Article

Characterization of the Gut Microbiota in Urban Thai Individuals Reveals Enterotype-Specific Signature

by
Jiramaetha Sinsuebchuea
1,
Prasobsook Paenkaew
2,
Montree Wutthiin
2,
Thatchawanon Nantanaranon
2,3,
Kiattiyot Laeman
2,
Weerayuth Kittichotirat
1,2,
Songsak Wattanachaisaereekul
4,
Sudarat Dulsawat
5,
Montira Nopharatana
6,
Namol Vorapreeda
7,
Sakarindr Bhumiratana
2,
Supapon Cheevadhanarak
2,5,8,* and
Sawannee Sutheeworapong
2,*
1
Bioinformatics and Systems Biology Program, School of Bioresources and Technology, and School of Information Technology, King Mongkut’s University of Technology Thonburi (KMUTT), Bangkok 10150, Thailand
2
Systems Biology and Bioinformatics Unit, Pilot Plant Development and Training Institute, King Mongkut’s University of Technology Thonburi (KMUTT), Bangkok 10150, Thailand
3
Innovation Ecosystem, Knowledge Xchange, King Mongkut’s University of Technology Thonburi (KMUTT), Bangkok 10600, Thailand
4
School of Food Industry, King Mongkut’s Institute of Technology Ladkrabang (KMITL), Bangkok 10520, Thailand
5
Fungal Biotechnology Unit, Pilot Plant Development and Training Institute, King Mongkut’s University of Technology Thonburi (KMUTT), Bangkok 10150, Thailand
6
Department of Food Engineering, Faculty of Engineering, King Mongkut’s University of Technology Thonburi (KMUTT), Bangkok 10140, Thailand
7
Research, Innovation and Partnerships Office, King Mongkut’s University of Technology Thonburi (KMUTT), Bangkok 10140, Thailand
8
School of Bioresources and Technology, King Mongkut’s University of Technology Thonburi (KMUTT), Bangkok 10150, Thailand
*
Authors to whom correspondence should be addressed.
Microorganisms 2023, 11(1), 136; https://doi.org/10.3390/microorganisms11010136
Submission received: 2 December 2022 / Revised: 30 December 2022 / Accepted: 3 January 2023 / Published: 5 January 2023
(This article belongs to the Topic Gut Microbiota in Human Health)

Abstract

:
Gut microbiota play vital roles in human health, utilizing indigestible nutrients, producing essential substances, regulating the immune system, and inhibiting pathogen growth. Gut microbial profiles are dependent on populations, geographical locations, and long-term dietary patterns resulting in individual uniqueness. Gut microbiota can be classified into enterotypes based on their patterns. Understanding gut enterotype enables us to interpret the capability in macronutrient digestion, essential substance production, and microbial co-occurrence. However, there is still no detailed characterization of gut microbiota enterotype in urban Thai people. In this study, we characterized the gut microbiota of urban Thai individuals by amplicon sequencing and classified their profiles into enterotypes, including Prevotella (EnP) and Bacteroides (EnB) enterotypes. Enterotypes were associated with lifestyle, dietary habits, bacterial diversity, differential taxa, and microbial pathways. Microbe–microbe interactions have been studied via co-occurrence networks. EnP had lower α-diversities than those in EnB. A correlation analysis revealed that the Prevotella genus, the predominant taxa of EnP, has a negative correlation with α-diversities. Microbial function enrichment analysis revealed that the biosynthesis pathways of B vitamins and fatty acids were significantly enriched in EnP and EnB, respectively. Interestingly, Ruminococcaceae, resistant starch degraders, were the hubs of both enterotypes, and strongly correlated with microbial diversity, suggesting that traditional Thai food, consisting of rice and vegetables, might be the important drivers contributing to the gut microbiota uniqueness in urban Thai individuals. Overall findings revealed the biological uniqueness of gut enterotype in urban Thai people, which will be advantageous for developing gut microbiome-based diagnostic tools.

1. Introduction

A hundred trillion microorganisms inhabiting the gastrointestinal tract play pivotal roles in maintaining and improving human health, including the utilization of indigestible nutrients [1], production of essential metabolites, e.g., short-chain fatty acids (SCFAs) [2,3], improvement of the immune system [4], reduction of inflammation [4], and elimination of toxins and pathogens [5,6,7]. Throughout the lifespan of a human, several factors, including mode of birth, breastfeeding, heredity, pathogenic infections, surgical procedures, antibiotic use, long-term dietary habits, behavioral changes, and geographical locations, can affect the composition and structure of these gut microbial communities [8,9,10,11]. The alteration of the microbial communities can lead to an imbalanced ecosystem known as dysbiosis. This can result in either an increase in harmful microorganisms or a decrease in beneficial bacteria and microbial diversity, raising the risk of various diseases [3,12]. Gut dysbiosis is known to be the starting point of various diseases. Therefore, understanding the normal state of gut microbiota is important to interpret health status.
The gut microbiota is personalized and varies widely among people, even in the same individual at different periods of time; nevertheless, the communities of the human gut microbiota are generally dominated by a few bacterial taxa [13]. In 2011, the enterotyping method was introduced to classify individuals based on common patterns and was named after the main feature of the microbiome profile [14]. Subsequently, extensive studies have revealed Bacteroides, Prevotella, and Ruminococcus as the three major enterotypes [14,15,16,17,18,19,20,21,22,23,24,25,26,27,28,29,30,31,32,33]. Enterotypes of the gut microbiota are relatively constant and strongly associated with repetitive dietary patterns. In other words, individuals who prefer a meat-rich diet belong to the Bacteroides-dominant enterotype, a high-carb diet is associated with the Prevotella-dominant enterotype, and high fruit or vegetable diet is relevant to the Ruminococcus-dominant enterotype [14,34,35,36,37,38]. Notably, biotin (vitamin B7), thiamine (vitamin B1), and heme biosynthetic pathways were discovered to be enriched in Bacteroides, Prevotella, and Ruminococcus dominant enterotypes, respectively [14]. These enriched synthetic pathways indicate the biochemical activities of the enterotype including nutrient synthesis, modulation of immunity, antibiotic production, and others. Understanding enterotypes and their characteristics can help us develop early diagnostic tools for disease prevention and personalized nutrition based on the gut microbiota profile. Although the predominant genera in the gut microbial community and the main functions of each enterotype have been discovered in healthy and dysbiotic individuals in many countries, the enterotypes and their characteristics in Thai individuals have not yet been well defined in detail. In addition, gut microbiota characteristics have also been influenced by ethnicity [39,40,41].
However, within the same ethnicity, people from distinct regions, especially between urban and rural areas, have different dietary patterns. Urban people have a tendency to consume western diets, which are high in meats, processed meats, refined grains, etc., rather than rural people [42]. Moreover, the prevalence of metabolic syndrome has also increased in the urban population [43,44,45]. Understanding the relationship between gut microbiota and health parameters in urban people may lead to guideline developments for disease prevention. In this study, we characterized the composition of the gut microbiota in 96 Thai urban individuals using fecal 16S rDNA amplicon-based metagenomics sequencing. The enterotyping method was used to stratify the profiles of the gut microbiota into enterotypes. Microbial co-occurrence networks were established for both enterotypes using Spearman’s correlation coefficient. Associations between the gut microbiota and host lifestyle parameters were statistically tested to determine specific features in a given enterotype. We compared enterotypes in various aspects of microbial markers, including diversity, host-associated lifestyle, enriched predicted functions, and co-occurrence networks leading to enhancing health based on the characteristics of enterotypes.

2. Materials and Methods

2.1. Study Design and Cohort

Two hundred urban volunteers who were living in Bangkok, which is the capital city of Thailand, and its vicinity, were recruited by the Systems Biology and Bioinformatics Unit, Pilot Plant Development and Training Institute, KMUTT in 2018. Volunteers were divided into 5 different age groups: 18–25, 26–35, 36–45, 46–55, and over 55 years old. Volunteers were asked to (i) sign an informed consent, (ii) complete questionnaires, (iii) collect their stool samples, and (iv) return their stool samples to the laboratory. The questionnaires consisted of sociodemographic and lifestyle factors, including health profile, e.g., gender, age, body mass index, delivery procedure, antibiotic use, smoking, alcohol consumption, allergies, type of diet, and probiotic use (see Table S9 for the questionnaire). Of the 200 participants, 131 participants returned stool samples to the laboratory and signed informed consent, while 69 participants who did not complete the whole procedure were excluded. In this study, 96 out of 131 samples were selected based on DNA quality.

2.2. DNA Extraction, Library Preparation, and 16S rDNA Gene Sequencing

DNA samples were extracted from stool samples using the QIAamp Fast DNA Stool Mini Kit (Qiagen, Hilden, Germany) based on enzymatic and mechanical lysis of cells. DNA samples were qualified using the NanoPhotometer® N60/N50 spectrophotometer. The criteria were a DNA concentration of at least 10 ng/µL, OD 260/280 of 1.8–2.0, and OD 260/230 of 2.0–2.2. The hypervariable V4 regions of the 16S rDNA genes were amplified from the DNA samples using four sets of adapters and primers 515F and 806R (Data S1). DNA libraries were prepared according to the MiSeq Reagent Kit V2 protocol and sequenced with 250 bp paired-end reads on the Illumina MiSeq platform at the Quebec Genome Institute, Canada.

2.3. Microbiome Data Analysis

Raw data quality was assessed using FastQC (v0.11.8) and MultiQC (v1.7) [46,47]. QIIME2 (v2019.7) was used to perform the microbiome analysis. Briefly, the adaptor and any preceding bases were trimmed at the 5’ end of the reads using the q2-cutadapt plugin [48]. Reads were truncated at the position where quality scores were reduced by less than 30. Paired-end reads were merged with an overlap of 25 nucleotides between forward and reverse reads, and chimeric sequences were filtered out using the q2-dada2 plugin [49]. Sequences were dereplicated into amplicon sequence variants (ASVs) using the q2-dada2 plugin, resulting in a feature table, representative sequences, and frequency of remaining sequences in each step [49]. The V4 hypervariable regions were extracted from 16S rDNA full-length sequences of the SILVA v132 SSURef NR99 using 515F and 806R primers. The taxonomic classifier was trained using the V4 sequences based on the naive Bayes classifier model using the q2-feature-classifier plugin [50,51]. ASVs were assigned for taxonomies based on the sklearn method using the q2-feature-classifier plugin. Unassigned, mitochondria, and chloroplast sequences were removed using the q2-taxa plugin. The feature table containing absolute abundances of samples and taxa was normalized using a rarefying method with a sequencing depth of 25,000 reads per sample and 5000 bootstrapping iterations to improve the reproducibility of the data using the q2-feature-table plugin.

2.4. Enterotyping

Enterotyping was used to classify samples into clusters based on the similarity of microbiome profiles [14]. The taxonomic abundance table at the genus level normalized by the rarefying method was used as input for enterotyping. The square root of Jensen–Shannon divergence (JSD) was used to measure dissimilarity between communities. The Calinski–Harabasz index (CH), the ratio of the sum of squares of dissimilarity between clusters to the sum of squares of dissimilarity within clusters, was calculated to determine the optimal number of clusters.
The silhouette coefficient was used as an indicator to calculate the goodness of the clustering technique from −1 (data were assigned to the wrong group) to 1 (clusters were separated) [52,53,54]. The clustering algorithm, partitioning around medoids (PAM), a supervised method, was used to group the taxonomic profiles according to the estimated number of clusters. Dissimilarities between communities were examined and visualized using PCoA, and the clustering results were overlaid on the graph.

2.5. Statistical Analysis

Kolmogorov–Smirnov tests were conducted to test the normality of the lifestyle-related data. The independence of lifestyle-related data between groups was examined using Fisher’s exact test. Differences in the relative abundance of each genus between enterotypes were examined using the Mann–Whitney U test. Chi-square tests with a cutoff p-value of less than 0.05 were performed to examine the association between lifestyle parameters and enterotypes.

2.6. Microbial Diversity Analysis

Alpha diversity was calculated at the genus level using Simpson’s diversity, Shannon’s diversity, Chao1 richness, and Pielou’s evenness indices via the package vegan (v2.4.2) and visualized using the package ggplot2 implemented in the R environment (v3.6.2). The difference in alpha diversity between two enterotypes was statistically tested using the Mann–Whitney U test with a cutoff p-value of less than 0.05. Correlation between alpha diversity indices and microbial abundance was performed using Spearman’s correlation in the SPSS program (v26) with a cutoff p-value of less than 0.05. Beta diversity was used to cluster the samples according to their microbiome profiles using PCoA based on Bray–Curtis distances [55]. PCoA plots were then overlaid with metadata from the questionnaires to classify groups of participants using the QIIME2 EMPeror plugins [56]. PERMANOVA tests were employed to assess whether the microbial communities in each lifestyle parameter are different with a cutoff p-value < 0.05 using the vegan (v2.5.7) and phyloseq (v1.36.0) packages in the R environment (v4.1.1).

2.7. Differential Abundance Analysis

The description of the experimental linear discriminant analysis effect size (LEfSe) on the Galaxy v1.0 platform was used to detect significantly differential abundant features between enterotypes at the genus level, where the linear discriminant analysis (LDA) criterion had a value of 2.0 or greater [57].

2.8. Co-Occurrence Network Construction and Network Property Measurement

In each enterotype, microbe–microbe interactions were determined by Spearman’s rank correlation coefficient [58] and filtered by the cutoff criteria of ρ ≥ 0.5, and p-value < 0.05. Microbe–microbe interactions that met the criteria were used to create a co-occurrence network in which nodes and edges represent microbes and interactions, respectively. Co-occurrence networks were evaluated using several network property parameters, including the number of nodes, number of edges, hubs, degree, clustering coefficient, network diameter, the average number of neighbors, network density, network heterogeneity, and network centralization using CytoCluster v2.1.0 [59] and NetworkAnalyzer v4.4.6 [60] packages in Cytoscape v3.8.0 [61]. Hierarchical clustering analysis based on complete-linkage was performed to cluster taxa similarity using stats (v4.1.1), Hmisc (v4.5.0), and NetCluster (v0.2) [62] packages in the R environment (v4.1.1).

2.9. Microbial Function Prediction and Pathway Enrichment Analysis

Phylogenetic Investigation of Communities by Reconstruction of Unobserved States (PICRUSt2 v2.3.0b0) [63] was applied to predict microbial metabolic functions including KEGG pathways, KEGG orthologs, and EC numbers. Pathway and gene abundances were estimated for each sample, based on the copy numbers of 16S rDNA genes of microbes found in the sample [64]. Statistical Analysis of Taxonomic and Functional Profiles (STAMP v2.1.3) was then employed to test whether functional abundances differed significantly between enterotypes using Welch’s t-test for unequal variance. The Benjamin–Hochberg (BH) correction for multiple hypotheses was used to estimate the false discovery rate (FDR). Functions were found to be significantly different between enterotypes when the q-value was less than 0.05 and the absolute value of the effect size was greater than 0.1 [65,66]. The value of the mean proportion indicates which functions are enriched in which enterotype.

3. Results

3.1. Demographic Data of Enrolled Participants from the MODGUT Project

The ninety-six participants who joined this project were divided into 5 age groups: 20 individuals aged 18–25 years, 29 individuals aged 26–35 years, 31 individuals aged 36–45 years, 6 individuals aged 46–55 years, 4 individuals aged over 55 years, and 6 individuals with no recorded data. In total, 61, 29, and 6 individuals were female, male, and unknown gender, respectively. The mean age of all participants was 34.17 ± 10.57 years. Participants were classified into 4 categories based on body mass index (BMI): 9 underweight (less than 18.5), 48 normal weight (18.5–24.9), 23 overweight (25.0–29.9), 10 obese (at least 30.0), and 6 unknown data. The mean BMI was 22.58 ± 3.68 kg/m2. A total of 62 of the 96 individuals had normal dietary patterns, 27 did not consume raw foods, and only one person had a vegan diet (Table 1). Further metadata were shown in Table S1.

3.2. Thai Gut Microbiota Profiling

The average number of raw paired-end reads per sample was 68,867, and the total number of raw reads was 6,611,209. After preprocessing, a total of 3,978,787 reads remained, and the average number of reads was 41,446 per sample (Table S2). Ninety-one percent of all sequences had a length of 253 nucleotides, which corresponds to the theoretical length of the hypervariable V4 region [67] as shown in Table S3. In total, 14 phyla, 22 classes, 35 orders, 79 families, and 271 genera were discovered in this dataset. The relative abundance of these taxa might be used as a reference range for Thai people, which could be further applied in health status prediction (Table S4). Characterization of the gut microbiota of Thai individuals revealed that Bacteroidetes (54.64 ± 19.01%) and Firmicutes (37.26 ± 17.20%) were mainly found in all samples. In addition, phyla Proteobacteria (5.67 ± 6.11%), Fusobacteria (0.85 ± 3.38%), Verrucomicrobia (0.51 ± 1.83%), Actinobacteria (0.50 ± 0.95%), and Elusimicrobia (0.12 ± 1.15%) were also detected in this study. Bacteroides, Prevotella, and Faecalibacterium were identified as the first three predominant genera. Eighty-seven genera had a relative abundance greater than 1%. Interestingly, about 90% of this cohort occupied Actinobacteria and about 80 percent of them had the genus Bifidobacterium in their intestinal tract. The alpha diversity of the gut microbiota based on Shannon’s diversity index ranged from 0.373 to 3.435, Simpson’s diversity index ranged from 0.118 to 0.943, Pielou’s evenness index ranged from 0.112 to 0.734, and the Chao1 richness index ranged from 22 to 109. Statistical tests revealed that there was no significant difference in alpha diversities including Chao1, Pielou, Simpson, and Shannon indices in age group, BMI category, and gender (Table S10). The beta diversity of the gut microbiota profiles based on the Bray–Curtis’s distance was calculated and ordinated by PCoA (Figure S1). PERMANOVA revealed that gut microbiota profiles were not significantly associated with any host lifestyle parameters, e.g., age interval, BMI category, and gender (Table S10). However, Fisher’s exact test revealed that there were a few highly abundant taxa (at least 1% abundance) significantly associated with age interval, gender, and BMI category (Table S5).

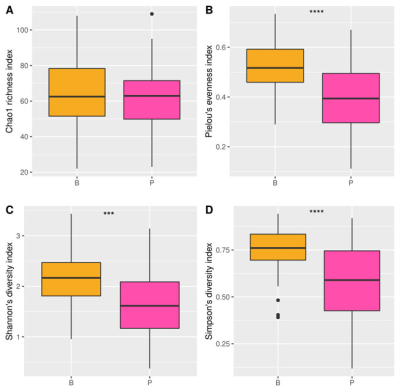
3.3. Association of Microbes and Diversity in Urban Thai Subjects

To investigate the correlation between microbes and the diversity of the microbiome, we calculated Spearman’s correlation coefficient between the microbial abundances in the samples and the diversity indices (Table S6). Forty-nine out of 87 taxa having at least 1% relative abundance were significantly correlated with at least one diversity index with the cutoff criteria ( ρ ≥ 0.35, p-value < 0.05). Bacteroides was negatively correlated with the Chao1 richness index ( ρ = −0.234, p-value = 0.022). Similarly, Prevotella 9 was negatively correlated with Shannon’s diversity index ( ρ = −0.316, p-value = 1.73 × 10⁻³), Simpson’s diversity index ( ρ = −0.336, p-value = 8.20 × 10⁻⁴), and Pielou’s evenness index ( ρ = −0.373, p-value = 1.85 × 10⁻⁴). This implies that an increased amount of these predominant bacteria may lead to lower microbial diversity in the gut. Interestingly, microbes from the Ruminococcaceae family, e.g., Ruminococcaceae NK4A214 group, Ruminococcaceae UCG-002, Ruminococcaceae UCG-003, and Ruminocaccaceae UCG-005 had strong positive correlations with all α-diversity indices with criteria ρ ≥ 0.5 and p-value < 0.05 (Table S6), suggesting that a higher proportion of Ruminococcaceae had a high association with the increase of α-diversity. On the other hand, Fusobacterium has negative correlations with all diversity indices (Shannon, ρ = −0.306, p-value = 0.002; Simpson, ρ = −0.226, p-value = 0.027; Chao1, ρ = −0.493, p-value = 3.40 × 10⁻⁷; Pielou, ρ = −0.237, p-value = 0.02).

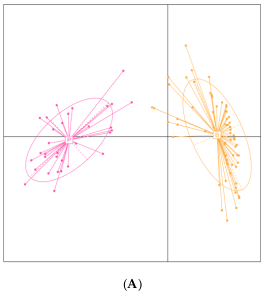
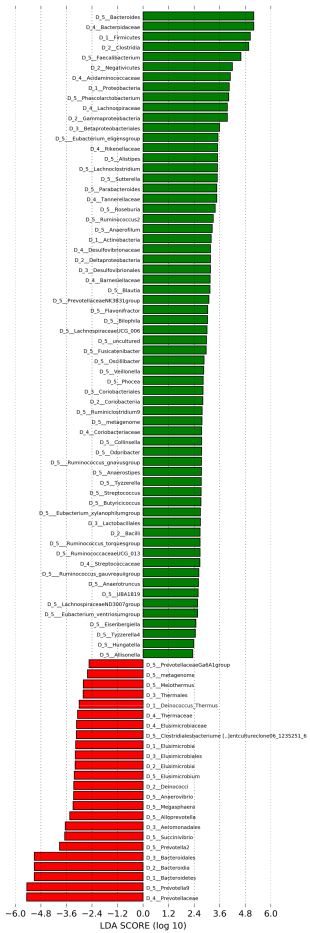
3.4. Stratification and Characterization of Thai Individuals Based on Their Gut Microbiota Profiles

Thai individuals were stratified into two enterotypes based on their gut microbiota composition: Prevotella- and Bacteroides-dominant enterotypes hereafter referred to as EnP and EnB, respectively (Figure 1A). Two-thirds of the participants belonged to enterotype B. More than half (58.90% of the average relative abundance) of total abundance in EnP was occupied by the genus Prevotella 9 (Figure 1B), while Bacteroides was the most dominant genus in EnB with an average relative abundance of 37.80% (Figure 1C). According to the result of differential abundance analysis between two enterotypes by LEfSe, 64 taxa and 24 taxa were significantly enriched in EnB and EnP, respectively (Figure 2). For example, Prevotella 9, Elusimicrobium, Anaerovibrio, Succinivibrio, Prevotella 2, Alloprevotella, and Megasphera genera were significantly enriched in EnP, while Bacteroides, Faecalibacterium, Phascolarctobacterium, Sutterella, Alistipes, Lachnoclostridium, Parabacteroides, Roseburia, Streptococcus, Blautia, Bilophila, Fusicaberibacter, Flavonibacter, Veillonella, Collinsella, Anaerostipes, Butyricicoccus, Tyzzerella, and Hungatella significantly predominated in EnB. Notably, Fusobacterium, which was reported to be associated with gut dysbiosis and intestinal inflammation possibly leading to the development of colorectal cancer and ulcerative colitis [68,69], was found in 12 individuals with at least 1% relative abundance. Eleven out of twelve participants belonged to EnB, whereas the remaining one belonged to EnP. Fisher’s exact test also showed the association between Fusobacterium and EnB (p-value = 0.056). In addition, Roseburia, the butyrate-producing bacteria, was detected in 19 participants with at least 1% relative abundance. Fisher’s exact test indicated that Roseburia was significantly enriched in EnB at the p-value of 0.003 (18 out of 19 participants belonged to EnB whereas one belonged to enterotype P). On the other hand, 11 participants had at least 1% relative abundance of Bifidobacterium, a well-known beneficial microbe, but only one belonged to EnP (p-value = 0.093) (Table S5).
Diversity analysis between EnB and EnP using the Mann–Whitney U test shows that EnB had significantly higher α-diversity than EnP based on Pielou’s evenness index (p-value = 1.37 × 10⁻⁵), Simpson’s diversity index (p-value = 8.26 × 10⁻⁵), and Shannon’s diversity index (p-value = 1.82 × 10⁻⁴), while the Chao1 richness index (p-value = 0.71) was not significantly different between both enterotypes (Figure 3). Moreover, the gut microbiota patterns of both enterotypes were significantly distinct according to PERMANOVA (p-value = 1 × 10⁻⁴).
To investigate the association between enterotypes and lifestyle parameters, e.g., age, BMI, frequency of exercise, and hours of sleep, Fisher’s exact tests indicate that the lifestyle variables including consumption of eggs and meat (p-value = 0.060) and poultry (p-value = 0.040) were statistically different between enterotypes (Table S1). In addition, the BMIs of EnP were slightly higher than those of EnB (Table 1 and Table S1).

3.5. Microbial Co-Occurrence Network and Clusters of Strongly Related Microbes

The microbial co-occurrence network describes microbe–microbe relationships, where nodes and edges represent microbial taxa and their interactions, respectively. 87 out of 271 taxa having at least 1% of relative abundance were included. Microbe–microbe correlations were calculated using Spearman’s correlation coefficient. From the correlations of microbiome profiles that met the criteria (p-value < 0.05 and ρ ≥ 0.5), the separated co-occurrence networks of EnP and EnB were constructed, yielding 67 and 42 nodes and 181 and 109 edges, respectively (Figure 4). Based on taxonomic assignment, the majority of microbes in both networks (39 nodes in p and 29 nodes in B) belonged to the phylum Firmicutes (Figure S4A,B). Remarkably, Prevotella in EnP had negative interactions with 11 other taxa in EnP (Figure S5A). In contrast, Bacteroides in EnB had only one negative interaction with Ruminococcaceae UCG-002 (Figure S5B).
Subsequently, network properties including the number of nodes, number of edges, node degree, clustering coefficient, network diameter, the average number of neighbors, network density, network heterogeneity, and network centralization were measured to compare the complexity and robustness of the two ecosystems (Table 2). The nodes with the 10% highest degrees were identified as hubs, including, Alistipes (13 degrees), Butyricimonas (15 degrees), Lachnospiraceae UCG-010 (13 degrees), Oscillibacter (17 degrees), Ruminococcaceae NK4A214 group (17 degrees), Ruminococcaceae UCG-002 (16 degrees), Ruminococcaceae UCG-005 (21 degrees), and Ruminococcus torques group (15 degrees) in EnP, and Christensenellaceae R-7 group (13 degrees), Eubacterium coprostanoligenes group (17 degrees), Ruminococcaceae NK4A214 group (16 degrees), Ruminococcaceae UCG-002 (18 degrees), Ruminococcaceae UCG-005 (13 degrees), and Ruminococcaceae UCG-010 (13 degrees) in EnB. The network of EnP was obviously larger than that of EnB in terms of the number of nodes, edges, and network diameters, suggesting that microbes in EnP have more microbial variants than those of EnB to maintain ecological stability. The clustering coefficient, which indicates how any three nodes interact with each other [70], was higher in network B, suggesting that EnB has more connectivity than EnP. Both networks had an average number of neighbors that was approximately equal to 6. The network density, which approaches zero and mainly describes the density of the edges [71,72], suggests that microorganisms generally live in the form of clusters. Both communities had network centralization approaching zero, implying that the microorganisms live together as a module, with some microbes responsible for the hub as identified previously.
Based on hubs, network density, and centrality, microorganisms generally live as an interactive community in an ecosystem. To understand the importance of microbial co-occurrence modules, microbial profiles were clustered using the hierarchical clustering method with complete linkage in each enterotype (Figure S2), resulting in 4 and 6 highly correlated clusters for EnP (Figure S2A,C) and EnB (Figure S2B,D), respectively (Table S8A).

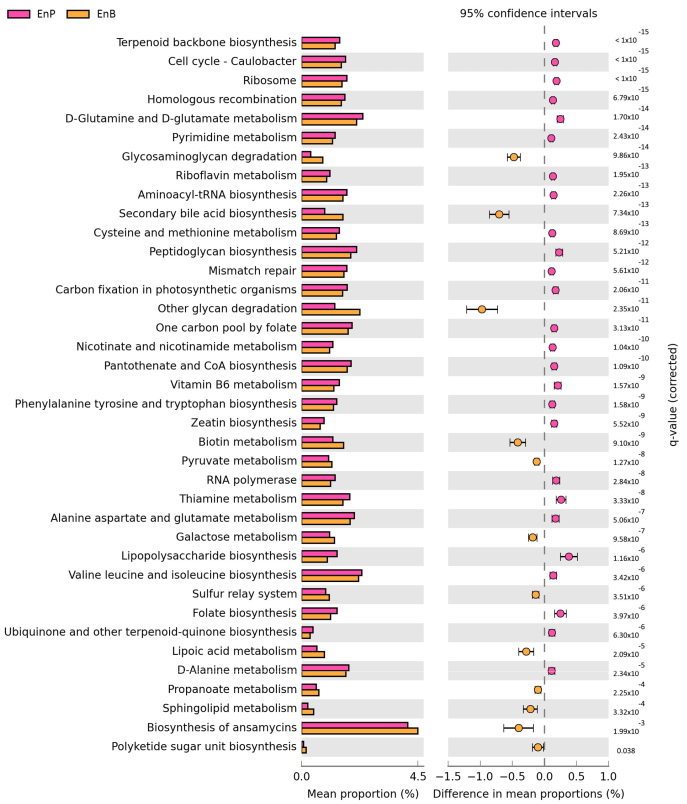
3.6. Metabolic Potential Prediction of Prevotella and Bacteroides Enterotypes

Metabolic pathway prediction of microbial communities was performed using PICRUSt [63] on 153 metabolic pathway profiles, which were annotated for the gut microbiota of all participants based on the KEGG database. The predicted abundance of metabolic pathways was evaluated for the analysis of the difference in abundance between both enterotypes. Thirty-eight out of 153 metabolic pathways differed significantly between both enterotypes (Figure 5), with 26 and 12 metabolic pathways enriched in EnP and EnB, respectively. Interestingly, several of these pathways were associated with the production of B vitamins, including thiamine (B1) metabolism (KO00730, q-value = 3.33 × 10⁻⁸), riboflavin (B2) metabolism (KO00740, q-value = 1.95 × 10⁻¹³), pyridoxine (B6) metabolism (KO00750, q-value = 1.57 × 10⁻⁹), nicotinate (B3) and nicotinamide metabolism (KO00760, q-value = 1.04 × 10⁻¹⁰), pantothenate (B5) and CoA biosynthesis (KO00770, q-value = 1.09 × 10⁻¹⁰), and folate (B9) biosynthesis pathway (KO00790, q-value = 3.97 × 10⁻⁶). In addition, amino acid biosynthetic pathways were also enriched in enterotype P, i.e., alanine, aspartate, and glutamate metabolism (KO00250, q-value = 5.06 × 10⁻⁷); cysteine and methionine metabolism (KO00270, q-value = 8.69 × 10⁻¹³); valine, leucine, and isoleucine biosynthesis (KO00290, q-value = 3.42 × 10⁻⁶); phenylalanine, tyrosine, and tryptophan biosynthesis (KO00400, q-value = 1.58 × 10⁻⁹); D-glutamine and D-glutamate metabolism (KO00471, q-value = 1.70 × 10⁻¹⁴); and D-alanine metabolism (KO00473, q-value = 2.34 × 10⁻⁵). However, ansamycin biosynthesis (KO01051), which is responsible for antibiotic production, was significantly enriched in EnB (q-value = 1.99 × 10⁻³). Secondary bile acid biosynthesis (KO00121) was another metabolic pathway that was significantly enriched in EnB (q-value = 7.34 × 10⁻¹³). Biotin (vitamin B7) metabolism (KO00780), already known to be relevant to carbohydrate utilization and to reduce inflammation of human dendritic cells [73], was also significantly overrepresented in EnB (q-value = 9.10 × 10⁻⁹). Furthermore, PICRUSt2 indicates that SCFA-producing bacteria including acetate, butyrate, and propionate presented in both enterotypes. STAMP shows that the bacterial abundances of these SCFA-related pathways were not significantly different between enterotypes.

4. Discussion

The profiles of the gut microbiota are personalized relying on various factors, but they often share common patterns that are co-existing with the same microbes with similar relative abundance, enabling us to cluster these profiles into groups. Enterotyping, a clustering method based on Jansen–Shannon distance, was introduced to partition microbiome profiles based on their general patterns. The clusters were then named after the predominant genus normally found in the imbalanced gut microbiota [74]. Prevotella enterotype (EnP) and Bacteroides enterotype (EnB) have been detected in the human gut microbiota of different populations [14,15,16,17,18,19,20,21,22,23,24,25,26,27,28,29,30,31,32,33]. In this study, one-third of all participants belonged to EnP, while the remaining two-thirds were corresponding with EnB, respectively. This is consistent with other studies that reported that gut microbiota of urban people occupied Bacteroides rather than Prevotella [32,75,76]. Other enterotypes could not be detected in our dataset. This could be due to the limited sample size or because the individuals were not distinct groups [33]. Moreover, it might depend on traditional dietary patterns, genetics, and lifestyle habits. Ruminococcus and other enterotypes were identified in other studies and the Ruminococcus enterotype was found in some populations [14,19,20,21,22,23,24,25,26,27,28,29,30,31,32,33]: Blautia enterotype was predominant in Japanese people [29]; Bifidobacterium enterotype in Thai and Dutch children [31,32]; Escherichia enterotype in Taiwanese people [21,28]; Ruminococcus-Bifidobacterium enterotype in Chinese people [14,33]; and Prevotella-Bacteroides enterotype in Americans [27]. In order to understand the characteristics and roles of gut enterotypes derived from this cohort, we investigated the relationship between enterotypes and microbiome diversity. Interestingly, we observed significantly higher α-diversity of gut microbiota communities in EnB than in EnP, which was consistent with a previous study [21] but also in contrast to some previous reports [31,32]. Moreover, the Prevotella to Bacteroides (P/B) ratio, another health indicator used to determine the ability to reduce weight on a specific food, was completely different between the EnP (59.85 ± 122.86) and the EnB (0.06 ± 0.21) [74,77,78]. Therefore, the P/B ratio can be used as a marker for the separation of EnP and EnB. EnP was observed to have a slightly higher BMI than EnB, which is consistent with the previous report [74]. Specifically, we found that EnB individuals consumed significantly more eggs, meat, and poultry than those of EnP, as revealed by statistical tests. Similarly, western individuals, who are predominantly of the Bacteroides-based enterotype, have a relatively low P/B ratio because the western diet is rich in red meat from terrestrial food animals. These results are consistent with previous findings suggesting that the Bacteroides genus may be increased in the intestinal tract by the consumption of a meat-rich diet, while Prevotella may be enriched by a high-fiber diet [34,36,37]. The discovery and characterization of enterotypes could bring benefits to the healthcare system.
Differential abundance analysis based on LEfSe revealed the microbial signature of each enterotype. Remarkably, the number of significantly enriched taxa in EnB was clearly greater than that in EnP. This can be explained that the α-diversity of EnB was significantly higher than that of EnP. In the EnB, the genus Ruminococcus, one of the resistant starch degraders as well as producers of SCFAs and natural antibiotics responsible for improving and maintaining the human gut symbiosis [79,80,81,82,83,84], was significantly predominant. Moreover, several members of the Ruminococcaceae family were positively correlated with species richness and evenness (Table S6), which are among the important indices of human health [85,86], suggesting that microbes from the Ruminococcaceae family might provide food sources for other microbes leading to an increase of microbial diversity in the intestinal tract, leading to better health. In general, there are not only beneficial microbes in the human gut but also harmful microbes at a very low level. Elusimicrobium, which normally decreases in patients with type 2 diabetes, was enriched in EnP [87,88]. However, harmful microbes at low levels do not damage the host because their composition is regulated by other beneficial and commensal microbes. An inappropriate lifestyle, such as a high-fat diet, can affect the composition of the gut microbiota and lead to an imbalance (or gut dysbiosis), so that commensal bacteria under certain circumstances become pathobionts, which can harm the host, and some harmful or pathogenic bacteria may increase and lead to pathogenesis [89,90]. In this study, these harmful and pathogenic bacteria, including Collinsella, Fusobacterium, Odoribacter, Peptococcus, Tyzzerella, and Veillonella with low relative abundance, were identified and the association with enterotypes was investigated. Odoribacter was significantly enriched in EnB (Figure 2), which has previously been reported to be overrepresented in neurological-related cases, such as attention deficit hyperactivity disorder (ADHD) [91] and depression [92]. Collinsella was discovered in EnB (Figure 2), which was strongly correlated with rheumatoid arthritis [93]. Veillonella, known to cause liver cirrhosis, was significantly enriched in EnB [94]. Interestingly, Tyzzerella was significantly increased in EnB (Figure 2), which is consistent with the previous study which reported that Tyzzerella was enriched in individuals at high risk for cardiovascular disease [95] and rheumatoid arthritis [96]. In addition, Fusobacteria associated with Fusobacterium spp. bacteremia, colorectal cancer, periodontitis, and ulcerative colitis, were detected with relatively higher abundance in EnB than in EnP [68,69,89,97,98,99,100,101]. Overall, although a number of beneficial bacteria were enriched in EnB rather than in EnP, some harmful bacteria were also overrepresented in EnB. The results indicate that urban people are likely to occupy a higher abundance of harmful bacteria leading to an increased risk of several diseases, possibly due to the alteration of dietary patterns. Therefore, a balance between Prevotella and Bacteroides in the gut microbiota is preferable for maintaining the abundance of beneficial and harmful bacteria, improving the digesting ability of various food types, and preserving gut microbial diversity.
Functional enrichment analysis was examined to infer enterotype-specific microbial pathways based on PICRUSt2 and STAMP. Overall, the number of microbial pathways in the amino acid metabolism, the nucleotide metabolism, and the cofactor and vitamin metabolism were enriched in EnP more than those in EnB. On the other hand, carbohydrate and lipid metabolic pathways were overrepresented in EnB more than in those of EnP. The pathways for B vitamin metabolism, i.e., B1, B2, B3, B5, B6, and B9, and the pathways for essential amino acids metabolism, i.e., valine, leucine, isoleucine, phenylalanine, and tryptophan, were enriched in EnP compared to EnB (Figure 5). B vitamin metabolic pathways have been reported to be associated with the genus Prevotella in the previous study [102]. EnB may have the potential to protect against mycobacterial infections due to a significant enrichment of ansamycin biosynthesis (KO01051, q-value = 1.99 × 10⁻³), which produces antibiotics against the mycobacteria [103]. In addition, the glycosaminoglycan (GAG) degradation pathway, which is responsible for maintaining water in tissues and preventing skin aging, was significantly enriched in EnB (KO00531, q-value = 9.86 × 10⁻¹⁴) [104]. Interestingly, the secondary bile acid (SBA) pathway was significantly enriched in EnB compared to EnP (q-value = 7.34 × 10⁻¹³). SBAs, consisting of deoxycholic acid and lithocholic acid, are normally absorbed in the colon and flowed in the enterohepatic circulation [105,106,107]. These metabolites can be increased by high-fat diet intakes, possibly leading to various conditions, including colonic inflammation, colon cancer, and inflammatory bowel disease [105,106,108,109,110,111]. However, due to the limitation of amplicon-based sequencing, these predicted pathways could be an inference to the role of enterotypes. Therefore, a metagenomic approach is required for the functional identification of enterotypes.
Microbes living in a community normally communicate with each other to produce and transfer metabolites between themselves and their host [112]. Constructing a microbiome network (or co-occurrence network) in which nodes and edges represent microbes and their interactions may be a promising way to understand how these microbes communicate and interact with the host. To understand the behavior of bacterial communities, both enterotype networks were constructed and their network properties, including network size, clustering coefficient, number of nodes, number of edges, node degree, average correlation, the average number of neighbors, network density, network heterogeneity, and network centralization were evaluated [113]. Based on the network properties, network P had more microbial members and interactions than network B, while network B had greater robustness than network P, as inferred from the clustering coefficient and the average number of neighbors (Table 2). An individual with higher microbial network diversity and robustness could possess more diverse microbial functions, including producing nutrients and vitamins, enhancing host immunity, and decreasing inflammation [114,115]. All hubs, bacteria having high node degree, discovered in this study, including Ruminococcaceae NK4A214 group, Ruminococcaceae UCG-002, Ruminococcaceae UCG-005 from both enterotypes, and Ruminococcaceae UCG-010 in EnB, belonged to the same family Ruminococcaceae, which is a resistant starch and dietary fiber decomposer leading to produce SCFAs, and feeding to other microbes in the same ecosystem [81,116,117,118]. The main staple food in Thailand is rice and vegetables, although animal product consumption is on the rise [119]. Westernized dietary habits, consisting of a high-fat, meat-rich, and high-sugar diet, might induce steatohepatitis [120]. It has been previously reported that Ruminococcus abundance is reduced in inflammatory bowel disease [121]. This suggests that Ruminococcaceae may be essential bacteria for all humans and contribute to the stability of the gut ecosystem [122,123]. In addition, the genus Fusobacterium, which has been associated with various diseases, e.g., colorectal cancer [68], Fusobacterium spp. bacteremia [89], acute pharyngitis [124], and periodontitis [125], was negatively correlated with several Ruminococcaceae in both enterotypes (Figure 4), implying that the presence of Ruminococcaceae may help reduce the abundance of harmful Fusobacterium. In the network P, Prevotella had only negative interactions with other bacteria (Figure S5A). Furthermore, the relative abundance of Prevotella in EnP was negatively correlated with the species evenness (Table S6), indicating that the presence of Prevotella led to a decrease in microbial diversity. The co-occurrence network of gut microbiota can provide us with an understanding of microbe–microbe and microbe–host interactions through the enterotypes, facilitating further applications regarding gut microbiota intervention and early screening diagnostic tools.

5. Conclusions

Enterotypes of Thai urban individuals were identified and characterized based on microbial profiles, host lifestyle, and dietary habits to understand the health benefits and the disease risks. A comparison of gut enterotypes in Thai urban people revealed higher diversity in EnB, higher abundance of beneficial and harmful bacteria in EnB, enriched B vitamin and amino acid biosynthesis in EnP, enterotype-specific differential abundant taxa, and unique microbial communities. Ruminococcaceae, the pivotally important microbes in a Thai cohort, might contribute to the stability of the gut ecosystem by degrading cellulose, cross-feeding, and cross-talking with SCFA producers. Nevertheless, further investigation into metabolomics and metagenomics is warranted for confirming microbial functions and microbe–microbe interactions. The overall results of this study may be useful to develop personalized nutrition for enhancing human health and preventing gut dysbiotic-driven disorders.

Supplementary Materials

The following supporting information can be downloaded at: https://www.mdpi.com/article/10.3390/microorganisms11010136/s1. Figure S1: the association of gut microbiota and host lifestyle parameters using PCoA visualization; Figure S2: the clustering of gut microbiome profiles using hierarchical clustering analysis; Figure S3: identification of the highest correlated cluster in enterotypes; Figure S4: co-occurrence network of highly correlated clusters in both enterotypes; Figure S5: microbe–microbe interactions of dominant taxa; Table S1: characteristics of lifestyle variables in Thai individuals; Table S2: the number of reads remaining in each step of microbiome analysis; Table S3: amplicon sequence length distribution; Table S4: taxonomic abundance and diversity Table S5: Fisher’s exact test of bacteria at least 1% abundance with age group, BMI level, gender, and enterotype; Table S6: association between microbial taxa and diversity indices using Spearman’s correlation coefficient; Table S7: cluster number of belonging taxa; Table S8: number of taxa (nodes), interactions (edges), and average correlation in individual clusters; Table S9: questionnaire; Table S10: statistical test for differences in diversity of age, BMI, and gender.

Author Contributions

Conceptualization, S.C., S.B. and S.S.; DNA extraction and sequencing, S.D. and S.W.; registration platform development, M.W., P.P., K.L., T.N. and S.S.; participant recruitment, T.N., K.L., M.W., P.P., S.S. and N.V.; formal analysis, J.S., M.W. and S.S.; funding acquisition, S.C., W.K., M.N. and S.S.; writing—original draft, J.S. and S.S.; writing—review and editing, S.C., W.K., P.P., J.S., S.S. and S.W.; supervision, S.C. and S.B. All authors have read and agreed to the published version of the manuscript.

Funding

This work was supported by King Mongkut’s University of Technology Thonburi (SBI-GT-62_KMUTT-Modgut).

Data Availability Statement

Raw sequences of the hypervariable V4 16S rDNA region in FASTQ file format for all samples have been deposited in the ENA repository under the BioProject accession number PRJEB41122 with the sample ID from SAMEA7538457 to SAMEA7538552.

Acknowledgments

We thank the members of the Systems Biology and Bioinformatics Laboratory and the Fungal Biotechnology Laboratory at King Mongkut’s University of Technology Thonburi for their support and contributions. We especially thank Chalida Rungsriwuttisak, Onnicha Leelartwattanakul, Pichahpuk Uthaipaisarnwong, Salisa Charoensri, Tanawut Srisuk, Tayvich Vorapreeda, Thoranin Intarajak, and Wanna Chetruengchai, for their assistance in recruiting participants for the MODGUT project, Ahmad Nuruddin Khoiri for submitting data, Kanthida Kusonmano, Peerada Prommeenate, and Suchart Vongkiatkajorn. for useful suggestions, and Sumet Angkasirikul for fundraising. We appreciated all the participants who contributed to this project.

Conflicts of Interest

The authors declare no conflict of interest.

References

  1. Valdes, A.M.; Walter, J.; Segal, E.; Spector, T.D. Role of the gut microbiota in nutrition and health. BMJ 2018, 361, k2179. [Google Scholar] [CrossRef] [Green Version]
  2. Ridaura, V.; Belkaid, Y. Gut microbiota: The link to your second brain. Cell 2015, 161, 193–194. [Google Scholar] [CrossRef] [Green Version]
  3. Ursell, L.K.; Metcalf, J.L.; Parfrey, L.W.; Knight, R. Defining the human microbiome. Nutr. Rev. 2012, 70, S38–S44. [Google Scholar] [CrossRef] [Green Version]
  4. Belkaid, Y.; Hand, T.W. Role of the microbiota in immunity and inflammation. Cell 2014, 157, 121–141. [Google Scholar] [CrossRef] [Green Version]
  5. Lynch, S.V.; Pedersen, O. The Human Intestinal Microbiome in Health and Disease. N. Engl. J. Med. 2016, 375, 2369–2379. [Google Scholar] [CrossRef] [Green Version]
  6. Yano, J.M.; Yu, K.; Donaldson, G.P.; Shastri, G.G.; Ann, P.; Ma, L.; Nagler, C.R.; Ismagilov, R.F.; Mazmanian, S.K.; Hsiao, E.Y. Indigenous Bacteria from the Gut Microbiota Regulate Host Serotonin Biosynthesis. Cell 2015, 161, 264–276. [Google Scholar] [CrossRef] [Green Version]
  7. Kampmann, C.; Dicksved, J.; Engstrand, L.; Rautelin, H. Composition of human faecal microbiota in resistance to Campylobacter infection. Clin. Microbiol. Infect. 2016, 22, 61.e1–61.e8. [Google Scholar] [CrossRef] [Green Version]
  8. Gaulke, C.A.; Sharpton, T.J. The influence of ethnicity and geography on human gut microbiome composition. Nat. Med. 2018, 24, 1495–1496. [Google Scholar] [CrossRef]
  9. Arrieta, M.C.; Stiemsma, L.T.; Amenyogbe, N.; Brown, E.M.; Finlay, B. The intestinal microbiome in early life: Health and disease. Front. Immunol. 2014, 5, 427. [Google Scholar] [CrossRef] [Green Version]
  10. Salminen, S.; Gibson, G.R.; McCartney, A.L.; Isolauri, E. Influence of mode of delivery on gut microbiota composition in seven year old children. Gut 2004, 53, 1388–1389. [Google Scholar] [CrossRef] [Green Version]
  11. Rodríguez, J.M.; Murphy, K.; Stanton, C.; Ross, R.P.; Kober, O.I.; Juge, N.; Avershina, E.; Rudi, K.; Narbad, A.; Jenmalm, M.C.; et al. The composition of the gut microbiota throughout life, with an emphasis on early life. Microb. Ecol. Health Dis. 2015, 26, 26050. [Google Scholar] [CrossRef]
  12. Wen, L.; Duffy, A. Factors Influencing the Gut Microbiota, Inflammation, and Type 2 Diabetes. J. Nutr. 2017, 147, 1468S–1475S. [Google Scholar] [CrossRef] [Green Version]
  13. Guarner, F.; Malagelada, J.R. Gut flora in health and disease. Lancet 2003, 361, 512–519. [Google Scholar] [CrossRef] [PubMed]
  14. Arumugam, M.; Raes, J.; Pelletier, E.; Le Paslier, D.; Yamada, T.; Mende, D.R.; Fernandes, G.R.; Tap, J.; Bruls, T.; Batto, J.M.; et al. Enterotypes of the human gut microbiome. Nature 2011, 473, 174–180. [Google Scholar] [CrossRef] [PubMed] [Green Version]
  15. Yin, Y.; Fan, B.; Liu, W.; Ren, R.; Chen, H.; Bai, S.; Zhu, L.; Sun, G.; Yang, Y.; Wang, X. Investigation into the stability and culturability of Chinese enterotypes. Sci. Rep. 2017, 7, 7947. [Google Scholar] [CrossRef] [PubMed] [Green Version]
  16. Roager, H.M.; Licht, T.R.; Poulsen, S.K.; Larsen, T.M.; Bahl, M.I. Microbial Enterotypes, Inferred by the Prevotella-to-Bacteroides Ratio, Remained Stable during a 6-Month Randomized Controlled Diet Intervention with the New Nordic Diet. Appl. Environ. Microbiol. 2014, 80, 1142–1149. [Google Scholar] [CrossRef] [PubMed] [Green Version]
  17. Claesson, M.J.; Jeffery, I.B.; Conde, S.; Power, S.E.; O’Connor, E.M.; Cusack, S.; Harris, H.M.B.; Coakley, M.; Lakshminarayanan, B.; O’Sullivan, O.; et al. Gut microbiota composition correlates with diet and health in the elderly. Nature 2012, 488, 178–184. [Google Scholar] [CrossRef]
  18. Zhang, J.; Guo, Z.; Lim, A.A.Q.; Zheng, Y.; Koh, E.Y.; Ho, D.; Qiao, J.; Huo, D.; Hou, Q.; Huang, W.; et al. Mongolians core gut microbiota and its correlation with seasonal dietary changes. Sci. Rep. 2014, 4, 5001. [Google Scholar] [CrossRef] [Green Version]
  19. Falony, G.; Joossens, M.; Vieira-Silva, S.; Wang, J.; Darzi, Y.; Faust, K.; Kurilshikov, A.; Bonder, M.J.; Valles-Colomer, M.; Vandeputte, D.; et al. Population-level analysis of gut microbiome variation. Science 2016, 352, 560–564. [Google Scholar] [CrossRef]
  20. Dhakan, D.B.; Maji, A.; Sharma, A.K.; Saxena, R.; Pulikkan, J.; Grace, T.; Gomez, A.; Scaria, J.; Amato, K.R.; Sharma, V.K. The unique composition of Indian gut microbiome, gene catalogue, and associated fecal metabolome deciphered using multi-omics approaches. Gigascience 2019, 8, giz004. [Google Scholar] [CrossRef]
  21. Liang, C.; Tseng, H.C.; Chen, H.M.; Wang, W.C.; Chiu, C.M.; Chang, J.Y.; Lu, K.Y.; Weng, S.L.; Chang, T.H.; Chang, C.H.; et al. Diversity and enterotype in gut bacterial community of adults in Taiwan. BMC Genom. 2017, 18, 932. [Google Scholar] [CrossRef] [PubMed] [Green Version]
  22. de Moraes, A.C.; Fernandes, G.R.; da Silva, I.T.; Almeida-Pititto, B.; Gomes, E.P.; Pereira, A.D.C.; Ferreira, S.R. Enterotype may drive the dietary-associated cardiometabolic risk factors. Front. Cell. Infect. Microbiol. 2017, 7, 47. [Google Scholar] [CrossRef] [PubMed] [Green Version]
  23. Wu, X.; Unno, T.; Kang, S.; Park, S. A Korean-Style Balanced Diet Has a Potential Connection with Ruminococcaceae Enterotype and Reduction of Metabolic Syndrome Incidence in Korean Adults. Nutrients 2021, 13, 495. [Google Scholar] [CrossRef]
  24. Karlsson, F.H.; Fåk, F.; Nookaew, I.; Tremaroli, V.; Fagerberg, B.; Petranovic, D.; Bäckhed, F.; Nielsen, J. Symptomatic atherosclerosis is associated with an altered gut metagenome. Nat. Commun. 2012, 3, 1245. [Google Scholar] [CrossRef] [Green Version]
  25. Wutthi-in, M.; Cheevadhanarak, S.; Yasom, S.; Kerdphoo, S.; Thiennimitr, P.; Phrommintikul, A.; Chattipakorn, N.; Kittichotirat, W.; Chattipakorn, S. Gut Microbiota Profiles of Treated Metabolic Syndrome Patients and their Relationship with Metabolic Health. Sci. Rep. 2020, 10, 10085. [Google Scholar] [CrossRef] [PubMed]
  26. Huse, S.M.; Ye, Y.; Zhou, Y.; Fodor, A.A. A Core Human Microbiome as Viewed through 16S rRNA Sequence Clusters. PLoS ONE 2012, 7, e34242. [Google Scholar] [CrossRef] [Green Version]
  27. Zhu, L.; Baker, S.S.; Gill, C.; Liu, W.; Alkhouri, R.; Baker, R.D.; Gill, S.R. Characterization of gut microbiomes in nonalcoholic steatohepatitis (NASH) patients: A connection between endogenous alcohol and NASH. Hepatology 2013, 57, 601–609. [Google Scholar] [CrossRef]
  28. Yang, T.W.; Lee, W.H.; Tu, S.J.; Huang, W.C.; Chen, H.M.; Sun, T.H.; Tsai, M.C.; Wang, C.C.; Chen, H.Y.; Huang, C.C.; et al. Enterotype-based Analysis of Gut Microbiota along the Conventional Adenoma-Carcinoma Colorectal Cancer Pathway. Sci. Rep. 2019, 9, 10923. [Google Scholar] [CrossRef] [Green Version]
  29. Hosoda, S.; Nishijima, S.; Fukunaga, T.; Hattori, M.; Hamada, M. Revealing the microbial assemblage structure in the human gut microbiome using latent Dirichlet allocation. Microbiome 2020, 8, 95. [Google Scholar] [CrossRef]
  30. Qin, J.; Li, Y.; Cai, Z.; Li, S.; Zhu, J.; Zhang, F.; Liang, S.; Zhang, W.; Guan, Y.; Shen, D.; et al. A metagenome-wide association study of gut microbiota in type 2 diabetes. Nature 2012, 490, 55–60. [Google Scholar] [CrossRef]
  31. Zhong, H.; Penders, J.; Shi, Z.; Ren, H.; Cai, K.; Fang, C.; Ding, Q.; Thijs, C.; Blaak, E.E.; Stehouwer, C.D.A.; et al. Impact of early events and lifestyle on the gut microbiota and metabolic phenotypes in young school-age children. Microbiome 2019, 7, 2. [Google Scholar] [CrossRef] [PubMed] [Green Version]
  32. Kisuse, J.; La-ongkham, O.; Nakphaichit, M.; Therdtatha, P.; Momoda, R.; Tanaka, M.; Fukuda, S.; Popluechai, S.; Kespechara, K.; Sonomoto, K.; et al. Urban Diets Linked to Gut Microbiome and Metabolome Alterations in Children: A Comparative Cross-Sectional Study in Thailand. Front. Microbiol. 2018, 9, 1345. [Google Scholar] [CrossRef] [PubMed] [Green Version]
  33. Costea, P.I.; Hildebrand, F.; Arumugam, M.; Bäckhed, F.; Blaser, M.J.; Bushman, F.D.; de Vos, W.M.; Ehrlich, S.D.; Fraser, C.M.; Hattori, M.; et al. Enterotypes in the landscape of gut microbial community composition. Nat. Microbiol. 2018, 3, 8–16. [Google Scholar] [CrossRef] [Green Version]
  34. Wu, G.D.; Chen, J.; Hoffmann, C.; Bittinger, K.; Chen, Y.Y.; Keilbaugh, S.A.; Bewtra, M.; Knights, D.; Walters, W.A.; Knight, R.; et al. Linking Long-Term Dietary Patterns with Gut Microbial Enterotypes. Science 2011, 334, 105–108. [Google Scholar] [CrossRef] [PubMed] [Green Version]
  35. Kovatcheva-Datchary, P.; Nilsson, A.; Akrami, R.; Lee, Y.S.; De Vadder, F.; Arora, T.; Hallen, A.; Martens, E.; Björck, I.; Bäckhed, F. Dietary Fiber-Induced Improvement in Glucose Metabolism Is Associated with Increased Abundance of Prevotella. Cell Metab. 2015, 22, 971–982. [Google Scholar] [CrossRef] [Green Version]
  36. Simpson, H.L.; Campbell, B.J. Review article: Dietary fibre–microbiota interactions. Aliment. Pharmacol. Ther. 2015, 42, 158–179. [Google Scholar] [CrossRef] [Green Version]
  37. Tomova, A.; Bukovsky, I.; Rembert, E.; Yonas, W.; Alwarith, J.; Barnard, N.D.; Kahleova, H. The effects of vegetarian and vegan diets on gut microbiota. Front. Nutr. 2019, 6, 47. [Google Scholar] [CrossRef] [Green Version]
  38. Klimenko, N.S.; Tyakht, A.V.; Popenko, A.S.; Vasiliev, A.S.; Altukhov, I.A.; Ischenko, D.S.; Shashkova, T.I.; Efimova, D.A.; Nikogosov, D.A.; Osipenko, D.A. Microbiome responses to an uncontrolled short-term diet intervention in the frame of the citizen science project. Nutrients 2018, 10, 576. [Google Scholar] [CrossRef] [Green Version]
  39. Ravel, J.; Gajer, P.; Abdo, Z.; Schneider, G.M.; Koenig, S.S.K.; McCulle, S.L.; Karlebach, S.; Gorle, R.; Russell, J.; Tacket, C.O. Vaginal microbiome of reproductive-age women. Proc. Natl. Acad. Sci. USA 2011, 108, 4680–4687. [Google Scholar] [CrossRef] [Green Version]
  40. Hyman, R.W.; Fukushima, M.; Jiang, H.; Fung, E.; Rand, L.; Johnson, B.; Vo, K.C.; Caughey, A.B.; Hilton, J.F.; Davis, R.W. Diversity of the vaginal microbiome correlates with preterm birth. Reprod. Sci. 2014, 21, 32–40. [Google Scholar] [CrossRef]
  41. Brooks, A.W.; Priya, S.; Blekhman, R.; Bordenstein, S.R. Gut microbiota diversity across ethnicities in the United States. PLoS Biol. 2018, 16, e2006842. [Google Scholar] [CrossRef] [PubMed] [Green Version]
  42. Halton, T.L.; Willett, W.C.; Liu, S.; Manson, J.E.; Stampfer, M.J.; Hu, F.B. Potato and french fry consumption and risk of type 2 diabetes in women. Am. J. Clin. Nutr. 2006, 83, 284–290. [Google Scholar] [CrossRef] [PubMed] [Green Version]
  43. Chakraborty, S.N.; Roy, S.K.; Rahaman, M.A. Epidemiological predictors of metabolic syndrome in urban West Bengal, India. J. Fam. Med. Prim. Care 2015, 4, 535. [Google Scholar] [CrossRef] [PubMed] [Green Version]
  44. Omuse, G.; Maina, D.; Hoffman, M.; Mwangi, J.; Wambua, C.; Kagotho, E.; Amayo, A.; Ojwang, P.; Premji, Z.; Ichihara, K. Metabolic syndrome and its predictors in an urban population in Kenya: A cross sectional study. BMC Endocr. Disord. 2017, 17, 37. [Google Scholar] [CrossRef] [PubMed] [Green Version]
  45. Sundarakumar, J.S.; Stezin, A.; Menesgere, A.L.; Ravindranath, V.; SANSCOG; TLSA Collaborators. Rural-urban and gender differences in metabolic syndrome in the aging population from southern India: Two parallel, prospective cohort studies. EClinicalMedicine 2022, 47, 101395. [Google Scholar] [CrossRef] [PubMed]
  46. Andrews, S. FastQC. A Quality Control Tool for High Throughput Sequence Data. 2010. Available online: https://www.bioinformatics.babraham.ac.uk/projects/fastqc/ (accessed on 15 July 2010).
  47. Ewels, P.; Magnusson, M.; Lundin, S.; Käller, M. MultiQC: Summarize analysis results for multiple tools and samples in a single report. Bioinformatics 2016, 32, 3047–3048. [Google Scholar] [CrossRef] [Green Version]
  48. Martin, M. CUTADAPT removes adapter sequences from high-throughput sequencing reads. EMBnet. J. 2011, 17, 10–12. [Google Scholar] [CrossRef]
  49. Callahan, B.J.; McMurdie, P.J.; Rosen, M.J.; Han, A.W.; Johnson, A.J.A.; Holmes, S.P. DADA2: High-resolution sample inference from Illumina amplicon data. Nat. Methods 2016, 13, 581–583. [Google Scholar] [CrossRef] [Green Version]
  50. Yilmaz, P.; Parfrey, L.W.; Yarza, P.; Gerken, J.; Pruesse, E.; Quast, C.; Schweer, T.; Peplies, J.; Ludwig, W.; Glöckner, F.O. The SILVA and “All-species Living Tree Project (LTP)” taxonomic frameworks. Nucleic Acids Res. 2013, 42, D643–D648. [Google Scholar] [CrossRef] [Green Version]
  51. Quast, C.; Pruesse, E.; Yilmaz, P.; Gerken, J.; Schweer, T.; Yarza, P.; Peplies, J.; Glöckner, F.O. The SILVA ribosomal RNA gene database project: Improved data processing and web-based tools. Nucleic Acids Res. 2012, 41, D590–D596. [Google Scholar] [CrossRef]
  52. Caliński, T.; Harabasz, J. A dendrite method for cluster analysis. Commun. Stat.-Theory Methods 1974, 3, 1–27. [Google Scholar] [CrossRef]
  53. Rousseeuw, P.J. Silhouettes: A graphical aid to the interpretation and validation of cluster analysis. J. Comput. Appl. Math. 1987, 20, 53–65. [Google Scholar] [CrossRef] [Green Version]
  54. Endres, D.M.; Schindelin, J.E. A new metric for probability distributions. IEEE Trans. Inf. Theory 2003, 49, 1858–1860. [Google Scholar] [CrossRef] [Green Version]
  55. Bray, J.R.; Curtis, J.T. An Ordination of the Upland Forest Communities of Southern Wisconsin. Ecol. Monogr. 1957, 27, 325–349. [Google Scholar] [CrossRef]
  56. Vázquez-Baeza, Y.; Pirrung, M.; Gonzalez, A.; Knight, R. EMPeror: A tool for visualizing high-throughput microbial community data. Gigascience 2013, 2, 2047-217X-2-16. [Google Scholar] [CrossRef] [Green Version]
  57. Segata, N.; Izard, J.; Waldron, L.; Gevers, D.; Miropolsky, L.; Garrett, W.S.; Huttenhower, C. Metagenomic biomarker discovery and explanation. Genome Biol. 2011, 12, R60. [Google Scholar] [CrossRef] [Green Version]
  58. Akoglu, H. User’s guide to correlation coefficients. Turk. J. Emerg. Med. 2018, 18, 91–93. [Google Scholar] [CrossRef]
  59. Li, M.; Li, D.; Tang, Y.; Wu, F.; Wang, J. CytoCluster: A cytoscape plugin for cluster analysis and visualization of biological networks. Int. J. Mol. Sci. 2017, 18, 1880. [Google Scholar] [CrossRef] [Green Version]
  60. Assenov, Y.; Ramírez, F.; Schelhorn, S.E.; Lengauer, T.; Albrecht, M. Computing topological parameters of biological networks. Bioinformatics 2008, 24, 282–284. [Google Scholar] [CrossRef] [Green Version]
  61. Shannon, P.; Markiel, A.; Ozier, O.; Baliga, N.S.; Wang, J.T.; Ramage, D.; Amin, N.; Schwikowski, B.; Ideker, T. Cytoscape: A Software Environment for Integrated Models of Biomolecular Interaction Networks. Genome Res. 2003, 13, 2498–2504. [Google Scholar] [CrossRef]
  62. Baralis, E.; Bianco, A.; Cerquitelli, T.; Chiaraviglio, L.; Mellia, M. NetCluster: A Clustering-Based Framework for Internet Tomography. In Proceedings of the 2009 IEEE International Conference on Communications, Dresden, Germany, 14–18 June 2009; pp. 1–5. [Google Scholar]
  63. Douglas, G.M.; Maffei, V.J.; Zaneveld, J.; Yurgel, S.N.; Brown, J.R.; Taylor, C.M.; Huttenhower, C.; Langille, M.G. PICRUSt2 for prediction of metagenome functions. Nat. Biotechnol. 2020, 38, 685–688. [Google Scholar] [CrossRef] [PubMed]
  64. Kanehisa, M.; Furumichi, M.; Sato, Y.; Ishiguro-Watanabe, M.; Tanabe, M. KEGG: Integrating viruses and cellular organisms. Nucleic Acids Res. 2021, 49, D545–D551. [Google Scholar] [CrossRef] [PubMed]
  65. Parks, D.H.; Tyson, G.W.; Hugenholtz, P.; Beiko, R.G. STAMP: Statistical analysis of taxonomic and functional profiles. Bioinformatics 2014, 30, 3123–3124. [Google Scholar] [CrossRef] [Green Version]
  66. Benjamin, D.J.; Berger, J.O.; Johannesson, M.; Nosek, B.A.; Wagenmakers, E.J.; Berk, R.; Bollen, K.A.; Brembs, B.; Brown, L.; Camerer, C.; et al. Redefine statistical significance. Nat. Hum. Behav. 2018, 2, 6–10. [Google Scholar] [CrossRef] [Green Version]
  67. García-López, R.; Cornejo-Granados, F.; Lopez-Zavala, A.A.; Sánchez-López, F.; Cota-Huízar, A.; Sotelo-Mundo, R.R.; Guerrero, A.; Mendoza-Vargas, A.; Gómez-Gil, B.; Ochoa-Leyva, A. Doing More with Less: A Comparison of 16S Hypervariable Regions in Search of Defining the Shrimp Microbiota. Microorganisms 2020, 8, 134. [Google Scholar] [CrossRef] [PubMed] [Green Version]
  68. Kelly, D.; Yang, L.; Pei, Z. Gut Microbiota, Fusobacteria, and Colorectal Cancer. Diseases 2018, 6, 109. [Google Scholar] [CrossRef] [PubMed] [Green Version]
  69. Broadley, M.; Schweon, S.J. Get the facts about Fusobacterium. Nursing2020 2017, 47, 64–65. [Google Scholar] [CrossRef] [PubMed]
  70. Barabási, A.L.; Oltvai, Z.N. Network biology: Understanding the cell’s functional organization. Nat. Rev. Genet. 2004, 5, 101–113. [Google Scholar] [CrossRef]
  71. Asgari, Y.; Salehzadeh-Yazdi, A.; Schreiber, F.; Masoudi-Nejad, A. Controllability in cancer metabolic networks according to drug targets as driver nodes. PLoS ONE 2013, 8, e79397. [Google Scholar] [CrossRef] [Green Version]
  72. Pavlopoulos, G.A.; Secrier, M.; Moschopoulos, C.N.; Soldatos, T.G.; Kossida, S.; Aerts, J.; Schneider, R.; Bagos, P.G. Using graph theory to analyze biological networks. BioData Min. 2011, 4, 10. [Google Scholar] [CrossRef]
  73. Agrawal, S.; Agrawal, A.; Said, H.M. Biotin deficiency enhances the inflammatory response of human dendritic cells. Am. J. Physiol.-Cell Physiol. 2016, 311, C386–C391. [Google Scholar] [CrossRef] [Green Version]
  74. Hjorth, M.F.; Blædel, T.; Bendtsen, L.Q.; Lorenzen, J.K.; Holm, J.B.; Kiilerich, P.; Roager, H.M.; Kristiansen, K.; Larsen, L.H.; Astrup, A. Prevotella-to-Bacteroides ratio predicts body weight and fat loss success on 24-week diets varying in macronutrient composition and dietary fiber: Results from a post-hoc analysis. Int. J. Obes. 2019, 43, 149–157. [Google Scholar] [CrossRef] [Green Version]
  75. Watanabe, M.; Sianoya, A.; Mishima, R.; Therdtatha, P.; Rodriguez, A.; Ramos, D.C.; Lee, Y.K.; Dalmacio, L.M.; Nakayama, J. Gut microbiome status of urban and rural Filipino adults in relation to diet and metabolic disorders. FEMS Microbiol. Lett. 2021, 368, fnab149. [Google Scholar] [CrossRef]
  76. Rosas-Plaza, S.; Hernández-Terán, A.; Navarro-Díaz, M.; Escalante, A.E.; Morales-Espinosa, R.; Cerritos, R. Human Gut Microbiome Across Different Lifestyles: From Hunter-Gatherers to Urban Populations. Front. Microbiol. 2022, 13, 843170. [Google Scholar] [CrossRef]
  77. Hjorth, M.; Roager, H.M.; Larsen, T.; Poulsen, S.; Licht, T.R.; Bahl, M.I.; Zohar, Y.; Astrup, A. Pre-treatment microbial Prevotella-to-Bacteroides ratio, determines body fat loss success during a 6-month randomized controlled diet intervention. Int. J. Obes. 2018, 42, 580–583. [Google Scholar] [CrossRef] [Green Version]
  78. Magne, F.; Gotteland, M.; Gauthier, L.; Zazueta, A.; Pesoa, S.; Navarrete, P.; Balamurugan, R. The Firmicutes/Bacteroidetes Ratio: A Relevant Marker of Gut Dysbiosis in Obese Patients? Nutrients 2020, 12, 1474. [Google Scholar] [CrossRef]
  79. Louis, P.; Flint, H.J. Formation of propionate and butyrate by the human colonic microbiota. Environ. Microbiol. 2017, 19, 29–41. [Google Scholar] [CrossRef] [PubMed] [Green Version]
  80. Chiumento, S.; Roblin, C.; Kieffer-Jaquinod, S.; Tachon, S.; Leprètre, C.; Basset, C.; Aditiyarini, D.; Olleik, H.; Nicoletti, C.; Bornet, O.; et al. Ruminococcin C, a promising antibiotic produced by a human gut symbiont. Sci. Adv. 2019, 5, eaaw9969. [Google Scholar] [CrossRef] [Green Version]
  81. Ze, X.; Duncan, S.H.; Louis, P.; Flint, H.J. Ruminococcus bromii is a keystone species for the degradation of resistant starch in the human colon. ISME J. 2012, 6, 1535–1543. [Google Scholar] [CrossRef] [Green Version]
  82. La Reau, A.J.; Suen, G. The Ruminococci: Key symbionts of the gut ecosystem. J. Microbiol. 2018, 56, 199–208. [Google Scholar] [CrossRef]
  83. Scott, K.P.; Jean-Michel, A.; Midtvedt, T.; van Hemert, S. Manipulating the gut microbiota to maintain health and treat disease. Microb. Ecol. Health Dis. 2015, 26, 25877. [Google Scholar] [CrossRef]
  84. Meslier, V.; Laiola, M.; Roager, H.M.; De Filippis, F.; Roume, H.; Quinquis, B.; Giacco, R.; Mennella, I.; Ferracane, R.; Pons, N.; et al. Mediterranean diet intervention in overweight and obese subjects lowers plasma cholesterol and causes changes in the gut microbiome and metabolome independently of energy intake. Gut 2020, 69, 1258–1268. [Google Scholar] [CrossRef] [Green Version]
  85. Hagerty, S.L.; Hutchison, K.E.; Lowry, C.A.; Bryan, A.D. An empirically derived method for measuring human gut microbiome alpha diversity: Demonstrated utility in predicting health-related outcomes among a human clinical sample. PLoS ONE 2020, 15, e0229204. [Google Scholar] [CrossRef] [Green Version]
  86. Menni, C.; Jackson, M.A.; Pallister, T.; Steves, C.J.; Spector, T.D.; Valdes, A.M. Gut microbiome diversity and high-fibre intake are related to lower long-term weight gain. Int. J. Obes. 2017, 41, 1099–1105. [Google Scholar] [CrossRef] [Green Version]
  87. Ahmad, A.; Yang, W.; Chen, G.; Shafiq, M.; Javed, S.; Zaidi, S.S.A.; Shahid, R.; Liu, C.; Bokhari, H. Analysis of gut microbiota of obese individuals with type 2 diabetes and healthy individuals. PLoS ONE 2019, 14, e0226372. [Google Scholar] [CrossRef] [Green Version]
  88. Almugadam, B.S.; Liu, Y.; Chen, S.M.; Wang, C.H.; Shao, C.Y.; Ren, B.W.; Tang, L. Alterations of Gut Microbiota in Type 2 Diabetes Individuals and the Confounding Effect of Antidiabetic Agents. J. Diabetes Res. 2020, 2020, 7253978. [Google Scholar] [CrossRef]
  89. Afra, K.; Laupland, K.; Leal, J.; Lloyd, T.; Gregson, D. Incidence, risk factors, and outcomes of Fusobacterium species bacteremia. BMC Infect Dis. 2013, 13, 264. [Google Scholar] [CrossRef] [Green Version]
  90. Zhang, Y.J.; Li, S.; Gan, R.Y.; Zhou, T.; Xu, D.P.; Li, H.B. Impacts of Gut Bacteria on Human Health and Diseases. Int. J. Mol. Sci. 2015, 16, 7493–7519. [Google Scholar] [CrossRef]
  91. Wan, L.; Ge, W.R.; Zhang, S.; Sun, Y.L.; Wang, B.; Yang, G. Case-Control Study of the Effects of Gut Microbiota Composition on Neurotransmitter Metabolic Pathways in Children With Attention Deficit Hyperactivity Disorder. Front. Neurosci. 2020, 14, 127. [Google Scholar] [CrossRef] [Green Version]
  92. Winter, G.; Hart, R.A.; Charlesworth, R.P.G.; Sharpley, C.F. Gut microbiome and depression: What we know and what we need to know. Rev. Neurosci. 2018, 29, 629–643. [Google Scholar] [CrossRef]
  93. Chen, J.; Wright, K.; Davis, J.M.; Jeraldo, P.; Marietta, E.V.; Murray, J.; Nelson, H.; Matteson, E.L.; Taneja, V. An expansion of rare lineage intestinal microbes characterizes rheumatoid arthritis. Genome Med. 2016, 8, 43. [Google Scholar] [CrossRef] [Green Version]
  94. Deng, Y.D.; Peng, X.B.; Zhao, R.R.; Ma, C.Q.; Li, J.N.; Yao, L.Q. The intestinal microbial community dissimilarity in hepatitis B virus-related liver cirrhosis patients with and without at alcohol consumption. Gut Pathog. 2019, 11, 58. [Google Scholar] [CrossRef]
  95. Kelly, T.N.; Bazzano, L.A.; Ajami, N.J.; He, H.; Zhao, J.; Petrosino, J.F.; Correa, A.; He, J. Gut Microbiome Associates With Lifetime Cardiovascular Disease Risk Profile Among Bogalusa Heart Study Participants. Circ. Res. 2016, 119, 956–964. [Google Scholar] [CrossRef] [Green Version]
  96. Sun, Y.; Chen, Q.; Lin, P.; Xu, R.; He, D.; Ji, W.; Bian, Y.; Shen, Y.; Li, Q.; Liu, C.; et al. Characteristics of Gut Microbiota in Patients With Rheumatoid Arthritis in Shanghai, China. Front. Cell. Infect. Microbiol. 2019, 9, 369. [Google Scholar] [CrossRef] [Green Version]
  97. Signat, B.; Roques, C.; Poulet, P.; Duffaut, D. Fusobacterium nucleatum in Periodontal Health and Disease. Curr. Issues Mol. Biol. 2011, 13, 25–36. [Google Scholar] [CrossRef] [Green Version]
  98. Amitay, E.L.; Werner, S.; Vital, M.; Pieper, D.H.; Höfler, D.; Gierse, I.J.; Butt, J.; Balavarca, Y.; Cuk, K.; Brenner, H. Fusobacterium and colorectal cancer: Causal factor or passenger? Results from a large colorectal cancer screening study. Carcinogenesis 2017, 38, 781–788. [Google Scholar] [CrossRef] [Green Version]
  99. Ye, X.; Wang, R.; Bhattacharya, R.; Boulbes, D.R.; Fan, F.; Xia, L.; Adoni, H.; Ajami, N.J.; Wong, M.C.; Smith, D.P.; et al. Fusobacterium Nucleatum Subspecies Animalis Influences Proinflammatory Cytokine Expression and Monocyte Activation in Human Colorectal Tumors. Cancer Prev. Res. 2017, 10, 398–409. [Google Scholar] [CrossRef] [Green Version]
  100. Wu, N.; Yang, X.; Zhang, R.; Li, J.; Xiao, X.; Hu, Y.; Chen, Y.; Yang, F.; Lu, N.; Wang, Z.; et al. Dysbiosis Signature of Fecal Microbiota in Colorectal Cancer Patients. Microb. Ecol. 2013, 66, 462–470. [Google Scholar] [CrossRef]
  101. Manson McGuire, A.; Cochrane, K.; Griggs, A.D.; Haas, B.J.; Abeel, T.; Zeng, Q.; Nice, J.B.; MacDonald, H.; Birren, B.W.; Berger, B.W.; et al. Evolution of invasion in a diverse set of Fusobacterium species. MBio 2014, 5, e01864. [Google Scholar] [CrossRef] [Green Version]
  102. Magnúsdóttir, S.; Ravcheev, D.; de Crécy-Lagard, V.; Thiele, I. Systematic genome assessment of B-vitamin biosynthesis suggests co-operation among gut microbes. Front. Genet. 2015, 6, 148. [Google Scholar] [CrossRef]
  103. Rothstein, D.M. Rifamycins, Alone and in Combination. Cold Spring Harb. Perspect. Med. 2016, 6, a027011. [Google Scholar] [CrossRef] [PubMed] [Green Version]
  104. Lee, D.H.; Oh, J.H.; Chung, J.H. Glycosaminoglycan and proteoglycan in skin aging. J. Dermatol. Sci. 2016, 83, 174–181. [Google Scholar] [CrossRef]
  105. Zeng, H.; Umar, S.; Rust, B.; Lazarova, D.; Bordonaro, M. Secondary Bile Acids and Short Chain Fatty Acids in the Colon: A Focus on Colonic Microbiome, Cell Proliferation, Inflammation, and Cancer. Int. J. Mol. Sci. 2019, 20, 1214. [Google Scholar] [CrossRef] [Green Version]
  106. Ajouz, H.; Mukherji, D.; Shamseddine, A. Secondary bile acids: An underrecognized cause of colon cancer. World J. Surg. Oncol. 2014, 12, 164. [Google Scholar] [CrossRef] [Green Version]
  107. Hofmann, A.F.; Cravetto, C.; Molino, G.; Belforte, G.; Bona, B. Simulation of the metabolism and enterohepatic circulation of endogenous deoxycholic acid in humans using a physiologic pharmacokinetic model for bile acid metabolism. Gastroenterology 1987, 93, 693–709. [Google Scholar] [CrossRef] [PubMed]
  108. Bernstein, C.; Holubec, H.; Bhattacharyya, A.K.; Nguyen, H.; Payne, C.M.; Zaitlin, B.; Bernstein, H. Carcinogenicity of deoxycholate, a secondary bile acid. Arch. Toxicol. 2011, 85, 863–871. [Google Scholar] [CrossRef] [Green Version]
  109. Sinha, S.R.; Haileselassie, Y.; Nguyen, L.P.; Tropini, C.; Wang, M.; Becker, L.S.; Sim, D.; Jarr, K.; Spear, E.T.; Singh, G. Dysbiosis-induced secondary bile acid deficiency promotes intestinal inflammation. Cell Host Microbe 2020, 27, 659–670. [Google Scholar] [CrossRef]
  110. Milovic, V.; Teller, I.C.; Faust, D.; Caspary, W.F.; Stein, J. Effects of deoxycholate on human colon cancer cells: Apoptosis or proliferation. Eur. J. Clin. Investig. 2002, 32, 29–34. [Google Scholar] [CrossRef] [PubMed]
  111. Heinken, A.; Ravcheev, D.A.; Baldini, F.; Heirendt, L.; Fleming, R.M.T.; Thiele, I. Systematic assessment of secondary bile acid metabolism in gut microbes reveals distinct metabolic capabilities in inflammatory bowel disease. Microbiome 2019, 7, 75. [Google Scholar] [CrossRef] [Green Version]
  112. Lavelle, A.; Sokol, H. Gut microbiota-derived metabolites as key actors in inflammatory bowel disease. Nat. Rev. Gastroenterol. Hepatol. 2020, 17, 223–237. [Google Scholar] [CrossRef]
  113. Naqvi, A.; Rangwala, H.; Keshavarzian, A.; Gillevet, P. Network-Based Modeling of the Human Gut Microbiome Chem. Biodivers. 2010, 7, 1040–1050. [Google Scholar] [CrossRef]
  114. Wexler, A.G.; Goodman, A.L. An insider’s perspective: Bacteroides as a window into the microbiome. Nat. Microbiol. 2017, 2, 17026. [Google Scholar] [CrossRef] [Green Version]
  115. Wexler, H.M. Bacteroides: The Good, the Bad, and the Nitty-Gritty. Clin. Microbiol. Rev. 2007, 20, 593–621. [Google Scholar] [CrossRef] [PubMed] [Green Version]
  116. Djekic, D.; Shi, L.; Brolin, H.; Carlsson, F.; Särnqvist, C.; Savolainen, O.; Cao, Y.; Bäckhed, F.; Tremaroli, V.; Landberg, R. Effects of a vegetarian diet on cardiometabolic risk factors, gut microbiota, and plasma metabolome in subjects with ischemic heart disease: A randomized, crossover study. J. Am. Heart Assoc. 2020, 9, e016518. [Google Scholar] [CrossRef] [PubMed]
  117. Park, J.; Hosomi, K.; Kawashima, H.; Chen, Y.A.; Mohsen, A.; Ohno, H.; Konishi, K.; Tanisawa, K.; Kifushi, M.; Kogawa, M. Dietary Vitamin B1 Intake Influences Gut Microbial Community and the Consequent Production of Short-Chain Fatty Acids. Nutrients 2022, 14, 2078. [Google Scholar] [CrossRef]
  118. van Trijp, M.P.H.; Schutte, S.; Esser, D.; Wopereis, S.; Hoevenaars, F.P.M.; Hooiveld, G.J.E.J.; Afman, L.A. Minor Changes in the Composition and Function of the Gut Microbiota During a 12-Week Whole Grain Wheat or Refined Wheat Intervention Correlate with Liver Fat in Overweight and Obese Adults. J. Nutr. 2021, 151, 491–502. [Google Scholar] [CrossRef]
  119. Kosulwat, V. The nutrition and health transition in Thailand. Public Health Nutr. 2002, 5, 183–189. [Google Scholar] [CrossRef] [Green Version]
  120. Ishimoto, T.; Lanaspa, M.A.; Rivard, C.J.; Roncal-Jimenez, C.A.; Orlicky, D.J.; Cicerchi, C.; McMahan, R.H.; Abdelmalek, M.F.; Rosen, H.R.; Jackman, M.R. High-fat and high-sucrose (western) diet induces steatohepatitis that is dependent on fructokinase. Hepatology 2013, 58, 1632–1643. [Google Scholar] [CrossRef] [Green Version]
  121. Nagao-Kitamoto, H.; Kamada, N. Host-microbial Cross-talk in Inflammatory Bowel Disease. Immune Netw. 2017, 17, 1–12. [Google Scholar] [CrossRef] [Green Version]
  122. Hu, J.X.; Thomas, C.E.; Brunak, S. Network biology concepts in complex disease comorbidities. Nat. Rev. Genet. 2016, 17, 615–629. [Google Scholar] [CrossRef] [PubMed]
  123. Landi, P.; Minoarivelo, H.O.; Brännström, Å.; Hui, C.; Dieckmann, U. Complexity and stability of ecological networks: A review of the theory. Popul. Ecol. 2018, 60, 319–345. [Google Scholar] [CrossRef]
  124. Aliyu, S.H.; Marriott, R.K.; Curran, M.D.; Parmar, S.; Bentley, N.; Brown, N.M.; Brazier, J.S.; Ludlam, H. Real-time PCR investigation into the importance of Fusobacterium necrophorum as a cause of acute pharyngitis in general practice. J. Med. Microbiol. 2004, 53, 1029–1035. [Google Scholar] [CrossRef] [PubMed]
  125. de Andrade, K.Q.; Almeida-da-Silva, C.L.C.; Coutinho-Silva, R. Immunological pathways triggered by Porphyromonas gingivalis and Fusobacterium nucleatum: Therapeutic possibilities? Mediat. Inflamm. 2019, 2019, 7241312. [Google Scholar] [CrossRef] [PubMed]
Figure 1. Gut microbiome enterotype and bacterial taxa in each enterotype: (A) gut microbiome profiles were separated into EnP and EnB based on the enterotyping method and were visualized by PCoA, in which X-axis and Y-axis represent the first and second principal components. Ten highest average taxonomic relative abundances at the genus level in EnP (B) and EnB (C) were demonstrated by boxplots.
Microorganisms 11 00136 g001aMicroorganisms 11 00136 g001b
Figure 2. Differential abundance analysis. Differential abundant taxa were identified for EnP (red) and EnB (green) using LEfSe with the criteria LDA score ≥ 2.0 and p-value < 0.05.
Microorganisms 11 00136 g002
Figure 3. α-diversity analysis of gut microbiome composition in EnP and EnB with (A) Chao1, (B) Pielou’s evenness, (C) Shannon’s diversity, and (D) Simpson’s diversity indices. The symbols *** and **** represent p-value < 0.001 and p-value < 0.0001, respectively.
Microorganisms 11 00136 g003
Figure 4. Co-occurrence network. Co-occurrence network of EnP (A) and EnB (B) were constructed based on Spearman’s correlation between microbial profiles with the criteria ρ ≥ 0.5 and p-value < 0.05. Nodes and edges represent taxa and microbe–microbe relationships, and node and edge colors denote bacterial phylum and type of correlation, respectively.
Microorganisms 11 00136 g004
Figure 5. Enrichment analysis of microbial metabolic function. A comparison of predicted metabolic functions between enterotypes was performed by enrichment analysis. Bar plots display the mean proportion (%) of metabolic pathways for EnP and EnB. Differences in mean proportions were conducted using two-sided Welch’s t-test and multiple hypothesis correction by Benjamin’s test with the criteria of difference in mean proportion > 0.1% and q-value < 0.05. The enriched pathways in EnP and EnB were denoted by pink and orange dots, respectively.
Microorganisms 11 00136 g005
Table 1. Characteristics of participants in each enterotype.
Lifestyle VariablesN
(n = 96)
EnP
(n = 32)
EnB
(n = 64)
p-Value 1
Gender 0.339
Male291217
Female611744
Age (years)34.17 ± 10.5734.31 ± 10.7534.10 ± 10.560.972
18 to 2520614
26 to 35291019
36 to 45311021
46 to 55624
Over 55413
BMI 2 (kg/m2)22.58 ± 3.6822.78 ± 3.4022.48 ± 3.820.884
Underweight927
Normal481632
Overweight23815
Obese1037
Types of diets 0.586
Vegetable and animal meat622240
Vegetable and animal meat but not consume raw meat27720
Vegan101
1 p-values were derived from Fisher’s exact test for testing the difference of lifestyle variables between enterotypes. 2 BMI stands for Body Mass Index.
Table 2. Network properties of enterotypes.
Network PropertiesEnPEnB
Number of nodes6742
Number of edges181
(Positive: 166, Negative: 15)
109
(Positive: 100, Negative: 9)
Clustering coefficient0.3530.485
Network diameter75
Average number of neighbors6.0696.516
Network density0.1060.217
Network centralization0.2710.409
Disclaimer/Publisher’s Note: The statements, opinions and data contained in all publications are solely those of the individual author(s) and contributor(s) and not of MDPI and/or the editor(s). MDPI and/or the editor(s) disclaim responsibility for any injury to people or property resulting from any ideas, methods, instructions or products referred to in the content.

