
Changes in Amino Acid Metabolism of Staphylococcus aureus following Growth to the Stationary Phase under Adjusted Growth Conditions

 , ,
, ,  ,
,  , ,
, , 
Abstract
:1. Introduction
2. Materials and Methods
2.1. S. aureus Strains
2.2. Bacterial Growth Conditions and Experimental Design
2.3. Analyses of Cell Extracts for Metabolic Profiling
2.4. Processing and Analysis of Metabolic Profile Data
3. Results
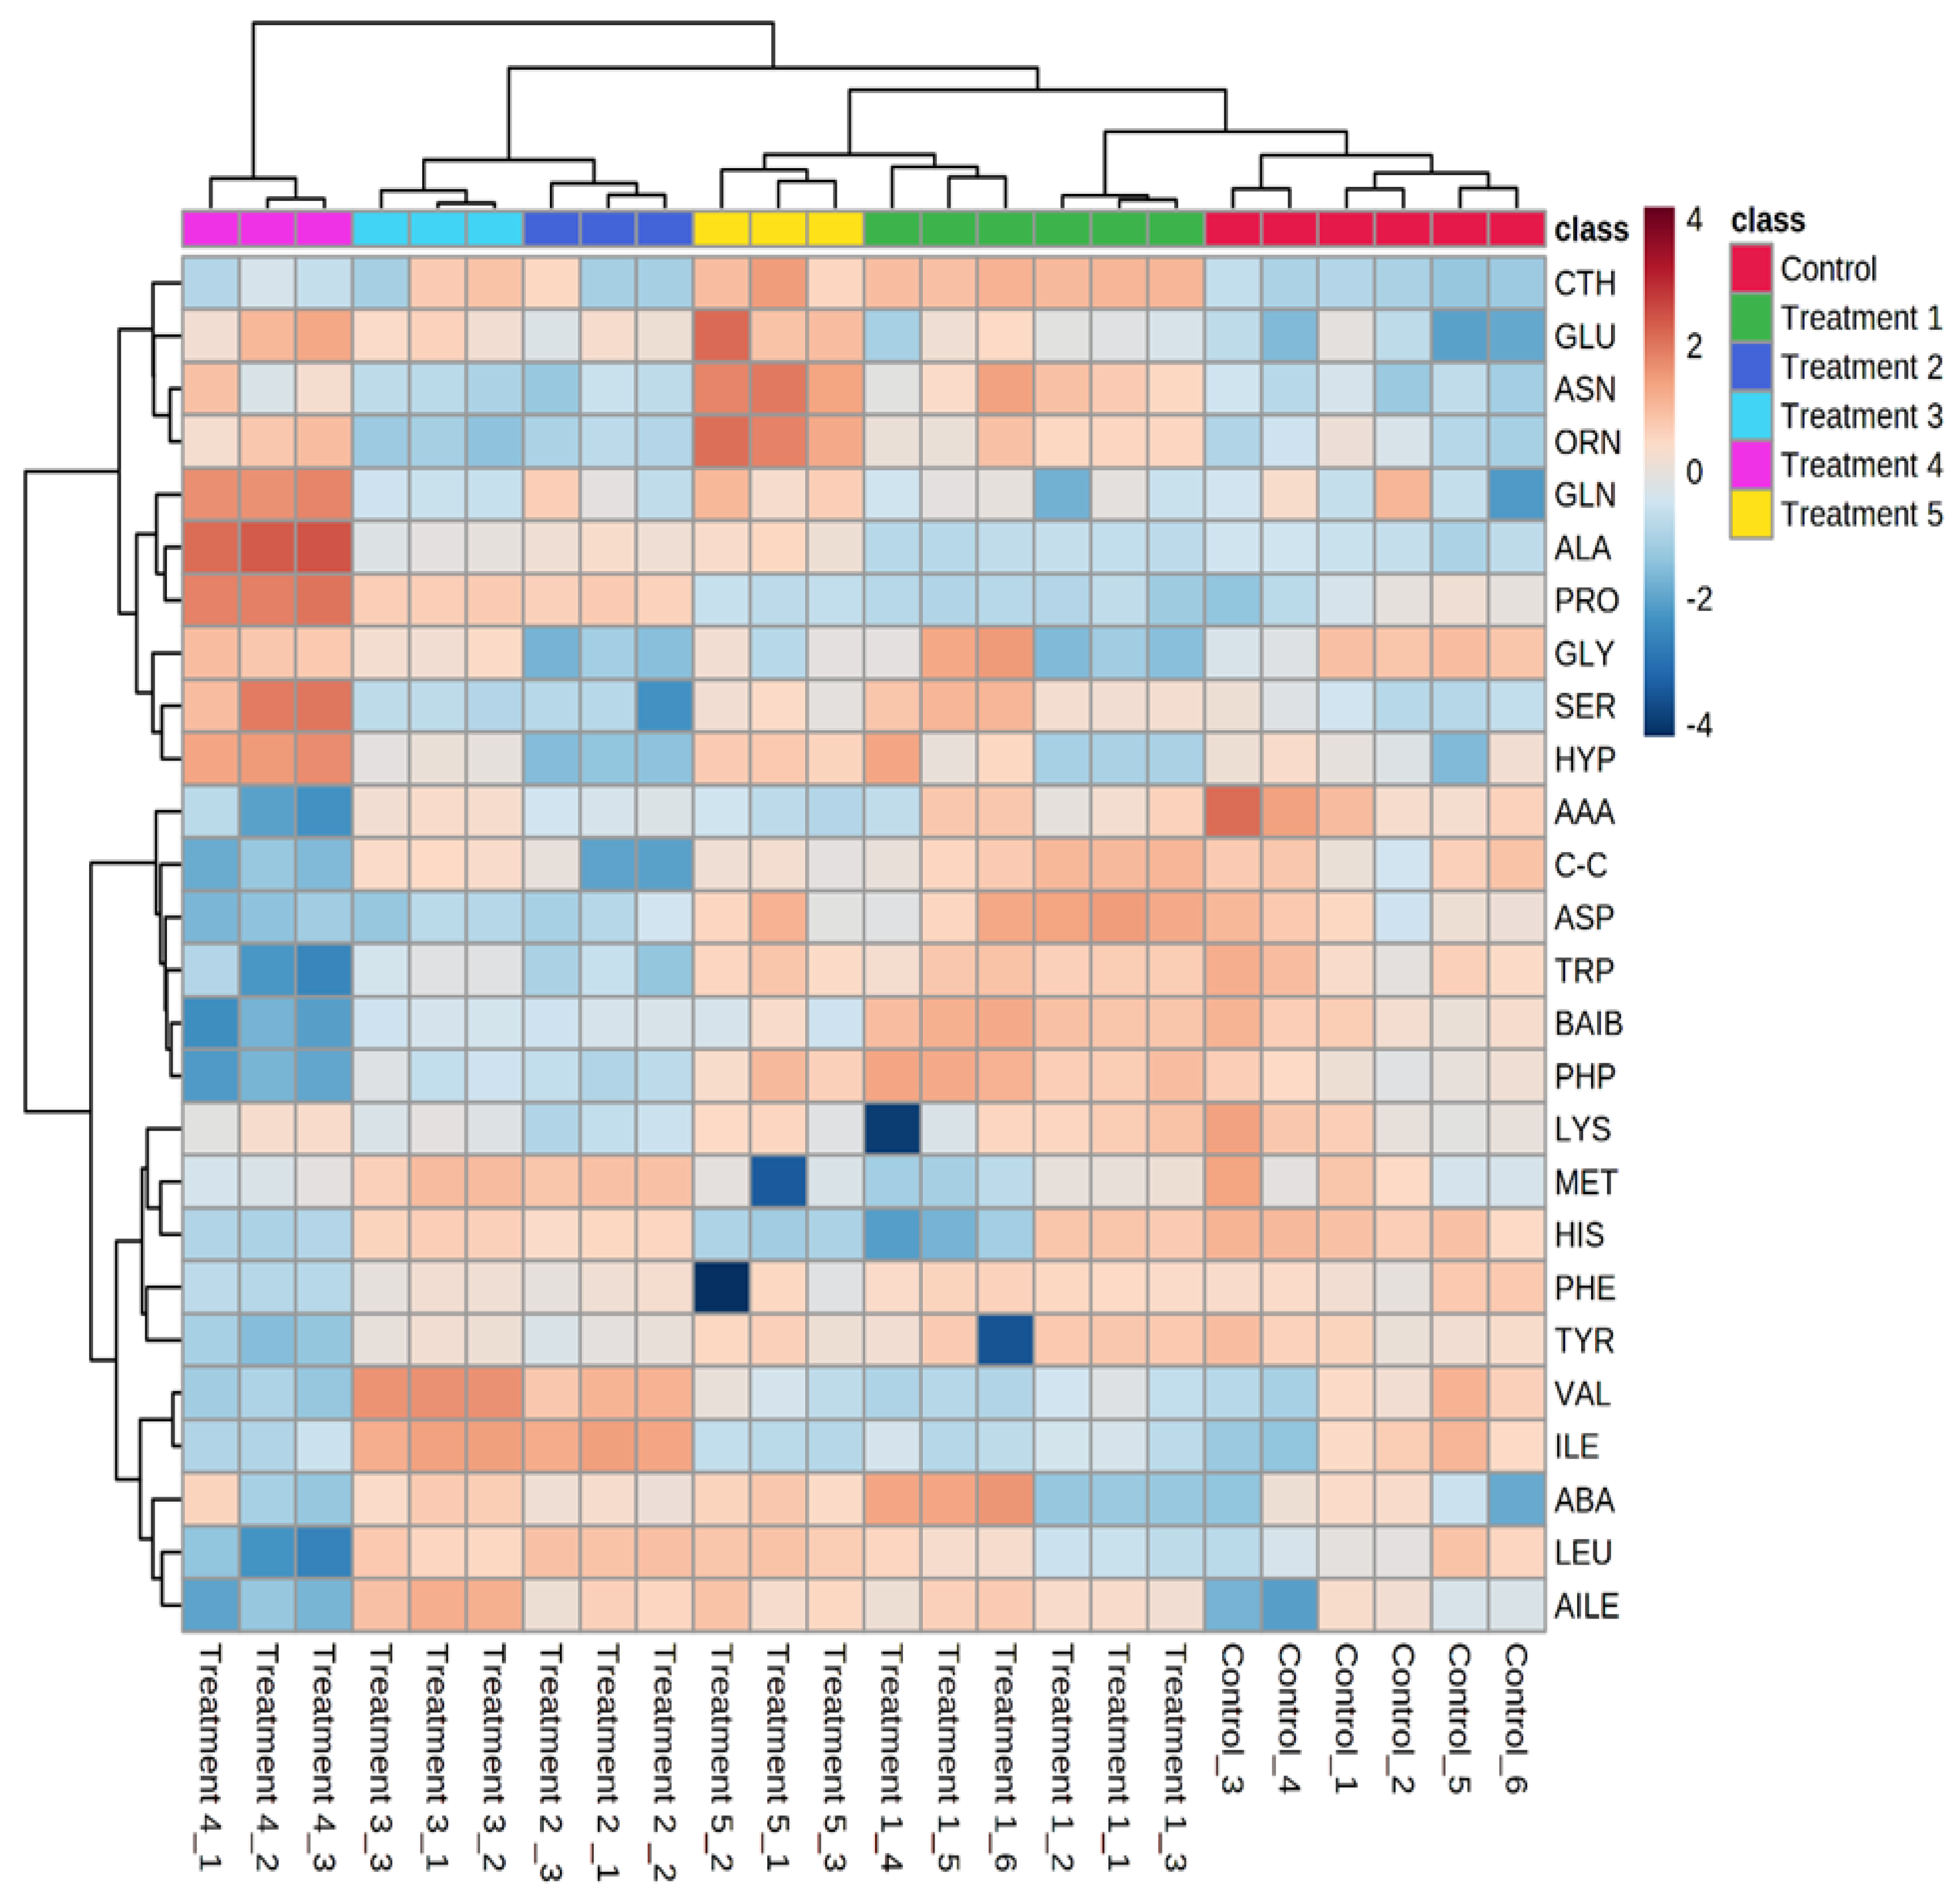
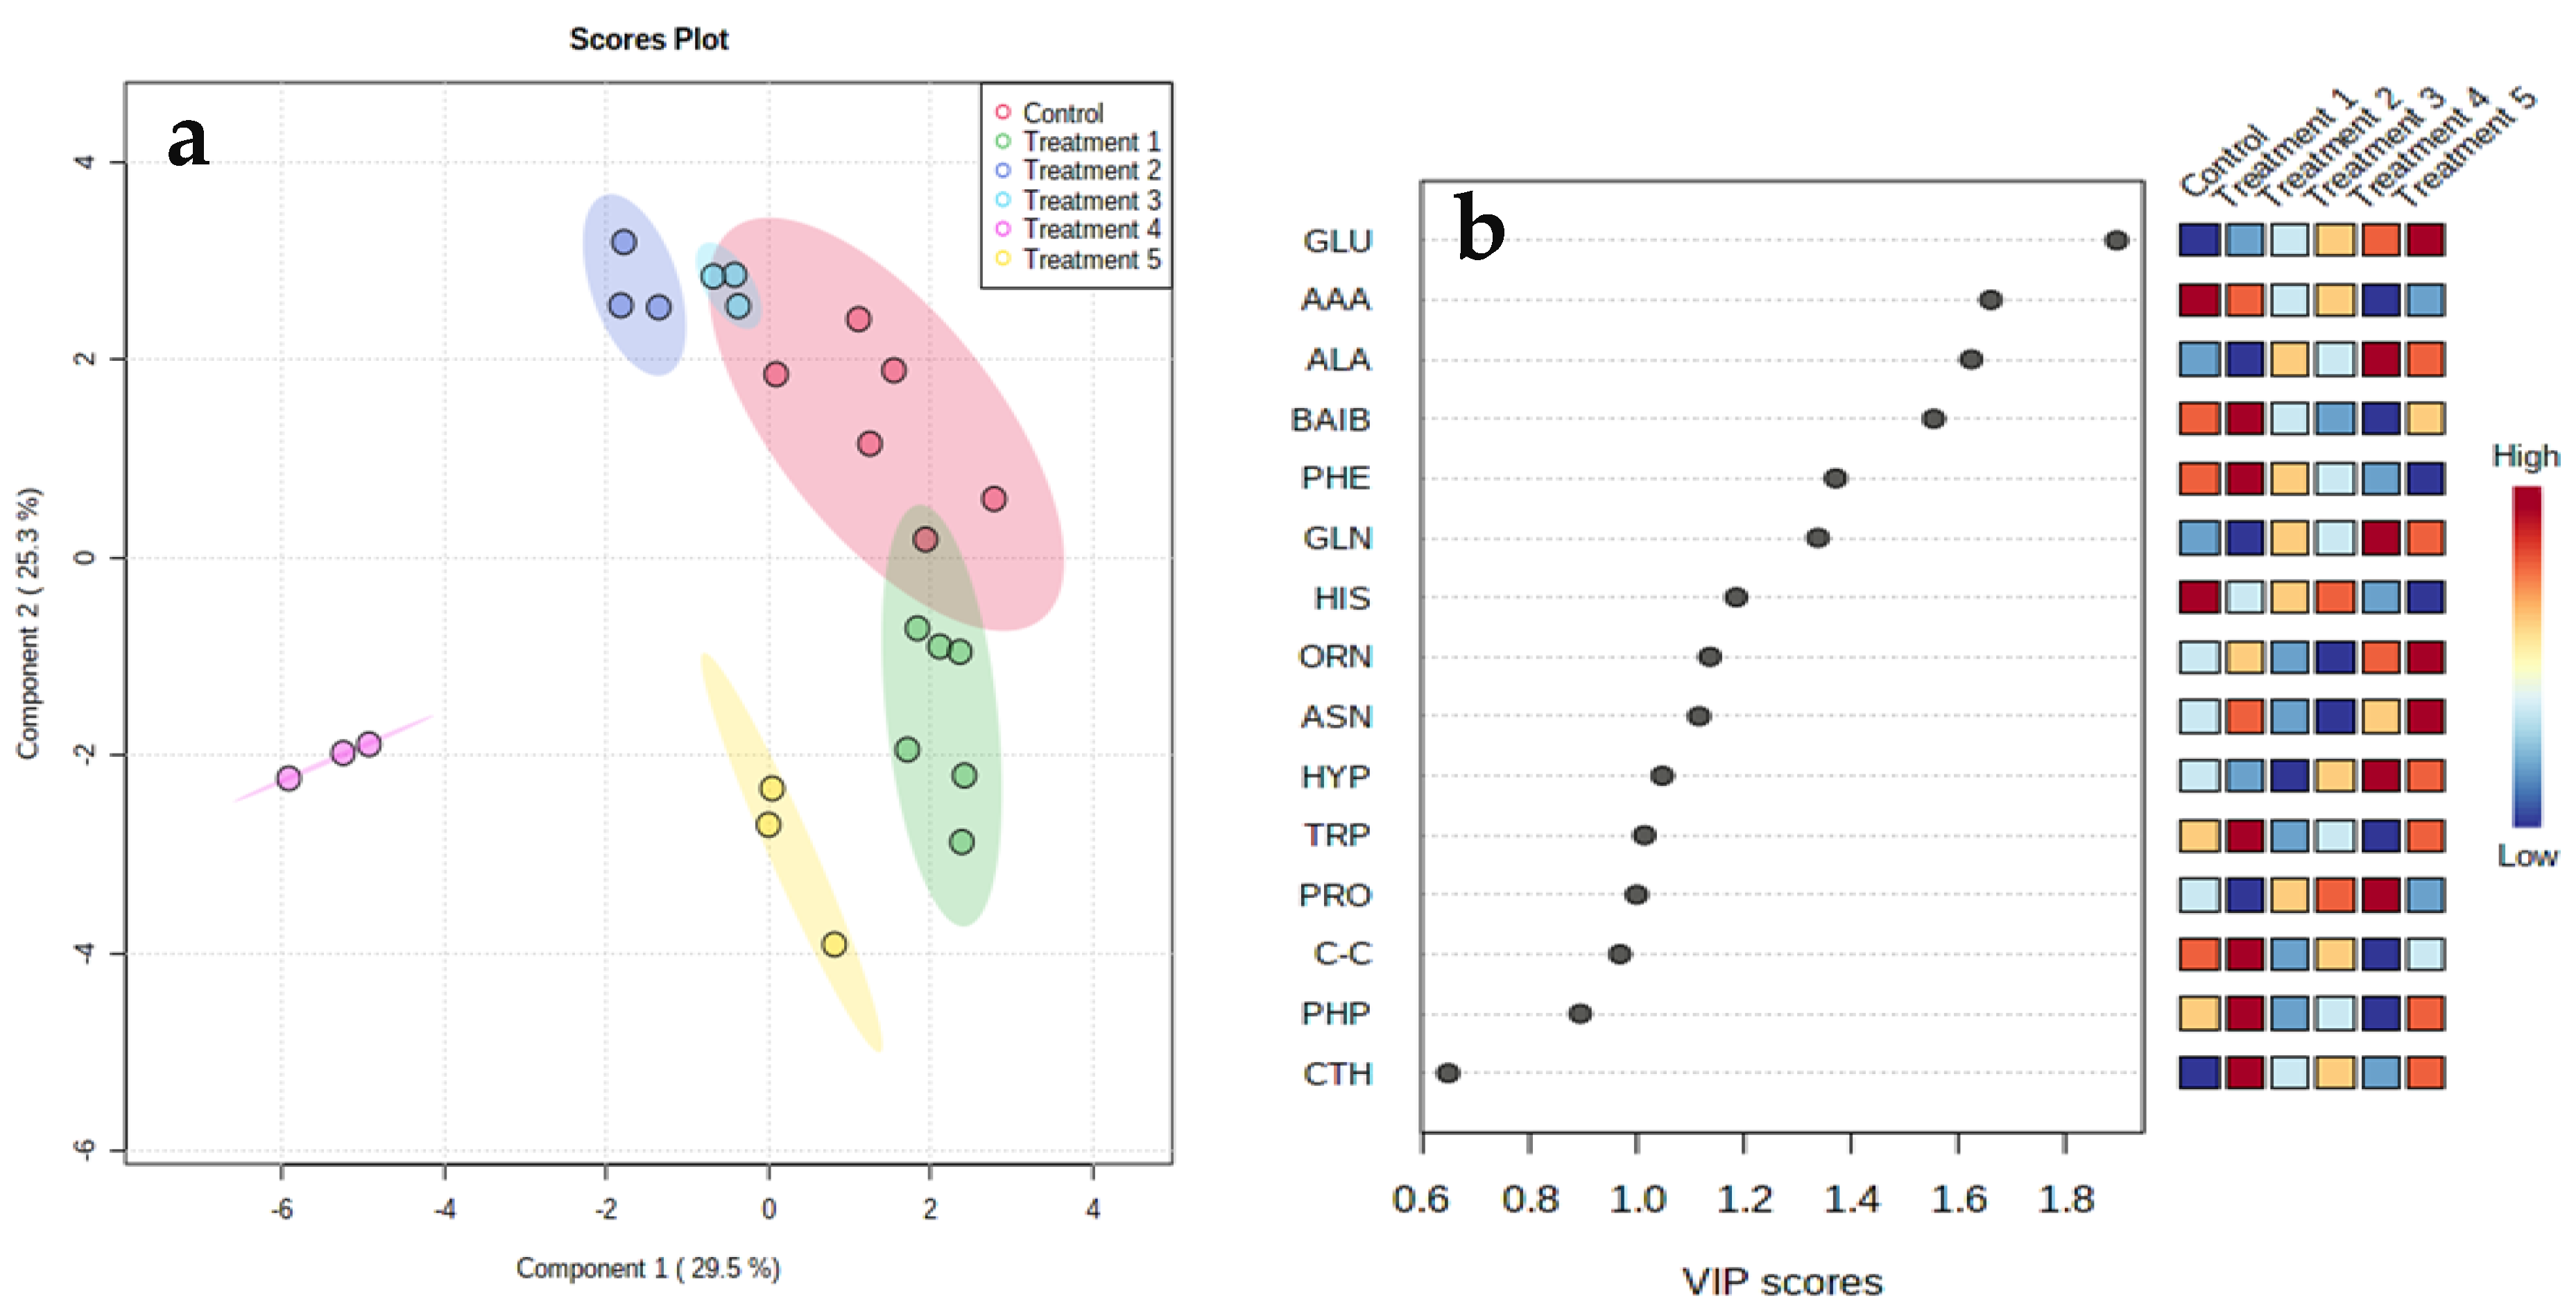
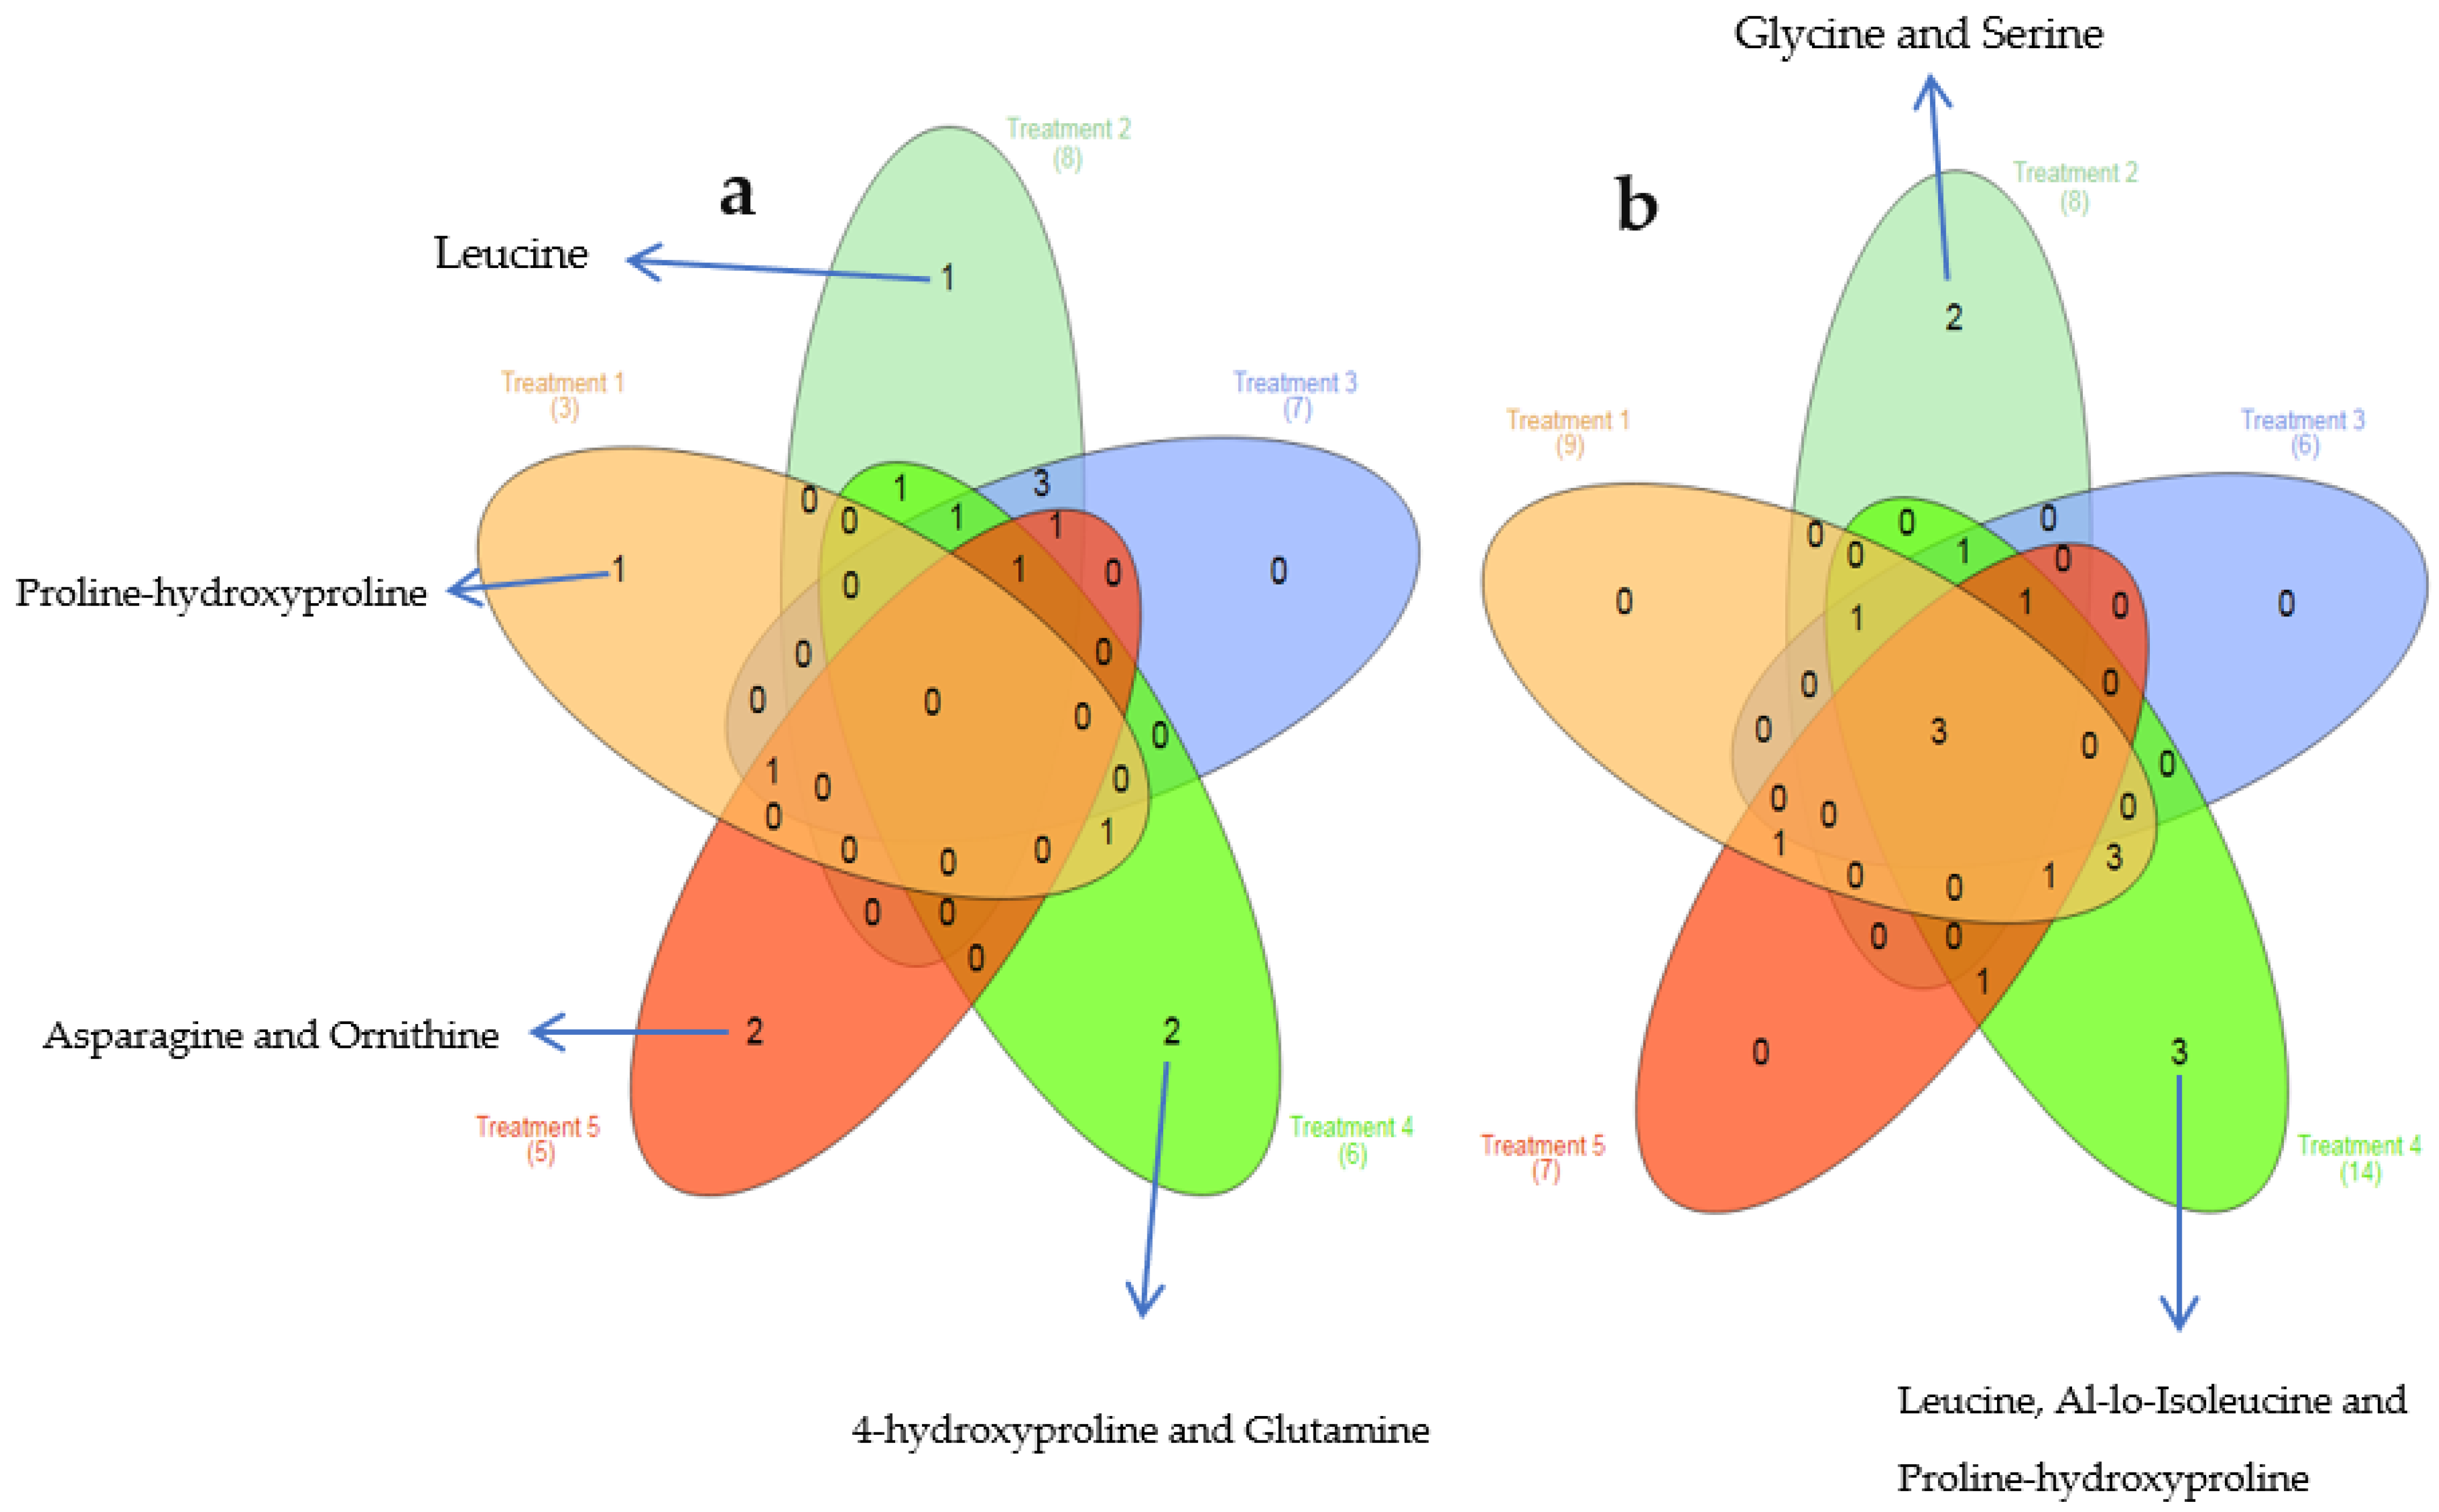
Clustering Analysis
4. Discussion
5. Conclusions
Author Contributions
Funding
Institutional Review Board Statement
Data Availability Statement
Conflicts of Interest
References
- Thompson, K.M.; Jefferson, K.K. Adaption ot Stress: Biofilms and Small-Colony Variants. In Staphylococci in Human Diseases, 2nd ed.; John Wiley & Sons: Hoboken, NJ, USA, 2009; pp. 109–110. [Google Scholar]
- Onyango, L.A.; Alreshidi, M.M. Adaptive Metabolism in Staphylococci: Survival and Persistence in Environmental and Clinical Settings. J. Pathog. 2018, 2018, 1092632. [Google Scholar] [CrossRef] [PubMed] [Green Version]
- Murphy, G.R.; Dunstan, R.H.; Macdonald, M.M.; Gottfries, J.; Roberts, T.K. Alterations in amino acid metabolism during growth by Staphylococcus aureus following exposure to H2O2—A multifactorial approach. Heliyon 2018, 4, e00620. [Google Scholar] [CrossRef] [PubMed] [Green Version]
- Alreshidi, M.M.; Dunstan, R.H.; Macdonald, M.M.; Smith, N.D.; Gottfries, J.; Roberts, T.K. Amino acids and proteomic acclimation of Staphylococcus aureus when incubated in a defined minimal medium supplemented with 5% sodium chloride. MicrobiologyOpen 2019, 8, e00772. [Google Scholar] [CrossRef] [PubMed] [Green Version]
- Goerke, C.; Wolz, C. Adaptation of Staphylococcus aureus to the cystic fibrosis lung. Int. J. Med. Microbiol. 2010, 300, 520–525. [Google Scholar] [CrossRef] [PubMed]
- Gottlieb, C.T.; Thomsen, L.E.; Ingmer, H.; Mygind, P.H.; Kristensen, H.-H.; Gram, L. Antimicrobial peptides effectively kill a broad spectrum of Listeria monocytogenes and Staphylococcus aureus strains independently of origin, sub-type, or virulence factor expression. BMC Microbiol. 2008, 8, 205. [Google Scholar] [CrossRef] [PubMed] [Green Version]
- Klingenberg, C.; Aarag, E.; Rønnestad, A.; Sollid, J.E.; Abrahamsen, T.G.; Kjeldsen, G.; Flaegstad, T. Coagulase-negative Staphylococcal sepsis in neonates. Association between antibiotic resistance, biofilm formation and the host inflammatory response. Pediatr. Infect. Dis. J. 2005, 24, 817–822. [Google Scholar] [CrossRef]
- Alreshidi, M.M. Metabolic Profiles of Clinical Strain of Staphylococcus aureus to Subtle Changes in the Environmental Parameters at Different Phases of Growth. J. Pure Appl. Microbiol. 2020, 14, 415–422. [Google Scholar] [CrossRef] [Green Version]
- Alreshidi, M.M. Selected Metabolites Profiling of Staphylococcus aureus Following Exposure to Low Temperature and Elevated Sodium Chloride. Front. Microbiol. 2020, 11, 834. [Google Scholar] [CrossRef]
- Gefen, O.; Fridman, O.; Ronin, I.; Balaban, N.Q. Direct observation of single stationary-phase bacteria reveals a surprisingly long period of constant protein production activity. Proc. Natl. Acad. Sci. USA 2013, 111, 556–561. [Google Scholar] [CrossRef] [Green Version]
- Jaishankar, J.; Srivastava, P. Molecular Basis of Stationary Phase Survival and Applications. Front. Microbiol. 2017, 8, 2000. [Google Scholar] [CrossRef] [Green Version]
- Link, H.; Fuhrer, T.; Gerosa, L.; Zamboni, N.; Sauer, U. Real-time metabolome profiling of the metabolic switch between starvation and growth. Nat. Methods 2015, 12, 1091–1097. [Google Scholar] [CrossRef]
- Liebeke, M.; Dörries, K.; Zühlke, D.; Bernhardt, J.; Fuchs, S.; Pané-Farré, J.; Engelmann, S.; Völker, U.; Bode, R.; Dandekar, T.; et al. A metabolomics and proteomics study of the adaptation of Staphylococcus aureus to glucose starvation. Mol. BioSyst. 2011, 7, 1241–1253. [Google Scholar] [CrossRef] [PubMed]
- Schneider, L.A.; Korber, A.; Grabbe, S.; Dissemond, J. Influence of pH on wound-healing: A new perspective for wound-therapy? Arch. Dermatol. Res. 2007, 298, 413–420. [Google Scholar] [CrossRef] [PubMed]
- Kaufman, T.; Eichenlaub, E.; Angel, M.; Levin, M.; Futrell, J. Topical acidification promotes healing of experimental deep partial thickness skin burns: A randomized double-blind preliminary study. Burns 1985, 12, 84–90. [Google Scholar] [CrossRef]
- Lenhardt, R.; Sessler, D.I. Estimation of mean body temperature from mean skin and core temperature. Anesthesiology 2006, 105, 1117–1121. [Google Scholar] [CrossRef] [Green Version]
- Celeste, C.J.; Deschesne, K.; Riley, C.B.; Theoret, C.L. Skin Temperature during Cutaneous Wound Healing in an Equine Model of Cutaneous Fibroproliferative Disorder: Kinetics and Anatomic-Site Differences. Vet. Surg. 2012, 42, 147–153. [Google Scholar] [CrossRef]
- Abele-Horn, M.; Schupfner, B.; Emmerling, P.; Waldner, H.; Göring, H. Persistent wound infection after herniotomy associated with small-colony variants of Staphylococcus aureus. Infection 2000, 28, 53–54. [Google Scholar] [CrossRef]
- Shinyee, W.; Rishya, M.; Sekaran, M. Analysis of bacterial diversity in healing and non-healing wounds among Malaysian subjects by phenotypic identification and 16S rDNA sequencing. Biomed. Res. 2013, 24, 389–395. [Google Scholar]
- Alreshidi, M.M.; Dunstan, R.H.; Macdonald, M.M.; Singh, V.K.; Roberts, T.K. Analysis of Cytoplasmic and Secreted Proteins of Staphylococcus aureus Revealed Adaptive Metabolic Homeostasis in Response to Changes in the Environmental Conditions Representative of the Human Wound Site. Microorganisms 2020, 8, 1082. [Google Scholar] [CrossRef]
- Alreshidi, M.; Dunstan, R.H.; Gottfries, J.; Macdonald, M.M.; Crompton, M.J.; Ang, C.-S.; Williamson, N.; Roberts, T.K. Changes in the Cytoplasmic Composition of Amino Acids and Proteins Observed in Staphylococcus aureus during Growth under Variable Growth Conditions Representative of the Human Wound Site. PLoS ONE 2016, 11, e0159662. [Google Scholar] [CrossRef] [Green Version]
- Alreshidi, M.M.; Dunstan, R.H.; Macdonald, M.M.; Smith, N.D.; Gottfries, J.; Roberts, T.K. Metabolomic and proteomic responses of Staphylococcus aureus to prolonged cold stress. J. Proteom. 2015, 121, 44–55. [Google Scholar] [CrossRef] [PubMed]
- Alreshidi, M.M.; Dunstan, R.H.; Macdonald, M.M.; Gottfries, J.; Roberts, T.K. The Uptake and Release of Amino Acids by Staphylococcus aureus at Mid-Exponential and Stationary Phases and Their Corresponding Responses to Changes in Temperature, pH and Osmolality. Front. Microbiol. 2020, 10, 3059. [Google Scholar] [CrossRef] [PubMed] [Green Version]
- Brown, G.K.; Martin, A.R.; Roberts, T.K.; Aitken, R.J. Detection of Ehrlichia platys in dogs in Australia. Aust. Vet. J. 2001, 79, 554–558. [Google Scholar] [CrossRef]
- Maharjan, R.P.; Ferenci, T. Global metabolite analysis: The influence of extraction methodology on metabolome profiles of Escherichia coli. Anal. Biochem. 2003, 313, 145–154. [Google Scholar] [CrossRef]
- Heberle, H.; Meirelles, G.V.; Da Silva, F.R.; Telles, G.P.; Minghim, R. InteractiVenn: A Web-Based Tool for the Analysis of Sets through Venn Diagrams. BMC Bioinform. 2015, 16, 169. [Google Scholar] [CrossRef] [PubMed]
- Zeden, M.S.; Burke, Ó.; Vallely, M.; Fingleton, C.; O’Gara, J.P. Exploring amino acid and peptide transporters as therapeutic targets to attenuate virulence and antibiotic resistance in Staphylococcus aureus. PLoS Pathog. 2021, 17, e1009093. [Google Scholar] [CrossRef]
- Onyango, L.A.; Dunstan, R.H.; Gottfries, J.; von Eiff, C.; Roberts, T.K. Effect of Low Temperature on Growth and Ultra-Structure of Staphylococcus spp. PLoS ONE 2012, 7, e29031. [Google Scholar] [CrossRef] [Green Version]
- Onyango, L.A.; Dunstan, R.H.; Roberts, T.K.; Macdonald, M.M.; Gottfries, J. Phenotypic Variants of Staphylococci and Their Underlying Population Distributions Following Exposure to Stress. PLoS ONE 2013, 8, e77614. [Google Scholar] [CrossRef] [Green Version]
- Wehrli, P.M.; Lindberg, E.; Svensson, O.; Sparén, A.; Josefson, M.; Dunstan, R.H.; Wold, A.E.; Gottfries, J. Exploring bacterial phenotypic diversity using factorial design and FTIR multivariate fingerprinting. J. Chemom. 2014, 28, S681–S686. [Google Scholar] [CrossRef]
- Crompton, M.J.; Dunstan, R.H.; Macdonald, M.M.; Gottfries, J.; von Eiff, C.; Roberts, T.K. Small Changes in Environmental Parameters Lead to Alterations in Antibiotic Resistance, Cell Morphology and Membrane Fatty Acid Composition in Staphylococcus lugdunensis. PLoS ONE 2014, 9, e92296. [Google Scholar] [CrossRef] [Green Version]
- Clements, M.O.; Watson, S.P.; Foster, S.J. Characterization of the major superoxide dismutase of Staphylococcus aureus and its role in starvation survival, stress resistance, and pathogenicity. J. Bacteriol. 1999, 181, 3898–3903. [Google Scholar] [CrossRef] [PubMed] [Green Version]
- Watson, S.P.; Clements, M.O.; Foster, S.J. Characterization of the starvation-survival response of Staphylococcus aureus. J. Bacteriol. 1998, 180, 1750–1758. [Google Scholar] [CrossRef] [PubMed] [Green Version]


| Amino Acid Names | Amino Acids | Control (pH 7, 37 °C, 0% NaCl) | Treatment 1 (2.5% NaCl, pH 7, 37 °C) | Treatment 2 (pH 6, 35 °C) | Treatment 3 (pH 8, 35 °C) | Treatment 4 (pH6, 5% NaCl, 35 °C) | Treatment 5 (pH 8, 5% NaCl, 35 °C) |
|---|---|---|---|---|---|---|---|
| Alanine | ALA | 3.38 ± 0.37 | 2.04 ± 0.15 | 7.96 ± 0.69 a | 5.45 ± 0.50 | 26.05 ± 4.35 a | 6.15 ± 0.40 |
| Glycine | GLY | 4.55 ±1.93 | 2.25 ± 1.64 | 1.44 ± 0.12 a | 3.74 ± 0.38 | 3.44 ± 0.96 | 2.23 ±0.71 |
| α-Aminobutyric acid | ABA | 0.20 ± 0.15 | 0.41 ± 0.42 | 0.37 ± 0.04 | 0.53 ± 0.08 | 0.14 ± 0.20 | 0.40 ± 0.04 |
| Valine | VAL | 6.46 ± 3.01 | 2.87 ± 0.28 a | 9.47 ± 0.46 a | 10.59 ± 0.50 a | 2.50 ± 0.54 a | 4.04 ± 0.44 |
| ß-Aminoisobutyric acid | BAIB | 1.62 ± 0.20 | 1.61 ± 0.25 | 0.84 ± 0.03 a | 0.72 ± 0.03 a | 0.00 ± 0.00 a | 0.74 ± 0.19 a |
| Leucine | LEU | 2.23 ± 1.19 | 1.24 ± 0.43 | 3.77 ± 0.41 a | 2.84 ± 0.25 | 0.42 ± 0.23 a | 2.52 ± 0.36 |
| Allo-Isoleucine | AILE | 0.25 ± 0.18 | 0.32 ± 0.05 | 0.58 ± 0.05 a | 0.94 ± 0.11 a | 0.00 ± 0.00 a | 0.47 ± 0.11 a |
| Isoleucine | ILE | 1.76 ± 1.03 | 0.68 ± 0.11 a | 3.41 ± 0.24 a | 3.08 ± 0.20 a | 0.63 ± 0.15 a | 0.76 ± 0.12 a |
| Serine | SER | 1.23 ± 0.30 | 3.02 ± 1.32 a | 0.64 ± 0.46 a | 0.86 ± 0.06 | 9.32 ± 3.28 a | 2.12 ± 0.20 |
| Proline | PRO | 10.83 ± 6.77 | 3.08 ± 0.55 a | 32.01 ± 2.99 a | 30.14 ± 2.30 a | 79.79 ± 17.70 a | 4.98 ± 1.01 a |
| Asparagine | ASN | 4.84 ± 0.97 | 4.59 ± 0.42 | 5.40 ± 0.13 | 4.87 ± 0.21 | 4.53 ± 1.64 | 7.72 ± 0.90 a |
| Aspartic acid | ASP | 180.4 ± 32.5 | 156.63 ± 29.33 | 124.78 ± 10.18 a | 102.24 ± 9.08 a | 55.51 ± 11.06 a | 158.01 ± 16.14 |
| Methionine | MET | 6.14 ± 1.83 | 2.31 ± 0.84 a | 10.36 ± 0.86 a | 9.38 ± 1.08 a | 2.63 ± 0.55 a | 2.43 ± 1.74 a |
| 4-Hydroxyproline | HYP | 0.47 ± 0.28 | 0.62 ± 0.98 | 0.00 ± 0.00 | 0.49 ± 0.04 | 3.12 ± 0.72 a | 1.07 ± 0.05 |
| Glutamic acid | GLU | 51.94 ±13.87 | 55.82 ± 9.98 | 110.07 ± 2.72 a | 116.94 ± 4.25 a | 95.62 ± 16.66 a | 152.76 ± 40.73 a |
| Phenylalanine | PHE | 3.26 ± 1.20 | 2.10 ± 0.14 | 3.01 ± 0.15 | 2.66 ± 0.17 | 0.99 ± 0.26 a | 1.51 ± 1.07 a |
| α-Aminoadipic acid | AAA | 3.31 ± 1.73 | 1.09 ± 0.43 a | 0.93 ± 0.05 a | 1.57 ± 0.08 a | 0.15 ± 0.21 a | 0.46 ± 0.07 a |
| Glutamine | GLN | 2.11 ± 2.73 | 0.67 ± 0.35 | 2.72 ± 2.30 | 3.28 ± 3.62 | 13.25 ± 3.39 a | 3.96 ± 1.55 |
| Ornithine | ORN | 5.53 ± 1.14 | 5.73 ± 0.58 | 5.47± 0.39 | 4.12 ± 0.13 | 6.58 ± 1.06 | 13.21 ± 0.91 a |
| Lysine | LYS | 67.22 ± 13.05 | 36.24 ± 17.54 a | 34.22 ± 1.69 a | 43.96 ± 1.62 a | 36.67 ± 5.32 a | 47.38 ± 1.87 a |
| Histidine | HIS | 37.54 ± 10.13 | 10.82 ± 10.34 a | 23.19 ± 0.93 a | 26.18 ± 1.75 a | 1.48 ± 0.40 a | 1.53 ± 0.39 a |
| Tyrosine | TYR | 5.47 ± 0.71 | 3.55 ± 1.58 a | 4.00 ± 0.13 | 4.28 ± 0.25 | 0.93 ± 0.36 a | 4.35 ± 0.13 |
| Proline-hydroxyproline (dipeptide) | PHP | 1.85 ± 0.40 | 3.14 ± 1.12 a | 0.66 ± 0.15 | 0.89 ± 0.25 | 0.00 ± 0.00 a | 2.59 ± 0.77 |
| Tryptophan | TRP | 0.99 ± 0.30 | 0.65 ± 0.07 a | 0.26 ± 0.07 a | 0.45 ± 0.05 a | 0.07 ± 0.10 a | 0.77 ± 0.09 |
| Cystathionine | CTH | 0.00 ± 0.00 | 0.21 ± 0.01 a | 0.08 ±0.11 | 0.17 ± 0.12 a | 0.00 ± 0.00 | 0.25 ± 0.07 a |
| Cystine | C-C | 0.42 ± 0.20 | 0.34 ± 0.10 | 0.10 ± 0.15 a | 0.37 ± 0.01 | 0.00 ± 0.00 a | 0.21 ± 0.01 |
| Total Amino acids | Total AA | 407.01 ± 47.9 | 301.67 ± 79.03 a | 385.64 ± 25.48 | 380.36 ± 27.09 | 343.81 ± 60.20 | 422.63 ± 28.26 |
Publisher’s Note: MDPI stays neutral with regard to jurisdictional claims in published maps and institutional affiliations. |
© 2022 by the authors. Licensee MDPI, Basel, Switzerland. This article is an open access article distributed under the terms and conditions of the Creative Commons Attribution (CC BY) license (https://creativecommons.org/licenses/by/4.0/).
Share and Cite
Alreshidi, M.; Dunstan, H.; Roberts, T.; Bardakci, F.; Badraoui, R.; Adnan, M.; Saeed, M.; Alreshidi, F.; Albulaihed, Y.; Snoussi, M. Changes in Amino Acid Metabolism of Staphylococcus aureus following Growth to the Stationary Phase under Adjusted Growth Conditions. Microorganisms 2022, 10, 1503. https://doi.org/10.3390/microorganisms10081503
Alreshidi M, Dunstan H, Roberts T, Bardakci F, Badraoui R, Adnan M, Saeed M, Alreshidi F, Albulaihed Y, Snoussi M. Changes in Amino Acid Metabolism of Staphylococcus aureus following Growth to the Stationary Phase under Adjusted Growth Conditions. Microorganisms. 2022; 10(8):1503. https://doi.org/10.3390/microorganisms10081503
Chicago/Turabian StyleAlreshidi, Mousa, Hugh Dunstan, Tim Roberts, Fevzi Bardakci, Riadh Badraoui, Mohd Adnan, Mohd Saeed, Fayez Alreshidi, Yazeed Albulaihed, and Mejdi Snoussi. 2022. "Changes in Amino Acid Metabolism of Staphylococcus aureus following Growth to the Stationary Phase under Adjusted Growth Conditions" Microorganisms 10, no. 8: 1503. https://doi.org/10.3390/microorganisms10081503