Review

Loss Determination Techniques for Piezoelectrics: A Review

International Center for Actuators and Transducers (ICAT), The Pennsylvania State University, University Park, PA 16802, USA
*
Author to whom correspondence should be addressed.
Actuators 2023, 12(5), 213; https://doi.org/10.3390/act12050213
Submission received: 4 April 2023 / Revised: 15 May 2023 / Accepted: 17 May 2023 / Published: 21 May 2023

Abstract

:
Nowadays, heat dissipation in electronic devices is one of the serious issues to be resolved in energy and environmental terms. Piezoelectric materials are being utilized in many electronic devices, yet the roadblock toward further miniaturization of piezoelectric devices was identified as heat dissipation. Three types of losses (dielectric, elastic, and piezoelectric) are known to be related to the heat dissipation mechanism of piezoelectric materials, therefore obtaining accurate values of the loss factors is essential for minimizing the heat dissipation of piezoelectric devices. The purpose of this review is to introduce several loss determination techniques for piezoelectric materials. The review starts with brief discussions of the loss factors and of the importance of piezoelectric loss that is related to the antiresonance frequency. Then, the review covers the methods developed by our research group, including High Power Piezoelectric Characterization Systems (HiPoCSTM), the crystallographic orientation method and the partial electrode method, as well as other methods such as the pulse-echo method and computer-based approaches. The review continues with a discussion of piezoelectric device modeling (analytical solution and equivalent circuits) that considers loss factors. Finally, the review provides concluding remarks for addressing current issues and suggesting possible solutions.

1. Introduction

As electronic devices become increasingly ubiquitous in modern society, concerns over their energy consumption and impact on the environment have significantly grown. One way to deal with this issue is to increase the energy efficiency of such devices by minimizing heat dissipation, which is related to power losses during device operation. The heat dissipation also increases the temperature of the electronic devices, resulting in a degradation of the device performance when the material properties for specific applications have negative impacts under temperature rise. Therefore, in order to reduce the amount of heat dissipated, researchers and engineers are making enormous efforts to design novel device structures or to modify and develop new materials to be used for the devices.
Many electronic devices consist of piezoelectric sub-devices or compartments, such as ultrasonic motors that are used for cameras in smartphones, piezoelectric voltage transformers, and various types of actuators and sensors in automobile industry. Piezoelectricity refers to a linear conversion between electrical and mechanical energy, and mainly consists of two types of effects: direct and converse. Direct refers to the ability of piezoelectric materials to generate electrical charges under mechanical stress, while converse effect is the ability to deform mechanically under an applied electric field. Piezoelectric compartments are known to be superior to conventional electromagnetic compartments, because they can provide a higher volume power density (power per unit volume) on a micro scale (less than 1 cm3) [1]. However, the bottleneck of piezoelectric devices is known to be heat dissipation, which hinders further miniaturization of piezoelectric compartments due to energy loss. Therefore, to make further progress in achieving high power density, it is crucial to reduce the heat dissipation of piezoelectric materials and understand the heat generation mechanism.
The heat dissipation of piezoelectric materials is known to be closely related to the “loss factors” of piezoelectric materials, which are usually represented as imaginary parts of complex coefficients of piezoelectric-related parameters and can be written as [2,3,4]:
ε X * = ε X ( 1 j tan δ )
s E * = s E ( 1 j tan ϕ )
d * = d ( 1 j tan θ )
κ x * = κ x ( 1 + j tan δ )
c D * = c D ( 1 + j tan ϕ )
h * = h ( 1 + j tan θ )
where ε X is relative dielectric permittivity under constant stress ( X ) condition, s E is elastic compliance under a constant electric field ( E ) condition, d is piezoelectric constant, κ x is relative inverse dielectric permittivity in constant strain ( x ) condition, c D is elastic stiffness under constant dielectric displacement ( D ) condition, and h is inverse piezoelectric constant. Here, superscript star ( * ) means complex notation and j is imaginary notation. The complex coefficients are divided into physical parameters (real part) and losses (imaginary parts), respectively. By the constitutive relationship of piezoelectric parameters, each type of the complex form of materials constants is classified into two, depending on the boundary conditions based on intensive and extensive quantities [5,6]. According to The International Union of Pure and Applied Chemistry (IUPAC) [7], intensive quantities are those that are independent of the size of the system (such as X and E), whereas extensive quantities are those that are dependent of the size (such as x and D). When the complex materials constants have a “constant intensive quantity” condition, they are called “intensive-type” (I-type), whereas they are called “extensive-type”(E-type) when they have a “constant extensive quantity” condition [8]. Such a distinction is essential for defining the energy conversion of piezoelectricity. For instance, the ratio of two types of elastic compliance determines the electromechanical coupling factor ( s D / s E = 1 k 2 ). The notation is different from what our group has called the materials constants [1,9,10,11,12,13] (i.e., extensive and intensive parameters, intensive and extensive loss factors) since it can be misleading in that the words “extensive parameters” or “extensive loss” may be interpreted as these constants being volume-dependent which they are not. Similarly, the loss factors are divided into I-type and E-type. The I-type losses (primed), in general, have negative signs in the notation, so that they may have the positive sign when they are experimentally determined. However, the sign of E-type (non-primed) losses may also maintain a positive sign, considering the normal response of the extensive quantities (polarization, strain) to the intensive quantities (electric field, stress). For instance, a negative E-type piezoelectric loss was previously reported by our group [14].
The determination of loss factors is essential, in a way that I-type loss factors can be used as input parameters for computer simulations, such as in the finite element method (FEM) [15,16] which can efficiently test the performance of piezoelectric devices, whereas E-type loss factors are known to be related to the heat generation mechanism of piezoelectric materials [12,13]. Therefore, in order to further miniaturize piezoelectric devices while maintaining power density, it is essential to obtain accurate values of the loss factors. In particular, recent discoveries by our group show that piezoelectric losses are key factors for reducing heat generation in lead zirconate titanate(PZT)-based piezoelectric resonators with antiresonance operation [3].
The purpose of this paper is to review the determination methodologies of the loss factors of piezoelectric materials. Firstly, it describes the historical background of the measurement methods for the determination of piezoelectric-related coefficients, and then explains the role of piezoelectric loss factors in diminishing the heat generation of piezoelectric resonators. Secondly, it reviews several experimental methods to determine piezoelectric coefficients, along with our group’s contributions to the field of loss factor determination. Finally, it provides concluding remarks regarding the current issues to be resolved and provides suggestions for future works.

2. Brief History of Development of Piezoelectric Measurement

Ever since the Curie brothers, Jacques and Pierre, formulated the direct piezoelectric effect in 1880 [17], numerous attempts to measure piezoelectric-related (dielectric, elastic, and piezoelectric) parameters have been suggested. Very early attempts were made by several researchers including Mason, Jaffe, Cady, and Berlincourt, such as static and dynamic measurement of piezoelectric crystals and ceramics, including Rochelle salts piezoelectric resonators [18,19], barium titanate (BaTiO3) single crystals [20], and polycrystalline PZT [21]. Additionally, several researchers including Van Dyke [22,23], Baerwald [24,25], Martin [26], and Marx [27] had made significant contributions to piezoelectric measurements in the early stages. In parallel, the standardized measurement method had been provided [28] and was constantly updated by the members of The Institute of Radio Engineers (IRE), which later became the Institute of Electrical and Electronics Engineers (IEEE) in 1963 [29]. The first standards were established by the IRE as “Standards on Piezoelectric Crystals” in 1949, and they covered crystallographic symmetry and how to deal with the anisotropic coefficients of piezoelectric single crystals [28], augmentations and revisions including the definitions and measurement method of piezoelectric vibrators, the determination of elastic, piezoelectric, and dielectric constants, electromechanical coupling factors [30], and measurements of piezoelectric ceramics [31]. The standard for the equations and analysis of piezoelectric vibrations [32] were made until the latest version of the “IEEE Standard on Piezoelectricity” was published in 1988 [33]. In parallel, several other organizations (in Europe [34,35,36] and Japan [37]) produced standards on piezoelectricity.
Researchers started paying attention to the determination of complex coefficients of piezoelectric materials, since the imaginary parameters (loss factors) are closely related to the mechanical quality factor ( Q m ) and the domain wall dynamics that are governing factors for the performance of piezoelectric resonators and devices [38,39]. While the standards provided by the IEEE have not paid attention to loss factors so significantly, many researchers have suggested determination methods for the loss factors of piezoelectric materials. Holland et al. suggested the determination of imaginary parameters (phase information) with the gain-bandwidth method by utilizing admittance and impedance loci based on Mittag-Leffler’s theorem [40]. The study noted the independence of piezoelectric loss factors, meaning that piezoelectric losses are independent of dielectric and elastic coefficients at least to the first order approximation; in the following year, Holland demonstrated the measurement of piezoelectric loss in niobium (Nb)-doped PZT ceramics using admittance measurement and mathematical approximation [41]. In later years, Smit proposed an iterative method to determine the real and imaginary parameters of the transverse vibrational mode piezoelectric ceramic plate [42]. The study pointed out that the new method proposed has a great accuracy for the determination of complex parameters, regardless of the high and low Q m piezoelectric resonators, whereas both the IRE standard, and the method proposed by Holland et al. [40], were not accurate. Using the same method, Smit determined the complex elastic, dielectric, and piezoelectric constants of ferroelectric PLZT (Lanthanum doped PZT) [43]. In the following years, several methods to determine complex dielectric, elastic, and piezoelectric coefficients with more accuracy were proposed. For instance, Sherrit et al. reported complex coefficients of piezoelectric resonators, including a non-iterative method to determine the complex coefficients of the thickness of the vibrational mode piezoelectric resonator [44] and radial mode resonator [45]. The accuracy of the method was found to be comparable with Smits’ [42] iterative method. Furthermore, Du et al. proposed a method that utilizes the admittance of piezoelectric vibrators normalized with respect to the angular frequency (ω) and showed that the method is applicable regardless of whether the sample has a high or low Q m by measuring and analyzing k 31 vibration mode specimens composed of hard (PZT8) and soft PZTs (PZT5H) [46]. Other developed methods to obtain the complex coefficients of piezoelectric materials were proposed: for example, the method suggested by Xu et al. [47], which was similar to that proposed by Smits and Ohigashi [48], that considered elastic and dielectric as complex but piezoelectric as real, and the nonlinear regression method proposed by Kwok et al. [49]. A software named Piezoelectric Resonance Analysis Program (PRAP) was even invented by TASI Technical Software (Kingston, ON, Canada) [50].

3. Role of Piezoelectric Loss Factors in Admittance Spectra

The latest standard on piezoelectricity by the IEEE was developed in 1988 [33]. Though it had been developed and revised by many experts on piezoelectric resonators, the standard has serious issues. Figure 1a shows the equivalent circuit (EC) model of piezoelectric resonator proposed by the IEEE Standard. The static dielectric properties are described by damped capacitance (C0), whereas resonance behaviors are described by the motional branch that includes motional capacitance (C1), inductance (L1), and resistance (R1). One issue arises from the fact that the Q m of both resonance and antiresonance described by the EC are identical and determined by Q m = (L1/C1)1/2/R1; in fact, several studies showed that the Q m at resonance frequency ( Q A ) is smaller than that at antiresonance frequency ( Q B ) in lead-containing piezoelectric ceramics. For example, Uchino and Hirose [51] found that Q B is larger than Q A in PZT ceramics regardless of vibration velocity, as shown in Figure 1b. They linked their experimental results to the heat generation mechanism and proposed an antiresonance drive of piezoelectric resonators, since it provides a similar vibration level with less heat generation (less energy loss). Furthermore, Mezheritsky measured various piezoelectric resonators using a “weak resonance” method and showed the inequality in the relationship between Q A and Q B that is due to the imaginary piezoelectric coefficients [52]. In a separate paper, he also investigated the effect of three types of losses on resonance frequency displacement and recognized that these three contribute to the total power of the devices differently [53] and mentioned that piezoelectric loss contributes to less energy loss for the operation of a piezoelectric transformer.
Motivated by the discovery of discrepancies between Q A and Q B , our research group focused on the derivation of admittance equations for various vibration modes. Zhuang derived the analytical expressions of Q A and Q B for various piezoelectric resonators including k 31 (transverse), k 33 (longitudinal), k p (radial), k t (thickness), and k 15 (shear) mode vibrators [4,54,55]. To simply show the discrepancies between Q A and Q B , the equation for Q A and Q B of k 31 mode is shown here [56]:
1 Q B = 1 Q A 1 1 + 1 k 31 k 31 2 Ω B 2 2 tan θ 31 tan δ 33 tan ϕ 11
where k 31 is electromechanical coupling factor, Ω B is normalized antiresonance angular frequency, tan θ 31 is I-type piezoelectric loss, tan δ 33 is I-type dielectric loss, and tan ϕ 11 is I-type elastic loss (for more detail, refer to Zhuang’s papers on the derivation of loss factors [4,54,55,56,57]). The term 2 tan θ 31 tan δ 33 tan ϕ 11 on the right-hand side is defined as the electromechanical coupling loss, which is an imaginary term for k 31 2 . From the equation above and the experimental results from Figure 1b, it can be deduced that piezoelectric loss in PZT ceramic is considerably larger compared to dielectric and elastic loss factors ( 2 tan θ 31 > tan δ 33 + tan ϕ 11 , meaning that the electromechanical coupling loss has a positive sign). Though several researchers do not consider there are strong discrepancies between Q A and Q B and use a single notation for mechanical quality factor notation ( Q M ) instead of distinguishing them [58,59,60,61,62], or do not believe there is such a “piezoelectric loss” [63], the predominant effect of Q B and less temperature rise in PZT ceramics at antiresonance operation is well explained by piezoelectric loss.

4. Loss Measurement Techniques

4.1. High Power Characterization of Piezoelectric Materials

Piezoelectric materials are widely utilized in high-power applications, in which they are driven near resonance or antiresonance frequencies with strong electric fields. Therefore, the evaluation of the properties of materials in these conditions is essential and directly related to the performance of high-power piezoelectric devices. Our group mainly focused on modifying and developing two types of piezoelectric measurements under high-power conditions: the admittance/impedance spectrum method and burst/transient method. The admittance/impedance spectrum method is a well-known method, in which Q A and Q B are determined through resonance and antiresonance peaks and the half-power bandwidth from experimental admittance/impedance spectra with a 3 dB method or admittance/impedance loci [13], whereas the burst/transient method utilizes the transient response of the piezoelectric sample under resonance/antiresonance drive for a short period of time. In the following subsubsections, these two types of high-power measurement methods, mainly proposed by our research group, will be discussed. The readers may refer to the review [64] for more information regarding the method described in the next subsubsections.

4.1.1. Admittance/Impedance Measurement Method

The constant voltage method is a conventional and well-known method to measure the admittance/impedance curves of piezoelectric specimens. However, it typically employs a distortion of the resonance spectrum, often exhibiting large hysteresis or a jump of the peak depending on the rising or falling frequency driving, as shown in Figure 2a. Therefore, in order to avoid the issues caused by the constant voltage method, the constant current method was devised by our group (the issue can also be resolved by a recently developed method, which utilizes a phase-controlled force excitation driving method [65]). Another reason for utilizing the constant current method is that the vibration velocity in the vicinity of the resonance frequency is proportional to the current, not the voltage, so that the specimens can be driven under an almost constant vibration amplitude for precise measurements. As shown in Figure 2b, the admittance peaks show perfect symmetry, allowing for the precise determination of parameters. However, the constant current method cannot be adopted for antiresonance characterization since the admittance at antiresonance frequency is too low. Therefore, our research group previously suggested that resonance peaks can be measured with the constant current method, while the antiresonance peaks can be measured with the constant voltage method for the accurate determination of Q A and Q B .
Nevertheless, there exists a big ambiguity in simultaneously utilizing the constant voltage and current methods, in that the two different types of mechanical quality factors determined from two different measurement methods cannot be compared to each other, taking into account that these two methods give out different experimental errors. To simultaneously measure the resonance and antiresonance peaks precisely with one experimental setup, our group developed High-Power Piezoelectric Characterization Systems (HiPoCSTM) with the constant vibration velocity method [3], in addition to two aforementioned experimental setups (constant voltage and current), as shown in Figure 3. HiPoCSTM is a customized measurement system, analyzing voltage, current, vibration amplitudes, and phase by integrating several sensors with oscilloscopes. The key element of the system includes a function generator, an NF Corporation’s power amplifier (the amplifier model shown in Figure 3 has actually been discontinued) for high voltage application, resistors for voltage and current measurements, and a clamp-on AC sensor for current detection. In addition, the system is equipped with an infrared image sensor to monitor the temperature change (mainly due to heat generation under the high-power driving conditions) of the measured specimen. During the frequency sweeping process of the constant vibration velocity measurement, the current remains almost constant, and the voltage is minimized at the resonance frequency, while the voltage remains comparably constant, and the current is minimized at the antiresonance frequency. In addition, the constant input power method [66] was proposed and added to HiPoCSTM in order to calculate the mechanical quality factors in any frequency, not just near resonance or antiresonance frequencies.
All aforementioned methods in this subsubsection (constant voltage, current, and vibration velocity) only enable the determination of Q m at either resonance or antiresonance frequency, but the real electric power measurement method allows for the determination of Q m at any frequencies. The measurement procedure and theoretical models can be found in our group’s paper [66,67,68] as well as in Mezheritsky’s paper [53]. The Q m at any frequency is defined in terms of the dissipated real electric power ( P d ), root mean square (RMS), and vibration velocity ( V R M S ), and can be written as:
Q m = 2 π f ( 1 2 ) ρ V R M S 2 P d / L w b
where f is frequency, ρ is mass density, and L , w , and b are length, width, and thickness of the piezoelectric resonator, respectively. The interesting finding made by our research group through real electric power measurement was that Q m is maximized (and at the same time, the power dissipated becomes minimum) between the resonance and antiresonance frequency, as shown in Figure 4. This may indicate that the best efficiency for the transducer’s operation can be achieved when the frequency is in between resonance and antiresonance. An exploration of the mechanism of the loss behavior of this phenomenon may be the next step.

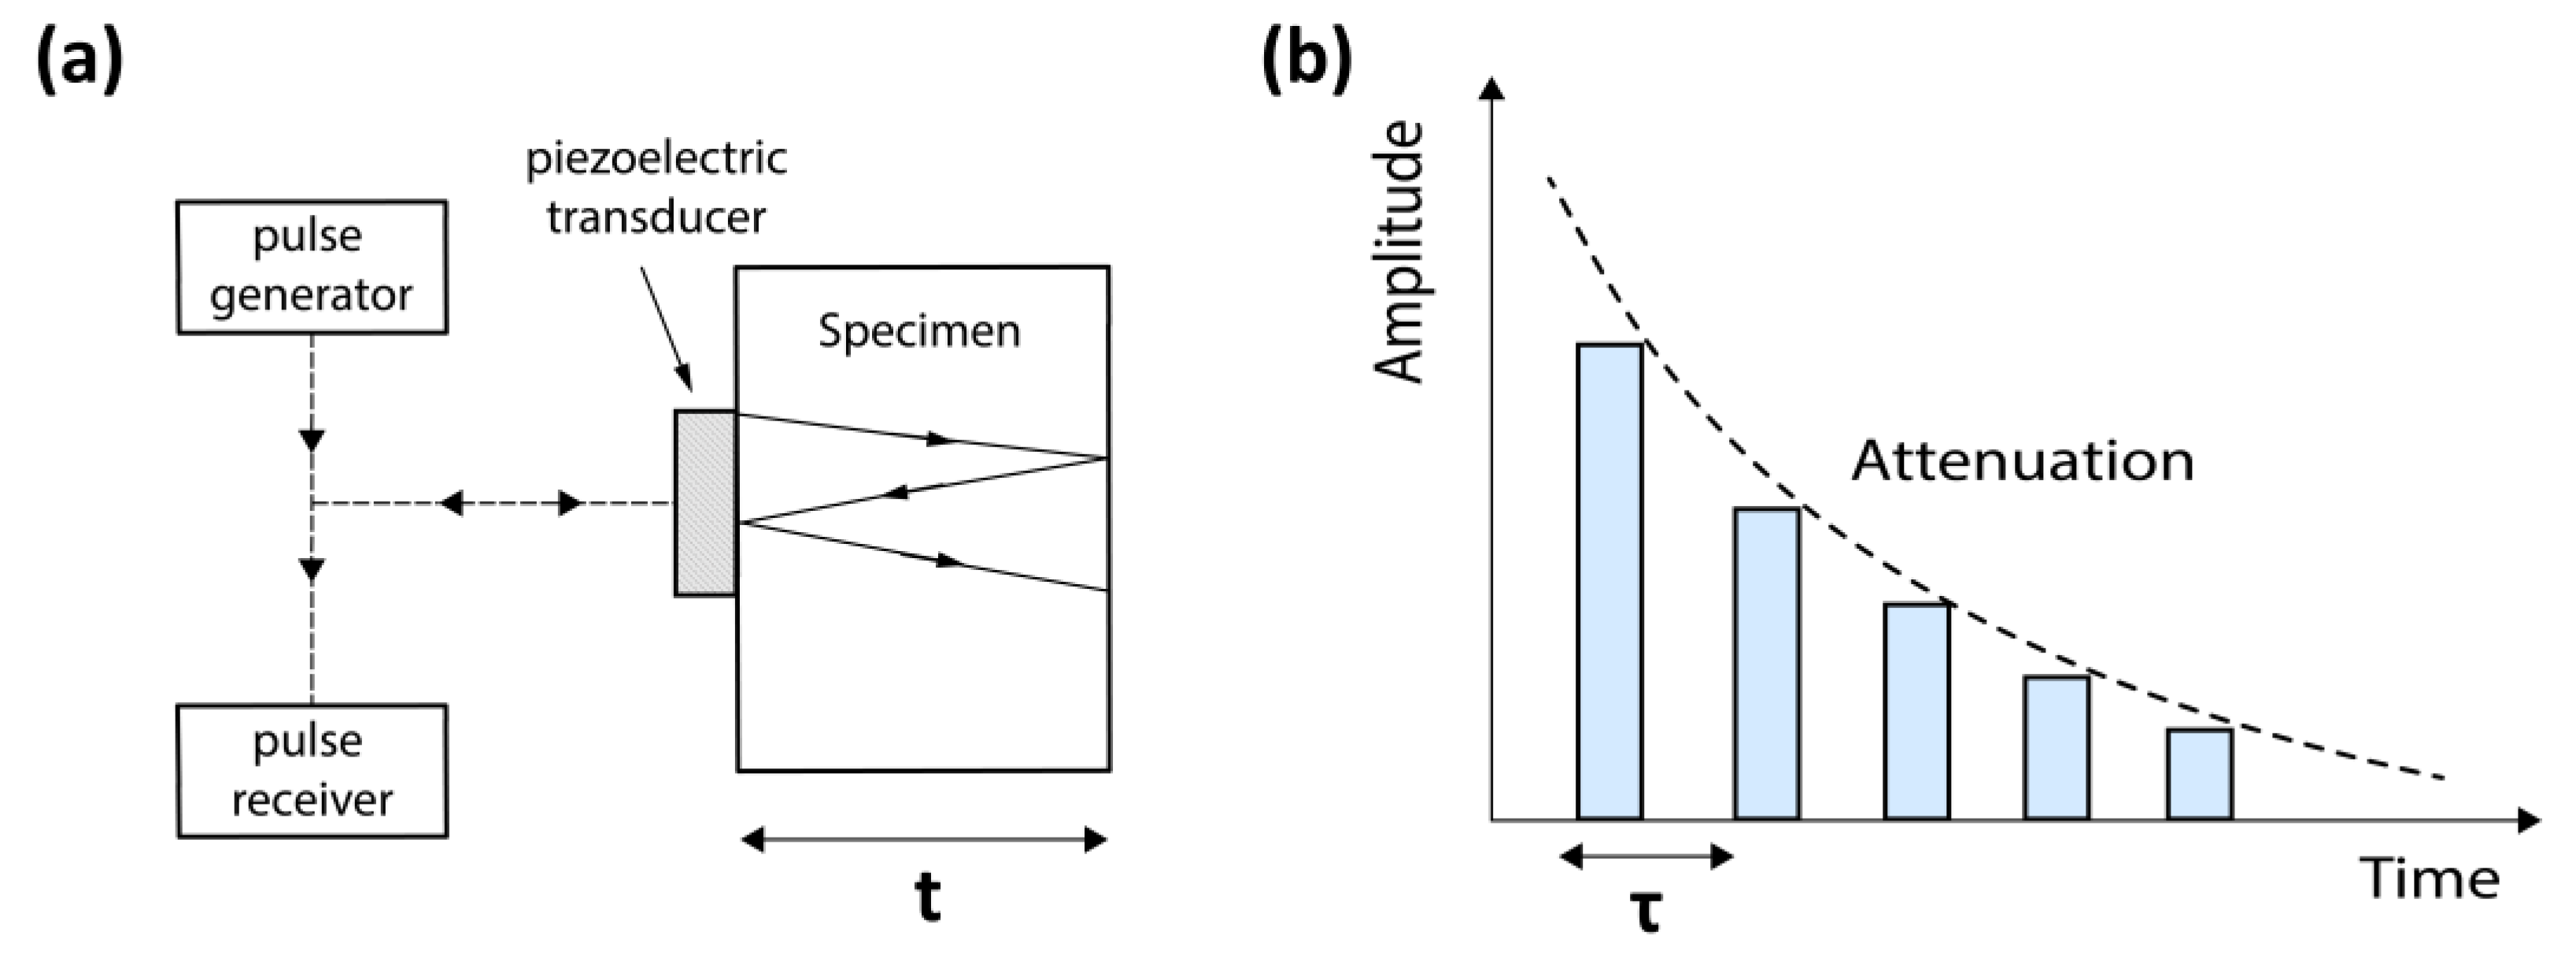
4.1.2. Burst/Transient Mode Method

Irrespective of the methods, including constant voltage, current, and vibration velocity, so long as the frequency at which the measurement is made is near the resonance or antiresonance frequency under high power, the specimen may undergo a serious heat generation issue. The pulse drive method, developed by Sugiyama and Uchino in the 1980s [69], could avoid the issue. By applying a step of an electric field (pulse) to a piezoelectric specimen, the transient characteristics, especially a displacement decay (i.e., ringing) of the desired vibration mode, can be measured. Since it operates the specimen for only a short period (~ms), the vibration does not generate measurable heat.
Umeda et al. [70] developed the burst/transient drive method to overcome one of the disadvantages of the pulse drive method; the pulse drive method has a limited displacement or strain level due to its just one-time high-voltage application. The words “burst drive” here stand for the operating of the piezoelectric specimen near the resonance (or antiresonance) frequency for a short period of time, then suddenly shutting down the voltage application to observe the displacement ringing. After Umeda et al. developed the method to obtain the equivalent circuit parameters of piezoelectric transducers using the burst drive method, it was adopted by several researchers to obtain the parameters for piezoelectric specimens [71,72,73].
In addition, our research group extended the burst/transient drive method by suggesting that the method operate with open- and short-circuit conditions, and by modifying HiPoCSTM with additional blocking circuit, so that the antiresonance characteristics can also be observed [74]. Figure 5 shows the measurement results of the burst drive method under open- and short-circuit conditions. Under short-circuit conditions, the current and the vibration velocity exhibit a proportional relationship with Q A and are determined by the exponential decay rate. On the other hand, under open-circuit conditions, the voltage and the displacement are proportional, and the decay rate gives Q B . One thing to note in the upper right plot of Figure 5 is that there exists a sudden jump in the voltage from resonance to antiresonance, due to an abrupt transition to open-circuit conditions from the initial resonance excitation.

4.2. Crystallographic Orientation Method

It is not only the IEEE standard’s absence of distinction between Q A and Q B that has been the issue; there have also been other issues. One such issue arises from the intrinsic structural constraint of the length extensional mode ( k 33 mode). The small capacitance issue arises from measuring electrical admittance (or impedance) at electrodes that are separated by a length of a specimen; the small capacitance causes electrical noise that prevents the accurate determination of extensive-type elastic compliance ( s 33 D ) and the corresponding loss ( tan ϕ 33 ). This issue is especially detrimental to the k 33 mode, since these elastic parameters are determined from the antiresonance frequency, which is the minimum admittance point, and the measurement at this point will be the most heavily disturbed. The problem becomes more serious when intensive-type elastic compliance ( s 33 E ) and loss ( tan ϕ 33 ) are to be determined, because they can only be determined indirectly (by using an equational relationship) and the reliability of the intensive-type parameters will diminish further due to the additional error propagation. Considering that intensive-type parameters are important factors as input parameters used in finite element method (FEM) simulations as means of testing piezoelectric devices without creating prototypes, it is important to resolve the issue.
The crystallographic orientation method, as shown in Figure 6a, is one method to reliably obtain s 33 E and tan ϕ 33 . The method utilizes an “effective” k 31 type specimen with a sufficiently large capacitance and angled polarization (0 < γ < π/4). With the derived relationship between s 33 E * and s 11 E * , along with the polarization angle, our research group successfully measured s 33 E and tan ϕ 33 more accurately compared to the IEEE Standard method. The relative errors for s 33 E and tan ϕ 33 with the method proposed by IEEE standard is the following:
s 33 E s 33 E = s 33 D s 33 D + 2 k 33 k 33 k 33 2 1 k 33 2
tan ϕ 33 tan ϕ 33 = tan δ 33 tan δ 33 2 k 33 k 33 k 33 2 1 k 33 2
From the equation, it can be noted that the sign of the relative errors for the real and imaginary parts of I-type elastic coefficients are different. Using the crystallographic orientation method, our group found that the IEEE standard underestimated s 33 E , whereas it overestimated tan ϕ 33 , as shown in Figure 6b.
Figure 6. (a) Schemes for samples with polarization rotation for determination of angle dependence of complex elastic coefficients and (b) polarization angle dependence of elastic compliance (upper) and elastic loss (lower) determined from the samples with polarization rotation. Figure 6a,b were redrawn and originally from [75].
Actuators 12 00213 g006
The method was further extended and utilizes effective k 31 and k 33 modes with a canted polarization angle to obtain the anisotropic I- and E-type loss factors [76]. Additionally, the intensive-type shear mode piezoelectric loss tan ϕ 15 was obtained with effective k 31 k 15 structure analysis [77], and the results of the electrical measurements are shown in Figure 7. Figure 7a,b shows the experimental admittance and impedance circles of the k 31 k 15 piezoceramic specimen, respectively. The spurious peak issue caused by the measurement at high frequency regime (>MHz) was effectively avoided and the resonance frequency and quality factors were accurately determined.

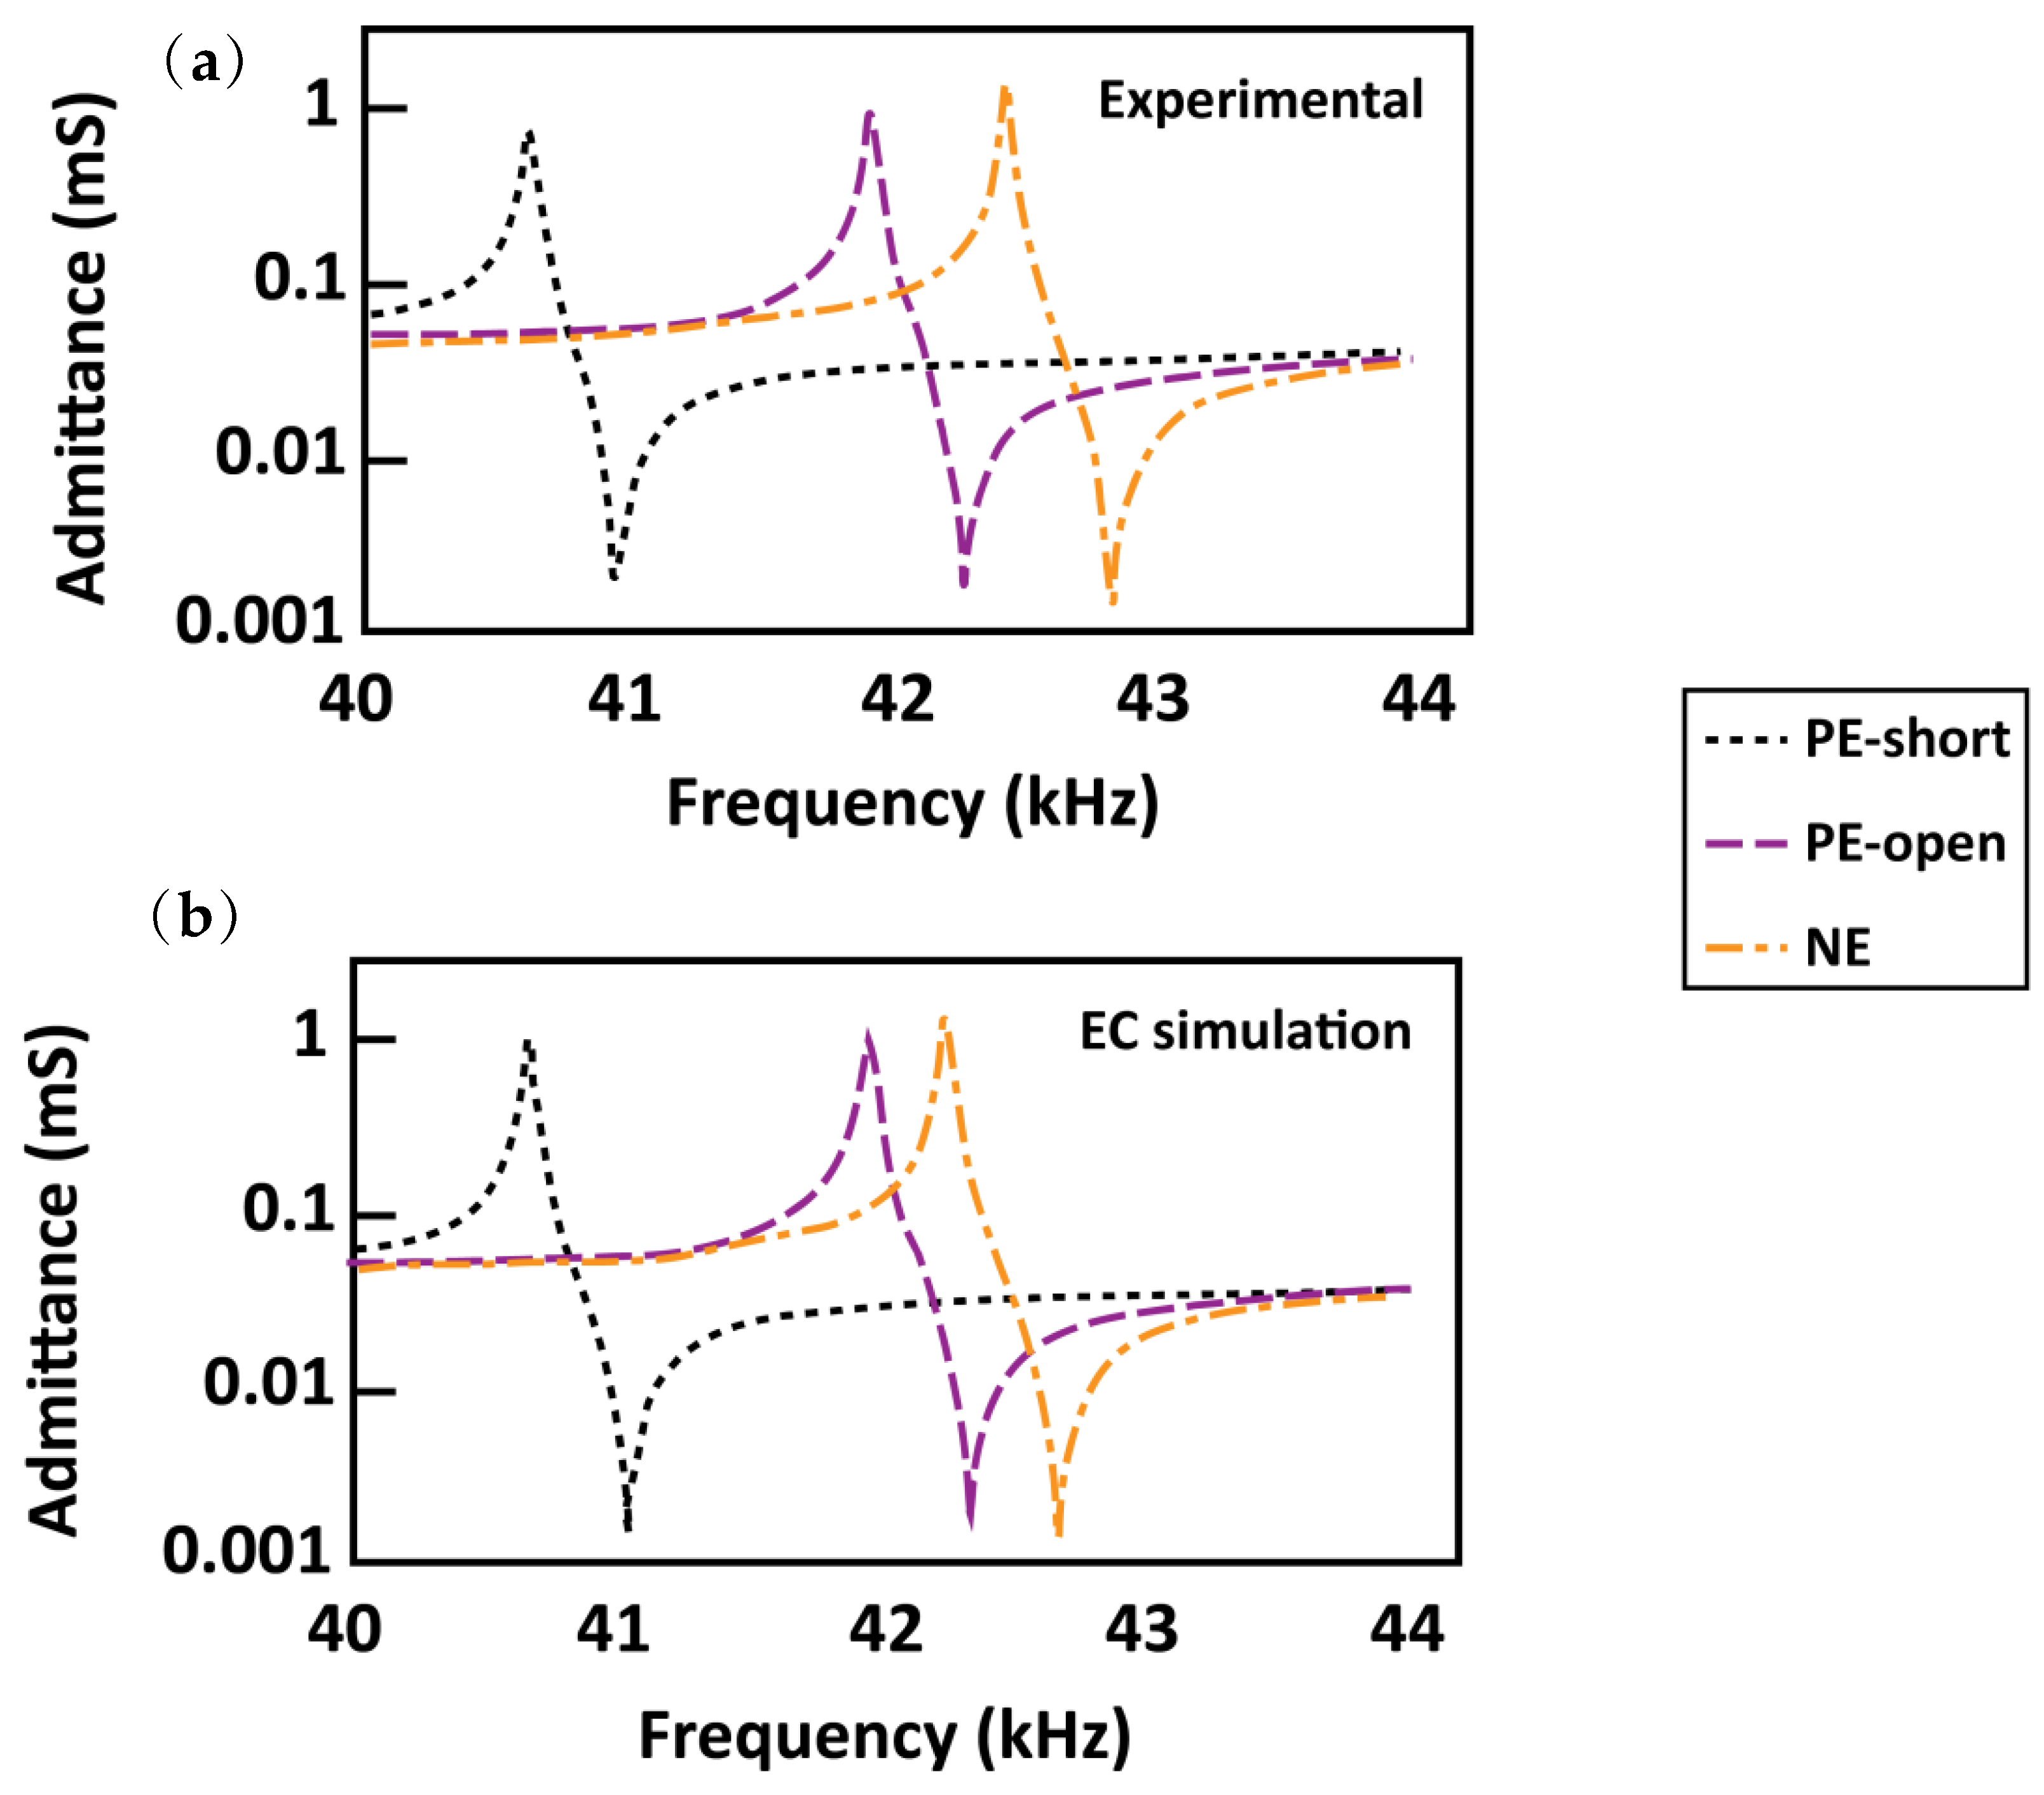
4.3. Partial Electrode Method

Another method, named “partial electrode method”, was proposed by our research group [1,16,78,79] to resolve the aforementioned small capacitance issue in the k 33 mode specimen of the IEEE standard, as shown in Figure 8. The sample configuration consists of a center part, which is measured and electrically excited, and a side part, which is mechanically excited by the center part. Since the measurement is made by the center part that has a considerably larger capacitance than the standard k 33 mode specimen does, the small capacitance issue can be avoided. The specimen types are composed of a k 31 non-electrode (NE), a k 33 open circuit (OC), and a k 33 side electrode (SE) depending on the existence of the electrode and side parts’ poling state. The idea is to measure the side parts’ elastic compliance and corresponding losses while maintaining the center parts as small (about 10%) compared to the side part. Not only does the partial electrode method resolve the small capacitance issues of the IEEE standard k 33 mode specimen, it also enables the direct determination of both the intensive and extensive type elastic compliances and the corresponding losses of both the k 31 - and k 33 -type vibration.
The partial electrode method utilizes an analytically derived equation; the experimental admittance curves are fitted to analytical equations and the elastic compliance and losses of the side parts are determined. The admittance equation for all three types of partial electrode is given by [80]:
Y m , P E = j w 2 d 31 * 2 v 11 E * v s * s s * t s 11 E * s s * v s * t a n a ω l 2 v 11 E * v 11 E * s 11 E * t a n 1 a ω l 2 v s * + a l ω ε 0 ε 33 X * 1 k 31 * 2 t
where k 31 is electromechanical coupling coefficient ( k 31 =   d 31 2 / ( ε 0 ε 33 X s 11 E ) ), d 31 is piezoelectric coefficient, s 11 E is intensive-type elastic compliance, v 11 E is sound velocity ( v 11 E = 1 / ( ρ s 11 E * ) ), ε 33 X is intensive-type dielectric permittivity, ω is angular frequency, a is the portion of center electrode, which ranges from 0 (0%) to 1 (100%), and l , w , and t are length, width, and thickness, respectively. The subscripted numbers and “ s ” refer to the direction (1 is perpendicular and 3 is parallel to the direction of poling) and the side parts ( s depends on the type of configuration. Refer to Figure 8). The superscripted stars mean that the parameters are complex and include loss factors. The first term inside the bracket is the motional admittance and the second term is the damped admittance of the partial electrode specimen. As can be seen from the equation, there are many other parameters in addition to side parts’ elastic parameters. To avoid errors caused by the multivariable fitting, the k 31 -mode-related parameters ( d 31 * , ε 33 X * , s 11 E * ) are determined from the standard k 31 mode specimens and the only parameter to determine is the complex elastic parameter of the side parts, which is to be obtained.
The partial electrode method also enables the determination of the complex elastic coefficients of unpoled piezoelectric ceramics [81], by leaving the side parts unpoled. Unpoled piezoelectric ceramics, though they may be considered useless because they cannot be used as piezoelectric counterparts, can have technological importance; many state-of-the-art piezoelectric devices possess partially unpoled or completely unpoled regions caused by a nonuniform electric field due to multiple poling steps and complex electrode configurations. Therefore, it is necessary to accurately obtain the elastic parameters (“elastic parameter” was emphasized because the permittivity of unpoled samples can easily be measured) of unpoled piezoelectric ceramics to suitably design and optimize piezoelectric devices with desirable (anti-)resonance frequencies and corresponding mechanical quality factors. The complex elastic parameters of unpoled piezoelectric ceramics (hard and soft PZT) were successfully measured, and it was newly found that the values of both elastic compliance and elastic loss were not just the arithmetic mean of extensive-type (non-electrode) elastic parameters, but rather that they lie in between those of the intensive and extensive-type parameters. This is because the polarization in each domain is partially screened depending on the charge configuration, so that some domains possess a depolarization field whereas some do not. This important finding could boost the understanding of the physical phenomena related to piezoelectric devices with unpoled regions, as well as help in predicting the performance of devices with complex structures and nonuniform electric fields through simulations.

4.4. Computer-Based Approach

In recent years, computer-based approaches to determine the complex coefficients of piezoelectric materials have been spotlighted. For example, numerical simulations, such as the finite element method (FEM), are being utilized for this purpose [82]. These methods are in general very useful for designing various types of piezoelectric devices including ultrasound transducers, ultrasonic motors, voltage transformers, actuators, and so on [83,84,85,86,87,88,89]. They allow for the testing of the performance of piezoelectric devices, as well as help anticipate operation frequencies without even creating prototypes. In particular, ATILA FEM [90,91] and COMSOL Multiphysics [92,93] allow the simulation of piezoelectric devices in consideration of complex parameters.
Lahmer et al. [94] proposed an iterative method to determine the complex elastic, dielectric, and piezoelectric parameters of two types of piezoelectric materials using FEM. They simulated different types of vibrational modes including longitudinal, radial, thickness, and shear modes, and fitted FEM results to experimental admittance data. However, in some of their results, especially in those from the thickness and shear modes simulation sets, the agreements were poor due to spurious modes. Meanwhile, a similar approach was created by Perez et al. [95]; the authors used a finite-element-method-(FEM)-based approach to determine the complex coefficients of piezoelectric disks. The authors made an in-house FEM simulation code to test the feasibility of their proposed method. The method consists of two main error minimization processes: one is based on approximation based on a sensitive analysis algorithm, and the other involves a non-physical minimization algorithm such as the Nelder–Mead algorithm. By doing so, the authors obtained a high degree of match between the experimental and FEM results of the admittance and phase curves after full refinement and obtained the related complex coefficients.
More advanced strategies, such as machine-learning-based methods, are being developed to minimize human intervention. Del Castillo et al. [96] utilized neural networks to determine the real parameters of piezoelectric ceramics. By using the imaginary parameters from their previous works, they confirmed that a machine-learning approach can be utilized for piezoelectric parameter determination with high accuracy. However, the bottleneck of the method proposed was revealed as the need for the first approximation of a solution, so the method cannot be applied to new materials with unknown coefficients.

4.5. Ultrasound Pulse-Echo Method

The ultrasonic pulse-echo method, which measures the velocity and attenuation of the sound in media using a set of an ultrasonic transducer and a receiver (or using a single transceiver), has been utilized for a long time, since the 1940s or even earlier during World War II [97,98,99] (the uses of the ultrasonic pulse echo method during World War II were found in several reports from the Massachusetts Institute of Technology (MIT) and described in Huntington’s paper [97]). The simplified apparatus of the pulse-echo method is described in Figure 9a. The method consists of two parts: transmitting a short acoustic pulse through the specimen and receiving the transit time of the sound signal that is reflected back and forth within the specimen. The sound velocity is determined by the distance of the medium perpendicular to the propagation direction of the sound wave (t) divided by the pulse transit time (τ), and elastic loss is determined by the attenuation of the pulse amplitude, as shown in Figure 9b. This method is not only used for probing mechanical properties, but also allows the characterization of the mechanical defects of solids. In 1947, Huntington demonstrated the measurements of elastic constants of alkali halides and Rochelle salts single crystals [97] and noted that the sound attenuations on those single crystals were negligibly small. Eros and Reitz [100] measured the elastic constants of single crystal KCl and NaI, and noted that the transit time error can be as large as one vibrational period of the fundamental pulse frequency if the acoustic impedance of the probing material is the same as that of the transducer materials. Moreover, a number of studies have utilized the ultrasonic pulse-echo method to observe the temperature-dependence of the elastic properties of single crystals and alloys, including single crystal lithium [101], potassium iodides and chlorides [102], and magnesium alloys [103].
The pulse-echo method is suggested by the IEEE Standard on Piezoelectricity [33] as a means of determining the elastic constants of piezoelectric materials. The accuracy and sensitivity of the measurement can be up to 10−4 and 10−5, respectively, depending on the measurement technique. Although the method provides a high accuracy and sensitivity, it cannot stand alone for probing piezoelectricity, since additional electrical measurements are indispensable for characterizing the dielectric and piezoelectric properties; therefore, electrical resonance/antiresonance measurements are usually accompanied. Mudinepalli et al. [104] measured the temperature dependence of longitudinal elastic moduli and the corresponding internal friction (elastic loss) of Na0.5Bi0.5TiO3, which is a lead-free piezoelectric ceramic. They found that the temperature dependence of elastic loss showed anomalies. Jiang et al. [105] measured the frequency dependence of the attenuation coefficients of PZT, 0.72Pb(Mg2/3Nb1/3)O3–0.28 PbTiO3, and LiNbO3. They found that the domain-engineered 0.72Pb(Mg2/3Nb1/3)O3–0.28 PbTiO3 has a very low elastic attenuation and thus is promising for high-frequency ultrasonic transducer applications. Zhu et al. [106] suggested the ultrasonic pulse-echo method combined with resonance and damped capacitance measurements of the longitudinal piezoelectric bar to determine the materials constants of PZT-5A ceramics. Though measurements of loss were not considered, the work is meaningful in that it demonstrated the determination of all the piezoelectric-related materials constants using only six (five for the pulse-echo method and one longitudinal piezoelectric bar for resonance and capacitance measurement) samples.
Nevertheless, some disadvantages of the pulse-echo method do exist. If the impedance matching at the specimen joint is not good, some echo trains can be observed due to the multiple reflection of the sound wave at both ends of the specimen. Moreover, since the pulse-echo method is highly sensitive, a huge experimental error can occur if both ends of the specimen are not parallel enough.

5. Modeling Including Loss Factors

A number of studies dealt with the modeling of piezoelectric devices considering complex coefficients of piezoelectric materials. In particular, losses, which are imaginary parameters, are essential because they can reflect the heat dissipation of the device that is a crucial factor for the energy efficiency of such devices. Pulpan et al. [107] derived analytical models for a ring-dot-type piezoelectric transformer and compared the models to the experimental data. The model and the experimental data showed an almost perfect fit in the resonance frequency; however, the peak transformation ratio differed significantly. The authors attributed this difference to the fact that the electric fields are different in the input and output segments due to the divided electrodes. The discrepancy might also have happened due to the fact that the authors only included elastic loss factors in their models. Loyau et al. [108] derived analytical solutions including loss factors for the Rosen-type piezoelectric bar transformer and analyzed the heat dissipation, which is related to the imaginary parameters. The loss measurements were performed using calorimetric methods and confirmed the good agreement between the analytical solutions and the experimental data.
Many studies proposed equivalent circuit models for piezoelectric devices including three (dielectric, elastic, and piezoelectric) loss factors. Our research group, collaborating with researchers at Southeast University, proposed equivalent circuit models including loss factors for partial electrode configurations for the k 31 mode [109]. The six-terminal equivalent circuit models were used to simulate the admittance spectrum of three types of partial electrode specimen: open circuit, short circuit, and non-electrode. Figure 10 shows the experimental admittance spectra (Figure 10a), along with those simulated with the proposed equivalent circuit models (Figure 10b) with a high degree of agreement. Dong et al. [110] proposed equivalent circuit models for piezoelectric ultrasonic motors including three types of losses. The authors of the study compared the models with and without the three types of losses and demonstrated that models with three types of losses fit much better to experimental data than the ones without loss factors. Yang et al. [111] proposed equivalent circuits for the coupled longitudinal–flexural vibration of a beam-type PZT-metal laminate structure including three types of losses. They compared the admittance curves generated from their models to the ones generated from the FEM also including the loss factors, and validated their models by showing the agreement of the models to the FEM results.
The FEM-based modeling of piezoelectric devices is also being considered by several researchers. Meurisse et al. [112] analyzed the temperature effects (from 20 °C to 300 °C) of the complex piezoelectric parameters of a simple ultrasonic transducer with admittance curves from both experiment and FEM results. Though some discrepancies happened between the experimental and FEM results, the authors found that the peak magnitude at the antiresonance frequency is affected by the piezoelectric loss factor. Joo et al. [113] used FEM to analyze temperature rise in a contour-mode piezoelectric transformer considering dielectric and elastic loss factors. Coupling the loss factors with heat transfer analysis, the authors performed FEM simulation and confirmed their results with experimental data and observed how complex coefficients vary under temperature change.

6. Concluding Remarks

In this review, we addressed the importance of the accurate determination of the loss factors of piezoelectric materials, specified researchers’ endeavors for the accurate determination of complex coefficients in a chronological manner, and provided measurement methods in detail, including our group’s contribution to the field of piezoelectric measurements, especially the loss determination method. Though many researchers have put massive efforts into accurately obtaining piezoelectric complex coefficients, there are still remaining issues that need to be resolved. The issues, and their possible solutions, are the following:
  • Though various measuring techniques—including our group’s works—have been developed to resolve the issues and/or to obtain more accurate loss factors and piezoelectric-related coefficients, each technique still has its own pros and cons. For example, one must consider the laborious fitting with analytical equations needed to obtain parameters when the partial electrode method is utilized. Furthermore, the crystallographic method may require measurements of numerous samples, since statistical dispersion of the parameters may become larger when the variance of the polarization angle is wide. The pros and cons of each method are organized in Table 1.
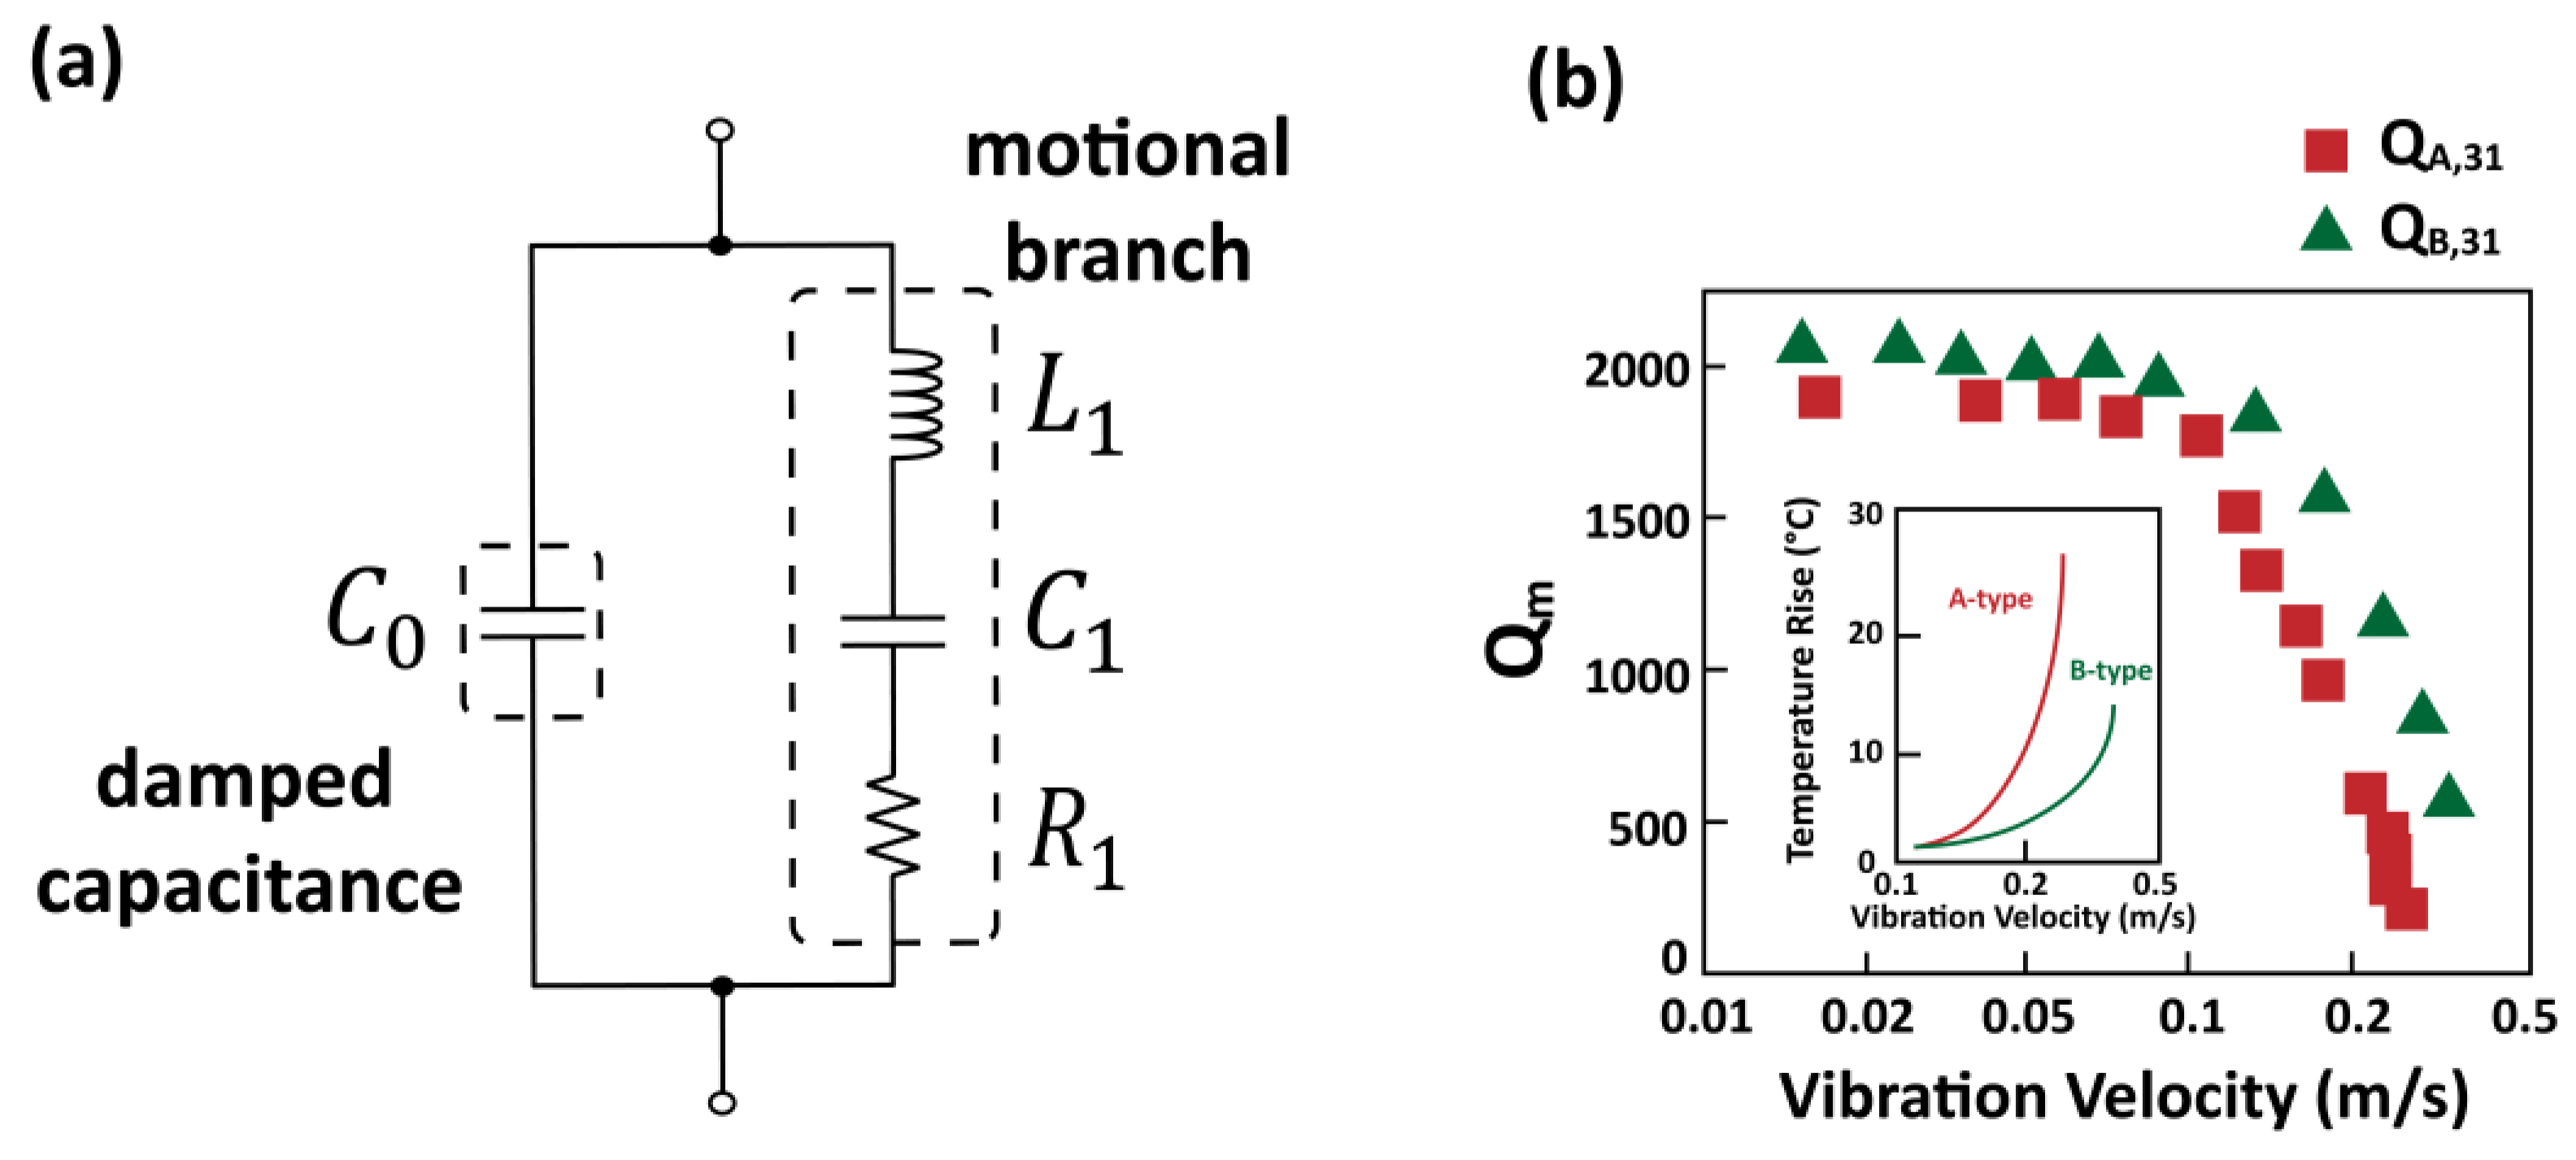
  • The anisotropy of loss factors was demonstrated by our group [54,55] and several other research groups [114,115]. Our research group, as mentioned in Section 3, derived analytical solutions for five types of vibrational modes and proposed a method to determine all the loss factors. While many elastic and dielectric loss factors can be directly obtained from admittance data, piezoelectric loss factors are hard to obtain; obtaining the piezoelectric loss factors involves complicated relationships between Q A and Q B , and possess large experimental errors due to uncertainty propagation. Zhuang reported ± 100% error of a certain piezoelectric loss factor in his thesis [55]. In this sense, piezoelectric loss can be considered as a “hidden” loss and it is difficult to obtain the loss factors with high accuracy. Therefore, piezoelectric loss factors are sometimes not considered in physical models; one research group even claimed that such piezoelectric loss does not exist [63]. Therefore, new determination methods to obtain the piezoelectric loss factors with a high accuracy are required, and the ways in which anisotropic loss factors affect the performance of certain types of piezoelectric devices should be studied.
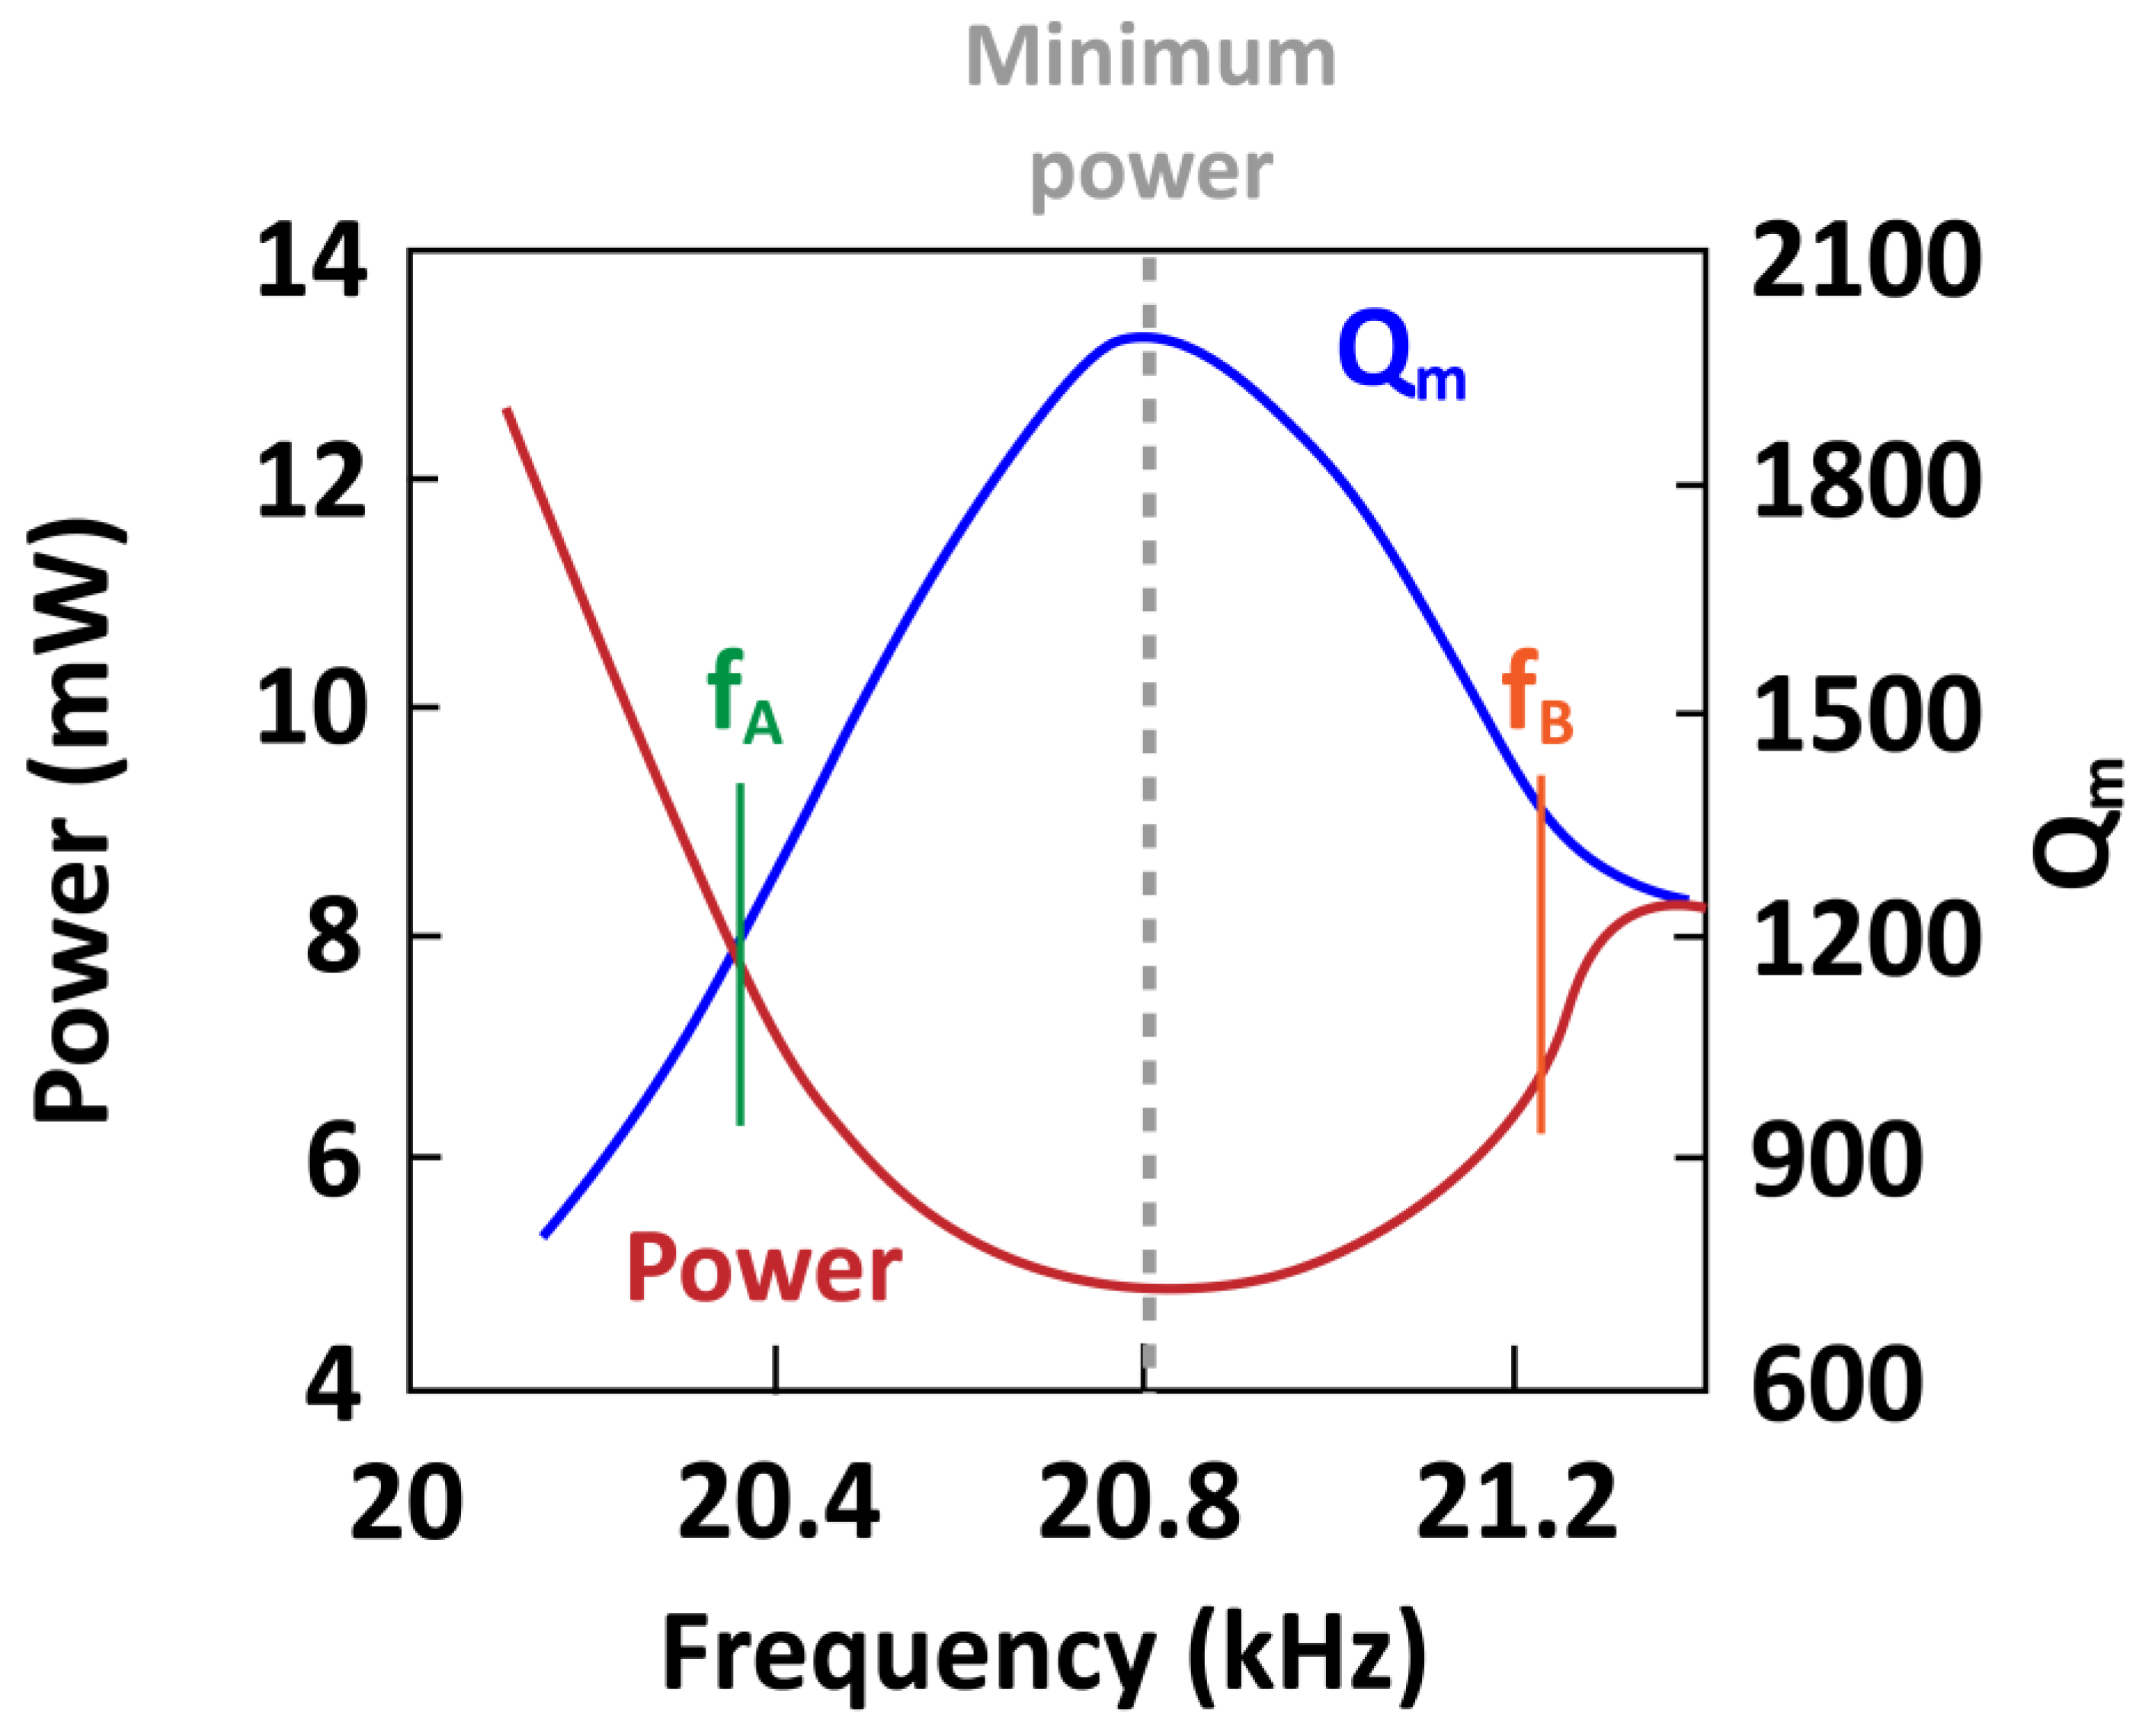
  • Our group proposed that the antiresonance frequency operation can be more efficient than the resonance operation in PZT-based piezoelectric ceramics. This is because piezoelectric loss is larger than the average of the sum of the dielectric and elastic loss factors, so that Q B > Q A . Furthermore, as already shown in this review, the minimum power consumption may be achieved between the resonance and antiresonance frequencies. These phenomena may be different in lead-free piezoelectric ceramics to some extent. For example, in sodium-potassium-niobate-based lead-free piezoelectric ceramics, Q A and Q B are almost equal to each other. This is actually not the difference between the lead-containing and lead-free piezoelectric ceramics, because our group previously observed that Q B > Q A in bismuth sodium tantalate piezoelectric ceramics [80]. Though we speculate that the main factor that makes the difference is lone pair electrons, due to the Pb and Bi ions being located in a site of the perovskite structure, a clear mechanism has not been revealed. Furthermore, the frequency where minimum power loss is achieved strongly depends on the material or device type. Therefore, the piezoelectric loss mechanism of different types of materials and/or devices should be clarified for optimal device operation.
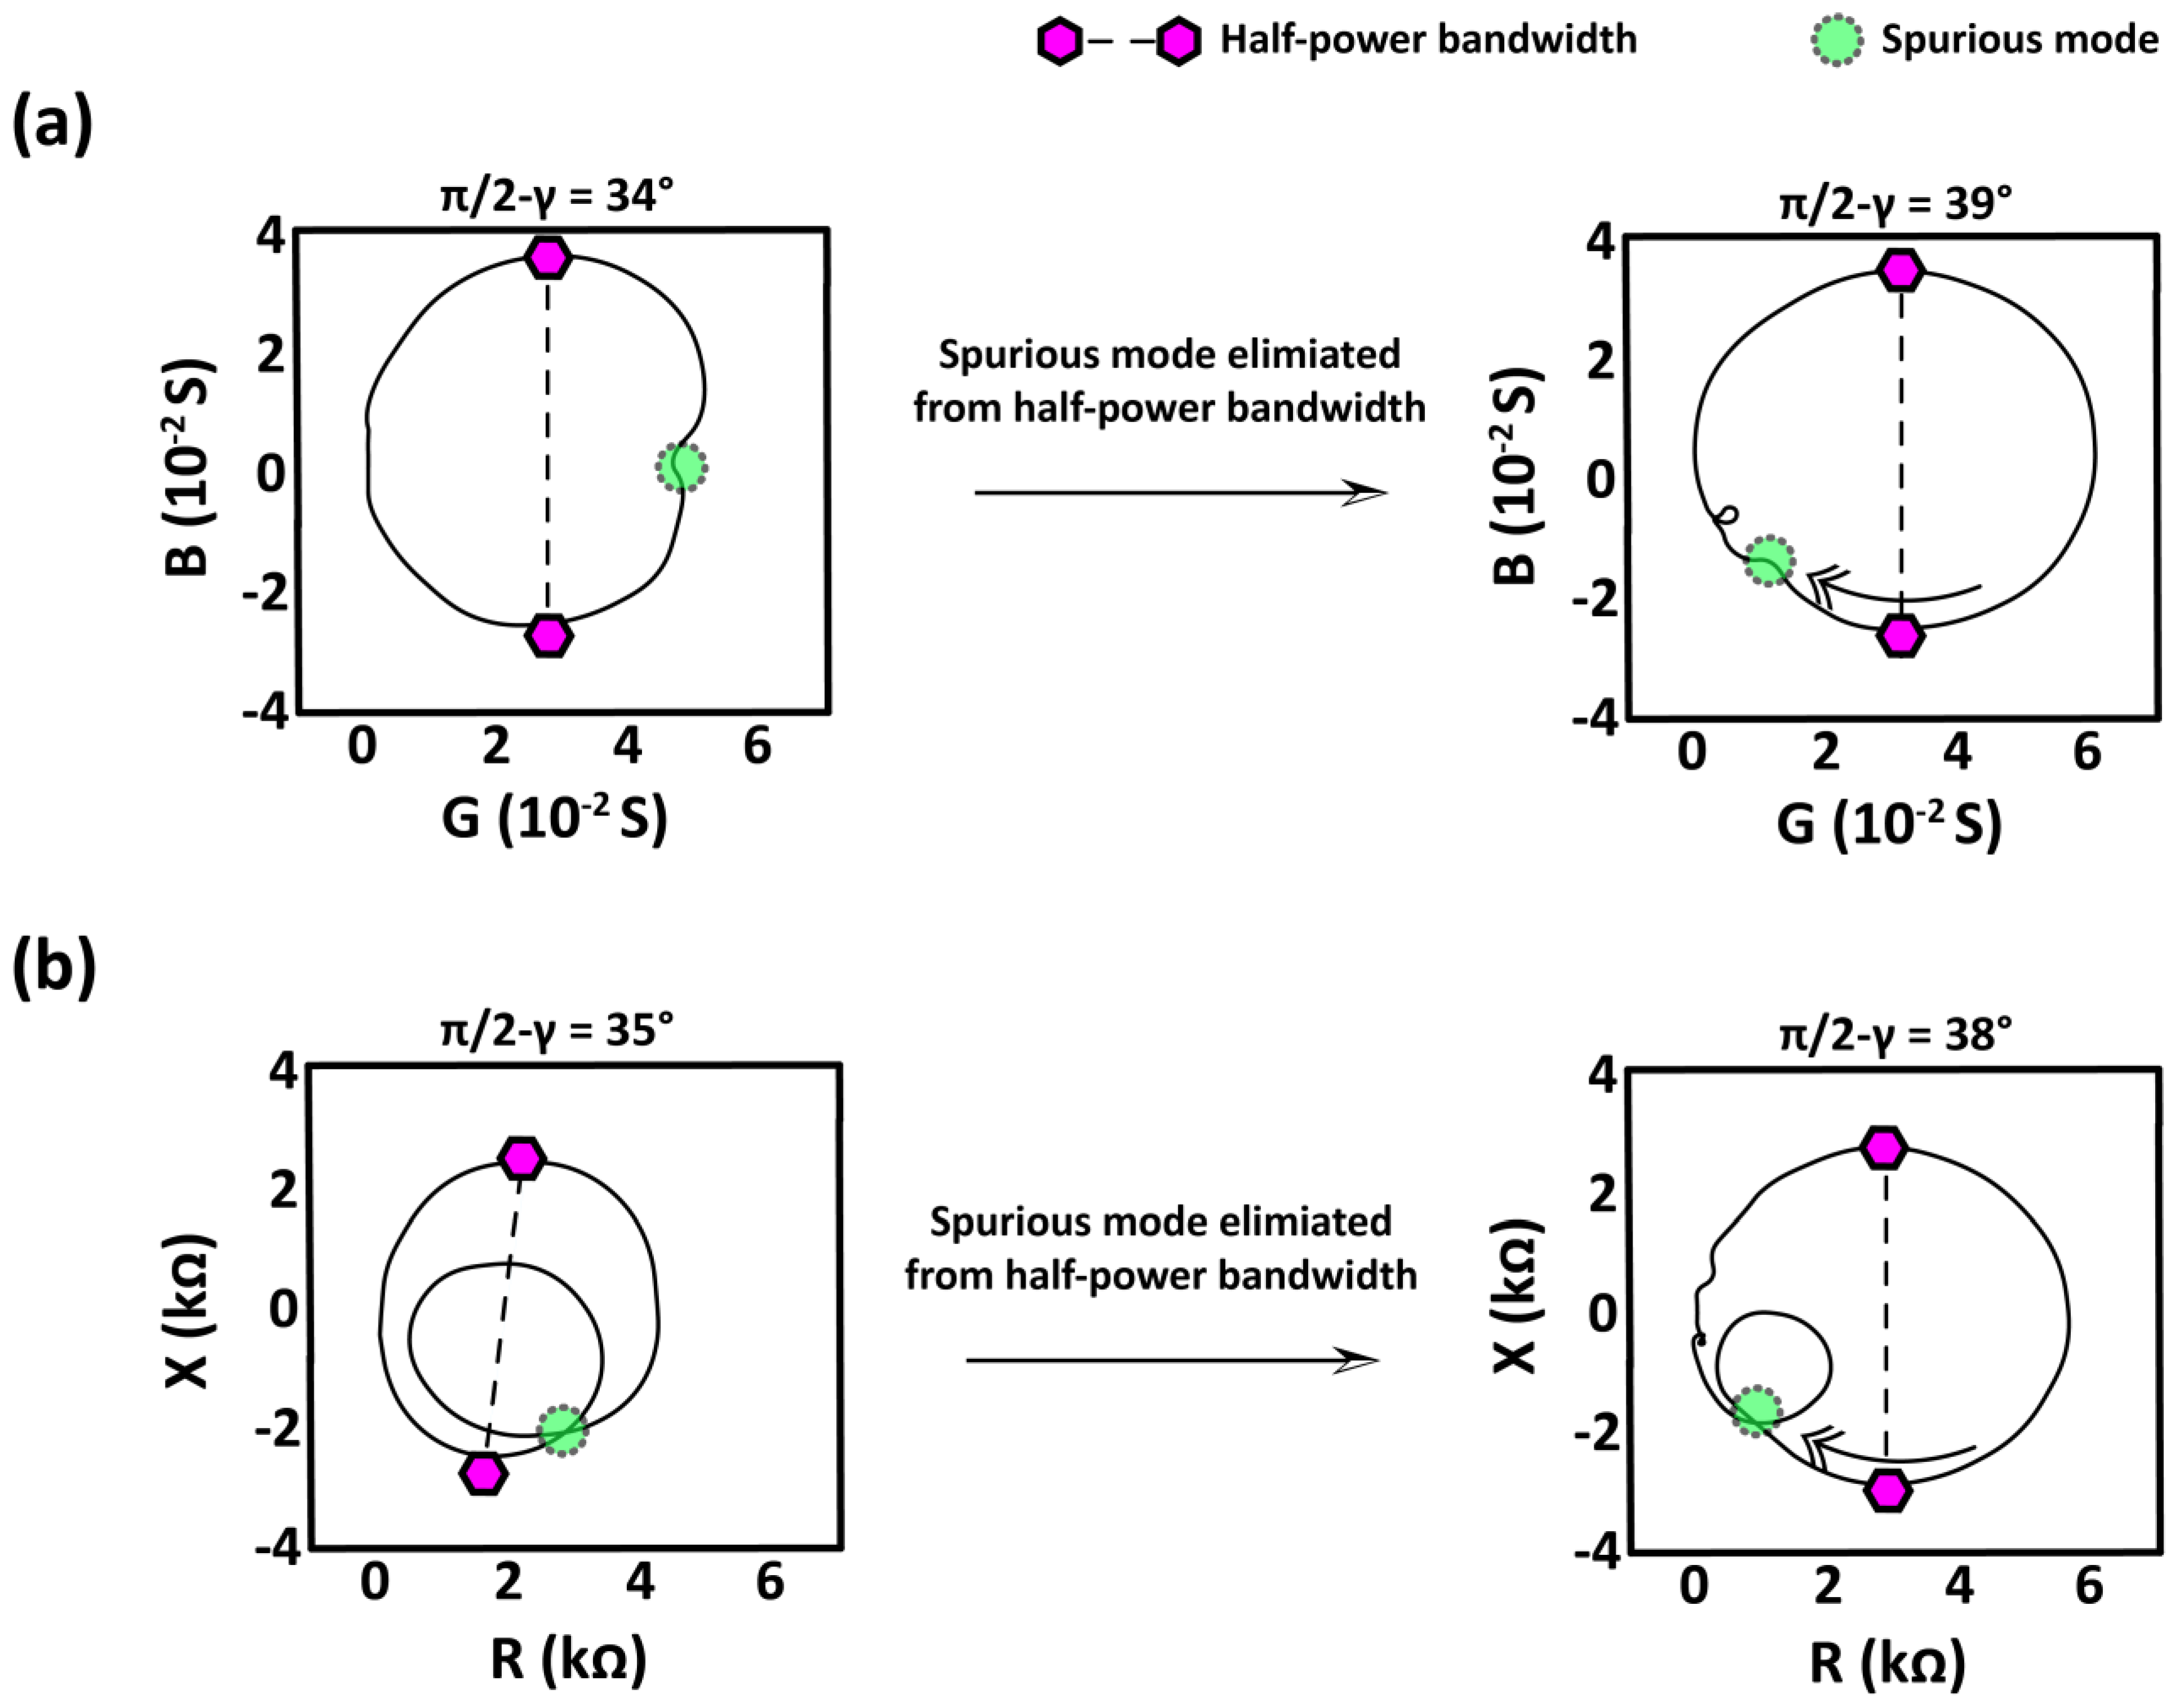
  • The piezoelectric effect is a linear coupling between elasticity and electricity, and the parameters may differ depending on the boundary conditions caused by the consistency of the intensive or extensive quantity [5,6]. For example, the D-constant condition causes elastic stiffening, so that the D-constant elastic compliance ( s D ) is smaller than the electric field (E)-constant elastic compliance ( s E ). Both types of parameters—I- or E-type—are important, because I-type parameters can be used as input parameters for models and simulations, while E-type parameters are important in discussing physical mechanisms. Though our group demonstrated the determination process of both I- and E- type elastic compliances and the corresponding loss factors in k 31 and k 33 vibrational modes, thus partially resolving the deficits of the IEEE Standard, there are still issues to be resolved. For instance, the thickness mode ( k t ) and thickness shear mode that provide E-type complex elastic parameters are typically used near the MHz regime, but they have various spurious modes, caused by overtone resonances or higher harmonics, that make it difficult to precisely determine the mechanical quality factors, as well as the resonance frequencies. Furthermore, the length shear mode ( k 15 ), which is similar to the longitudinal mode ( k 33 ), has a large impedance issue due to its intrinsic structure similar to the k 33 mode. Therefore, a new methodology for precisely determining both I- and E- type complex coefficients should be devised. One way of overcoming the spurious mode could be the FEM-based approach proposed by Perez et al. [95] that fits experimental data over a wide range of frequency, if all the spurious modes can be fitted.
  • The accurate parameter (especially elastic and piezoelectric) determinations of piezoelectric thin films have been challenging, since the measurements are always affected by a clamping effect due to the substrate. For example, to eliminate the effect of substrate clamping, the contribution of substrate stiffness to the measured piezoelectric constant should be considered [116]. Furthermore, up-to-date, suggested methods have focused on the determination of real parameters, yet the determination of the imaginary parameters (loss factors) of piezoelectric thin films (though many deal with dielectric loss, which is relatively easily obtained with simple capacitance measurements) has not been thoroughly studied. Since loss factors are directly related to the performance of piezoelectric devices, it seems necessary to develop such methods. Recently, researchers utilized MEMS structures to determine piezoelectric coefficients; several recent works on the characterization of capacitive MEMS resonators [117,118] share many similar aspects compared to piezoelectric MEMS resonators, so applying similar characterization methods may improve the accuracy of determined parameters and loss factors.
  • Finally, a machine-learning based approach should be created for the determination of complex coefficients based on researchers’ convenience. The first effort to automate the parameter determination process was made in 2021 [96], and researchers started utilizing machine-leaning techniques for anticipating the behaviors of various piezoelectric device applications [119,120,121,122]. If the usage of the technique is proved to be valid in the future, piezoelectric complex coefficients could be determined without laborious tasks including creating samples, measurements, and analysis.

Author Contributions

Conceptualization, Y.P.; software, Y.P.; investigation, Y.P.; resources, Y.P.; data curation, Y.P.; writing—original draft preparation, Y.P. and M.C.; writing—review and editing, Y.P., M.C. and K.U.; visualization, Y.P.; supervision, Y.P. and K.U.; project administration, K.U.; funding acquisition, K.U. All authors have read and agreed to the published version of the manuscript.

Funding

This research was funded by the Office of Naval Research (ONR) under grant numbers N00014-17-1-2088 and N00014-20-1-2039.

Data Availability Statement

Not applicable.

Conflicts of Interest

The authors declare no conflict of interest.

References

  1. Park, Y.; Zhang, Y.; Majzoubi, M.; Scholehwar, T.; Hennig, E.; Uchino, K. Improvement of the standard characterization method on k33 mode piezoelectric specimens. Sens. Actuators A Phys. 2020, 312, 112124. [Google Scholar] [CrossRef]
  2. Uchino, K.; Zhuang, Y.; Ural, S.O. Loss determination methodology for a piezoelectric ceramic: New phenomenological theory and experimental proposals. J. Adv. Dielectr. 2011, 1, 17–31. [Google Scholar] [CrossRef]
  3. Ural, S.O.; Tuncdemir, S.; Zhuang, Y.; Uchino, K. Development of a high power piezoelectric characterization system and its application for resonance/antiresonance mode characterization. Jpn. J. Appl. Phys. 2009, 48, 056509. [Google Scholar] [CrossRef]
  4. Zhuang, Y.; Ural, S.O.; Tuncdemir, S.; Amin, A.; Uchino, K. Analysis on loss anisotropy of piezoelectrics with∞ mm crystal symmetry. Jpn. J. Appl. Phys. 2010, 49, 021503. [Google Scholar] [CrossRef]
  5. Ikeda, T. Fundamentals of Piezoelectricity; Oxford University Press: Oxford, UK; New York, NY, USA, 1990; 263p. [Google Scholar]
  6. Ikeda, T. On the Relations between Electromechanical Coupling Coefficients and Elastic Constants in a Piezoelectric Crystal. Jpn. J. Appl. Phys. 1972, 11, 463. [Google Scholar] [CrossRef]
  7. Tobergte, D.R.; Curtis, S.; IUPAC. Compendium of Chemical Terminology (The “Gold Book”); Blackwell Scientific Publications: Oxford, UK, 2013; Volume 53. [Google Scholar]
  8. Park, Y. Partial Electrode Configuration for Loss and Physical Parameter Determination of Piezoelectric Ceramics. Ph.D. Thesis, The Pennsylvania State University, State College, PA, USA, 2021. [Google Scholar]
  9. Majzoubi, M.; Shekhani, H.N.; Bansal, A.; Hennig, E.; Scholehwar, T.; Uchino, K. Advanced methodology for measuring the extensive elastic compliance and mechanical loss directly in k31 mode piezoelectric ceramic plates. J. Appl. Phys. 2016, 120, 225113. [Google Scholar] [CrossRef]
  10. Uchino, K. Micromechatronics; CRC Press: Boca Raton, FL, USA, 2019. [Google Scholar]
  11. Uchino, K. Advanced Piezoelectric Materials: Science and Technology; Woodhead Publishing: Sawston, UK, 2017. [Google Scholar]
  12. Uchino, K. Ferroelectric Devices, 2nd ed.; CRC Press: Boca Raton, FL, USA, 2018. [Google Scholar]
  13. Uchino, K. High-power piezoelectrics and loss mechanisms. In Advanced Piezoelectric Materials; Elsevier: Amsterdam, The Netherlands, 2017; pp. 647–754. [Google Scholar]
  14. Choi, M. Polarization Orientation Dependence of Piezoelectric Loss and Proposed Crystallographic Characterization Methodology. Ph.D. Thesis, Pennsylvania State University, State College, PA, USA, 2018. [Google Scholar]
  15. Uchino, K. FEM and Micromechatronics with ATILA Software; CRC Press: Boca Raton, FL, USA, 2018. [Google Scholar]
  16. Park, Y.; Majzoubi, M.; Zhang, Y.; Scholehwar, T.; Hennig, E.; Uchino, K. Analytical modeling of k 33 mode partial electrode configuration for loss characterization. J. Appl. Phys. 2020, 127, 204102. [Google Scholar] [CrossRef]
  17. Jacques, C.; Pierre, C. Development, via compression, of electric polarization in hemihedral crystals with inclined faces. Bull. Soc. Minérologique Fr. 1880, 3, 90–93. [Google Scholar]
  18. Cady, W.G. The longitudinal piezoelectric effect in rochelle-salt crystals. Proc. Phys. Soc. 1937, 49, 646. [Google Scholar] [CrossRef]
  19. Mason, W. A dynamic measurement of the elastic, electric and piezoelectric constants of rochelle salt. Phys. Rev. 1939, 55, 775. [Google Scholar] [CrossRef]
  20. Berlincourt, D.; Jaffe, H. Elastic and piezoelectric coefficients of single-crystal barium titanate. Phys. Rev. 1958, 111, 143. [Google Scholar] [CrossRef]
  21. Berlincourt, D. Variation of electroelastic constants of polycrystalline lead titanate zirconate with thoroughness of poling. J. Acoust. Soc. Am. 1964, 36, 515–520. [Google Scholar] [CrossRef]
  22. Van Dyke, K.S. The piezoelectric quartz resonator. Am. Mineral. J. Earth Planet. Mater. 1945, 30, 214–244. [Google Scholar]
  23. Van Dyke, K.S. Matrices of piezoelectric, elastic, and dielectric constants. J. Acoust. Soc. Am. 1950, 22, 681. [Google Scholar] [CrossRef]
  24. Baerwald, H. Thermodynamic theory of ferroelectric ceramics. Phys. Rev. 1957, 105, 480. [Google Scholar] [CrossRef]
  25. Baerwald, H. Electrical Admittance of a Circular Ferro-Electric Disc; Contract No. Nonr-1055 (00); Technical Report; Clevite Research Center: Cleveland, OH, USA,, 1955. [Google Scholar]
  26. Martin, G.E. Determination of equivalent-circuit constants of piezoelectric resonators of moderately low Q by absolute-admittance measurements. J. Acoust. Soc. Am. 1954, 26, 413–420. [Google Scholar] [CrossRef]
  27. Marx, J. Use of the piezoelectric gauge for internal friction measurements. Rev. Sci. Instrum. 1951, 22, 503–509. [Google Scholar] [CrossRef]
  28. Standard on Piezoelectric Crystals: Recommended Termonology. Proc. IRE 1945, 37.
  29. Teare, B.; Haggerty, P. Publications policy of the IEEE. Electr. Eng. 1962, 81, 771. [Google Scholar]
  30. IRE standards on piezoelectric crystals-the piezoelectric vibrator-definitions and methods of measurement, 1957. Proc. Inst. Radio Eng. 1957, 45, 353–358.
  31. Standards on Piezoelectric Crystals: Measurements of Piezoelectric Ceramics. Proc. IRE 1961, 49, 1161–1169.
  32. Electrical, I.o.; Sonics, E.E.; Group, U. IEEE Standard on Piezoelectricity; IEEE: Manhattan, NY, USA, 1978. [Google Scholar]
  33. Meitzler, A.; Tiersten, H.; Warner, A.; Berlincourt, D.; Couqin, G.; Welsh, F., III. IEEE Standard on Piezoelectricity; IEEE: Manhattan, NY, USA, 1988. [Google Scholar]
  34. BS EN 50324-1; 2002 Piezoelectric Properties of Ceramic Materials and Components Terms and Definitions. CELENEC: Brussels, Belgium, 2002; p. 18.
  35. BS EN 50324-2; 2002 Piezoelectric Properties of Ceramic Materials and Components: Methods of Measurement: Low Power. CELENEC: Brussels, Belgium, 2002; p. 30.
  36. BS EN 50324-3; 2002 Piezoelectric Properties of Ceramic Materials and Components: Method of Measurements: High Power. CELENEC: Brussels, Belgium, 2002; p. 20.
  37. EMAS-6100; Electrical Test Methods for Piezoelectric Ceramic Vibrators. JISC: Bristol, UK, 1993; p. 74.
  38. Arlt, G.; Dederichs, H. Complex elastic, dielectric and piezoelectric constants by domain wall damping in ferroelectric ceramics. Ferroelectrics 1980, 29, 47–50. [Google Scholar] [CrossRef]
  39. Smits, J. Influence of moving domain walls and jumping lattice defects on complex material coefficients of piezoelectrics. IEEE Trans. Sonics Ultrason. 1976, 23, 168–173. [Google Scholar] [CrossRef]
  40. Holland, R.; EerNisse, E.P. Accurate measurement of coefficients in a ferroelectric ceramic. IEEE Trans. Sonics Ultrason. 1969, 16, 173–181. [Google Scholar] [CrossRef]
  41. Holland, R. Measurement of piezoelectric phase angles in a ferroelectric ceramic. IEEE Trans. Sonics Ultrason. 1970, 17, 123–124. [Google Scholar] [CrossRef]
  42. Smits, J. Iterative method for accurate determination of the real and imaginary parts of the materials coefficients of piezoelectric ceramics. IEEE Trans. Sonics Ultrason. 1976, 23, 393–401. [Google Scholar] [CrossRef]
  43. Smits, J. High accuracy determination of real and imaginary parts of elastic, piezoelectric and dielectric constants of ferroelectric PLZT (11/55/45) ceramics with iterative method. Ferroelectrics 1985, 64, 275–291. [Google Scholar] [CrossRef]
  44. Sherrit, S.; Wiederick, H.; Mukherjee, B. PdP135. Nun-iterative evaluation of the real and imaginary material constants of piezoelectric resonators. Ferroelectrics 1992, 134, 111–119. [Google Scholar] [CrossRef]
  45. Sherrit, S.; Gauthier, N.; Wiederick, H.; Mukherjee, B. Accurate evaluation of the real and imaginary material constants for a piezoelectric resonator in the radial mode. Ferroelectrics 1991, 119, 17–32. [Google Scholar] [CrossRef]
  46. Du, X.-H.; Wang, Q.-M.; Uchino, K. Accurate determination of complex materials coefficients of piezoelectric resonators. IEEE Trans. Ultrason. Ferroelectr. Freq. Control 2003, 50, 312–320. [Google Scholar]
  47. Xu, Q.; Ramachandran, A.; Newnham, R. Resonance measuring technique for complex coefficients of piezoelectric composites. J. Wave-Mater. Interact. 1987, 2, 105–122. [Google Scholar]
  48. Ohigashi, H. Electromechanical properties of polarized polyvinylidene fluoride films as studied by the piezoelectric resonance method. J. Appl. Phys. 1976, 47, 949–955. [Google Scholar] [CrossRef]
  49. Kwok, K.W.; Chan, H.L.W.; Choy, C.L. Evaluation of the material parameters of piezoelectric materials by various methods. IEEE Trans. Ultrason. Ferroelectr. Freq. Control 1997, 44, 733–742. [Google Scholar] [CrossRef]
  50. TASI Technical Software. PRAP: Piezoelectric Resonance Analysis Program. Available online: https://www.tasitechnical.com/prap (accessed on 14 March 2023).
  51. Uchino, K.; Hirose, S. Loss mechanisms in piezoelectrics: How to measure different losses separately. IEEE Trans. Ultrason. Ferroelectr. Freq. Control 2001, 48, 307–321. [Google Scholar] [CrossRef] [PubMed]
  52. Mezheritsky, A.V. A method of “weak resonance” for quality factor and coupling coefficient measurement in piezoelectrics. IEEE Trans. Ultrason. Ferroelectr. Freq. Control 2005, 52, 2120–2130. [Google Scholar] [CrossRef]
  53. Mezheritsky, A.V. Elastic, dielectric, and piezoelectric losses in piezoceramics: How it works all together. IEEE Trans. Ultrason. Ferroelectr. Freq. Control 2004, 51, 695–707. [Google Scholar]
  54. Zhuang, Y.; Ural, S.O.; Uchino, K. Methodology for characterizing loss factors of piezoelectric ceramics. Ferroelectrics 2014, 470, 260–271. [Google Scholar] [CrossRef]
  55. Zhuang, Y. Loss Phenomenology and the Methodology to Derive Loss Factors in Piezoelectric Ceramics. Ph.D. Thesis, The Pennsylvania State University, State College, PA, USA, 2011. [Google Scholar]
  56. Zhuang, Y.; Ural, S.O.; Rajapurkar, A.; Tuncdemir, S.; Amin, A.; Uchino, K. Derivation of piezoelectric losses from admittance spectra. Jpn. J. Appl. Phys. 2009, 48, 041401. [Google Scholar] [CrossRef]
  57. Yuan, Z.; Seyit, O.; Kenji, U. Loss factor characterization methodology for piezoelectric ceramics. IOP Conf. Ser. Mater. Sci. Eng. 2011, 18, 092027. [Google Scholar]
  58. Suzuki, M.; Nagata, H.; Ohara, J.; Funakubo, H.; Takenaka, T. Bi3−xMxTiTaO9 (M= La or Nd) ceramics with high mechanical quality factor Qm. Jpn. J. Appl. Phys. 2003, 42, 6090. [Google Scholar] [CrossRef]
  59. Tanaka, D.; Yamazaki, J.; Furukawa, M.; Tsukada, T. High power characteristics of (Ca, Ba) TiO3 piezoelectric ceramics with high mechanical quality factor. Jpn. J. Appl. Phys. 2010, 49, 09MD03. [Google Scholar] [CrossRef]
  60. Butt, Z.; Anjum, Z.; Sultan, A.; Qayyum, F.; Khurram Ali, H.M.; Mehmood, S. Investigation of electrical properties & mechanical quality factor of piezoelectric material (PZT-4A). J. Electr. Eng. Technol. 2017, 12, 846–851. [Google Scholar]
  61. Hou, Y.; Zhu, M.; Gao, F.; Wang, H.; Wang, B.; Yan, H.; Tian, C. Effect of MnO2 addition on the structure and electrical properties of Pb (Zn1/3Nb2/3)0.20(Zr0.50Ti0.50)0.80O3 ceramics. J. Am. Ceram. Soc. 2004, 87, 847–850. [Google Scholar] [CrossRef]
  62. Shen, Z.-Y.; Xu, Y.; Li, J.-F. Enhancement of Qm in CuO-doped compositionally optimized Li/Ta-modified (Na, K) NbO3 lead-free piezoceramics. Ceram. Int. 2012, 38, S331–S334. [Google Scholar] [CrossRef]
  63. Hagiwara, M.; Hoshina, T.; Takeda, H.; Tsurumi, T. Identicalness between piezoelectric loss and dielectric loss in converse effect of piezoelectric ceramic resonators. Jpn. J. Appl. Phys. 2012, 51, 09LD10. [Google Scholar] [CrossRef]
  64. Uchino, K. High power piezoelectric characterization system (HiPoCS™). Ferroelectrics 2020, 569, 21–49. [Google Scholar] [CrossRef]
  65. Mojrzisch, S.; Twiefel, J. Phase-controlled frequency response measurement of a piezoelectric ring at high vibration amplitude. Arch. Appl. Mech. 2016, 86, 1763–1769. [Google Scholar] [CrossRef]
  66. Shekhani, H.; Uchino, K. Evaluation of the mechanical quality factor under high power conditions in piezoelectric ceramics from electrical power. J. Eur. Ceram. Soc. 2015, 35, 541–544. [Google Scholar] [CrossRef]
  67. Shekhani, H.N.; Uchino, K. Characterization of mechanical loss in piezoelectric materials using temperature and vibration measurements. J. Am. Ceram. Soc. 2014, 97, 2810–2814. [Google Scholar] [CrossRef]
  68. Shi, W.; Shekhani, H.N.; Zhao, H.; Ma, J.; Yao, Y.; Uchino, K. Losses in piezoelectrics derived from a new equivalent circuit. J. Electroceram. 2015, 35, 1–10. [Google Scholar] [CrossRef]
  69. Sugiyama, S.; Uchino, K. Pulse driving method of piezoelectric actuators. In Proceedings of the Sixth IEEE International Symposium on Applications of Ferroelectrics, Bethlehem, PA, USA, 8–11 June 1986; 1986. [Google Scholar]
  70. Umeda, M.; Nakamura, K.; Ueha, S. The measurement of high-power characteristics for a piezoelectric transducer based on the electrical transient response. Jpn. J. Appl. Phys. 1998, 37, 5322. [Google Scholar] [CrossRef]
  71. Doshida, Y.; Shimizu, H.; Mizuno, Y.; Tamura, H. Investigation of high-power properties of (Bi, Na, Ba) TiO3 and (Sr, Ca)2NaNb5O15 piezoelectric ceramics. Jpn. J. Appl. Phys. 2013, 52, 07HE01. [Google Scholar] [CrossRef]
  72. Chang, K.-T. Investigation of electrical transient behavior of an ultrasonic transducer under impulsive mechanical excitation. Sens. Actuators A Phys. 2007, 133, 407–414. [Google Scholar] [CrossRef]
  73. Li, B.; Li, G.; Zhao, S.; Zhang, L.; Ding, A. Characterization of the high-power piezoelectric properties of PMnN–PZT ceramics using constant voltage and pulse drive methods. J. Phys. D Appl. Phys. 2005, 38, 2265. [Google Scholar] [CrossRef]
  74. Shekhani, H.; Scholehwar, T.; Hennig, E.; Uchino, K. Characterization of piezoelectric ceramics using the burst/transient method with resonance and antiresonance analysis. J. Am. Ceram. Soc. 2017, 100, 998–1010. [Google Scholar] [CrossRef]
  75. Choi, M.; Scholehwar, T.; Hennig, E.; Uchino, K. Crystallographic approach to obtain intensive elastic parameters of k33 mode piezoelectric ceramics. J. Eur. Ceram. Soc. 2017, 37, 5109–5112. [Google Scholar] [CrossRef]
  76. Choi, M.; Uchino, K.; Hennig, E.; Scholehwar, T. Polarization orientation dependence of piezoelectric losses in soft lead Zirconate-Titanate ceramics. J. Electroceram. 2018, 40, 16–22. [Google Scholar] [CrossRef]
  77. Choi, M.; Park, Y.; Daneshpajooh, H.; Scholehwar, T.; Hennig, E.; Uchino, K. Determination of anisotropic intensive piezoelectric loss in polycrystalline ceramics. Ceram. Int. 2021, 47, 16309–16315. [Google Scholar] [CrossRef]
  78. Park, Y.; Daneshpajooh, H.; Scholehwar, T.; Hennig, E.; Uchino, K. Physical parameter and loss determination using partial electrode: k31 and k33 mode cases. arXiv 2020, arXiv:2012.07053. [Google Scholar]
  79. Park, Y.; Choi, M.; Daneshpajooh, H.; Scholehwar, T.; Hennig, E.; Uchino, K. Partial Electrode Configuration as a Tool for the Precise Determination of Losses and Physical Parameters of Piezoceramics. J. Korean Inst. Electr. Electron. Mater. Eng. 2021, 34, 167–177. [Google Scholar]
  80. Park, Y.; Daneshpajooh, H.; Scholehwar, T.; Hennig, E.; Uchino, K. Partial Electrode Method for Loss and Physical Parameter Determination of Piezoceramics: Simplification, Error Investigation and Applicability. J. Eur. Ceram. Soc. 2021, 41, 5900–5908. [Google Scholar] [CrossRef]
  81. Park, Y.; Daneshpajooh, H.; Scholehwar, T.; Hennig, E.; Uchino, K. Depolarization field effect on elasticity of unpoled piezoelectric ceramics. Appl. Mater. Today 2021, 23, 101020. [Google Scholar] [CrossRef]
  82. Feldmann, N.; Schulze, V.; Claes, L.; Jurgelucks, B.; Walther, A.; Henning, B. Inverse piezoelectric material parameter characterization using a single disc-shaped specimen. tm-Tech. Mess. 2020, 87, s50–s55. [Google Scholar] [CrossRef]
  83. Chien, W.T.; Yang, C.J.; Yen, Y.T. Coupled-field analysis of piezoelectric beam actuator using FEM. Sens. Actuators A Phys. 2005, 118, 171–176. [Google Scholar]
  84. Tsuchiya, T.; Kagawa, Y.; Wakatsuki, N.; Okamura, H. Finite element simulation of piezoelectric transformers. IEEE Trans. Ultrason. Ferroelectr. Freq. Control 2001, 48, 872–878. [Google Scholar] [CrossRef]
  85. Li, H.L.; Hu, J.H.; Chan, H.L.W. Finite element analysis on piezoelectric ring transformer. IEEE Trans. Ultrason. Ferroelectr. Freq. Control 2004, 51, 1247–1254. [Google Scholar]
  86. Wang, J.S.; Ostergaard, D.F. A finite element-electric circuit coupled simulation method for piezoelectric transducer. In Proceedings of the 1999 IEEE Ultrasonics Symposium. Proceedings. International Symposium (Cat. No.99CH37027), Tahoe, NV, USA, 17–20 October 1999; pp. 1105–1108. [Google Scholar]
  87. Iula, A.; Vazquez, F.; Pappalardo, M.; Gallego, J.A. Finite element three-dimensional analysis of the vibrational behaviour of the Langevin-type transducer. Ultrasonics 2002, 40, 513–517. [Google Scholar] [CrossRef]
  88. Frangi, A.; Corigliano, A.; Binci, M.; Faure, P. Finite element modelling of a rotating piezoelectric ultrasonic motor. Ultrasonics 2005, 43, 747–755. [Google Scholar] [CrossRef]
  89. Flueckiger, M.; Fernandez, J.M.; Perriard, Y. Finite element method based design and optimisation methodology for piezoelectric ultrasonic motors. Math. Comput. Simul. 2010, 81, 446–459. [Google Scholar] [CrossRef]
  90. Ebenezer, D.; Abraham, P. Analysis of axially polarized piezoelectric ceramic cylindrical shells of finite length with internal losses. J. Acoust. Soc. Am. 2002, 112, 1953–1960. [Google Scholar] [CrossRef] [PubMed]
  91. Uchino, K. Loss integration in ATILA software. In Applications of ATILA FEM Software to Smart Materials; Elsevier: Amsterdam, The Netherlands, 2013; pp. 45–65. [Google Scholar]
  92. Andersen, T.; Andersen, M.A.; Thomsen, O.C. Simulation of piezoelectric transformers with COMSOL. In COMSOL Conference 2012: Proceedings: Milan, Italy, 10 October 2012; COMSOL: Burlington, MA, USA, 2012. [Google Scholar]
  93. Wang, L.; Zhao, L.; Jiang, Z.; Luo, G.; Yang, P.; Han, X.; Li, X.; Maeda, R. High accuracy comsol simulation method of bimorph cantilever for piezoelectric vibration energy harvesting. AIP Adv. 2019, 9, 095067. [Google Scholar] [CrossRef]
  94. Lahmer, T.; Kaltenbacher, M.; Kaltenbacher, B.; Lerch, R.; Leder, E. FEM-based determination of real and complex elastic, dielectric, and piezoelectric moduli in piezoceramic materials. IEEE Trans. Ultrason. Ferroelectr. Freq. Control 2008, 55, 465–475. [Google Scholar] [CrossRef] [PubMed]
  95. Pérez, N.; Carbonari, R.; Andrade, M.; Buiochi, F.; Adamowski, J. A FEM-based method to determine the complex material properties of piezoelectric disks. Ultrasonics 2014, 54, 1631–1641. [Google Scholar] [CrossRef] [PubMed]
  96. Del Castillo, M.; Pérez, N. Machine Learning Identification of Piezoelectric Properties. Materials 2021, 14, 2405. [Google Scholar] [CrossRef] [PubMed]
  97. Huntington, H.B. Ultrasonic measurements on single crystals. Phys. Rev. 1947, 72, 321. [Google Scholar] [CrossRef]
  98. Pinkerton, J. A pulse method for the measurement of ultrasonic absorption in liquids: Results for water. Nature 1947, 160, 128–129. [Google Scholar] [CrossRef]
  99. Pellam, J.R.; Galt, J. Ultrasonic propagation in liquids: I. Application of pulse technique to velocity and absorption measurements at 15 megacycles. J. Chem. Phys. 1946, 14, 608–614. [Google Scholar] [CrossRef]
  100. Eros, S.; Reitz, J. Elastic constants by the ultrasonic pulse echo method. J. Appl. Phys. 1958, 29, 683–686. [Google Scholar] [CrossRef]
  101. Nash, H.C.; Smith, C.S. Single-crystal elastic constants of lithium. J. Phys. Chem. Solids 1959, 9, 113–118. [Google Scholar] [CrossRef]
  102. Norwood, M.H.; Briscoe, C. Elastic constants of potassium iodide and potassium chloride. Phys. Rev. 1958, 112, 45. [Google Scholar] [CrossRef]
  103. Eros, S.; Smith, C. Low-temperature elastic constants of magnesium alloys. Acta Metall. 1961, 9, 14–22. [Google Scholar] [CrossRef]
  104. Mudinepalli, V.R.; Reddy, N.R.; Lin, W.-C.; Kumar, K.S.; Murty, B. Phase transitions of the ferroelectric Na0.5Bi0.5TiO3 by dielectric and internal friction measurements. Adv. Mater. Lett. 2015, 6, 27–32. [Google Scholar] [CrossRef]
  105. Jiang, W.; Cao, W.; Han, P. High-frequency dispersion of ultrasonic velocity and attenuation of single-crystal 0.72 Pb (Mg1/3Nb2/3) O3–0.28 PbTiO3 with engineered domain structures. Appl. Phys. Lett. 2002, 80, 2466–2468. [Google Scholar] [CrossRef]
  106. Zhu, S.; Jiang, B.; Cao, W. Characterization of piezoelectric materials using ultrasonic and resonant techniques. In Medical Imaging 1998: Ultrasonic Transducer Engineering; SPIE: Bellingham, WA, USA, 1998; pp. 154–162. [Google Scholar]
  107. Pulpán, P.; Erhart, J. Experimental verification of an analytical model for the ring-shaped piezoelectric transformer. J. Electr. Electron. Eng. 2015, 8, 23. [Google Scholar]
  108. Loyau, V.; Liu, Y.-P.; Costa, F. Analyses of the heat dissipated by losses in a piezoelectric transformer. IEEE Trans. Ultrason. Ferroelectr. Freq. Control 2009, 56, 1745–1752. [Google Scholar] [CrossRef] [PubMed]
  109. Dong, X.; Majzoubi, M.; Choi, M.; Ma, Y.; Hu, M.; Jin, L.; Xu, Z.; Uchino, K. A new equivalent circuit for piezoelectrics with three losses and external loads. Sens. Actuators A 2017, 256, 77–83. [Google Scholar] [CrossRef]
  110. Dong, X.; Jiang, C.; Jin, L.; Xu, Z.; Yuan, Y. Inherent loss analysis of piezoelectrics in radial vibration and its application in ultrasonic motor. IEEE Trans. Ultrason. Ferroelectr. Freq. Control 2020, 67, 1632–1640. [Google Scholar] [CrossRef] [PubMed]
  111. Yang, H.; Yuan, T.; Guo, H.; Sun, P.; Fan, P.; Wang, Y. Coupled longitudinal-flexural vibration characteristics of a piezoelectric structure with losses. J. Intell. Mater. Syst. Struct. 2021, 32, 2541–2553. [Google Scholar] [CrossRef]
  112. Meurisse, T.; Damjanovic, D. Modeling losses of a piezoelectric resonator: Analytical vs finite elements analysis. In Proceedings of the 2017 Joint IEEE International Symposium on the Applications of Ferroelectric (ISAF)/International Workshop on Acoustic Transduction Materials and Devices (IWATMD)/Piezoresponse Force Microscopy (PFM), Atlanta, GA, USA, 7–11 May 2017; pp. 71–74. [Google Scholar]
  113. Joo, H.-W.; Lee, C.-H.; Rho, J.-S.; Jung, H.-K. Analysis of temperature rise for piezoelectric transformer using finite-element method. IEEE Trans. Ultrason. Ferroelectr. Freq. Control 2006, 53, 1449–1457. [Google Scholar] [CrossRef]
  114. Slabki, M.; Wu, J.; Weber, M.; Breckner, P.; Isaia, D.; Nakamura, K.; Koruza, J. Anisotropy of the high-power piezoelectric properties of Pb (Zr, Ti) O3. J. Am. Ceram. Soc 2019, 102, 6008–6017. [Google Scholar] [CrossRef]
  115. Zhang, S.; Sherlock, N.P.; Meyer Jr, R.J.; Shrout, T.R. Crystallographic dependence of loss in domain engineered relaxor-PT single crystals. Appl. Phys. Lett. 2009, 94, 162906. [Google Scholar] [CrossRef]
  116. Lu, Y.; Reusch, M.; Kurz, N.; Ding, A.; Christoph, T.; Prescher, M.; Kirste, L.; Ambacher, O.; Žukauskaitė, A. Elastic modulus and coefficient of thermal expansion of piezoelectric Al1−xScxN (up to x = 0.41) thin films. APL Mater. 2018, 6, 076105. [Google Scholar] [CrossRef]
  117. Brenes, A.; Juillard, J.; Dos Santos, F.V.; Bonnoit, A. Characterization of MEMS resonators via feedthrough de-embedding of harmonic and subharmonic pulsed-mode response. Sens. Actuators A Phys. 2015, 229, 211–217. [Google Scholar] [CrossRef]
  118. Polunin, P.; Yang, Y.; Atalaya, J.; Ng, E.; Strachan, S.; Shoshani, O.; Dykman, M.; Shaw, S.; Kenny, T. Characterizing MEMS nonlinearities directly: The ring-down measurements. In Proceedings of the 2015 Transducers—2015 18th International Conference on Solid-State Sensors, Actuators and Microsystems (TRANSDUCERS), Anchorage, AK, USA, 21–25 June 2015; pp. 2176–2179. [Google Scholar]
  119. Li, W.; Yang, T.; Liu, C.; Huang, Y.; Chen, C.; Pan, H.; Xie, G.; Tai, H.; Jiang, Y.; Wu, Y. Optimizing piezoelectric nanocomposites by high-throughput phase-field simulation and machine learning. Adv. Sci. 2022, 9, 2105550. [Google Scholar] [CrossRef] [PubMed]
  120. Zhang, C.; Hu, G.; Yurchenko, D.; Lin, P.; Gu, S.; Song, D.; Peng, H.; Wang, J. Machine learning based prediction of piezoelectric energy harvesting from wake galloping. Mech. Syst. Signal Process. 2021, 160, 107876. [Google Scholar] [CrossRef]
  121. Hu, J.; Song, Y. Piezoelectric modulus prediction using machine learning and graph neural networks. Chem. Phys. Lett. 2022, 791, 139359. [Google Scholar] [CrossRef]
  122. Chimeh, H.E.; Nabavi, S.; Al Janaideh, M.; Zhang, L. Deep-learning-based optimization for a low-frequency piezoelectric MEMS energy harvester. IEEE Sens. J. 2021, 21, 21330–21341. [Google Scholar] [CrossRef]
Figure 1. (a) Equivalent circuit (EC) of piezoelectric resonator suggested by the IEEE Standard. (b) Vibration velocity dependence of resonance ( Q A ) and antiresonance ( Q B ) and corresponding temperature rise. Figure 1a,b were redrawn and originally from [33] and [51], respectively.
Actuators 12 00213 g001
Figure 2. (a) Resonance peak distortions in constant voltage method and (b) resonance peaks in constant current method. Figure 2a,b were redrawn and originally from [64].
Actuators 12 00213 g002
Figure 3. The schematic of High-Power Piezoelectric Characterization Systems (HiPoCSTM). The Figure is redrawn and originally from [3].
Actuators 12 00213 g003
Figure 4. Change in electrical power and Q m as a function of frequency in constant input power method. The minimum power located in between resonance and antiresonance frequency. The Figure is redrawn and originally from [66].
Actuators 12 00213 g004
Figure 5. The ringing characteristics of voltage (orange) and current (blue) in short-(left) and open-(right) circuit conditions for burst/transient drive applied to k 31 mode. The Figure is redrawn and originally from [74].
Actuators 12 00213 g005
Figure 7. Spurious peaks clearing out from the (a) motional admittance and (b) motional impedance by changing polarization angle in effective k 31 k 15 piezoceramic specimen. The Figure is redrawn and originally from [77].
Actuators 12 00213 g007
Figure 8. (a) IEEE Standard k 31 mode piezoelectric specimen, (b) k 31 non-electrode (NE) for determination of s 11 D * , (c) k 33 open circuit (OC) for determination of s 33 D * , and (d) k 33 side electrode (SE) for determination of s 33 E * . The Figure is redrawn and originally from [80].
Actuators 12 00213 g008
Figure 9. (a) A schematic diagram for ultrasonic pulse-echo measurement and (b) received pulse scheme. Redrawn from the IEEE Standard on Piezoelectricity.
Actuators 12 00213 g009
Figure 10. (a) Experimental admittance results of k 31 mode partial electrode samples and (b) admittance generated from equivalent circuit model with three losses. The Figure was redrawn and is originally from [109].
Actuators 12 00213 g010
Table 1. Pros and cons of each measurement techniques.
MethodsProsCons
Admittance measurementIt is a well-known method and utilized by many researchersHigh-power measurements may distort resonance/antiresonance peaks
Burst/transientHeat generation issue can be eliminated.The measurements can be unstable compared to admittance measurements.
Crystallographic orientationVarious I-type and E-type loss factors can be determined.Laborious measurements are required to reduce the error from polarization angle variance.
Partial electrodeI-type and E-type elastic loss factors can be determined with reduced error.Laborious fitting task is required.
Computer-based approachEffective when many spurious modes exist; convenient due to process automationExpertise in computer science/machine-learning is required.
Ultrasound pulse-echoElastic parameters and loss factors can be accurately determined.The method requires electrical measurements to obtain all types of piezoelectric-related coefficients and loss factors.
Disclaimer/Publisher’s Note: The statements, opinions and data contained in all publications are solely those of the individual author(s) and contributor(s) and not of MDPI and/or the editor(s). MDPI and/or the editor(s) disclaim responsibility for any injury to people or property resulting from any ideas, methods, instructions or products referred to in the content.

