Article

Investigations of the Crystallographic Orientation on the Martensite Variant Reorientation of the Single-Crystal Ni-Mn-Ga Cube and Its Composites for Actuator Applications

Institute of Innovative Research (IIR), Tokyo Institute of Technology, 4259 Nagatsuta-cho, Midori-ku, Yokohama 226-8503, Japan
*
Author to whom correspondence should be addressed.
Current address: Honda R&D Co., Ltd., Saitama 351-0113, Japan.
Actuators 2023, 12(5), 211; https://doi.org/10.3390/act12050211
Submission received: 20 April 2023 / Revised: 12 May 2023 / Accepted: 18 May 2023 / Published: 20 May 2023
(This article belongs to the Special Issue Recent Advances in Shape-Memory Materials and Actuators)

Abstract

:
High-speed actuators are greatly required in this decade due to the fast development of future technologies, such as Internet-of-Things (IoT) and robots. The ferromagnetic shape memory alloys (FSMAs), whose shape change could be driven by applying an external magnetic field, possess a rapid response. Hence, these materials are considered promising candidates for the applications of future technologies. Among the FSMAs, the Ni-Mn-Ga-based materials were chosen for their large shape deformation strain and appropriate phase transformation temperatures for near-room temperature applications. Nevertheless, it is widely known that both the intrinsic brittleness of the Ni-Mn-Ga alloy and the constraint of shape deformation strain due to the existence of grain boundaries in the polycrystal inhibit the applications. Therefore, various Ni-Mn-Ga-based composite materials were designed in this study, and their shape deformation behaviors induced by compressive or magnetic fields were examined by the in situ micro CT observations. In addition, the dependence of the martensite variant reorientation (MVR) on the crystallographic directions was also investigated. It was found that most of the MVRs are active within the magnetic field range applied in the regime of the <100>p, <110>p, and <111>p of the single-crystal {100}p Ni-Mn-Ga cubes.

1. Introduction

Shape memory alloys (SMAs) have been paid much attention due to their applicability to future technologies, such as components in the Internet-of-Things (IoT) and robots [1,2]. The conventional SMAs, whose shape deformation is driven by manipulating the external stress applied and by tuning their environmental temperature, perform slow responses when the stimulation (i.e., thermal) is applied [3]. As a consequence, the ferromagnetic shape memory alloys (FSMAs), which present a fast response as excitation is introduced, have been widely studied [4,5,6]. In the FSMAs, the shape deformation could not only be driven by applying external stress or controlling its environmental temperature as aforementioned but also could be manipulated by introducing an external magnetic field [7,8]. This is the so-called magnetic field-induced strain (MFIS). Therefore, based on the aforementioned advantages of the FSMAs to the applications, the FSMAs were chosen in this work.
There are various alloy systems in the community of the FSMAs, such as Ni-Mn-Ga [9,10], Ni-Mn-In [11,12], Ni-Mn-Sn [13,14], and many of their derivatives [15,16,17]. Among all the alloy systems, the ternary Ni-Mn-Ga alloy was selected in this work due to its proper phase transformation temperature range and its large shape deformation strain [5,18]. The shape deformation of the alloys, which are driven by the externally applied magnetic field, could originate from two different mechanisms. The first one is the shape deformation activated by the martensite variant reorientation (MVR) (i.e., the twin motions) [19,20], while the second one is the shape deformation generated by the phase transformation between the austenite phase (L21) and the martensite phase [21,22]. The shape deformation, which is brought about by the first mechanism, is targeted in this study due to the relatively smaller magnetic field required [19,20,21,22,23,24]. Accordingly, the Ni-Mn-Ga alloys, which are in their martensite state, are a prerequisite in this work for magnetic field-induced shape deformation.
Among the martensite phase, there exist three typical martensite phases, which are the five-modulated (5M), seven-modulated (7M), and non-modulated (NM) martensite phases, respectively [25,26]. They are also known as 10M-, 14M-, and 2M-martensite phases, respectively. The apparent phase could be manipulated by controlling the chemical composition of the alloys, in other words, the electron-to-atom (e/a) ratio [25,27,28]. Among all the martensite phases, the MVR could be triggered by a relatively low magnetic field as the apparent phase is the single 5M-martensite phase compared to those of the 7M- and NM-martensite phases. Therefore, based on the aforementioned truth, the chemical composition of Ni50Mn28Ga22 (at.%) was selected in this study for its MFIS, which is triggered by the magnetic field-induced MVR and could be achieved by a relatively low magnetic field [19,20,29,30].
It has been reported that the Ni-Mn-Ga alloys in the state of the martensite phase performed a large shape deformation strain [5,8,18,22]. However, firstly, the intrinsic embrittlement of the Ni-Mn-Ga alloys still remains a difficulty to be tackled with [31]. In addition, secondly, the low shape deformation strain of the polycrystalline Ni-Mn-Ga alloys, which is attributed to the inhibition of twin motions by the grain boundaries among the polycrystalline alloys [32,33], is also necessary to be solved. Some studies have worked on the foam or the porous structures of the Ni-Mn-Ga alloys, which could produce a large deformation strain [34,35]. However, it ended up with low stability as compensation. Therefore, it is crucial to find a solution that could both solve the intrinsic embrittlement difficulty and the low deformation strain of polycrystals while the cyclic stability remains not sacrificed.
Up to date, few articles showed that integration of the single-crystalline Ni-Mn-Ga particles served as fillers and the silicone rubber served as a polymer matrix could not only solve the conventional embrittlement difficulties but also achieve a relatively large shape deformation strain, which is close to the single-crystal Ni-Mn-Ga bulk alloys [36,37]. In other words, the balance between the ductility and the shape deformation strain was practiced by utilizing the composite materials composed of the single-crystalline Ni-Mn-Ga particles and silicone rubber matrix. Moreover, it has also been proven that the cyclic stability and long-term stability in terms of the MFIS remained high in these composite materials [38].
Nevertheless, the controlling of the crystallographic direction of the single-crystal Ni-Mn-Ga has not been reported. It is known that the extent of the MVR, which could eventually result in the overall shape deformation strain, strongly depends on the crystallographic direction [39,40]. In this study, the investigations of the dependence of the magnetic field-induced MVR on the crystallographic directions both in the {100}p single-crystal Ni-Mn-Ga cube and its composite materials were thus conducted. Additionally, the interaction between the neighboring alloys, which are one active and one inactive, has also been investigated. It was found that the MVR took place in almost all crystallographic directions while the magnetic field is tuned from <100>p to <110>p and from <100>p to <111>p of the single-crystal {100}p Ni-Mn-Ga cube for every 5 degrees. The disappearance of the magnetic field-induced MVR within the examined magnetic field range could be attributed to the equivalent of the three variants of the 5M-martensite phase. Moreover, it was found that the existence of the neighboring alloy could enhance the shape deformation strain and shape recovery owing to the interaction between these two embedded alloys.

2. Materials and Methods

2.1. Ingot Fabrications

Ni spheres (purity < 99.99%), Mn flakes (purity > 99.9%), and Ga spheres (purity > 99.9999%) were used for the fabrications of the Ni-Mn-Ga mother ingots. Prior to use, Ni spheres were subjected to cold-rolling and were cleaned by mechanical grinding and acetone cleansing. Mn flakes were also subjected to pre-treatments of mechanical grinding and etching by using the solution of 10 vol.% HNO3 at room temperature (RT; i.e., 296 K ± 3 K). While the Ga spheres, which were stored in a refrigerator at all times, were used as-received. The pre-treated Ni and Mn, as well as Ga, were utilized as the starting materials for the fabrications of the ingots. As mentioned in the introduction part, to achieve the magnetic field (H-field) driven martensite variant reorientation (MVR) at RT, ingots with the chemical composition of Ni50Mn28Ga22 (at.%) exhibiting the electron-to-atom ratio (e/a) of approximately 7.62 was determined. With this chemical composition, the alloy, which possesses the 5M-martensite phase and the ferromagnetic characteristic at RT, allows the MVR to take place at RT under an externally imposed H-field [41].
The starting materials were preciously weighted and were then high-temperature alloyed by using an arc-melting system, which is equipped with a non-consumable tungsten (W) electrode. During the high-temperature arc-melting process, the alloying chamber was filled with the atmosphere of Ar-1 vol.% H2 to prevent the oxidation of the ingots. The ingots were alloyed five times with an upside-down flipping before each re-alloying to achieve homogenized specimens. The ingots after the treatment of arc-melting alloying are denoted as “as-cast” alloys in the entire article unless otherwise stated. The as-cast alloys were then mechanically polished, cleaned, wrapped by Ta film, vacuumed in a quartz ampoule, and sealed in the quartz ampoule filled with a high-purity Ar gas (purity > 99.9999%). A homogenization treatment (HT) at 1273 K for 3.6 ks followed by an air-cooling process to RT was then conducted to further homogenize the chemical composition of the as-cast alloys. The homogenized ingots were then abbreviated as “HT” alloys unless otherwise mentioned. Part of the “HT” alloys, which are polycrystals, were used for the fabrications of some of the composite materials. On the other hand, part of the HT polycrystalline Ni-Mn-Ga alloys was utilized as the starting materials for the fabrications of the single-crystal Ni-Mn-Ga alloys. For the different processes, please refer to the following sections.

2.2. Fabrication of Single-Crystal Ni-Mn-Ga Specimens

The aforementioned polycrystalline HT alloys were used as the starting materials for the fabrications of single-crystal Ni-Mn-Ga alloys in different morphologies, such as single-crystal cubes and single-crystal plates. In this series study, for the fabrications of these single-crystal materials, three approaches were used, those are, (1) mechanical crushing, (2) stress-assisted thermal crushing, and (3) floating-zone methods. These three techniques for the preparations of the single-crystal materials are described in the following Section 2.2.1 and Section 2.2.2, respectively. In this article, the (3) floating-zone method was especially focused.

2.2.1. Obtaining Single-Crystal Ni-Mn-Ga Particles by a Crushing Method

The processes for the fabrications of the single-crystal Ni-Mn-Ga particles via mechanical crushing have been described in detail elsewhere [42,43]. In brief, the intrinsic embrittlement of the Ni-Mn-Ga alloy allows the polycrystalline HT alloys to be mechanically crushed into single-crystal particles with polygon morphologies by using (1) a mechanical crushing method or (2) a stress-assisted thermal crushing method. Some results of this single-crystal series study have been published elsewhere [43].

2.2.2. Obtaining Single-Crystal Ni-Mn-Ga Cubes and Plates by a Floating-Zone Method

Another method, which is a widely used technique for the fabrication of single-crystal materials, named as (3) floating-zone (FZ) technique, was used for the fabrication of the single-crystal Ni-Mn-Ga cubes and plates in this work. For the details of the FZ processes, please refer to the published articles [44,45]. In brief, the as-cast ingots were combined together by a high-temperature arc-melting again to obtain the polycrystalline Ni-Mn-Ga alloys with a stick-structure. These stick-structured alloys were then used as a feed ingot (~8 cm) and a seed ingot (~3 cm) in the FZ technique. The feed and seed ingots were then re-melted in a high-purity Ar atmosphere-filled chamber with a constant growth rate (i.e., travel rate of the shafts) of 5 mm h−1 along with a rotation rate of 30 rotation min−1. The high-purity Ar gas has been kept inserting at a flow rate of 0.2 L min−1 into the FZ chamber during the high-temperature process, and the chamber pressure has been kept at 0.4 MPa during the entire FZ process.
The single-crystal Ni-Mn-Ga alloys with different shapes and dimensions were then sliced down from the FZ-treated alloys by using an electro-discharge machine (EDM). Alloys with the dimensions of approximately 1 × 1 × 1 mm3 (single-crystal Ni-Mn-Ga cubes) and 6.6 × 6.0 × 1.7 mm3 (single-crystal Ni-Mn-Ga plate) specimens were prepared. Here, the 1 × 1 × 1 mm3 cubes are mainly for the measurements of the shape deformation under a compressive or a magnetic field, while the 6.6 × 6.0 × 1.7 mm3 plate specimen was essentially for the investigations of the training effect on the magnetic field-induced MVR. The usages of the single-crystal alloys are described in detail in the following sections. The normal directions on the faces of prismatic single-crystal Ni-Mn-Ga cubes and plate were nearly parallel to the [100]p, [010]p, and [001]p of the parent phase (L21), respectively. Here, please note that the coordination was determined based on the high-temperature austenite parent phase. Therefore, the near-{100}p single-crystal Ni-Mn-Ga alloys were prepared, where the subscript of “p” indicates the parent austenite phase. The single-crystal Ni-Mn-Ga alloys with different dimensions were then mechanically polished and cleaned.

2.3. Fabrication of Single-Crystal Ni-Mn-Ga Alloy(s)/Polymer Composites

For the fabrications of the single-crystal Ni-Mn-Ga alloy(s)/polymer composites, two polymers, such as epoxy resin and silicone rubber, were chosen as the polymer matrix. The epoxy resin and silicone rubber are abbreviated as “epoxy” and “silicone” in this article, respectively, unless otherwise specified. Both the polymers are thermoset polymers. The details of the fabrication processes of these (1) pure epoxy, (2) pure silicone, and (3) Ni-Mn-Ga alloy(s)/polymer composites are described in detail in the following Section 2.3.1, Section 2.3.2 and Section 2.3.3, respectively.

2.3.1. Fabrication of Pure Epoxy

The epoxy precursor (EPIKOTE 828; Westlake Epikote, TX, USA), which is composed of bisphenol, was used as the first polymer matrix. The corresponding hardener (TOHMIDE 280-B; Sanho Chemical Co., Ltd., Kaohsiung, Taiwan), which is composed of modified polyaminoamide, was used for the polymerization of the epoxy. The epoxy precursor and the hardener were initially homogeneously mixed manually in the ratio of 1 to 1 (wt.%) and then were well-mixed by using a hybrid mixer (HM-500, KEYENCE) automatically. In the automatic mixing, the program of 3 min of mixing and 1 min of degassing was conducted. The well-mixed epoxy precursor, which was in a slurry state, was immediately poured into an acrylic mold. The epoxy slurry was thereafter cured at RT under ambient for 24 h with a plastic lid covered on the mold to avoid air contact. The density of the pure epoxy was confirmed to be 1.10 g cm−3. At the same time, Yong’s modulus (E) and the flow stress (σ) are 200–800 MPa and 15–40 MPa, respectively. It is necessary to mention that the flow stress is higher than the stress for the martensite variant reorientation (σMVR) of approximately 1–5 MPa [44,45,46,47,48].

2.3.2. Fabrication of Pure Silicone

The silicone precursor (ELASTOSIL M8017; Wacker Asahikasei Silicone Co., Ltd., Tokyo, Japan) was used as the other polymer matrix. The corresponding hardener (CATALYST T40; Wacker Asahikasei Silicone Co., Ltd. Tokyo, Japan) was used for the polymerization of the silicone. The silicone precursor and the hardener were homogeneously mixed in the weight ratio of 25 to 1 (i.e., silicone precursor: hardener = 25:1 (wt.%)) manually and then were well-mixed by using a hybrid mixer automatically. Similarly, in the automatic mixing, the program of 3 min of mixing and 1 min of degassing was conducted. The well-mixed silicone precursor, which was in a slurry state, was immediately poured into a mold-release agent-applied acrylic mold. The silicone slurry was, thereafter, cured at RT under ambient for 24 h with a plastic lid covered on the mold to avoid an air contact. The density of the pure silicone was confirmed to be 1.27 g cm−3. Young’s modulus (E) and the flow stress (σ) are 2–4 MPa and <3 MPa, respectively. It is necessary to mention that the flow stress is around the stress for the martensite variant reorientation (σMVR) of approximately 1–5 MPa [44,45,46,47,48].

2.3.3. Fabrications of Single-Crystal Ni-Mn-Ga Cube(s)/Polymer Composites

Proceeding to this single-crystal Ni-Mn-Ga alloy series [42,43,44,45], some of the new specimens were designed and fabricated, and the processes are stated as follows. The single-crystal {100}p Ni-Mn-Ga alloys and the polycrystalline Ni-Mn-Ga alloys (i.e., the HT alloys), which are stated in Section 2.1 and Section 2.2, were used for the fabrications of various composites in this section.
The semi-liquid polymer slurries, which are described in Section 2.3.1 and Section 2.3.2, were prepared and poured into the acrylic mold to prepare the composite materials. Thereafter, the Ni-Mn-Ga cube(s) or plate were also embedded into the center of the mold release agent applied acrylic mold as described in Section 2.3.1 and Section 2.3.2. The composite material, which was composed of the Ni-Mn-Ga cube(s) or plate and the polymer slurry, was then covered by a plastic lid to prevent them from contacting the air, and the composite material was cured at RT under ambient for 24 h. Specimens with various designs were prepared in this study; for the preparation procedures, please refer to the following descriptions for each specimen. Additionally, for the illustrations of each specimen, please refer to Figure 1.
(Specimen1) The 13 vol.% {100}p single-crystal Ni-Mn-Ga cube/epoxy composite: The composite material was taken out of the mold after 24 h temperature curing process, and the redundant epoxy was shaped into a cubic structure, making the vol.% of the single-crystal Ni-Mn-Ga cube to the epoxy matrix equals to 13 vol.% (i.e., Ni-Mn-Ga cube: epoxy = 13:87 (vol.%)). This composite material was denoted as “13 vol.% {100}p single-crystal Ni-Mn-Ga cube/epoxy composite”. Specimen1 was mainly used for the evaluations of shape deformation behavior via the in situ compression test or the in situ magnetic field applied examinations.
(Specimen2) The 30 vol.% {100}p single-crystal Ni-Mn-Ga cube/silicone composite: Similar to the aforementioned procedures, another {100}p single-crystal Ni-Mn-Ga cube was embedded into the silicone matrix via exact same procedures as described in Specimen1. Please note that this time, instead of the epoxy matrix, silicone was used as the matrix. The composite material was then taken out of the acrylic mold, and the silicone was shaped into a cubic structure while the vol.% of the {100}p single-crystal Ni-Mn-Ga cube to the silicone matrix equals 30 vol.% (i.e., Ni-Mn-Ga cube: silicone = 30:70 (vol.%)). This composite material was denoted as “30 vol.% {100}p single-crystal Ni-Mn-Ga cube/silicone composite”. Specimen2 was mainly used for the evaluation of the dependence of the crystallographic orientation on the behavior of the magnetic field-induced MVR.
(Specimen3) The 20 vol.% two Ni-Mn-Ga cubes/silicone composite: Two cubes, which are one {100}p single-crystal and one polycrystal, were used in the silicone-based composite. Here, the single-crystal is defined as an “active” material, while the polycrystal is defined as an “inactive” material. Please note that the “inactive” definition of the polycrystal is owing to its almost zero shape deformation due to the limited twin motions inhibited by the grain boundaries. Similar to the aforementioned procedures, two different Ni-Mn-Ga cubes were embedded into the silicone matrix via exactly the same procedures. The two-cube composed composite material was taken out of the acrylic mold, and the silicone matrix was shaped into a rectangular structure while the vol.% of the Ni-Mn-Ga cubes to the silicone matrix equals 20 vol.% (i.e., two Ni-Mn-Ga cubes: silicone = 20:80 (vol.%)). This composite material was therefore denoted as “20 vol.% two Ni-Mn-Ga cubes/silicone composite”. Specimen3 was mainly used for the evaluation of the in situ compressive stress-induced shape deformation for the analysis of the interactions between these two-alloy cubes.
(Specimen4) The 25 vol.% two Ni-Mn-Ga cubes/silicone composite: Similar to Specimen3, two cubes, which are one {100}p single-crystal Ni-Mn-Ga cube and one polycrystalline Ni-Mn-Ga cube, are embedded in the silicone-based composite. Again, as aforementioned, the single-crystal is an active material, while the polycrystal is an inactive material. Similar to the aforementioned synthesis procedures, two Ni-Mn-Ga cubes were embedded into the silicone matrix via exactly identical procedures. The as-cured two-cube composed composite material was taken out of the mold, and the silicone matrix was shaped into a rectangular structure while the vol.% of the overall Ni-Mn-Ga cubes to the silicone matrix equals 25 vol.% (i.e., two Ni-Mn-Ga cubes: silicone = 25:75 (vol.%)). This composite material was thus denoted as “25 vol.% two Ni-Mn-Ga cubes/silicone composite”. Specimen4 was mainly used for the evaluation of the in situ magnetic field (3.3 kOe) induced shape deformation for the analysis of the interactions between these two cubes.
(Specimen5) The 50 vol.% {100}p single-crystal Ni-Mn-Ga plate/silicone composite: The relatively large Ni-Mn-Ga plate (i.e., the 6.6 × 6.0 × 1.7 mm3 plate specimen as described in Section 2.2.2) was used for the fabrication of the 50 vol.% {100}p single-crystal Ni-Mn-Ga plate/silicone composite. Similar to Specimen1 and Specimen2, the single-crystal Ni-Mn-Ga plate was embedded in the silicone matrix via conducting exactly identical integration procedures. The as-cured composite material was taken out of the mold, and the silicone matrix was shaped into a rectangular structure while the vol.% of the {100}p single-crystal Ni-Mn-Ga plate to the silicone matrix equals 50 vol.% (i.e., Ni-Mn-Ga plate: silicone = 50:50 (vol.%)). This composite material was thus denoted as “50 vol.% {100}p single-crystal Ni-Mn-Ga plate/silicone composite”.
In this section, five different but similar procedures for the preparations of five specimens are described as above-mentioned. The illustrations of each specimen as well as the measurements and analysis to which the specimens were subjected are summarized in Figure 1. In addition, the illustration of the overall fabrication processes of the composite materials is shown in Figure 2.

2.4. Measurements and Analysis

2.4.1. Recording 3D Images via a Micro CT

The in situ measurements of the micro-computed tomography (micro CT; ScanXmate-E090, Comscantecno Co. Ltd., Yokohama, Japan) were conducted while two different fields were applied, one is a compressive field (σ-field), and the other one is a magnetic field (H-field). The micro CT instrument, which was confirmed to be applicable for the observations of the shape change in our previous article [42,43], was used for the recording of the 3D microstructures of the composite materials. Details of the settings of the micro CT and the settings of the specimen under two different fields were also stated in our previous publication [42,43]. In brief, on the one hand, for the in situ measurements of the compression tests, a lab-made compression holder was used for the compression of the specimens. The in situ microstructures were thus recorded while the compressive field was applied to the specimens. The entire setting of the compression holder and specimen was placed on the rotation stage in the main chamber of the micro CT. On the other hand, for the in situ measurements of the magnetic field-induced shape deformation, a magnet was attached to the specimen, and the overall setting was placed on the rotation stage in the micro CT main chamber while conducting the micro CT recording.

2.4.2. Compression Tests

To analyze the mechanical properties of the composite materials, the compression tests were conducted by using a universal testing machine (Shimadzu Autograph AG-IS, Shimadzu Co. Ltd., Kyoto, Japan) at RT under ambient. The compression tests were performed until the 3% overall strain of the composite material at a constant strain rate of ~2 × 10⁻⁴ s−1. Details of the settings and some photos of the settings for the compression tests can be found in references [42,43].

2.4.3. Magnetic Properties

The magnetization-magnetic field (M-H) curves of the composite materials were conducted by using a vibrating sample magnetometer (VSM; TM-VSM1530-HGC-D, Tamagawa Co. Ltd., Sendai, Japan) at RT under ambient. The scanning window of the magnetic field (H-field) was in the range of ±10 kOe at a scan rate of 0.2 kOe s−1. Prior to the measurements of the M-H curves of the composite materials, a standard Ni cube possessing a dimension of approximately 2 × 2 × 2 mm3 was utilized for the calibration of VSM.
In addition to the aforementioned M-H curve measurements without the rotation of the electromagnets, the electromagnets in VSM were further rotated for the measurements of the crystallographic direction-dependent magnetic properties of both the (1) {100}p single-crystal Ni-Mn-Ga cube and the (2) Specimen2 (i.e., the 30 vol.% {100}p single-crystal Ni-Mn-Ga cube/silicone composite). Illustrations of the side-view of the settings of VSM and specimens are shown in Figure 3a, and the zoomed-in figure of the specimen with certain crystallographic directions of <100>p, <110>p, and <111>p, respectively, are shown in Figure 3b. The two examples of the top-view of the 45o rotated setting (i.e., H-field//<110>p) and 54.7° rotated setting (i.e., H-field//<111>p) in Figure 3b are demonstrated in Figure 3c,d, respectively. Figure 3c displays the relationship between <100>p and <110>p, while Figure 3d exhibits the relationship between <100>p and <111>p. Symbols of “H” or “H-field” in the illustrations indicate the direction of the externally applied magnetic field. Here, please note that the angle θ was defined as 0° as the base angle, and the angles of various crystallographic directions are defined based on the 0° of <100>p. In addition to the specific angles illustrated in Figure 3c,d, for analyzing the correspondence of the crystallographic direction and the magnetic properties (i.e., the magnetic field induced MVR) in detail, the electromagnets were rotated every 5° in the range of both 0–45° for rotating from <100>p to <110>p (Figure 3c) and 0–54.7° for rotating from <100>p to <111>p (Figure 3d) for each measurement.

2.4.4. Pole Figures

Prior to the embedment of the Ni-Mn-Ga alloys into the polymer matrix, the orientation of the single-crystal Ni-Mn-Ga cube was confirmed by using an X-ray diffraction pole figure analysis (Ultima Ⅳ multipurpose X-ray diffraction system with Schülz method, Rigaku Co. Ltd., Tokyo, Japan). The CuKα was used as the X-ray source with the tube voltage and tube current at 40 kV and 40 mA, respectively. The 2θ = 44.1°, 62.5°, and 66.4° were served as the target angles for the planes of (202), (400), and (004). The scan ranges of the rotation angle (α) and tilt angle (β) were from α = 0° to 360° with a scan rate of 120° min−1 and from β = 0° to 75° with a scan rate of 5° per step, respectively. All the measurements were conducted under ambient at RT. All the crystal orientations of the single-crystal Ni-Mn-Ga alloys were confirmed to be near-{100}p specimens by using the pole figure analysis before the embedment of them into the polymer matrix as described in Section 2.3.3. Here, to simplify the expression, the “near-{100}p” is abbreviated as “{100}p” by excluding the phrase “near-”.

2.4.5. Effect of Training by a Magnetic Field on the MVR

The single-crystal {100}p Ni-Mn-Ga plate with the dimension of 6.6 × 6.0 × 1.7 mm3 as above-mentioned (i.e., Specimen5: 50 vol.% {100}p single-crystal Ni-Mn-Ga plate/silicone composite as previously mentioned) was used for the investigation of the training effect via a magnetic field on the MVR by scanning the magnetic field. During the training procedures, the magnetic field was applied externally in the range of 0–10 kOe. Overall, 10 cycles of magnetic field scanning were done on Specimen5 for the purpose of training. All the training procedures were conducted under ambient at RT. The corresponding M-H curves were used for the analysis of the behaviors before and after training.

3. Results and Discussion

In our previous publications [42,43,44], it was confirmed that the single-crystal Ni-Mn-Ga particles are composed of the single 5M-martensite phase. Additionally, it was also verified that the Ni-Mn-Ga alloys are in the state of the 5M-martensite at RT by using a thermal analysis; that is, the phase transformation temperature is higher than RT (i.e., the operation temperature). The Ni-Mn-Ga alloys (either in particle form or in cubic form) were also affirmed to be single-crystal materials [42,43]. Some preliminary analysis, such as pole figures for the identification of crystallographic orientation (i.e., {100}p single-crystal Ni-Mn-Ga cubes as mentioned in the experimental Section 2.4.4), mechanical properties, magnetic properties, and 3D microstructure via micro CT images, have been revealed in our previous publications [42,43]. The proceeding results in this study series are shown in this article.

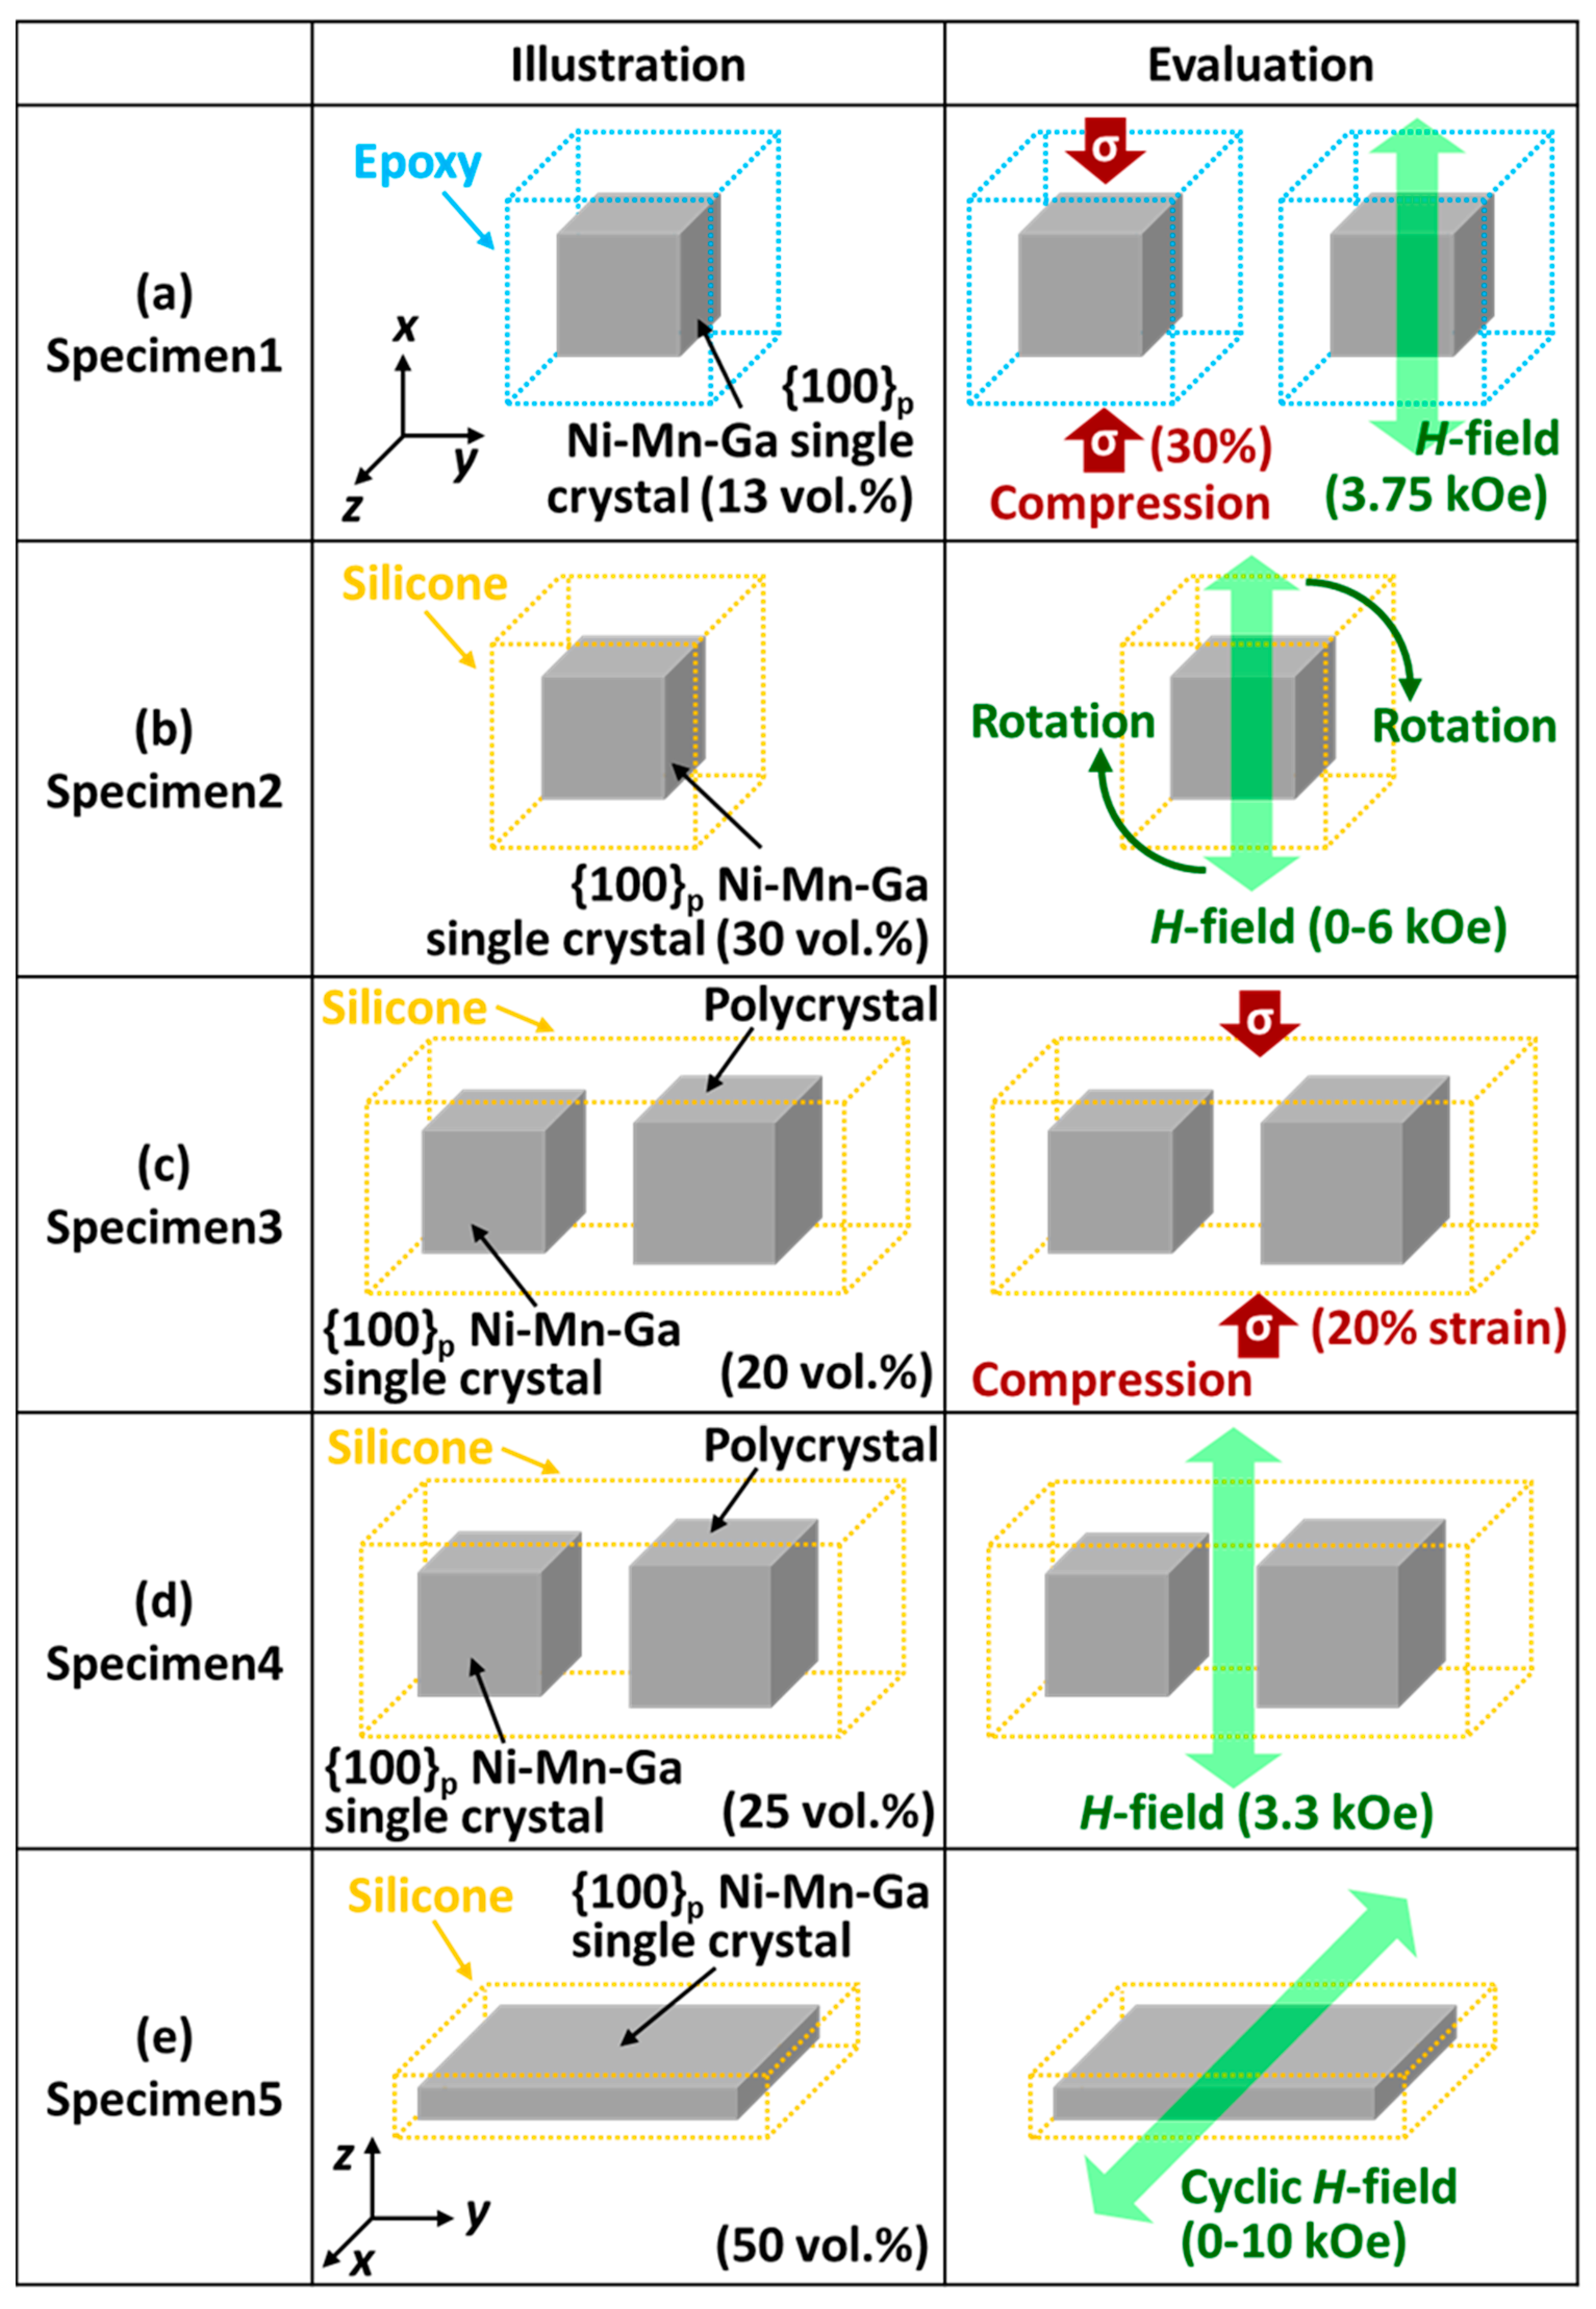
3.1. Deformation Behavior of the Single-Crystal Ni-Mn-Ga in the Polymer Matrix

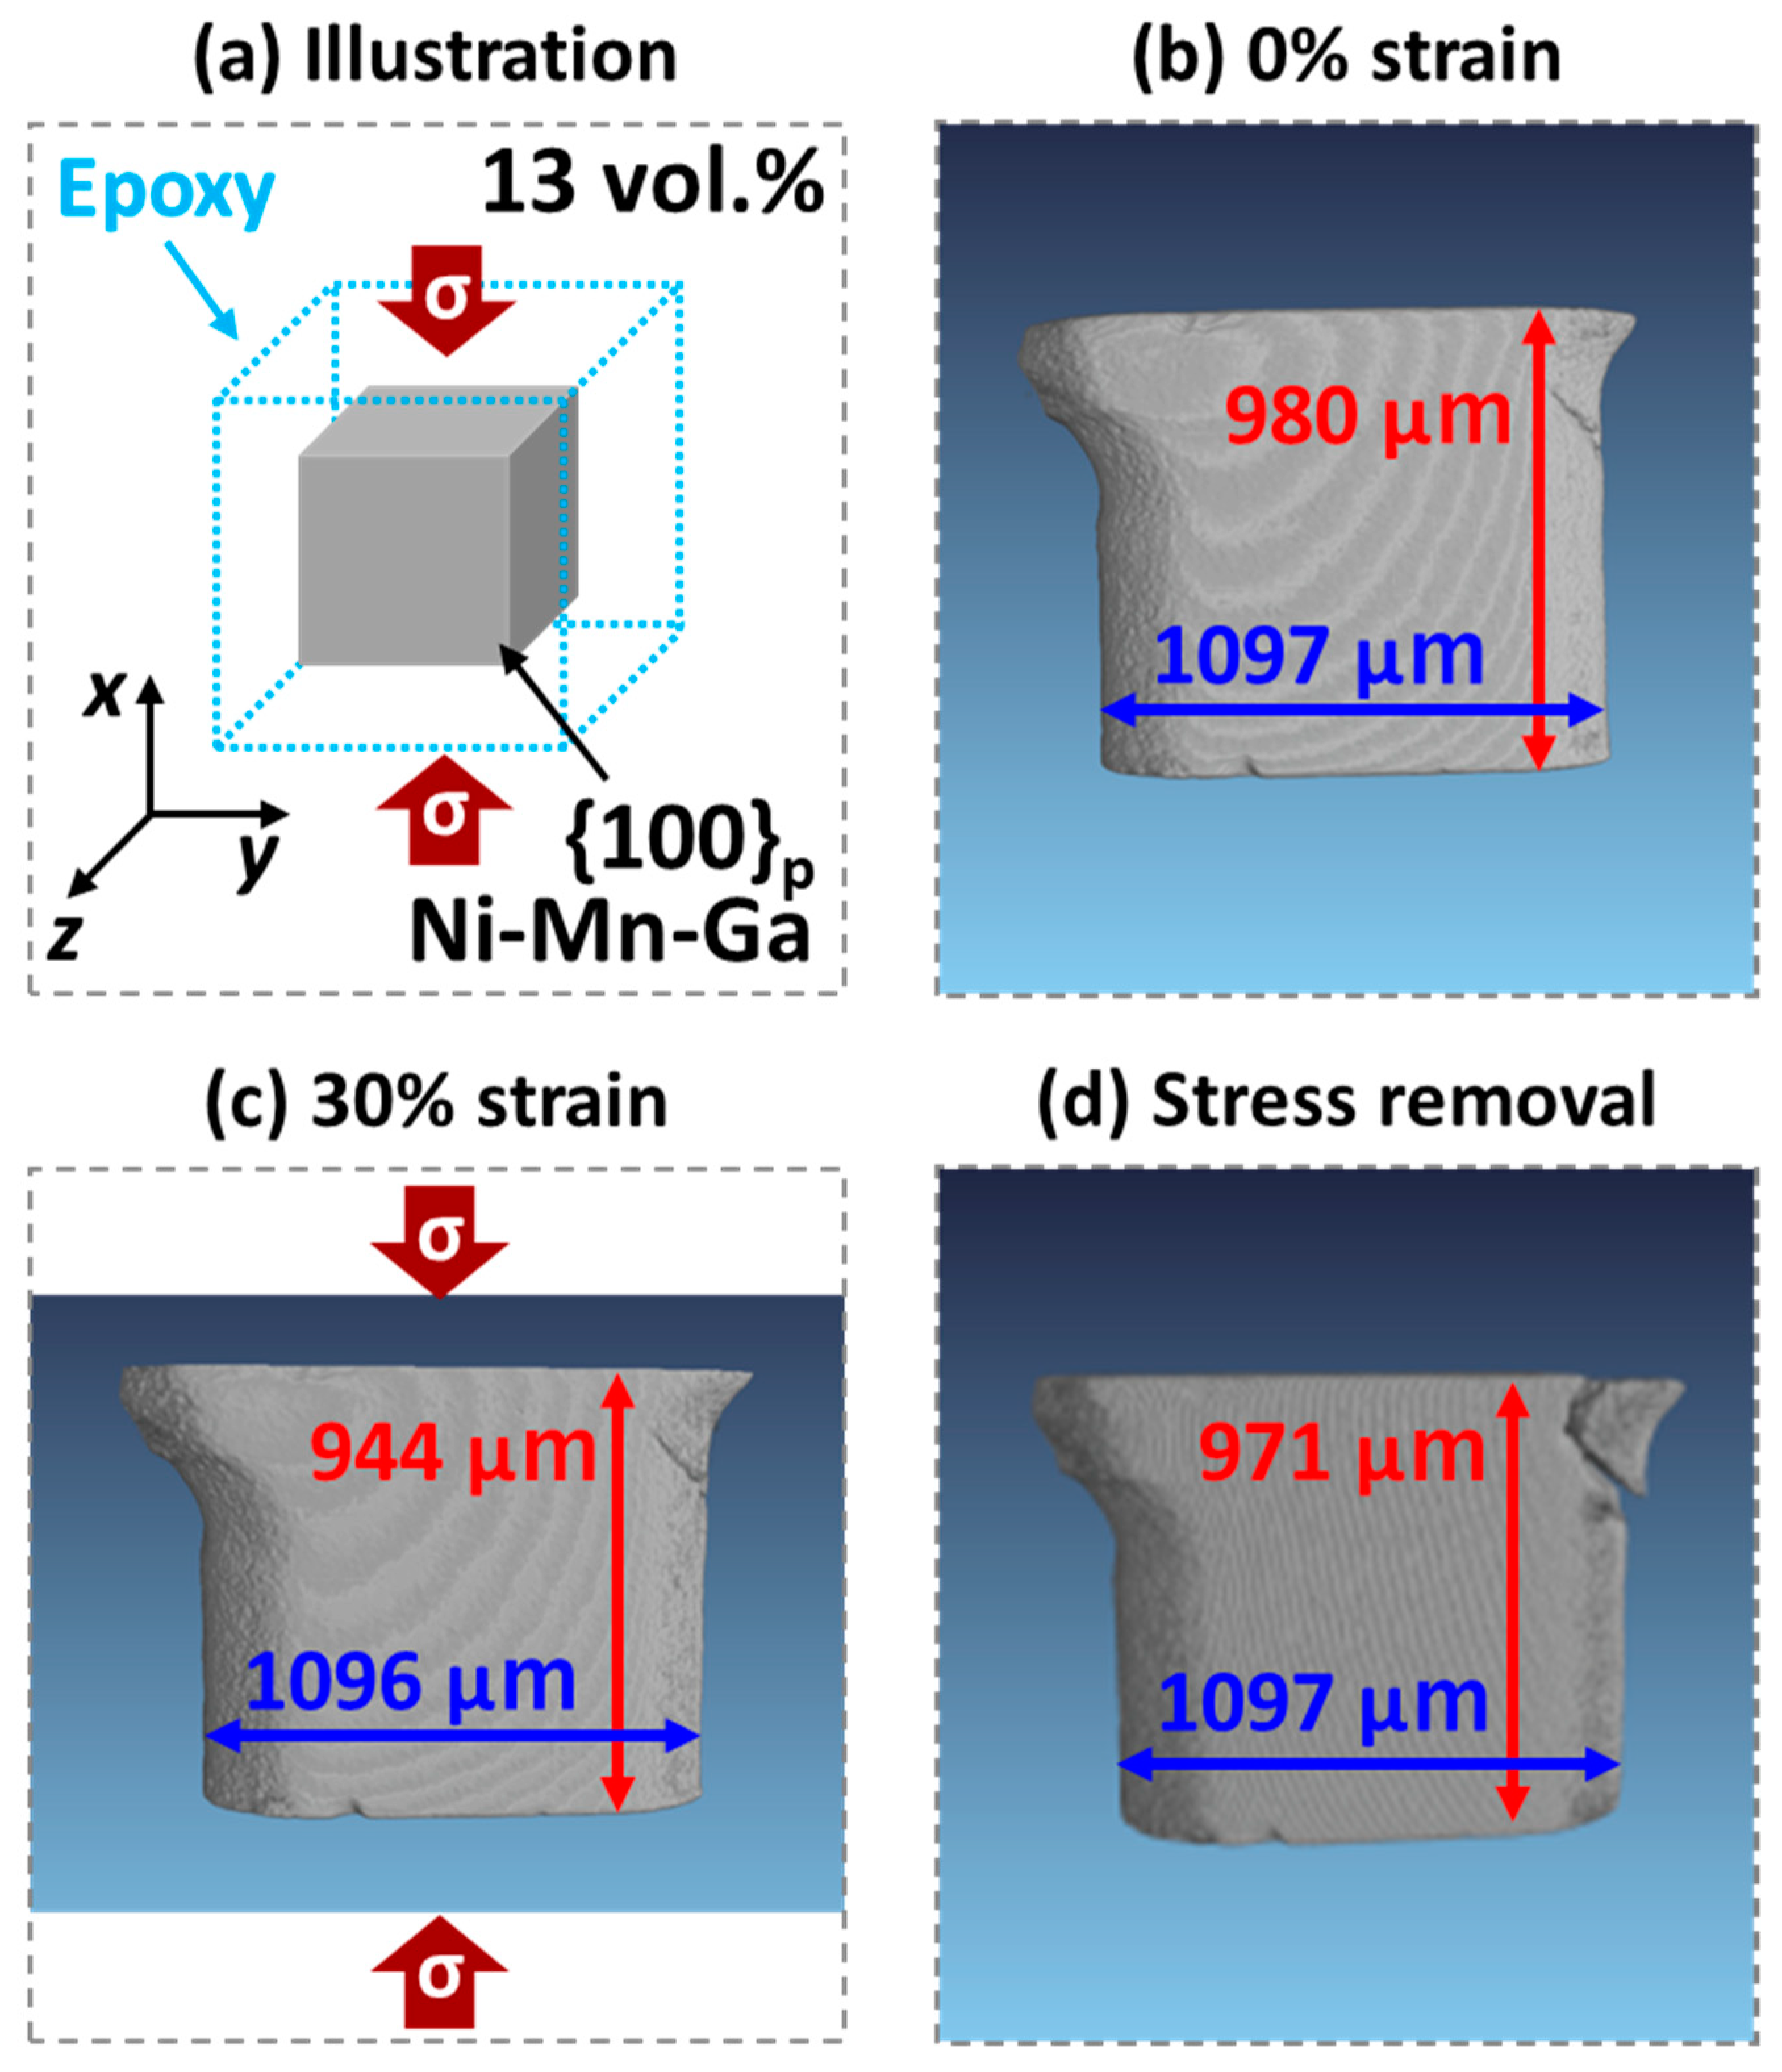
3.1.1. The 13 Vol.% {100}p Single-Crystal Ni-Mn-Ga Cube/Epoxy Composite

Shape Deformation Imposed by a Compressive Field

To achieve the applications for the actuators, it is important to investigate the shape deformation of the composite materials. Some evaluations for the magnetic field-driven and mechanical field-driven shape deformation behaviors of the composite materials are shown in this section, and some are shown in the following sections. Please note that in the compression tests, a 30% strain with respect to the overall composite material in the x-component (i.e., the height of the composite material in the x-axis, as shown in Figure 1) was applied to the composite material.
Figure 4 shows the deformation behaviors of the 13 vol.% {100}p single-crystal Ni-Mn-Ga cube/epoxy composite material (i.e., Specimen1) via the observation of its shape change by using a micro CT as a compressive strain was applied. It is necessary to mention that the volume percentage corresponds to the {100}p single-crystal Ni-Mn-Ga cube in the composite. An illustration of the 13 vol.% {100}p single-crystal Ni-Mn-Ga cube/epoxy composite and the compression direction is shown in Figure 4a. The micro CT images of the (b) before compression (i.e., 0% strain), (c) after compression (i.e., 30% strain), and (d) after removal of compressive strain are revealed in Figure 4, respectively. Here, please note that the percentage of compression indicates the percentage of the compressed strain of the overall height of the composite. As shown in Figure 4a, the compression direction was parallel to the normal direction of the {100}p of the single-crystal Ni-Mn-Ga cube (i.e., compressive strain//the <100>p as shown). The vertical red doubled arrows, and the horizontal blue doubled arrows indicate the length and width of the Ni-Mn-Ga cubes.
Judging from the micro CT images, it is found that after the 30% compression strain was applied to the composite, a contraction of 3.7% of the particle height was found (see Figure 4b,c). On the other hand, a shape recovery of 2.9% is found upon the removal of the externally applied compressive strain (see Figure 4c,d). That is, approximately 0.8% of residual strain was produced. It is necessary to mention that for the evaluations of each length, some markers on the Ni-Mn-Ga cube were specified and tracked before and after the compression strain was applied. On the one hand, the shape change could be attributed to the martensite variant reorientation (MVR) while the compressive strain was applied to the entire composite material; on the other hand, the shape recovery strain could be ascribed to the reverse MVR upon unloading [42,43,44,45,49,50]. It has been reported that the reverse MVR in the martensite Ni-Mn-Ga alloy during the unloading process was triggered by the elastic back stress brought about by the polymer matrix working on the Ni-Mn-Ga alloy [38,51].
In addition to the aforementioned micro CT image analysis, the Stress-Strain (S-S) curve of the 13 vol.% {100}p single-crystal Ni-Mn-Ga cube/epoxy composite material was also examined at RT under ambient and is shown in Figure 5. It is observed that the stress for the martensite variant reorientation (σMVR) was found to be less than 1 MPa, which was in good accordance with those of the literature [42,43,44,45,52,53]. After fully unloading, it was found that approximately 2.8% of the overall deformation strain remained. It was also reported that, to some extent, the residual strain remained in the composite materials after full unloading [36,54].

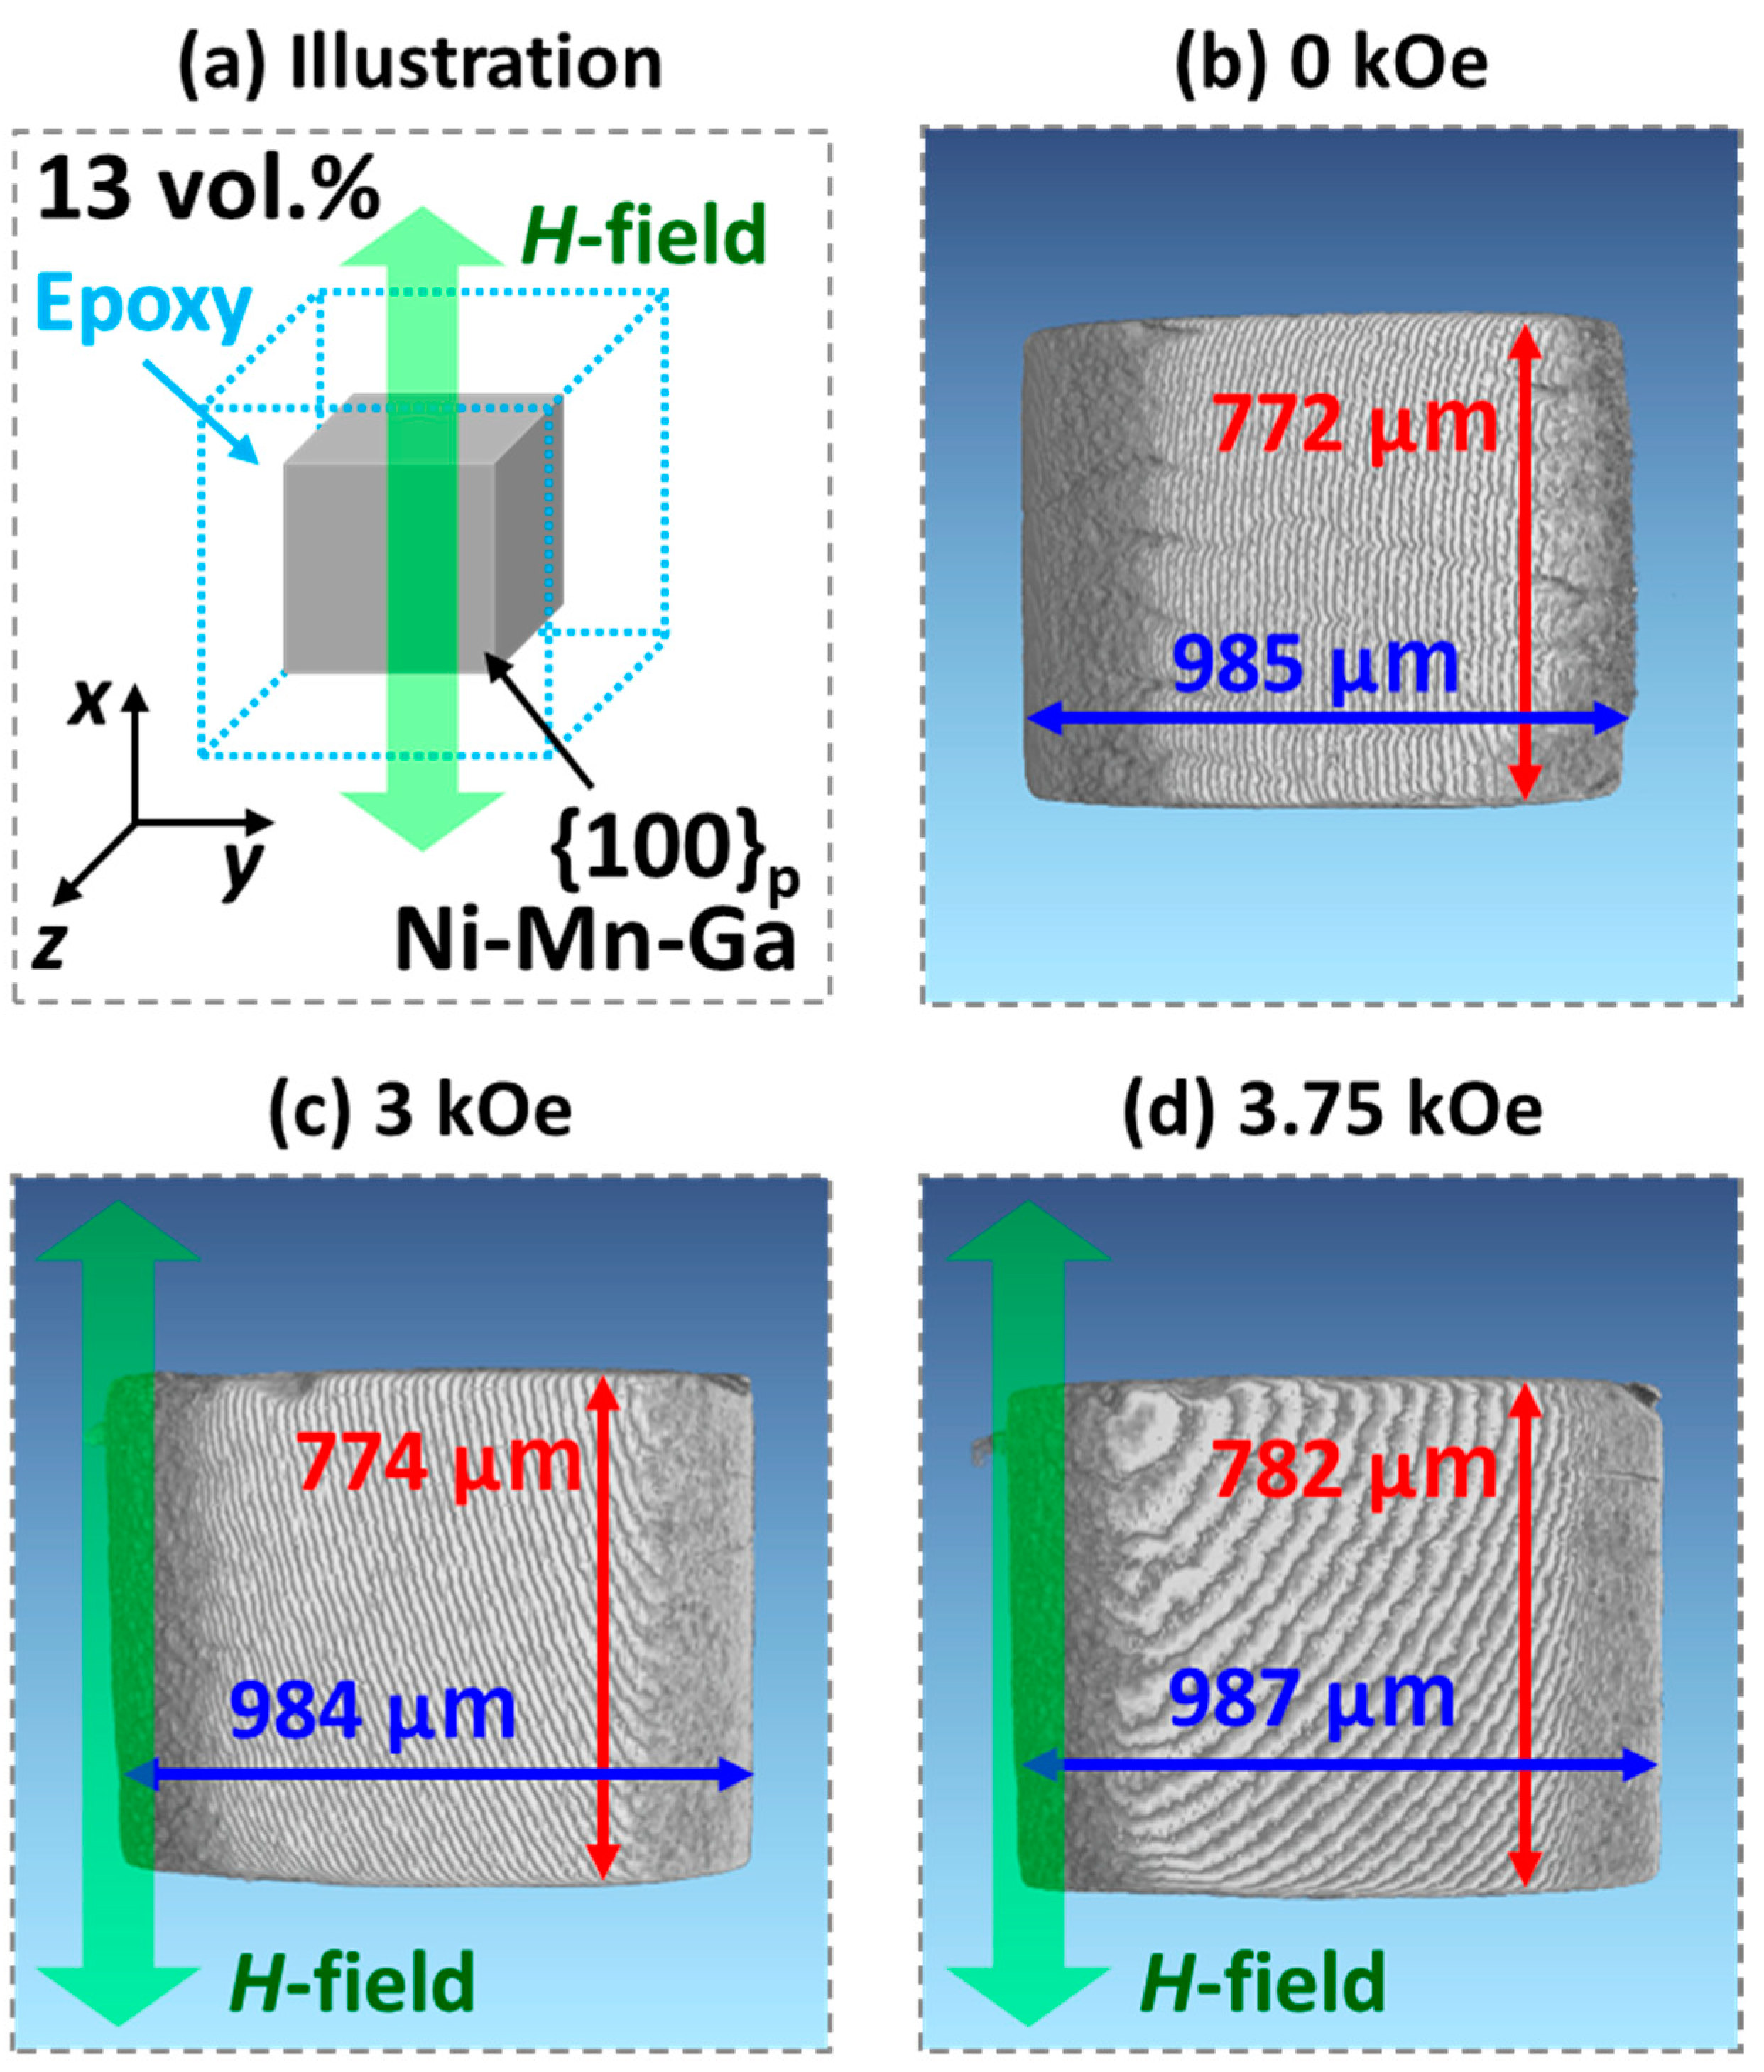
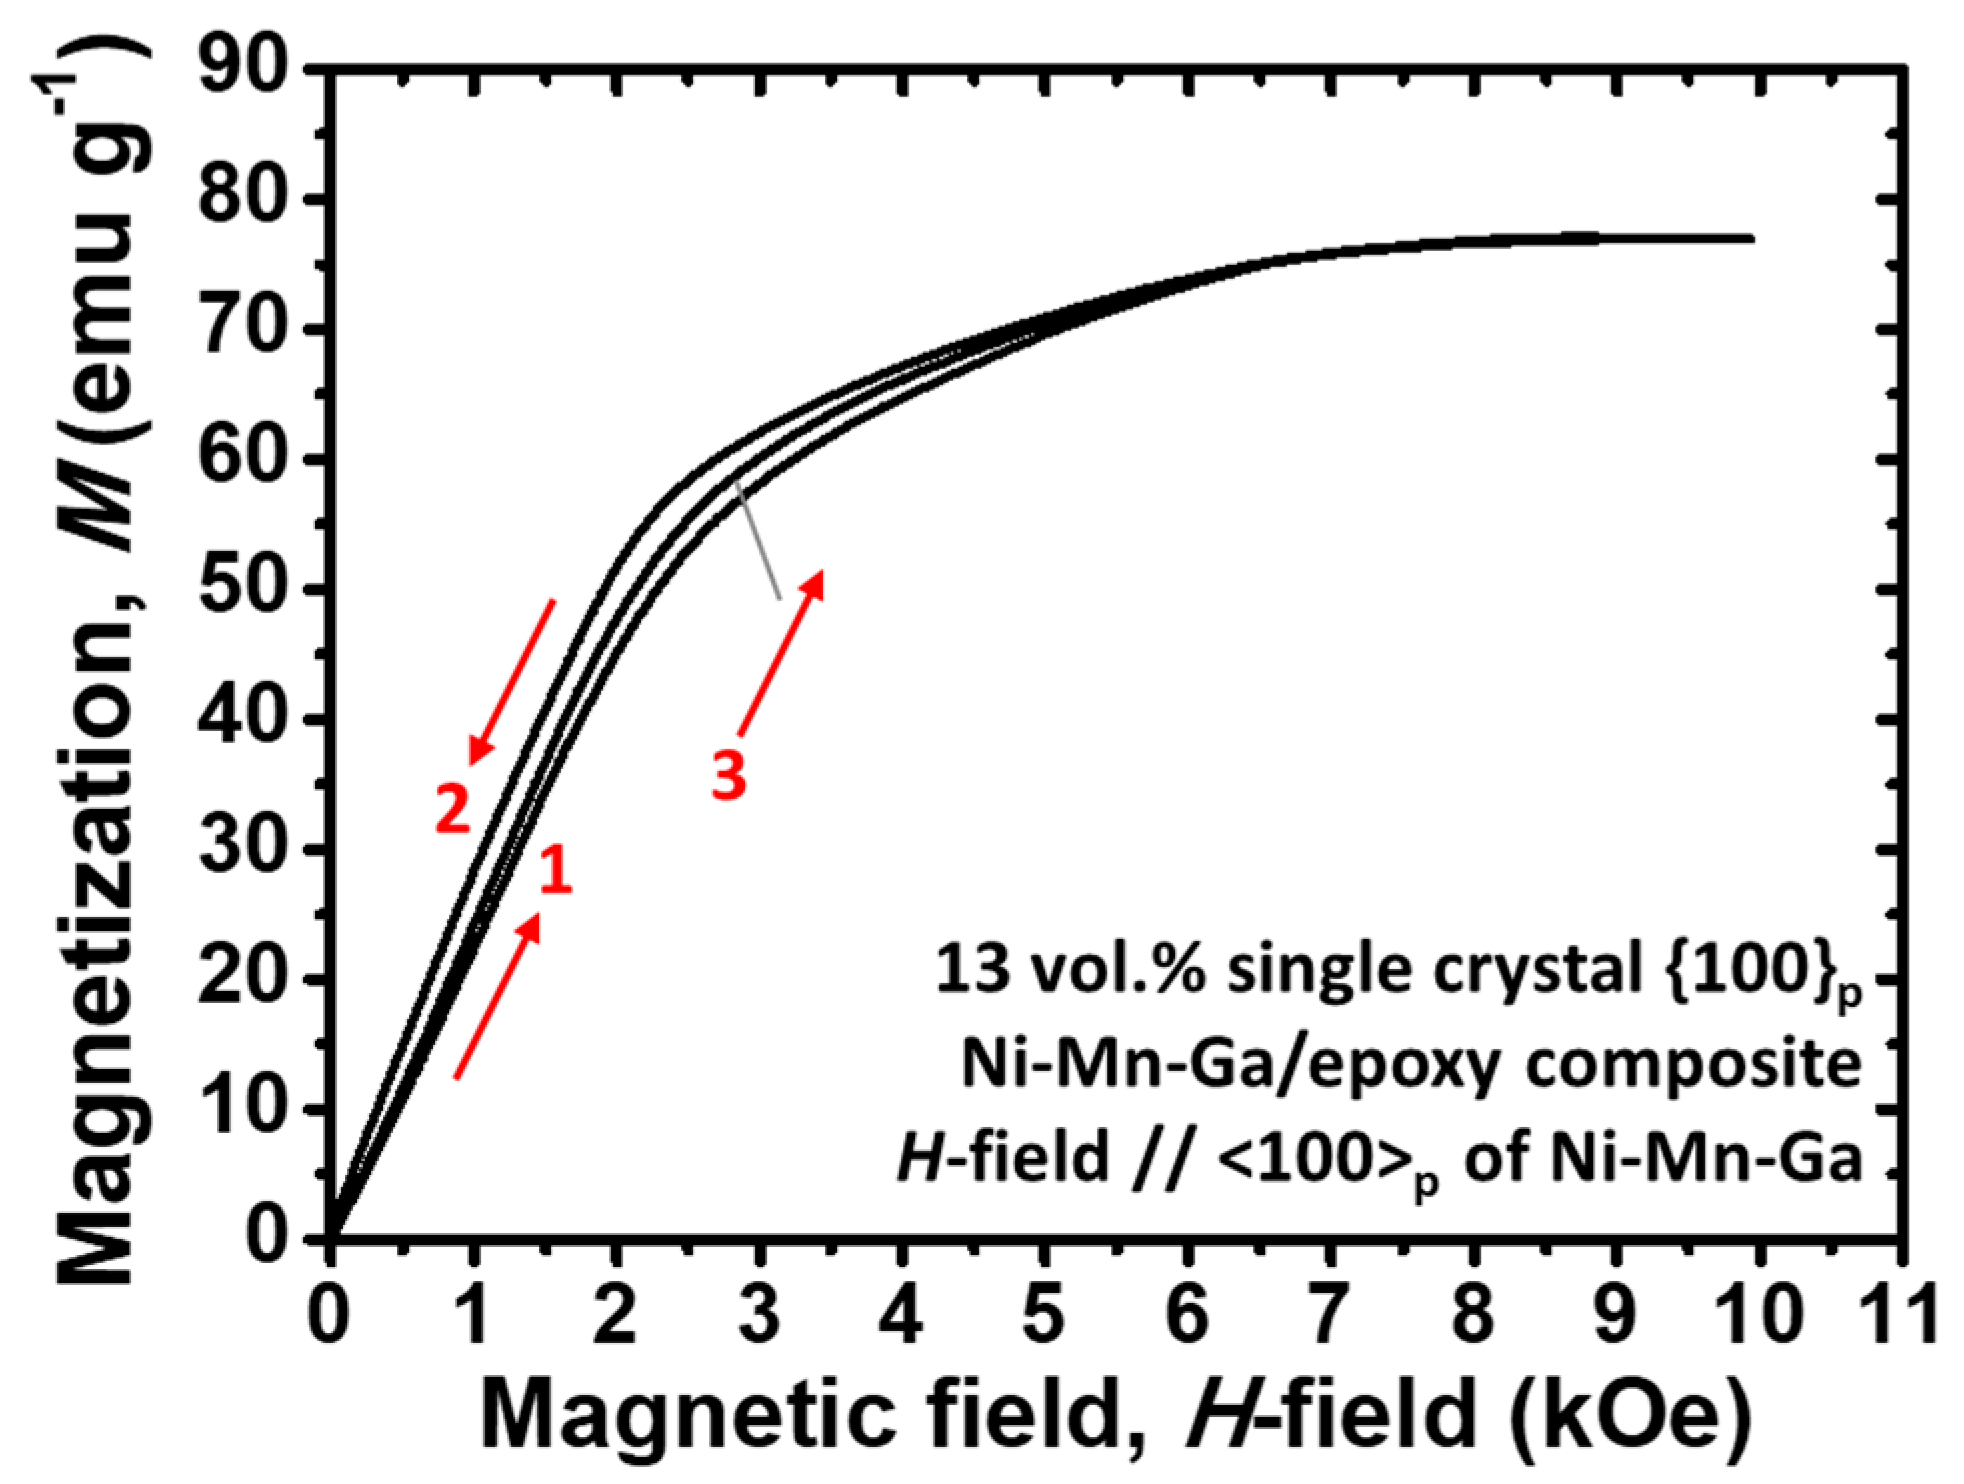
Shape Deformation Imposed by a Magnetic Field

In addition to the above-mentioned shape deformation caused by the introduction of a compressive field, the shape deformation behavior of the 13 vol.% {100}p single-crystal Ni-Mn-Ga cube/epoxy composite triggered by applying an externally applied magnetic field was also conducted. Similar to Section 3.1.1 the in situ shape deformation observations were recorded by using a micro CT while an external magnetic field was applied. In Figure 6a, an illustration is revealed to show the correlation between the composite material and the externally applied magnetic field (H-field). The applied magnetic field was along the <100>p of the {100}p single-crystal Ni-Mn-Ga cube. The micro CT images at (b) 0, (c) 3, and (d) 3.75 kOe of the magnetic field were recorded, respectively (Figure 6). The red vertical arrows and blue horizontal arrows suggest the lengths and widths of the {100}p single-crystal Ni-Mn-Ga cubes subjected to different magnitudes of an externally applied magnetic field, respectively.
Judging from the micro CT images, different from the compression tests as shown in Figure 4, hardly could any shape deformation be found while an external magnetic field was applied. The faint shape deformation could be attributed to the elastic constraint of the epoxy matrix, which inhibits the magnetic field-induced MVR; that is, the stress originates from the magnetoelastic coupling for the twin motion is less than the elastic stress from the epoxy matrix. Accordingly, merely a limited shape deformation could be found when the magnetic field was applied to composite material.
In addition to the in situ observations of the shape change by using the micro CT, the magnetization-magnetic field curve (M-H curve) of the 13 vol.% {100}p single-crystal Ni-Mn-Ga cube/epoxy composite (Specimen1) was also examined (Figure 7). The red arrows along with the numbers adjacent to them, suggest the scanning sequence of the magnetic field. It has been reported that an obvious “jump” of magnetization appears if the MVR takes place in the single-crystal Ni-Mn-Ga alloys [42,43,44,45]. Reversely, no magnetization jump could be found in the M-H curve of Figure 7; it is, therefore, determined that barely did the MVR take place when the externally applied magnetic field was introduced along <100>p of the {100}p single-crystal Ni-Mn-Ga cube in Specimen1 (for the relationship of the direction of magnetic field and the Ni-Mn-Ga cube, please refer to Figure 6a). It is necessary to mention that the results from the M-H curves are in good agreement with those of the results in the micro CT images (Figure 6). Additionally, it has been reported that the critical volume percentage of the single-crystal Ni-Mn-Ga alloy for the MVR is about 13 vol.% [44,45]. In other words, the MVR is restricted by the elastic stress of the epoxy surrounded; therefore, no MVR could be observed in this case. Hence, the results are also in good agreement with those in the literature [44,45].

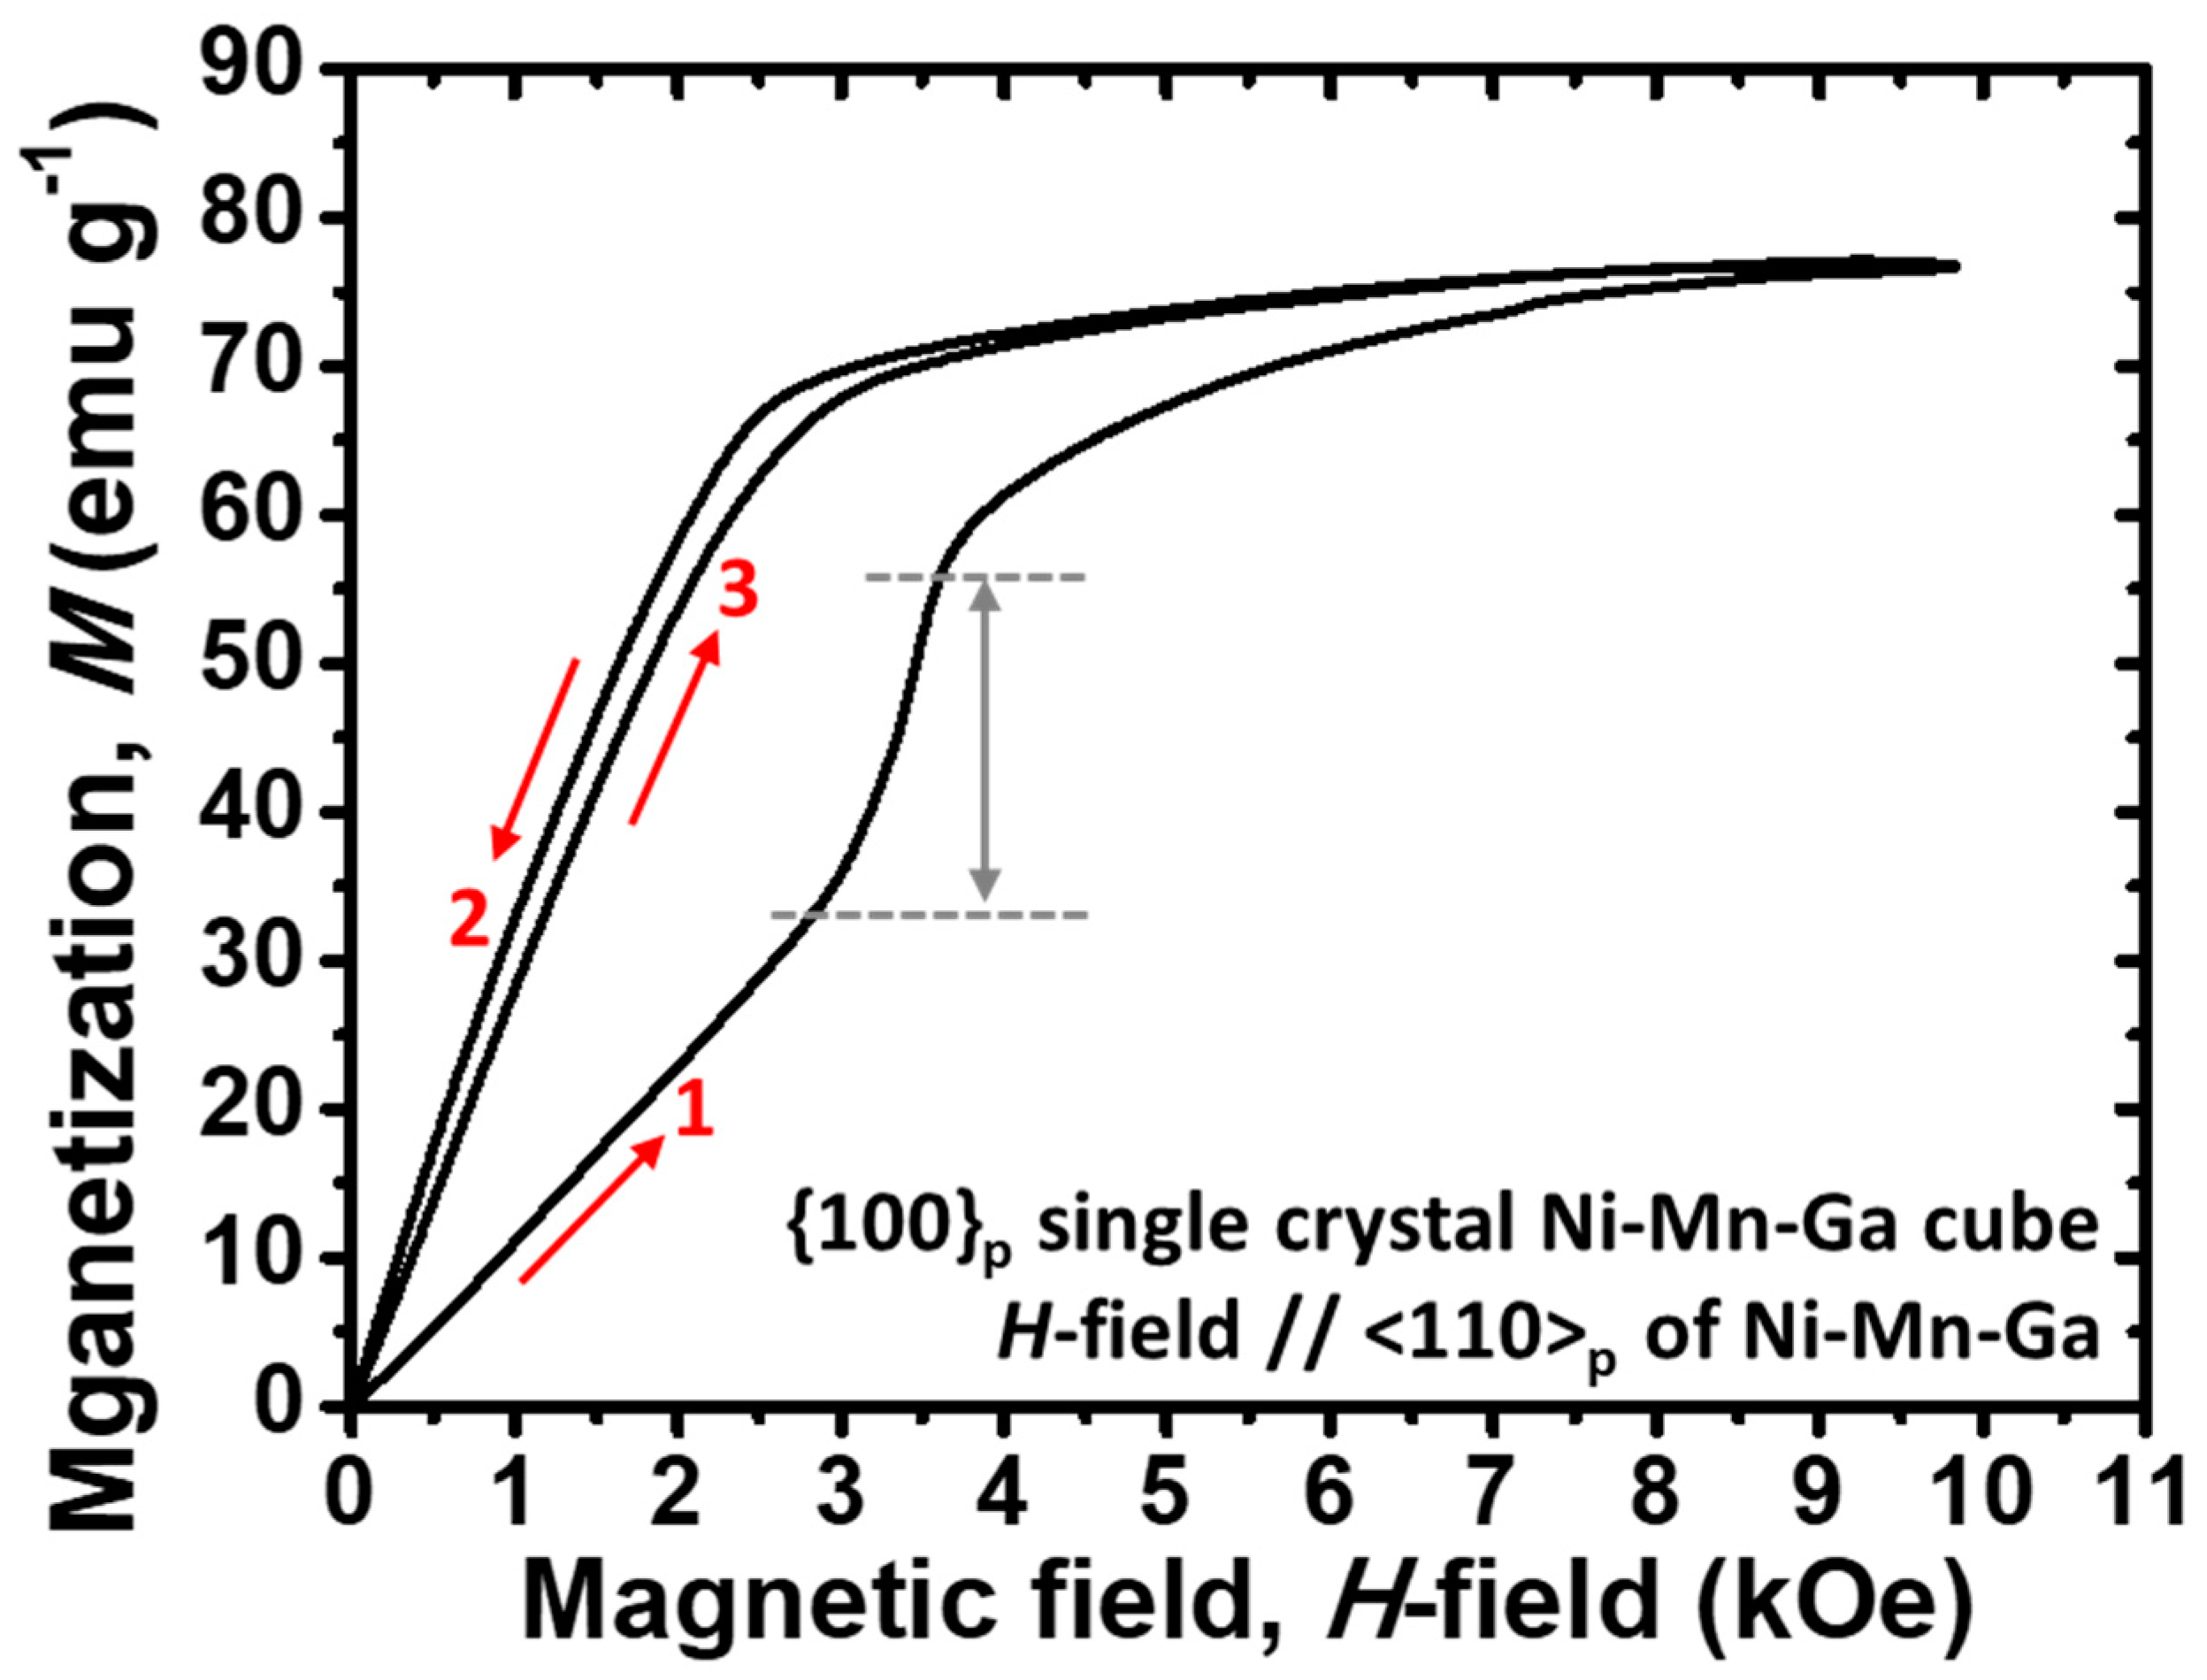
3.2. Martensite Variant Reorientation in the {100}p Single-Crystal Ni-Mn-Ga Cube

Prior to going into other composite materials, the {100}p single-crystal Ni-Mn-Ga cube was used for the analysis of the magnetic field-induced MVR as a preliminary result. In this section, the externally applied magnetic field was applied along with the direction of <110>p of the {100}p single-crystal Ni-Mn-Ga cube. Again, for the setting of the VSM measurement, please refer to the illustrations displayed in Figure 3. For example, here, for the measurement of the M-H curves of the {100}p single-crystal Ni-Mn-Ga cube in <110>p, the electromagnets were rotated 45° to align the magnetic field to the <110>p of the {100}p single-crystal Ni-Mn-Ga cube. The M-H curve of this measurement is shown in Figure 8. The red arrows, along with numbers, correspond to the scanning sequence of the magnetic field, while the horizontal dashed lines and the gray doubled-arrow indicate the sudden jump of magnetization, which is attributed to the magnetic field-induced MVR of the {100}p single-crystal Ni-Mn-Ga cube as a sufficient magnetic field was applied.
Different from the M-H curve of H-field//<100>p of the 13 vol.% {100}p single-crystal Ni-Mn-Ga cube/epoxy composite (Figure 7), in the case of the H-field//<110>p of the {100}p single-crystal Ni-Mn-Ga cube, the critical magnetic field for the commencement of MVR of the single-crystal Ni-Mn-Ga cube is determined to be around 2.8 kOe as shown in Figure 8. Nevertheless, it is well-known that the stress for the twin motion varies with the crystallographic direction; therefore, the critical magnetic field for the twin motion also differs. Besides, in the case of the single-crystal, there is no elastic inhibition from the epoxy matrix surrounded; hence, an obvious MVR was found (i.e., the range within the two horizontal dashed lines). The twin motion only takes place as the stress for the twin motion could overcome the constraint among specific variants.
For figuring out the correlation between the magnetic field and the crystallographic direction, an illustration showing these two parameters is shown in Figure 9a. Symbols H and M indicate the magnetic field and the magnetization, respectively, while symbols γ and θ suggest the angle difference of the magnetic field and magnetization to the easy axis (i.e., c-axis) of the Ni-Mn-Ga alloy. Therefore, based on Figure 9a, the Zeeman energy (EZeeman) could be formulated as
E Z e e m a n = μ 0 M H c o s ( γ θ )
where μ0 is permeability, M is magnetization, H is a magnetic field, γ is the angle between the easy axis of the single-crystal Ni-Mn-Ga alloy and the applied magnetic field, and θ is the angle between the easy axis of the single-crystal Ni-Mn-Ga alloy and the magnetization.
The magnetocrystalline anisotropic energy (MAE; EMAE) could be formulated as
E M A E = K u s i n 2 θ
where Ku is the magnetic anisotropy constant, and θ is the angle between the easy axis of the single-crystal Ni-Mn-Ga alloy and the direction of magnetization, M. To sum up, the overall energy could be written as
E t o t a l = μ 0 M H c o s ( γ θ ) + K u s i n 2 θ
The EZeeman and the EMAE are also indicated in Figure 9a by using the dotted curves, respectively. Based on the aforementioned equations, the equilibrium angle θ could be determined by using
E t o t a l θ = μ 0 M H ( c o s γ s i n θ + s i n γ c o s θ ) + 2 K u s i n θ c o s θ = 0
In addition, the three variants of the 5M-martensite Ni-Mn-Ga alloys are shown in Figure 9b. The crystallographic direction, which is depicted by bright, bold green lines, corresponds to the easy axis (i.e., c-axis) of the 5M-martensite Ni-Mn-Ga alloys. Three variants are denoted as Variant1, Variant2, and Variant3, respectively, in Figure 9b. Accordingly, the energy of each variant could be defined as EVariant1, EVariant2, and EVariant3, respectively. Hence, the energy difference between two different specific variants (ΔE) could be formulated as
Δ E = E M E N
where the EM and EN correspond to the energy of two different specific variants of M and N, respectively. Hence, by using the energy difference in Equation (5), the shear stress (τ) for the movement of the twin boundary of the specific plane of {110}p in the 5M Ni-Mn-Ga alloy could be expressed by
τ = Δ E s
where s indicates the shear strain of 0.12 [55].
As mentioned previously, in Figure 9b, three variants of the 5M-martensite phase are indicated. The easy axis of each variant, which is the c-axis highlighted by a bright green bold line, is pointed out by the bright green arrows. The twin boundary of Variant1 and Variant2, whose zoomed-in figure is shown on the right-hand side, are also pointed out by black arrows. Figure 9b illustrates the state of the variants without externally applied compressive stress, while Figure 9c displays the state of the variants with externally applied compressive stress (i.e., two red arrows with symbols of σ). Once the shear stress written as Equation (6) goes beyond the critical shear stress for MVR, the twin motions take place, and the variant configuration transforms from Figure 9b to Figure 9c. In the twin motion caused by the externally applied compressive stress, Variant1 increases by consuming Variant2 and Variant3. The calculated results based on the aforementioned equations are shown in the following Section 3.3.

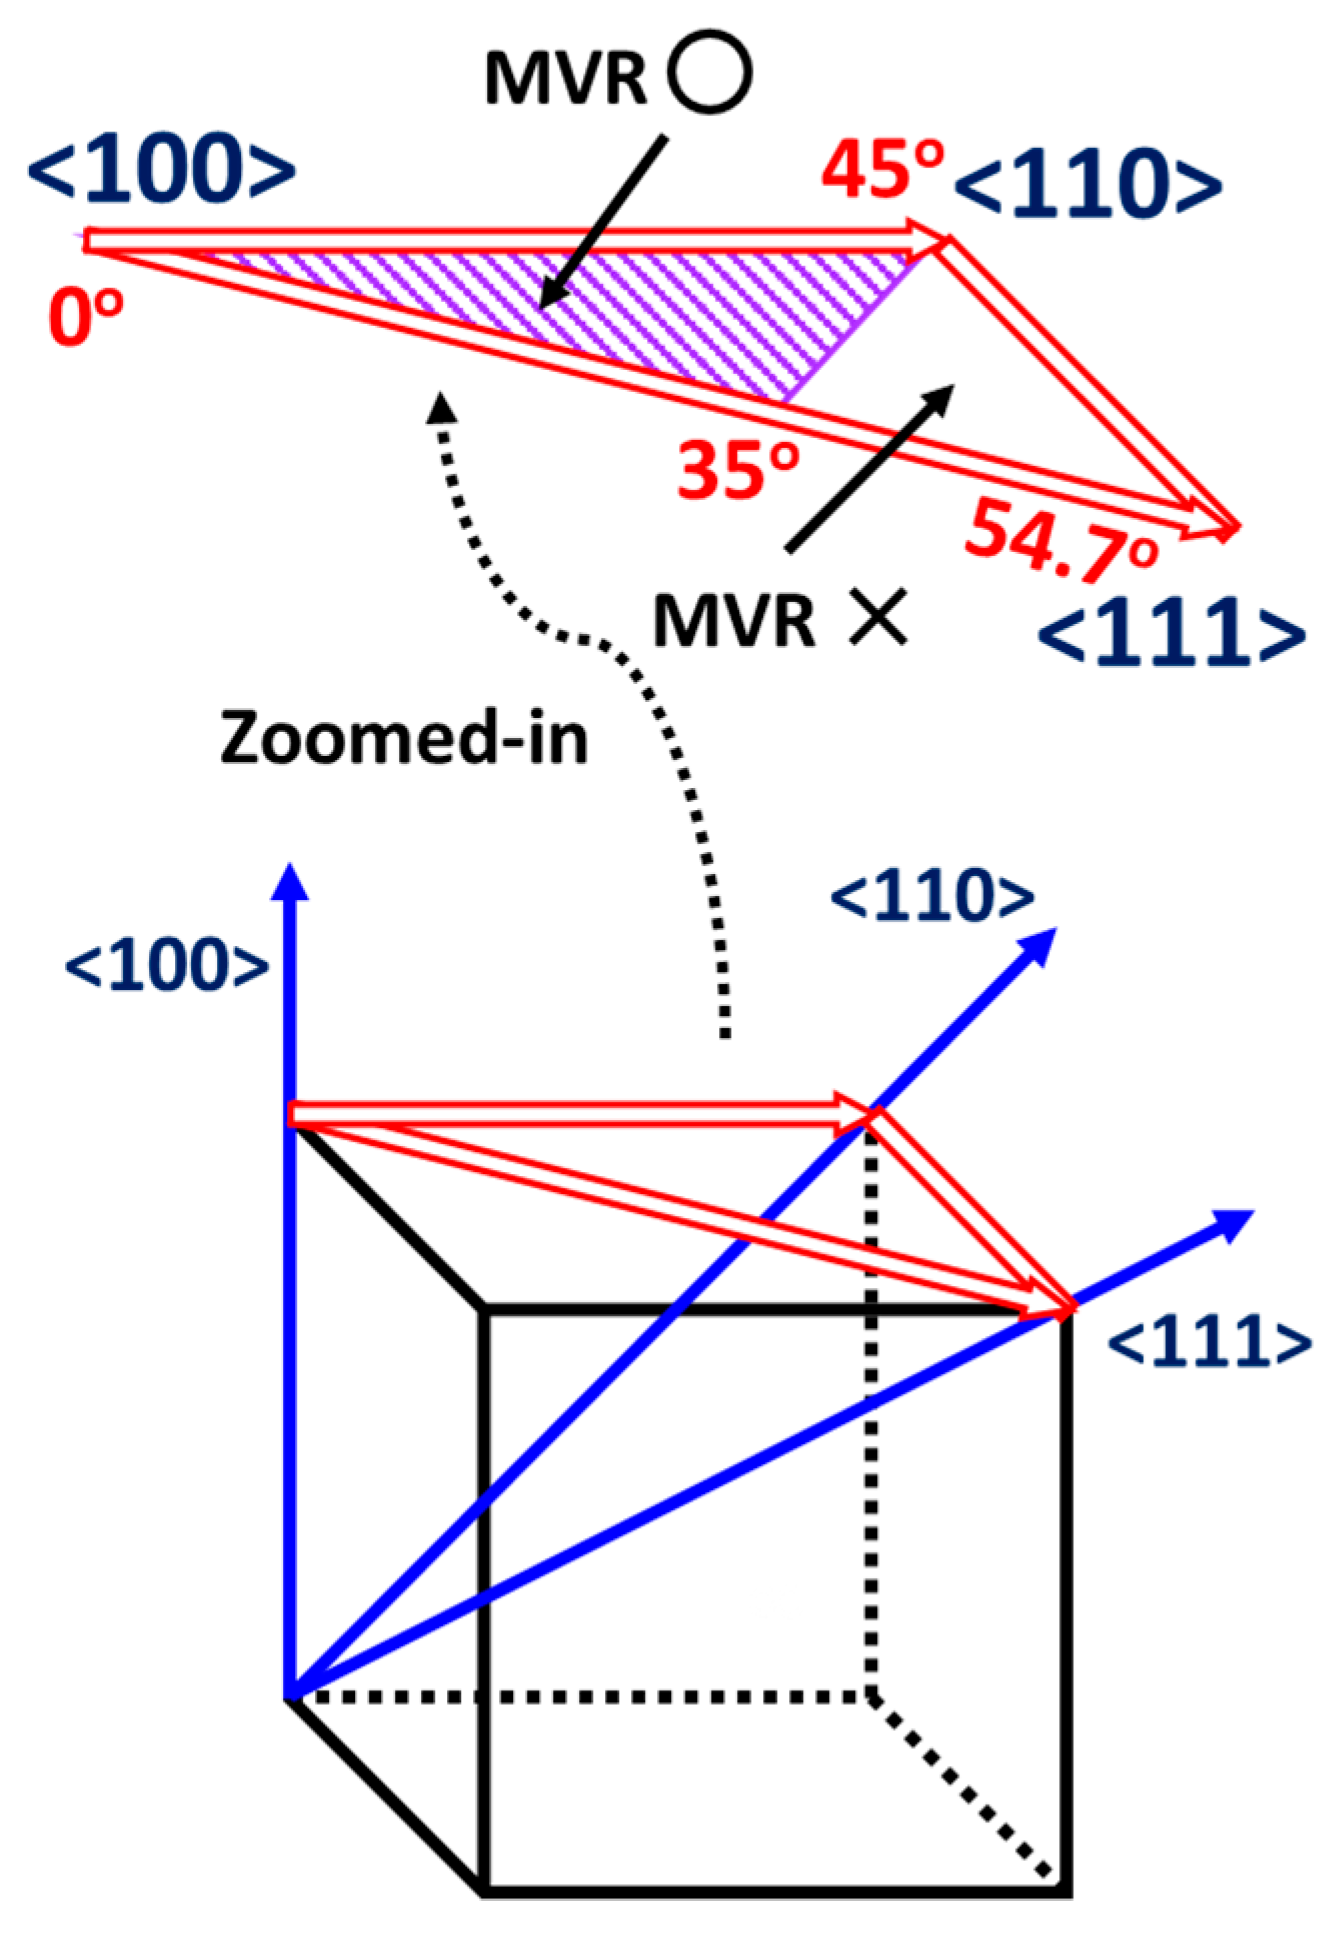
3.3. Dependence of MVR on Crystallographic Direction

As shown in the experimental section, the electromagnets were rotated to investigate the dependence of the magnetic field-induced MVR on the crystallographic direction. The electromagnets were rotated 45° (i.e., from <100>p to <110>p of the {100}p single-crystal Ni-Mn-Ga cube) and 54.7° (i.e., from <100>p to <111>p of the {100}p single-crystal Ni-Mn-Ga cube), respectively. The corresponding settings of these two rotations are shown in Figure 3c,d), respectively. In this section, the {100}p single-crystal Ni-Mn-Ga and the 30 vol.% {100}p single-crystal Ni-Mn-Ga cube/silicone composite material (i.e., Specimen2) were used for the examinations. The 30 vol.% {100}p single-crystal Ni-Mn-Ga cube/silicone composite material, as shown in Figure 1b, was chosen to reveal the effect of the silicone matrix on the motion of the magnetic field-induced MVR. The results are shown in the following sections.

3.3.1. Magnetic Field-Induced MVR vs. Crystallographic Orientation

Figure 10a shows the dependence of the magnetic field necessary for the MVR on the rotation angle from <100>p to <110>p (i.e., from 0° to 45°). The solid blue squares indicate the {100}p single-crystal Ni-Mn-Ga cube, the solid red circles suggest the 30 vol.% {100}p single-crystal Ni-Mn-Ga cube/silicone composite and the blue, and red cross symbols correspond to the disappearance of the MVR within the range of the magnetic field applied. However, please note that this merely reveals that the MVR did not take place within the magnetic field range scanned in this study. The cross symbols were used to reveal the truth of no twin motion at certain rotation angles, while the corresponding magnetic field magnitude in the figure (i.e., the corresponding y-axis) is without any meaning. The vertical dashed lines at 0° and 45° suggest the rotation from <100>p to <110>p of the {100}p single-crystal Ni-Mn-Ga cube. An illustration is inserted at the right-bottom corner to reveal the relationship between the magnetic field applied and the crystallographic direction.
It was observed that the necessary magnetic field for MVR of both tested materials increased when the direction rotated from <100>p to <110>p of the {100}p single-crystal Ni-Mn-Ga cube. This indicates that the higher driving force for the MVR motion is required when the direction rotated from <100>p to <110>p of the {100}p single-crystal Ni-Mn-Ga cube. In addition, it is worth noting that the necessary magnetic field for the twin motion in the composite material (i.e., the solid red circles) is higher than the single-crystal specimen (i.e., the solid blue squares) at all times. This could be attributed to the elastic inhibition of the twin motion originating from the silicone matrix working on the {100}p single-crystal Ni-Mn-Ga cube.
In addition to the measurements from <100>p to <110>p of the {100}p single-crystal Ni-Mn-Ga cube and its composite, Figure 10b shows the dependence of the magnetic field necessary for the MVR on the rotation angle from <100>p to <111>p (i.e., from 0° to 54.7°) of the {100}p single-crystal Ni-Mn-Ga cube and its composite. Similarly, the solid blue squares indicate the {100}p single-crystal Ni-Mn-Ga cube without any polymer matrix, the solid red circles suggest the 30 vol.% {100}p single-crystal Ni-Mn-Ga cube/silicone composite, and the cross symbols correspond to the disappearance of the magnetic field-induced MVR within the detected range. The vertical dashed lines at 0° and 54.7° indicate the rotation from <100>p to <111>p of the {100}p single-crystal Ni-Mn-Ga cube. An illustration is inserted at the right-upper corner to reveal the relationship between the magnetic field and the crystallographic direction of the {100}p single-crystal Ni-Mn-Ga cube.
It was discerned that the magnetic field for the twin motion slightly decreased when the magnetic field was rotated from <100>p to <111>p of the {100}p single-crystal Ni-Mn-Ga cube. Additionally, similar to Figure 10a, the necessary magnetic field for the twin motion in the composite materials is higher than that of the {100}p single-crystal Ni-Mn-Ga cube at all times. The reason for this phenomenon has been described previously. It was further found that no apparent MVR could be observed while the rotation angles were at 40° and 45° when the magnetic field was rotated from <100>p to <111>p of the {100}p single-crystal Ni-Mn-Ga cube (i.e., the red and blue cross symbols at 40° and 45°, respectively). This disappearance of the magnetic field-induced MVR is attributed to the three near-equivalent variants in the 5M-martensite phase. Therefore, it could be concluded that, for this {100}p single-crystal Ni-Mn-Ga cube and its composite material, the critical angle for the twin motion is approximately at 35° while the single-crystal {100}p Ni-Mn-Ga cube was rotated in the direction from <100>p to <111>p of the {100}p single-crystal Ni-Mn-Ga cube. Moreover, both Figure 10a,b reveal that the twin motion is in a good trend with the crystallographic direction, showing an increase from <100>p to <110>p and a decrease from <100>p to <111>p of the {100}p single-crystal Ni-Mn-Ga cube with acceptable deviations.

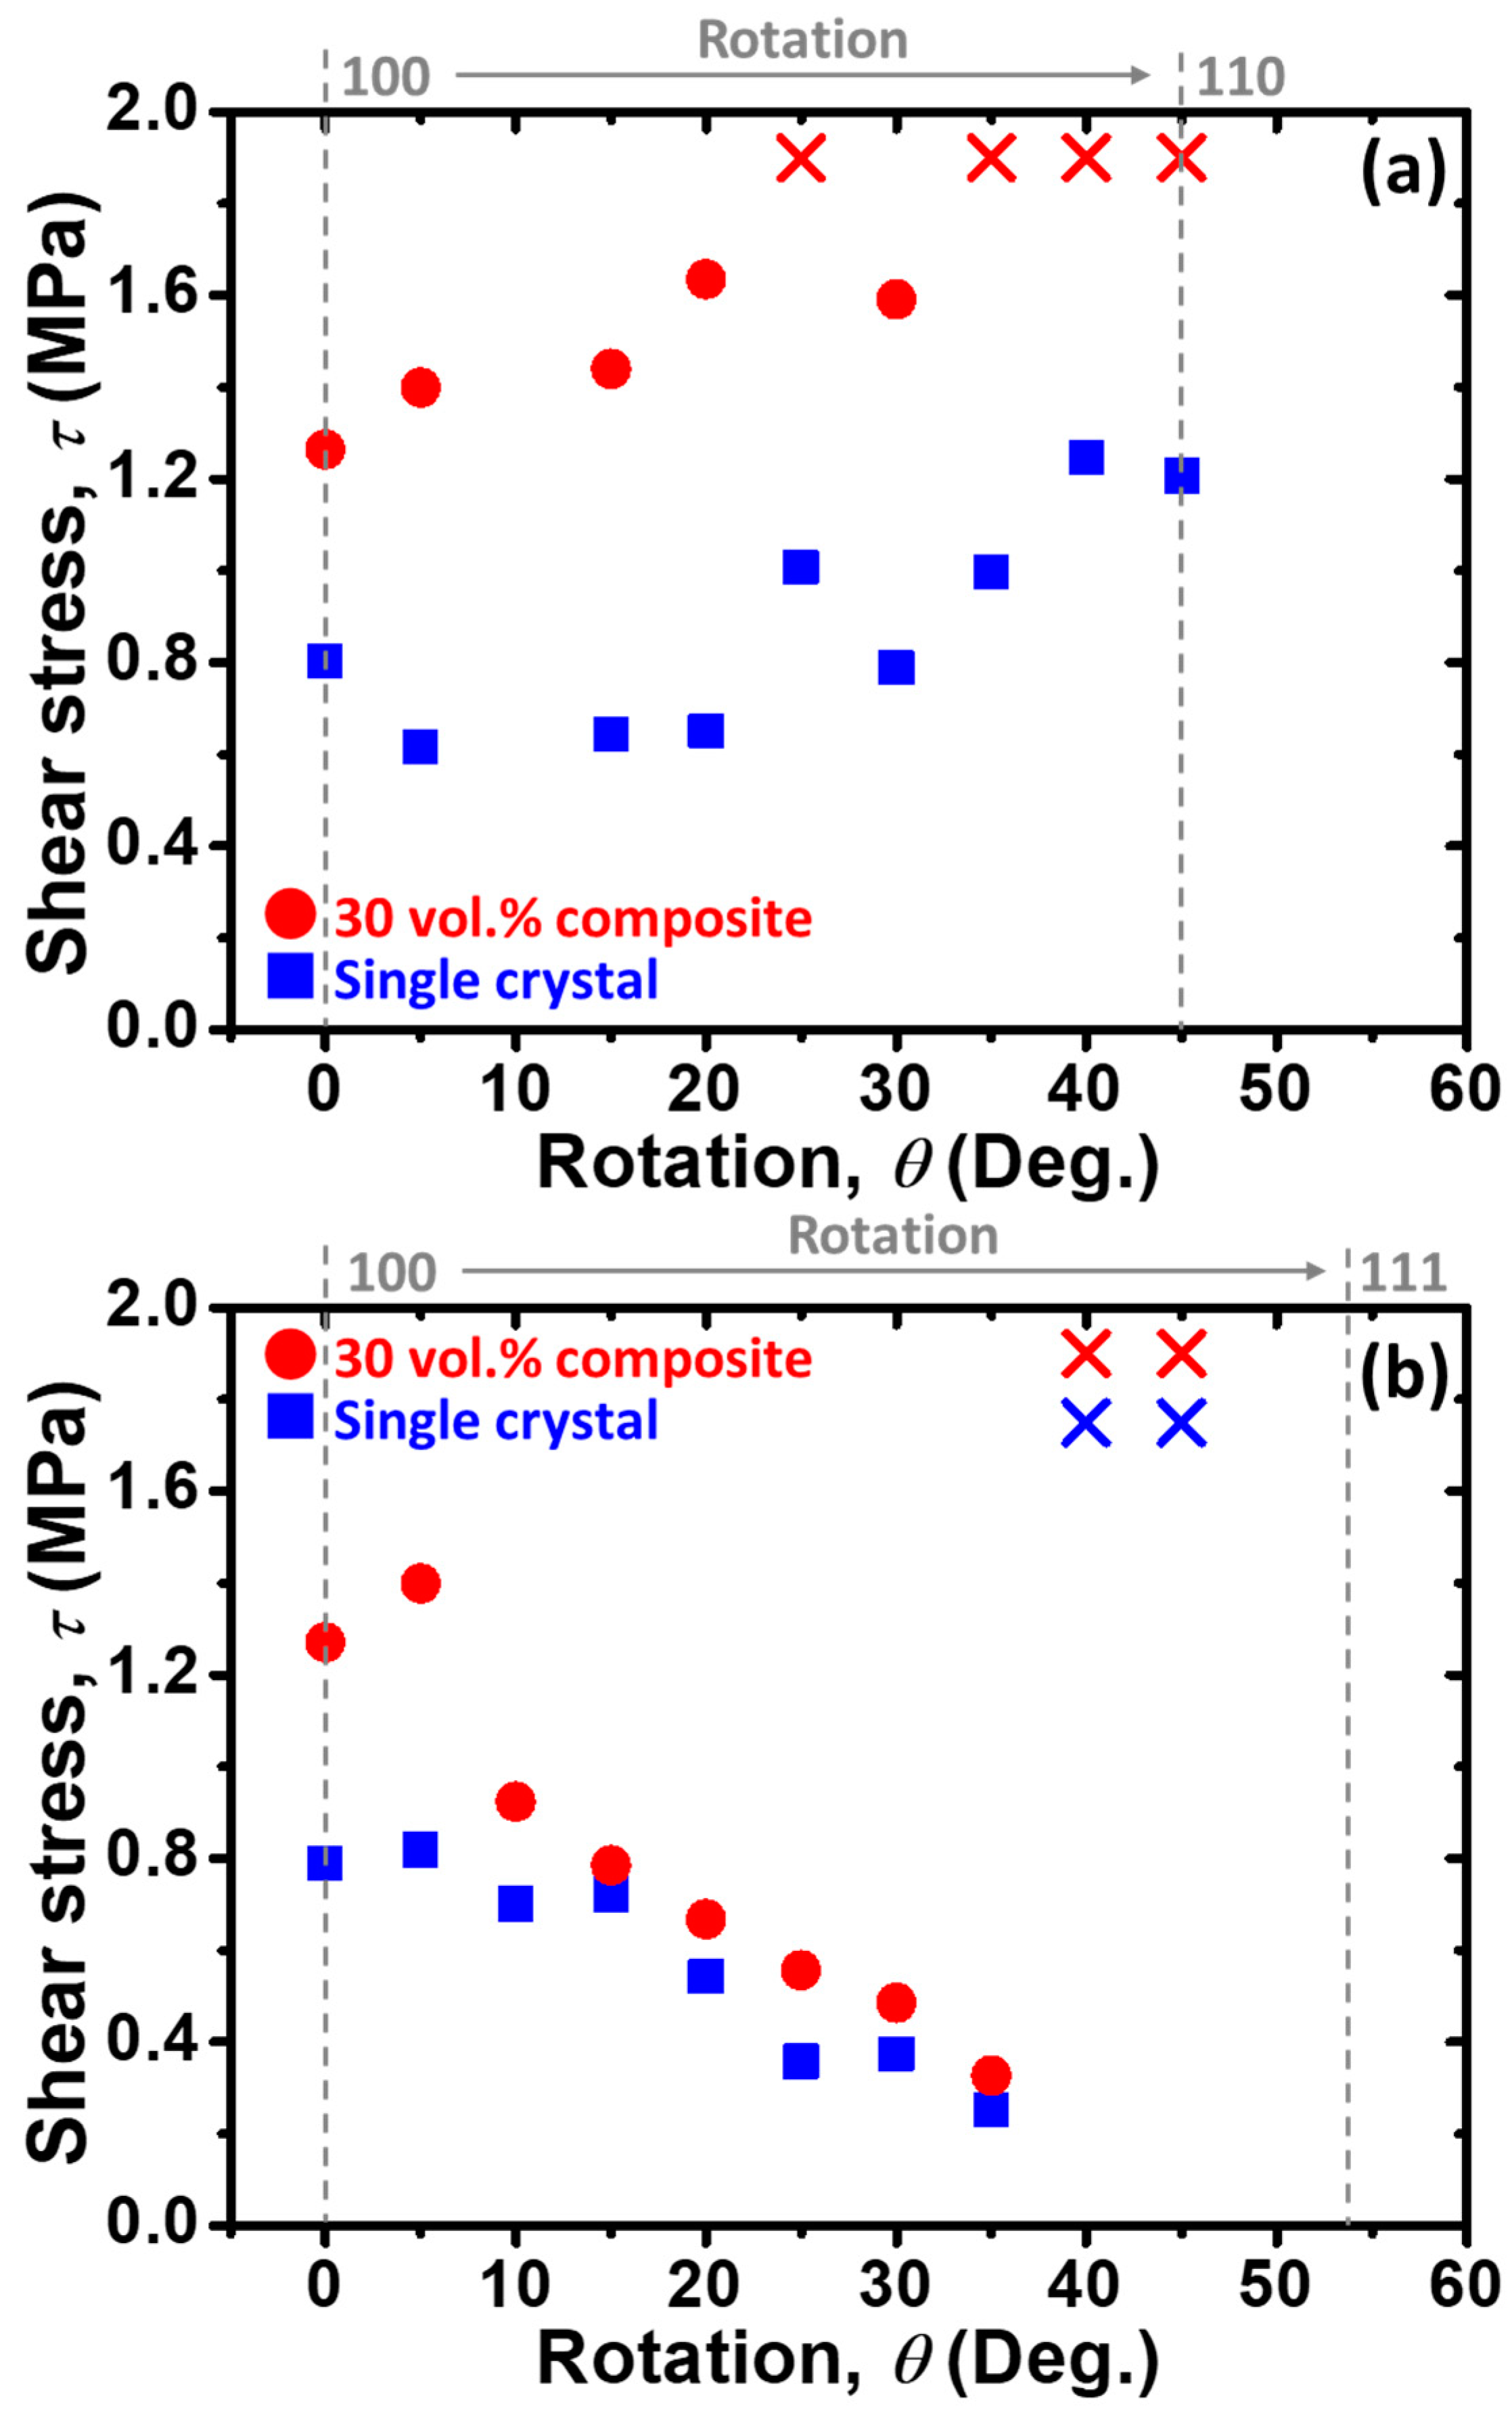
3.3.2. Shear Stress of {110} vs. Crystallographic Direction

Shear stress (τ) for the twin motion was calculated based on Equations (1)–(6) as formulated above, and the results of (a) from <100>p to <110>p and (b) from <100>p to <111>p of the {100}p single-crystal Ni-Mn-Ga cube are both plotted in Figure 11, respectively. It reveals the necessary shear stress for the motion of the twin boundary on the {110} of the {100}p single-crystal Ni-Mn-Ga cube by applying an external magnetic field. The blue solid squares indicate the {100}p single-crystal Ni-Mn-Ga cube, the solid red circles suggest the 30 vol.% {100}p single-crystal Ni-Mn-Ga cube/silicone composite, and the cross symbols correspond to the disappearance of the MVR within the range of the magnetic field applied. The vertical dashed lines in (a) 0° and 45° indicate the rotation from <100>p to <110>p, while the vertical dashed lines in (b) 0° and 54.7° indicate the rotation from <100>p to <111>p of the {100}p single-crystal Ni-Mn-Ga cube.
Similar to the plot of the magnetic field-rotation in Figure 10, the necessary shear stress for the twin motion of the composite materials are larger than that of the single-crystal cube at all times. Additionally, judging from Figure 11, the trend of the necessary shear stress for the twin motion is similar to that of the trend of the magnetic field, which is revealed in Figure 10. Moreover, it could be concluded that the necessary shear stress for the twin motion on {110} of the {100}p single-crystal Ni-Mn-Ga cube was around 1 MPa or less with certain deviations, which is close to those stress for the twin motion reported in the literature [56,57,58]. It was further found that the necessary shear stress decreases when the rotation approaches <111>p, and thus, the critical stress for the commencement of MVR is at approximately 0.3 MPa (i.e., the shear stress at about 35° of the rotation angle) as the specimen was rotated from <100>p to <111>p of the {100}p single-crystal Ni-Mn-Ga cube (Figure 11b). While the rotation angle was at 40° and 45°, no apparent MVR could be observed (i.e., the blue and red cross symbols at 40° and 45°). Again, the not observed MVR could be attributed to the equivalence of these three different variants in the 5M-martensite phase.
An illustration, which reveals the regime for apparent MVR and inapparent MVR via the introduction of an external magnetic field, is displayed in Figure 12. The bottom part displays the three directions of <100>p, <110>p, and <111>p in the parent {100}p single-crystal Ni-Mn-Ga cube by using solid blue arrows, while the zoomed-in figure of the largest triangle (three hollow red arrows), which shows the details, is illustrated at the upper part of this figure. In the zoomed-in figure, the triangle filled with purple straight lines (at the left-hand side) indicates the regime allowing the magnetic field-induced MVR (i.e., MVR ◯), while the un-filled triangle (at the right-hand side) suggests the regime not allowing the magnetic field-induced MVR (i.e., MVR −) when the magnetic field is applied. The angle at each intersection of lines represents the rotation angles from <100>p to <110>p or <111>p in the parent {100}p single-crystal Ni-Mn-Ga cube. In this triangle, among these three crystallographic directions, most of the MVR could be triggered via an introduction of a magnetic field (i.e., the straight purple line-filled part). On the other hand, the remaining unfilled regime represents the inapparent MVR as a magnetic field was applied. This indicates that most of the twin motion is active in the single-crystal Ni-Mn-Ga cube as shown from Figure 10 to Figure 12. Nevertheless, as shown in Figure 10, the active twin motion of the composite was less than that of the {100}p single-crystal Ni-Mn-Ga cube due to the elastic restriction from the silicone rubber.

3.4. Effects of the Adjacent Cube on the Deformation Behavior

In addition to the “one {100}p single-crystal Ni-Mn-Ga cube/polymer composite materials” mentioned in the previous sections, for analyzing the effect of the neighboring alloys on the shape deformation, the “two Ni-Mn-Ga cubes/polymer composite materials” were also examined in this study. The results and discussion of the specimens are shown in the following sections.

3.4.1. The 20 Vol.% of Two Ni-Mn-Ga Cubes/Silicone Composite

For the first design, the composite material was composed of one active Ni-Mn-Ga cube, which is {100}p single-crystal and one inactive Ni-Mn-Ga cube, which is a polycrystal. Again, please note that since it was found that barely did the polycrystal performs a shape deformation strain (i.e., around 0.1%) due to the constraint among the adjacent grain boundaries, the polycrystalline Ni-Mn-Ga cube is thus defined as an “inactive” object here [59,60]. An illustration of the aforementioned design of the composite materials is shown in Figure 13a, which reveals the 20 vol.% two Ni-Mn-Ga cubes/silicone composite material (i.e., Specimen3). The left small solid gray cube indicates the {100}p single-crystal Ni-Mn-Ga cube (active), while the right large solid gray cube suggests the polycrystalline Ni-Mn-Ga cube (inactive). The large dashed yellow rectangular corresponds to the silicone matrix. The symbols σ in the solid red arrows reveal the compression direction of the external compressive field.
A compressive examination was then conducted on the 20 vol.% two Ni-Mn-Ga cubes/silicone composite (Figure 13b–d). The micro CT images of the 20 vol.% two Ni-Mn-Ga cubes/silicone composite (b) before compression (i.e., 0% compression strain), (c) after compression (i.e., 20% compression strain), and (d) after complete removal of the external compressive strain are revealed in Figure 13, respectively. The vertical red lines and horizontal blue lines with double arrows indicate the heights and the widths of both the Ni-Mn-Ga cubes, respectively.
It is obvious that in the shape deformation examination via applying a compressive strain (from Figure 13b to Figure 13c), the {100}p single-crystal Ni-Mn-Ga cube (left-hand side cube) shrunk about 2%; on the other hand, hardly did the shape deformation could be found in the polycrystalline Ni-Mn-Ga cube (right-hand side cube). Upon removal of the externally applied compressive strain (from Figure 13c to Figure 13d), an almost complete shape recovery was discerned in the {100}p single-crystal Ni-Mn-Ga cube (left-hand side cube). This could be attributed to the back stress, which originates from the silicone matrix [54], works on the {100}p single-crystal Ni-Mn-Ga cube. In addition, it is further considered that the inactive polycrystalline Ni-Mn-Ga cube could also be another driving force for the high shape recovery of the {100}p single-crystal Ni-Mn-Ga cube in this case since it was found that the shape recovery of the {100}p single-crystal Ni-Mn-Ga cube is slightly higher in the two cubes composite (Specimen3 in Figure 13) than that in the one cube composite (Specimen1 in Figure 4). That is, the inactive cube assists the silicone matrix in inserting additional stress on the {100}p single-crystal Ni-Mn-Ga cube.

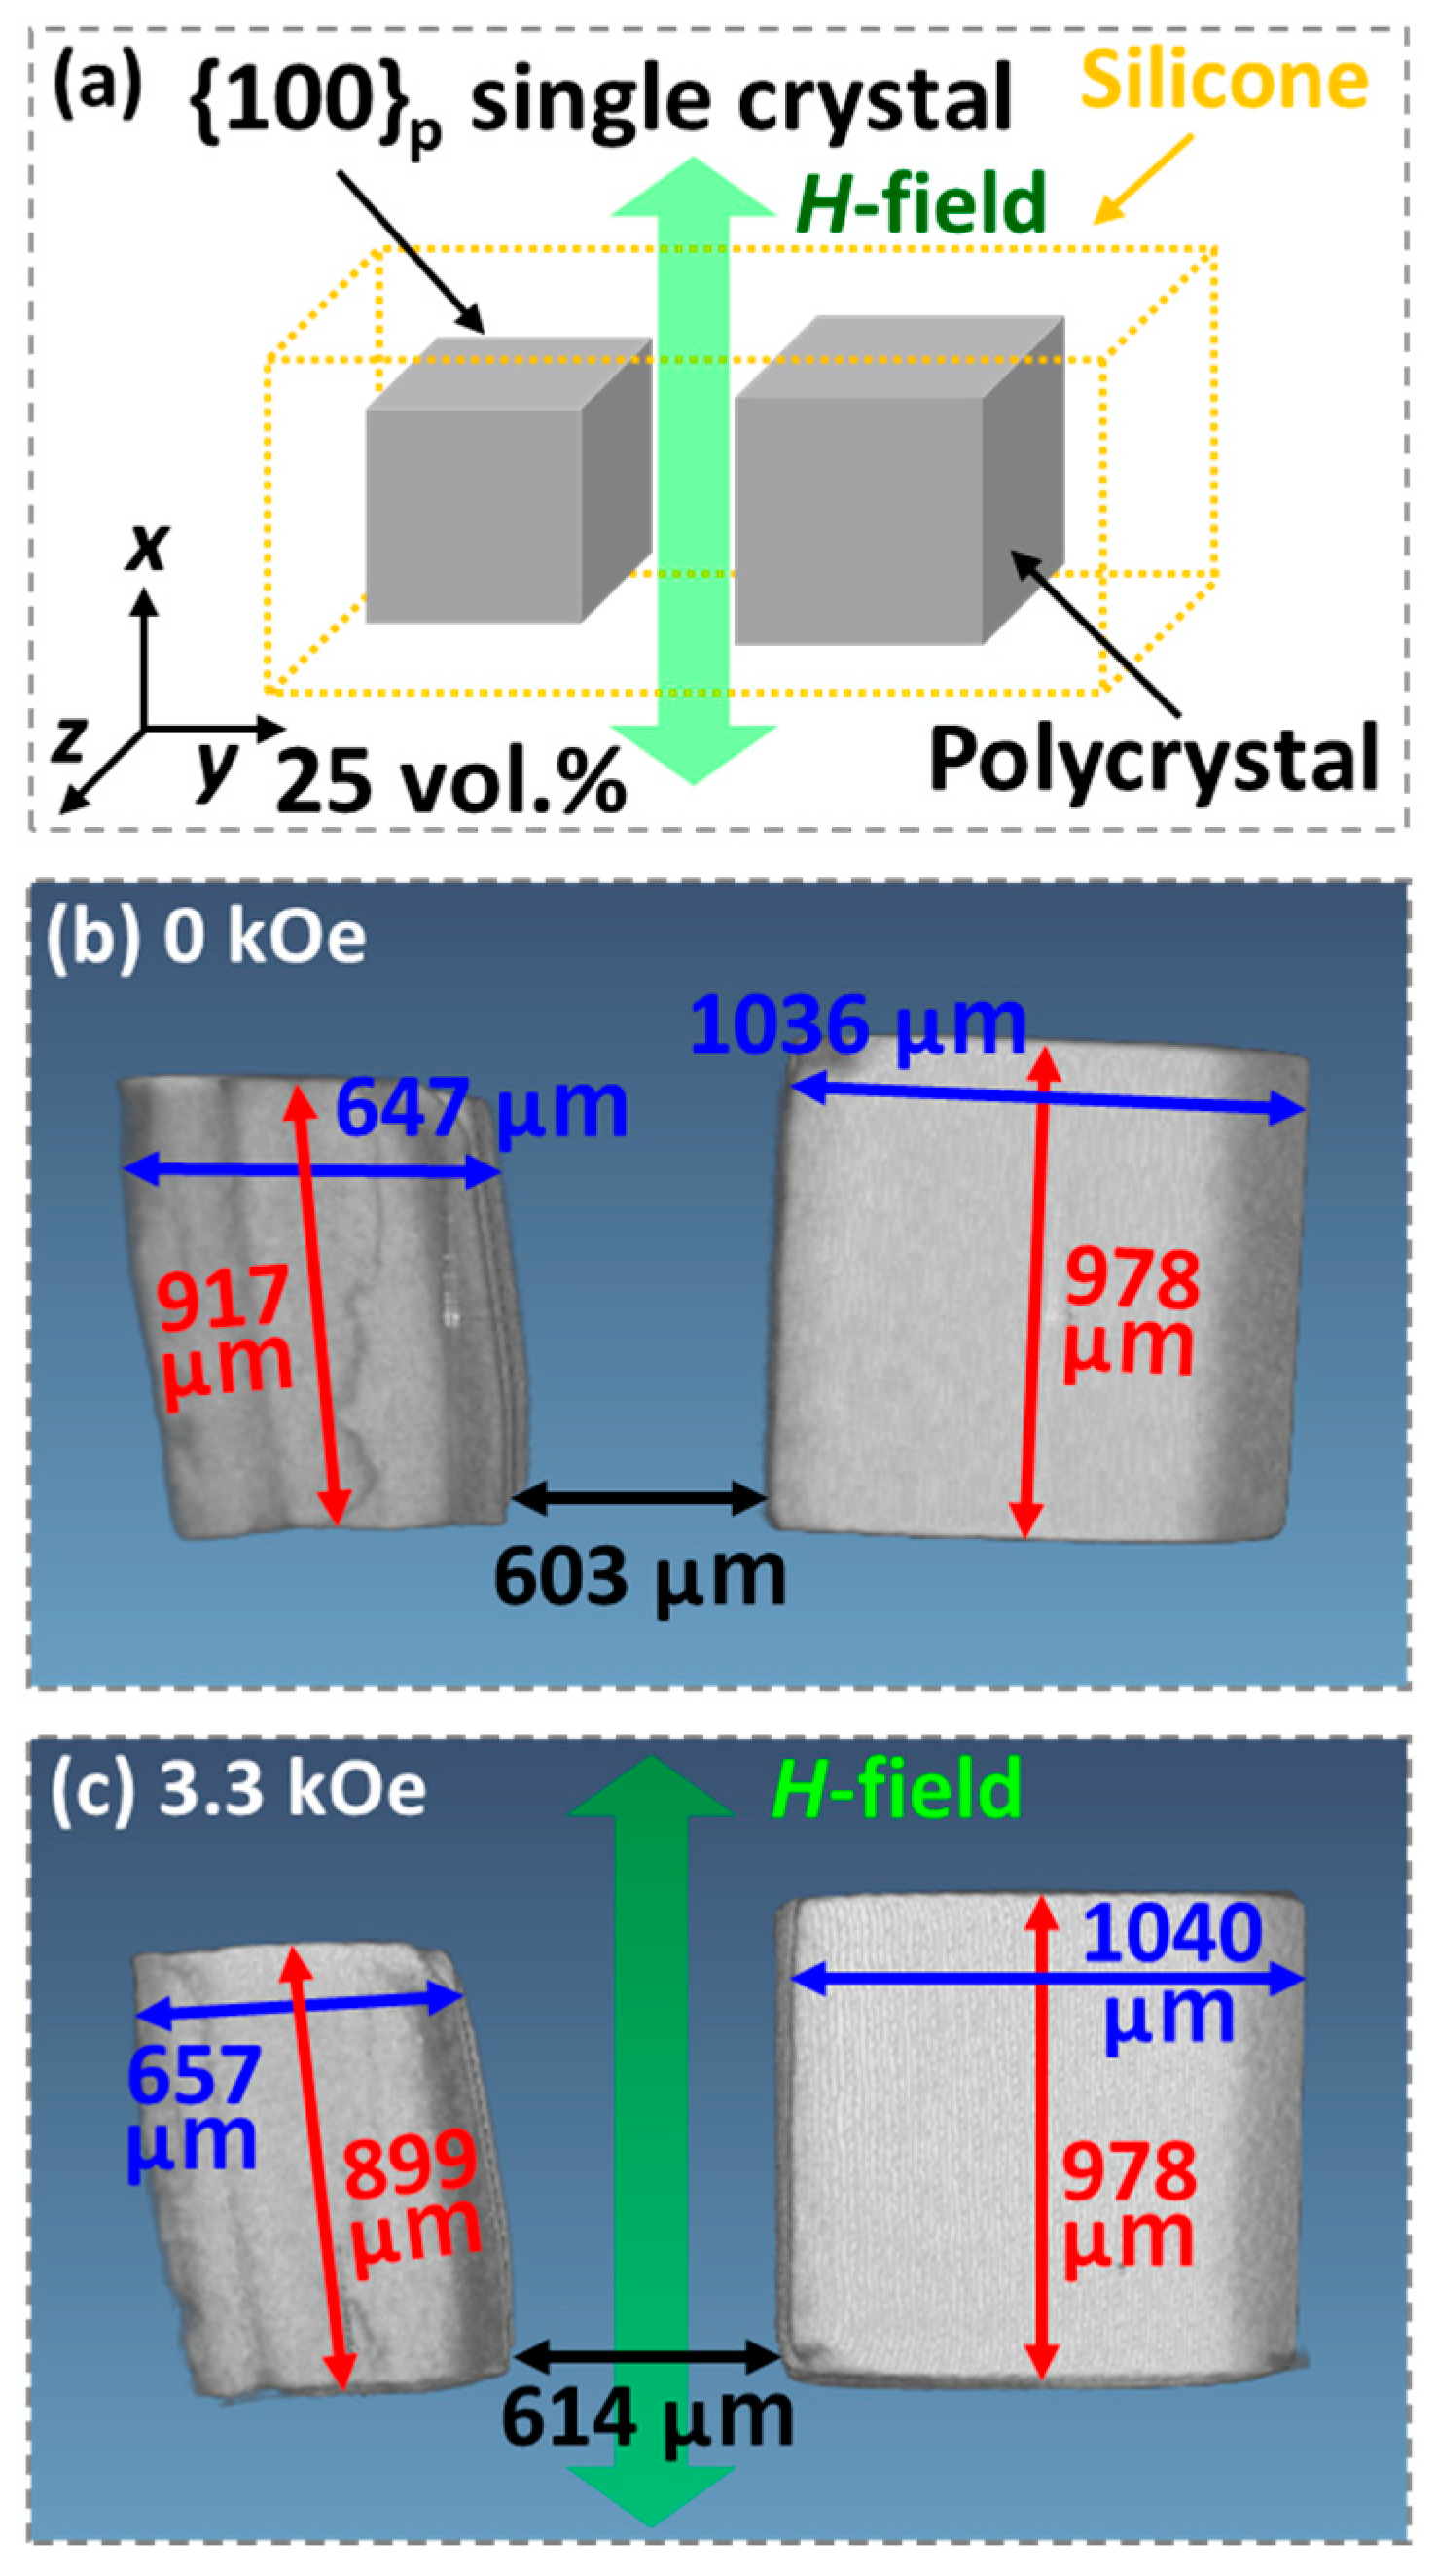
3.4.2. The 25 Vol.% of Two Single-Crystal Ni-Mn-Ga Cubes/Silicone Composite

The other 25 vol.% two Ni-Mn-Ga cubes/silicone composite material (Specimen4) was fabricated for the observations of the shape deformation of the composite material via an introduction of an externally applied magnetic field (Figure 14). The two Ni-Mn-Ga cubes with a higher volume percentage (i.e., 25 vol.% of two cubes) were used due to the less impact of the shape deformation of the cubes via an introduction of a magnetic field compared to that of the compressive field (i.e., the specimen with 20 vol.% of Ni-Mn-Ga alloys used in Section 3.4.1). Therefore, higher volume percentages of the overall Ni-Mn-Ga cubes were used in this case of the magnetic field-driven shape deformation. Similarly, one {100}p single-crystal (active) cube and one polycrystal (inactive) cube were embedded into the silicone matrix. The reasons for the definitions of active and inactive are stated in Section 3.4.1. In Figure 14, the left small solid gray cube indicates the {100}p single-crystal Ni-Mn-Ga cube, while the right large solid gray cube suggests the polycrystalline Ni-Mn-Ga cube. The large dashed yellow rectangular corresponds to the silicone matrix. The green doubled arrow indicates the direction of an externally applied magnetic field (H-field).
A magnetic field of 3.3 kOe was then applied on the 25 vol.% two Ni-Mn-Ga cubes/silicone composite (Figure 14c). The micro CT images of the 25 vol.% two Ni-Mn-Ga cubes/silicone composite (b) before a magnetic field applied (i.e., 0 kOe) and (c) after a magnetic field applied (i.e., 3.3 kOe) are revealed in Figure 14, respectively. The vertical red lines and horizontal blue lines with arrows indicate the heights and the widths of both the {100}p single-crystalline and polycrystalline Ni-Mn-Ga cubes, respectively. It is obvious that in the shape deformation examination via applying a magnetic field (from Figure 14b to Figure 14c)), the {100}p single-crystalline Ni-Mn-Ga cube (left-hand side cube) shrunk from 917 to 899 μm along the magnetic field, while it expanded from 647 to 657 μm in the direction vertical to the magnetic field. This is owing to, on the one hand, the alignment of the short c-axis (i.e., the easy axis of the 5M-martensite phase) to the externally applied magnetic field; on the other hand, the long axis moves to the orthogonal direction of the externally applied magnetic field. Compared to the compressive examination, the extent of shape deformation of the {100}p single-crystal Ni-Mn-Ga cube is less than the above-mentioned compressed one. Nevertheless, the shape deformation of the {100}p single-crystal Ni-Mn-Ga cube is much clear than that of the polycrystalline Ni-Mn-Ga cube, which barely performed any shape deformation strain upon an introduction of an externally applied magnetic field.

3.5. Effect of Training on the MVR

3.5.1. Crystallographic Direction Verification

As mentioned previously, prior to the embedment of the {100}p single-crystal Ni-Mn-Ga cubes into the polymer matrices, the crystallographic directions of the cubes were verified. The (004) pole figure of the {100}p single-crystal Ni-Mn-Ga plate with a dimension of 6.6 × 6.0 × 1.7 mm3 were also confirmed before the embedment (Figure 15), and the resulting composite was used for the examination of the effect of training processes on the magnetic field-induced MVR. The detection of the crystallographic direction via the X-ray measurement was conducted on the largest surface of the {100}p single-crystal Ni-Mn-Ga plate specimen.
In addition to the measured pole figure in Figure 15a, the corresponding calculated pole figure by using the software CaRine is also shown in Figure 15b. The solid red circle symbols correspond to the {100}p, while the blue square symbols represent the {101}p. It is therefore confirmed that similar to the {100}p Ni-Mn-Ga cubes stated in the previous sections, the single-crystal Ni-Mn-Ga with a plate shape was also a near-{100}p cubic specimen.

3.5.2. Dependence of Training on the MVR Behavior

After the embedment, the Specimen5 (i.e., the 50 vol.% {100}p single-crystal Ni-Mn-Ga plate/silicone composite as shown in Figure 1e) was trained by a cyclic scan of a magnetic field of the field range from 0 to 10 kOe for 10 cycles since it was reported that the pinning effect among the martensitic twins could be released by applying certain magnetic field or compressive field training processes [42,44,61]. The magnetization-magnetic field (M-H) curves of the (a) 1st run, (b) 5th run, and (c) 10th run are shown in Figure 16, respectively. An illustration, which exhibits the relationship between the directions of the applied external magnetic field (H-field; green double arrow) and the composite material, is inserted at the right-bottom corner of Figure 16a. The red tangent lines and the red arrows in all figures overlapping the M-H curves correspond to the sudden increasing of the magnetization (i.e., the “jumping” behavior) [42,44]. As mentioned previously, the sudden jump of the magnetization indicates the MVR in the {100}p single-crystal Ni-Mn-Ga plate. It is thus obvious that the magnetic field, which was required for the commencement of MVR, decreased gradually with the increasing cycle of the magnetic field applied (from 3.3 kOe in Figure 16a of the 1st run to 1.1 kOe in Figure 16c of the 10th run). It was confirmed that the pinning effect was successfully released by the magnetic field training procedures [42,44,61].

4. Conclusions

The {100}p single-crystal Ni-Mn-Ga alloys with both cube and plate structures were prepared in this study, while their composite materials were also fabricated for various in situ examinations, such as the shape deformation behavior under various fields of compression or magnetic. The dependence of the magnetic field-induced martensite variant reorientation (MVR) behavior on the crystallographic directions, composite morphology, and training process were also examined in this study. Some of the important findings are listed as follows:
  • The stress for the stress-induced MVR was confirmed to be at approximately 1 MPa or less. This is in accordance with those reported. Additionally, obvious shape deformation behaviors were observed through an in situ observation using a micro CT.
  • The magnetic field-induced MVR was inhibited when the {100}p single-crystal Ni-Mn-Ga cube was at the volume percentage of 13%, while an obvious magnetic field-induced MVR was observed when the {100}p single-crystal Ni-Mn-Ga cube was used. The difference between these two specimens originates from the elastic constraint of the polymer matrix. Additionally, the shape deformation behaviors of the composite under an external magnetic field were also discerned.
  • The necessary magnetic field increased when the crystallographic direction was rotated from <100>p to <110>p of the {100}p single-crystal Ni-Mn-Ga cube; on the other hand, the necessary magnetic field decreased when the crystallographic direction was rotated from <100>p to <111>p of the {100}p single-crystal Ni-Mn-Ga cube.
  • The necessary magnetic field (that is, the shear stress required) for the MVR of the cube of the composite material is higher than that of the {100}p single-crystal Ni-Mn-Ga cube at all times. This is due to the elastic inhibition of the polymer matrix to the single-crystal Ni-Mn-Ga cube.
  • A critical rotation angle for the magnetic field-induced MVR was found at around 35° when the crystallographic direction was rotated from <100>p to <111>p of the {100}p single-crystal Ni-Mn-Ga cube. This could be attributed to the near-equivalent three variants in the 5M-martensite phase when the magnetic field approached <111>p of the {100}p single-crystal Ni-Mn-Ga cube.
  • It was found that most of the MVR could be triggered by introducing an external magnetic field in the range of approximately 0–6 kOe when the crystallographic direction is within the range of <100>p, <110>p, and <111>p.
  • In the case of the two cubes composed composites, both in the compressive field and the magnetic field, the {100}p single-crystal Ni-Mn-Ga cube performed shape deformation, while barely the polycrystalline Ni-Mn-Ga cube was deformed owing to the inhibition among the neighboring grain boundaries.
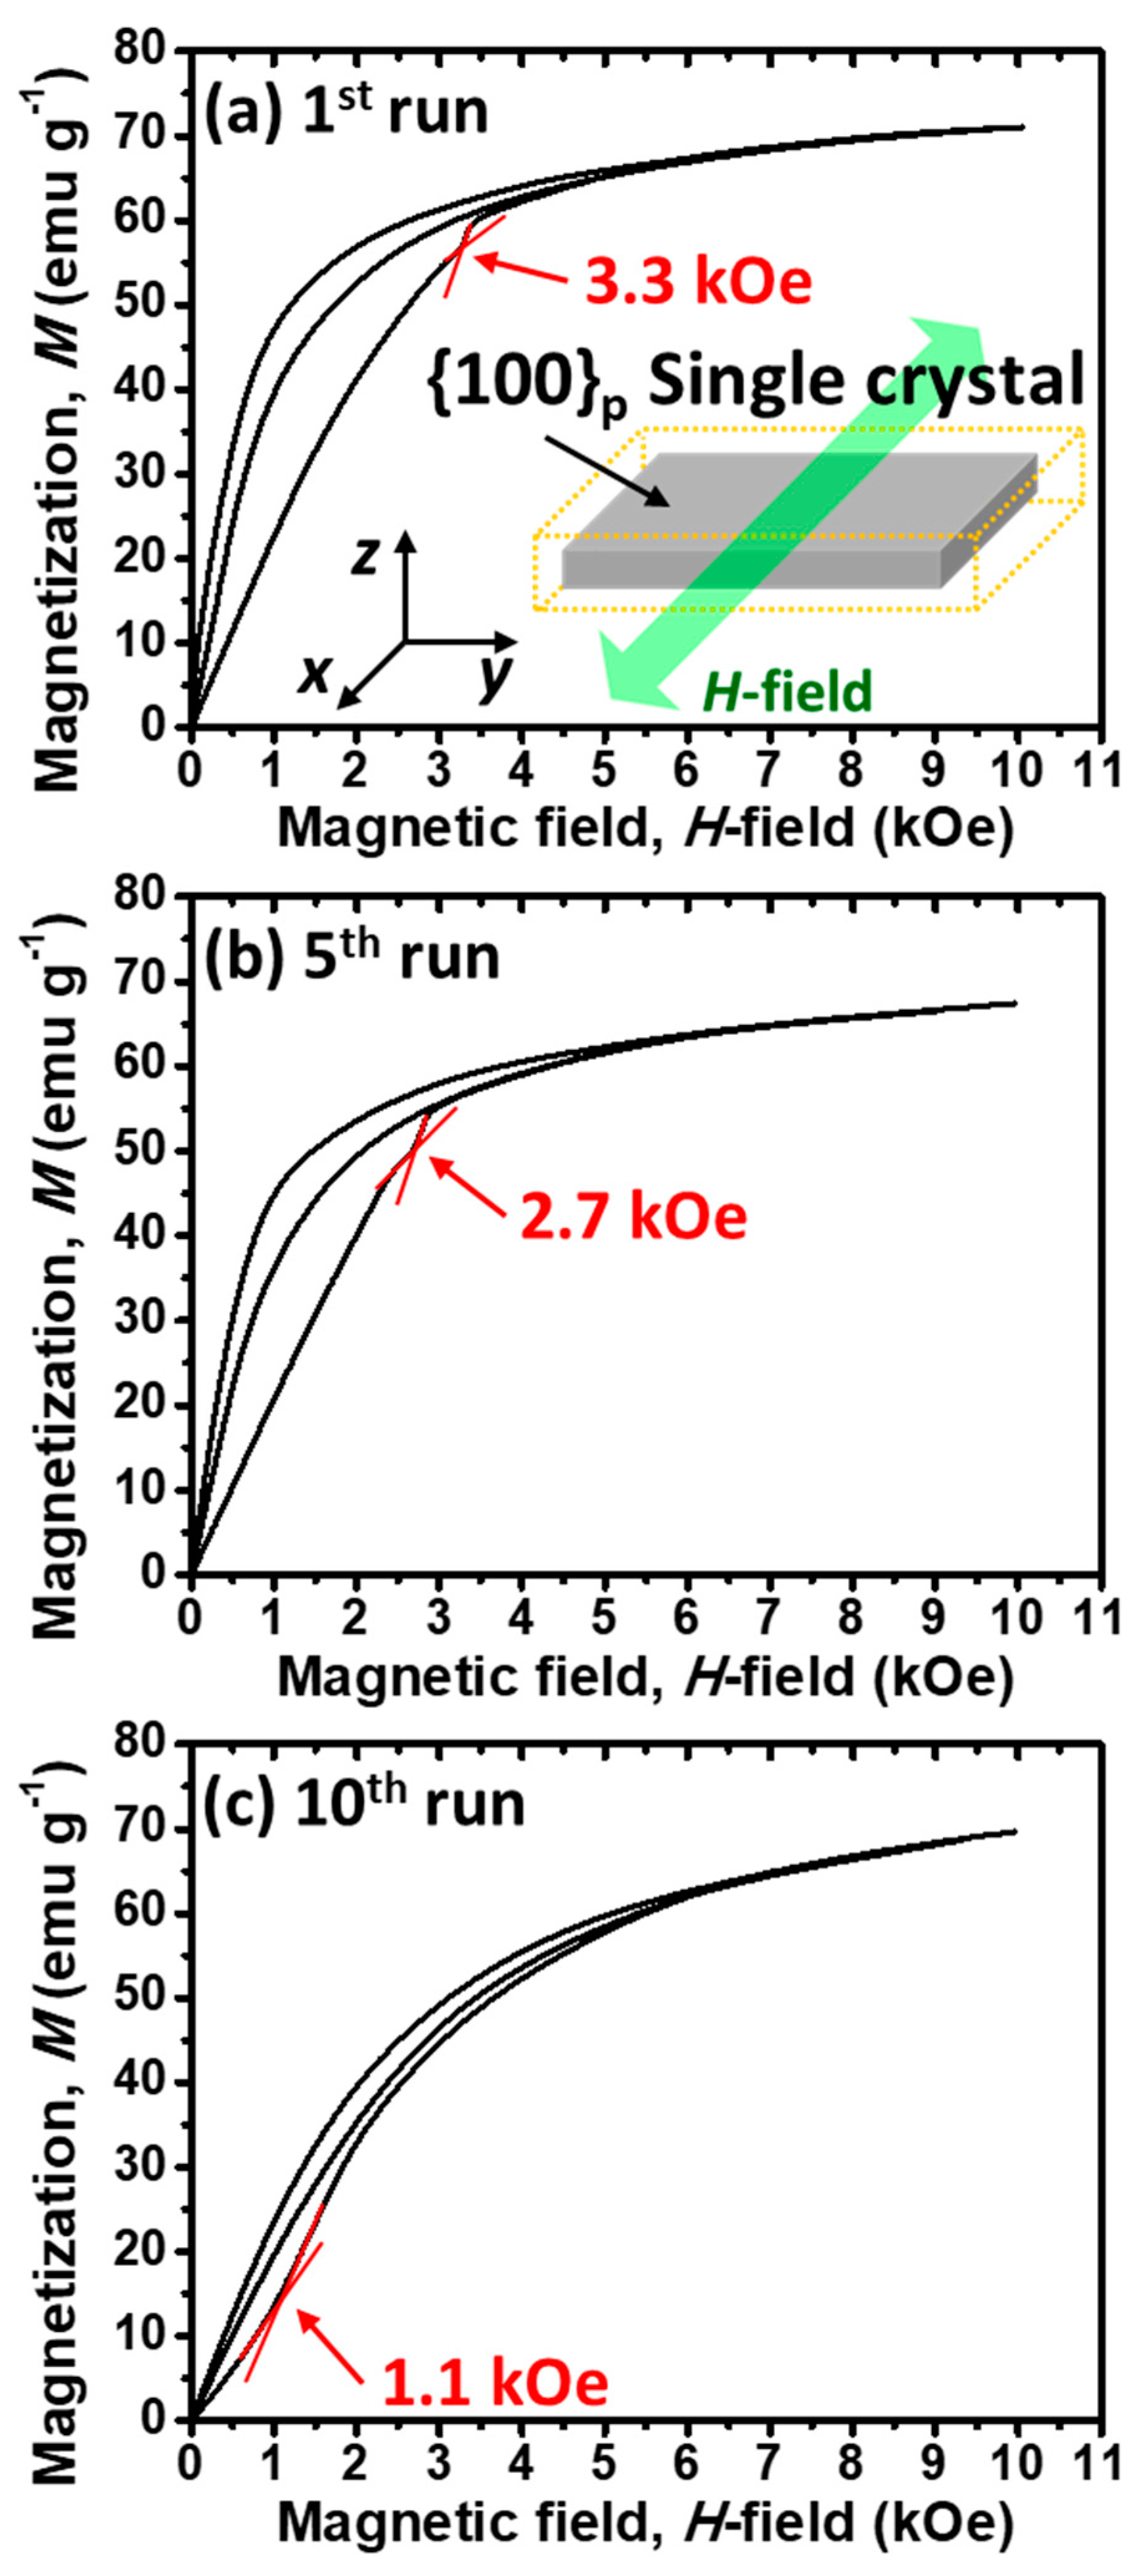
  • The training effect reveals a reduced magnetic field that is necessary for MVR of the single-crystal cube, where the required magnetic field was reduced from 3.3 kOe to 1.1 kOe when the composite material was subjected to the magnetic field scanning cycles from the range of 0–10 kOe. This is due to the release of the pinning effect among the variants in the 5M-martensite.

Author Contributions

Conceptualization, H.H. and T.I.; methodology, M.O.; software, W.-T.C.; validation, W.-T.C., M.T. and M.O.; formal analysis, M.O.; investigation, W.-T.C.; resources, H.H.; data curation, M.O.; writing—original draft preparation, W.-T.C.; writing—review and editing, W.-T.C.; visualization, W.-T.C.; supervision, H.H.; project administration, H.H.; funding acquisition, H.H. All authors have read and agreed to the published version of the manuscript.

Funding

This work is supported by the financial supports from the research grant of the Hitachi Metals and Materials Science Foundation, the Iwatani Naoji Foundation, the Japan Society for the Promotion of Science (JSPS) (KAKENHI 22K14491), the Japan Society for the Promotion of Science (JSPS) (KAKENHI 19H02417), the Japan Society for the Promotion of Science (JSPS) (KAKENHI 20K20544), and the Japan Society for the Promotion of Science (JSPS) (KAKENHI 22H00256).

Data Availability Statement

The data that has been used are confidential.

Conflicts of Interest

The authors declare no conflict of interest.

References

  1. Guo, Z.; Pan, Y.; Wee, L.B.; Yu, H. Design and control of a novel compliant differential shape memory alloy actuator. Sens. Actuators A Phys. 2015, 225, 71–80. [Google Scholar] [CrossRef]
  2. Dasgupta, R. A look into Cu-based shape memory alloys: Present scenario and future prospects. J. Mater. Res. 2014, 29, 1681–1698. [Google Scholar] [CrossRef]
  3. Jani, J.M.; Leary, M.; Subic, A.; Gibson, M.A. A review of shape memory alloy research, applications and opportunities. Mater. Des. 2014, 56, 1078–1113. [Google Scholar] [CrossRef]
  4. Pons, J.; Cesari, E.; Seguí, C.; Masdeu, F.; Santamarta, R. Ferromagnetic shape memory alloys: Alternatives to Ni-Mn-Ga. Mater. Sci. Eng. A 2018, 481–482, 57–65. [Google Scholar] [CrossRef]
  5. Murray, S.J.; Marioni, M.A.; Kukla, A.M.; Robinson, J.; O’Handley, R.C.; Allen, S.M. Large field induced strain in single crystalline Ni-Mn-Ga ferromagnetic shape memory alloy. J. Appl. Phys. 2000, 87, 5774. [Google Scholar] [CrossRef]
  6. Chernenko, V.A.; Cesari, E.; Kokorin, V.V.; Vitenko, I.N. The development of new ferromagnetic shape memory alloys in Ni-Mn-Ga system. Scr. Mater. 1995, 33, 1239–1244. [Google Scholar] [CrossRef]
  7. O’Handley, R.C.; Murray, S.J.; Marioni, M.; Nembach, H.; Allen, S.M. Phenomenology of giant magnetic-field-induced strain in ferromagnetic shape-memory materials. J. Appl. Phys. 2000, 87, 4712. [Google Scholar] [CrossRef]
  8. Ullakko, K.; Huang, J.K.; Kantner, C.; O’Handley, R.C.; Kokorin, V.V. Large magnetic-field-induced strains in Ni2MnGa single crystals. Appl. Phys. Lett. 1996, 69, 1966. [Google Scholar] [CrossRef]
  9. Karaca, H.E.; Karaman, I.; Basaran, B.; Chumlyakov, Y.I.; Maier, H.J. Magnetic field and stress induced martensite reorientation in NiMnGa ferromagnetic shape memory alloy single crystals. Acta Mater. 2006, 54, 233–245. [Google Scholar] [CrossRef]
  10. Tickle, R.; James, R.D.; Shield, T.; Wuttig, M.; Kokorin, V.V. Ferromagnetic shape memory in the NiMnGa system. IEEE Trans. Magn. 1999, 35, 4301–4310. [Google Scholar] [CrossRef]
  11. Zhang, B.; Zhang, X.X.; Yu, S.Y.; Chen, J.L.; Cao, Z.X.; Wu, G.H. Giant magnetothermal conductivity in the Ni-Mn-In ferromagnetic shape memory alloys. Appl. Phys. Lett. 2007, 91, 012510. [Google Scholar] [CrossRef]
  12. Han, Z.D.; Wang, D.H.; Zhang, C.L.; Tang, S.L.; Gu, B.X.; Du, Y.W. Large magnetic entropy changes in the Ni45.4Mn41.5In13.1 ferromagnetic shape memory alloy. Appl. Phys. Lett. 2006, 89, 182507. [Google Scholar] [CrossRef]
  13. Khovaylo, V.V.; Skokov, K.P.; Gutfleisch, O.; Miki, H.; Takagi, T.; Kanomata, T.; Koledov, V.V.; Shavrov, V.G.; Wang, G.; Palacios, E.; et al. Peculiarities of the magnetocaloric properties in Ni-Mn-Sn ferromagnetic shape memory alloys. Phys. Rev. B 2010, 81, 214406. [Google Scholar] [CrossRef]
  14. Koyama, K.; Watanabe, K.; Kanomata, T.; Kainuma, R.; Oikawa, K.; Ishida, K. Observation of field-induced reverse transformation in ferromagnetic shape memory alloy Ni50Mn36Sn14. Appl. Phys. Lett. 2006, 88, 132505. [Google Scholar] [CrossRef]
  15. Yu, S.Y.; Yan, S.S.; Zhao, L.; Feng, L.; Chen, J.L.; Wu, G.H. Intermartensitic transformation and magnetic field effect in NiMnInSb ferromagnetic shape memory alloys. J. Magn. Magn. Mater. 2010, 322, 2541–2544. [Google Scholar] [CrossRef]
  16. Wang, Y.D.; Huang, E.W.; Ren, Y.; Nie, Z.H.; Wang, G.; Liu, Y.D.; Deng, J.N.; Choo, H.; Liaw, P.K.; Brown, D.E.; et al. In situ high-energy X-ray studies of magnetic-field-induced phase transition in a ferromagnetic shape memory Ni-Co-Mn-In alloy. Acta Mater. 2008, 56, 913–923. [Google Scholar] [CrossRef]
  17. Morito, H.; Fujita, A.; Oikawa, K.; Ishida, K.; Fukamichi, K.; Kainuma, R. Stress-assisted magnetic-field-induced strain in Ni-Fe-Ga-Co ferromagnetic shape memory alloys. Appl. Phys. Lett. 2007, 90, 062505. [Google Scholar] [CrossRef]
  18. Müllner, P.; Chernenko, V.A.; Kostorz, G. Large magnetic-field-induced deformation and magneto-mechanical fatigue of ferromagnetic Ni-Mn-Ga martensites. Mater. Sci. Eng. A 2004, 387–389, 965–968. [Google Scholar] [CrossRef]
  19. Zhang, Y.; Hughes, R.A.; Britten, J.F.; Preston, J.S.; Botton, G.A.; Niewczas, M. Self-activated reversibility in the magnetically induced reorientation of martensitic variants in ferromagnetic Ni-Mn-Ga films. Phys. Rev. B 2010, 81, 054406. [Google Scholar] [CrossRef]
  20. Kiefer, B.; Lagoudas, D.C. Magnetic field-induced martensitic variant reorientation in magnetic shape memory alloys. Philos. Mag. 2005, 85, 4289–4329. [Google Scholar] [CrossRef]
  21. Kainuma, R.; Imano, Y.; Ito, W.; Sutou, Y.; Morito, H.; Okamoto, S.; Kitakami, O.; Oikawa, K.; Fujita, A.; Kanomata, T.; et al. Magnetic-field-induced shape recovery by reverse phase transformation. Nature 2006, 439, 957–960. [Google Scholar] [CrossRef] [PubMed]
  22. Liang, T.; Jiang, C.B.; Xu, H.B.; Liu, Z.H.; Zhang, M.; Cui, Y.T.; Wu, G.H. Phase transition strain and large magnetic field induced strain in Ni50.5Mn24Ga25.5 unidirectionally solidified alloy. J. Magn. Magn. Mater. 2004, 268, 29–32. [Google Scholar] [CrossRef]
  23. Kiefer, B.; Karaca, H.E.; Lagoudas, D.C.; Karaman, I. Characterization and modeling of the magnetic field-induced strain and work output in Ni2MnGa magnetic shape memory alloys. J. Magn. Magn. Mater. 2007, 312, 164–175. [Google Scholar] [CrossRef]
  24. Sozinov, A.; Likhachev, A.A.; Lanska, N.; Ullakko, K. Giant magnetic-field-induced strain in NiMnGa seven-layered martensitic phase. Appl. Phys. Lett. 2002, 80, 1746. [Google Scholar] [CrossRef]
  25. Lanska, N.; Söderberg, O.; Sozinov, A.; Ge, Y.; Ullakko, K.; Lindroos, V.K. Composition and temperature dependence of the crystal structure of Ni-Mn-Ga alloys. J. Appl. Phys. 2004, 95, 8074. [Google Scholar] [CrossRef]
  26. Likhachev, A.A.; Sozinov, A.; Ullakko, K. Different modeling concepts of magnetic shape memory and their comparison with some experimental results obtained in Ni-Mn-Ga. Mater. Sci. Eng. A 2004, 378, 513–518. [Google Scholar] [CrossRef]
  27. Jin, X.; Marioni, M.; Bono, D.; Allen, S.M.; O’Handley, R.C.; Hsu, T.Y. Empirical mapping of Ni-Mn-Ga properties with composition and valence electron concentration. J. Appl. Phys. 2002, 91, 8222. [Google Scholar] [CrossRef]
  28. Pons, J.; Chernenko, V.A.; Santamarta, R.; Cesari, E. Crystal structure of martensitic phases in Ni-Mn-Ga shape memory alloys. Acta Mater. 2000, 48, 3027–3038. [Google Scholar] [CrossRef]
  29. Pagounis, E.; Chulist, R.; Szczerba, M.J.; Laufenberg, M. High-temperature magnetic shape memory actuation in a Ni-Mn-Ga single crystal. Scr. Mater. 2014, 83, 29–32. [Google Scholar] [CrossRef]
  30. Sozinov, A.; Likhachev, A.A.; Lanska, N.; Söderberg, O.; Ullakko, K.; Lindroos, V.K. Stress- and magnetic-field-induced variant rearrangement in Ni-Mn-Ga single crystals with seven-layered martensitic structure. Mater. Sci. Eng. A 2004, 378, 399–402. [Google Scholar] [CrossRef]
  31. Xiong, F.; Liu, Y.; Pagounis, E. Thermally induced fracture of single crystal Ni-Mn-Ga ferromagnetic shape memory alloy. J. Alloys Compd. 2006, 415, 188–192. [Google Scholar] [CrossRef]
  32. Zhang, X.X.; Witherspoon, C.; Müllner, P.; Dunand, D.C. Effect of pore architecture on magnetic-field-induced strain in polycrystalline Ni-Mn-Ga. Acta Mater. 2011, 59, 2229–2239. [Google Scholar] [CrossRef]
  33. Gaitzsch, U.; Romberg, J.; Pötschke, M.; Roth, S.; Müllner, P. Stable magnetic-field-induced strain above 1% in polycrystalline Ni-Mn-Ga. Scr. Mater. 2011, 65, 679–682. [Google Scholar] [CrossRef]
  34. Chmielus, M.; Zhang, X.X.; Witherspoon, C.; Dunand, D.C.; Müllner, P. Giant magnetic-field-induced strains in polycrystalline Ni-Mn-Ga foams. Nat. Mater. 2009, 8, 863–866. [Google Scholar] [CrossRef]
  35. Witherspoon, C.; Zheng, P.; Chmielus, M.; Dunand, D.C.; Müllner, P. Effect of porosity on the magneto-mechanical behavior of polycrystalline magnetic shape-memory Ni-Mn-Ga foams. Acta Mater. 2015, 92, 64–71. [Google Scholar] [CrossRef]
  36. Chiu, W.-T.; Sratong-on, P.; Tahara, M.; Chernenko, V.; Hosoda, H. Large magnetostrains of Ni-Mn-Ga/silicone composite containing system of oriented 5M and 7M martensitic particles. Scr. Mater. 2022, 207, 114265. [Google Scholar] [CrossRef]
  37. Sratong-on, P.; Chernenko, V.A.; Feuchtwanger, J.; Hosoda, H. Magnetic field-induced rubber-like behavior in Ni-Mn-Ga particles/polymer composite. Sci. Rep. 2019, 9, 3443. [Google Scholar] [CrossRef]
  38. Chiu, W.-T.; Sratong-on, P.; Tahara, M.; Chernenko, V.; Hosoda, H. Aging behavior of Ni-Mn-Ga/silicone particulate composites exhibiting large recoverable magnetostrain. Scr. Mater. 2023, 227, 115277. [Google Scholar] [CrossRef]
  39. Ranzieri, P.; Campanini, M.; Fabbrici, S.; Nasi, L.; Casoli, F.; Cabassi, R.; Buffagni, E.; Grillo, V.; Magén, C.; Celegato, F.; et al. Achieving Giant Magnetically Induced Reorientation of Martensitic Variants in Magnetic Shape-Memory Ni-Mn-Ga Films by Microstructure Engineering. Adv. Mater. 2015, 27, 4760–4766. [Google Scholar] [CrossRef]
  40. Straka, L.; Heczko, O. Magnetization changes in Ni-Mn-Ga magnetic shape memory single crystal during compressive stress reorientation. Scr. Mater. 2006, 54, 1549–1552. [Google Scholar] [CrossRef]
  41. Chernenko, V.A. Compositional instability of β-phase in Ni-Mn-Ga alloys. Scr. Acta. 1999, 40, 523–527. [Google Scholar] [CrossRef]
  42. Hosoda, H.; Inamura, T. Development of NiMnGa/Polymer Composite Materials. Mater. Sci. Forum. 2012, 706–709, 31–36. [Google Scholar] [CrossRef]
  43. Chiu, W.-T.; Sratong-on, P.; Chang, T.-F.M.; Tahara, M.; Sone, M.; Chernenko, V.; Hosoda, H. Bi-doping engineering of Ni-Mn-Ga polycrystals and resulting grain particles for smart Ni-Mn-Ga/polymer composites. J. Mater. Res. Technol. 2023, 23, 131–142. [Google Scholar] [CrossRef]
  44. Chiu, W.-T.; Goto, A.; Tahara, M.; Inamura, T.; Hosoda, H. Effects of volume fraction between single crystal Ni-Mn-Ga ferromagnetic shape memory alloy and silicone rubber on the martensite variant reorientation. J. Alloys Compd. 2022, 926, 166862. [Google Scholar] [CrossRef]
  45. Chiu, W.-T.; Goto, A.; Tahara, M.; Inamura, T.; Hosoda, H. Investigation of the martensite variant reorientation of the single crystal Ni-Mn-Ga alloy via training processes and a modification with a silicone rubber. Mater. Chem. Phys. 2023, 297, 127390. [Google Scholar] [CrossRef]
  46. Li, Z.; Li, Z.; Yang, B.; He, X.; Gan, W.; Zhang, Y.; Li, Z.; Zhang, Y.; Esling, C.; Zhao, X.; et al. Over 2% magnetic-field-induced strain in a polycrystalline Ni50Mn28.5Ga21.5 alloy prepared by directional solidification. Mater. Sci. Eng. A 2020, 780, 139170. [Google Scholar] [CrossRef]
  47. Wang, J.M.; Jiang, C.B.; Xu, H.B. Stress Induced and Magnetic Field Enhanced Twin Variants Reorientation in NiMnGa Single Crystal. Mater. Sci. Forum. 2005, 475–479, 2013–2016. [Google Scholar] [CrossRef]
  48. Hosoda, H.; Takeuchi, S.; Inamura, T.; Wakashima, K. Material design and shape memory properties of smart composites composed of polymer and ferromagnetic shape memory alloy particles. Sci. Technol. Adv. Mater. 2004, 5, 503. [Google Scholar] [CrossRef]
  49. Chulist, R.; Straka, L.; Sozinov, A.; Lippmann, T.; Skrotzki, W. Modulation reorientation in 10M Ni-Mn-Ga martensite. Scr. Mater. 2013, 68, 671–674. [Google Scholar] [CrossRef]
  50. Straka, L.; Heczko, O.; Hänninen, H. Activation of magnetic shape memory effect in Ni-Mn-Ga alloys by mechanical and magnetic treatment. Acta Mater. 2008, 56, 5492–5499. [Google Scholar] [CrossRef]
  51. Sratong-on, P.; Tahara, M.; Inamura, T.; Chernenko, V.A.; Hosoda, H. Compression response of Ni-Mn-Ga/silicone composite and study of three-dimensional deformation of particles. Smart Mater. Struct. 2018, 27, 085024. [Google Scholar] [CrossRef]
  52. Aaltio, I.; Söderberg, O.; Ge, Y.; Hannula, S.-P. Twin boundary nucleation and motion in Ni-Mn-Ga magnetic shape memory material with a low twinning stress. Scr. Mater. 2010, 62, 9–12. [Google Scholar] [CrossRef]
  53. Heczko, O.; Scheerbaum, N.; Gutfleisch, O. Magnetic shape memory phenomena. In Nanoscale Magnetic Materials and Applications; Liu, J., Fullerton, E., Gutfleisch, O., Sellmyer, D., Eds.; Springer: Boston, MA, USA, 2009. [Google Scholar]
  54. Sratong-on, P.; Chernenko, V.; Hosoda, H. Influence of internal stress on magnetostrain effect in Ni-Mn-Ga/polymer composite. Results Mater. 2019, 2, 100037. [Google Scholar] [CrossRef]
  55. Okamoto, N.; Fukuda, T.; Kakeshita, T. Magnetocrystalline anisotropy and twinning stress in Ni-Mn-Ga ferromagnetic shape memory alloys. J. Phys. Conf. Ser. 2006, 51, 315. [Google Scholar] [CrossRef]
  56. Straka, L.; Lanska, N.; Ullakko, K.; Sozinov, A. Twin microstructure dependent mechanical response in Ni-Mn-Ga single crystals. Appl. Phys. Lett. 2010, 96, 131903. [Google Scholar] [CrossRef]
  57. Straka, L.; Heczko, O.; Hannula, S.-P. Temperature dependence of reversible field-induced strain in Ni-Mn-Ga single crystal. Scr. Mater. 2006, 54, 1497–1500. [Google Scholar] [CrossRef]
  58. Heczko, O.; Straka, L.; Ullakko, K. Relation between structure, magnetization process and magnetic shape memory effect of various martensites occurring in Ni-Mn-Ga alloys. J. Phys. IV Fr. 2003, 112, 959–962. [Google Scholar] [CrossRef]
  59. Boonyongmaneerat, Y.; Chmielus, M.; Dunand, D.C.; Müllner, P. Increasing magnetoplasticity in polycrystalline Ni-Mn-Ga by reducing internal constraints through porosity. Phys. Rev. Lett. 2007, 99, 247201. [Google Scholar] [CrossRef]
  60. Chmielus, M.; Witherspoon, C.; Wimpory, R.C.; Paulke, A.; Hilger, A.; Zhang, X.; Dunand, D.C.; Müllner, P. Magnetic-field-induced recovery strain in polycrystalline Ni-Mn-Ga foam. J. Appl. Phys. 2010, 108, 123526. [Google Scholar] [CrossRef]
  61. Guo, S.H.; Zhang, Y.H.; Quan, B.Y.; Li, J.L.; Wang, X.L. Martensitic Transformation and Magnetic-Field-Induced Strain in Magnetic Shape Memory Alloy NiMnGa Melt-Spun Ribbon. Mater. Sci. Forum. 2005, 475–479, 2009–2012. [Google Scholar] [CrossRef]
Figure 1. Illustrations and evaluation methods for Specimen1-Specimen5 from (ae), respectively. (The cubic and rectangular dotted lines indicate the polymers (i.e., epoxy (blue) or silicone (yellow)). Red arrows with symbols of σ indicate the direction of the compressive stress to the composite materials, while the green doubled-arrow suggests the direction of the externally applied magnetic field (H-field). “Rotation” indicated by dark green arrows suggests the rotation of the electromagnets for the evaluations of the dependence of MVR on the crystallographic orientation of Specimen2. A coordinate is inserted in the column of Specimen1, which is responsible from (a) Specimen1 to Specimen4, while another coordinate, which is inserted in the column of (e) Specimen5, is responsible for Specimen5 only).
Actuators 12 00211 g001
Figure 2. Flow chart for the fabrication of specimens. (a) Preparation for the {100}p single-crystal Ni-Mn-Ga alloys. (b) General fabrication processes for various composite materials (Details are described in Section 2.3).
Actuators 12 00211 g002
Figure 3. The setting of the specimens in VSM for analyzing the magnetic properties of the specimen in various crystallographic directions. (a) An illustration to show the side-view of the specimen and two electromagnets in VSM. (b) An illustration of the {100}p single-crystal Ni-Mn-Ga cube and its crystallographic directions. (c) A top-view of VSM to reveal the measurement of the magnetic property along <110>p of the {100}p single-crystal Ni-Mn-Ga cube. (d) A top-view of VSM to reveal the measurement of the magnetic property along <111>p of the {100}p single-crystal Ni-Mn-Ga cube.
Actuators 12 00211 g003
Figure 4. (a) An illustration of the 13 vol.% {100}p single-crystal Ni-Mn-Ga cube/epoxy composite. The solid gray small cube in the center indicates the {100}p single-crystal Ni-Mn-Ga cube, while the dotted blue large cube corresponds to the epoxy matrix. The symbols σ in the solid red arrows reveal the compression strain direction of the external compressive stress. The micro CT images of the 13 vol.% {100}p single-crystal Ni-Mn-Ga cube/epoxy composite (b) before compression (i.e., 0% compression strain), (c) after compression (i.e., 30% compression strain), and (d) after removal of the external compressive strain. The vertical red lines and horizontal blue lines with doubled arrows indicate the heights and the widths of the {100}p single-crystal Ni-Mn-Ga cube, respectively. All the observations were conducted at RT under ambient.
Actuators 12 00211 g004
Figure 5. The Stress-Strain (S-S) curve of the 13 vol.% {100}p single-crystal Ni-Mn-Ga cube/epoxy composite examined at RT under ambient (an illustration for the compression test is inserted).
Actuators 12 00211 g005
Figure 6. (a) An illustration of the 13 vol.% {100}p single-crystal Ni-Mn-Ga cube/epoxy composite. The solid gray small cube in the center indicates the {100}p single-crystal Ni-Mn-Ga cube, while the dotted blue large cube corresponds to the epoxy matrix. The magnetic field, which is labeled by “H-field” along with a green transparent doubled-arrow, reveals the direction of the externally applied magnetic field. The micro CT images of the 13 vol.% {100}p single-crystal Ni-Mn-Ga cube/epoxy composite at (b) 0, (c) 3, and (d) 3.75 kOe of an externally applied magnetic field. The vertical red lines and blue lines with arrows indicate the heights and the widths of the {100}p single-crystal Ni-Mn-Ga cube, respectively. All the observations were conducted at RT under ambient.
Actuators 12 00211 g006
Figure 7. The magnetization-magnetic field (M-H) curves of the 13 vol.% {100}p single-crystal Ni-Mn-Ga cube/epoxy composite at RT under ambient. The magnetic field was parallel to the <100>p of the {100}p single-crystal Ni-Mn-Ga cube. The red arrows, along with numbers, indicate the sequence of the scanning of a magnetic field.
Actuators 12 00211 g007
Figure 8. The magnetization-magnetic field (M-H) curves of the {100}p single-crystal Ni-Mn-Ga cube at RT under ambient. The magnetic field was parallel to the <110>p of the {100}p single-crystal Ni-Mn-Ga cube. Red arrows along with numbers indicate the sequence of the scanning of the magnetic field applied, while the horizontal dashed lines and doubled-arrow indicate the “jump” of magnetization corresponding to the magnetic field-induced MVR of the {100}p single-crystal Ni-Mn-Ga cube.
Actuators 12 00211 g008
Figure 9. (a) An illustration reveals the relationships among a magnetic field direction applied, magnetization, and the easy-axis of the c-axis. Symbols H and M indicate the magnetic field and the magnetization, respectively, while symbols γ and θ suggest the angle difference of the magnetic field and magnetization to the easy c-axis of the Ni-Mn-Ga alloy. (b) Three variants of the 5M-martensite Ni-Mn-Ga alloy without the introduction of an externally applied compressive stress. The c-axis, which is highlighted by the bright, bold green lines, corresponds to the easy c-axis of the 5M-martensite Ni-Mn-Ga alloy. The twin boundary of Variant1 and Variant2 is zoomed-in on the right-hand side. (c) Three variants of the 5M-martensite Ni-Mn-Ga alloy with the introduction of an externally applied compressive stress. The twin boundary of Variant1 and Variant2 is zoomed-in on the right-hand side. The red arrows, along with a symbol of σ, indicate the direction of the compressive stress. The dotted lines indicate the place of the variant interfaces before the compressive stress is applied.
Actuators 12 00211 g009
Figure 10. Plot for the magnetic field as a function of rotation angle from (a) <100>p to <110>p (i.e., from 0° to 45°) and from (b) <100>p to <111>p (i.e., from 0° to 54.7°). The solid blue squares indicate the {100}p single-crystal Ni-Mn-Ga cube, the solid red circles suggest the 30 vol.% {100}p single-crystal Ni-Mn-Ga cube/silicone composite, and the cross symbols reveal the disappearance of the twin motion. The vertical dashed lines at 0° and 45° indicate the rotation from <100>p to <110>p in (a), while the vertical dashed lines at 0° and 54.7° indicate the rotation from <100>p to <111>p in (b). Illustrations are inserted in the figures, respectively, to reveal the relationships between the magnetic field and the crystallographic directions.
Actuators 12 00211 g010
Figure 11. Plot for the shear stress (τ) as a function of rotation angle (θ) from (a) <100>p to <110>p (i.e., from 0° to 45°) and from (b) <100>p to <111>p (i.e., from 0° to 54.7°). The blue solid squares indicate the {100}p single-crystal Ni-Mn-Ga cube, the solid red circles suggest the 30 vol.% {100}p single-crystal Ni-Mn-Ga cube/silicone composite, and the cross symbols reveal the disappearance of the twin motion. The vertical dashed lines at 0° and 45° indicate the rotation from <100>p to <110>p in (a), while the vertical dashed lines at 0° and 54.7° indicate the rotation from <100>p to <111>p in (b).
Actuators 12 00211 g011
Figure 12. Illustration for revealing the regimes for apparent MVR and inapparent MVR via the introduction of an external magnetic field. The bottom figure displays the three directions of <100>p, <110>p, and <111>p in the parent Ni-Mn-Ga alloy by using solid blue arrows, while the zoomed-in figure, which shows the details, is illustrated at the upper part. The triangle filled with purple straight lines (at the left-hand side) indicates the regime allowing the MVR (i.e., MVR ◯), while the un-filled triangle (at the right-hand side) suggests the regime not allowing MVR (i.e., MVR −). Angles represent the rotation angles from <100>p to <110>p or <111>p.
Actuators 12 00211 g012
Figure 13. (a) An illustration of the 20 vol.% two Ni-Mn-Ga cubes/silicone composite. The left small solid gray cube indicates the {100}p single-crystal Ni-Mn-Ga cube (active), while the right large solid gray cube suggests the polycrystalline Ni-Mn-Ga cube (inactive). The large dashed yellow rectangular corresponds to the silicone matrix. The symbols σ in the solid red arrows reveal the compression direction of the external compressive field. The micro CT images of the 20 vol.% two Ni-Mn-Ga cubes/silicone composite (b) before compression (i.e., 0% compression strain), (c) after compression (i.e., 20% compression strain), and (d) after removal of the external compressive strain. The vertical red lines and horizontal blue lines with arrows indicate the heights and the widths of both the Ni-Mn-Ga cubes, respectively. All the observations were conducted at RT under ambient.
Actuators 12 00211 g013
Figure 14. (a) An illustration of the 25 vol.% two Ni-Mn-Ga cubes/silicone composite along with an externally applied magnetic field (H-field). The left small solid gray cube indicates the {100}p single-crystal Ni-Mn-Ga cube (active), while the right large solid gray cube suggests the polycrystal Ni-Mn-Ga cube (inactive). The large dashed yellow rectangular corresponds to the silicone matrix. The green doubled-arrow indicates the direction of an externally applied magnetic field. The micro CT images of the 25 vol.% two Ni-Mn-Ga cubes/silicone composite (b) before a magnetic field applied (i.e., 0 kOe) and (c) after a magnetic field applied (i.e., 3.3 kOe). The vertical red lines and horizontal blue lines with arrows indicate the heights and the widths of both the Ni-Mn-Ga cubes, respectively. All the observations were conducted at RT under ambient.
Actuators 12 00211 g014
Figure 15. (a) The (004)m pole figure (2θ = 66.4°) of the {100}p single-crystal Ni-Mn-Ga with a plate structure (i.e., 6.6 × 6.0 × 1.7 mm3) and (b) the calculated pole figure of the {100}p single-crystal Ni-Mn-Ga alloy. (The red circle symbols correspond to the {100}p, while the blue square symbols represent the {101}p). For the coordinate of the specimen, please refer to Figure 1. (The subscript m indicates the martensite phase.).
Actuators 12 00211 g015
Figure 16. The magnetization-magnetic field (M-H) curves of the 50 vol.% single-crystal Ni-Mn-Ga plate/silicone composite (Specimen5) in (a) the 1st run, (b) the 5th run, and (c) the 10th run for the purpose of training. All the M-H curves were recorded at RT under ambient. An illustration, which reveals the direction of the applied magnetic field to the composite material, is inserted in (a). Red tangent lines and red arrows are labeled to show the sudden increment of the magnetization.
Actuators 12 00211 g016
Disclaimer/Publisher’s Note: The statements, opinions and data contained in all publications are solely those of the individual author(s) and contributor(s) and not of MDPI and/or the editor(s). MDPI and/or the editor(s) disclaim responsibility for any injury to people or property resulting from any ideas, methods, instructions or products referred to in the content.

