Article

SARS-CoV-2 Variants by Whole-Genome Sequencing in a University Hospital in Bangkok: First to Third COVID-19 Waves

by
Chayanee Setthapramote
1,†,
Thanwa Wongsuk
1,†,
Chuphong Thongnak
1,
Uraporn Phumisantiphong
1,2,
Tonsan Hansirisathit
2 and
Maytawan Thanunchai
1,3,*
1
Department of Clinical Pathology, Faculty of Medicine Vajira Hospital, Navamindradhiraj University, Bangkok 10300, Thailand
2
Department of Central Laboratory and Blood Bank, Faculty of Medicine Vajira Hospital, Navamindradhiraj University, Bangkok 10300, Thailand
3
Division of Clinical Microbiology, Department of Medical Technology, Faculty of Associated Medical Sciences, Chiang Mai University, Chiang Mai 50200, Thailand
*
Author to whom correspondence should be addressed.
These authors contributed equally to this work.
Pathogens 2023, 12(4), 626; https://doi.org/10.3390/pathogens12040626
Submission received: 18 February 2023 / Revised: 30 March 2023 / Accepted: 17 April 2023 / Published: 21 April 2023
(This article belongs to the Topic Acute Respiratory Viruses Molecular Epidemiology)

Abstract

:
Background: Multiple severe acute respiratory syndrome coronavirus 2 (SARS-CoV-2) variants emerged globally during the recent coronavirus disease (COVID-19) pandemic. From April 2020 to April 2021, Thailand experienced three COVID-19 waves, and each wave was driven by different variants. Therefore, we aimed to analyze the genetic diversity of circulating SARS-CoV-2 using whole-genome sequencing analysis. Methods: A total of 33 SARS-CoV-2 positive samples from three consecutive COVID-19 waves were collected and sequenced by whole-genome sequencing, of which, 8, 10, and 15 samples were derived from the first, second, and third waves, respectively. The genetic diversity of variants in each wave and the correlation between mutations and disease severity were explored. Results: During the first wave, A.6, B, B.1, and B.1.375 were found to be predominant. The occurrence of mutations in these lineages was associated with low asymptomatic and mild symptoms, providing no transmission advantage and resulting in extinction after a few months of circulation. B.1.36.16, the predominant lineage of the second wave, caused more symptomatic COVID-19 cases and contained a small number of key mutations. This variant was replaced by the VOC alpha variant, which later became dominant in the third wave. We found that B.1.1.7 lineage-specific mutations were crucial for increasing transmissibility and infectivity, but not likely associated with disease severity. There were six additional mutations found only in severe COVID-19 patients, which might have altered the virus phenotype with an inclination toward more highly pathogenic SARS-CoV-2. Conclusion: The findings of this study highlighted the importance of whole-genome analysis in tracking newly emerging variants, exploring the genetic determinants essential for transmissibility, infectivity, and pathogenicity, and helping better understand the evolutionary process in the adaptation of viruses in humans.

1. Introduction

Three years have passed since the world faced the major challenges caused by the coronavirus disease (COVID-19) crisis; when the crisis will end remains unknown. The disease is caused by severe acute respiratory syndrome coronavirus 2 (SARS-CoV-2), which first appeared in Wuhan, China, in late December 2019. Since then, it has infected more than 700 million people and caused over 6 million deaths globally [1]. The more the virus circulates, the greater the chance for mutations to occur; as a process, viral evolution randomly generates a large number of variants with either more or fewer pathogenic characteristics [2,3]. Genomic diversity based on whole-genome sequencing (WGS) data can precisely identify evolving variants and their hotspot mutations, which is beneficial for tracking the spread of the virus, predicting disease outcomes, and guiding vaccine and therapeutic development [4].
According to the current situation, the omicron variant (B.1.1.529) and its sub-lineages are designated as variants of concern (VOC) and variants of interest (VOI). Only the Omicron sub-lineage BA.2 listed in VOC harbors mutations that have a potential impact on increased transmissibility. All VOC and VOI omicron sub-lineages exhibited reduced severity but increased immune evasiveness. Therefore, the effectiveness of vaccines to protect against omicron was reduced [5,6]. Previous VOCs that were once a global threat, such as alpha (B.1.1.7), beta (B.1.351), gamma (P.1), and delta (B.1.672), are listed as de-escalated variants due to no longer circulating and having little impact on the current epidemiological situation. The circulating VOC omicron variant shares some mutations with the alpha (S:N501Y, P681H) and delta (S:T478K, T478K, E484A) variants, which have been proven to be evolutionary selective benefits for the virus [7,8].
In Thailand, we encountered five COVID-19 surges over the past three years, resulting in a cumulative total of 4 million confirmed cases and 33,882 deaths [9]. Several variants and lineages were introduced to regions in various ways, such as human travel, the migrant movement of workers, and crowded entertainment venues. The first wave of COVID-19 initially spread at boxing stadiums and nightlife venues in March 2020, with 3042 cases and 57 deaths being reported [10]. A.6 and B.1 were the dominant lineages. Most of the patients had asymptomatic and mild upper respiratory symptoms, such as fever, cough, and sore throat. The number of confirmed cases in the first wave subsided in May 2020 due to the successful implementation of public health and social measures as well as a full lockdown [11,12]. Six months later, a large number of illegal migrant workers crossed the borders into Thailand for work and carried the B.1.36.16 lineage with them. Due to having asymptomatic or mild symptoms, migrant workers might have inadvertently spread the virus, thus triggering the second wave, which caused over 20,000 confirmed cases in 2.5 months [10,13]. The successful containment of the pandemic throughout the year was interrupted by the third wave outbreak in April 2021, when alpha-B.1.1.7 was the main variant. The outbreak started in pubs, bars, and restaurants, resulting in 127,000 cases throughout Thailand, which was six times greater than that in the second wave [10]. From July 2021 to December 2021, the fourth wave was encountered, which was driven by the highly contagious delta-B.1.672 variant. This surge was the worst outbreak in terms of having the highest infection rates and death toll, resulting in the collapse of the public health system [14]. At the time of preparing the manuscript, we were living with omicron sub-lineages, for which the cumulative case numbers were greater than the previous outbreak, though the symptoms caused by these variants were milder [15]. Over 70% of Thailand’s population was fully vaccinated [9]. People with confirmed or suspected COVID-19 could be isolated at home, and all preventive measures were implemented continuously.
Before the mass COVID-19 vaccination roll-out in Thailand, SARS-CoV-2 variants from the first, second, and third waves spread extensively among populations who were not immune to the disease. The mutations that emerged during this period were likely to develop independently of immune selective pressures. Therefore, this study aimed to explore the genotypes of SARS-CoV-2 lineages that circulated from the first to the third waves. We performed WGS using clinical samples collected from Vajira Hospital, Bangkok, Thailand between April 2020 and April 2021. Viral mutations associated with disease severity were characterized.

2. Materials and Methods

2.1. Ethical Approval

This study was approved by The Ethical Review Board of the Faculty of Medicine, Vajira Hospital, Navamindradhiraj University (approval ID COA 049/2563). The informed consent was waived due to all samples being anonymous.

2.2. Sample Selection and Viral RNA Extraction

Forty nasopharyngeal swab (NPS) specimens of COVID-19-suspected patients routinely sent for diagnosis at the Molecular Laboratory Unit, Division of Central Laboratory and Blood Bank, Faculty of Medicine, Vajira Hospital, Navamindradhiraj University from April 2020 to April 2021 were selected for RNA extraction and WGS. Viral RNA of COVID-19 cases confirmed by a routine method were extracted using QIAamp Viral RNA Mini kit (QIAGEN, Qiagen, Germantown, MD, USA) following the manufacturer’s instructions.

2.3. Collection of Demographic and Clinical Data

The demographic and clinical data, including sex, age, clinical features, inpatient/outpatient status, and comorbidities, were retrieved from medical records. The disease severity was classified as asymptomatic, mild, moderate, severe, and critical illnesses according to World Health Organization; asymptomatic (laboratory-confirmed patients without COVID-19 symptoms), mild (fever and upper respiratory symptoms with no signs of pneumonia), moderate (fever and respiratory symptoms with evidence of lower respiratory disease), severe (oxygen saturation < 94%, ratio of arterial partial pressure of oxygen to fraction of inspired oxygen < 300 mm Hg, respiratory rate > 30 breaths/min, or lung infiltration > 50%), and critical (respiratory failure, septic shock, and/or multiple organ failure) [16].

2.4. WGS and Phylogenetic Tree

2.4.1. WGS of the First Wave

Nine samples from April 2020 were subjected to WGS using an Atoplex System, in accordance with the manufacturer’s protocol. In brief, 10 uL of RNA were reverse transcribed to cDNA. Then, the DNA library which contained a Dual barcode adaptor was performed by two-step multiplex PCR to amplify the RNA target region. The pooled DNA library was used to create circularized single strand DNA (ssCirDNA) by following the protocol of ATOPlex RNA Universal Library Preparation Kit (MGI Tech Co., Ltd., Shenzhen, China). DNA nanoball (DNB) was generated from ssCirDNA for subsequent sequencing on MGISEQ-2000RS sequencer by following the protocol of MGISEQ-2000RS High-throughput Sequencing Set (MGI Tech Co., Ltd., Shenzhen, China). The sequences were cleaned and retrieved by the bioinformatician at the Medical Genome Company, Bangkok, Thailand.
After obtaining sequencing read in FASTQ format, the bioinformatic analysis is done by the iGVD software following the iGenomeVirusDetector User Guide (Genome Wisdom (Beijing, China) Gene Technology Co., Ltd.).

2.4.2. WGS of the Second and Third Waves

A total of 31 samples collected during December 2020 to April 2021 were analyzed using the Ion Proton system (Thermo Fisher Scientific, Waltham, MA, USA) following the manufacturer’s protocol. The Ion AmpliSeq SARS-CoV-2 research panel used in this study contains 247 amplicons in two pools targeting the SARS-CoV-2 genome with >99% coverage. The library preparation of amplified samples was performed on the Ion OneTouch 2 System and then sequenced on the Ion Proton system (Thermo Fisher Scientific, Waltham, MA, USA) at the Center of Medical Genomics, Ramathibodi Hospital, Mahidol University, Thailand.
For data analysis, the sequencing reads were processed with the Ion Proton software plug-ins coverageAnalysis, IRMAreport, AssemblerTrinity, variantCaller (Torrent Suite software v5.20, with germline low-stringency settings according to the TS5.20 user guide), and GenerateConsensus (Ion AmpliSeq SARS-CoV-2 Insight research assay). Coverage analysis was set to a minimum depth of 30 reads. The consensus sequence was obtained directly from the IRMAreport and GenerateConsensus as the fasta file format. The consensus sequences were assessed using NextClade (https://clades.nextstrain.org/, version 1.9.0, accessed on 1 October 2021) for sequence clade assignment, identification quantification of mutations, and sequence quality analyses.

2.4.3. Phylogenetic Tree

To assess the evolutionary relationships among the studied sequences, we aligned the sequence using an online version of MAFFT version 7 (https://mafft.cbrc.jp/alignment/server/, accessed on 13 February 2022). Then, evolutionary history was inferred using the maximum likelihood method. The best models of evolution for the dataset were selected from the Bayesian Information Criterion (BIC) of MEGA 11: Molecular Evolutionary Genetics Analysis across computing platforms [17]. The model with the lowest BIC score was selected to construct a maximum likelihood phylogenetic tree. The percentage of trees in which the associated taxa clustered together was shown next to the branches. The initial tree for the heuristic search was automatically obtained by the application of the Neighbor-Join and BioNJ algorithms to a matrix of pairwise distances estimated using the maximum composite likelihood (MCL) approach. We then selected the topology associated with a superior log likelihood value. The tree was drawn to scale, with branch lengths representing the number of substitutions per site. A bootstrap analysis was conducted using 500 replicates, and bootstrap values  ≥50% are shown above branches.

2.5. SARS-CoV-2 Lineage Classification

Consensus FASTA files of SAR-CoV2 genomic sequences were uploaded to the Pangolin web service to assign the most likely SARS-CoV-2 lineage to our samples (Pango nomenclature) [18]. CoVsurver online server (CoVsurver—CoronaVirus Surveillance Server, 2021) was used for GISAID clade assignment.

3. Result

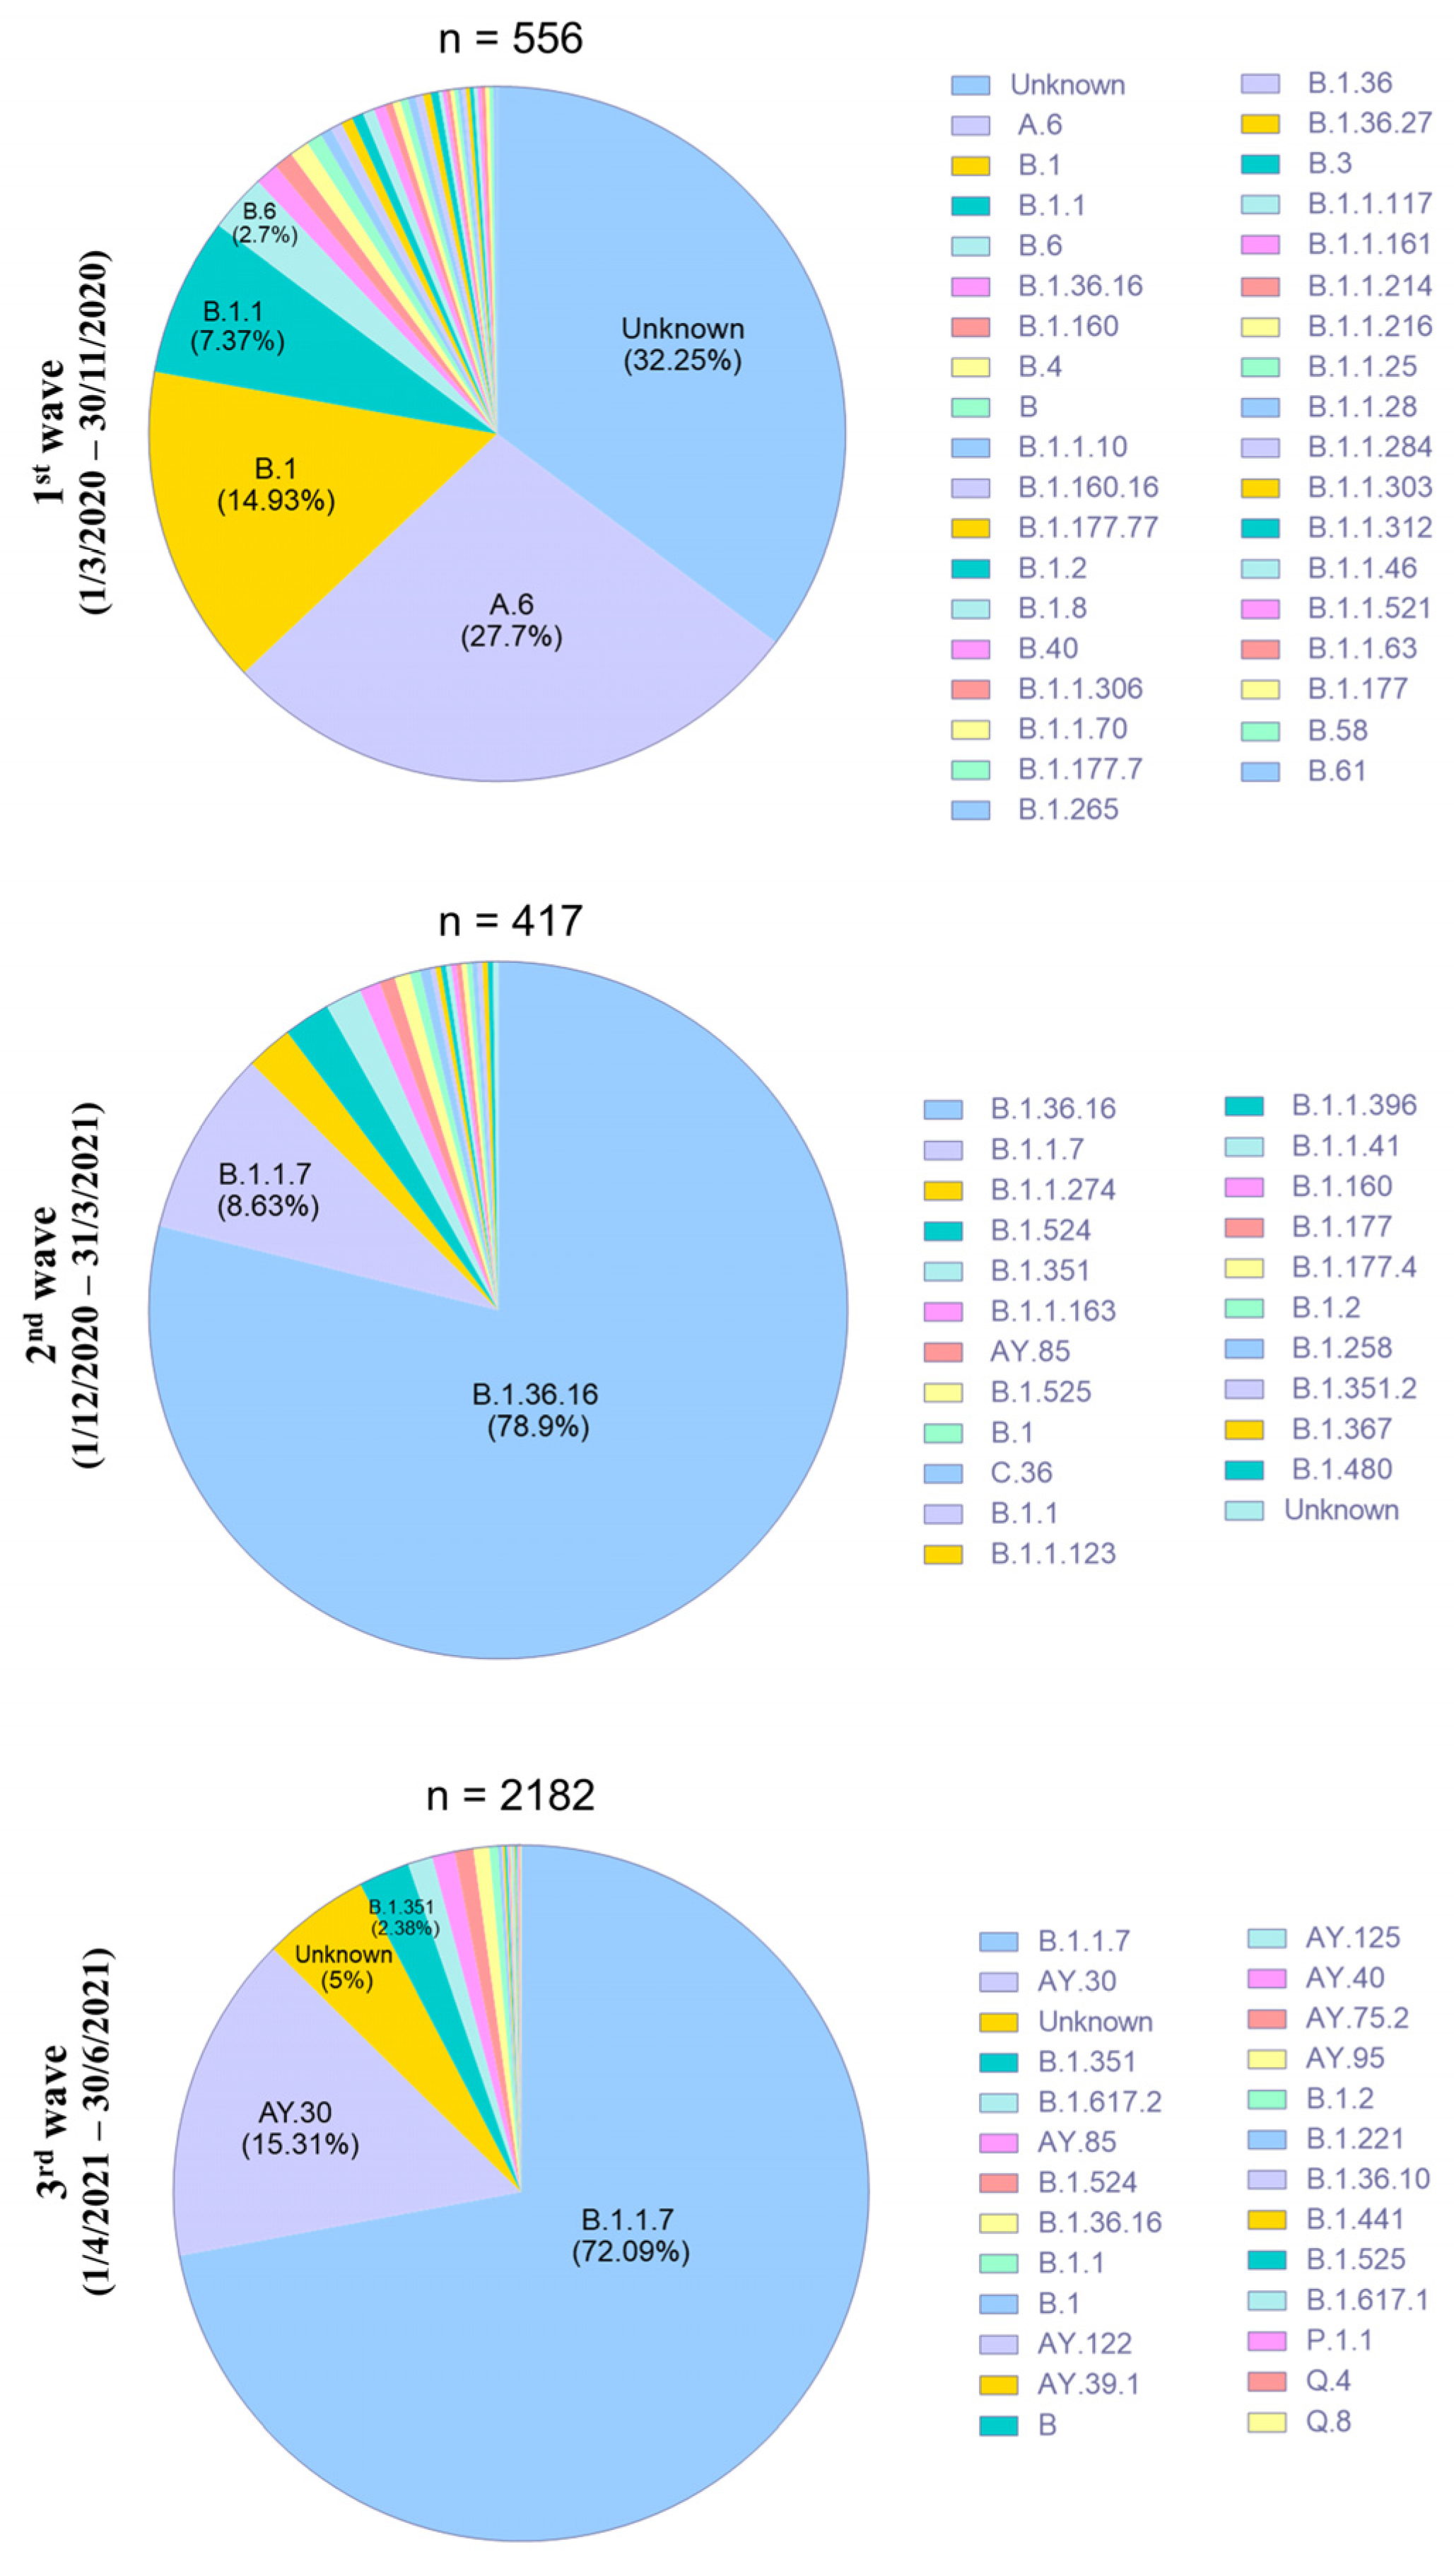
3.1. Distribution of Three Waves of COVID-19 Outbreaks in Thailand

The COVID-19 situation in Thailand was divided into distinct waves driven by different dominant SARS-CoV-2 strains. In this context, the first (March 2020–November 2020), second (December 2020–March 2021), and third (April 2021–June 2021) waves were studied. The first wave of the SARS-CoV-2 outbreak started in early March 2020 and peaked between the 22 and 31 March 2020 (188 cases/day). The number of confirmed cases never exceeded 200 cases per day. For the second wave, a peak of transmission (959 cases/day) started on the 26 January 2021 until the 4 February 2021 with less than 1000 new COVID-19 cases per day. At the beginning of the third wave in early April 2021, the number of cases started to increase rapidly. A record of 9635 new cases, which was the highest daily number of cases since the pandemic began, was reported on 17 May 2021. The average number of new COVID-19 cases reported per day during this wave was nearly 3000 (Figure 1).
A total of 40 NPS swabs were collected from 40 confirmed COVID-19 patients who acquired the virus by local transmission and were subjected to WGS study. Given the poor genomic coverage (<95%), seven samples were excluded from the analysis. Thirty-three samples passed the Chi-square test performed by IQ-TREE multicore version 1.6.12 and were analyzed to represent the first, second, and third waves of the SARS-CoV-2 outbreak in the hospital (Table 1). The samples collected from travelers or residents returning home in the state quarantine were not included in the study. Viral lineages were assigned using Pangolin online software (https://cov-lineages.org/pangolin.html; accessed on 30 November 2021), respectively. Four viral Pangolin lineages (A.6, B, B.1, and B.1.375) were identified in eight samples collected during the first wave. All ten samples obtained during the second wave belonged to the B.1.36.16 lineage. This lineage disappeared quickly and was replaced by B.1.1.7 in approximately three months. Thus, all 15 samples collected in the third wave were B.1.1.7 and Q lineages (14 for B.1.1.7 and 1 for Q.3).
The shared SARS-CoV-2 data were retrieved by CoV spectrum, showing that 27.7% of A.6 in the first wave, 78.9% of B.1.36.16 in the second wave, and 72.1% of B.1.1.7 in the third wave were sequenced from clinical samples in Thailand and submitted to the database (Figure 2). Thus, A.6, B.1.36.16, and B.1.1.7 were the predominant lineages that circulated in the first, second, and third waves, respectively. Of note, B.1.36.16 was detected in very low frequency (1%) during the first wave, while a small number (8.63%) of B.1.1.7 was found in the second wave, demonstrating that these lineages had already emerged and circulated for a few months before becoming dominating variants of the second and third waves. The B.1.375 and Q.3 found in the samples for the current study had not been previously recorded in Thailand’s database.

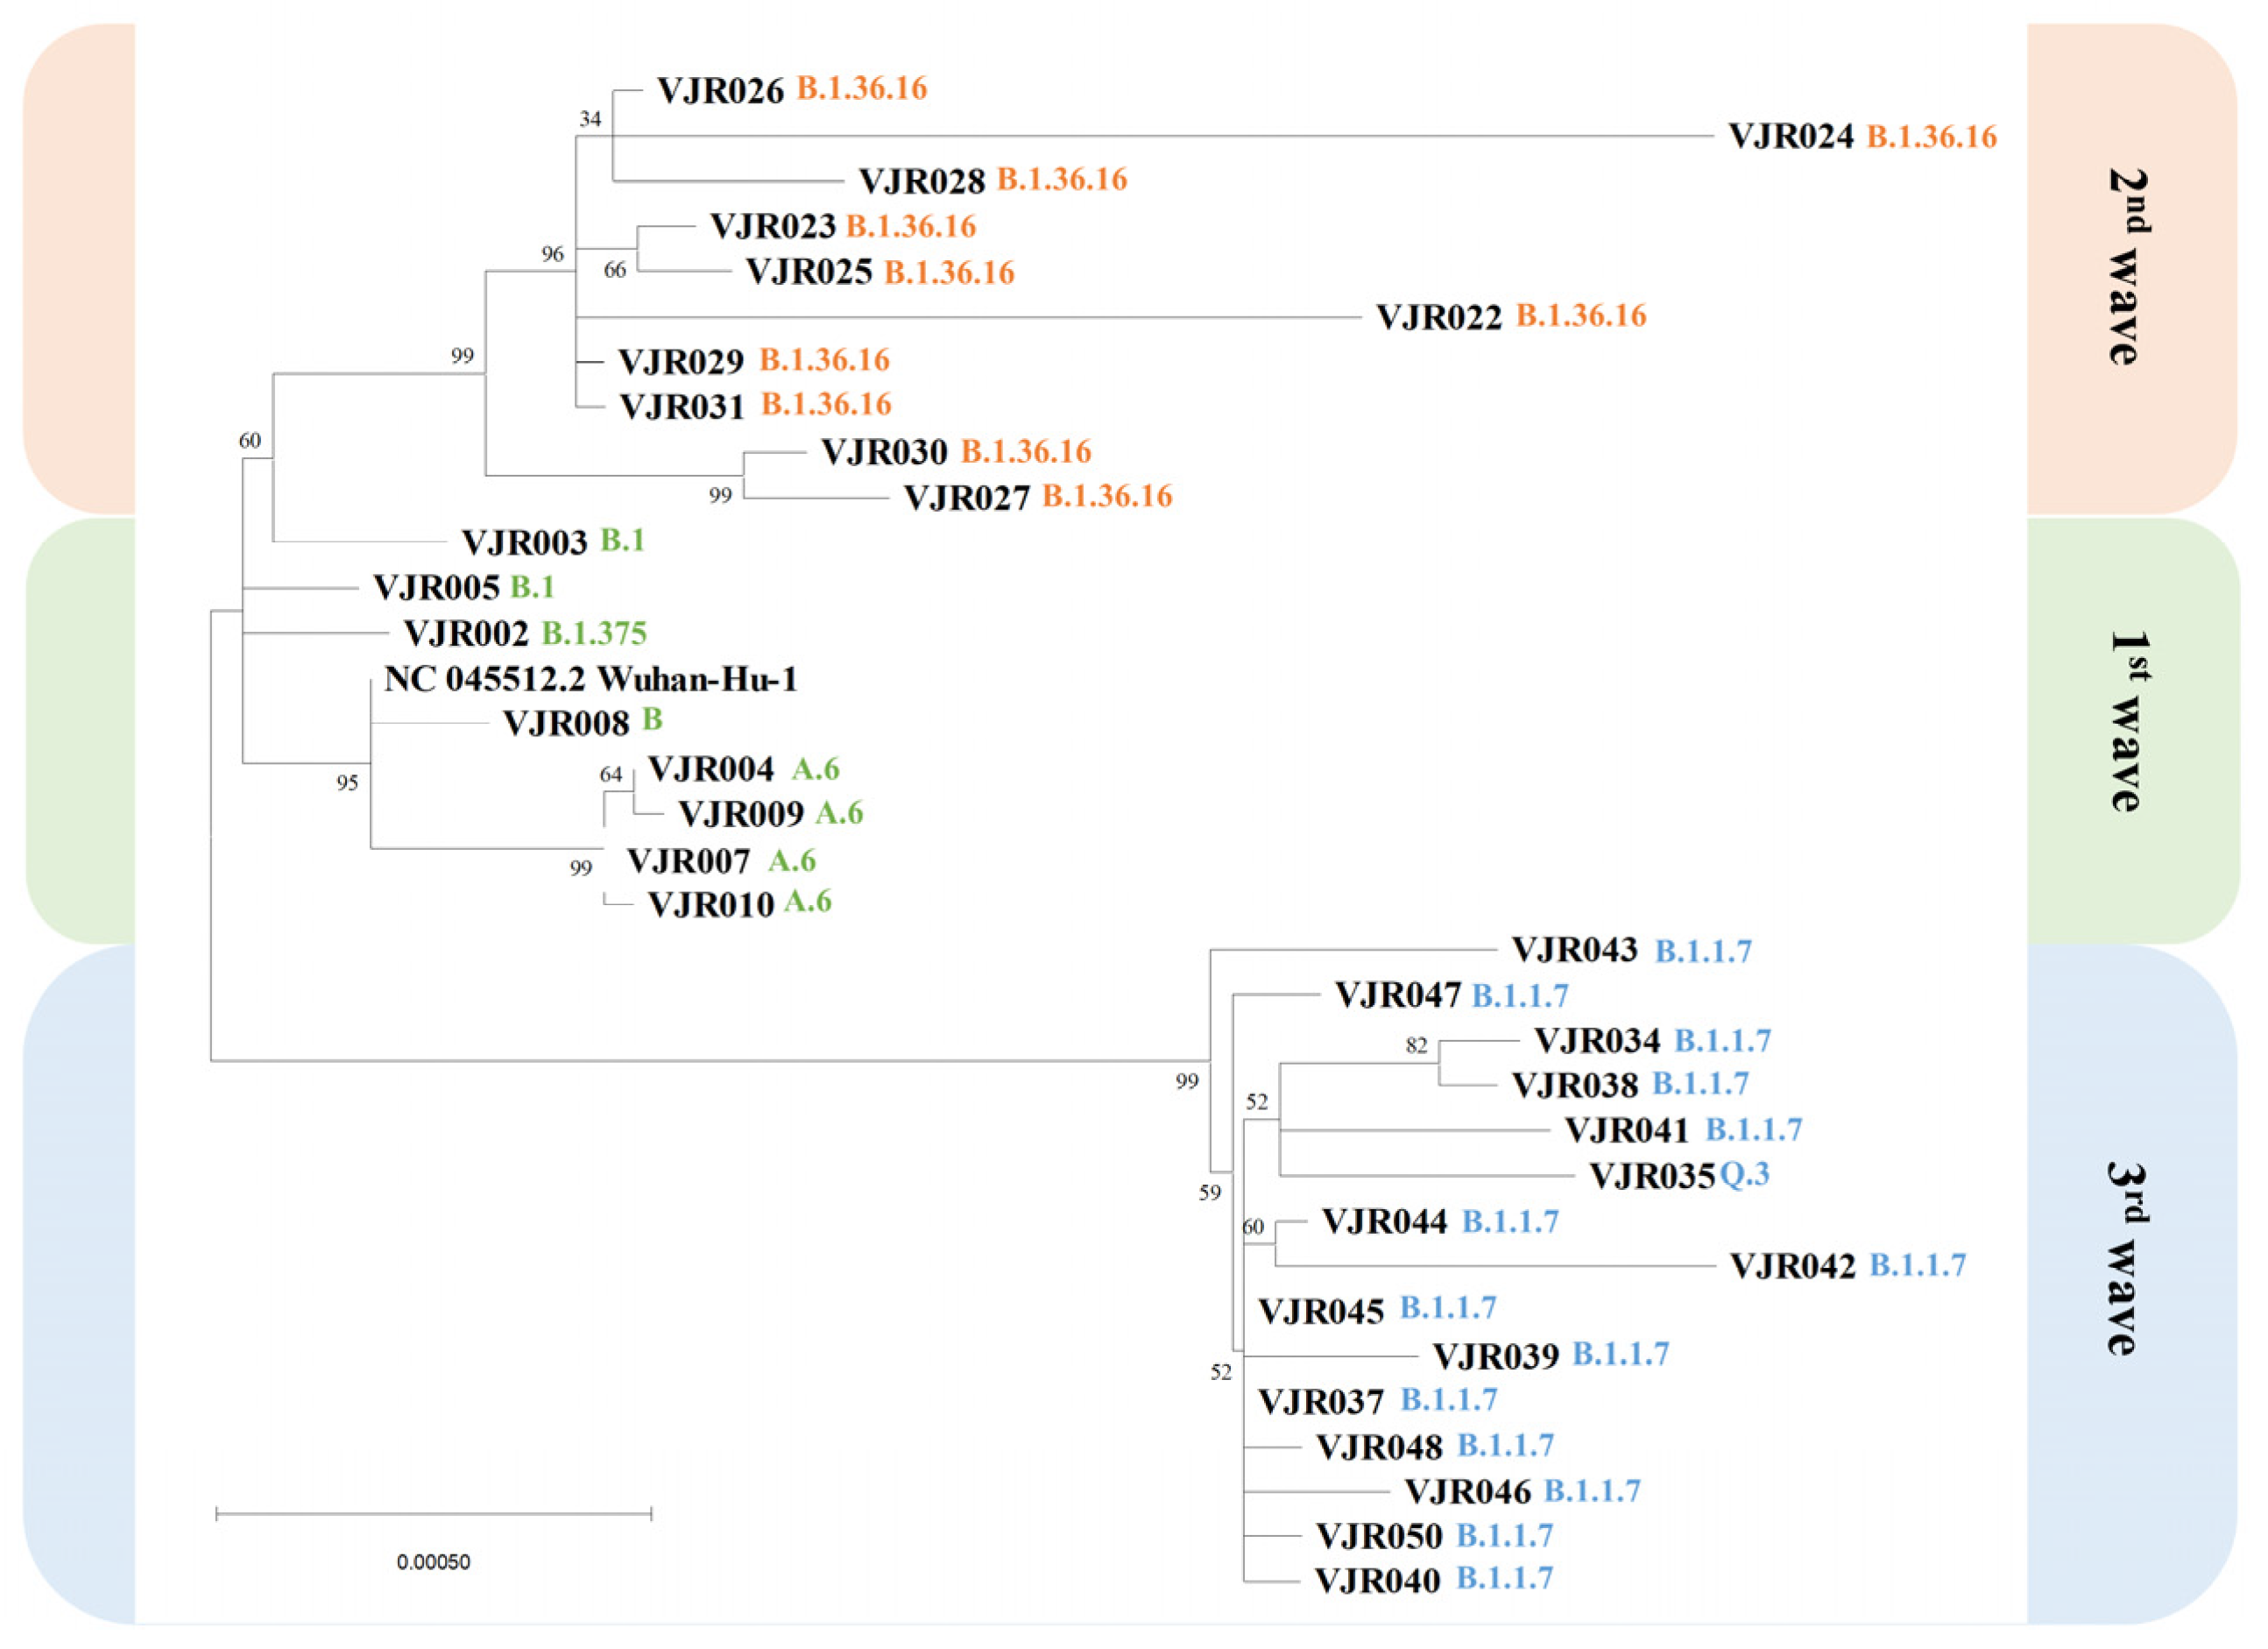
3.2. Phylogenetic Tree

This study assessed the genetic relationship in the samples by building a phylogenetic tree in MEGA11 [17]. The T93:Tamura–Nei parameter model and the nonuniformity of evolutionary rates among sites can be modeled by using a discrete gamma distribution (+G), with five rate categories selected based on the best model of evolution analyses (BIC score: 87244.0255270594). Subsequently, a phylogenetic tree was constructed by maximum likelihood analysis based on the T93 + G model with 500 replications of bootstrap analysis. The tree with the highest log likelihood (−43190.83) was shown. A + G was used to model the evolutionary rate differences among sites [5 categories (+G, parameter = 0.0500)]. As a tree (Figure 3), 34 nucleotide sequences were involved. The codon positions included were 1st + 2nd + 3rd + Noncoding. A total of 30,266 positions were included in the final dataset.
The evolutionary analysis revealed the circulation of B, B.1, B.1.375, and A.6 lineages during the first wave of the selected samples at the hospital and demonstrated genetic relations to the Wuhan-Hu-1 isolate (NC_045512.2). Meanwhile, B.1.36.16 and alpha (B.1.1.7 and Q lineages) were detected during the second and third waves of infection at the hospital, respectively.

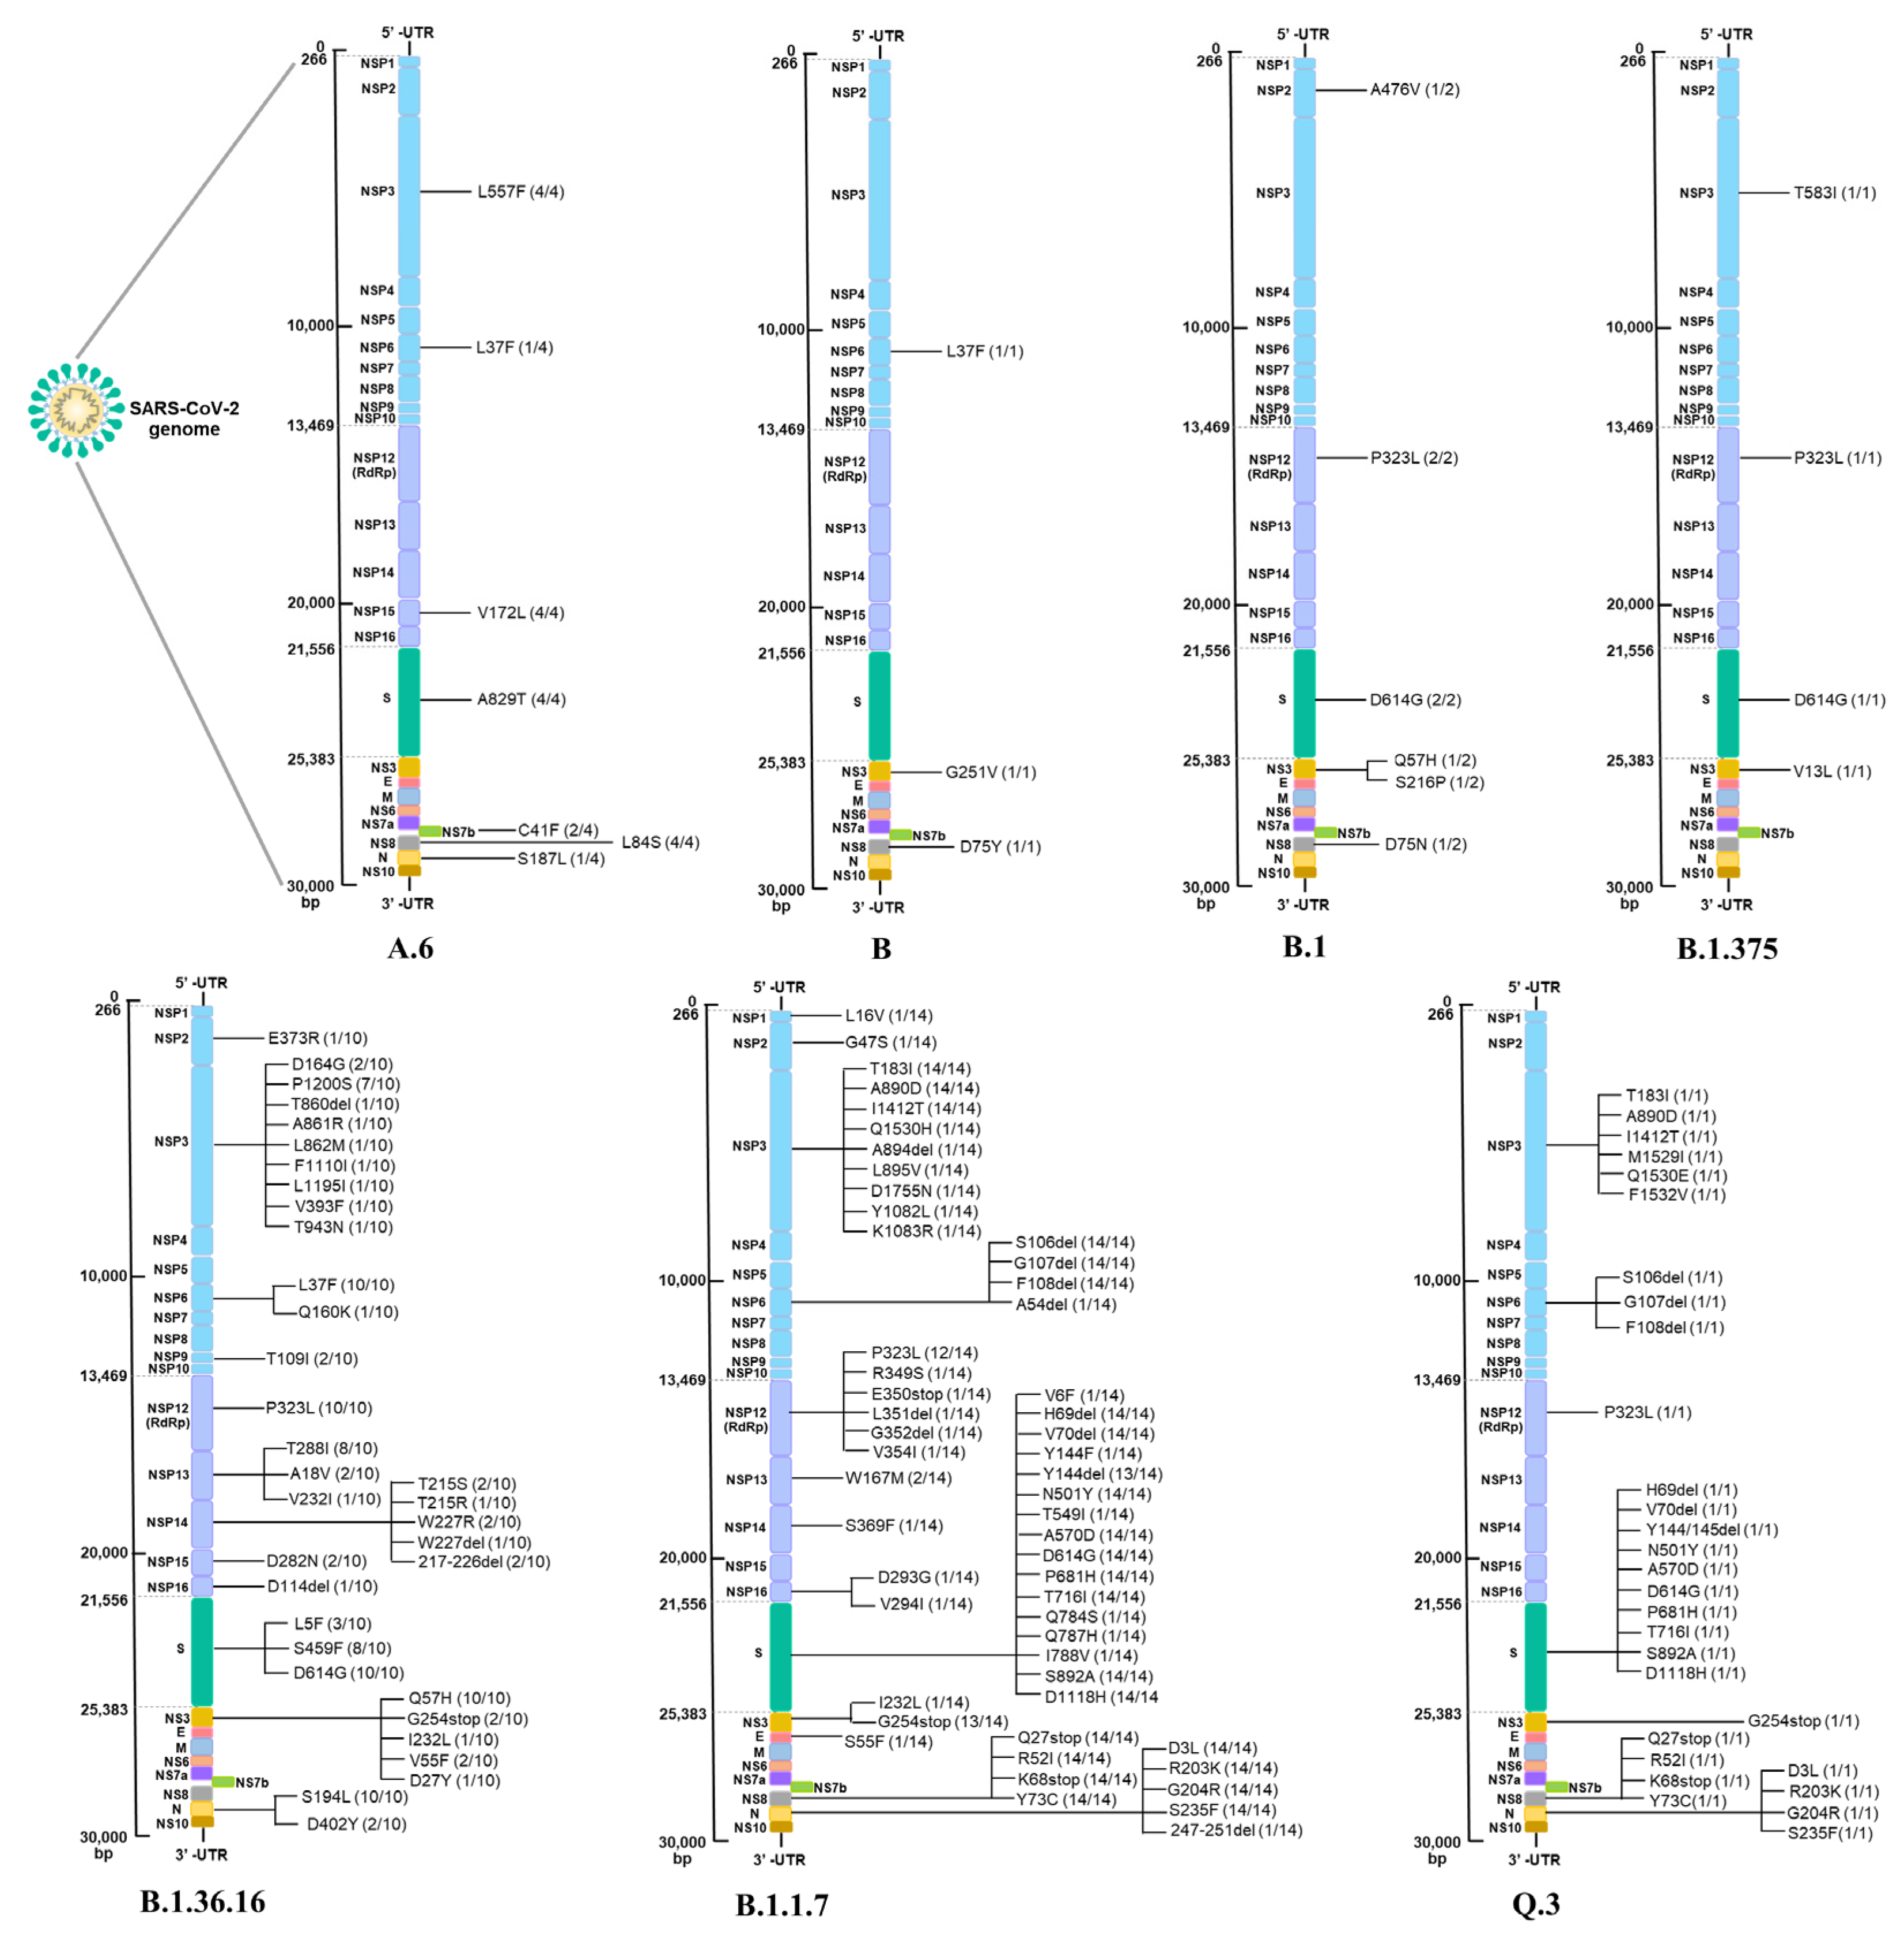
3.3. Characterization of SARS-CoV-2 Variants in Thailand

We further characterized the aa changes in each lineage. Figure 4 shows the mutations throughout the genome of each lineage in all three COVID-19 waves. Since A.6, B, B.1, and B.1.375 were the earliest clusters in Thailand, low levels of genomic diversity were expected in these lineages. In comparison to the reference strain Wuhan-Hu-1, there were less than 10 mutations in an entire genome. Focusing on the S protein, there was only one mutation (A829T) in the A.6 lineage, while D614G was initially detected in the B.1 and B.1375 lineages and remained present in all the lineages that circulated in Thailand. Similar to D614G, P323L in nonstructural protein (Nsp) 12 was first identified in the first wave (B.1 and B.1.375) and frequently detected throughout the period of study.
More mutations were observed in the second wave; B.1.36.16 carried 32 mutations, in which a high frequency was located on Nsp; there were nine mutations in Nsp3 and 15 mutations in Nsp14 (12 of these were deletions at positions 216–227). However, only three mutations (L5F, S459F, and D614G) were identified on the S protein. L37F in Nsp6 and Q57H in NS3, which were found in few samples from the first wave, later became predominant mutations of the second wave.
Notably, the B.1.1.7 lineage in the third wave harbored a large number of mutations. A total of 54 aa substitutions were identified throughout the genome, where the majority of mutations were located on the S protein. Mutation patterns on both S and other proteins, such as for example (i) S: del69-70HV, del144Y, N501Y, A570D, D614G, P681H, T761I, S982A, and D1118H; (ii) N: D3L, R203K, G204R, and S235F; (iii) Nsp3: T183I, A890D, and I1412T; (iv) Nsp6: del106-108SGF; (v) Nsp12: P323L; (vi) NS3: G254stop; and (vii) NS8: Q27stop, R52I, K68stop, and Y73C, were found with a high frequency and could define the specific lineage. Thus, these were recognized as lineage-defining mutations. The Q.3 lineage, which was sequenced from one sample during the third wave, contained lineage-defining mutations in all regions without any uncommon aa changes detected.
The global occurrence of all mutations found in this study are shown in the Supplementary Data section. Similar to high global frequency, S: D614G and Nsp12: P323L were detected in 28/33 (84.8%) and 26/33 (78.8%) in all three epidemic waves, respectively. A mutation that had never been reported elsewhere was not considered a mutation of concern and was thus excluded for further analysis.

3.4. Clinical Characteristics of COVID-19 Patients in Three Epidemic Waves

The demographic and clinical information were obtained from 32 patients (data on one patient in the first wave remained unavailable) (Table 2). The median age of all patients was 37 years (range 1–74); 46.9% were male, and 53.1% were female. The distributions of age and gender in the first and second waves were similar; the median ages were 32 (13–48) and 34 (18–67) years, respectively. Females were affected more than males, whereas higher median age and number of males than females were observed in the third wave. The clinical features of patients in each wave were elaborated. In the first wave, the numbers of asymptomatic and symptomatic patients were comparable at 42.9% and 57.1%, respectively. The symptoms included mild upper respiratory indications (fever, cough, and sore throat) and diarrhea, which were relieved without hospitalization. The second wave caused more symptomatic indications compared to the first wave; 80% of patients presented symptoms, of which 60% had mild illnesses, and 20% developed severe-to-critical illnesses. One of two severe patients had underlying diseases, namely hypertension and diabetes. All of the patients in the second wave outbreak recovered. A notably more intense situation was observed in the third wave, in which the mass vaccination campaign had not yet started. Nearly all infected people had symptoms, particularly lower respiratory symptoms including cough, sputum production, and shortness of breath. All patients required hospital admission (isolation in a healthcare facility for an asymptomatic patient); 40% had moderate symptoms, and 33.3% developed severe-to-critical illnesses. Patients who had comorbidities (66.7%) such as hypertension, diabetes, and heart disease were affected more by this cluster and had a higher risk of death. The clinical outcomes of the third wave resulted in 11 (73.3%) recoveries and four (26.7%) deaths, all of which had underlying diseases.

3.5. SARS-CoV-2 Mutations Associated with Disease Severity

The mutations found in virus sequences retrieved from patients who had no symptoms, mild symptoms, and severe-to-critical illness were characterized and grouped by COVID-19 waves (Table 3). A majority of aa substitutions were lineage-defining mutations which were not likely associated with disease severity. For example, (i) S:A829T (A.6 lineage) was detected in asymptomatic and mild-symptom patients in the first wave; (ii) S:L5F, S459F, and D614G (B.1.36.16 lineage) were detected in asymptomatic and severe-to-critical patients in the second wave; (iii) ten aa substitutions in the S protein of B.1.1.7 were found in all patients with varying degrees of severity. However, some mutations were specifically identified in certain clinical spectra. For example, S protein T549I and envelope (E) protein S55F were detected only in severe-to-critical patients, who eventually died, suggesting that these mutations might be potentially pathogenic determinants of the virus which could have influenced disease severity.

4. Discussion

SARS-CoV-2 has placed a continuous strain on the global population with the emergence of several VOCs. Genomic surveillance has been implemented to track viral transmission, monitor mutations, evaluate the rate of evolution, and determine the potential for causing future outbreaks. From the beginning of the COVID-19 pandemic up to June 2021, Thailand experienced three COVID-19 waves that were dominated by distinct viral lineages. In the absence of herd immunity, the introduction of a new variant in each wave contributed to increases in the number of confirmed cases of COVID-19 as well as disease severity. The total case numbers and deaths in the third wave were nearly 30 times that from the first wave [10]. This fact led to the exploration of the genomic diversity of dominant viral lineages in the three waves using WGS. The correlation between mutations and clinical data was also analyzed. Whole-genome analyses revealed the differences in mutation patterns among predominant lineages, which might be associated with transmissibility, infectivity, and disease severity.
During the first wave, Pangolin lineages A.6, B, B.1, and B.1.375 were identified from the samples in the current study and linked to asymptomatic or mild symptoms. The results in this study were in line with those from the study of Puenpa J. et al., wherein clade L (Wuhan-Hu-1-like), S (A.6), G (B.1), V (B), and O (Others) were detected in samples collected from mild symptomatic patients during the first COVID-19 wave in Thailand [11]. Several research groups have attempted to link genetic variations with disease severity. The majority of mutations that occurred during the first wave have been shown to relate to asymptomatic and mild diseases. Nagy Á. et al. identified the mutations in viral sequences retrieved from the GISAID database and observed that NS8:L84S (A.6 lineage) and Nsp6:L37F (B lineage) had higher frequencies among asymptomatic and mild patients [19]. Similar to the study by Aiewsakul P. and colleagues, Nsp6:L37F was significantly associated with asymptomatic patients [20]. Moreover, structural analysis and ex vivo study of NS3:Q57H (B.1 lineage) provided evidence supporting that this mutation was associated with decreased viral virulence, resulting in decreased mortality rates and increased transmission [21,22].
The second wave of the COVID-19 surge was driven by the B.1.36.16 lineage. Most of the patients in the second wave had mild respiratory illnesses, which is consistent with an article from South China in which Xu H. and colleagues reported that patients infected with B.1.36.16 were more symptomatic than earlier strains [23]. High-frequency substitutions were S: D614G; N:S194L; Nsp6:L37F; Nsp12:P323L; NS3:Q57H, which were found in all samples collected during the second wave. Co-mutational combinations (S:D614G, NS3:Q57H, N:S194L) have been shown to correlate with mild and severe outcome based on a model predicting mutations-associated disease severity [24], indicating that the co-mutations were possibly responsible for symptomatic manifestations compared to the previous outbreak. The second wave of the COVID-19 surge was driven by the B.1.36.16 lineage. Most of the patients in the second wave had mild respiratory illnesses, which is consistent with an article from South China in which Xu H. and colleagues reported that patients infected with B.1.36.16 were more symptomatic than earlier strains [25,26]. For example, the combination of S:D614G and Nsp12:P323L has been proven to be an epidemiologically successful variant, giving an advantage to increase the viral fitness and transmissibility but not disease severity [27,28,29]. Our results showed that S:D614G and Nsp12:P323L were dominant in the second and third waves, respectively, suggesting that this combination might have significantly impacted enhanced transmission, contributing to increasing COVID-19 case numbers.
The predominant lineages of the third wave were designated as VOCs (Alpha variant; B.1.1.7 and its sub-lineages). This variant spread rapidly across the globe, increasing the risk of ICU admission and mortality, especially in among older people [30,31]. Data for the third wave showed the same trend as other countries in terms of clinical characteristics and the rise of daily COVID-19 confirmed cases [32,33,34]. The B.1.1.7 and Q3 lineages harbored mutation patterns that could facilitate transmissibility, infectivity, and immune evasion, particularly in the S protein such as del69-70HV, del144Y, N501Y, A570D, D614G, P681H, T761I, S982A, and D1118H. For example, N501Y increases the binding affinity to the host receptor; P681H enhances the spike cleavage, impacting the viral entry; del69-70HV is likely to be involved with immune evasion and an increase in viral transmission [35,36]. Mutations in non-spike proteins such as (N: D3L, R203K, G204R, S235F; Nsp3: T183I, A890D, I1412T; Nsp6: SGF106-108del; Nsp12: P323L; NS3: G254stop; NS8: Q27stop, R52I, K68stop, Y73C) were also observed at a high frequency (85–100%) corresponding to the global prevalence [37]. Although the potential effects of these mutated proteins have not been investigated thoroughly, the relationship among mutations may have provided transmissibility, infectivity, and replication advantages for the alpha variant, eventually making it predominant in Thailand. However, these signature mutations were not likely to contribute to enhanced disease severity since they were detected in patients with varying degrees of clinical symptoms and illnesses ranging from mild to critical.
In this study, a few additional mutations were found only in sequences retrieved from severe/critical and deceased patients. The aa substitutions in structural proteins might affect viral attachment and entry into host cells. The mutational effect of S:T549I has not been reported previously. However, position 549 on the S protein is proximal to RBD, which may affect the binding affinity to the ACE2 receptor and subsequently influence viral entry. S55F was predicted to improve the binding of the SARS-CoV-2 envelope protein to a tight junction-associated protein (PALS1) [38]. In addition, changes in the non-structural proteins might be involved with viral replication and the ability to counteract with host immune response [39]. For example, Nsp2 mutations might affect virulence by interfering with the interaction with host proteins [40]; Nsp3 mutations might be responsible for interacting with host immunity and contribute to unfavorable clinical outcome in patients [41]; and Nsp14 mutations possibly affect the genomic diversity and evolution of viruses [40]. Nevertheless, the functional impacts of these substitutions need to be investigated further. Due to the low frequency of occurrence, we postulated that these mutations probably change the virus phenotype to be more pathogenic and decrease viral fitness. It should be noted that the mutation-associated disease severity could vary widely due to the wide-ranging clinical information regarding symptom classification and patient management in each country.
Not only are genetic variations of the virus responsible for virulence, but the host factor also contributes to severe outcomes. The presence of pre-existing comorbidities including hypertension, heart disease, diabetes, and obesity combined with pathogenic determinants in the viral genome can cause detrimental effects on the host. Given the small sample size, determining the correlation between aa substitutions and clinical data is difficult. Further investigations including in vitro, in vivo, and structural analyses are required to explore whether additional mutations affect viral pathogenesis and disease severity since these mutations might rebound in subsequent emerging variants.

5. Conclusions

This study presented the genome characterization of SARS-CoV-2 variants that predominated during three COVID-19 waves in Thailand. The number of mutations increased over time and was directly proportional to the increase in confirmed cases as well as disease severity. The A.6, B, and B.1 lineages contained mutations that had minimal impacts on transmission; the lockdowns and preventive measures could have effectively controlled this wave. Accumulated mutations were observed in B.1.36.16, relative to the increase of symptomatic COVID-19 patients in the second wave. The alpha variant that was predominant in the third wave harbored mutations that were essential for enhanced transmissibility and infectivity. Thus, a sharp rise in case numbers and increased hospitalizations were recorded. All lineage-defining mutations were not likely to be associated with severe diseases since they were detected in sequences retrieved from patients in all clinical spectra. Nevertheless, six mutations were detected only in severe and deceased patients, suggesting that these additional mutations possibly gave rise to phenotypic changes to attain higher pathogenicity, especially in patients with underlying conditions. The findings of this study can provide more insights into the genomic epidemiology and diversity of SARS-CoV-2 circulating in Thailand.

Supplementary Materials

The following supporting information can be downloaded at: https://www.mdpi.com/article/10.3390/pathogens12040626/s1, Table S1: Global prevalence of amino acid substitutions identified in our study.

Author Contributions

C.S., M.T. and T.W. conceived and designed the study, analyzed and interpret the results, and wrote the original manuscript; C.S. and M.T. performed RNA extraction; T.W. and C.T. performed the data curation and genetic and phylogenetic analyses; T.H., U.P. and C.T. helped in coordinating the project. All authors have read and agreed to the published version of the manuscript.

Funding

This research received funding from the Faculty of Medicine Vajira Hospital, Navamindradhiraj University Research Fund (Grant number 14-63).

Institutional Review Board Statement

The study was conducted according to the guidelines of the Declaration of Helsinki and approved by the Institutional Review Board of the Faculty of Medicine Vajira Hospital, Navamindradhiraj University, approval code: COA 049/2563.

Informed Consent Statement

A waiver of informed consent was approved by the Vajira Institutional Review Board (IRB) since the study involves no greater than minimal risk. In addition, a waiver of informed consent will not adversely affect the rights and welfare of the subjects. Permission from Vajira Hospital is required for the secondary use of electronic medical records.

Data Availability Statement

The data presented in this study are not publicly available due to confidentiality but are available on reasonable request.

Acknowledgments

We would like to thank Chayanit Phuttanu, Sunisa Dongphooyao, and Wipawee Thongsopa of Department of Central Laboratory for facilitating specimen collection. We would also like to thank Insee Sensorn of the Center of Medical Genomics for technical support in whole genome sequencing.

Conflicts of Interest

The authors declare no conflict of interest.

Abbreviations

1stfirst
2ndsecond
3rdthird
aaamino acid
ACE2angiotensin-converting enzyme 2
cDNAcomplementary DNA
COVID-19coronavirus disease 2019
deldeletion
DNADeoxyribonucleic acid
GISAIDGlobal Initiative on Sharing Avian Influenza Data
NPSnasopharyngeal swab
Nspnonstructural protein
RBDreceptor-binding domain
RNARibonucleic acid
S proteinspike protein
SARS-CoV-2severe acute respiratory syndrome coronavirus 2
ssCirDNAcircularized single strand DNA
VOCvariants of concern
VOIvariants of interest
WGSwhole-genome sequencing

References

  1. World Health Organization. WHO Coronavirus (COVID-19) Dashboard. Available online: https://covid19.who.int/ (accessed on 6 February 2023).
  2. Ghosh, N.; Saha, I.; Nandi, S.; Sharma, N. Characterisation of SARS-CoV-2 clades based on signature SNPs unveils continuous evolution. Methods 2021, 203, 282–296. [Google Scholar] [CrossRef] [PubMed]
  3. Osman, I.O.; Levasseur, A.; Brechard, L.; Abdillahi Hassan, I.; Salah Abdillahi, I.; Ali Waberi, Z.; Delerce, J.; Bedotto, M.; Houhamdi, L.; Fournier, P.E.; et al. Whole Genome Sequencing of SARS-CoV-2 Strains in COVID-19 Patients from Djibouti Shows Novel Mutations and Clades Replacing over Time. Front. Med. 2021, 8, 737602. [Google Scholar] [CrossRef]
  4. Oude Munnink, B.B.; Worp, N.; Nieuwenhuijse, D.F.; Sikkema, R.S.; Haagmans, B.; Fouchier, R.A.M.; Koopmans, M. The next phase of SARS-CoV-2 surveillance: Real-time molecular epidemiology. Nat. Med. 2021, 27, 1518–1524. [Google Scholar] [CrossRef] [PubMed]
  5. Andrews, N.; Stowe, J.; Kirsebom, F.; Toffa, S.; Rickeard, T.; Gallagher, E.; Gower, C.; Kall, M.; Groves, N.; O’Connell, A.M.; et al. COVID-19 Vaccine Effectiveness against the Omicron (B.1.1.529) Variant. N. Engl. J. Med. 2022, 386, 1532–1546. [Google Scholar] [CrossRef] [PubMed]
  6. Buchan, S.A.; Chung, H.; Brown, K.A.; Austin, P.C.; Fell, D.B.; Gubbay, J.B.; Nasreen, S.; Schwartz, K.L.; Sundaram, M.E.; Tadrous, M.; et al. Estimated Effectiveness of COVID-19 Vaccines against Omicron or Delta Symptomatic Infection and Severe Outcomes. JAMA Netw. Open 2022, 5, e2232760. [Google Scholar] [CrossRef]
  7. Covariants. Shared Mutations Enabled by Data from GISAID. Available online: https://covariants.org/shared-mutations (accessed on 9 February 2023).
  8. Ou, J.; Lan, W.; Wu, X.; Zhao, T.; Duan, B.; Yang, P.; Ren, Y.; Quan, L.; Zhao, W.; Seto, D.; et al. Tracking SARS-CoV-2 Omicron diverse spike gene mutations identifies multiple inter-variant recombination events. Signal Transduct. Target. Ther. 2022, 7, 138. [Google Scholar] [CrossRef]
  9. World Health Organization. WHO Coronavirus (COVID-19) Dashboard—Thailand Situation. Available online: https://covid19.who.int/region/searo/country/th (accessed on 6 February 2023).
  10. Kunno, J.; Supawattanabodee, B.; Sumanasrethakul, C.; Wiriyasivaj, B.; Kuratong, S.; Kaewchandee, C. Comparison of Different Waves during the COVID-19 Pandemic: Retrospective Descriptive Study in Thailand. Adv. Prev. Med. 2021, 2021, 5807056. [Google Scholar] [CrossRef]
  11. Puenpa, J.; Suwannakarn, K.; Chansaenroj, J.; Nilyanimit, P.; Yorsaeng, R.; Auphimai, C.; Kitphati, R.; Mungaomklang, A.; Kongklieng, A.; Chirathaworn, C.; et al. Molecular epidemiology of the first wave of severe acute respiratory syndrome coronavirus 2 infection in Thailand in 2020. Sci. Rep. 2020, 10, 16602. [Google Scholar] [CrossRef]
  12. Buathong, R.; Chaifoo, W.; Iamsirithaworn, S.; Wacharapluesadee, S.; Joyjinda, Y.; Rodpan, A.; Ampoot, W.; Putcharoen, O.; Paitoonpong, L.; Suwanpimolkul, G.; et al. Multiple clades of SARS-CoV-2 were introduced to Thailand during the first quarter of 2020. Microbiol. Immunol. 2021, 65, 405–409. [Google Scholar] [CrossRef]
  13. Rajatanavin, N.; Tuangratananon, T.; Suphanchaimat, R.; Tangcharoensathien, V. Responding to the COVID-19 second wave in Thailand by diversifying and adapting lessons from the first wave. BMJ Glob. Health 2021, 6, e006178. [Google Scholar] [CrossRef]
  14. Chookajorn, T.; Kochakarn, T.; Wilasang, C.; Kotanan, N.; Modchang, C. Southeast Asia is an emerging hotspot for COVID-19. Nat. Med. 2021, 27, 1495–1496. [Google Scholar] [CrossRef] [PubMed]
  15. Meo, S.A.; Meo, A.S.; Al-Jassir, F.F.; Klonoff, D.C. Omicron SARS-CoV-2 new variant: Global prevalence and biological and clinical characteristics. Eur. Rev. Med. Pharmacol. Sci. 2021, 25, 8012–8018. [Google Scholar] [CrossRef] [PubMed]
  16. Report of the WHO-China Joint Mission on Coronavirus Disease 2019 (COVID-19). Available online: https://www.who.int/publications/i/item/report-of-the-who-china-joint-mission-on-coronavirus-disease-2019-(covid-19) (accessed on 16 March 2022).
  17. Tamura, K.; Stecher, G.; Kumar, S. MEGA11: Molecular Evolutionary Genetics Analysis Version 11. Mol. Biol. Evol. 2021, 38, 3022–3027. [Google Scholar] [CrossRef]
  18. Klempt, P.; Brzon, O.; Kasny, M.; Kvapilova, K.; Hubacek, P.; Briksi, A.; Bezdicek, M.; Koudelakova, V.; Lengerova, M.; Hajduch, M.; et al. Distribution of SARS-CoV-2 Lineages in the Czech Republic, Analysis of Data from the First Year of the Pandemic. Microorganisms 2021, 9, 1671. [Google Scholar] [CrossRef]
  19. Nagy, A.; Pongor, S.; Gyorffy, B. Different mutations in SARS-CoV-2 associate with severe and mild outcome. Int. J. Antimicrob. Agents 2021, 57, 106272. [Google Scholar] [CrossRef] [PubMed]
  20. Aiewsakun, P.; Nilplub, P.; Wongtrakoongate, P.; Hongeng, S.; Thitithanyanont, A. SARS-CoV-2 genetic variations associated with COVID-19 pathogenicity. Microb. Genom. 2021, 7, 000734. [Google Scholar] [CrossRef]
  21. Oulas, A.; Zanti, M.; Tomazou, M.; Zachariou, M.; Minadakis, G.; Bourdakou, M.M.; Pavlidis, P.; Spyrou, G.M. Generalized linear models provide a measure of virulence for specific mutations in SARS-CoV-2 strains. PLoS ONE 2021, 16, e0238665. [Google Scholar] [CrossRef]
  22. Chu, D.K.W.; Hui, K.P.Y.; Gu, H.; Ko, R.L.W.; Krishnan, P.; Ng, D.Y.M.; Liu, G.Y.Z.; Wan, C.K.C.; Cheung, M.C.; Ng, K.C.; et al. Introduction of ORF3a-Q57H SARS-CoV-2 Variant Causing Fourth Epidemic Wave of COVID-19, Hong Kong, China. Emerg. Infect. Dis. 2021, 27, 1492–1495. [Google Scholar] [CrossRef]
  23. Xu, H.; Xie, C.Y.; Li, P.H.; Ji, Z.L.; Sun, J.F.; Hu, B.; Li, X.; Fang, M. Demographic, Virological Characteristics and Prognosis of Asymptomatic COVID-19 Patients in South China. Front. Med. 2022, 9, 830942. [Google Scholar] [CrossRef]
  24. Pang, X.; Li, P.; Zhang, L.; Que, L.; Dong, M.; Xie, B.; Wang, Q.; Wei, Y.; Xie, X.; Li, L.; et al. Emerging Severe Acute Respiratory Syndrome Coronavirus 2 Mutation Hotspots Associated with Clinical Outcomes and Transmission. Front. Microbiol. 2021, 12, 753823. [Google Scholar] [CrossRef]
  25. Majumdar, P.; Niyogi, S. SARS-CoV-2 mutations: The biological trackway towards viral fitness. Epidemiol. Infect. 2021, 149, e110. [Google Scholar] [CrossRef] [PubMed]
  26. Gupta, V.; Haider, S.; Verma, M.; Singhvi, N.; Ponnusamy, K.; Malik, M.Z.; Verma, H.; Kumar, R.; Sood, U.; Hira, P.; et al. Comparative Genomics and Integrated Network Approach Unveiled Undirected Phylogeny Patterns, Co-mutational Hot Spots, Functional Cross Talk, and Regulatory Interactions in SARS-CoV-2. mSystems 2021, 6, e00030-21. [Google Scholar] [CrossRef] [PubMed]
  27. Plante, J.A.; Liu, Y.; Liu, J.; Xia, H.; Johnson, B.A.; Lokugamage, K.G.; Zhang, X.; Muruato, A.E.; Zou, J.; Fontes-Garfias, C.R.; et al. Spike mutation D614G alters SARS-CoV-2 fitness. Nature 2021, 592, 116–121. [Google Scholar] [CrossRef] [PubMed]
  28. Volz, E.; Hill, V.; McCrone, J.T.; Price, A.; Jorgensen, D.; O’Toole, A.; Southgate, J.; Johnson, R.; Jackson, B.; Nascimento, F.F.; et al. Evaluating the Effects of SARS-CoV-2 Spike Mutation D614G on Transmissibility and Pathogenicity. Cell 2021, 184, 64–75.e11. [Google Scholar] [CrossRef]
  29. Ilmjarv, S.; Abdul, F.; Acosta-Gutierrez, S.; Estarellas, C.; Galdadas, I.; Casimir, M.; Alessandrini, M.; Gervasio, F.L.; Krause, K.H. Concurrent mutations in RNA-dependent RNA polymerase and spike protein emerged as the epidemiologically most successful SARS-CoV-2 variant. Sci. Rep. 2021, 11, 13705. [Google Scholar] [CrossRef]
  30. Garcia Borrega, J.; Naendrup, J.H.; Heindel, K.; Hamacher, L.; Heger, E.; Di Cristanziano, V.; Deppe, A.C.; Dusse, F.; Wetsch, W.A.; Eichenauer, D.A.; et al. Clinical Course and Outcome of Patients with SARS-CoV-2 Alpha Variant Infection Compared to Patients with SARS-CoV-2 Wild-Type Infection Admitted to the ICU. Microorganisms 2021, 9, 1944. [Google Scholar] [CrossRef]
  31. Grint, D.J.; Wing, K.; Houlihan, C.; Gibbs, H.P.; Evans, S.J.W.; Williamson, E.; McDonald, H.I.; Bhaskaran, K.; Evans, D.; Walker, A.J.; et al. Severity of Severe Acute Respiratory System Coronavirus 2 (SARS-CoV-2) Alpha Variant (B.1.1.7) in England. Clin. Infect. Dis. 2022, 75, e1120–e1127. [Google Scholar] [CrossRef]
  32. Florensa, D.; Mateo, J.; Spaimoc, R.; Miret, C.; Godoy, S.; Solsona, F.; Godoy, P. Severity of COVID-19 cases in the months of predominance of the Alpha and Delta variants. Sci. Rep. 2022, 12, 15456. [Google Scholar] [CrossRef]
  33. Snell, L.B.; Wang, W.; Alcolea-Medina, A.; Charalampous, T.; Batra, R.; de Jongh, L.; Higgins, F.; Nebbia, G.; Investigators, C.-U.H.; Wang, Y.; et al. Descriptive comparison of admission characteristics between pandemic waves and multivariable analysis of the association of the Alpha variant (B.1.1.7 lineage) of SARS-CoV-2 with disease severity in inner London. BMJ Open 2022, 12, e055474. [Google Scholar] [CrossRef]
  34. Lai, A.; Bergna, A.; Della Ventura, C.; Menzo, S.; Bruzzone, B.; Sagradi, F.; Ceccherini-Silberstein, F.; Weisz, A.; Clementi, N.; Brindicci, G.; et al. Epidemiological and Clinical Features of SARS-CoV-2 Variants Circulating between April-December 2021 in Italy. Viruses 2022, 14, 2508. [Google Scholar] [CrossRef]
  35. Hill, V.; Du Plessis, L.; Peacock, T.P.; Aggarwal, D.; Colquhoun, R.; Carabelli, A.M.; Ellaby, N.; Gallagher, E.; Groves, N.; Jackson, B.; et al. The origins and molecular evolution of SARS-CoV-2 lineage B.1.1.7 in the UK. Virus Evol. 2022, 8, veac080. [Google Scholar] [CrossRef]
  36. Kurpas, M.K.; Jaksik, R.; Kus, P.; Kimmel, M. Genomic Analysis of SARS-CoV-2 Alpha, Beta and Delta Variants of Concern Uncovers Signatures of Neutral and Non-Neutral Evolution. Viruses 2022, 14, 2375. [Google Scholar] [CrossRef]
  37. GISAID. Tracking of hCoV-19 Variants. Available online: https://gisaid.org/hcov19-variants/ (accessed on 16 December 2021).
  38. Rahman, M.S.; Hoque, M.N.; Islam, M.R.; Islam, I.; Mishu, I.D.; Rahaman, M.M.; Sultana, M.; Hossain, M.A. Mutational insights into the envelope protein of SARS-CoV-2. Gene Rep. 2021, 22, 100997. [Google Scholar] [CrossRef]
  39. Low, Z.Y.; Zabidi, N.Z.; Yip, A.J.W.; Puniyamurti, A.; Chow, V.T.K.; Lal, S.K. SARS-CoV-2 Non-Structural Proteins and Their Roles in Host Immune Evasion. Viruses 2022, 14, 1991. [Google Scholar] [CrossRef]
  40. Yan, W.; Zheng, Y.; Zeng, X.; He, B.; Cheng, W. Structural biology of SARS-CoV-2: Open the door for novel therapies. Signal. Transduct. Target. Ther. 2022, 7, 26. [Google Scholar] [CrossRef]
  41. Ichikawa, T.; Torii, S.; Suzuki, H.; Takada, A.; Suzuki, S.; Nakajima, M.; Tampo, A.; Kakinoki, Y. Mutations in the nonstructural proteins of SARS-CoV-2 may contribute to adverse clinical outcome in patients with COVID-19. Int. J. Infect. Dis. 2022, 122, 123–129. [Google Scholar] [CrossRef]
Figure 1. SARS-CoV-2 positive cases in Thailand. Graph based on a data source available at https://ourworldindata.org/coronavirus/country/thailand (accessed on 30 November 2021). Color of plotting area illustrates the sample collection time range for each wave during the COVID-19 pandemic. The asterisk indicates the highest number of new cases.
Pathogens 12 00626 g001
Figure 2. Distribution of SARS-CoV-2 Pangolin lineages in the first, second, and third COVID-19 waves in Thailand. Graph based on a data source available at https://cov-spectrum.org (accessed on 30 November 2021).
Pathogens 12 00626 g002
Figure 3. Phylogenetic tree of SAR-CoV-2 sequences. The percentage of trees in which the associated taxa clustered together is shown next to the branches. The initial tree for the heuristic search was obtained automatically by applying Neighbor-Join and BioNJ algorithms to a matrix of pairwise distances estimated using the MCL approach, and the topology with a superior log likelihood value was selected. The tree was drawn to scale, with branch lengths measured in the number of substitutions per site.
Pathogens 12 00626 g003
Figure 4. Changes in the aa of the protein in SARS-CoV-2 VOCs deciphered by WGS in this study. A.6, B, B.1, and B.1.375 variants were detected during the 1st wave of the pandemic. For the 2nd wave, all detected variants were B.1.36.16. In the 3rd wave, a large number of detected variants were mostly dominated by B.1.1.7, followed by the Q.3 variant. The number in the bracket represents the frequency of occurrence of an event (Number count/Total number of sequences classified in each lineage).
Pathogens 12 00626 g004
Table 1. Number of samples collected and lineage distribution at each wave.
Wave of InfectionsnSamplesLineages (n)
First wave8VJR004, VJR007, VJR009, VJR010A.6 (4)
VJR008B (1)
VJR003, VJR005B.1 (2)
VJR002B.1.375 (1)
Second wave10VJR022, VJR023, VJR024, VJR025, VJR026, VJR027, VJR028, VJR029, VJR030, VJR031B.1.36.16 (10)
Third wave15VJR034, VJR037, VJR038, VJR039, VJR040, VJR041, VJR042, VJR043, VJR044, VJR045, VJR046, VJR047, VJR048, VJR050B.1.1.7 (14)
VJR035Q.3 (1)
Total33
Table 2. Clinical characteristics of COVID-19 patients in three COVID-19 waves.
Total Cases
(n = 32)
First Wave
(n = 7)
Second Wave
(n = 10)
Third Wave
(n = 15)
Age (Years)
Median (range)37 (1–74)32 (13–48)34 (18–67)55 (1–74)
Gender, n (%)
Male15 (46.9)3 (42.9)2 (20)10 (66.7)
Female17 (53.1)4 (57.1)8 (80)5 (33.3)
Symptoms, n (%) *
Fever15 (57.7)2 (50)4 (50)9 (64.3)
Cough16 (61.5)2 (50)3 (37.5)11 (78.6)
Sore throat5 (19.2)2 (50)2 (25)1 (7.1)
Sputum production8 (30.8)-2 (25)6 (42.9)
Headache3 (11.5)1 (25)1 (12.5)1 (7.1)
Nasal congestion4 (15.4)-2 (25)2 (14.3)
Loss of taste and smell2 (7.7)-1 (12.5)1 (7.1)
Fatigue4 (15.4)-1 (12.5)3 (21.4)
Myalgia5 (19.2)-2 (25)3 (21.4)
Breathing difficulty13 (50)-2 (25)11 (78.6)
Diarrhea3 (11.5)1 (25)-2 (14.3)
Other1 (3.8)--1 (7.1)
COVID-19 disease severity, n (%)
Asymptomatic6 (18.8)3 (42.9)2 (20)1 (6.7)
Mild13 (40.6)4 (57.1)6 (60)3 (20)
Moderate6 (18.8)--6 (40)
Severe to critical7 (21.9)-2 (20)5 (33.3)
Hospitalization
No13 (40.6)7 (100)6 (60)0
Yes19 (59.4)04 (40)15 (100)
Comorbidities
Any *, n (%)11 (34.4)-1 (10)10 (66.7)
Diabetes4 (12.5)-1 (10)3 (20)
Hypertension8 (25.0)-1 (10)7 (46.7)
Obesity1 (3.1)--1 (6.7)
Cancer1 (3.1)--1 (6.7)
Cerebrovascular disease2 (6.3)--2 (13.3)
Heart disease3 (9.4)--3 (20)
Final clinical outcomes, n (%)
Recovered28 (87.5)7 (100)10 (100)11 (73.3)
Deceased4 (12.5)--4 (26.7)
* More than one symptom or comorbidity can be given.
Table 3. The association of amino acid substitutions with COVID-19 severity.
First WaveSecond WaveThird Wave
No SymptomMild No SymptomMildSevere/
Critical
No SymptomMildModerateSevere/
Critical
Structural Protein
SpikeA829TA829TL5FS459FL5FH69delH69delV6FH69del
D614GS459FD614GS459FV70delV70delH69delV70del
D614G D614GY144delY144delV70delY144del
N501YY144FY144delN501Y
A570DN501YN501YT549I
D614GA570DA570DA570D
P681HD614GD614GD614G
T716IP681HP681HP681H
S892AT716IT716IT716I
D1118HS892AS892AS892A
D1118HD1118HD1118H
Q784S
Q787H
I788V
Envelope S55F
NucleocapsidS187L S194LS194LS194LD3LD3LD3LD3L
D402Y R203KR203KR203KR203K
G204RG204RG204RG204R
S235FS235FS235FS235F
247–251 del
Non-structural protein
Nsp1 L16V
Nsp2 A476VE373R G47S
Nsp3L557FL557FD164GD164GP1200ST183IT183IT183IT183I
T583IP1200SP1200S A890DA890DA890DA890D
T860delL1195I I1412TI1412TI1412TI1412T
A861RV393F M1529I Q1530HD1755N
L862MT943N Q1530E A894del
F1110I F1532V L895V
Nsp6L37FL37FL37FL37FL37FS106delS106delS106delS106del
Q160K G107delG107delG107delG107del
F108delF108delF108delF108del
A54del
Nsp9 T109I
Nsp12 P323LP323LP323LP323LP323LP323LP323LP323L
Nsp13 T588IT588IT588I W167MW167M
A18V
V232I
Nsp14 T215ST215SW227R S369F
T215R217–226 del
216–227 del
Nsp15V172LV172L D282N
Nsp16 D114del D293G
V294I
NS3 G251VQ57HQ57HQ57HG254stopG254stopG254stopG254stop
Q57H G254stop I232L
S216P V55F
V13L D27Y
I232L
NS7bC41F
NS8L84SL84S Q27stopQ27stopQ27stopQ27stop
D75Y R52IR52IR52IR52I
K68stopK68stopK68stopK68stop
Y73CY73CY73CY73C
Disclaimer/Publisher’s Note: The statements, opinions and data contained in all publications are solely those of the individual author(s) and contributor(s) and not of MDPI and/or the editor(s). MDPI and/or the editor(s) disclaim responsibility for any injury to people or property resulting from any ideas, methods, instructions or products referred to in the content.

