1. Introduction
COVID-19 is an ongoing pandemic of coronavirus disease 2019, caused by severe acute respiratory syndrome coronavirus 2 (SARS-CoV-2). The outbreak was first identified in Wuhan, China, in December 2019. The World Health Organization declared the outbreak a Public Health Emergency of International Concern on 30 January, and a pandemic on 11 March (
World Health Organization 2020).
On 9 March 2020, Italian government imposed a “lockdown” in the country for the COVID-19 pandemic. After about two months of lockdown, and a further two months of gradual recovery of production and work activities, the pandemic’s economic effects begin to appear in all their intensity.
The pandemic has caused severe global economic disruption, including the largest global recession since the U.S. Great Depression (
International Monetary Fund 2020). Real estate markets are not or will remain immune from the effects of the COVID-19 pandemic.
A nefarious scenario recalls a question that many ask themselves: will house prices drop? In Italy, the drop in the number of real estate transactions is a certainty, but it will not be accompanied by an equal drop in prices, at least not in the short term. This is what Nomisma and Scenari Immobiliari say, two big independent and private Italian real estate research institutes (
Nomisma 2020;
Scenari Immobiliari 2020).
There are two factors to be reckoned: on the one hand, the impoverishment that will result as an effect induced by involuntary inactivity for many productive and commercial sectors; on the other, a new future propensity of families who will give priority to saving to protect themselves from other future difficulties. In the short term, the effect of this situation will reflect quickly on housing sales and real estate prices, which for the residential market, could drop between 1.3% and 4.0% in the two-year period 2020–2021, and then, slightly rise in 2022, according to what the Nomisma Institute affirms (
Nomisma 2020). The real estate outlook of the Scenari Immobiliari group, updated to April 2020, indicates an estimated 2.1% reduction in real estate prices (−1.2% for Naples, the capital city of Campania) (
Scenari Immobiliari 2020). Since the end of the Italian lockdown, real estate data sourced by “Idealista”, one of Italy’s most important websites for real estate ads, have recorded a reduction in the requested home prices in the order of 4.4% for Naples (capital of the Campania region) (
Idealista 2020).
The COVID-19 pandemic is causing a dramatic reduction in consumption, with a further drop in prices and a decrease in workers’ per capita income. To this will be added to an increase in unemployment, which will further depress consumption.
The real estate market, as for other productive and commercial sectors, in the medium-long term, will not tend to move independently from the context of the aforementioned macroeconomic variables. At the sector level, therefore, only a few different possible scenarios can be proposed: the pre-virus one, for which we were preparing but was overcome by the events, a soft scenario and a pessimistic one, the latter in which the unemployment rate could increase exponentially.
In such a changing scenario, such as the one marked by the current health and economic emergency in progress, the only way to make predictions is to proceed by hypothesis.
In line with these perspectives, our aim is to provide a short and mid-run forecast of housing prices in the Campania region (Italy), beyond the levels that can be estimated from cyclical housing market downturns. Under a pandemic that exploded almost instantly, homeowners experience a dramatic loss of real estate capital, a significant economic shock to the local and regional economy, negative health impacts, and in many cases, forced evacuation and relocation during periods of decontamination and disinfection (
Giesecke et al. 2012).
We investigate the regional economic consequences of the COVID-19 pandemic, taking into account the ways in which the event might affect regional economic activity: reduction in effective resource supply and behavioral changes in the perceptions of economic factors. Although a pandemic causes no physical building damage, it generates a substantial short-run financial liquidity loss due to businesses interruption. Not only that but also changes in fear and risk perception increase the supply cost of resources, especially in the areas most affected, while simultaneously reducing demand for real estate goods. We use results from different nationwide surveys on the current COVID-19 scenario to implement a regressive model focused on real estate values and homeowners’ behavioral effects.
The effect of pandemics or health emergencies on housing markets is an unexplored topic in international literature. For this reason, firstly, the few specific studies found are reported and, by analogy, studies on the effects of terrorism attacks and natural disasters on real estate prices are examined too. Subsequently, beginning from real estate dynamics and macroeconomic indicators of the Campania region before the COVID-19 emergency, the current COVID-19 scenario is presented (focusing on employment, personal and family income, real estate judicial execution, and real estate dynamics). To predict possible changes in the mid-run of real estate judicial execution and real estate dynamics, the economic model of Lotka–Volterra (also known as the “prey–predator” model) was applied. Finally, a real estate pricing model is proposed, evaluating the short and mid-run effects on housing prices.
2. Literature Review
The effect of pandemics or health emergencies on housing markets, as already mentioned, is an unexplored topic. Only very few specific studies are found in the literature.
In 2008,
Wong (
2008) investigated how housing markets react to extreme events like the 2003 Hong Kong Severe Acute Respiratory Syndrome (SARS) epidemic. A panel dataset of large-scale housing complexes is used to exploit the cross-sectional variation in the spread of SARS to estimate the effect of the disease on real estate prices and sales. Wong concludes that the average price declines by 1–3% if a property is directly affected by SARS, and by 1.6% for all properties as a result of the outbreak of the disease. Concerning the results, he also highlights that the absence of price overreaction is likely to be related to housing market characteristics.
In 2019,
Argyroudis and Siokis (
2019) investigated the impact of the sub-prime loan crisis on the real estate market of Hong Kong and, only marginally, identify periods where the underlying dynamical structure of the real estate market was impacted by certain events like the SARS epidemic.
In 2020,
Nicola et al. (
2020) summarized the socioeconomic effects of COVID-19 on individual aspects of the world economy. Again in 2020, the main findings of the
Zillow Economic Research (
2020) on the 2003 Hong Kong SARS epidemic are: 1.75% loss in annualized Gross Domestic Product (GDP), or 5.1% monthly loss at peak, 1.3% increase in unemployment, statistically insignificant 1.9% fall in home prices, recording a drop transactions by an average of 33% for the duration of the pandemic. The Zillow Economic Research considers as inputs of its model the GDP, unemployment rate, residential real estate prices, and real estate transactions.
By analogy, we have also examined studies related to the effects of terrorism attacks and natural disasters on real estate prices in order to identify which approaches and tools can be adapted to a model that aims to capture the real estate effects of pandemics or health emergencies events. Although, apparently, natural disasters seem less comparable to the case of investigation, they may cause widespread land contamination (as what happened in Fukushima in Japan in March 2011) or also toxic spills (dioxins, petroleum products, etc.). These phenomena are certainly characterized by stigma effects, evacuation of the inhabitants, and remediation works extended for many years.
Mills (
2002) is the first scholar who studied, in a qualitative manner, the effects of terrorism on U.S. real estate and urban development, proposing the first ideas about how private people and businesses will perceive the risks and how quickly and decisively private parties will make adjustments.
Redfearn (
2005) studies the relationship among land markets and terrorism, this in respect to the uncovering perceptions of risk by examining land price changes following 9/11 attacks in U.S. The attacks on 11 September 2001 offered an opportunity to identify the idiosyncratic influence of perceived risk from terrorism. In this perspective, Redfearn performed an experiment to assess home prices before and after the events in order to isolate price changes due to changes in expectations about future attacks and their impacts on housing values. The hypothesis developed is that consumers have altered their valuation of risk and this should be testable by examining the price gradient around possible targets—prices closer to sites of greater perceived risk should become relatively less valuable.
Hazam and Felsenstein (
2007) show an inverse relationship between neighborhood house values and terror events in Jerusalem. They verify the hypothesis that fear is a central factor in understanding human behavior in the face of terror. This claim is addressed in the context of behavior in the Jerusalem housing market over the terror-stricken years in the city, 1999–2004. Using a unique data source and the tools of spatial data analysis, the paper provides support for the above hypothesis in three aspects. First, patterns of terror in the city are shown to be increasingly deconcentrated over the period studied. Secondly, the types of terror with the sharpest effect on residential property prices are those most associated with randomness. Thirdly, the effect of terror is less on purchasing prices than on rental prices.
Dermisi (
2007) identifies the cyclical patterns for the office market under potential terrorism threat by comparing vacancy rates and rent per square foot trends before and after 11 September 2001. This study goes beyond identifying general market trends and focuses specifically on the office market trends in Chicago. The findings indicate that the real estate market was severely impacted by 9/11 and did not recover until the end of 2005. In general, the Chicago office market cycles were estimated to be between 6.4 and 13 years.
Later,
Abadie and Dermisi (
2008) apply property-level data on vacancy and rents to investigate the impact of terrorism risk following 9/11 on the office market in downtown Chicago. The 9/11 attacks induced a large increase in the perception of terrorist risk in the Chicago Central Business District, which includes the tallest building in the U.S. (the Sears Tower) and other landmark buildings, which are potential targets of large-scale terrorist attacks. Results suggest that economic activity in the Central Business Districts can be greatly affected by changes in the perceived level of terrorism.
Arbel et al. (
2010) present new findings on the economic cost of terror. In particular, the paper provides evidence of changes in house prices in the Gilo neighborhood of Jerusalem in the wake of the 2000 Second Palestinian Intifada, using a real estate sample of 555 housing transactions from the Gilo neighborhood of Jerusalem over the 1997–2008 period. Results indicate that shooting events result in a lagged 12% reduction in Gilo house values. However, as evidenced in the impulse response functions, those effects are largely reversed within 18 months of the terror event. Again, highlighted is an average quality-adjusted house price decline of about 10% among “frontline” relative to “non-frontline” dwellings in Gilo in the aftermath of the outbreak of hostilities; moreover, much of that effect persisted some five years subsequent to the cessation of violence.
Besley and Mueller (
2012) exploit data on the pattern of violence across regions and over time to estimate the impact of the peace process in Northern Ireland on house prices. After establishing a negative correlation between killings and house prices, they estimate the parameters of a Markov switching model with conflict and peace as latent states, and this model is used to estimate the size of the peace dividend, as captured in house price changes.
Dormady et al. (
2014) provide a model for the economic analysis of the potential consequences of a simulated anthrax terrorism attack on real estate within the Seattle metropolitan area. In particular, they have spatially disaggregated the impacts on the median sales price of residential housing within the Seattle metro area, simulating an attack on the central business district, and found that the median sales price could decline by as much as 280,000 USD, and by nearly 100,000 USD in nearby communities (i.e., from 86.80% to 30.99%, approximately).
Concerning the economic effects of natural disasters,
Hallstrom and Smith (
2005) propose a model in order to measure, in the Florida counties, the impacts on housing prices of Hurricane Andrew, also comparing these effects with the hurricane’s direct path. Two regression models, based on repeat sales prices as the dependent variable, have been implemented. In the case study of Hallstrom and Smith, housing prices declined by 19% in the surrounding flood hazard areas, with homebuyers and sellers strongly influenced by information or events in the areas adjacent to directly impacted areas by Hurricane Andrew.
With similar aims,
Smith et al. (
2006) apply some regression models in order to analyze how people and housing markets respond to Hurricane Andrew impacts in Dade County, Florida. The study highlights that economic circumstances of a household are more significant factors than housing prices, in regard to Hurricane Andrew effects. Moreover, recalling the study of Hallstrom and Smith, the authors also highlighted some significant social effects—since the housing prices are lower in flood areas, after Hurricane Andrew, the population grew faster in these areas. This due to the different financial capacities of homebuyers. Lower-income households moved into highly damaged areas due to better affordability, while middle-income households moved out of those same areas, favored by their financial ability to do so.
Differently, Zhang and Peacock focused their work on how quickly housing values recovered to their pre-disaster levels before of Hurricane Andrew (
Zhang and Peacock 2009). Although housing sales increased after the hurricane and floods, the real estate values slowed significantly. A noteworthy aspect of the study is how the abandonment rate by homeowners has influenced the number of housing sales.
Almost all of the above studies evaluate the changes in housing prices with respect to the event distance from the urban context involved. This to verify if real estate values and perception of risk change with the distance from a possible terrorism event or natural disaster. Even if the distance was used as a proxy variable about assessing the risk perceived by people, its combination with local economic and demographic factors may condition significantly the housing values.
3. Real Estate Dynamics of the Campania Region before the COVID-19 Emergency
The latest available real estate data from
EUROSTAT (
2020) on nominal house prices refer to the third quarter of 2019 and show for the E.U., in terms of annual trend variations (third quarter of 2019 compared to the third quarter of 2018), an increase of around 4.1% in the euro area.
In Italy too, house prices, in the third quarter of 2019 (latest update available), show a positive trend rate (+0.4%). The increasing trend is mainly attributable to the prices of new homes which accelerated, on a trend basis, from +0.5% in the second quarter to +1.3% in the third quarter of 2019. Additionally, the prices of existing homes, after ten quarters of consecutive drops, show a slight positive change of +0.1%.For the main Italian cities, the current slowdown in housing sales is confirmed. Compared to the same quarter last year, the large Italian metropolises recorded an average contraction in the real estate transactions of more than 3% (
Italian Revenue Agency 2019).
House sales in the Campania region were equal to 35,048 in 2018 and 35,602 in 2019 (the last update available specifically referred to the Campania region and was provided in 2020 by the Real Estate Market Observatory of Italian Revenue Agency), marking for 2019, a +1.4% in transactions compared to 2018, an increase more contained than last year (+4.2% in 2018, with respect to 2017 year), but which confirms the general positive trend of the residential sector since 2014. In 2019, the overall growth observed at the regional level shows that it is higher in the provincial capitals (+6.4%), compared to sales in the entire provincial market (+4.2%), while the provincial distribution of housing transactions confirms the main role of Naples’ province, with 54.4% of regional transactions. For the provincial capitals, there was a slight decrease (−0.8%), in contrast with the sales in the entire provincial markets; the province of Naples confirms its main role with 54.2% of regional transactions.
The trend of the Market Intensity Indicator (so called “IMI—Indice del Mercato Immmobiliare”) follows the sales and purchases, highlighting growth in all territorial areas. The analysis of the historical series shows a gradual rise from 2014. It should also be noted that the main cities are the ones driving the increases.
The most active regional real estate markets are those in the provincial capitals, in the hinterland of the Naples metropolitan area and in the tourist areas of the coastal strip.
At the regional level, the average surface of the houses sold is equal to 110.1 sqm (approximately +0.4 sqm compared to 2018) and to 102.0 sqm in the provincial capitals. More than 70% of the market concerned housing units between 50 and 145 sqm. Although, with different percentages, the order of preference does not change if the distribution in the main regional cities is observed.
Analyzing the market trend rates in 2019 compared to 2018, by housing size classes, growth emerges in all the real estate segments, in particular, for units with a surface between 115 and 145 sqm (+1.4%), or over 145 sqm (+3.2%). In the provincial capitals, a general contraction is recorded for all the dimensional classes of housing, except for housing between 85 and 145 sqm.
The housing market data collected by the Real Estate Market Observatory of the Italian Revenue Agency show, for the year 2019, as regards the entire regional territory, a decrease in the average property prices for main cities (−0.6%) and stationary data for the rest of the provinces. It should be noted that, despite the long-run period of crisis in the real estate market, in 2019, the average regional prices are still 16% higher than those of 2004. As regards the differentials of the average housing prices with respect to the national average price of housing, the highest prices in Campania are mainly achieved, in addition to Naples and Salerno, in the municipalities on the regional coast, where average prices are 1.5 to 5 times higher than the national average (
Italian Revenue Agency 2019).
4. Regional Economic Indicators before the COVID-19 Emergency
In the last fifteen years, the Campania region has gone through cyclical economic phases. The long recession that began in 2008, which continued uninterruptedly until 2013, was followed by a recovery that has gradually lost strength in recent years. The partial recovery from 2007 activity levels risks being significantly compromised by the most serious pandemic of the last century, despite the spread of the coronavirus and the incidence of deaths attributed to the virus in Campania being much lower than in the epicenter regions of the infection.
The Campania economy was immediately affected by stringent measures of physical distancing and limiting the mobility of citizens, aimed at limiting contagion. These interventions, which initially concerned the areas where the first outbreaks emerged, have been extended nationally with the lockdown, and the closure of all activities considered non-essential (from 26 March 2020). In Campania, the impact of these measures was less extensive: 58.6% of the employees of the local units in the region remained active, representing 60.5% of the turnover, both values above the average estimated for the Italy. The employment rate, which remained substantially stable in 2019 at 41.5%, drop to 40.9% in the first quarter of 2020 (
Bank of Italy 2020).
According to the latest statistics provided in 2020 by the Bank of Italy regarding the regional economy of Campania, employment decreased in 2019 (−1.0%), confirming the interruption of the expansion phase recorded from 2015, while it continued to grow, albeit with a slower route, in the Italian average (0.6%) and in the southern average (0.2%). Overall employment in Campania has returned, already since 2017, to the levels recorded at the beginning of the global economic crisis, however, despite the recovery of recent years, it remains even lower for industry in the strict sense and, above all, for building sector.
Significant differences are also found within the region between local work systems, characterized by different employment dynamics in response to the crisis and subsequent recovery. The global economic crisis has in fact affected the local systems of the areas north and west of the Campania region, which however, show different dynamics of recovery in terms of duration of the recession and recovery of employment levels.
The job offers declined (−1.4%) in 2019, due not only to the reduction in the number of employed, but also the effect of people looking for employment (−3.1%). The activity rate of the population between 15 and 64 years old decreased by 0.4% (to 52.2%) and the unemployment rate by 0.4% (to 20.0%).
Over the past five years, the share of families in Campania who value their economic situation has improved and the share of those who consider their economic resources to be at least adequate has gradually increased. In 2017, the last year of reference for the territorial economic accounts, the disposable income of consumer households was equal to 13,150 EUR per capita in Campania (18,500 EUR in Italy). In 2018 and 2019, disposable income slowed down, reflecting the drop in employment.
In the economic recovery phase, employee income mainly contributed to the income dynamics, making up more than half of the disposable income of Campania families. The dynamics of property income provided a tendentially negative contribution. The per capita earnings, measured at constant prices, increased slightly.
According to Istat (Italian National Institute of Statistics) data, in 2019, in Campania, the share of families in relative poverty, i.e., with a monthly expenditure lower than the average in the country, was 21.8%; in Italy the incidence stood at 11.4%. The “irregular” worker rate, according to Istat data, was equal to 19.8% (13.1% in Italy) in 2017, the last year available; the share of residents who, by not accessing economic support actions, need other income support measures to tackle the risk of poverty, has sharpened due to the health emergency (
Bank of Italy 2020).
The region is characterized not only by a significant incidence of poverty, but also by an inequality of work income higher than the average of the Italian regions
The well-being of Campania families is affected not only by economic gaps but also by those in the quality of local public services and in the other dimensions of fair and sustainable well-being. The use of a mortgage loan is the main source of financing for families for the acquisition of residential properties. In Campania, positive housing purchase conditions have benefited over time by the drop in house prices and interest rates, especially in the first part of the last decade.
5. Post COVID-19: What Scenarios?
Our model to estimate real estate price changes resulting from the current COVID-19 scenario derives from a shock of regional economic outputs. That shock, focused on the main regional economic and real estate outputs, allows us to predict the effects on housing prices in
Section 6. The choice of variables (economic and real estate) to be included in our model is made on the basis of the literature review carried out previously in
Section 2.
Under current COVID-19 effects, the value of each regional economic and real estate variable considered in the statistical model subsequently implemented is prefigured in this section.
5.1. Employment
The drop in employment was partially offset by the suspension of layoffs for economic reasons and the strengthening of a “Wages Guarantee Fund”, which in April 2020 alone recorded more than twice the number of hours authorized in respect to 2019. The Campania employment structure makes the regional labor market particularly exposed to the effects of adverse shocks; in 2019, a significant share of workers was employed in the commerce, hotels and restaurants sector, most affected by restrictions on mobility, and was part of categories more at risk from the point of view of stability of the employment relationship, such as self-employed workers and employees with fixed-term contracts. In the presence of a relatively wide spread of irregular work in Campania, the share of residents who cannot access social security contributions and for whom specific income support measures are needed, made even more necessary by the health emergency that has worsened, is also significant.
That said, there are possibly 420,000 fewer employees in 2020 due to the COVID-19 pandemic. This is what emerges from the update made in March by Unioncamere (organization which federates the Italian Chambers of Commerce) through its forecast model of the employment needs of private companies in industry and services which, taking advantage of all the information available to the system of the Chambers of Italian Commerce, allows the carrying out of a first study for the year 2020 characterized by the emergency COVID-19. This is an unprecedented crisis scenario, in which the national and international economy has been hit by a shock of huge proportions on both the demand and supply sides (
Unioncamere 2020).
The first estimates consider an intermediate scenario of progressive exit from the crisis and recovery of economic activities by May, without however, taking into account the possible effects of the measures to support the economy which will be activated at the national and European level, since they are still being defined.
In 2020, net of the workers who will benefit from the unemployment benefit, it is estimated that the stock of employed persons in the private sectors of industry and services, on an annual average, is 422 thousand units compared to 2019 (−2.1%). In fact, a reduction of 190 thousand units (−3.4%) and for private employees of 232 thousand units (−1.6%) is expected for the self-employed or independent workers ones (
Unioncamere 2020).
The analysis of the main production sectors shows an estimated decrease of 113 thousand units in industry and around 309 thousand in services. Tourism is the sector with the greatest difficulty, with an estimated drop in 2020 of 220 thousand employees, but large declines in the stock of employees are also estimated in the construction sectors (−31 thousand units), fashion (−19 thousand units), metallurgy (−17 thousand units), mechatronics (−10 thousand units) and the rubber and plastics industries (−10 thousand units). As far as services, over the tourism sector, there are important reductions in the number of people employed in commerce (−72 thousand units), in cultural, sports and other services for people (−24 thousand units) and in transport and logistics (−18 thousand units).
The economic sectors for which a positive balance can be expected are those of healthcare (+26 thousand units), ICT services (+8 thousand units) and the pharmaceutical industries (+1200 units).
Estimations of changes in employees in the private sectors of industry and services are obtained through the implementation of an econometric model that estimates the evolution of the stock of average annual employees (from (
Italian National Institute of Statistics (ISTAT) 2020), considering GDP as exogenous variable. About the forecasts, a specific model was implemented in order to take into account the shock deriving from the health emergency following the spread of the COVID-19 epidemic and the different impacts in the production sectors. The scenario of contraction of GDP in 2020 is a scenario based on the available assessments of the Chambers of Commerce system and of the major national research institutes.
5.2. Household and per Capita Income
The workers employed in sectors subject to lockdown live in families that for more than 36%, have dependent children and for more than 40%, are single-income; for these workers, without any state intervention, the closure of their work sectors result a significant reduction of income (see
Table 1).
With respect to an average 33% reduction in gross income for the entire population, due to the effect of the Italian legislative measures, the compensatory measures could lead to an average reduction in disposable income of 12%. It is interesting to note how the so called “Cura Italia” Italian decree (
Italian Law Decree No. 18 2020) has a strong redistributive effect: for example, 20% of the poorest families, faced with a loss of market income of over 40%, should bear a net loss of disposable income of less than 9%.
From the ratio between the increase in the net benefits provided by the “Cura Italia” Decree and the reduction in market income after tax, it is possible to define the degree of compensation for the support measures for families implemented by the Italian Government. Considering the income of a single month,
Table 2 highlights how the first measures have a potentially disruptive impact on the probability of falling into poverty of all the families concerned and that the D.L. manages to limit its effects only partially (
Report Insubria University 2020).
The crisis, even with the compensatory tools of the Decree, determines an increase in the risk of poverty of about 8% for the overall population and of more than 13% among minors, based on their family income.
On monthly basis, the effect on incomes is only for the first month, or only from the introduction of the Italian Government measures, regardless of the possible savings that families can draw on in the short term. It is also clear that families have overall reduced their consumption as a result of the lockdown and that a complete analysis of the economic hardship of Italian families will have to jointly consider the effect of the crisis on income and consumption. However, it is clear that the economic shock caused by COVID-19 is asymmetrical, particularly strong from an economic point of view for some families and less for others, even in the presence of the compensatory measures implemented by the Italian Government.
5.3. Judicial Procedures of Real Estate Execution
The Law Decree n. 18/2020 (“Cura Italia”), subsequently modified at the end of April 2020, suspended all real estate execution procedures in Italy for six months (
Italian Law Decree No. 18 2020). For almost all of the year 2020, therefore, a substantial block of all real estate procedures both in progress and new is expected.
In 2019, the number of real estate auctions increased by 24% in the first half of the year compared to the same period of 2018. In fact, 152,708 lots of properties published in auction in 2019 (in the first half of 2018, there were 128,000) in the 140 Italian courts from 1 January to 30 June were calculated by the Astasy Scientific Committee, a Gabetti group company that deals with real estate executions (
Astasy, Organization of Gabetti Group 2020). According to the Astasy survey, in 2018, the total auctions were 245,100.
Astasy found that the Lombardy region maintains the primacy of the region with the most properties at auction (19.05%), while Campania absorbs only 6.22% of the total lots.
The average of monthly real estate auctions in Campania, for the year 2019, is 1061 (total number of auctions equal to 12,738); compared to 2018, there was a decrease of 20.65%.
The largest number of real estate executions in Campania is concentrated in the most populous provinces (Naples and Salerno, with 8375 auctions, equal to 4.06% on national basis).
Table 3 shows the distribution of real estate executions for the five provinces of the Campania region in the year 2019.
On a national basis, due to the auction rebates, the properties undergo an average price decrease of −56%. In a relevant aspect, 51% of the property values are concentrated in only 5.6% of the assets put into execution and these are often particular situations.
Although the durations of the Italian courts have clearly improved (an average of 289 days less than in 2018), the average time of Italian justice is still very high, estimated at four years with very high percentage reductions on the award value of the properties.
About 95% of the total properties represent the so called “granular” or properties with an average value of approximately 85,000 EUR, often attributable to residential properties, with maximum values of the order of 500,000 EUR.
All that said, to predict possible change in the medium term of the growth rate of real estate execution procedures due to the COVID-19 pandemic, the economic model of Lotka–Volterra (also known as the “prey–predator” model) was applied. The applicability of this model is motivated by the fact that the real estate execution procedures, upon their resumption, will undergo a probable increase (“preys”), which will attract many real estate speculators (“predators”) in this specific market segment. The two categories of operators, therefore, will tend to interact with each other.
This mathematical modeling was proposed independently by Alfred J.
Lotka (
1925) and Vito
Volterra (
1926). Say
y(t) is the number of predators present at time
t, and
x(t) that of the prey, the equations have the following form:
dx/dt = Ax−Bxy (prey equation);
dy/dt = −Dy + Cxy (predator equation). In these equations, the derivatives
dx/dt and
dy/dt are the growth rates over time of the populations of prey and predators, while the letters A, B, C and D are positive parameters that describe the interaction between the two species considered. In particular: A is prey growth rate, B is prey’s destroy rate by predators, C is predator growth rate consuming preys, D is predator death rate. The study of the dynamic system defined by this system of differential equations allows the identification of all the types of evolution that can be had starting from any initial situation. The Lotka–Volterra system of equations is a particular example of a Kolmogorov model, which is a more general framework that can model the dynamics of ecological systems with predator–prey interactions, competition, disease, and mutualism (
Freedman 1980;
Brauer and Castillo-Chavez 2012).
The resolution of the Lotka–Volterra equations provides as output a growth rate increase in real estate executions of 3.86% compared to the value referred to in year 2019. With specific reference to the Campania region context, the inputs elaborated from us and taken as reference in the model are the following: term A equal to 7.48% (average growth rate of real estate executions); term B equal to 65.67% (success rate of real estate executions for year); term C equal to 7.48% (estimated growth rate of new real estate speculators, equal to average growth rate of real estate executions); D equal to 28.88% (success rate of executive procedures at the first auction round).
5.4. Housing Sales and Real Estate Offer (IMI Index)
In this case also, to valuate, in the medium term, change in the real estate dynamics of the Campania region (IMI index, a specific market intensity indicator provided by Italian Revenue Agency, obtained as the ratio between the number of houses sold and the available stock of houses on the real estate market), the economic model of Lotka–Volterra was used (
Freedman 1980;
Brauer and Castillo-Chavez 2012;
Lotka 1925;
Volterra 1926;
Volterra 1931). The output of Lotka–Volterra equations is a growth rate increase in IMI index of 2.88% compared to the value referred to in year 2019. The inputs elaborated from us and taken as reference in the model are the following: term A equal to 0.96% (average growth rate of residential inventory or stock available in the Campania region); term B equal to 1.32% (average growth rate in home sales/inventory ratio for the Campania region); term C equal to 4.18% (estimated growth rate of new real estate speculators, not related to the market segment of real estate judicial execution); D equal to 1.32% (rate of abandonment of the Campania housing market by economic operators who have saturated their demand).
6. Specification of the Real Estate Pricing Model
Our model to estimate real estate price changes resulting from the COVID-19 scenario derives from a shock of regional economic and real estate factors above discussed.
As mentioned before, COVID-19 affects real estate values both through housing market and economic variables. Starting from a discussion about datasets consisting of differentiated economic variables (see above), the housing prices are driven, to a large extent, by specific extrinsic and intrinsic factors: preferences, characteristics inherent to the specific location, requirements, dimension, etc., as well as also the social context in which the property is located (
Saaty and De Paola 2017;
Del Giudice et al. 2019). Social and regional factors are the real estate market drivers that are most altered by a specific pandemic event.
We utilize regional data as our unit of analysis because it enables us to make both community-specific and region-specific assessments of the macroeconomic drivers of real estate prices, while avoiding the large quantity of property-specific and exogenous information that may otherwise provide noise in our model.
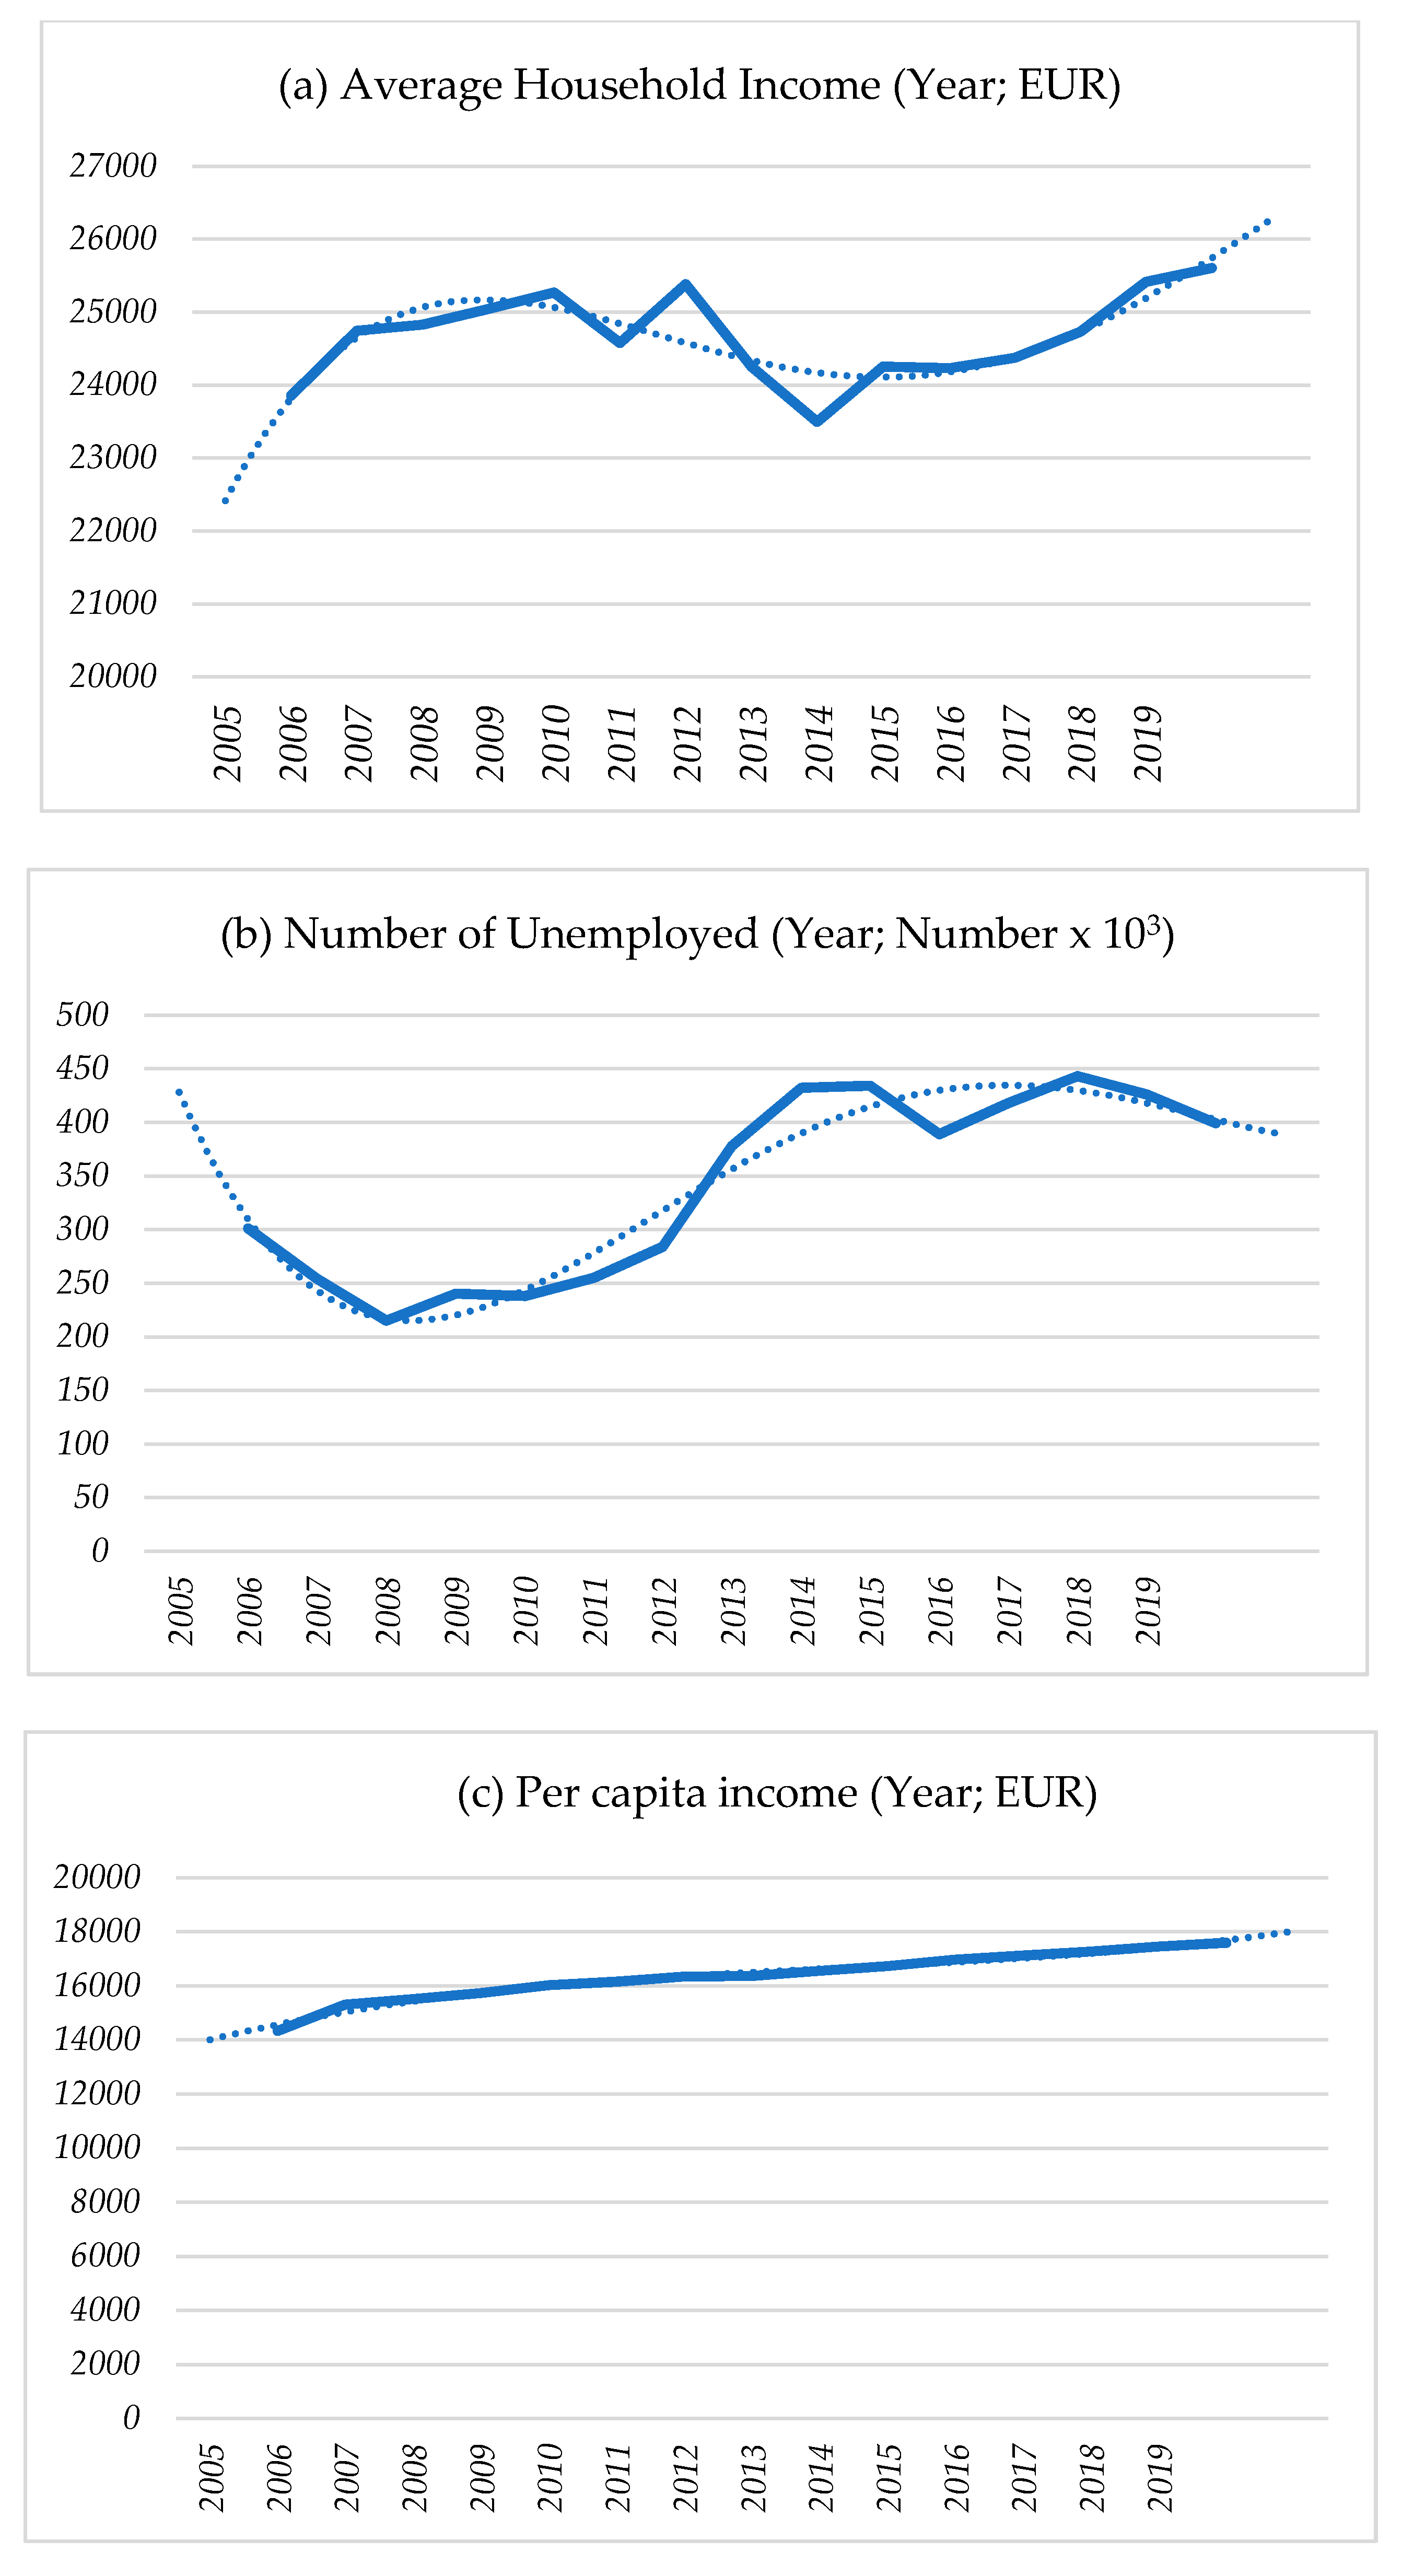
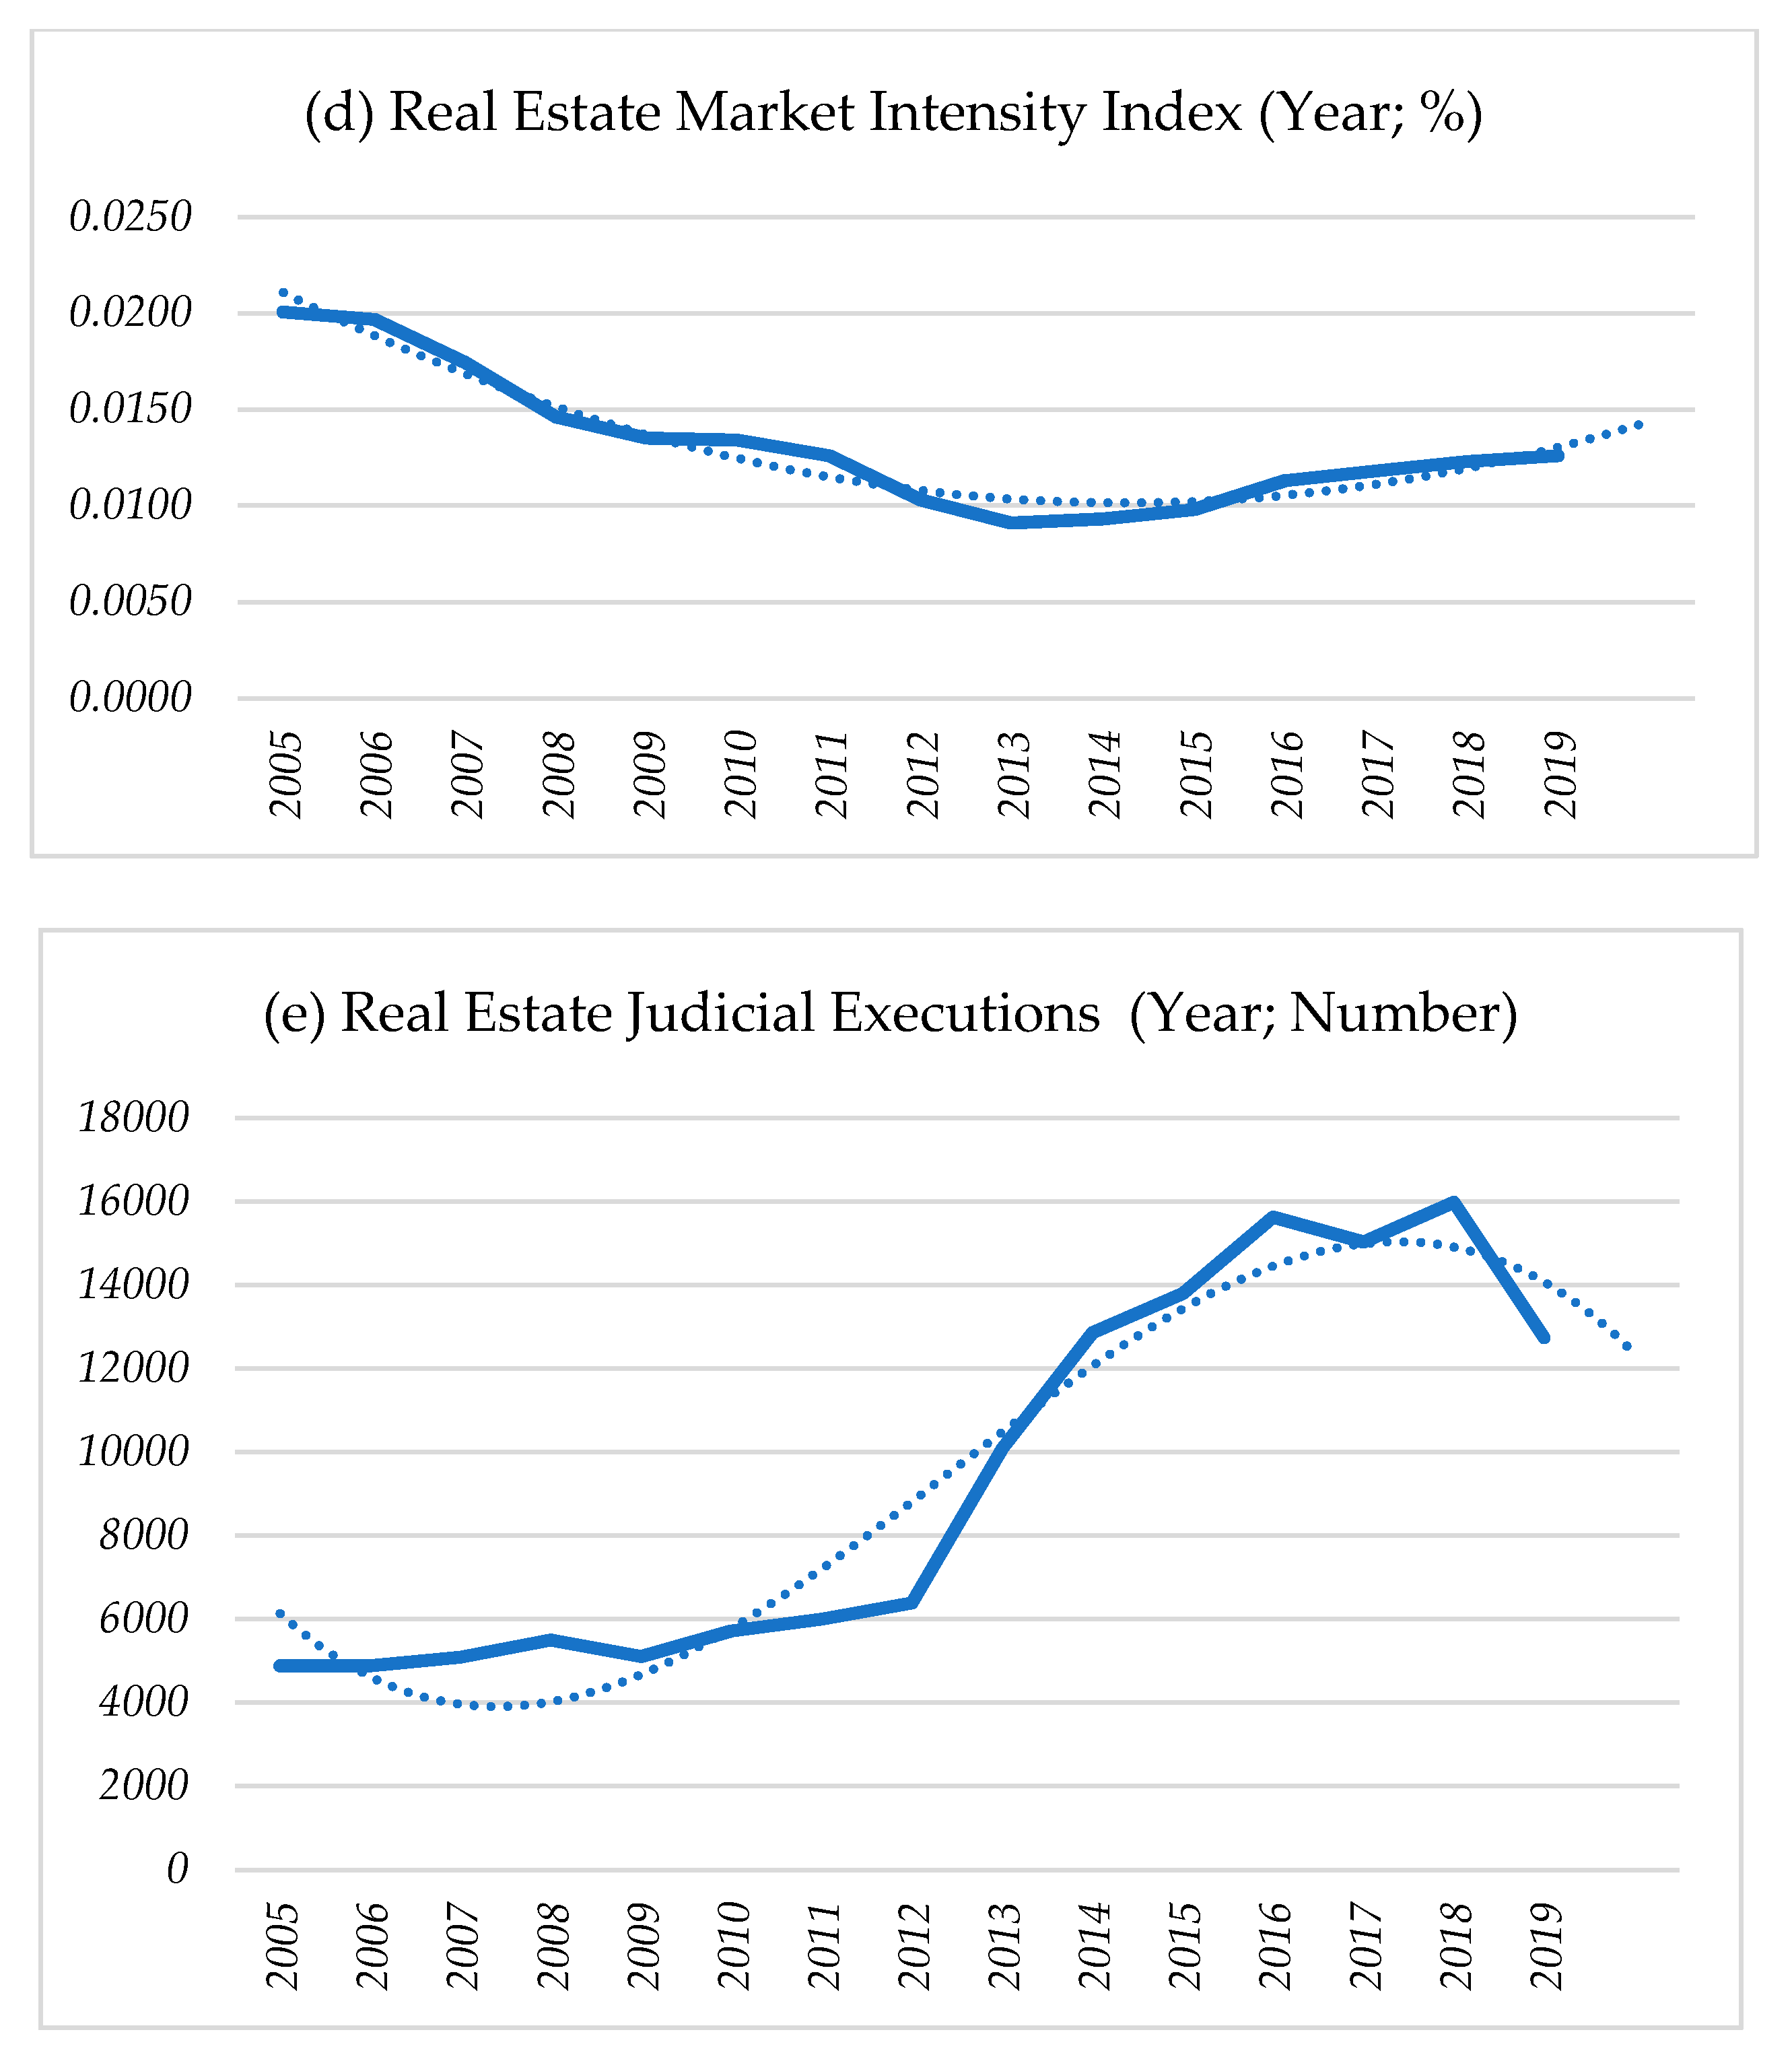
Our unit of analysis for time scale is semesters from 2005 to 2019. This time range is important for the region-specific history of the Campania region, incorporating periods with several events, such as recessions, on a local or national scale. The data used for this analysis come from a variety of both public and private sources. We provide a detailed explanation in
Table 4 and
Figure 1.
The dependent variable of this analysis is average housing price (AHP). It is measured at regional and provincial levels, and it varies semesterly across our 15-year panel. The method for elaborating these data is a multiple regression analysis (
Del Giudice et al. 2017), similarly to other studies in the literature (
Zillow Economic Research 2020;
Dormady et al. 2014). This model is given by:
where: AHP is the average housing price (dependent variable); YEAR is the year indication (the years are counted retrospectively from the present moment); AHI is the average household income (expressed in euros); UNEMP is the number of unemployment; PI is the per capita income (expressed in euros); IMI is a real estate market index depending on the number of housing transactions and the number of housing stock offered for sale (expressed in percentual terms); JEX is the number of judicial foreclosures or real estate judicial execution; u
z is a term related to fixed but unobservables effects.
The regressors included in this equation are both the fundamentals of the local and regional macroeconomy, as well as the fundamentals of the local and regional housing market (see
Figure 1).
7. COVID-19′s Impacts on Housing Prices of the Campania Region
The COVID-19 pandemic affects housing values through several channels. This includes temporary or permanent closing of entire neighborhoods or cities in which the COVID-19 emergency is endemic, fear of diffusion in a wider area, concern about long-run contagion/distrust of the effectiveness of sanitation efforts, general economic decline, and factors specific of housing markets.
Home sale declines would likely stem from the demand side, through both income effects and psychological (stigma) effects, and the latter would be attributed to the areas most affected by the health emergency. Considering past natural hazards or terrorism events (e.g., 9/11 attacks in U.S.), both domestically and in other developed nations, it can also be assumed that there would be at least a modest degree of capital influx and subsidization stemming from relief efforts and political support, which would have medium to long-run impacts that are similarly exogenous to our analysis.
Into the short-run COVID-19 scenario, we inserted into the model, beyond the time variable (referred at June 2020), the other independent regional economic variables applied differentially; unemployment, real estate judicial execution and real estate market intensity index are kept constant, as the current health emergency has in fact actually “frozen” these indicators, while household income and per capita income vary in accordance with the indications provided in
Section 5.2, for a duration ranging from the start of the lockdown (early March 2020) until the first half of May 2020 (beginning of the slow restart of the economic recovery). In correspondence with these inputs, the housing price decreases are quantified in −4.16% (−2.93% neutralizing the time variable) for the Campania region.
For the mid-run COVID-19 scenario (end 2020–early 2021), all the independent variables (both economic and real estate) are applied differentially in accordance with the indications provided in
Section 5—the inputs thus entered are certainly valid for the second half of 2020 until the beginning of 2021. The mid-run scenario is “soft”, assuming that current government actions of economic recovery can have their effective validity in the medium term, but it cannot be excluded that this scenario is much more “hard”. In correspondence with the hypothesized mid-run scenario, the housing prices decrease are quantified in −6.49% (−4.03% neutralizing the time variable) for the Campania region.
Concerning these results, it is noteworthy to highlight that the real estate cycle of the years 2000–2019 shows, in Campania, a honeycomb structure where both the real estate markets for major cities and those of intermediate cities move in the same direction, albeit with some differences. The main housing markets record a greater loss of value of the home compared to the intermediate ones, but in intermediate cities, however, there is a higher loss of market share. In such a changing scenario, such as that marked by the current health and economic emergency underway, the effects on housing prices are certainly more pronounced in larger cities than in intermediate ones.
The results of the real estate pricing model are provided in
Table 5.
The regression is robust overall because the model has strong fitness measures, indicating that a proper set of both economic and real estate variables has been included. From the statistical point of view, the determination index is equal to 0.924 (corrected determination index equal to 0.866) and the F-test is significant for a 95% confidence level (F-test = 4.51 × 10⁻⁴).
The correlation indexes are shown in
Table 6. The degree of correlation between the explanatory variables does not require particular corrections since the matching of the model with the observed data is high. In fact, it does not reduce the predictive power or reliability of the model as a whole, at least in the dataset, for purposes—we emphasize—exclusively predictive of the dependent variable. In the case of any collinearity, validity can affect individual predictors and not the final result, however, in the case under examination, there is plausibility in the signs and in the amounts of the parameters which do not require the search for additional tools to deal with possible effects of collinearity. Concerning the “strength” of the correlation coefficient (which has no transitive measure), it must not be confused with its statistical significance. In fact, with the same correlation coefficient, the significance varies according to the number of data samples. Certainly, the reduced sample size leads, in the case in question, to obtaining limited results for some individual predictors. In general, a correlation that exceeds the 0.8 threshold (positive or negative) is considered “strong”, but obviously, we must also refer to the subject of investigation and the nature of the data; for example, it is clear that the calculation of correlation between the number of Real Estate Judicial Executions and Personal Income (as for Unemployment also) variables that, by their nature, are completely different from each other, can provide an index that has only purely descriptive validity but no statistical significance. The correlation index can provide a perception of the “effect size”, but must be read in conjunction with the p-value also: if a correlation is not significant (
p-value greater than 0.05), we cannot say much about that relationship; instead, if it is significant (
p-value less than 0.05) at that point, we can go on to evaluate if it is a weak, medium or strong correlation.
For completeness,
Table 7 shows the Variance Inflation Factors (VIF) for economic and real estate variables.
In the model, the variables’ coefficients directly express the marginal prices: the intercept is related to specific fixed or unobservables effects of context and has a negative sign, it is equal to 1880.76 EUR; for the “YEAR” variable, the marginal price is 49.59 EUR for each year retrospectively from the present moment; for the “AHI” variable, the marginal price is 0.05 EUR for every unit variation of average household income; for the “UNEMP” variable, the marginal price (negative sign) is 0.64 EUR for every unit variation of unemployment; for the “PI” variable, the marginal price is 0.20 EUR for every unit variation of average per capita income; for the “IMI” variable, the marginal price (negative sign) is 31,773.78 EUR for every unit variation of this real estate market intensity index; for the “JEX” variable, the marginal price (negative sign) is 0.01 EUR for every unit variation of the number of real estate judicial executions. All expected signs of the variables are consistent with current Campania housing market dynamics.
The t-test is passed 98% for the “IMI” variable, 91% for “YEAR” variable, 86% for “PI” variable, 63% for “UNEMP” variable, 62% for “AHI” variable, and 53% for intercepts and “JEX” variables. Therefore, all variables are statistically significant enough.
The per capita income demonstrated to have the strongest effect on real estate prices, as holding all other variables constant, a 1% variation of PI would change housing prices by 0.25%. That effect is higher than other variables: 1% variation of the unemployment variable would change house sale prices by 0.12%. Lower is the effect of the average household income—only a change of 0.09% in housing prices, varying 1% of this economic factor.
However, logically, also real estate variables (IMI and JEX) are robust indicators of the health of local and regional real estate markets. IMI index represents a measure of real estate market intensity, and its 1% change would vary housing prices by 0.19%. While judicial execution procedures signal to homeowners that housing demand may be in decline and are often both a cause and a consequence of a depressed real estate market: forecasts of our model indicate that a 1% change in JEX variable can induce only a 0.07% of variation in housing price. About that, it is noteworthy that increases in housing inventory have historically provided a supply-side effect that has led to declines in housing prices. In other words, as the supply of available housing increases, the price of housing relative to demand declines. In a post COVID-19 scenario, we logically hypothesize that there would be a proportionally small effect in the opposite direction.
8. Conclusions
The Italian real estate sector is facing an unprecedented situation with potentially dramatic consequences.
Household investment prospects will change. Housing demand, which is always long-lasting, will only grow after 2021 and will need products (new or recovered) suitable for the times—high-quality properties capable of offering a safe and healthy living and working environment.
The COVID-19 emergency highlighted that domestic spaces have become obsolete from a functional point of view, especially in current times of smart-working and minors being forced into social and home isolation due to unpredictable health emergencies. Residential and office real estate sectors, once distinct, today tend to overlap with each other. Therefore, new market segments appear to be identified and studied in their main components and characteristics.
Even if the expected reduction in housing prices is apparently limited, 4.16% in short-run and 6.49% in mid-run, results in line with the forecasts provided by independent research institutes or real estate ads websites (
Nomisma 2020;
Scenari Immobiliari 2020;
Idealista 2020), “predatory” housing prices can occur in the short-run and this phenomenon may well change the national and local economic geography.
In these perspectives, the greatest danger for the national and local economy is the income impoverishment that will arise as an effect induced by forced inaction.
The model proposed may be useful to evaluate different scenarios in real time about the effects of pandemics or health emergencies on real estate markets, as well as any natural or anthropic event that may have a relevant effect on housing prices and local economic factors (as per capita income, household income, unemployment).
This article highlighted the potentialities of a statistical model, simple but very effective, analyzing the impacts of the COVID-19 pandemic on the Campania housing market.
In any case, our results are intended to be illustrative about the vulnerability of local real estate markets rather than to provide a precise framework for possible recovery actions formulation at this time for the Campania housing market.


