
Refugee Population and Environmental Quality in Sweden and Lebanon: Is Fertility Rate Changing the Dynamics?


1
CREDS-Centre for Research on Digitalization and Sustainability, Inland Norway University of Applied Sciences, 2418 Elverun, Norway
2
Faculty of Economics, Administrative and Social Sciences, Nişantaşı University, 69002 Istanbul, Turkey
3
Department of Agricultural Economics, Federal University of Agriculture, Makurdi 970101, Nigeria
*
Author to whom correspondence should be addressed.
Soc. Sci. 2023, 12(4), 243; https://doi.org/10.3390/socsci12040243
Submission received: 21 February 2023
/
Revised: 2 April 2023
/
Accepted: 9 April 2023
/
Published: 18 April 2023
Abstract
:Arising from the arrays of man-made factors (including political- and socioeconomic-related factors) and natural disasters across the globe, population displacement, as one of the consequences of the above-mentioned factors, has continued to trigger refugee populations. This is the reason Lebanon (with the highest number of refugees per total population in the world) and Sweden (with the highest number of refugees per total population in Europe) are considered in a comparative investigation. Importantly, this study examines the environmental effect of greenhouse gas (GHG) emissions via the refugee population and fertility rate, alongside the roles of income and natural resource abundance, from 1990 to 2021. The results reveal that fertility rates spur GHG emissions, thereby hampering environmental sustainability in both countries. While the refugee population mitigates GHG emissions in Sweden, the effect is contrary and environmentally damaging in Lebanon. The disparity in the countries’ environmental proactiveness, which has supposedly permeated societal values, especially in Sweden, could have influenced the above result. Meanwhile, in both countries, the refugee populations moderate the effect of the fertility rate, increasing the environmental demerit of the increase in the fertility rate. However, the Swedish income level improvement helps mitigate GHG emissions, thus validating the environmental Kuznets curve (EKC) hypothesis in the long run. In Sweden, the natural resource abundance also promotes environmental benefit. Contrarily, in Lebanon, increases in both the natural resource abundance and income per person increase GHG emissions, thus worsening the environmental quality. Finally, this study offers policy recommendations for improving refugee programs.
1. Introduction
Despite human achievements and advancements in the 21st century, humanity remains vulnerable to natural and man-made disasters. The consequence of this is the increasing number of displaced populations across the globe. Globally, the number of refugees has steadily continued to rise for various reasons. Wars, environmental disasters, climatic conditions, violence, conflict, and persecution are among the recognized reasons. Given these reasons, it has been revealed that Lebanon has the largest proportion of refugees globally (19.8 percent of the country’s population) (Norwegian Refugee Council 2022). According to the United Nations High Commissioner for Refugees (UNHCR), 13,715 refugees from other countries and over 1.5 million Syrian refugees were estimated to be in Lebanon (UNHCR 2019). More alarming is the fact that the environmental quality is not spared from the consequences of the above-mentioned scenario. Specifically, the environment has continued to be a secondary concern in Lebanon, given that the country is faced with an ineffective institutional or legislative framework, and inefficient policies to deal with the problems and political obstacles involved in implementing reforms for a sustainable environment (World Bank 2011).
Especially for the case of Lebanon, United Nations Environment Programme (2021) acknowledges the undesirable increase in the poverty rate among refugees, as a significant proportion of this population lacks access to basic services, including healthcare, education, and food. Due to the significant associated risks and economic hardship with which refugee populations are confronted or compounded, the government and related agencies of many host countries are now adopting the policy of resettling refugees in their preferred nations or third-world countries. Similarly, in Europe, refugees make up 2.6% of Sweden’s overall population, thereby making the country a host to the largest refugee population in Europe (Norwegian Refugee Council 2022). Unlike many other nations, Sweden has actively welcomed migrants, and many argue that the country has the most benevolent refugee policy in Europe. Specifically, in 2015, there was a significant influx of refugees into Europe. Although the Swedish government was forced to enact a temporary law that restricted the rights of refugees to the bare minimum of what the nation had agreed to through international conventions, given that many European nations were unwilling to share the burden, Sweden nonetheless took in a lot more refugees than many European nations.
Refugee integration programs in several developed countries, such as Sweden, are more effective than those in less developed states. Despite the seeming success of the integration programs in these countries, critics have also motioned the potential demerit(s) of the inflow of refugees to the host societies. For instance, competition for economic opportunities, such as the host country’s labor market, is reportedly impacted by the inflow of refugees (Ruiz and Vargas-Silva 2016; Fallah et al. 2019). Alongside the economic arguments, socioeconomic factors, such as political alignment/behavior, crime issues, and alterations in the demographics (i.e., fertility and population) of the host country, have also been named as subjects of concern (Fajth et al. 2019; Tanrıkulu 2021). Refugees’ and host populations’ fertility patterns depend on their respective traditional norms, such as the culture and religion. Understanding the patterns of marriage and reproduction among refugees is a useful approach to underpinning the diversity of the migrant population, given that immigrants may have distinct sexual and reproductive health profiles compared with the host society (Amiri et al. 2020; Kulu 2005; Korri et al. 2021). In contrast, acculturation, psychological distress, and early marriage are among the potentially associated issues of refugees and displaced populations (Abdulrahim et al. 2017; Alola and Alola 2018; Al Akash and Chalmiers 2021; Bozdag et al. 2022; Golbasi et al. 2022; Kurt et al. 2021). A more salient intuition is that migrants increase the populations of their host countries, thereby putting more burden on resources and increasing the hosts’ ecological footprints, thus potentially worsening the environmental quality. For example, an increase in fuel utilization (especially of fossil sources) for transportation and energy consumed in the camps or homes of refugees account for increased energy intensity and cause setbacks to environmental sustainability.
Given this background, this study set out to investigate the environmental effect of the inflow of refugees. Furthermore, given this primary objective, the moderating effect of fertility on the nexus of refugee inflow and environmental quality is further explored. Alongside these main objectives, the economic effects of income per person and natural resource endowment are accounted for in the investigation. Specifically, the study seeks to know whether an inverted U-shaped relationship exists between the environmental indicator and income per person in the sampled cases. For a proper positioning of the study, the cases of Sweden and Lebanon were considered because the countries are ranked among the world’s top 10 countries with the highest proportions of refugee populations (Norwegian Refugee Council 2022). Refugees account for 19.8% of the total population of Lebanon; thus, it is ranked as the country with the highest refugee population in the world. Sweden has the highest refugee population in Europe, with refugees accounting for 2.6% of the total population. To provide reliable outcomes, quantitative approaches through econometric tools are employed for the dataset spanning from 1990 to 2021. The result of the investigation should provide useful policy insight, given its novelty in terms of the sampled countries. Moreover, the study’s novelty is also rooted in the fact that there is sparse literature on the environmental effect of refugee populations with respect to fertility rates.
The other parts of the study are arranged so that the summary of related studies is highlighted in Section 2. Then, in Section 3, the dataset and empirical approaches are discussed, while the investigation results are presented in Section 4. Finally, the study concludes with a highlight of the policy relevance in Section 5.
2. Literature: Theory and Empirical Highlights
Although there is sparse literature that illustrates the empirical evidence of the environmental effect of the refugee movement, the environmental aspects of the fertility rate can be conveniently viewed from the perspective of the population dimension and environmental indicator, which is overwhelming in the literature. As demonstrated in (Bildirici 2022) and other related and highlighted studies in Table 1, the refugee population can potentially drive the environmental quality. Similarly, the evidence from (Kim et al. 2020; Alola et al. 2019a) and several related studies also demonstrates the potential of the fertility rate of the human population to drive the environmental quality. These two strands of literature are summarily captured in the associated Table 1 and Table 2, respectively.
However, the empirical conceptualization of refugees and fertility rates in the environmental model can be traced to earlier theoretical concepts. For instance, environmental impacts are presented as a function of population, affluence (such as economic indicators), and technology, which is empirically represented by the STIRPAT (stochastic impacts by regression on population, affluence, and technology) model (York et al. 2003). Moreover, by applying the concept of the income inequality and economic growth nexus in (Kuznets 1955), the possibility of a quadratic pattern representing the environmental impacts of the economic indicator was later conceived by the authors of (Grossman and Krueger 1991). Subsequently, this concept of an inverted U-shaped relationship between income and environmental degradation became known as the environmental Kuznets curve (EKC). Most empirical literature on environmental impacts is based mainly on the concept of the EKC hypothesis.
3. Materials and Methods
This study used two datasets, one for Sweden and the other for Lebanon, obtained from the World Development Index (WDI) from 1990 to 2021. The dependent variable is the greenhouse gas per capita, used as an indicator of environmental pollution. The gross domestic product, gross domestic product squared, natural resource rent, fertility, and refugees are independent variables. The interaction between fertility rates and the number of refugees (R×F) was also included as an explanatory variable. Additionally, the per capita GHG emissions were computed by dividing the total annual GHG emissions by the corresponding annual population. Table 3 presents the variables and their symbols, measurements, and sources with the units and sources of the variables. Table 4 presents their descriptive statistics. Additionally, Table 5 includes the correlation matrix. The time series plots for Sweden (Appendix A, Figure A1) and Lebanon (Appendix A, Figure A2) are also presented. All the variables have been transformed into their natural logs (l).
3.1. Empirical Method
Recently, the importance of using non-economic elements and the greenhouse gas per capita has been revisited. In this situation, the current study furthered Alola et al. (2019b)’s consideration of the non-economic determinants of the ecological footprint, such as marriage, fertility, energy use, and information and communication technology. To account for the greenhouse gas emissions of Sweden and Lebanon, this analysis uses income, fertility, refugees, and the interaction of fertility and refugees. The square of income is also included in the equation. In addition, the natural resource rent is used to account for other possible influences. As a result, the models examined in the current study are provided as follows:
The models above can be transformed as follows:
For all, t = 1990, …, 2021, and , , and are the error terms. For Sweden and Lebanon, Equations (4) through (6) can be formulated and calculated separately. Additionally, for each t, s represents the extent to which the explanatory variables responded to the GHGC. For Sweden and Lebanon, Equations (4) through (6) can be formulated and calculated separately. Moreover, , , and are the degrees to which the explanatory variables (income, fertility, refugees, and the interaction of fertility and refugees) respond to the GHGC (greenhouse gases per capita) for each t given that , , and are iid N ().
3.1.1. ARDL-Bound Test
The stationarity test, used as a preliminary test, is an approach to further justify the appropriateness of the ARDL estimation technique. The stationarity of the series was examined using the ADF (Dickey and Fuller 1979) and PP test (Phillips and Perron 1988) (see the result in Table 6). The mixed order of the stationarity of the variables is revealed in the results, paving the way for the ARDL-bound test technique (Pesaran et al. 2001). The ARDL test approach is also appropriate because it provides a dynamic relationship in addition to the long- and short-run relationships. This is because the ARDL-bound testing technique generates a dynamic unrestricted error correction model from a straightforward linear transformation without losing the information of the long-run dynamics (Alola et al. 2019a). Equations (4)–(6) are then subjected to the empirical representation of the ARDL-bound test approach to cointegration. The ARDL for Equation (4) is given as Equation (7) below:
Similarly, to acquire the short- and long-run relationships, Equations (5) and (6) are also represented as Equation (7) above. All the models (for Equations (4)–(6)) are separately simulated for Sweden and Lebanon.
3.1.2. Empirical Diagnostic Tests
Table 7 shows the result of the ARDL test for Sweden. The bound test shows evidence of a long-run relationship among the variables across the three models. The bound test captures the long-run relationship among the variables; the result suggests that the variables of interest are related in the long run. Table 7 (Sweden) shows that the three models (Model 1, Model 2, and Model 3) are statistically significant. This is because the f-statistics are higher than the upper bound at the 1% significance level. This means that there is a long-run relationship among the variables. Table 8 shows that Models 2 and 3 are statistically significant at a 1% level of significance, and Model 1 is significant at a 10% level. The heteroscedasticity test is used to confer a condition where the variance of the residual term in the model varies widely. The result from both tables shows that none of the models suffer from the problem of heteroscedasticity. Lastly, the diagnostic graphs for the CUSUM and CUSUM-squared residuals from both tables, which are not included in the manuscript due to space restrictions, show that the model is stable.
4. Discussion of Findings
The result of the ARDL model is presented and discussed by comparing estimates from Sweden and Lebanon.
4.1. Greenhouse Gas Emissions and Income
In Sweden, income has a positive and significant long-term impact on greenhouse gas emissions, but in Lebanon, it has a negative and significant long-term impact. For example, Table 7 shows that a percentage change in income is associated with ~27.35%, ~0.92%, and ~0.23% increases in greenhouse gas emissions in Models 1 (without refugee and fertility factors), 2 (with refugee factor), and 3 (with the interaction of refugee and fertility factors), respectively, for Sweden. To further examine the impact of income, the square of income (Y2) was included in the model to see the effect of a 100% increase in income on greenhouse gas emissions. Y and Y2 are, respectively, positive and negative, indicative of an inverted U-shaped curve, implying that economic growth will lead to a decline in emissions. This result implies that the EKC hypothesis holds for Sweden.
Additionally, the Swedish economy’s shift toward servitization can be considered in reference to the inverted U-shaped relationship. The rising service sector has enabled the economy to thrive without degrading the environment, which may have led to the EKC relationship. It is crucial to remember that Sweden has seen a strong tendency toward servitization, and that this change alone may have contributed to the construction of the EKC. This further shows that if proper and corrective steps are taken, then economic expansion may enhance the state of the environment (Kar 2022). Our result agrees with Urban and Nordensvärd (2018), which found the existence of the EKC in Sweden.
However, for Lebanon, Table 8 demonstrates that for Models 1 (without refugee and fertility factors), 2 (with refugee factor), and 3 (with the interaction of refugee and fertility factors), a percentage change in income is related to reductions in greenhouse gas emissions of ~121.64%, 0.52%, and ~0.53%, respectively. At the same time, Y2 shows a positive relationship with greenhouse gas emissions, indicating a U-shaped relationship between income and environmental degradation, implying that the EKC hypothesis does not hold for Lebanon. This result demonstrates a situation in which the per capita GHG emissions increase per unit of income per person. The result for Lebanon is not surprising; according to (Mahmalat 2018), the government has prioritized the macroeconomic environment, monetary stability, and taxation issues over fundamental development-related issues, such as electricity, water, education, the environment, healthcare, and transportation. Therefore, the absence of the EKC hypothesis suggests that economic growth might not be enough to provide environmental sustainability in Lebanon. This result is supported by (Onifade et al. 2021; Aye and Edoja 2017), which found that economic growth leads to more CO2 emissions.
4.2. Greenhouse Gas Emissions and Fertility
According to Models 1 and 3 (in Table 7), a rise in fertility corresponds to Sweden’s increased greenhouse gas emissions. The GHGC emissions in Lebanon grew as fertility (both current and lagged) increased (see Models 1 and 3 in Table 8). The study’s empirical evidence supports the conventional belief that a strong relationship exists between high fertility and environmental degradation. According to some debates, population directly related to fertility has climate-change-related effects, affecting environmental sustainability. It is frequently emphasized that human activity, rather than natural causes, is to blame for climate change in the use of the phrase “humans cause climate change.” However, in developed nations with low or negative population growth, excessive consumption by individuals is the primary contributor to climate change (Stephenson et al. 2010). The impact of fertility on the GHGC for Sweden is significant at the 5% level compared with that of Lebanon, which is significant at the 10% level when lagged by two years in Model 1. The result is not surprising. Although Lebanon has a higher total number of births per woman than Sweden, other dynamics, such as the consumption of energy in Sweden, might play significant roles in the contribution of the GHGC compared with Lebanon, for which the effect of the total births per woman on the GHGC was not significant in the current year except when lagged. This complicated relationship was previously noted by the authors of (Charfeddine and Mrabet 2017), who stated that environmental deterioration and fertility rates have a complex relationship. Our finding is in harmony with other authors who have motioned the undesirable effect of the fertility rate on carbon emissions (Kim et al. 2020; Alola et al. 2019a; Alola et al. 2020).
4.3. Greenhouse Gas Emissions and Refugees
The result further shows that an increase in the refugee population in Sweden reduces the GHGC (Model 2 of Table 7) compared with Lebanon, where the refugee population increases the GHGC, except for the lagged value (Model 2 of Table 8). Similarly, the interaction between refugees and fertility reduces environmental degradation in Sweden. Contrarily, the interaction further reveals that Sweden’s refugee population moderates fertility’s impact on the GHG emissions per capita. As a result, fertility further increases the magnitude of the GHG emissions as the refugee population increases. In contrast, the refugee population increases environmental degradation in Lebanon, even as the magnitude of the impact also increases with an increase in the refugee population. One possible explanation for the discrepancy in the environmental effect of the refugee population in Sweden can be conceived from the fact that Sweden receives fewer refugees on average than Lebanon (see descriptive statistics in Table 4). As a developed and more environmentally conscious state, Sweden has a more comprehensive resettlement program to address the protracted refugee situation.
Sweden also has a larger surface area (528,861 km2) than Lebanon. With a surface area of 10,450 km2, Lebanon has suffered many macroeconomic and socioeconomic difficulties recently, as the country is home to the most refugees per capita in the world. Another possible explanation for the result of Lebanon is that the increasing number of refugees in a nation such as Lebanon, which suffers economic challenges, naturally causes a surge in the traditional energy demands for heating, cooking, and other activities. According to Bildirici (2022), traditional energy use and the use of fossil fuels place various demands on the environment’s ability to sustain itself. The authors of Alola et al. (2019b) and Charfeddine and Mrabet (2017) emphasized that a growing population pressures the ecosystem, which validates our finding for Lebanon.
4.4. Greenhouse Gas Emissions and Natural Resource Rent
An increase in the natural resource rent in the previous year reduced the greenhouse gas emissions in Sweden for Models 1 and 2 (see Table 7). Sweden’s negative coefficient of natural resource rent may be explained by its more abundant natural resources, contributing to a decrease in environmental degradation by increasing the adoption of resource reuse and other resource circularity approaches. Another possible explanation is that countries with rich natural resources have high-level fiscal decentralization. Additionally, an increase in the natural resource rent decreases the need for imported fossil fuel energy and increases the development of renewable energy sources that emit low or no greenhouse gases (Baloch et al. 2019; Balsalobre-Lorente et al. 2018). In contrast, an increase in the natural resource rent increases Lebanon’s GHG per capita emissions. This suggests that rapid economic growth has forced the country’s economy to industrialize through the intensive extraction of natural resources. Finally, this process accelerates the depletion of natural resources and the rate of CO2 emissions (Tufail et al. 2021; Sarkodie and Adams 2018).
4.5. Robustness Evidence
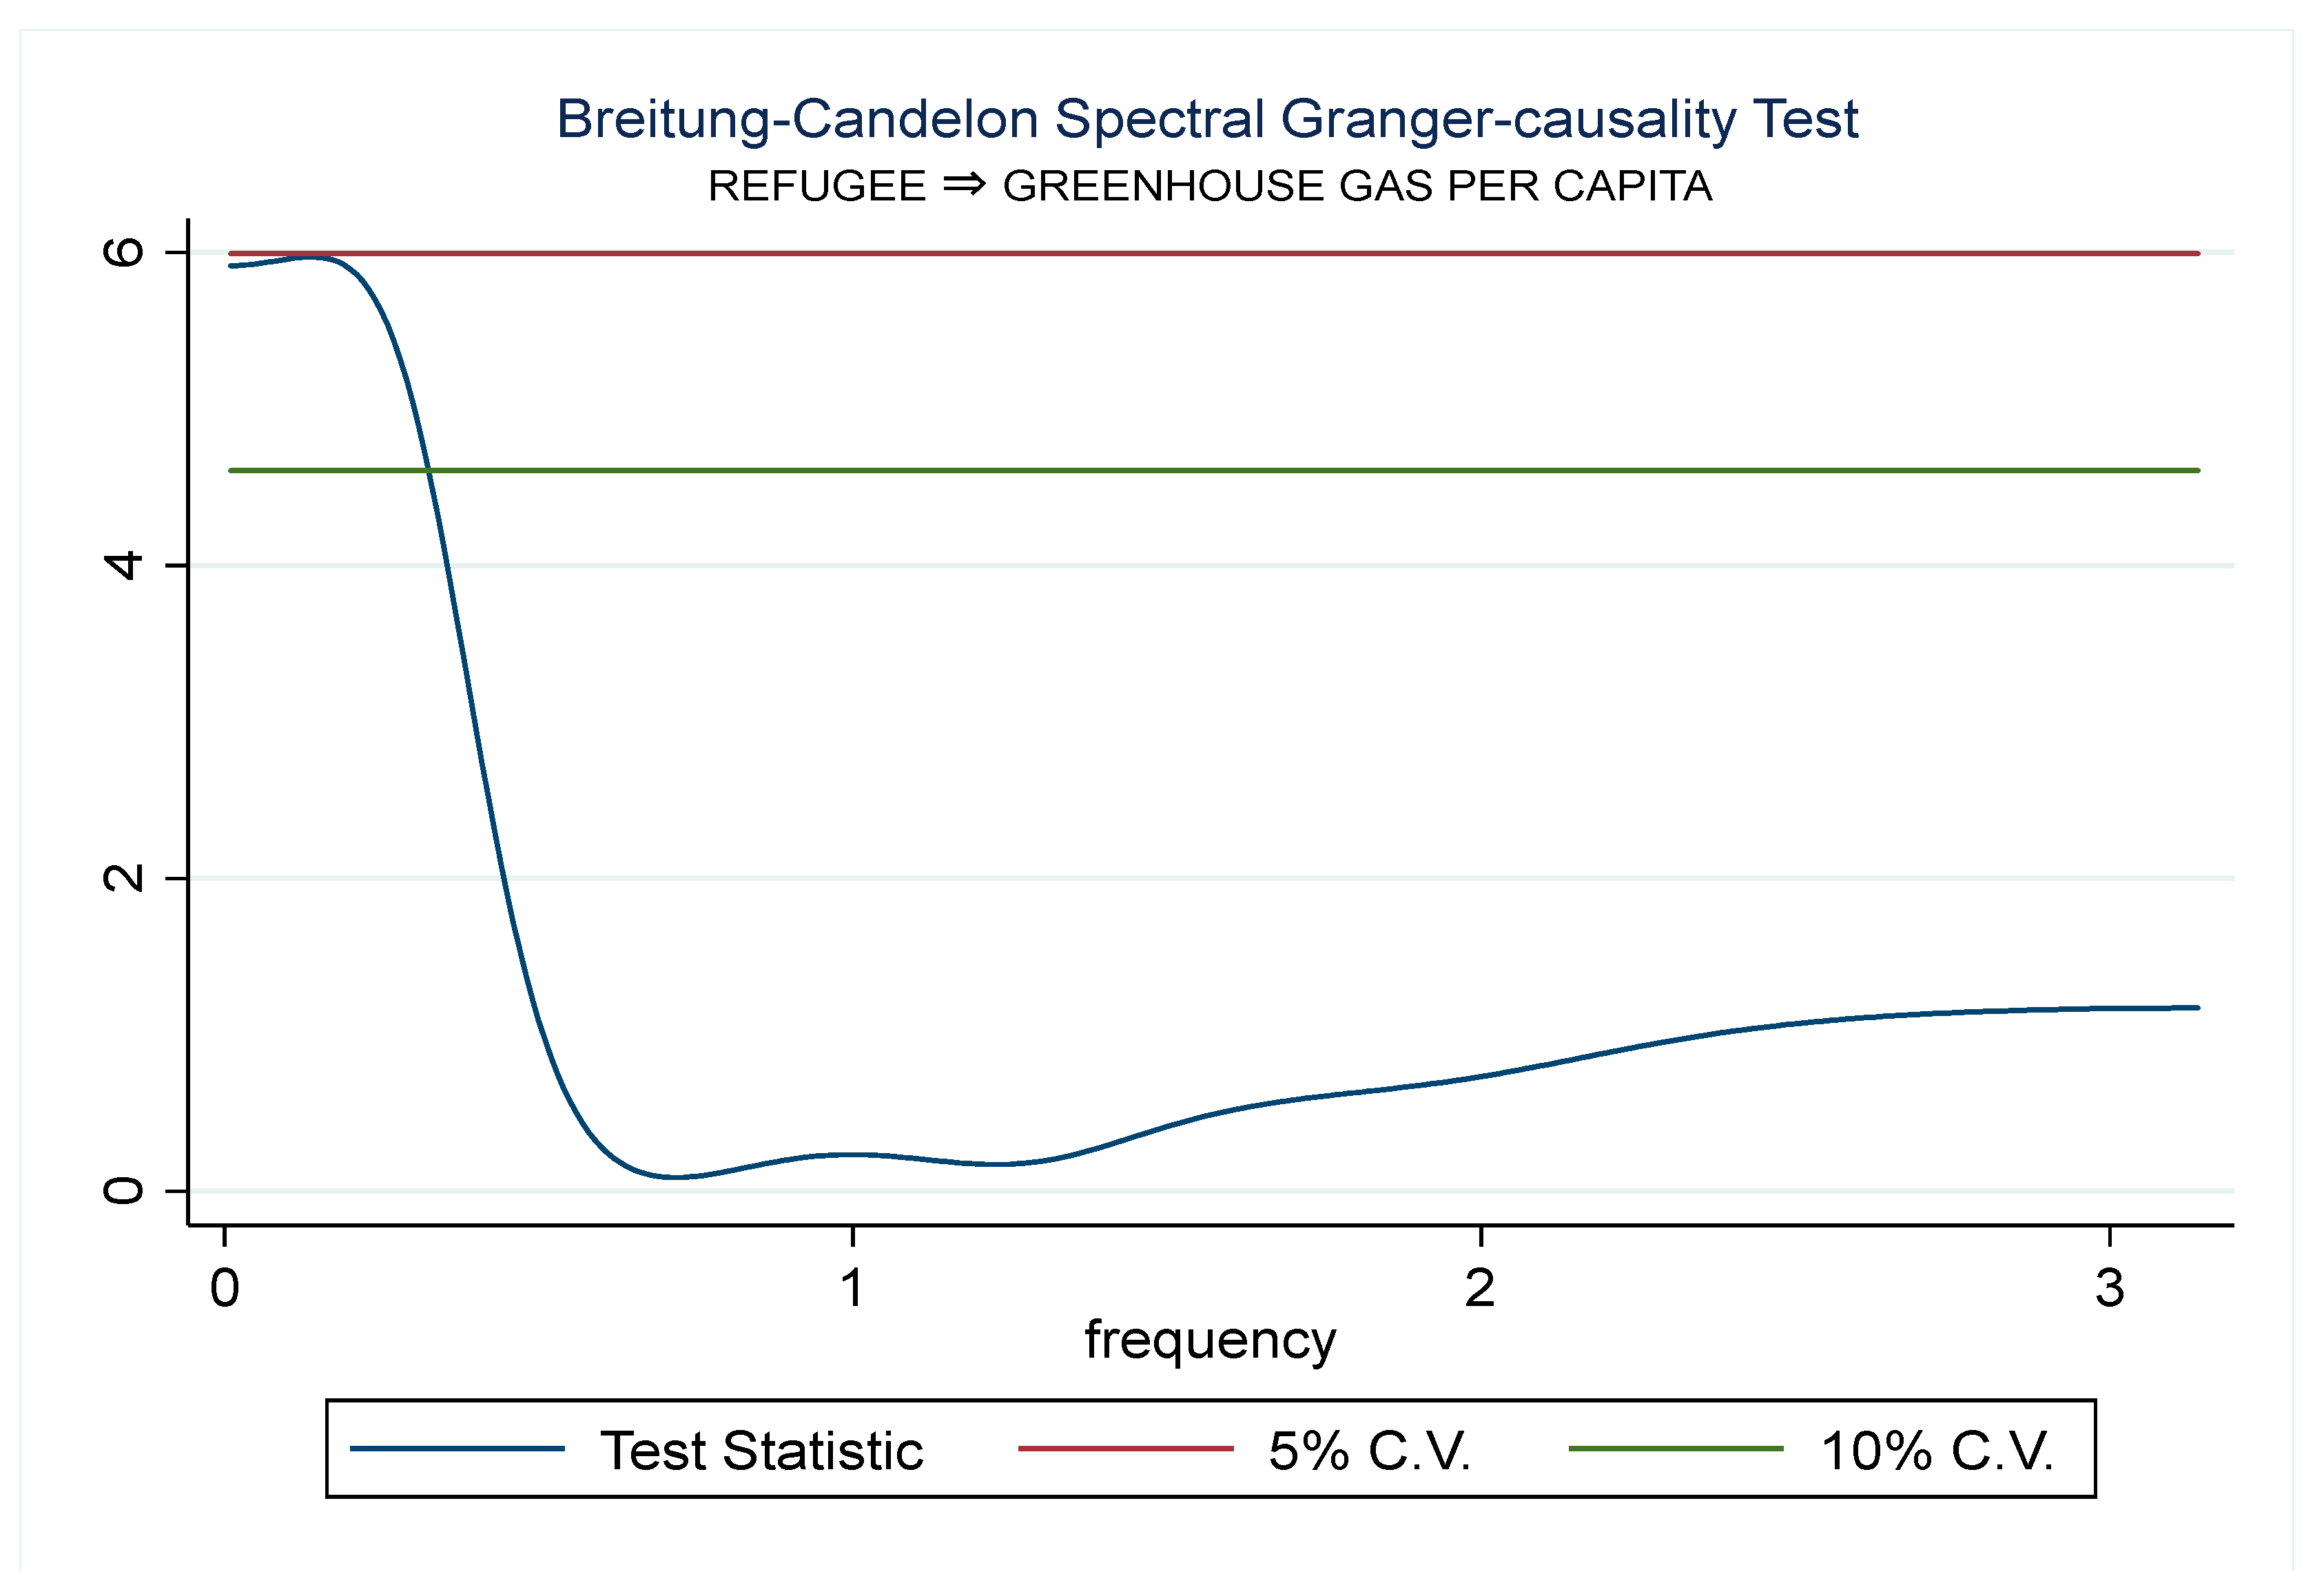
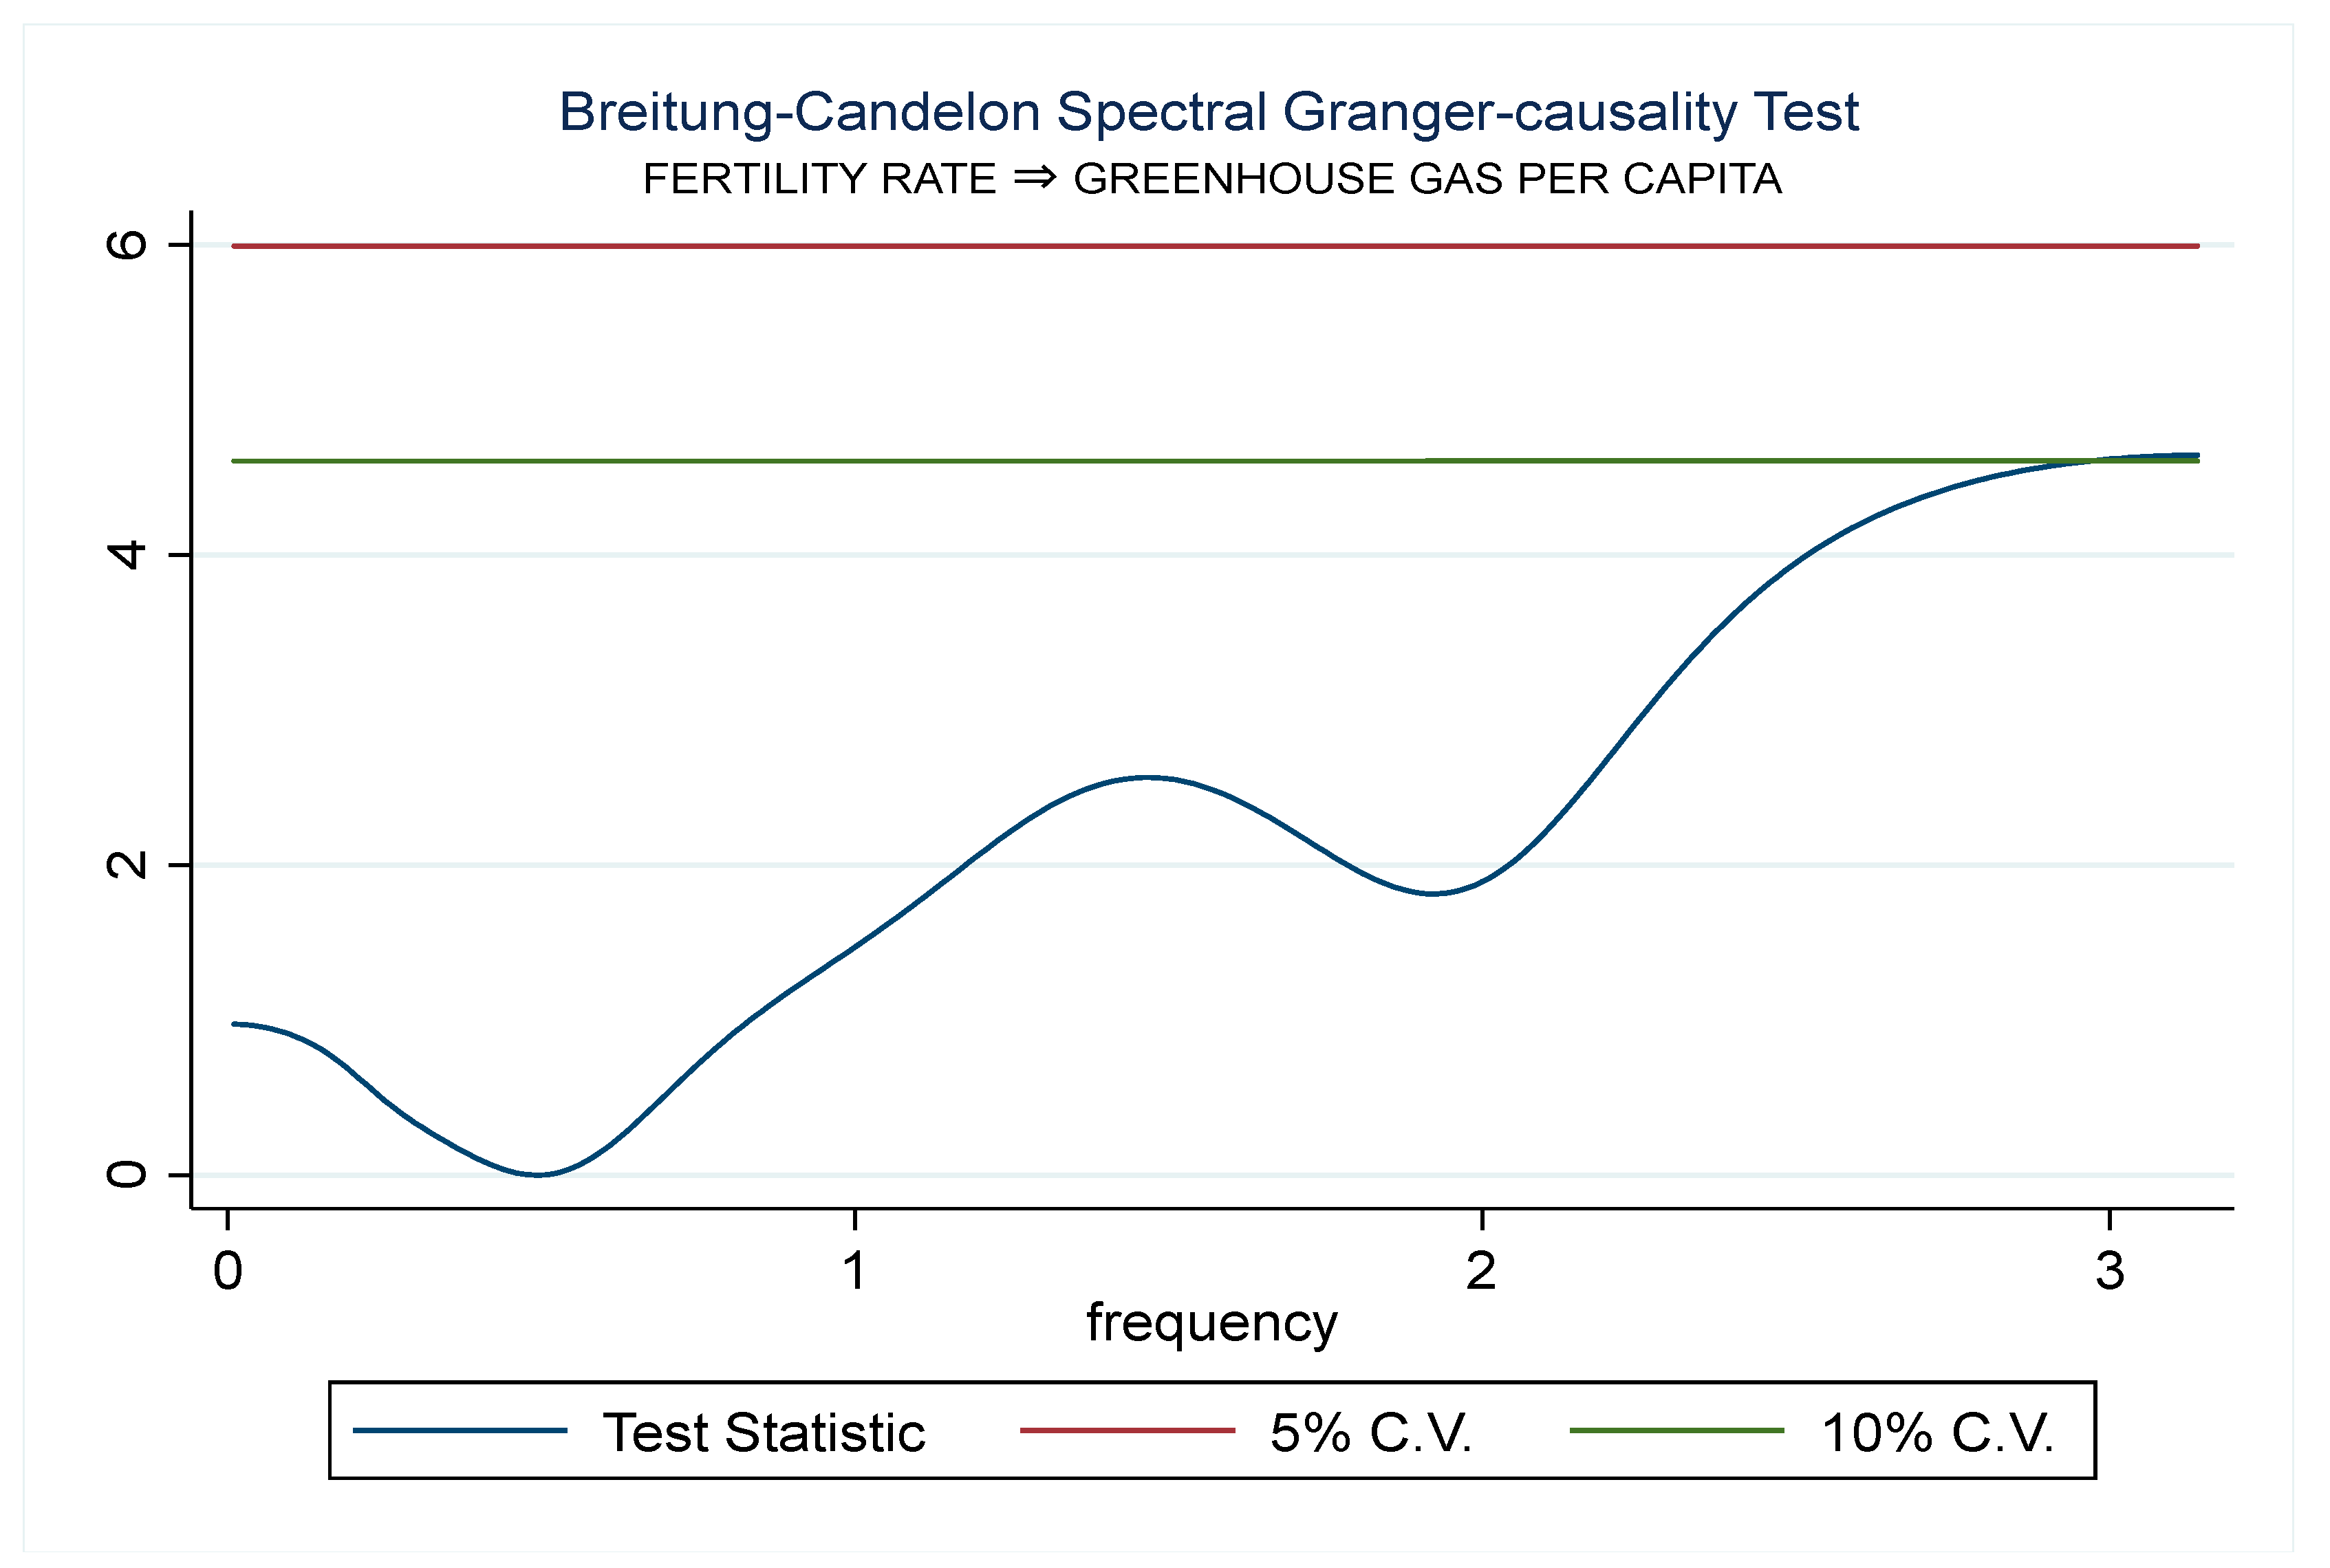
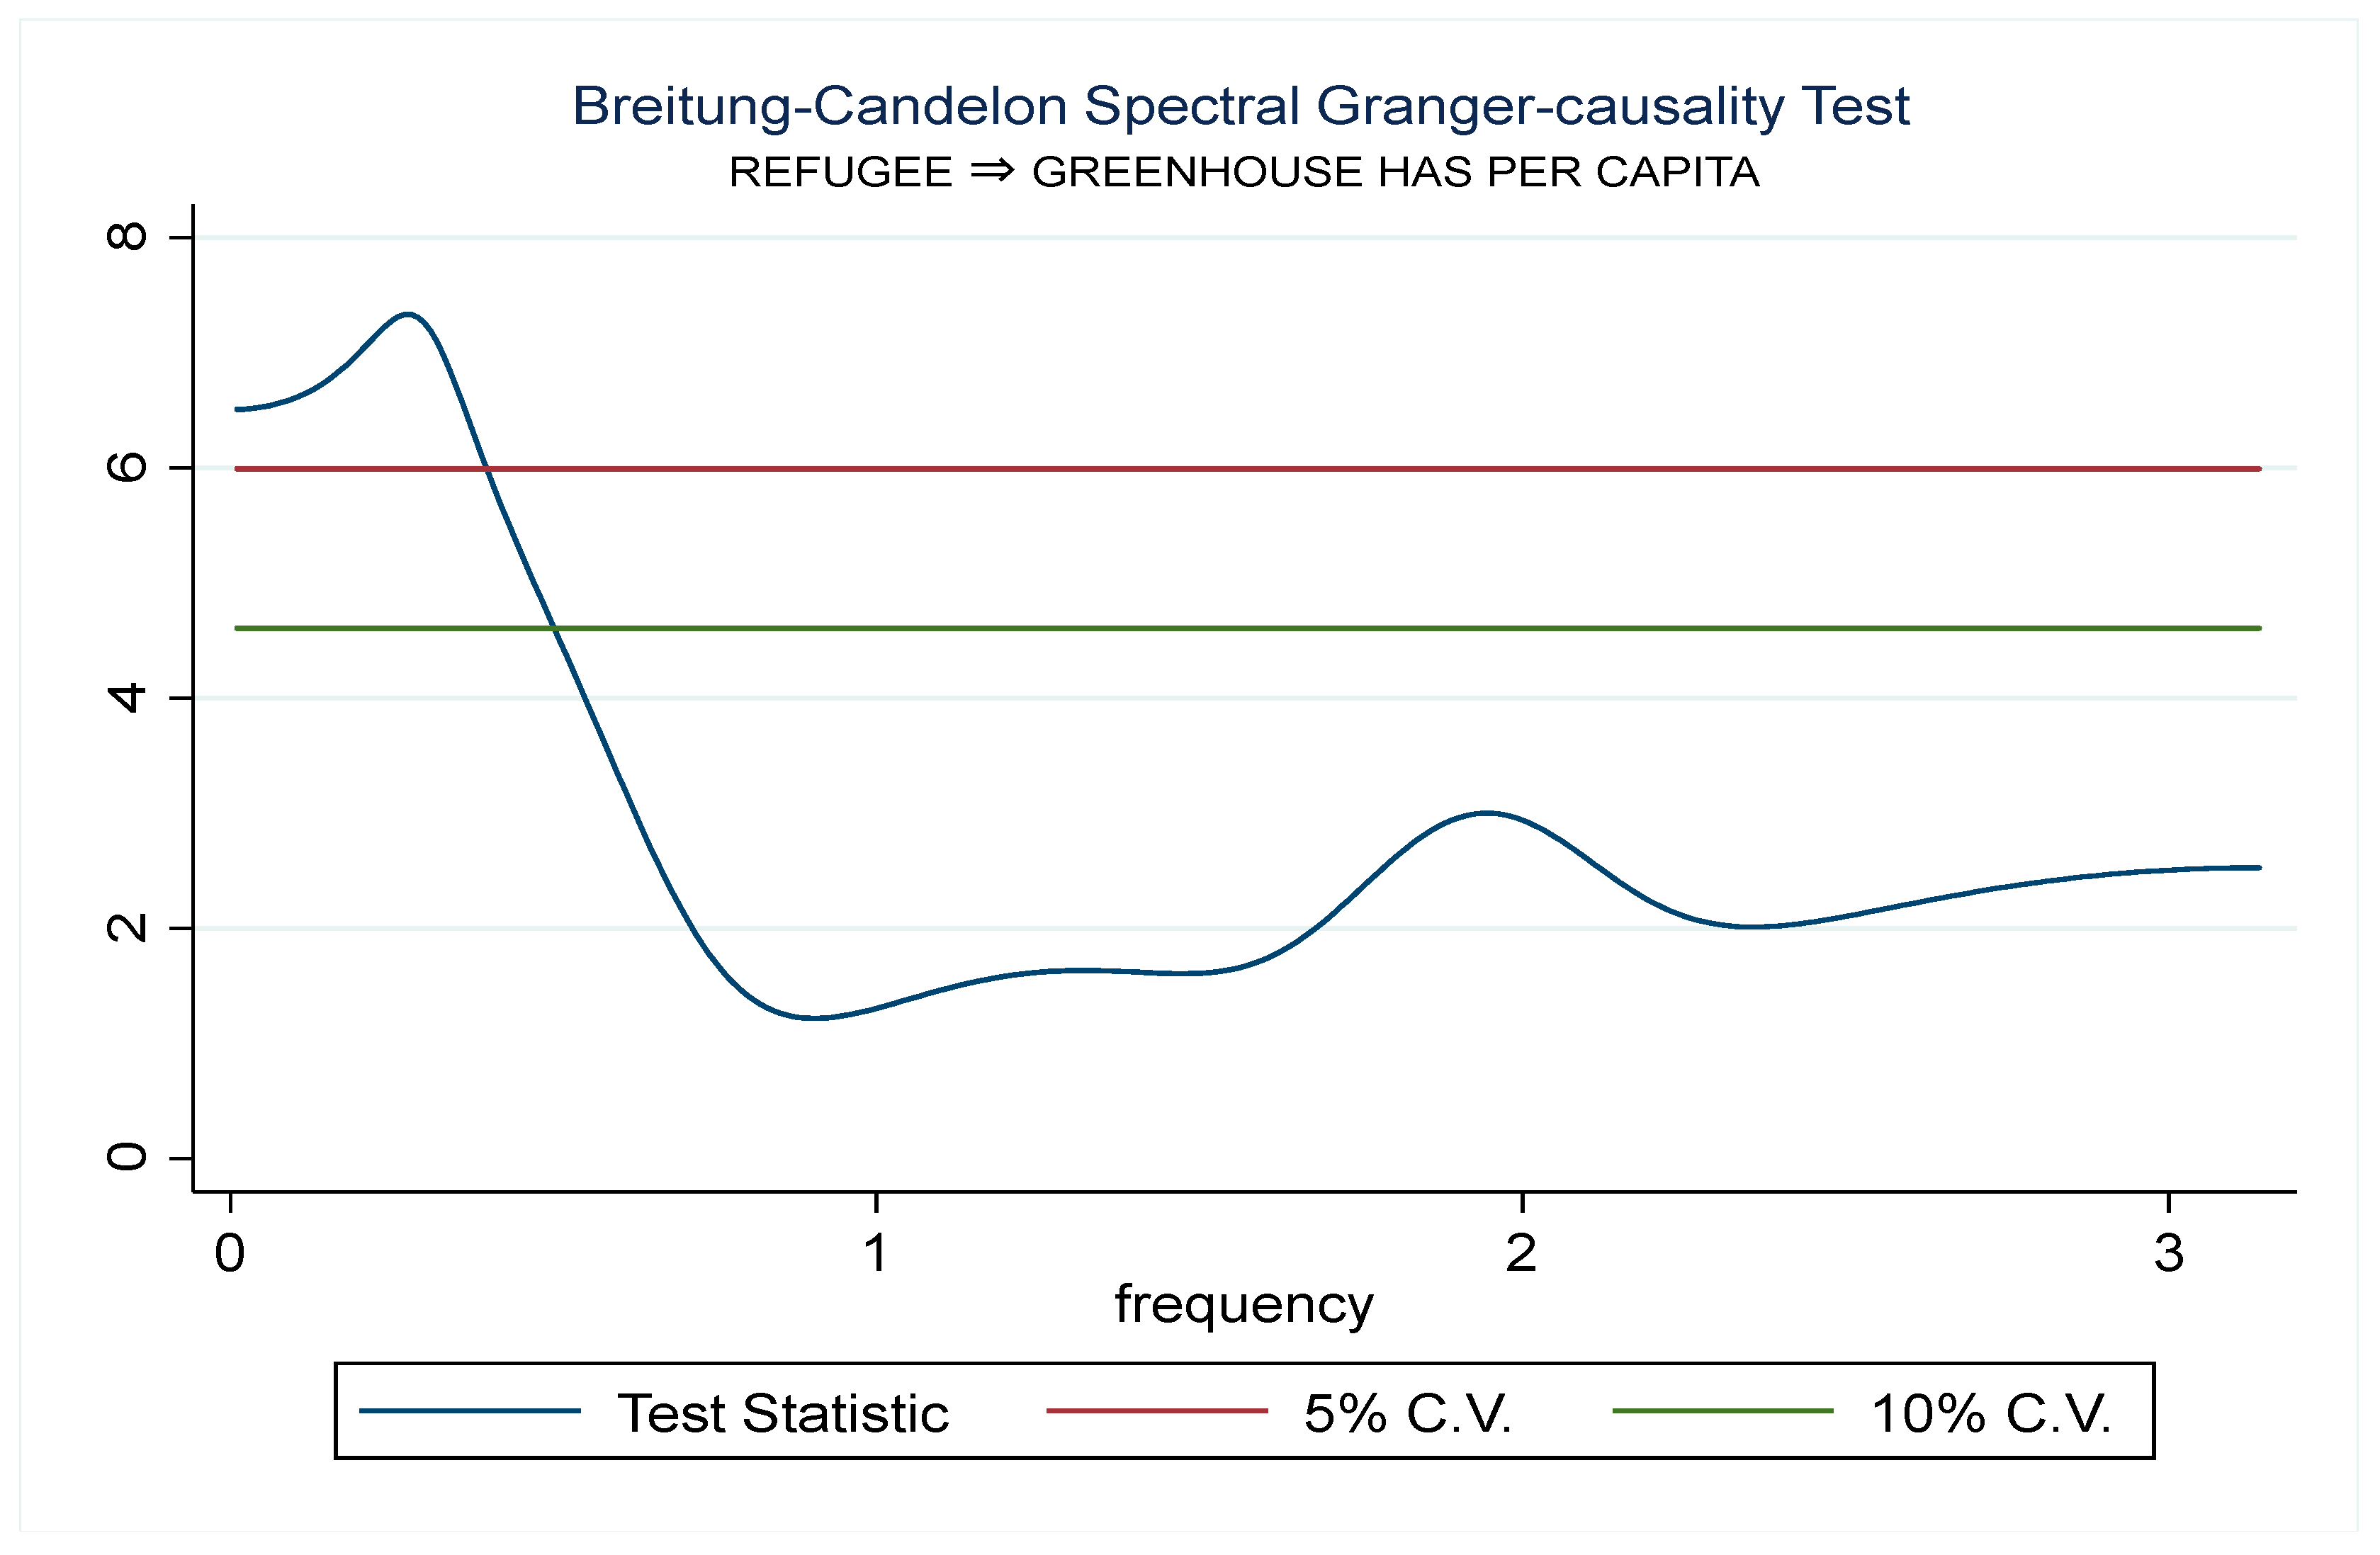
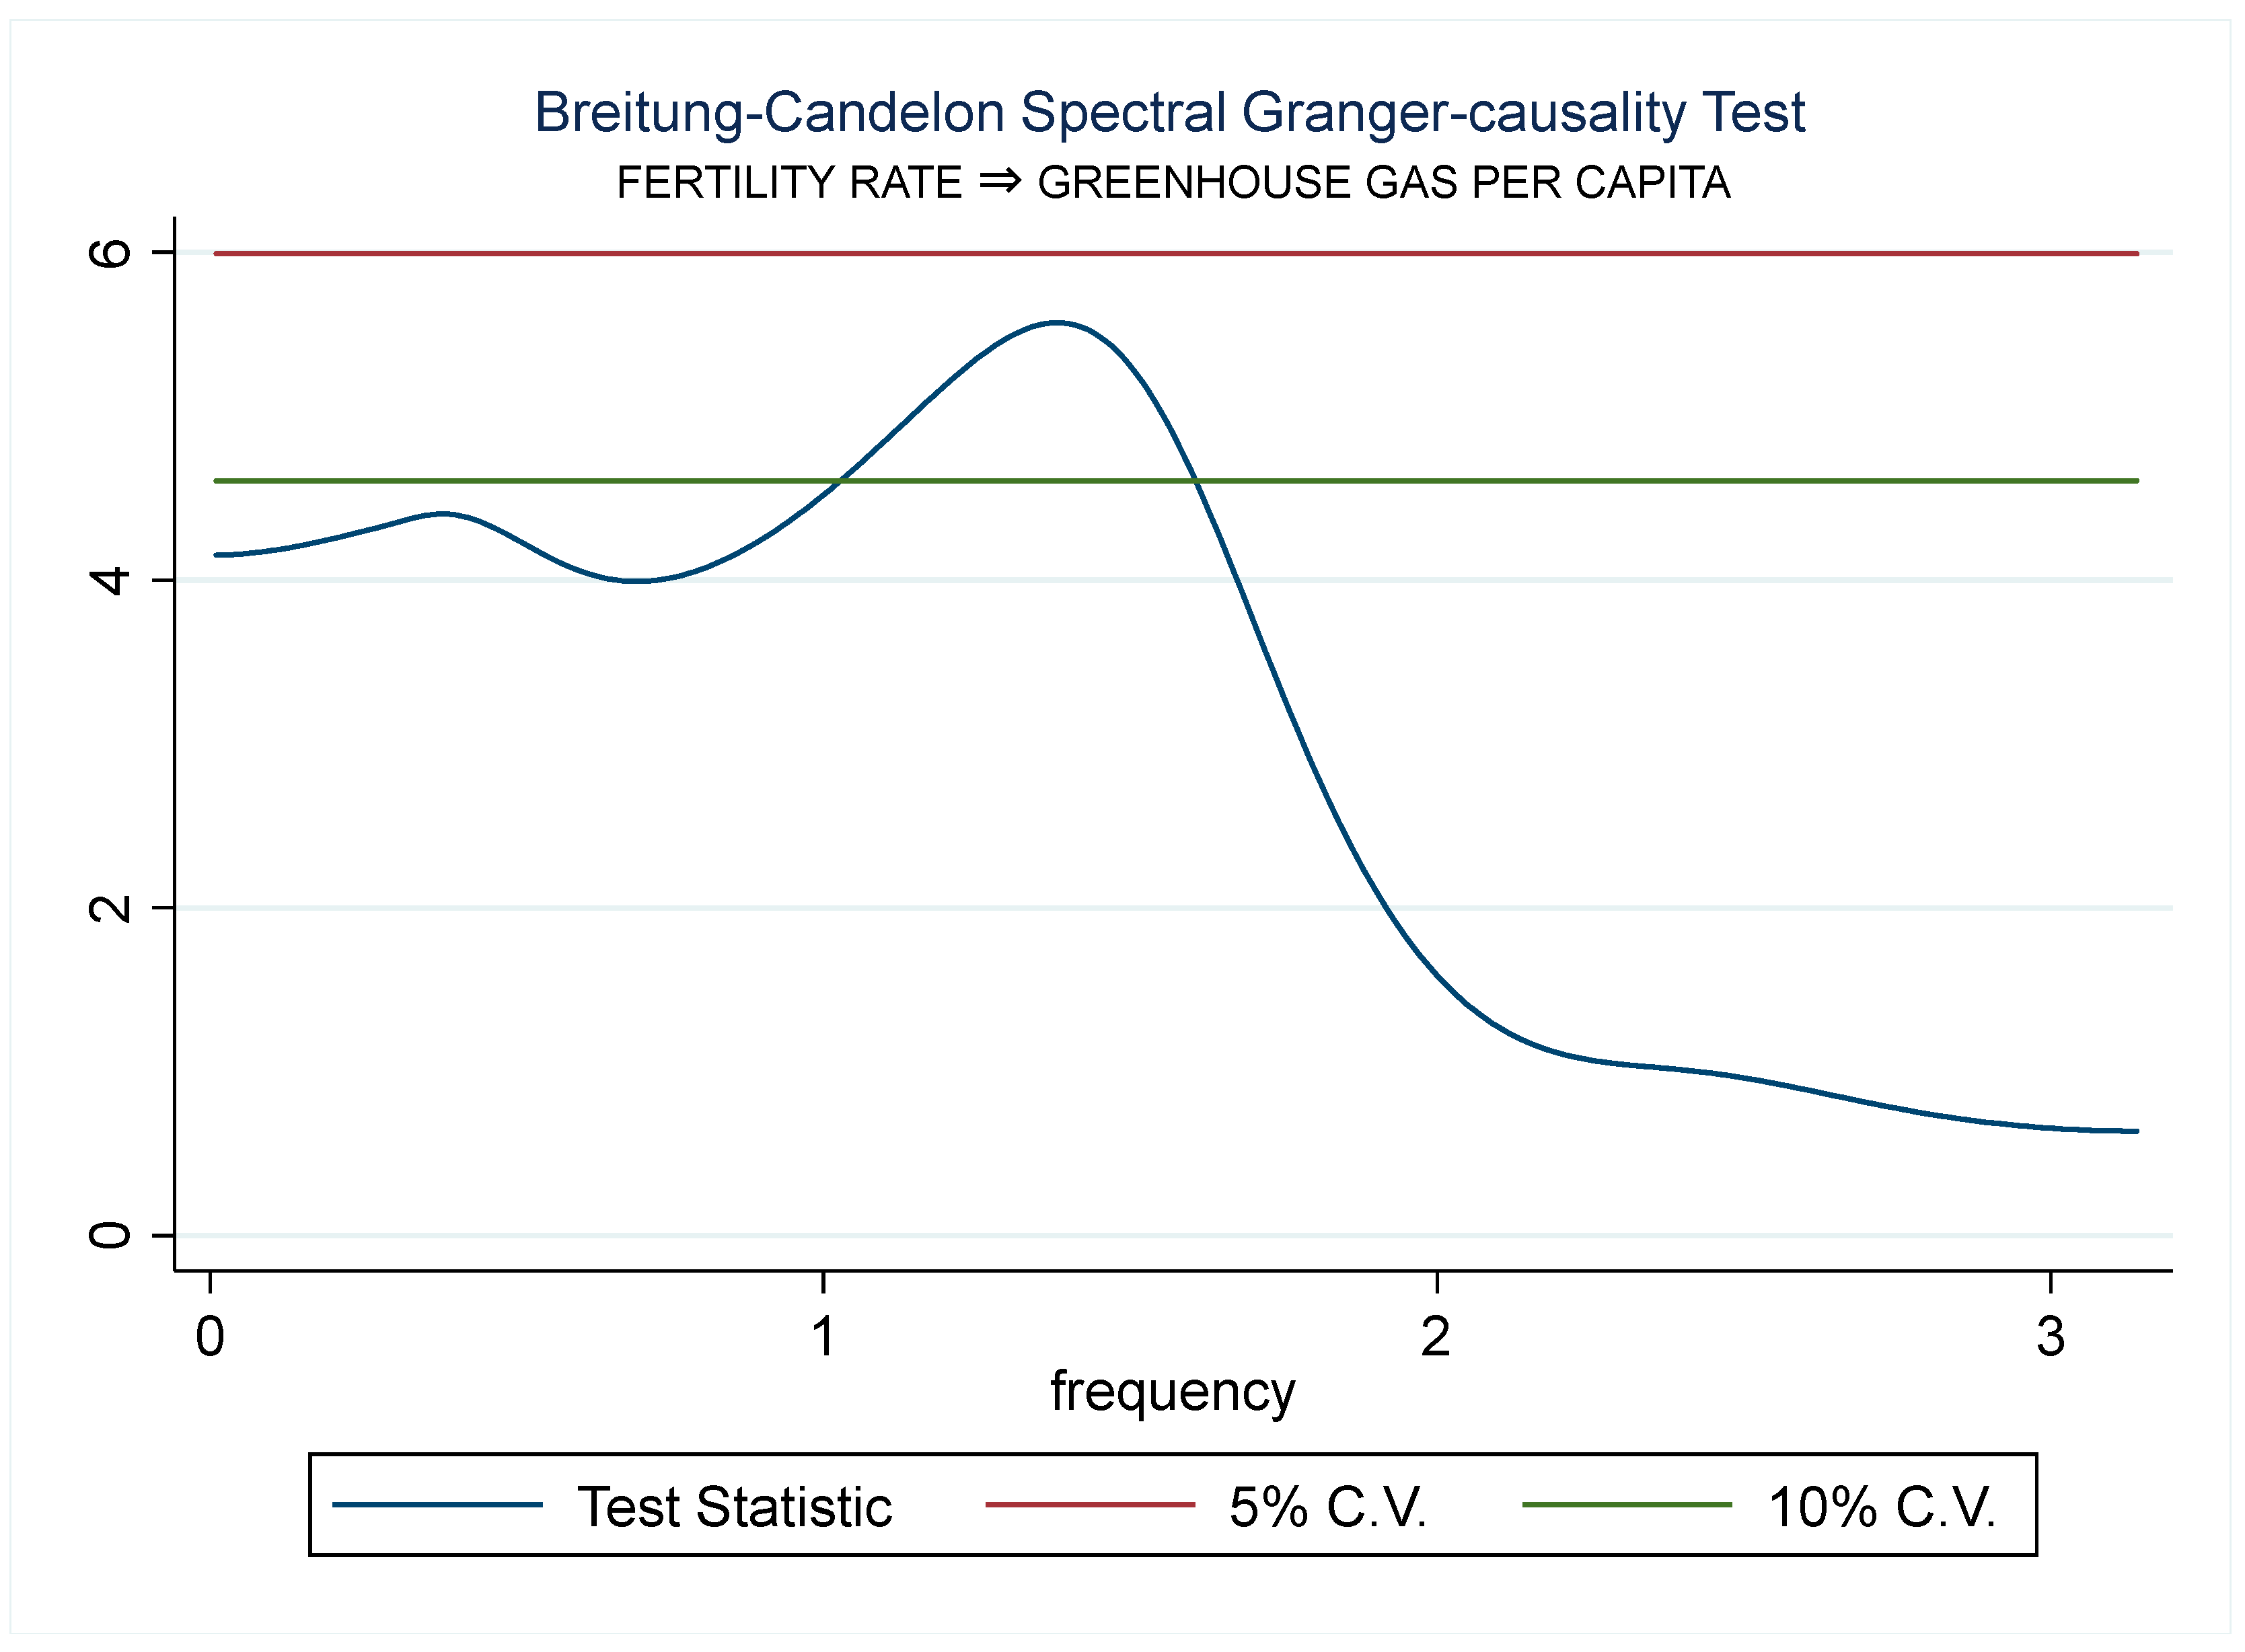
It is crucial to comprehend the differences between the frequency and time domains before constructing frequency-domain causality tests (Breitung and Candelon 2006). According to Pavia et al. (2014), a time-domain graph shows a signal’s evolution, while a frequency-domain graph shows how much of a signal is included inside each frequency band throughout a range of frequencies (Obekpa and Alola 2023; Serfraz 2017). The Breitung–Candelon test can be used to investigate whether a specific component of the “cause” variable at one frequency can be used to predict a component of the “effect” variable at this same frequency one period later. The results of the tests shown in Figure 1, Figure 2, Figure 3 and Figure 4 further support the ARDL results on the impact of refugees and fertility on the greenhouse gases per capita in Table 7 and Table 8.
5. Conclusions and Policy Recommendation
This is a rare comparative study that explores the environmental effect of refugee populations and the fertility rate. Moreover, as part of the novelty of this investigation, the cases of Sweden and Lebanon, which account for the highest refugee populations in Europe and the world, respectively, were considered. By employing the dataset over the period 1990–2021, the effect of the refugee population and fertility rate, and the moderating effect of the refugee population on the nexus between fertility and environmental degradation, were examined. Given the advantages of the autoregressive distributed lag, the country-specific empirical evidence was provided by the bound-test-based ARDL approach.
The result largely reveals that, as regarding a per head basis, the income growth in Sweden mitigates GHG emissions, even as the estimation validates the EKC hypothesis, especially in the long run. Contrarily, the EKC hypothesis in Lebanon is not valid. This implies that the income per capita increases the surge in GHG emissions per capita in Lebanon. The result further uncovers that the GHG per capita emissions in both countries are exacerbated by the increase in fertility rates in the long run. However, the increases in the refugee populations in Sweden and Lebanon have mitigating and exacerbating effects on GHG emissions, respectively. In both countries, the inflow of refugees further worsens the impact of the fertility rate on GHG emissions, thus causing more environmental woes.
Meanwhile, natural resource abundance causes environmental merit and demerit in Sweden and Lebanon, respectively. Although environmental policies have not been a primary issue in Lebanon for long, unlike Sweden, which ranks number 1 in the Sustainable Governance Indicator (SGI) 2022’s top position in the area of environmental policy, this study could provide more useful and policy-based revelations if country-specific socioeconomic factors/dimensions, such as demographics and behavioral factors, are considered. While future studies could focus on improving this line of weakness, the current results are not without significant policy insight.
Policy Recommendation
Given the desirable impact of the refugee population on GHG emissions in Sweden, the country’s problem of an ageing population could be partly solved by the inflow of a sizeable number of refugees. Although the country’s fertility rate induces GHG emissions, the refugee population’s desirable environmental role could provide an antidote for the ageing population’s challenges and environmental degradation. This is not to dismiss the existence of a potential threshold in the nexus of the refugee population and GHG emissions (i.e., the existence of the environmental desirability of the refugee population until a certain threshold, after which the refugee population would begin to inflict environmental damage). Given this insight, Sweden could further improve its refugee integration program, including training refugees in green vocational skills and providing education on environmentally friendly behaviors. On the part of Lebanon, there should be more international interventions to reduce the inflow of refugees to the country, as well as the provision of the necessary aid and relevant, green-based economic training for refugees.
Author Contributions
A.A.A.: Investigation, discussion, conclusion, writing and editing; A.A.: Worked on the literature section; H.O.O.: Investigation and writing; I.O.: Writing of the introduction section. All authors have read and agreed to the published version of the manuscript.
Funding
This research received no external funding.
Institutional Review Board Statement
Not applicable.
Informed Consent Statement
Not applicable.
Conflicts of Interest
The authors declare no conflict of interest.
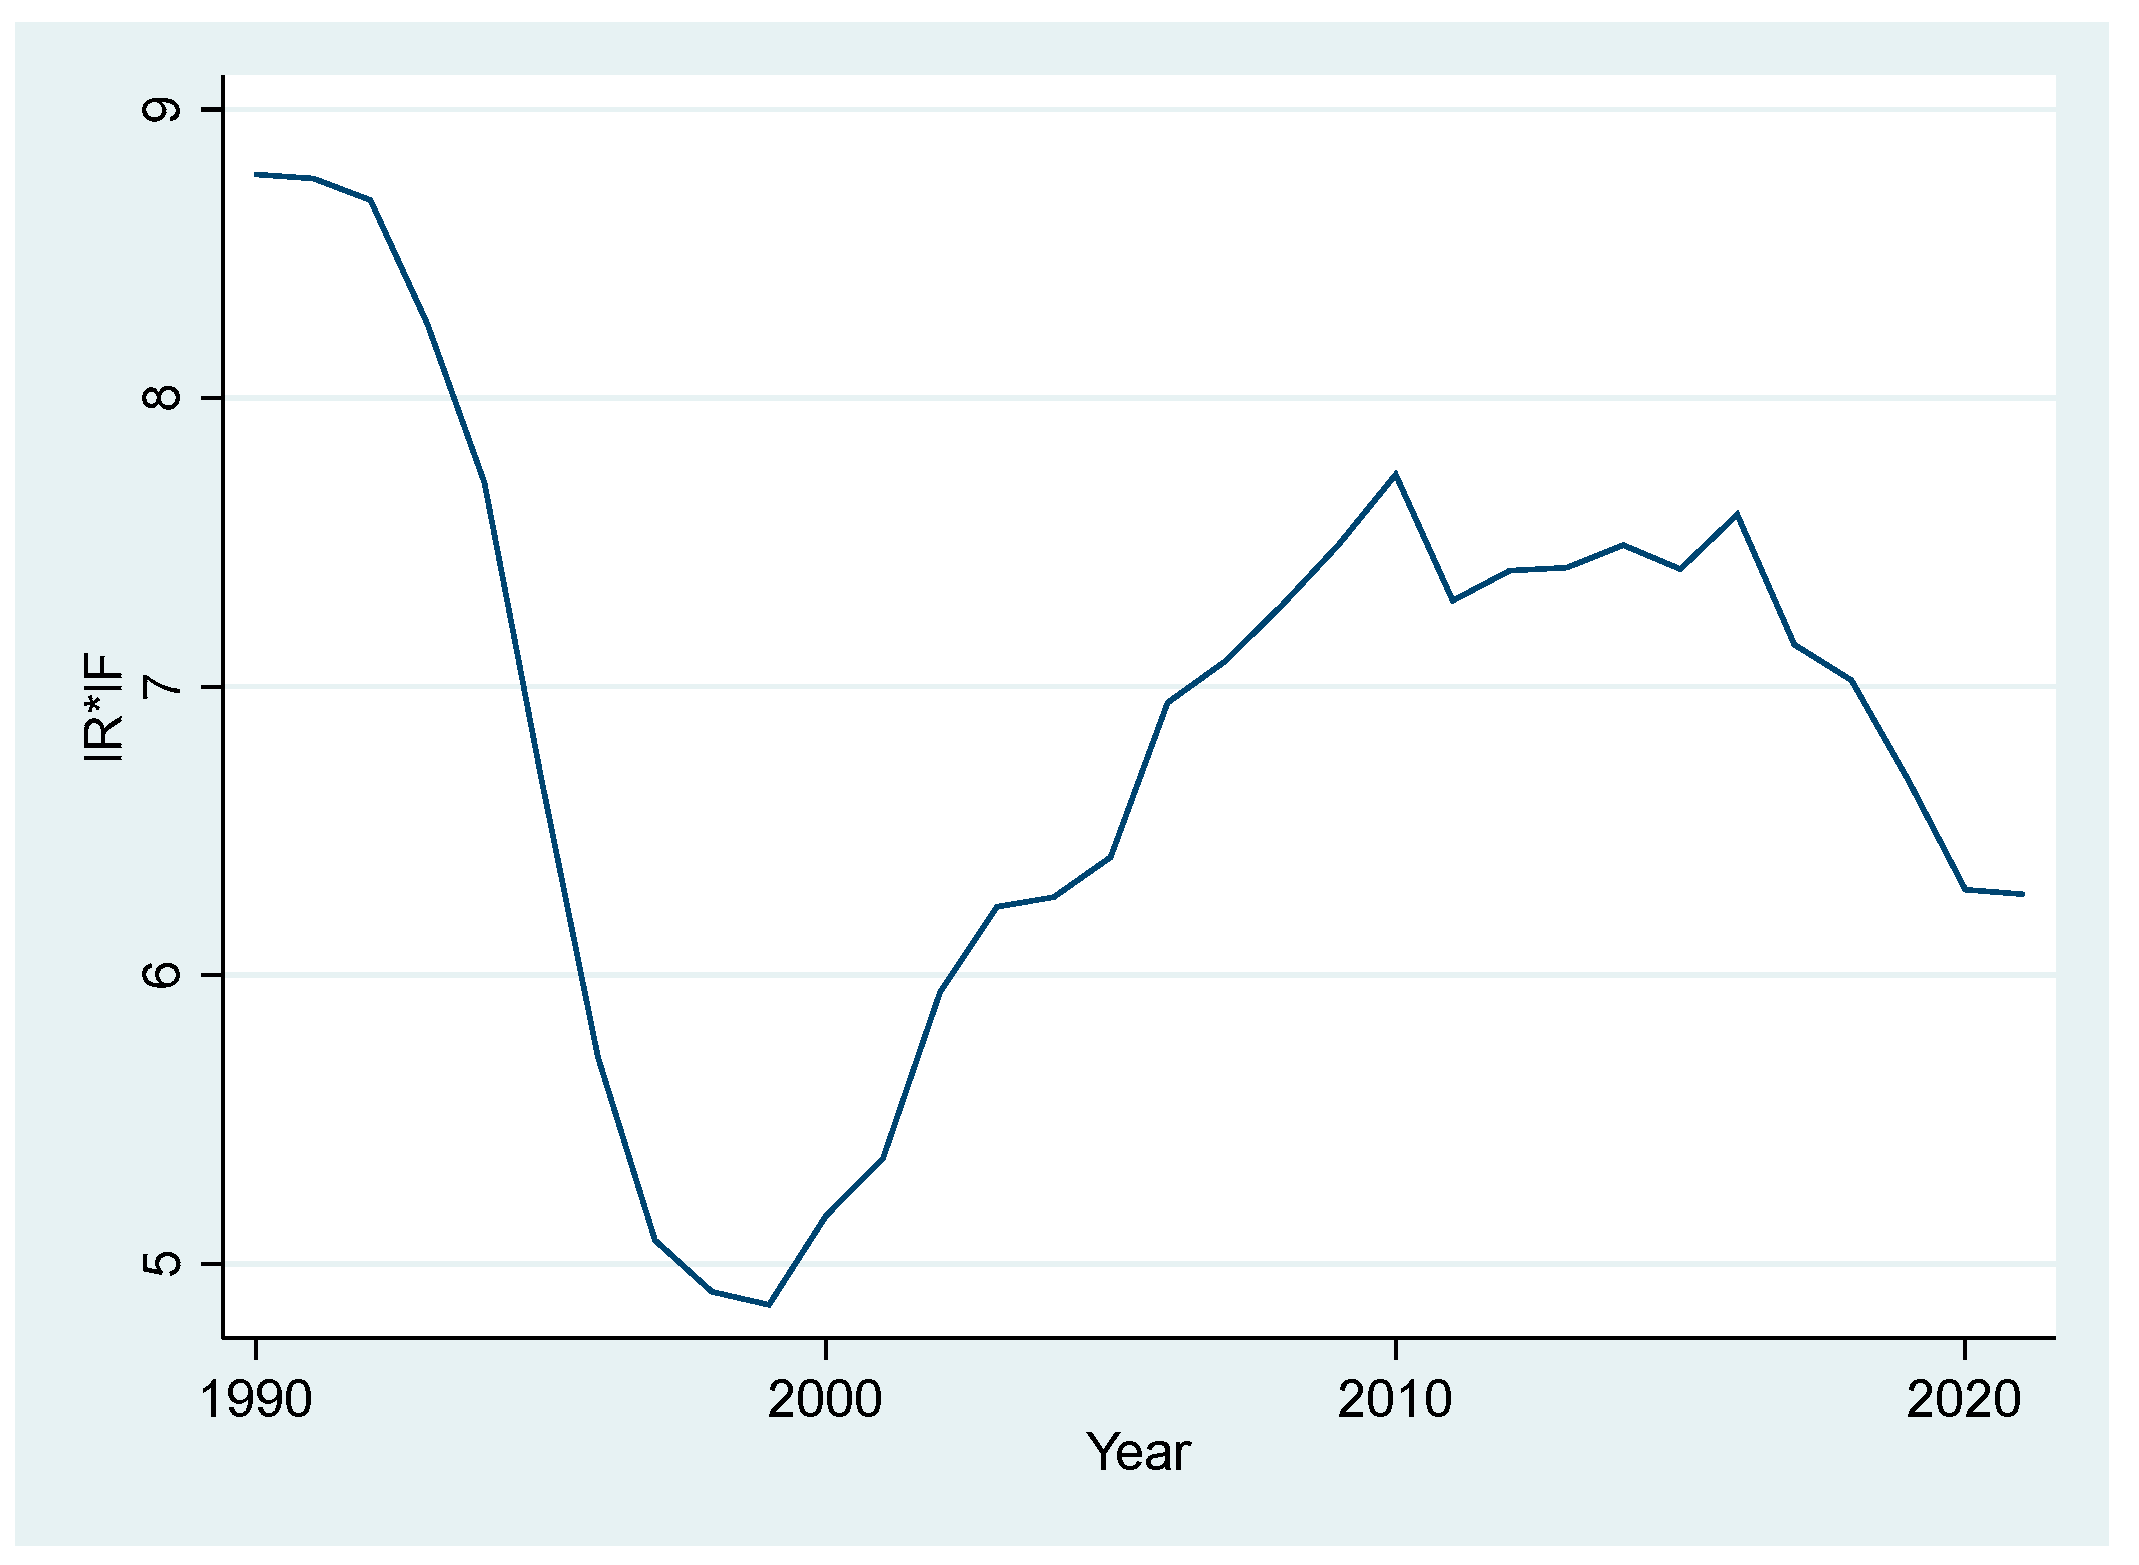
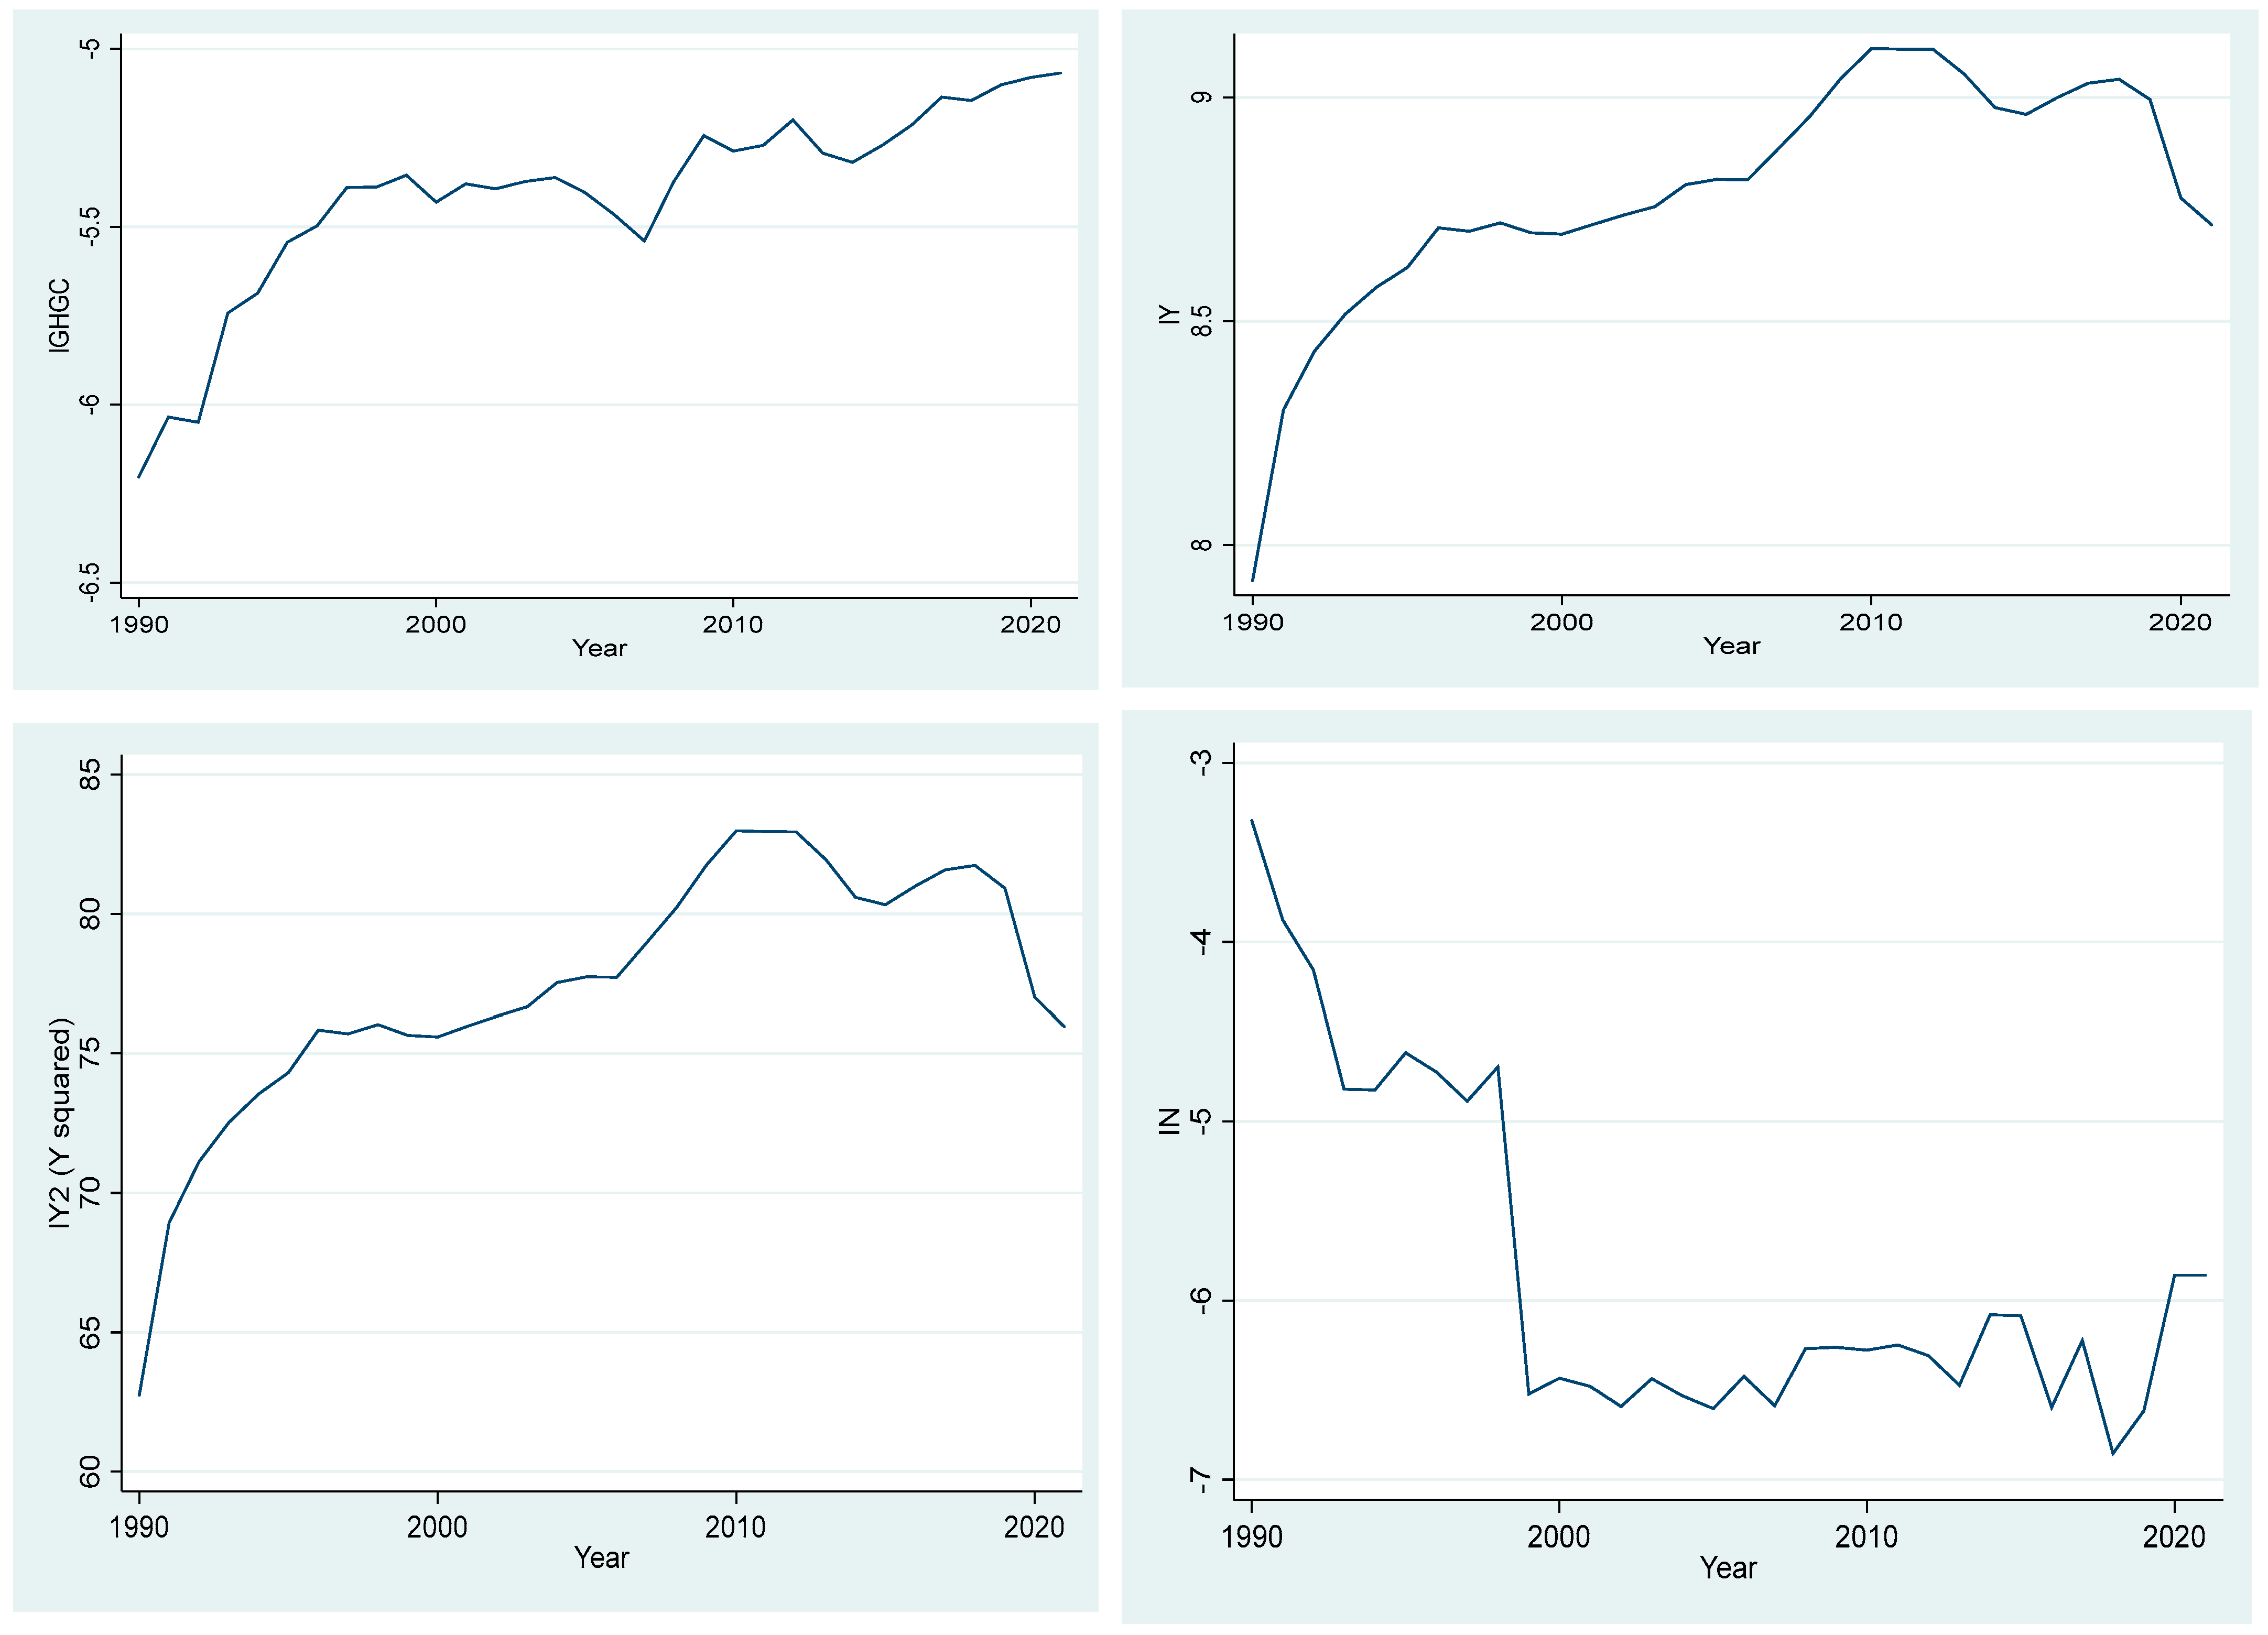
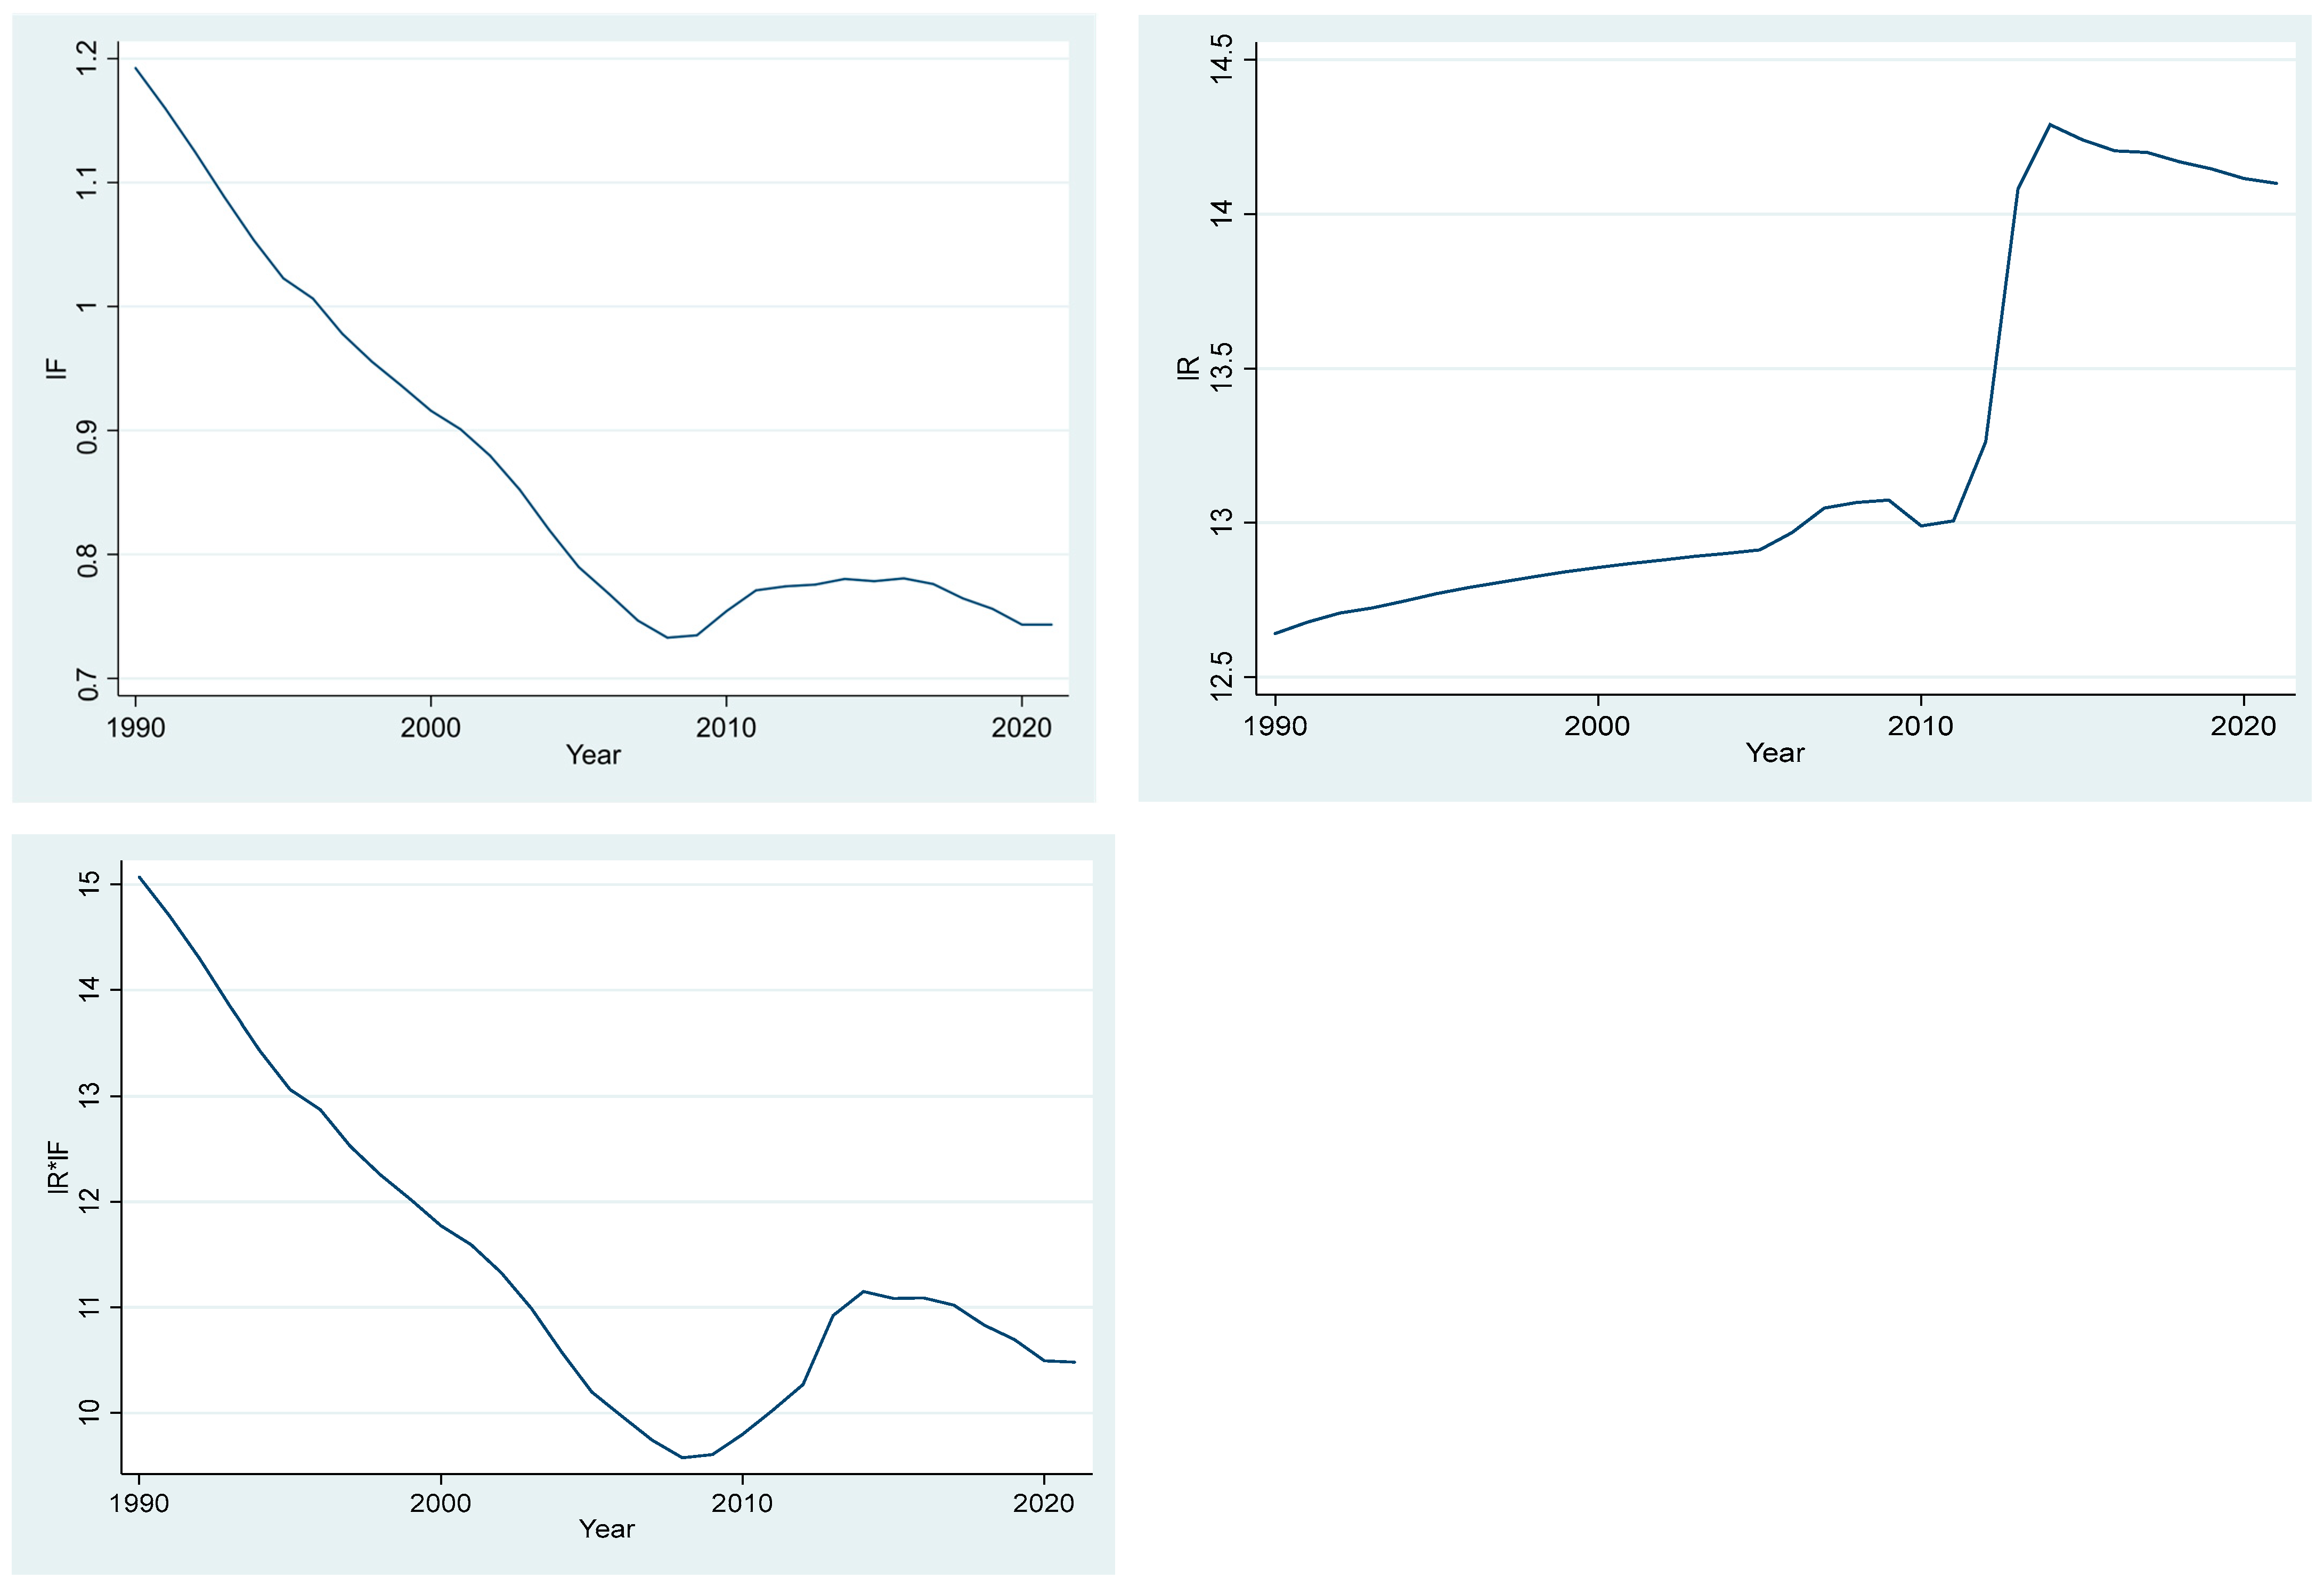
Appendix A
Figure A1.
Time trend of variables for Sweden.


Figure A2.
Time trend of variables for Lebanon.


| 1 | According to the World Bank, the 1951 Convention Relating to the Status of its 1967 Protocol, and the 1969 Organization of African Unity Convention Governing the Specific Aspects of Refugee Problems in Africa, people recognized as refugees in accordance with the UNHCR statute, people granted refugee-like humanitarian status, and people provided temporary protection. Asylum seekers—people who have applied for asylum or refugee status and who have not yet received a decision, or who are registered as asylum seekers—are excluded. Palestinian refugees are people (and their descendants) whose residence was Palestine between June 1946 and May 1948, and who lost their homes and means of livelihood because of the 1948 Arab–Israeli conflict. |
References
- Abdulrahim, Sawsan, Jocelyn DeJong, Rima Mourtada, and Huda Zurayk. 2017. Estimates of Early Marriage Among Syrian Refugees in Lebanon in 2016 Compared to Syria Pre-2011. European Journal of Public Health 27: 322–23. [Google Scholar] [CrossRef]
- Al Akash, Ruba, and Morgen A. Chalmiers. 2021. Early Marriage Among Syrian Refugees in Jordan: Exploring Contested Meanings through Ethnography. Sex Reprod Health Matters 29: 1–16. [Google Scholar] [CrossRef] [PubMed]
- Alola, Andrew A., Abdugaffar Olawale Arikewuyo, Bahire Ozad, Uju Violet Alola, and Halima Oluwaseyi Arikewuyo. 2020. A drain or drench on biocapacity? Environmental account of fertility, marriage, and ICT in the USA and Canada. Environmental Science and Pollution Research 27: 4032–43. [Google Scholar] [CrossRef] [PubMed]
- Alola, Andrew Adewale, Festus Victor Bekun, and Samuel Asumadu Sarkodie. 2019a. Dynamic impact of trade policy, economic growth, fertility rate, renewable and non-renewable energy consumption on ecological footprint in Europe. Science of The Total Environment 685: 702–09. [Google Scholar] [CrossRef] [PubMed]
- Alola, Andrew Adewale, Kürşat Yalçiner, Uju Violet Alola, and Seyi Saint Akadiri. 2019b. The role of renewable energy, immigration and real income in environmental sustainability target. Evidence from Europe largest states. Science of The Total Environment 674: 307–15. [Google Scholar] [CrossRef]
- Alola, Andrew Alola, and Uju Violet Alola. 2018. The Dynamics of Tourism—Refugeeism on House Prices in Cyprus and Malta. Journal of International Migration and Integration 20: 1–16. [Google Scholar] [CrossRef]
- Amiri, Mirwais, Ieman M. El-Mowafi, Tala Chahien, Hind Yousef, and Loulou Hassan Kobeissi. 2020. An Overview of the Sexual and Reproductive Health Status and Service Delivery Among Syrian Refugees in Jordan, Nine Years since the Crisis: A Systematic Literature Review. Reproductive Health 17: 166. [Google Scholar] [CrossRef]
- Aydin, Mucahit, and Oguzhan Bozatli. 2023. The impacts of the refugee population, renewable energy consumption, carbon emissions, and economic growth on health expenditure in Turkey: New evidence from Fourier-based analyses. Environmental Science and Pollution Research 30: 41286–298. [Google Scholar] [CrossRef]
- Aye, Goodness C., and Prosper Ebruvwiyo Edoja. 2017. Effect of economic growth on CO2 emission in developing countries: Evidence from a dynamic panel threshold model. Cogent Economics & Finance 5: 1379239. [Google Scholar] [CrossRef]
- Baloch, Muhammad Awais, Nasir Mahmood, and Jian Wu Zhang. 2019. Effect of natural resources, renewable energy and economic development on CO2 emissions in BRICS countries. Science of the Total Environment 678: 632–38. [Google Scholar]
- Balsalobre-Lorente, Daniel, Muhammad Shahbaz, David Roubaud, and Sahbi Farhani. 2018. How economic growth, renewable electricity and natural resources contribute to CO2 emissions? Energy Policy 113: 356–67. [Google Scholar] [CrossRef]
- Bildirici, Melike. 2022. Refugees, governance, and sustainable environment: PQARDL method. Environmental Science and Pollution Research 29: 39295–309. [Google Scholar] [CrossRef] [PubMed]
- Bozdag, Ilgi, Celio Sierra-Paycha, and Armelle Andro. 2022. Humanitarian Assistance and Fertility Decisions: To What Extent Emergency Social Safety Net (ESSN) Targeting Criteria Had Influenced the Fertility Rates and Fertility Calendar of Syrian Refugees in Turkey. Ankara: World Food Programme. [Google Scholar]
- Brauner-Otto, Sarah R. 2014. Environmental quality and fertility: The effects of plant density, species richness, and plant diversity on fertility limitation. Population and Environment 36: 1–31. [Google Scholar] [CrossRef] [PubMed]
- Breitung, Jörg, and Bertrand Candelon. 2006. Testing for short- and long-run causality: A frequency-domain approach. Journal of Econometrics 132: 363–78. [Google Scholar] [CrossRef]
- Bu, Yan, Erda Wang, Dominik Möst, and Martin Lieberwirth. 2022. How population migration affects carbon emissions in China: Factual and counterfactual scenario analysis. Technological Forecasting and Social Change 184: 122023. [Google Scholar] [CrossRef]
- Charfeddine, Lanouar, and Zouhair Mrabet. 2017. The impact of economic development and social-political factors on ecological footprint: A panel data analysis for 15 MENA countries. Renewable and Sustainable Energy Reviews 76: 138–54. [Google Scholar] [CrossRef]
- Dickey, David A., and Wayne A. Fuller. 1979. Distribution of the estimators for autoregressive time series with a unit root. Journal of the American Statistical Association 74: 427–31. [Google Scholar]
- Fajth, Veronika, Özge Bilgili, Craig Loschmann, and Melissa Siegel. 2019. How do refugees affect social life in host communities? The case of Congolese refugees in Rwanda. Comparative Migration Studies 7: 1–21. [Google Scholar] [CrossRef]
- Fallah, Belal, Caroline Krafft, and Jackline Wahba. 2019. The impact of refugees on employment and wages in Jordan. Journal of Development Economics 139: 203–16. [Google Scholar] [CrossRef]
- Golbasi, Ceren, Tayfun Vural, Burak Bayraktar, Hakan Golbasi, and Alkim Gulsah Sahingoz Yildirim. 2022. Maternal and Neonatal Outcomes of Syrian Adolescent Refugees and Local Adolescent Turkish Citizens: A Comparative Study at a Tertiary Care Maternity Hospital in Turkey. Gynecology Obstetrics & Reproductive Medicine 28: 135–43. [Google Scholar] [CrossRef]
- Grossman, Gene M., and Alan B. Krueger. 1991. Environmental Impacts of a North American Free Trade Agreement. Cambridge, MA: National Bureau of Economic Research. [Google Scholar]
- Kar, Ashim Kumar. 2022. Environmental Kuznets curve for CO2 emissions in Baltic countries: An empirical investigation. Environmental Science and Pollution Research 29: 47189–208. [Google Scholar] [CrossRef] [PubMed]
- Kim, Jaehyeok, Hyungwoo Lim, and Ha-Hyun Jo. 2020. Do Aging and Low Fertility Reduce Carbon Emissions in Korea? Evidence from IPAT Augmented EKC Analysis. International Journal of Environmental Research and Public Health 17: 2972. [Google Scholar] [CrossRef] [PubMed]
- Korri, Rayan, Sabine Hess, Guenter Froeschl, and Olena Ivanova. 2021. Sexual and Reproductive Health of Syrian Refugee Adolescent Girls: A Qualitative Study Using Focus Group Discussions in an Urban Setting in Lebanon. Reproductive Health 18: 130. [Google Scholar] [CrossRef] [PubMed]
- Kulu, Hill. 2005. Migration and Fertility: Competing Hypotheses Re-examined. European Journal of Population 21: 51–87. [Google Scholar] [CrossRef]
- Kurt, Gulsah, İbrahim Hakkı Acar, Zeynep Ilkkursun, Taylan Yurtbakan, Busra Acar, Ersin Uygun, and Ceren Acarturk. 2021. Traumatic Experiences, Acculturation, and Psychological Distress Among Syrian Refugees in Turkey: The Mediating Role of Coping Strategies. International Journal of Intercultural Relations 81: 214–25. [Google Scholar] [CrossRef]
- Kuznets, Simon. 1955. Economic growth and income inequality. In The Gap between Rich and Poor. London: Routledge, pp. 25–37. [Google Scholar]
- Mahmalat, Mounir. 2018. Growth without Development: The Role of Lebanon’s Legislative Agenda. Houston: Rice University’s Baker Institute for Public Policy, Issue brief no. 10.10.18. [Google Scholar]
- Norwegian Refugee Council. 2022. These 10 Countries Receive the Most Refugees. Available online: https://www.nrc.no/perspectives/2020/the-10-countries-that-receive-the-most-refugees/ (accessed on 20 February 2023).
- Obekpa, Hephzibah Onyeje, and Andrew Adewale Alola. 2023. Asymmetric response of energy efficiency to research and development spending in renewables and nuclear energy usage in the United States. Progress in Nuclear Energy 156: 104522. [Google Scholar] [CrossRef]
- Onifade, Stephen Taiwo, Andrew Adewale Alola, Savaş Erdoğan, and Hakan Acet. 2021. Environmental aspect of energy transition and urbanization in the OPEC member states. Environmental Science and Pollution Research 28: 17158–169. [Google Scholar] [CrossRef]
- Pavia, Donald L., Gary M. Lampman, George S. Kriz, and James A. Vyvyan. 2014. Introduction to Spectroscopy. Boston: Cengage Learning. [Google Scholar]
- Pesaran, M. Hashem, Yongcheol Shin, and Richard J. Smith. 2001. Bounds testing approaches to the analysis of level relationships. Journal of Applied Econometrics 16: 289–326. [Google Scholar] [CrossRef]
- Phillips, Peter C. B., and Pierre Perron. 1988. Testing for a unit root in time series regression. Biometrika 75: 335–46. [Google Scholar] [CrossRef]
- Ruiz, Isabel, and Carlos Vargas-Silva. 2016. The labour market consequences of hosting refugees. Journal of Economic Geography 16: 667–94. [Google Scholar] [CrossRef]
- Sarkodie, Samuel Asumadu, and Samuel Adams. 2018. Renewable energy, nuclear energy, and environmental pollution: Accounting for political institutional quality in South Africa. Science of the Total Environment 643: 1590–601. [Google Scholar] [CrossRef] [PubMed]
- Serfraz, Ayesha. 2017. Analyzing Short-Run and Long-Run Causality between FDI Inflows, Labor Productivity and Education in Pakistan. Asian Journal of Economics and Empirical Research 5: 36–59. [Google Scholar] [CrossRef]
- Simon, Daniel H. 2017. Exploring the influence of precipitation on fertility timing in rural Mexico. Population and Environment 38: 407–23. [Google Scholar] [CrossRef]
- Squalli, Jay. 2021. Disentangling the relationship between immigration and environmental emissions. Population and Environment 43: 1–21. [Google Scholar] [CrossRef]
- Stephenson, Judith, Karen Newman, and Susannah Mayhew. 2010. Population dynamics and climate change: What are the links? Journal of Public Health 32: 150–56. [Google Scholar] [CrossRef] [PubMed]
- Subramaniam, Yogeeswari, Tajul Ariffin Masron, and Nanthakumar Loganathan. 2023. The impacts of migrants on environmental degradation in developing countries. Environmental and Ecological Statistics 30: 17–40. [Google Scholar] [CrossRef]
- Tanrıkulu, Faik. 2021. The political economy of migration and integration: Effects of immigrants on the economy in Turkey. Journal of Immigrant & Refugee Studies 19: 364–77. [Google Scholar]
- Tufail, Muhammad, Lin Song, Tomiwa Sunday Adebayo, Dervis Kirikkaleli, and Suliman Khan. 2021. Do fiscal decentralization and natural resources rent curb carbon emissions? Evidence from developed countries. Environmental Science and Pollution Research 28: 49179–90. [Google Scholar] [CrossRef]
- UNHCR. 2019. UNHCR Turkey-Fact Sheet. Available online: https://www.relief.reliefwebint/report/turkey/unhcr-turkey-fact-sheet-july-2019 (accessed on 10 February 2023).
- United Nations Environment Programme. 2021. Emissions Gap Report 2021: The Heat Is on—A World of Climate Promises Not Yet Delivered Nairobi. Nairobi: United Nations Environment Programme. [Google Scholar]
- Urban, Frauke, and Johan Nordensvärd. 2018. Low Carbon Energy Transitions in the Nordic Countries: Evidence from the Environmental Kuznets Curve. Energies 11: 2209. [Google Scholar] [CrossRef]
- World Bank. 2011. Lebanon: Country Environmental Analysis 2011. Available online: https://openknowledge.worldbank.org/entities/publication/0e7fd98e-cebc-524c-b328-37181c0d0686 (accessed on 1 April 2023).
- York, Richard, Eugene A. Rosa, and Thomas Dietz. 2003. STIRPAT, IPAT and ImPACT: Analytic tools for unpacking the driving forces of environmental impacts. Ecological Economics 46: 351–65. [Google Scholar] [CrossRef]
- Zhang, Chuanguo, and Zheng Tan. 2016. The relationships between population factors and China’s carbon emissions: Does population aging matter? Renewable and Sustainable Energy Reviews 65: 1018–25. [Google Scholar] [CrossRef]
Figure 1.
Evidence of causality from refugee to GHG per capita emissions in Lebanon.

Figure 2.
Evidence of causality from fertility rate to GHG per capita emissions in Lebanon.

Figure 3.
Evidence of causality from refugee to GHG per capita emissions in Sweden.

Figure 4.
Evidence of causality from fertility rate to GHG per capita emissions in Sweden.


Table 1.
Summary of related studies on refugee aspects and environmental quality nexus.
| Study | Period | Country | Key Variables | Method | Findings |
|---|---|---|---|---|---|
| Bildirici (2022) | From 1996 to 2019 | Bangladesh, Ethiopia, Jordan, Lebanon, Pakistan, Sudan, and Uganda | Greenhouse gas (GHG) emissions, deforestation, and refugee populations | Panel quantile autoregressive distributed lag (PQARDL) | Refugee population causes a decline in forest area and an increase in greenhouse gas emissions. |
| Aydin and Bozatli (2023) | From 1979 to 2019 | Turkey | Effects of refugee population, renewable energy consumption, carbon emissions, and economic growth on health expenditure | Fourier analysis | Air pollution increases health expenditures. Refugee population is an important determinant of health expenditures. |
| Subramaniam et al. (2023) | From 1980 to 2019 | 29 developing countries | CO2 emissions, environmental degradation, the refugee population | Fully modified ordinary least squares (FMOLS); dynamic ordinary least-squares estimator (DOLS) | Migration worsens environmental degradation. Environmental degradation appears to be greater in countries with higher immigration. |
| Bu et al. (2022) | 2017 | China | Population migration affects carbon emissions | GWR (geographically weighted regression); EE MRIO (environmentally extended multi-regional input–output) | Population migration exacerbates carbon emission inequality, especially increasing provinces’ carbon emission reduction barrier with net out-migrants. |
| Squalli (2021) | From 1997 to 2014 | USA | Migration and environmental emissions. | NAICS (North American Industry Classification System); SIC (Standard Industrial Classification) | Overall population contributes to environmental emissions at the US state level. Immigration may indeed yield environmental benefits. Second, US states with lower GHG emissions are associated with a higher share of immigrants. |
Table 2.
Summary of related studies on fertility rate and environmental quality.
| Study | Period | Countries | Key Variables | Method | Findings |
|---|---|---|---|---|---|
| Kim et al. (2020) | From 1998 to 2016 | 16 South Korean provinces | Income, CO2 emissions, and population aging | (FMOLS) | Population aging reduces carbon emissions and younger populations spur carbon emissions. |
| Alola et al. (2019a) | From 1997 to 2014 | 16 EU countries | Economic growth, fertility rate, energy indicators, and ecological footprint | Panel pool mean group autoregressive distributive lag (PMG-ARDL) | Fertility and renewable energy consumption mitigates ecological footprint, thereby promoting environmental sustainability. |
| Alola et al. (2020) | From 1990 to 2014 | USA and Canada | Biocapacity, fertility, marriage, and ICT | Autoregressive distributive lag (ARDL) | Marriage mitigates (promotes) biocapacity in Canada (USA). Fertility moderate marriage to cause a negative impact on biocapacity in the USA. |
| Zhang and Tan (2016) | From 1997 to 2016 | 29 provinces in China | Population factors and carbon emissions. | Stochastic impacts by regression on population, affluence, and technology (STIRPAT) | Population aging and population quality positively correlate with carbon emissions. Population living standard exhibits urban–rural difference in carbon emissions. Population aging–carbon emissions nexus varies across regions. |
| Brauner-Otto (2014) | From 1997 to 2013 | Chitwan, Nepal | Environmental quality and fertility. | Shannon–Weiner diversity index | The result reveals that women living in poor environmental conditions are likely to have larger families. |
| Simon (2017) | From 1971 to 2010 | Rural areas of Mexico | Precipitation and fertility | Vicious circle model (VCM) | The nexus of fertility and environmental quality depends on the climatic condition in Mexico. |
Table 3.
Details of the variables.
| Variable | Symbol | Measurement | Source |
|---|---|---|---|
| Greenhouse gas per capita | GHGC | kt of CO2 equivalent | Estimated from WDI |
| Gross domestic product per capita | Y | Constant 2015 USD | WDI |
| Natural resource rent | N | Total natural resource rents (% of GDP) | WDI |
| Fertility | F | Total births per woman | WDI |
| Refugee | R | as defined under the 1951 Convention Relating to the status of its 1967 Protocol1. | WDI |
Table 4.
Descriptive statistics.
| Sweden | |||||||
|---|---|---|---|---|---|---|---|
| lGHGC | lY | lY2 | lN | lF | lR | lR*lF | |
| Mean | −5.022 | 10.684 | 114.181 | −0.741 | 0.580 | 11.839 | 6.855 |
| Median | −4.964 | 10.736 | 115.278 | −0.914 | 0.595 | 11.879 | 7.054 |
| Maximum | −4.720 | 10.901 | 118.844 | 0.510 | 0.756 | 12.444 | 8.774 |
| Minimum | −5.418 | 10.388 | 107.914 | −1.444 | 0.405 | 11.203 | 4.857 |
| Std. Dev. | 0.223 | 0.168 | 3.591 | 0.531 | 0.098 | 0.418 | 1.088 |
| Skewness | −0.466 | −0.457 | −0.444 | 0.848 | −0.173 | −0.133 | −0.165 |
| Kurtosis | 1.798 | 1.740 | 1.731 | 2.551 | 2.228 | 1.701 | 2.378 |
| Jarque–Bera | 3.088 | 3.228 | 3.199 | 4.110 | 0.955 | 2.343 | 0.661 |
| Lebanon | |||||||
| Mean | −5.413 | 8.790 | 77.339 | −5.828 | 0.870 | 13.243 | 11.478 |
| Median | −5.372 | 8.790 | 77.270 | −6.264 | 0.785 | 12.940 | 11.052 |
| Maximum | −5.067 | 9.109 | 82.975 | −3.323 | 1.192 | 14.289 | 15.073 |
| Minimum | −6.203 | 7.920 | 62.738 | −6.852 | 0.732 | 12.641 | 9.575 |
| Std. Dev. | 0.273 | 0.258 | 4.459 | 0.949 | 0.139 | 0.603 | 1.531 |
| Skewness | −1.382 | −1.265 | −1.148 | 1.131 | 0.911 | 0.849 | 0.857 |
| Kurtosis | 4.574 | 5.291 | 4.875 | 3.039 | 2.536 | 1.909 | 2.764 |
| Jarque–Bera | 13.502 | 15.538 | 11.721 | 6.830 | 4.718 | 5.438 | 3.995 |
Table 5.
Correlations.
| Sweden | |||||||
| lGHGC | lY | lY2 | lN | lF | lR | lR*lF | |
| lGHGC | 1 | ||||||
| LY | −0.889 | 1 | |||||
| lY2 | −0.891 | 0.999 | 1 | ||||
| lN | −0.551 | 0.564 | 0.565 | 1 | |||
| lF | −0.087 | −0.034 | −0.032 | 0.362 | 1 | ||
| lR | −0.269 | −0.035 | −0.031 | −0.125 | −0.425 | 1 | |
| lR*lF | −0.152 | −0.045 | −0.042 | 0.357 | 0.978 | −0.230 | 1 |
| Lebanon | |||||||
| lGHGC | lY | lY2 | lN | lF | lR | lR*lF | |
| lGHGC | 1 | ||||||
| LY | 0.846 | 1 | |||||
| lY2 | 0.842 | 0.999 | 1 | ||||
| lN | −0.784 | −0.803 | −0.800 | 1 | |||
| lF | −0.867 | −0.882 | −0.882 | 0.869 | 1 | ||
| lR | 0.651 | 0.549 | 0.553 | −0.447 | −0.624 | 1 | |
| lR*lF | −0.807 | −0.854 | −0.854 | 0.870 | 0.971 | −0.423 | 1 |
Table 6.
Unit root tests.
| Sweden | ||||||||
| ADF | PP | |||||||
| Variables | I(0) | I(0) with Suppressed Constant | I(1) | I(1) with Suppressed Constant | I(0) | I(0) with Suppressed Constant | I(1) | I(1) with Suppressed Constant |
| t-stat | t-stat | t-stat | t-stat | t-stat | t-stat | t-stat | p-value | |
| lGHGC | 0.801 | 2.728 | −6.568 a | −5.221 a | 1.264 | 3.150 | −6.548 a | −5.324 a |
| lY | −0.573 | 3.187 | −4.473 a | −3.396 a | −0.588 | 2.973 | −4.391 a | −3.368 a |
| lY2 | −0.553 | 3.175 | −4.511 a | −3.421 a | −0.566 | 2.986 | −4.431 a | −3.396 a |
| lN | −2.315 | −1.259 | −6.460 a | −6.574 a | −2.226 | −0.996 | −6.993 a | −7.132 a |
| lF | −1.697 | −1.610 c | −2.122 | −2.106 b | −1.985 | −1.119 | −2.187 | −2.155 b |
| lR | −0.514 | 0.990 | −2.858 c | −2.896 a | −1.146 | 0.632 | −2.818 c | −2.850 a |
| lR*lF | −1.761 | −1.427 | −2.392 | −2.369 b | −2.007 | −1.031 | −2.464 | −2.428 b |
| Lebanon | ||||||||
| ADF | PP | |||||||
| Variables | I(0) | I(0) with Suppressed Constant | I(1) | I(1) with Suppressed Constant | I(0) | I(0) with Suppressed Constant | I(1) | I(1) with Suppressed Constant |
| t-stat | t-stat | t-stat | t-stat | t-stat | t-stat | t-stat | t-stat | |
| lGHGC | −3.405 b | −2.579 b | −5.538 a | −4.973 a | −3.629 b | −2.357 b | −5.530 a | −4.986 a |
| lY | −5.438 a | 1.426 | −5.362 a | −5.673 a | −4.430 a | 1.039 | −5.213 a | −5.496 a |
| lY2 | −5.105 a | 1.293 | −4.984 a | −5.273 a | −4.196 a | 0.918 | −4.885 a | −5.150 a |
| lN | −2.962 b | 0.581 | −6.341 a | −6.279 a | −3.084b | 0.650 | −6.364 a | −6.275 a |
| lF | −6.040 a | −6.484 a | −1.477 | −1.613 c | −3.944 a | −3.738 a | −1.534 | −1.623 c |
| lR | −0.346 | 1.650 | −3.317 b | −3.192 a | −0.572 | 1.367 | −3.214 b | −3.115 a |
| lR*lF | −4.167 a | −3.903 a | −1.773 | −1.760 c | −2.891 c | −2.303 b | −1.795 | −1.754 c |
Notes: 1. This table includes the outputs of the augmented Dickey–Fuller (Dickey and Fuller 1979) and Phillips–Perron (Phillips and Perron 1988) unit root tests. 2. Level and first difference are symbolized by I(0) and I(1), respectively. 3. Confidence levels of 1%, 5%, and 10% are represented as a, b, and c, respectively. 4. L represents the logarithmic transformation.
Table 7.
ARDL Sweden.
| Model 1 (Fertility) | Model 2 (Refugee) | Model 3 (Refugee*Fertility) | ||||
|---|---|---|---|---|---|---|
| Indicators | Coefficient | p-Value | Coefficient | p-Value | Coefficient | p-Value |
| lY | 27.346 b | 0.035 | 0.920 b | 0.015 | 0.230 a | 0.008 |
| lY2 | −1.270 b | 0.037 | −0.030 a | 0.002 | −0.036 b | 0.017 |
| lN | 0.005 | 0.790 | 0.003 | 0.843 | 0.014 | 0.475 |
| lN−1 | −0.031 c | −0.071 | −0.030 c | 0.086 | ||
| lF | 0.178 b | 0.045 | 2.980 b | 0.023 | ||
| lR | −0.048 b | 0.046 | ||||
| lR*lF | −0.211 b | 0.043 | ||||
| Bound Test | 5.675 a | 6.045 a | 5.493 a | |||
| Het Test | 0.350 | 0.710 | 0.862 | |||
| SR | 0.050 | 0.100 | 0.121 | |||
| Stability | Stable | Stable | Stable | |||
Note: The probability values for statistical significance are respectively donated by a for p < 0.01, b for p < 0.05, and c for p < 0.1.
Table 8.
ARDL Lebanon.
| Model 1 (Fertility) | Model 2 (Refugee) | Model 3 (Refugee*Fertility) | ||||
|---|---|---|---|---|---|---|
| Indicators | Coefficient | p-Value | Coefficient | p-Value | Coefficient | p-Value |
| lY | −121.639 a | 0.009 | −0.522 b | 0.026 | −0.526 b | 0.037 |
| lY2 | 6.870 a | 0.009 | 0.039 b | 0.028 | 0.039 c | 0.050 |
| lN | 0.105 b | 0.042 | 0.020 | 0.437 | −0.019 | 0.521 |
| lN−1 | 0.062 | 0.208 | −0.030 c | 0.086 | ||
| lF | 0.315 | 0.894 | 2.980 b | 0.023 | ||
| lF−2 | 6.222 c | 0.075 | ||||
| lR | −0.130 | 0.139 | ||||
| lR−1 | 0.163 c | 0.065 | ||||
| lR*lF | 0.001 | 0.961 | ||||
| Bound Test | 2.800 c | 5.429 a | 4.334 a | |||
| Het Test | 1.000 | 0.124 | 0.862 | |||
| SR | 0.401 | 0.070 | 0.074 | |||
| Stability | Stable | Stable | Stable | |||
Note: The probability values for statistical significance are respectively donated by a for p < 0.01, b for p < 0.05, and c for p < 0.1.
Disclaimer/Publisher’s Note: The statements, opinions and data contained in all publications are solely those of the individual author(s) and contributor(s) and not of MDPI and/or the editor(s). MDPI and/or the editor(s) disclaim responsibility for any injury to people or property resulting from any ideas, methods, instructions or products referred to in the content. |
© 2023 by the authors. Licensee MDPI, Basel, Switzerland. This article is an open access article distributed under the terms and conditions of the Creative Commons Attribution (CC BY) license (https://creativecommons.org/licenses/by/4.0/).
Share and Cite
MDPI and ACS Style
Alola, A.A.; Aliyev, A.; Obekpa, H.O.; Olagunju, I. Refugee Population and Environmental Quality in Sweden and Lebanon: Is Fertility Rate Changing the Dynamics? Soc. Sci. 2023, 12, 243. https://doi.org/10.3390/socsci12040243
AMA Style
Alola AA, Aliyev A, Obekpa HO, Olagunju I. Refugee Population and Environmental Quality in Sweden and Lebanon: Is Fertility Rate Changing the Dynamics? Social Sciences. 2023; 12(4):243. https://doi.org/10.3390/socsci12040243
Chicago/Turabian StyleAlola, Andrew Adewale, Anar Aliyev, Hephzibah Onyeje Obekpa, and Ishaaqa Olagunju. 2023. "Refugee Population and Environmental Quality in Sweden and Lebanon: Is Fertility Rate Changing the Dynamics?" Social Sciences 12, no. 4: 243. https://doi.org/10.3390/socsci12040243
Note that from the first issue of 2016, this journal uses article numbers instead of page numbers. See further details here.