Article

The Chess–Thomas Adult Temperament Questionnaire: Psychometric Properties of the Lithuanian Version

by
Tomas Lazdauskas
1,* and
Sean C. McDevitt
2
1
Institute of Psychology, Vilnius University, 01513 Vilnius, Lithuania
2
Behavioral-Developmental Initiatives, Scottsdale, AZ 85254, USA
*
Author to whom correspondence should be addressed.
Soc. Sci. 2023, 12(2), 52; https://doi.org/10.3390/socsci12020052
Submission received: 1 November 2022 / Revised: 13 January 2023 / Accepted: 14 January 2023 / Published: 17 January 2023

Abstract

:
Evidence-based information accumulated over the years has demonstrated the importance of having a culturally embedded temperament assessment instrument. Thus, the aim of this article was to investigate the psychometric properties of a Lithuanian version of the adult temperament scale derived from the Chess–Thomas Adult Temperament Questionnaire. The sample consisted of 654 participants between 13 and 79 years of age (M = 30.9, SD = 11.9). The structure of the questionnaire was validated using confirmatory factor analysis, the measurement invariance (configural, metric, and scalar) was evaluated to demonstrate equivalence under different conditions, and the reliability was tested using internal consistency and test–retest methods. A confirmatory factor analysis of nine theoretically based scales demonstrated a good model fit (χ2 = 4928.6, df = 1137, p < 0.001; CFI = 0.916; TLI = 0.909; RMSEA = 0.071). The scales evidenced equivalence across age, gender, education, and social status. Reliability analyses also showed adequate results: Cronbach’s alpha fell within a range of 0.61 to 0.86 (Mdn = 0.73) and retest within one month ranged between 0.65 and 0.95 (Mdn = 0.73). These findings suggest that the Lithuanian version of the questionnaire measures dimensions similar to the original nine Chess–Thomas temperament characteristics.

1. Introduction

Temperament, or behavioral style, is known to be an important facet of individual differences interwoven into the fabric of personality across the lifespan. The modern era of temperament research began with the seminal work of two psychiatrists, Alexander Thomas and Stella Chess, in the New York Longitudinal Study (NYLS). In the 1950s, these researchers assembled a group of 133 infants and followed them into mid-adulthood. The authors defined temperament as a behavioral style that “refers to the how rather than the what (abilities and content) or the why (motivation) of behavior” (Chess and Thomas 1996, p. 33). After a comprehensive analysis of infant behavioral patterns and at an early stage of their longitudinal study, the authors identified nine categories that allowed them to describe individual differences in reactivity, or temperament: activity level, rhythmicity (or regularity), approach/withdrawal, adaptability, threshold of responsiveness, quality of mood, distractibility, and persistence/attention span (Chess et al. 1959; Thomas and Chess 1977). Further analysis of the results of the NYLS showed that the same behavioral characteristics remained relevant regardless of the age of the individuals (Chess and Thomas 1999). The temperament assessment procedures used at that time (e.g., observation and interviews) were time-consuming and required significant financial and human resources, so the authors looked for ways to optimize temperament assessment in this regard (Chess and Thomas 1996).
As a result, an Adult Temperament Questionnaire (ATQ) was developed. The psychometric characteristics of the research version of the questionnaire were reported in the early 1980s (Thomas et al. 1982a). This version of ATQ consisted of 140 self-reported items rated on a 7-point scale (from hardly ever or never to almost always or always) and was designed to assess the nine characteristics described above. The questionnaire was validated in NYLS (N = 70) and college student (N = 490) samples. Since then, the issue of temperament in adulthood has attracted the attention of multiple groups of researchers (Cloninger et al. 1993; Evans and Rothbart 2007; Ruch et al. 1991; Carver and White 1994), with particular emphasis on its clinical value (Chess and Thomas 1986, 1999). In recent years, there has been a growing body of empirical work in this area. The range of research questions is wide, and it has been shown that certain temperament characteristics, or their combinations, have been associated with both positive and negative outcomes. On the one hand, empirical evidence has been obtained on the interaction of temperament with physical activity (Karvonen et al. 2020) and eating behavior (Lipsanen et al. 2020), academic (Mullola et al. 2015) and cognitive (Tölli et al. 2022) performance, development of leadership potential (Guerin et al. 2011), and protection against symptoms of depression and anxiety (Marder et al. 2022). On the other hand, specific temperament characteristics in adulthood are known to be associated with anxiety disorders (Windle and Windle 2006), depression (Boldrini et al. 2021; Katainen et al. 1999; Toyoshima et al. 2021), alcohol and other substance use (Pintos Lobo et al. 2021; Windle and Windle 2006), eating disorders (Burt et al. 2015), attention deficit–hyperactivity disorder (Ozdemiroglu et al. 2018), an increased risk of developing post-traumatic stress disorder (Geng et al. 2021), and even mortality (McCarron et al. 2003). The work of Chess and Thomas is replete with clinical vignettes showing how temperament can impact social interaction and even adjustment in a clinical population (Chess and Thomas 1986, 1999). They found that awareness of temperament was important since it focused their clients on behavioral style instead of motivation as the determining element of behavior in certain situations. Additionally, Chess and Thomas advocated for the benefits of understanding one’s own temperament profile and how it may affect those with whom they interact. They also illustrated how analyzing temperament–environment conflict in therapy sessions was a useful means of finding accommodations or ‘workarounds’ in ongoing interaction with persons in relevant situations in their clients’ lives. Therefore, the need to have a valid and reliable temperament assessment tool remains relevant in both scientific and clinical terms.
Temperament characteristics of adults are now typically assessed using self-report tools (Gartstein et al. 2016; Shiner and DeYoung 2013). A shorter version of the NYLS questionnaire (ATQ2) for use in clinical settings as well as research was also authorized by Drs. Chess and Thomas and subsequently developed and published (Chess and Thomas 1998). It consisted of fifty-four items taken from the original research questionnaire, six in each of the nine categories, based on item performance on internal consistency analysis and test–retest reliability as described in the Test Manual. This version of the questionnaire has been revised twice by enlarging standardization samples and developing age norms in 2008 (McDevitt 2008) and 2017 (Behavioral-Developmental Initiatives 2018). The Test Manual also pointed out some limitations of using the questionnaire, which are as follows: (1) the rating of items requires a certain level (junior high school) of reading ability; (2) the items may describe situations that a person has not encountered; (3) vagaries common to many self-report questionnaires, such as social desirability. The ATQ2 has good psychometric properties in a US standardization sample (N = 6400) and is used by practitioners today.
There is no reliable instrument in Lithuania to assess the temperament of adolescents and adults. Therefore, the aim of this study was to investigate the psychometric properties of a Lithuanian version of the ATQ2. To this end, the factor structure of the questionnaire and its equivalence under different conditions (viz., across age, gender, level of education, and social status) were tested, and the internal reliability and retest reliability were examined. Taking into account the good psychometric characteristics of the original ATQ2 version and the long-term use of the questionnaire in clinical practice, we hypothesize that the Lithuanian version of the questionnaire will have adequate psychometric properties for assessing the temperament of adolescents and adults. To the best of our knowledge, this article is the first published report on the factor structure of the questionnaire using confirmatory factor analysis (CFA) and measurement invariance (MI). Thus, the results of this study may also make a valuable contribution to the development of the next version of ATQ, as well as to cross-cultural research on temperament in adults.

2. Materials and Methods

2.1. Participants and Procedures

The convenience sample consisted of 654 participants ranging in age from 13 to 79 years (M = 30.9, SD = 11.9, Mdn = 26), with 79.7% (n = 521) being women, 19.7% (n = 129) men, and 0.6% (n = 4) nonbinary. According to the highest level of education, the participants were distributed as follows: 62.5% (n = 409) had higher education, 33.5% (n = 219) had upper secondary or equivalent education (e.g., vocational), and 4.0% (n = 26) had lower than secondary education. The study participants were from all ten counties of Lithuania: 70.8% (n = 463) of them were from the largest cities of the country (>100,000 inhabitants), 19.6% (n = 128) from smaller cities, 8.3% (n = 54) from towns and villages, and 1.4% (n = 9) from another type of settlement (e.g., suburb). Participants rated their subjective social status with an average score of 6.2 (SD = 1.65, Mdn = 6, range from 1 to 10).
The survey was conducted online, and information about the study was disseminated through online social networking ads as well as through personal contacts. Part of the participants (n = 36) completed the temperament questionnaire twice within a period of one month. The latter data were used to measure test–retest reliability. The test–retest sample size was between ‘good’ and ‘fair’ (Terwee et al. 2012) and the results were comparable to the test–retest results of the original sample (Behavioral-Developmental Initiatives 2018). The information provided by the participants was entered into the database only if the questionnaire was completed in full. For this reason, there were no missing data. However, three participants incorrectly reported their date of birth (indicated the date of participation), so their data were not included in the analysis where the age variable was used. Study participants (or their caregivers in the case of adolescents) signed an informed consent. The study was conducted in accordance with the Declaration of Helsinki and approved by the Psychology Research Ethics Committee of Vilnius University (No. 31/(1.3E) 25000-KP-50).

2.2. Measures

The ATQ2 was used in the study. The questionnaire consists of 54 items rated on a 7-point scale (1 = hardly ever, 2 = rarely, 3 = once in a while, 4 = sometimes, 5 = often, 6 = very often, 7 = almost always). The items in the ATQ2 describe situations at a behavioral level and are designed to be suitable for both adolescents and adults. The norms developed in the US standardization sample cover the age range from 13 to 89 years. This instrument assesses nine temperament characteristics: activity level, rhythmicity, adaptability, approach, intensity, mood, persistence, distractibility, and threshold. There are six items for each characteristic. To reduce the possibility of response bias, half of the items are reverse-scored. The internal reliability for the original version of the questionnaire ranged from 0.66 to 0.90 (Mdn = 0.76) and the retest reliability within one month ranged from 0.69 to 0.83 (Mdn = 0.82). The ATQ2 has a tradition of online use. Comparative analysis showed that both the paper-and-pencil and the online methods were similarly effective in measuring temperament characteristics (Behavioral-Developmental Initiatives 2018).
The questionnaire was translated into Lithuanian according to the standard procedure of forward and backward translation (e.g., Fenn et al. 2020). Four experts were involved in the translation process: developmental and clinical psychologists, Lithuanian language, and English language professionals. Five items were slightly adjusted for cultural context. Four items (Nos. 3, 16, 48, and 49) ask individuals to rate their typical behavior on a bus, train, or airplane (e.g., When I travel and have to change a different airplane, bus, or train…). In the Lithuanian version, the specific vehicles were replaced by the more general term “public transport” due to the possible lack of experience of some participants traveling by train or plane. In one item (No. 19), individuals are asked to choose an outfield versus infield position in a sport. These positions belong to a sport that is not widespread in Lithuania, so the terms defense versus offense, which are better known to Lithuanians, were used. The initial version of the questionnaire was tested with 20 individuals who indicated that all the items were understandable and clear. Participants in the main study were also asked to comment on items that were unclear to them, if any.
In addition, participants were asked to provide information about their age, gender, level of education, and place of residence, and to assess their social status on a slightly modified ten-point MacArthur Scale of Subjective Social Status (Adler et al. 2000).

2.3. Data Analysis

The factorial structure of the questionnaire was tested using a confirmatory factor analysis based on the weighted least square mean and variance-adjusted estimation method. Comparative fit index (CFI), Tucker–Lewis index (TLI), and root mean square error of approximation (RMSEA) with 90% confidence intervals were chosen as model-data fit indicators. The following cut-off values were considered as evidence of goodness-of-fit: >0.90–0.95 acceptable model fit for CFI and TLI, <0.08 adequate model fit for RMSEA (Brown 2015). At the same time, factor loadings of at least 0.30 were desirable (DiStefano 2002; Tabachnick and Fidell 2013). The modification indices report was also used to optimize the model. Measurement invariance across age, gender, level of education, and social status groups was tested to assess whether the model is equivalent under different conditions. For this purpose, a method for ordered categorical outcomes was used (Wu and Estabrook 2016; Svetina et al. 2020). In each group, model equivalence was consistently assessed at three levels: configural (baseline model identification using delta parameterization), metric (threshold invariance), and scalar (both threshold and loading invariance). The equivalence of the models was confirmed when (Chen 2007; Svetina et al. 2020) the change in CFI was not greater than −0.010 and the change in RMSEA was not greater than 0.015; a non-significant change in Chi-square was desirable.
The internal consistency reliability and test–retest reliability analyses were performed to check the reliability of the questionnaire. The ordinal Cronbach’s alpha and average inter-item correlation analyses were used to test the internal consistency of the questionnaire. Test–retest reliability analysis was performed by using Pearson product-moment correlation. The Cronbach’s alpha values and Pearson correlation coefficients were interpreted as follows: <0.60, unacceptable (DeVellis 2017; Hair et al. 2017); around 0.70, adequate; around 0.80, very good; around 0.90, excellent (Kline 2016). The preferred value for average inter-item correlation was moderate (Streiner et al. 2015) or ranged from 0.15 to 0.50 (Clark and Watson 1995).
Statistical analyses were conducted using version 3.6.2 of R (R Core Team 2019): version 1.3.1 of readxl (Wickham and Bryan 2019) for data importing to RStudio (RStudio Team 2016), version 0.6-8 of lavaan (Rosseel 2012) for CFA and MI, and version 2.1.3 of psych (Revelle 2020) for descriptive statistics and reliability analyses.

3. Results

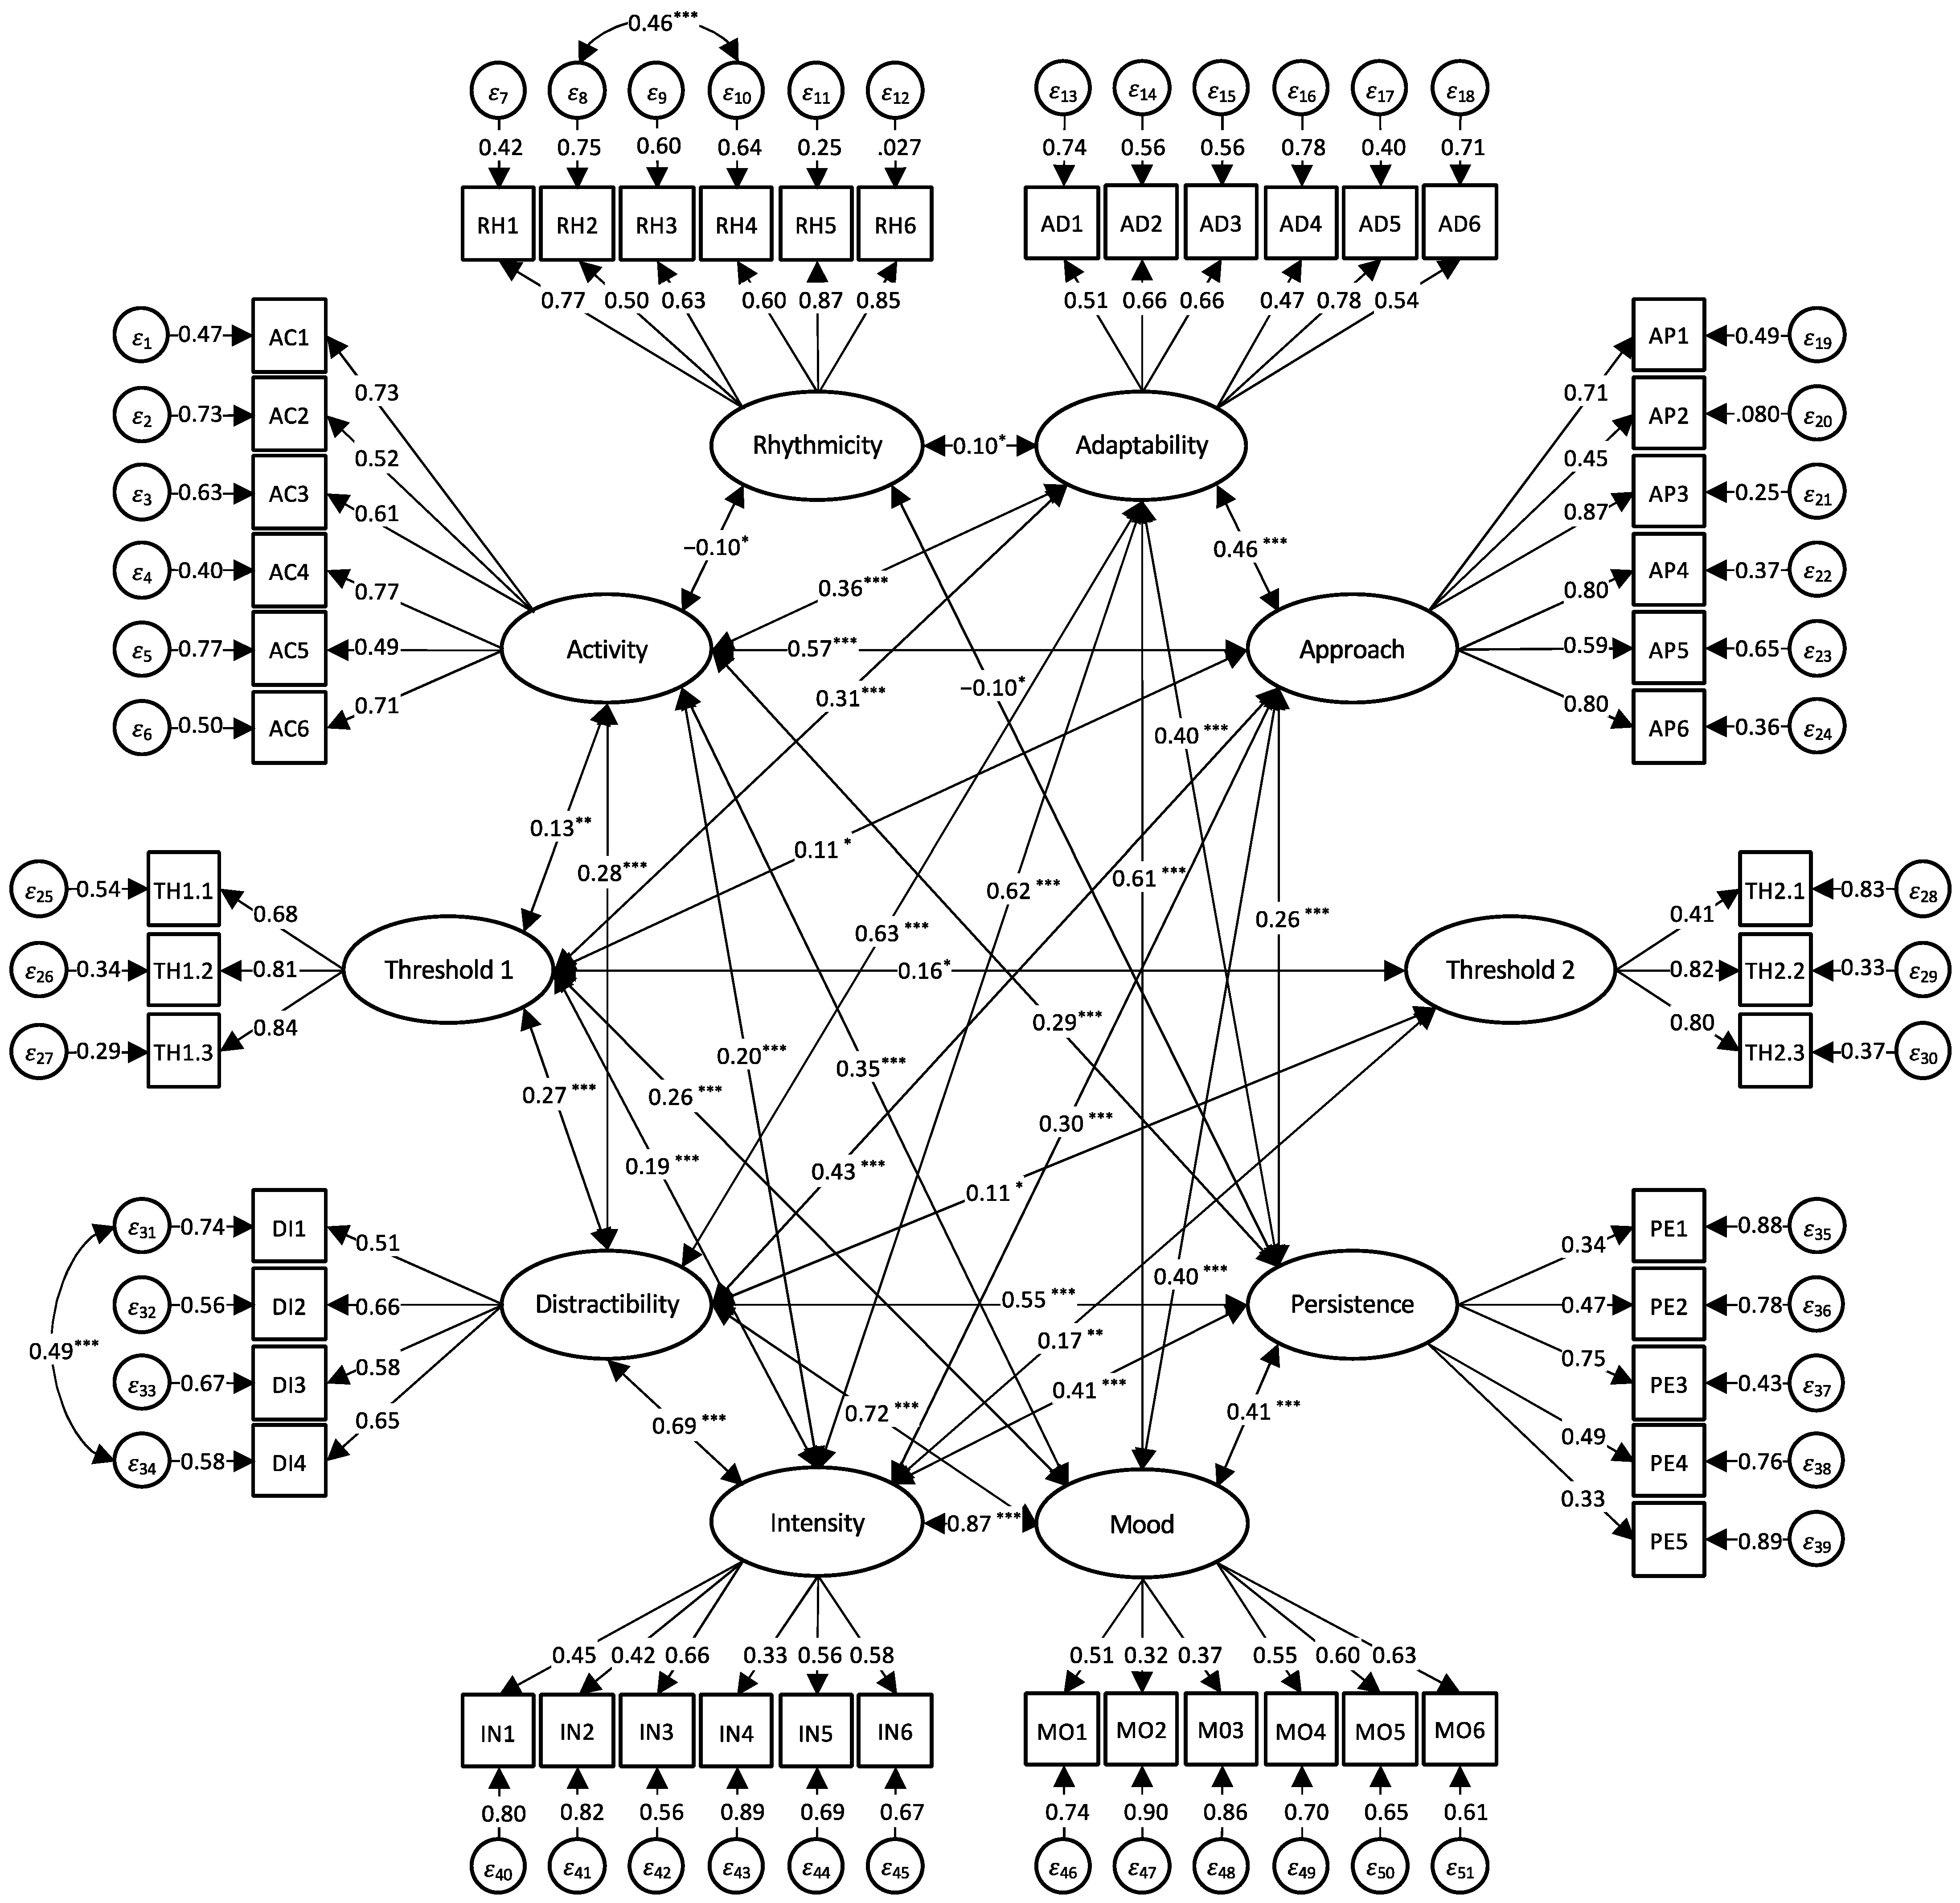
3.1. Factorial Structure

The nine-factor structure of ATQ2 was tested using CFA. Analysis of the results showed (Table 1) that the model-data fit of the baseline model (Model 1) was insufficient: although the absolute fit index (RMSEA) was adequate (<0.08), the incremental fit indices (CFI and TLI) were unacceptable (<0.90). A more detailed analysis of this model revealed that there were four items with factor loadings less than 0.30: two on the Distractibility scale (Nos. 6, 15), one on the Threshold scale (No. 22), and one on the Persistence scale (No. 8). These four items were removed and the model with 50 items was re-run (Model 2). The goodness-of-fit indices of the latter model were sufficient, while the modification indices report showed that linking the residuals of the three pairs of items in Threshold (No. 40 and No. 49), Rhythmicity (No. 11 and No. 29), and Distractibility (No. 24 and No. 51) scales would further improve the model. This idea worked with Rhythmicity and Distractibility scales, while factor loadings of the Threshold scale became unacceptably low. For this reason, it was decided to link only the residual values in the Rhythmicity and Distractibility scales. This led to Model 3, in which the absolute fit index (RMSEA) was less than 0.08 and the incremental fit indices (CFI and TLI) were greater than 0.90; also, all factor loadings exceeded 0.30.
As can be seen from Figure 1, on average, the strongest loadings (>0.70) were in the Approach and Rhythmicity factors, while the weakest loadings were in the Persistence factor. It can also be seen that most of the factors were significantly related. The strongest correlations were between Mood and Intensity (>0.80), and between Mood and Distractibility (>0.70). The Adaptability factor was strongly related (>0.60) to the three factors (Distractibility, Intensity, and Mood); Intensity and Distractibility were related similarly. The Rhythmicity factor was least associated with other factors (in a range from −0.10 to 0.10), and its correlations were negative with two of them.
To test the equivalence of the model under different conditions, an MI analysis across age, gender, level of education, and social status was performed (Table 2). According to these characteristics, the sample was divided into two groups, as described below. Age (13–26 years, n = 310 and 27–79 years, n = 341) and social status (1–6 points, n = 341 and 7–10 points, n = 313) groups were divided based on the median value. The two gender groups consisted of female (n = 521) and male (n = 129), and the two education groups consisted of those with higher education (n = 409) and those with upper secondary and lower education (n = 245).
As shown in Table 2, all goodness-of-fit indices were within acceptable ranges, regardless of MI level. Additionally, the model change rates for CFI and RMSEA did not exceed cut-off values either when comparing metric with a configural level or scalar with metric level. Only in the case of MI across age and gender were significant differences in Chi-square at the scalar level obtained.

3.2. Reliability

Two methods were used to check the reliability of the ATQ2: the internal consistency (expressed in Cronbach’s alpha and average inter-item correlation) and test–retest reliability (Table 3).
Cronbach’s alpha values were acceptable for all scales. The indicators for the seven scales were adequate or very good. The highest value was for the Rhythmicity scale and the lowest, but still acceptable, value was for the Persistence scale. The average inter-item correlation analysis showed that scores for eight scales were moderate, fell within the desired range (0.15–0.50), and only the Rhythmicity scale score was minimally above this threshold. Test–retest within month reliability analysis showed that the scores for most scales can be considered as very good and excellent. The highest test–retest reliability was for the Approach scale and the lowest one for the Threshold scale.
Reliability results for the individual scales of the present study were quite similar to those of the US standardization sample: Cronbach’s alpha values for eight of the nine scales and test–retest values for six of the nine scales did not differ by more than 0.10, although the range of values was wider in the current study. Cronbach’s alpha medians for the Lithuanian sample and the US standardization sample were also similar (0.73 and 0.76, respectively), whereas the test–retest median difference was slightly more pronounced (0.73 and 0.82, respectively).

4. Discussion

The aim of this study was to create a reliable and structurally sound version of the Adult Temperament Questionnaire, Second Edition, for Lithuanian users. Such an instrument would provide opportunities for research and clinical work among speakers of the Lithuanian language. The analyses, in particular, focused on the factorial structure and reliability of the translated questionnaire. The results confirmed our research hypothesis and showed that the psychometric characteristics of the questionnaire were appropriate and would allow for a reliable assessment of the nine temperament characteristics in adolescents and adults. The main findings of the study will be discussed in more detail below.
Factor analysis confirmed that the questionnaire consisted of nine theoretically based scales. The questionnaire was also found to measure these characteristics equivalent across age, gender, level of education, and subjective social status. Such a result was achieved by removing four items from the original version of the 54-item questionnaire. These items were omitted after evaluating their empirical contribution to the statistical model, as well as seeking to ensure that the quality of the construct was not compromised. The latter statement was also supported by similar results obtained by the authors of the original version of the questionnaire, as described below.
The CFA showed that some factors were quite strongly correlated, especially Distractibility, Mood, Intensity, and Adaptability. The authors of the questionnaire performed a factor analysis of the total scores of nine scales and obtained solutions of three (Thomas et al. 1982a) and four factors (Behavioral-Developmental Initiatives 2018). The clustering of Intensity and Distractibility was observed in the three-factor model, while in the four-factor model, Adaptability, Intensity, and Distractibility (along with Threshold) formed a separate factor. The strong relationship between Adaptability, Distractibility, Intensity, and Mood can also be explained by the theoretical assumption that these characteristics form a cluster of difficult temperament (Thomas et al. 1982b). Strong correlations between some factors were also typical for other adult temperament instruments. For example, Naerde et al. (2004) found that the distress factor was highly correlated with fearfulness (0.96) and anger (0.75) factors. In the current study, it was also found that the Rhythmicity factor was least associated with other factors. The same result was obtained by the authors of the questionnaire: “[Rhythmicity] was virtually unrelated to other temperamental traits in adult life. This outcome confirms the investigator’s qualitative impression from the subject interviews that rhythmicity of biological functioning is strongly influenced in adult life by external demands, such as work or school schedules” (Thomas et al. 1982a, p. 597). Interestingly, current study participants also commented on the Rhythmicity items, noting that it was difficult to separate personal needs from the regime that arose due to the work schedule.
Analysis of measurement invariance across age and gender showed a statistically significant Chi-square change between metric and scalar levels. We can only speculate that such a result was obtained due to the uneven gender distribution and the wide age range of the study participants. Although the changes in other indicators (CFI and RMSEA) did not exceed the critical value and this allowed us to confirm the measurement invariance, more detailed comparative studies of temperament in the Lithuanian sample in terms of age and gender could be a reasonable direction for further research.
The internal reliability indicators of the questionnaire were acceptable, while several aspects of this result need to be mentioned. The median values for both the internal consistency and test–retest correlation were 0.73. The internal consistency for some scales was relatively low and fell within the range of 0.60–0.70, specifically, Persistence, Intensity, Mood, and Threshold. It has been observed that modest values of internal consistency are typical for personality scales (McCrae et al. 2011). Similar internal consistency results were also obtained by the authors of other temperament instruments for adults: Evans and Rothbart (2007) analyzed the adult temperament model and found Cronbach’s alpha coefficients of 0.59 to 0.79 for their Adult Temperament Questionnaire (short form); Ruch et al. (1991) examined the reliability of several temperament instruments and found that more than half of the scales had reliability scores below 0.70; Naerde et al. (2004) tested the psychometric characteristics of the EAS temperament model proposed by Bus and Plomin and found that the internal consistency of the scales fell within the range of 0.53 to 0.75; Carver and White (1994) tested scales based on the Behavioral Inhibition/Behavioral Activation model and found internal consistency indices ranging from 0.66 to 0.76; in the questionnaire based on Cloninger et al.’s (1993) psychobiological model of temperament and character, the persistence scale also had the lowest reliability (0.62). Thus, the low-reliability indicators obtained in the Lithuanian version of the ATQ2 questionnaire are not an exception in the context of other temperament assessment instruments for adults. In the current study, the highest value of Cronbach’s alpha was obtained for the Rhythmicity scale. The same result was found in both the NYLS sample (Thomas et al. 1982a) and the US sample (Behavioral-Developmental Initiatives 2018). However, the CFA has shown that the residual values of this factor were related, and the average inter-item correlation was minimally above the targeted range, which may indicate a risk of item redundancy in the scale. Because of related residual values, the same risk applies to the Distractibility scale.
It is important to note several limitations of this study that may also serve as future directions. First, although the study sample was well balanced by type of settlement and level of education relative to the population, there was a clear predominance of female and emerging adulthood participants. Thus, in the future, it is important to supplement the sample with older individuals, as well as to include a larger number of males and to ensure greater gender diversity (e.g., to form a separate group of non-binary individuals). Second, as mentioned before, the authors of both the ATQ and the ATQ2 attempted to cluster the nine factors into more general categories by applying exploratory factor analysis. In our opinion, a multi-level factor analysis could also provide valuable information in this regard and allow for a more detailed description of the temperament construct. A person-centered data analysis strategy would be valuable in clinical terms. Third, the authors of the original version of the ATQ confirmed the validity of the questionnaire; however, a more detailed validity analysis of the Lithuanian version of the questionnaire should be performed in the future.
In summary, this study demonstrated that the Lithuanian version of the ATQ2 (ATQ2-LT) measures temperament characteristics in adults and teens in a manner comparable to the original version developed by Chess and Thomas in the New York Longitudinal Study. The questionnaire was found to measure temperament characteristics equivalent across age, gender, education, and social status. Adequate results of internal consistency and test–retest reliability were also obtained. Confirmatory factor analysis showed that the questionnaire contained the nine theoretically based scales and represents some preliminary evidence of construct validity. All these results lead to the conclusion that the ATQ2-LT allows a reliable assessment of the nine-dimensional characteristics, and it can be utilized in future studies of temperament with teens and adults.

Author Contributions

Conceptualization, T.L. and S.C.M.; methodology, T.L. and S.C.M.; formal analysis, T.L.; investigation, T.L.; data curation, T.L.; writing—original draft preparation, T.L. and S.C.M.; writing—review and editing, T.L. and S.C.M.; visualization, T.L.; supervision, S.C.M. All authors have read and agreed to the published version of the manuscript.

Funding

This research received no external funding.

Institutional Review Board Statement

The study was conducted in accordance with the Declaration of Helsinki, and approved by the Psychology Research Ethics Committee of Vilnius University (No. 31/(1.3E) 25000-KP-50, 2021-06-28).

Informed Consent Statement

Informed consent was obtained from all subjects involved in the study.

Data Availability Statement

Data can be made available for consultation upon request to the corresponding author.

Conflicts of Interest

The authors declare no conflict of interest.

References

  1. Adler, Nancy E., Elissa S. Epel, Grace Castellazzo, and Jeannette R. Ickovics. 2000. Relationship of Subjective and Objective Social Status with Psychological and Physiological Functioning: Preliminary Data in Healthy White Women. Health Psychology 19: 586–92. [Google Scholar] [CrossRef] [PubMed]
  2. Behavioral-Developmental Initiatives, ed. 2018. The New York Longitudinal Scales: Adult Temperament Questionnaire 2 (2017 Edition): Test Manual and Users Guide (by Stella Chess and Alexander Thomas). Scottsdale: Behavioral-Developmental Initiatives. [Google Scholar]
  3. Boldrini, Tommaso, Elisa Mancinelli, Denise Erbuto, Vittorio Lingiardi, Laura Muzi, Maurizio Pompili, Giuseppe Ducci, Silvia Salcuni, Annalisa Tanzilli, Paola Venturini, and et al. 2021. Affective Temperaments and Depressive Symptoms: The Mediating Role of Attachment. Journal of Affective Disorders 293: 476–83. [Google Scholar] [CrossRef]
  4. Brown, Timothy A. 2015. Confirmatory Factor Analysis for Applied Research, 2nd ed. New York: The Guilford Press. [Google Scholar]
  5. Burt, Nicole M., Lauren E. Boddy, and David J. Bridgett. 2015. Contribution of Temperament to Eating Disorder Symptoms in Emerging Adulthood: Additive and Interactive Effects. Eating Behaviors 18: 30–35. [Google Scholar] [CrossRef] [PubMed]
  6. Carver, Charles S., and Teri L. White. 1994. Behavioral Inhibition, Behavioral Activation, and Affective Responses to Impending Reward and Punishment: The BIS/BAS Scales. Journal of Personality and Social Psychology 67: 319–33. [Google Scholar] [CrossRef]
  7. Chen, Fang Fang. 2007. Sensitivity of Goodness of Fit Indexes to Lack of Measurement Invariance. Structural Equation Modeling 14: 464–504. [Google Scholar] [CrossRef]
  8. Chess, Stella, Alexander Thomas, and Herbert Birch. 1959. Characteristics of the Individual Child’s Behavioral Responses to the Environment. American Journal of Orthopsychiatry 29: 791–802. [Google Scholar] [CrossRef]
  9. Chess, Stella, and Alexander Thomas. 1986. Temperament in Clinical Practice. New York: The Guilford Press. [Google Scholar]
  10. Chess, Stella, and Alexander Thomas. 1996. Temperament: Theory and Practice. New York: Brunner/Mazel. [Google Scholar]
  11. Chess, Stella, and Alexander Thomas. 1998. The Adult Temperament Questionnaire. Scottsdale: Behavioral-Developmental Initiatives. [Google Scholar]
  12. Chess, Stella, and Alexander Thomas. 1999. Goodness of Fit: Clinical Applications from Infancy through Adult Life. Philadelphia: Brunner/Mazel. [Google Scholar]
  13. Clark, Lee Anna, and David Watson. 1995. Constructing Validity: Basic Issues in Objective Scale Development. Psychological Assessment 7: 309–19. [Google Scholar] [CrossRef]
  14. Cloninger, C. Robert, Dragan M. Svrakic, and Thomas R. Przybeck. 1993. A Psychobiological Model of Temperament and Character. Archives of General Psychiatry 50: 975–90. [Google Scholar] [CrossRef]
  15. DeVellis, Robert F. 2017. Scale Development: Theory and Applications, 4th ed. Los Angeles: Sage. [Google Scholar]
  16. DiStefano, Christine. 2002. The Impact of Categorization with Confirmatory Factor Analysis. Structural Equation Modeling 9: 327–46. [Google Scholar] [CrossRef]
  17. Evans, David E., and Mary K. Rothbart. 2007. Developing a Model for Adult Temperament. Journal of Research in Personality 41: 868–88. [Google Scholar] [CrossRef]
  18. Fenn, Jessy, Chee-Seng Tan, and Sanju George. 2020. Development, Validation and Translation of Psychological Tests. BJPsych Advances 26: 306–15. [Google Scholar] [CrossRef]
  19. Gartstein, Maria A., Samuel P. Putnam, Elaine N. Aron, and Mary K. Rothbart. 2016. Temperament and Personality. In The Oxford Handbook of Treatment Processes and Outcomes in Psychology: A Multidisciplinary, Biopsychosocial Approach. Edited by Sara Maltzman. Oxford Library of Psychology. New York: Oxford University Press, pp. 11–41. [Google Scholar] [CrossRef]
  20. Geng, Fulei, Shuhan Li, Yanling Yang, Jiaqi Zou, Liangqi Tu, and Jian Wang. 2021. Trauma Exposure and Posttraumatic Stress Disorder in a Large Community Sample of Chinese Adults. Journal of Affective Disorders 291: 368–74. [Google Scholar] [CrossRef] [PubMed]
  21. Guerin, Wright Diana, Pamella H. Oliver, Allen W. Gottfried, Adele Eskeles Gottfried, Rebecca J. Reichard, and Ronald E. Riggio. 2011. Childhood and Adolescent Antecedents of Social Skills and Leadership Potential in Adulthood: Temperamental Approach/Withdrawal and Extraversion. The Leadership Quarterly 22: 482–94. [Google Scholar] [CrossRef]
  22. Hair, Joseph F., G. Tomas M. Hult, Christian M. Ringle, and Marko Sarstedt. 2017. A Primer on Partial Least Squares Structural Equation Modeling (PLS-SEM), 2nd ed. Los Angeles: Sage. [Google Scholar]
  23. Karvonen, Jenni, Timo Törmäkangas, Lea Pulkkinen, and Katja Kokko. 2020. Associations of Temperament and Personality Traits with Frequency of Physical Activity in Adulthood. Journal of Research in Personality 84: 103887. [Google Scholar] [CrossRef]
  24. Katainen, Saara, Katri Raïkkönen, and Liisa Keltikangas-Järvinen. 1999. Adolescent Temperament, Perceived Social Support, and Depressive Tendencies as Predictors of Depressive Tendencies in Young Adulthood. European Journal of Personality 13: 183–207. [Google Scholar] [CrossRef]
  25. Kline, Rex B. 2016. Principles and Practice of Structural Equation Modeling, 4th ed. New York: The Guilford Press. [Google Scholar]
  26. Lipsanen, Jari, Marko Elovainio, Christian Hakulinen, Mark S. Tremblay, Suvi Rovio, Hanna Lagström, Johanna M. Jaakkola, Antti Jula, Tapani E. Rǒnnemaa, Jorma Viikari, and et al. 2020. Temperament Profiles Are Associated with Dietary Behavior from Childhood to Adulthood. Appetite 151: 104681. [Google Scholar] [CrossRef]
  27. Marder, Maya A., Corey Richier, Gregory A. Miller, and Wendy Heller. 2022. Pandemic Onset, Individual Differences, and Dimensional Symptoms of Depression and Anxiety among Emerging Adults. Emerging Adulthood 10: 1026–40. [Google Scholar] [CrossRef]
  28. McCarron, Peter, David Gunnell, Glynn L. Harrison, Mona Okasha, and G. Davey Smith. 2003. Temperament in Young Adulthood and Later Mortality: Prospective Observational Study. Journal of Epidemiology & Community Health 57: 888–92. [Google Scholar] [CrossRef] [Green Version]
  29. McCrae, Robert R., John E. Kurtz, Shinji Yamagata, and Antonio Terracciano. 2011. Internal Consistency, Retest Reliability, and Their Implications for Personality Scale Validity. Personality and Social Psychology Review 15: 28–50. [Google Scholar] [CrossRef]
  30. McDevitt, Sean C. 2008. Measuring Adult Temperament: Re-standardization and Development of Age and Gender Related Norms for the Chess-Thomas ATQ. Paper presented at 7th Occasional Temperament Conference, San Rafael, CA, USA, October 17–18. [Google Scholar]
  31. Mullola, Sari, Mirka Hintsanen, Marko Elovainio, Laura Pulkki-Råback, Jari Lipsanen, Kim Josefsson, Terho Lehtimäki, Olli T. Raitakari, and Liisa Keltikangas-Järvinen. 2015. Adulthood Temperament and Educational Attainment: A Population-Based Cohort Study. Learning and Instruction 40: 39–53. [Google Scholar] [CrossRef]
  32. Naerde, Ane, Espen Roysamb, and Kristian Tambs. 2004. Temperament in Adults-Reliability, Stability, and Factor Structure of the EAS Temperament Survey. Journal of Personality Assessment 82: 71–79. [Google Scholar] [CrossRef] [PubMed]
  33. Ozdemiroglu, Filiz, Kadir Karakus, Cagdas Oyku Memis, Levent Sevincok, and Sanem Mersin. 2018. Temperament in Adulthood Attention Deficit-Hyperactivity Disorder without Bipolar Disorder. Psychiatry Investigation 15: 266–71. [Google Scholar] [CrossRef] [PubMed] [Green Version]
  34. Pintos Lobo, Rosario, Stephanie S. J. Morris, Julio Yanes, Rachel B. Tenenbaum, Kathleen E. Feeney, and Erica D. Musser. 2021. The Role of Temperament in Alcohol Use among College Students. Addictive Behaviors Reports 14: 100366. [Google Scholar] [CrossRef]
  35. R Core Team. 2019. R: A Language and Environment for Statistical Computing. Vienna: R Foundation for Statistical Computing. [Google Scholar]
  36. Revelle, William. 2020. Psych: Procedures for Personality and Psychological Research. Evanston: Northwestern University. [Google Scholar]
  37. Rosseel, Yves. 2012. Lavaan: An R Package for Structural Equation Modeling. Journal of Statistical Software 4: 1–36. [Google Scholar] [CrossRef] [Green Version]
  38. RStudio Team. 2016. RStudio: Integrated Development for R. Boston: PBC. [Google Scholar]
  39. Ruch, Willibald, Alois Angleitner, and Jan Strelau. 1991. The Strelau Temperament Inventory—Revised (STI-R): Validity Studies. European Journal of Personality 5: 287–308. [Google Scholar] [CrossRef] [Green Version]
  40. Shiner, Rebecca L., and Colin G. DeYoung. 2013. The Structure of Temperament and Personality Traits: A Developmental Perspective. In Oxford Handbook of Developmental Psychology. Edited by Philip David Zelazo. New York: Oxford University Press, pp. 113–41. [Google Scholar]
  41. Streiner, David L., Geoffrey R. Norman, and John Cairney. 2015. Health Measurement Scales: A Practical Guide to Their Development and Use, 5th ed. Oxford: Oxford University Press. [Google Scholar]
  42. Svetina, Dubravka, Leslie Rutkowski, and David Rutkowski. 2020. Multiple-Group Invariance with Categorical Outcomes Using Updated Guidelines: An Illustration Using Mplus and the Lavaan/SemTools Packages. Structural Equation Modeling 27: 111–30. [Google Scholar] [CrossRef]
  43. Tabachnick, Barbara G., and Linda S. Fidell. 2013. Using Multivariate Statistics, 6th ed. New Jersey: Pearson. [Google Scholar]
  44. Terwee, Caroline B., Lidwine B. Mokkink, Dirk L. Knol, Raymond W. J. G. Ostelo, Lex M. Bouter, and Henrica C. W. de Vet. 2012. Rating the Methodological Quality in Systematic Reviews of Studies on Measurement Properties: A Scoring System for the COSMIN Checklist. Quality of Life Research 21: 651–57. [Google Scholar] [CrossRef] [Green Version]
  45. Thomas, Alexander, and Stella Chess. 1977. Temperament and Development. New York: Brunner/Mazel. [Google Scholar]
  46. Thomas, Alexander, Mary Mittelman, Stella Chess, Sam J. Korn, and Jacob Cohen. 1982a. A Temperament Questionnaire for Early Adult Life. Educational and Psychological Measurement 42: 593–600. [Google Scholar] [CrossRef]
  47. Thomas, Alexander, Stella Chess, and Sam J. Korn. 1982b. The Reality of Difficult Temperament. Merrill-Palmer Quarterly 28: 1–20. [Google Scholar]
  48. Tölli, Pekka, Liisa Keltikangas-Järvinen, Terho Lehtimäki, Niklas Ravaja, Mirka Hintsanen, Ari Ahola-Olli, Katja Pahkala, Mika Kähönen, Nina Hutri-Kähönen, Tomi T. Laitinen, and et al. 2022. The Relationship between Temperament, Polygenic Score for Intelligence and Cognition: A Population-Based Study of Middle-Aged Adults. Genes, Brain and Behavior 21: e12798. [Google Scholar] [CrossRef]
  49. Toyoshima, Kuniyoshi, Takeshi Inoue, Jiro Masuya, Yota Fujimura, Shinji Higashi, and Ichiro Kusumi. 2021. Affective Temperaments Moderate the Effect of Insomnia on Depressive Symptoms in Adult Community Volunteers. Journal of Affective Disorders 282: 726–31. [Google Scholar] [CrossRef] [PubMed]
  50. Wickham, Hadley, and Jennifer Bryan. 2019. Readxl: Read Excel Files. Available online: https://readxl.tidyverse.org (accessed on 10 March 2022).
  51. Windle, Michael, and Rebecca C. Windle. 2006. Adolescent Temperament and Lifetime Psychiatric and Substance Abuse Disorders Assessed in Young Adulthood. Personality and Individual Differences 41: 15–25. [Google Scholar] [CrossRef]
  52. Wu, Hao, and Ryne Estabrook. 2016. Identification of Confirmatory Factor Analysis Models of Different Levels of Invariance for Ordered Categorical Outcomes. Psychometrika 81: 1014–45. [Google Scholar] [CrossRef] [PubMed]
Figure 1. Standardized factor loadings and factor correlations in ATQ2 (Model 3). Note. AC = Activity; RH = Rhythmicity; DI = Distractibility; AD = Adaptability; AP = Approach; PE = Persistence; MO = Mood; IN = Intensity; TH = Threshold. All factor loadings are significant (p < 0.001). N = 654. * p < 0.05. ** p < 0.01. *** p < 0.001.
Socsci 12 00052 g001
Table 1. Results of a confirmatory factor analysis.
Modelχ2dfCFITLIRMSEA [90% CI]
Model 16080.5 *13410.8970.8900.074 [0.072, 0.075]
Model 25176.2 *11390.9110.9040.074 [0.072, 0.076]
Model 34928.6 *11370.9160.9090.071 [0.069, 0.074]
Note. CFI = comparative fit index (CFI); TLI = Tucker–Lewis index; RMSEA = root mean square error of approximation; CI = confidence interval. N = 654. * p < 0.001.
Table 2. Results of a measurement invariance analysis across age, gender, education, and social status.
Model FitModel Difference (Δ)
χ2 (df)CFIRMSEA [90% CI]Δχ2df)ΔCFIΔRMSEA
Age (n = 651)
Configural6193.3 (2274)0.9160.073 [0.071, 0.075]
Metric6287.3 (2474)0.9180.069 [0.067, 0.071]93.4 (200)0.002−0.004
Scalar6507.1 (2515)0.9140.070 [0.068, 0.072]219.7 (41) **−0.0040.001
Gender (n = 650)
Configural6729.1 (2274)0.9050.078 [0.076, 0.080]
Metric6808.5 (2474)0.9070.077 [0.075, 0.079]79.4 (200)0.002−0.001
Scalar7028.0 (2515)0.9030.074 [0.072, 0.076]219.6 (41) *−0.004−0.003
Education (n = 654)
Configural6296.5 (2274)0.9120.074 [0.072, 0.076]
Metric6401.9 (2474)0.9140.070 [0.068, 0.072]105.5 (200)0.002−0.004
Scalar6554.0 (2515)0.9110.070 [0.068, 0.072]152.1 (41)−0.0030
Social status (n = 654)
Configural6336.8 (2274)0.9120.074 [0.072, 0.076]
Metric6428.8 (2474)0.9140.070 [0.068, 0.072]92.0 (200)0.002−0.004
Scalar6567.8 (2515)0.9120.070 [0.068, 0.072]139.0 (41)−0.0020
Note. CFI = comparative fit index (CFI); RMSEA = root mean square error of approximation; CI = confidence interval. All Chi-square differences in Model Fit section are significant (p < 0.001). * p < 0.05. ** p < 0.01.
Table 3. Results of a reliability analysis.
ScaleNumber of ItemsInternal ConsistencyTest–Retest
Cronbach’s AlphaAverage Inter-Item Correlation
Activity60.78 (0.83)0.370.89 (0.90)
Rhythmicity60.86 (0.83)0.510.86 (0.89)
Adaptability60.76 (0.74)0.350.71 (0.64)
Threshold50.68 (0.76)0.300.65 (0.76)
Approach60.84 (0.78)0.460.95 (0.85)
Distractibility40.73 (0.72)0.400.72 (0.70)
Intensity60.66 (0.71)0.250.82 (0.84)
Persistence50.61 (0.79)0.240.73 (0.66)
Mood60.66 (0.69)0.240.66 (0.82)
Note. N = 654 in case of internal consistency. N = 36 in case of test–retest within month reliability. All test–retest reliability coefficients are significant (p < 0.001). In parentheses are the corresponding estimates for the US standardization sample (Behavioral-Developmental Initiatives 2018).
Disclaimer/Publisher’s Note: The statements, opinions and data contained in all publications are solely those of the individual author(s) and contributor(s) and not of MDPI and/or the editor(s). MDPI and/or the editor(s) disclaim responsibility for any injury to people or property resulting from any ideas, methods, instructions or products referred to in the content.

