Article

Formula for Determining the Construction Workers Productivity Including Environmental Factors

by
Jarosław Malara
,
Edyta Plebankiewicz
* and
Michał Juszczyk
Faculty of Civil Engineering, Cracow University of Technology, Warszawska 24, 31-155 Kraków, Poland
*
Author to whom correspondence should be addressed.
Buildings 2019, 9(12), 240; https://doi.org/10.3390/buildings9120240
Submission received: 31 October 2019 / Revised: 16 November 2019 / Accepted: 23 November 2019 / Published: 26 November 2019

Abstract

:
The aim of this study is to build a mathematical model of the productivity of construction workers. It does so by selecting 17 factors that influence the productivity of construction workers and categorising them into five groups. For the mathematical description of the factors, fuzzy logic was used. A formula for calculating the work productivity of construction workers is proposed. The novelty of the approach proposed by the authors is rooted in the consideration of various factors that have the potential to influence the productivity of construction workers. To present the way the formula operates, a single assessment of ceiling formwork was undertaken. The verification of a model confirmed its capability of analyzing, evaluating, and predicting the productivity of construction workers with satisfying accuracy.

1. Introduction

The construction of buildings is related to the execution of various types of tasks, which require different material expenditures and efforts from workers, who should possess a variety of skills. The type of construction work performed, and the characteristics of the workers strongly influence the time spent on performing a particular task. An additional problem is the interaction of the environment and various other factors characterized by instability (e.g., changing weather conditions). In terms of environmental factors, the authors consider all identifiable elements in the environment, e.g., physical, economic, technological etc., that affect the productivity of construction workers. Construction labour is one of the main resources, so labour productivity, as well as completeness and correctness of the executive project, plays a key role in predicting the time and cost of construction activities [1,2,3].
In the literature on the subject, the term “productivity” is defined in different ways. In construction, productivity is usually taken to mean labour productivity [4]. Most researchers defined labour productivity as a relationship between human hours and work accomplished [5]. Hwang and Soh [6] as well as Yi and Chan [7] defined labor productivity as the relationship between the output produced and the inputs used during the production process period. Moselhi and Khan [5] as well as Nguyen and Nguyen [8] defined labor productivity as a ratio of output to input while producing a product. In economic science, the ratio is usually expressed as a percentage, e.g., 100% productivity means that the person is working as per the standard, while a higher score means that he or she is working more efficiently, that is, producing more units than those specified in the standard. This definition will be used in the model proposed.
The aim of this paper is to report the results of studies on the development of a mathematical model capable of analyzing, evaluating, and predicting the productivity of construction workers. The novelty of the approach proposed by the authors roots in taking into account various factors that have the potential to influence productivity of construction workers. The goal was to develop a model that binds together a number of multidisciplinary factors as the input, with productivity of a worker, or a gang of workers, assigned to a specific construction work as the output. Other studies, in comparison, usually focus on groups of factors that derive from one or at least two disciplines. In the course of the research, various factors affecting the productivity of construction workers have been analyzed and introduced to the model. As a tool, which was implemented for the formal description of relationships between values of different factors and productivity of workers, fuzzy logic was used. The studies resulted in the formulation of a mathematical relationship, which is a core of a developed model. Verification of the model confirmed its capability of analyzing, evaluating, and predicting productivity of construction workers with satisfying accuracy.

2. Literature Review

Numerous researchers have attempted to develop models for predicting construction labour productivity. Methodologies that exist in construction labour productivity research area can be categorised as follows: (1) qualitative research methods, (2) quantitative research methods and (3) mixed method approaches, which involve a combination of qualitative and quantitative approaches [9]. Another classification of construction labour productivity is based on the research focus of each study, which can be: (1) archival study, (2) empirical research, and (3) simulation methodology. Many models apply advanced mathematical methods. These modeling techniques encompass statistical and regression models, expert systems, artificial intelligence, and simulation. Regression-based models have been used to study earthmoving productivity [10], masonry productivity [11,12] and pile construction productivity [13]. Examples of employing expert systems for productivity modeling include the system developed by Fayek and Oduba [14] as well as El- Rayes and Mosehli [15]. Such techniques as the artificial neural network have also been involved [13,16,17].
Choy and Ruwanpura [18] applied situation-based simulation models for predicting construction productivity. Hanna et al. [19] applied stepwise regression model to estimate the impact of changes on labor productivity in mechanical projects. Graham and Smith [20] gathered past productivity data regarding concrete supply and onsite delivery to create a predictive model by applying case-based reasoning (CBR) principles. Huang et al. [21] used the CYCLONE modeling methodology to estimate the productivity of formwork operations.
Despite the development of a considerable number of models, many of them reveal certain drawbacks which hinder the correct assessment of labour productivity under particular conditions. The models are usually developed and verified for the selected scope of construction works. Moreover, they include only a few selected factors affecting the productivity level. Also, the complicated mathematical methods used in a number of models often discourage potential users in applying the models in practice.
Another issue that contributes to the complexity of productivity estimation is the existence of numerous productivity-influencing factors. Productivity rates can fluctuate considerably due to the influence of these factors.
Over the years, there has been a significant shift towards a study of working time and productivity of workers. Ergonomics and interruptions at work were the key areas of workplace organization science. Over time, issues such as the importance of employee wages began to be noticed. Contemporary research on working time in construction tends to pay increasing attention to areas not directly related to professional activity. Many studies conducted around the world have concentrated on the development of a model of rest time [22]. The results show the positive impact of adequate time spent at home on the efficiency of the work of construction workers. Excessive time spent with family, as well as a dearth of it, results in reduced productivity. Very similar conclusions can be drawn from the Australian work-life-balance (WLB) model, which aims to balance the time spent working with the private life of construction workers [23]. Another approach analyzing the impact of absenteeism on performance is presented by the model of Ahn et al. [24] who take into account the social problems of workers.
Weather conditions have a huge impact on construction activities. Many studies have modelled the influence of temperature and air humidity, as well as that of extreme weather conditions, on the productivity of construction workers [25,26].
Among the factors related to the psychophysical condition of employees, those related to their state of health are considered important [27]. Another aspect is the proper replenishment of bodily energy, as well as the regeneration of strength during physical work in the construction industry [28]. It turns out that the appropriate length of rest time increases the performance of the workforce. Researchers in South Africa have determined the importance of stress on performance [29]. Unsurprisingly, the results show that stress negatively affects work productivity; thus, this study focused on determining the specific values of the impact. Workplaces should also provide acoustic comfort, because high noise levels are tiring and can, in addition, cause hearing loss, which leads to reduced productivity. Supervision of the construction site also depends on the length of the work shift [30]. Performance can be increased by setting the appropriate wage, as well as by providing bonuses and rewards. According to research [31], financial consideration plays the biggest role in motivating employees to increase performance. The day of the week is not without significance for the effect on productivity as it was found there is a dip in the productivity of constructions on Mondays, Fridays, and Saturdays [30].
Previous research presents various classifications of factors influencing the labour productivity of construction workers [32,33]. However, these studies do not take into account a large number of factors affecting the working time of construction workers and are primarily limited to factors involved in performance-related scheduling [34,35,36,37].

3. Materials and Methods

3.1. Factors Affecting Labour Productivity

To construct a model to measure the productivity of construction workers, on the basis of an analysis of the literature, 17 factors were selected and categorized into five groups (Table 1). These factors are most often cited in the literature [5,16,22,23,25,26,28] as having a fundamental impact on the productivity of construction workers. They are also characterized by universality, i.e., they have an impact in all types of construction work and are not characteristic only for a selected group of works. The main reason for choosing these factors was the possibility to examine them in the current research.
When analysing the factors in Table 1, it should be noted that some of them belong to the group of “Human Resources” (time spent outside work, psychophysical conditions), while the others belong to the group which can be called “Project Condition”. As a result, all these factors can be used to determine only the productivity of an individual worker. When determining the productivity of the entire team, factors from the “human resource” group cannot be considered.
The factor to which attention should be paid and which was not included in Table 1 is experience. This issue is exceedingly complex, because it includes many so-called soft skills that are acquired with age and life experience. This means that the factor “employee’s age” also includes aspects related to experience, and therefore it has not been subjected to a separate analysis in this work.

3.2. Parameterization of the Factors

One of the problems in constructing a mathematical model depicting the dependence of the productivity of construction workers on various factors is the number and variety of units by which these factors can be determined. Having reviewed solutions for similar mathematical depictions, fuzzy set theory proved the most effective, as it is a frequently used tool in these types of problems [38,39]. Fuzzy sets effectively allow one to change the values of variables with different units into numerical parameters belonging to the range <0, 1>. Taking into account the descriptions of the factors available in the literature, membership functions were proposed for each of them. Each of the factors was analyzed separately and the effect was to develop a membership function, which in the near way reflects its impact on productivity. The method of analyzing individual factors can be found in [30]. To illustrate the course of the analysis, this paper presents its details regarding only one factor, which is the age of the worker.
Studies [40,41] prove that the best working age is 26–27 years due to the optimal physical conditions (biologically the best age). However, one cannot approach this data uncritically and treat this age as the most conducive to achieving the highest productivity. The same research also shows that, in the European Union, the employment of 26-year-olds is at a similar level as 45-year-olds and in this age frame is permanent. It is only over 45 years of age that employers are reluctant to hire workers due to their lower productivity. It should be noted that there exists a large amount of help from the European Union countries in the activation of employees in the pre-retirement age. In individual countries (including Poland), the costs of hiring older employees are reduced, and there is the possibility of subsidies and reimbursement of training costs for these employees. However, according to employers, this does not compensate for the declining productivity of workers. The range of 45–55 years is assumed as the age of a strong decrease in employee productivity. After reaching the upper value of the range, no clear decreases in physical activity until the employee reaches retirement age are observed. The relatively constant productivity of worker aged 26–45 depends on the gradual replacement of physical strength by experience. In the case of manual work conducted by construction workers, the accepted limit terminating optimal performance at the age of 45 is justified. The above analysis concerns manual workers, because in the case of administrative or mental tasks lower physical fitness does not play such a significant role.
The above description of the worker’s age factor is best illustrated by the trapezoidal function of belonging to the high productivity sets (Figure 1), with the values of characteristic parameters: a = 16 years of age (the lower limit of employability of workers allowed by the Polish law), b = 26 years, c = 45 years and d = 55 years. Thus, the full formula of the membership function for the factor takes the form of Equation (1).
μ A ( x ) = { 0   d l a   x 16   a n d   x 55 x 16 10   f o r   16 < x < 26 55 x 10   f o r   45 < x < 55 1   f o r   16 x 45
Figure 1 depicts its graphic interpretation.
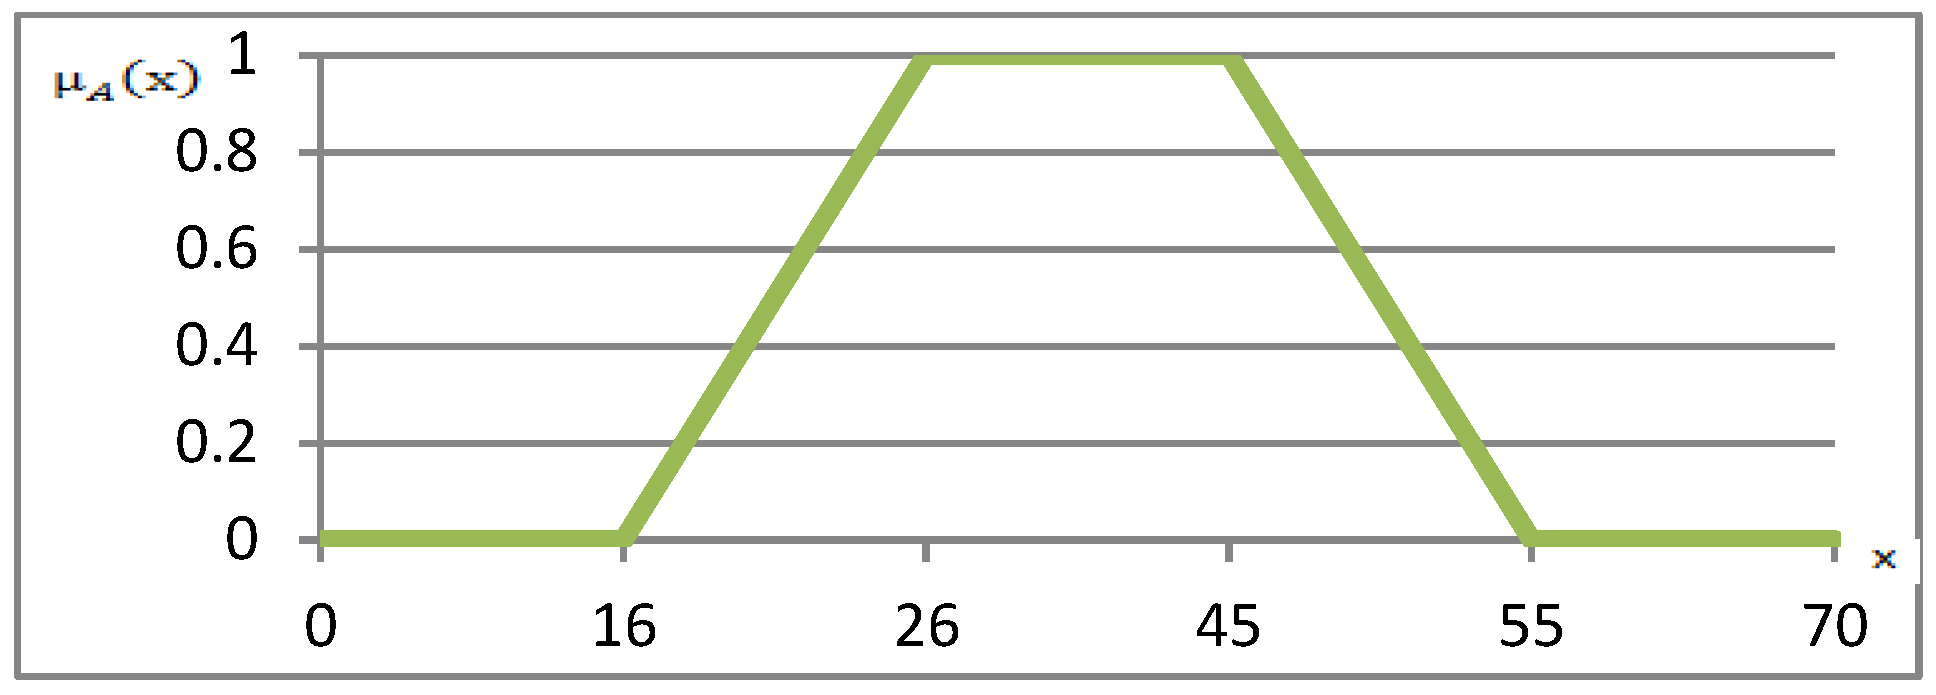
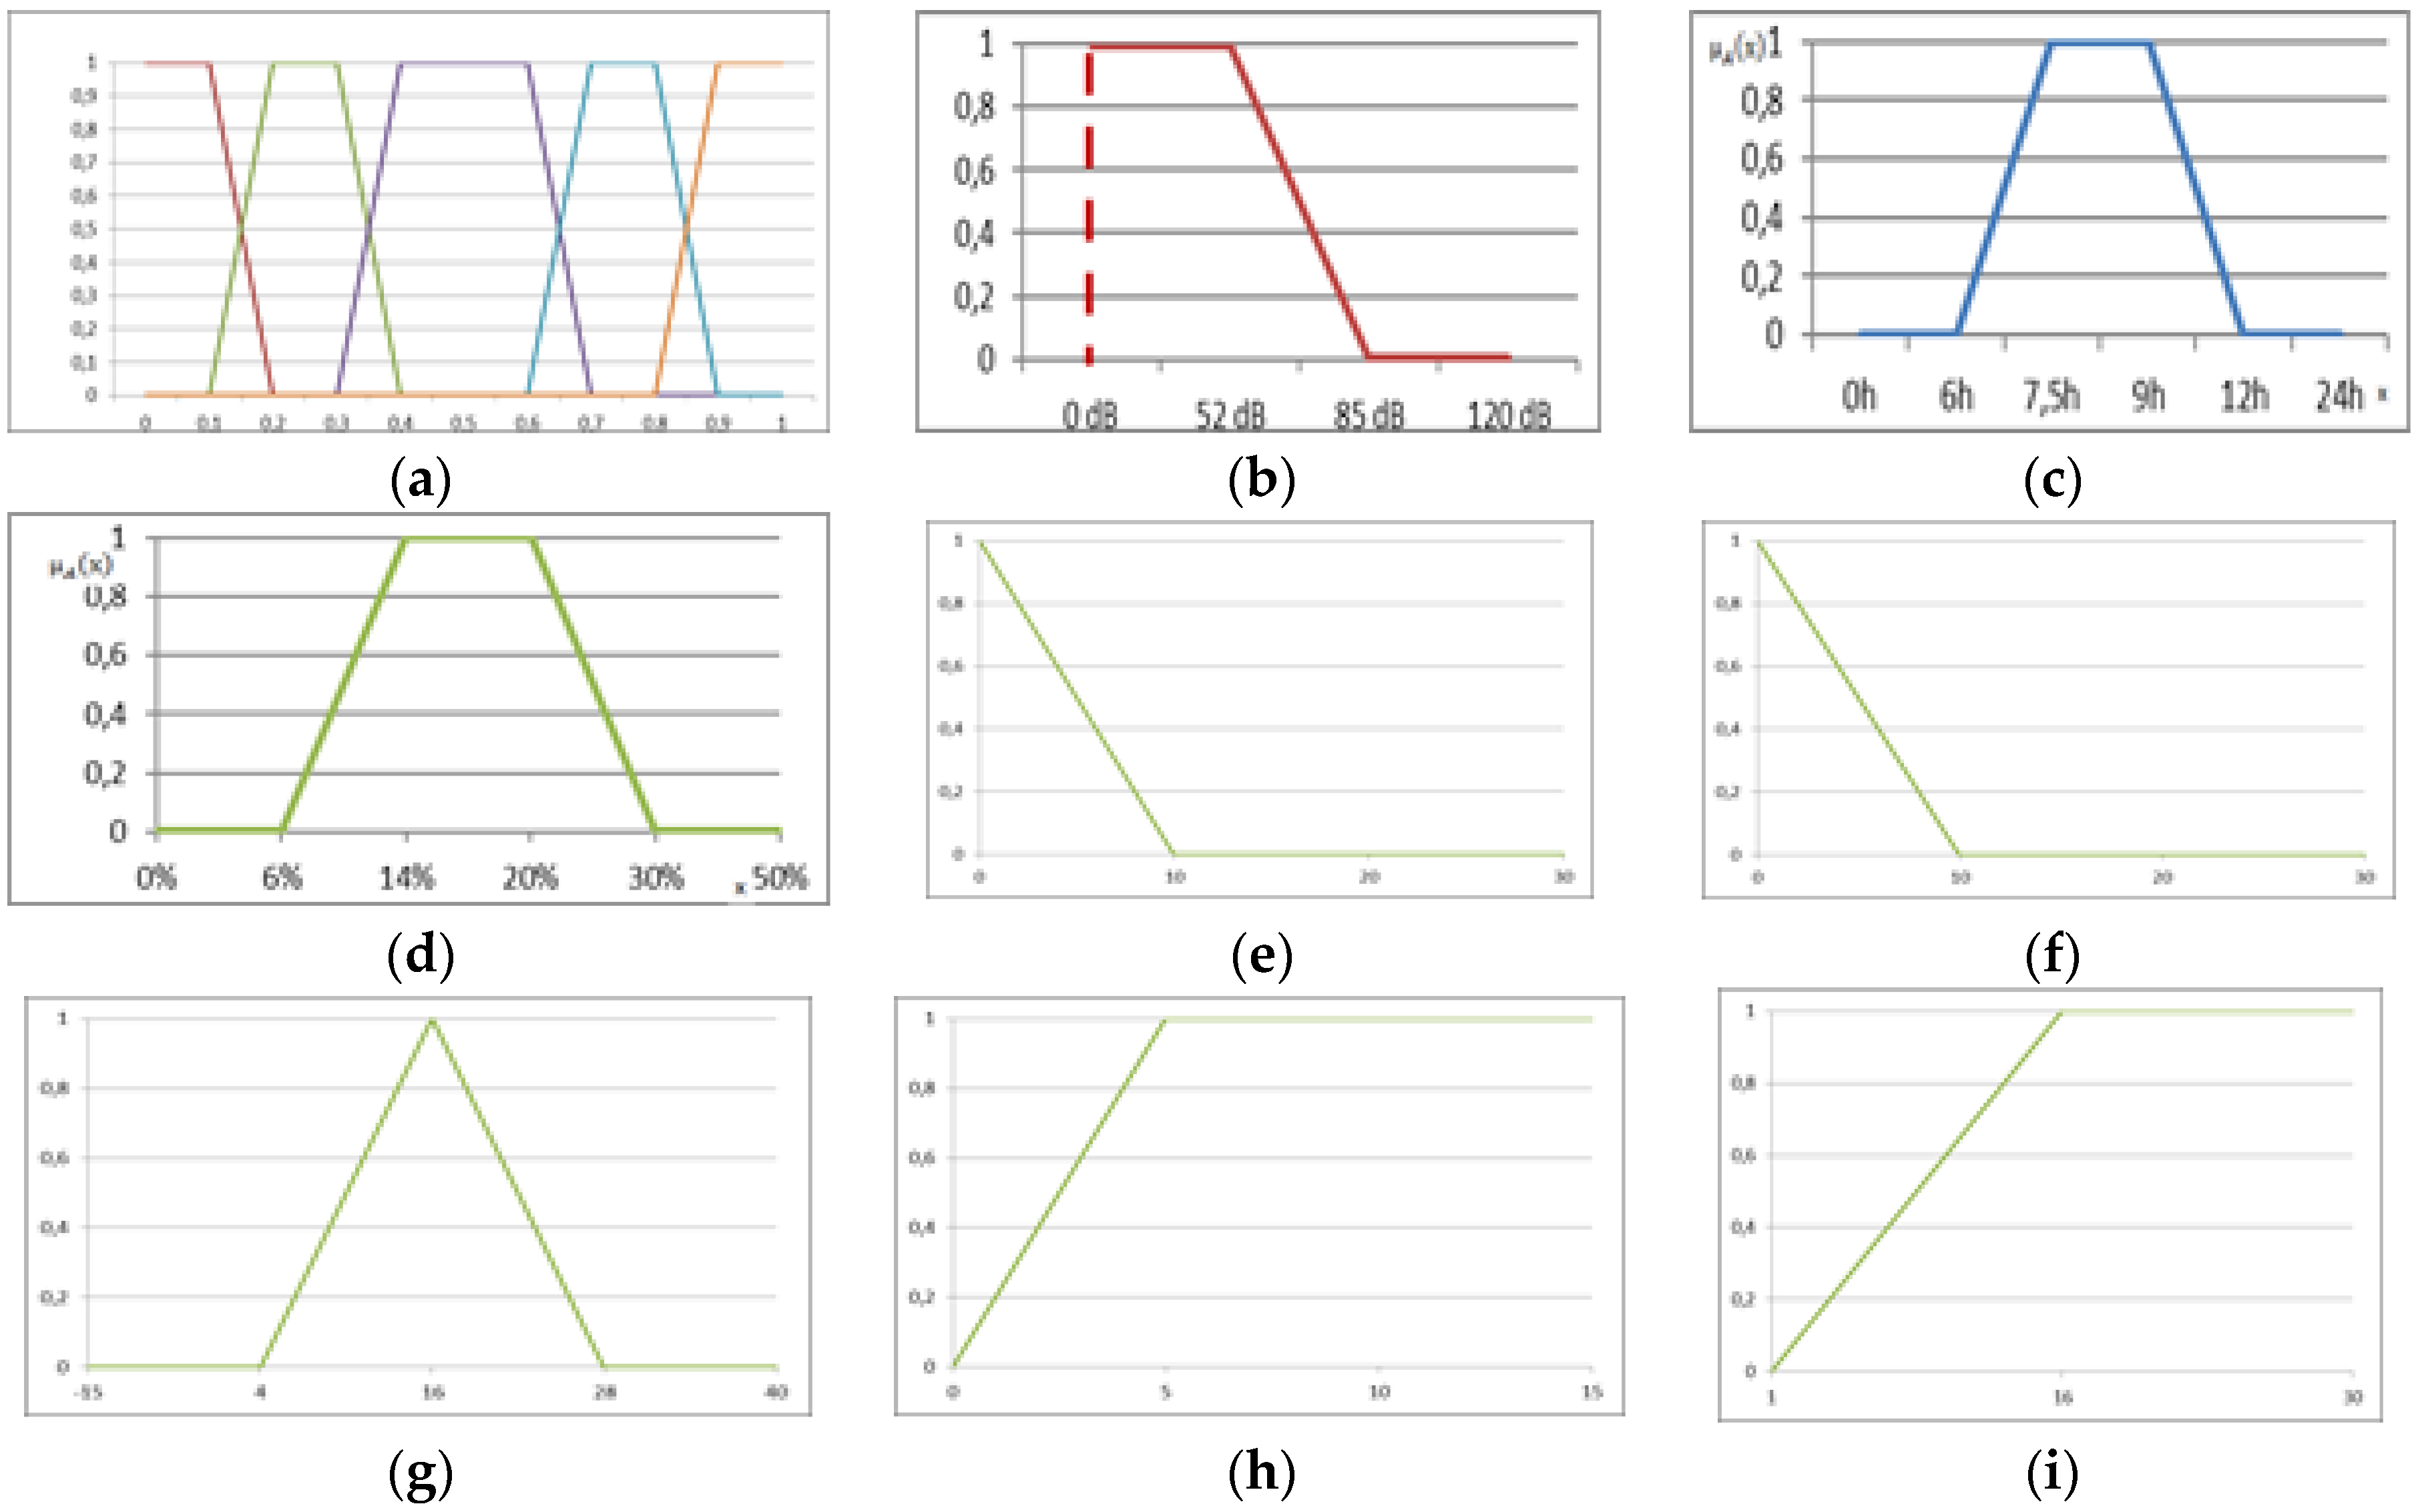
  • The membership functions of the following factors are captured as linguistic values: ergonomics of equipment and tools; wage; organization of work and work stations; stress; fatigue of the employee; and health. The membership function is:
    • Very good (0.8; 0.9; 1.0; 1.0);
    • Good (0.6; 0.7; 0.8; 0.9)
    • Average (0.3; 0.4; 0.6; 0.7);
    • Weak (0.1; 0.2; 0.3; 0.4)
    • Bad (0.0; 0.0; 0.1; 0.2)
  • For the factor: noise, the membership function is described in Equation (2).
    μ A ( x ) = { 1   f o r   x 52 d B 85 d B x 33 d B f o r   52 d B < x < 85 d B 0   f o r   x 85 d B
    where dB stands for decibels.
  • For the factor: duration of work shift, the membership function is described in Equation (3).
    μ A ( x ) = { 0   f o r   x 6 h   a n d   x 12 h x 6 h 1.5 h f o r   6 h < x < 7.5 h 12 h x 3 h f o r   9 h < x < 12 h 1   f o r   7.5 h x 9 h
    where h is hours worked.
  • For the factor: regeneration of strength, the membership function is described in Equation (4).
    μ A ( T f o / T ) = { 0   f o r   T f o / T 6 %   a n d   T f o / T 30 % T f o / T 6 % 8 % f o r   6 % < T f o / T < 14 % 30 % T f o / T 10 f o r   20 % < T f o / T < 30 % 1   f o r   14 % T f o / T 20 %
    where: T is time available; Tfo is time to rest; and T f o / T = T f o T 100 %
  • For the factor: precipitation, the membership function is described in Equation (5).
    μ A ( x ) = { 1 f o r   x = 0 m m 10 x 10 f o r   0 m m < x < 10 m m 0   f o r   10 m m x
  • For the factor: wind, the membership function is described in Equation (6).
    μ A ( x ) = { 1   f o r   x = 0 m / s 10 x 10 f o r   0 m / s < x < 10 m / s 0   f o r   10 m / s x
  • For the factor: air temperature, the membership function is described in Equation (7).
    μ A ( x ) = { 0   f o r   x 4 ° C x 4 ° C 12 ° C f o r   4 ° C < x < 16 ° C 1   f o r   x = 16 ° C 28 ° C x 12 ° C f o r   16 ° C < x < 28 ° C 0   f o r   28 ° C x
  • For the factor ‘worker’s absence,’ the membership function is described in Equation (8).
    μ A ( x ) = { 0   f o r   x = 0 r d x 5 f o r   1 r d < x < 5 r d 1   f o r   x 5 r d
    where: rd represents workdays.
  • For the factor: adaptation to new working conditions, the membership function is described in Equation (9).
    μ A ( x ) = { 0   f o r   x = 1 r d x 1 15 f o r   2 r d x 15 r d 1   f o r   x 16 r d
The shape of the membership function is presented in Figure 2.
  • For the factor ‘time spent with family,’ the membership function is described in Equation (10).
    μ A ( x ) = { 1   f o r   x 5 r d / w e e k 0   f o r   x 6 r d / w e e k
  • For the factor ‘day of the week,’ the membership function is described in Equation (11).
    μ A ( x ) = { 0.38   f o r   x = M o n d a y 0.87   f o r   x = T u e s d a y 1   f o r   x = W e d n e s d a y 0.88   f o r   x = T h u r s d a y 0.84   f o r   x = F r i d a y 0   f o r   x = S a t u r d a y
More on the characterization of the factors and the justification of their proposed membership functions can be found in [30,31].

3.3. Impact of Identified Factors on Work Productivity of Construction Workers

The next step in the study was to determine the impact of the identified factors on worker productivity. The results of the survey were used to determine this. The survey covered a total of 142 respondents, comprising both supervisors (66 people) and construction workers (76 people). A survey for supervisory staff was available on the website of the Institute of Construction Management of the Faculty of Civil Engineering, Cracow University of Technology from April 16, 2014, to June 30, 2014. The largest group of respondents included construction engineers, craftsmen, and masters, while the smallest group involved contract managers, directors, board members, and construction company owners. Most of the subjects had worked in their current positions for 3–6 years, but it is difficult to indicate their employment timespan clearly. The greatest number of respondents worked in companies employing 10–249 workers; however, when workers for subcontracting companies were included, the dominant group was the one with 100–499 people. The most represented groups were small and medium-sized companies.
As part of the follow-up survey, surveys were also conducted among construction workers; 76 anonymous paper-based questionnaires were collected. The research was conducted in the second half of 2014. The workers, who were employed at several construction sites in Cracow, worked as specialists in a variety of tasks, ranging from earthworks to finishing. The largest group was specialists, which included carpenters, reinforcers, and bricklayers. The respondents had typically worked in their positions for 3–6 years. Most of them declared a work experience of 3–7 years in the construction sector. By determining the average number of the employed workers in the company, excluding subcontractors, the largest group was one with up to nine employees. If subcontractors were included, most responses had a range from 20 to 99 employees.
In the survey, the respondents evaluated the degree of influence of each of 15 factors on a 1–5 scale. Ratings are assigned numeric values by the following key: 1—insignificant factor; 2—factor of small significance; 3—factor of average significance; 4—significant factor; and 5—strongly significant factor.
After aggregating all the surveys, it was found that for none of the factors was the mean score of the responses less than three, indicating the generally average significance of the factors; therefore, the respondents confirmed that all the factors included in the survey had influence on construction workers’ productivity. The results are presented in Table 2.
Such an assignment becomes the basis for further inference concerning the degree of influence that individual factors have on the productivity of construction workers.
As the collected survey results proved statistically significant, a basic set of degree of influence coefficients was created. The analysis of responses allowed four characteristic groups to be specified. Of all the factors, the lowest mean evaluation was given to c3, c10, c14, and c15. Their values are included in the range <3.09, …, 3.20>. Due to the small differences between the means for these factors, they were categorized into one group: those with the lowest influence on the construction workers’ productivity. The next group included the factors c2, c6, c9, c11, c12, c13, c16, and c17, whose means fit the range <3.38, …, 3.83>. This group comprises factors described as having an average influence on the productivity of construction workers. Yet another group was based on mean values of responses in the range <4.01, …, 4.27>, and included the factors c1, c5, c7, and c8. These were called factors that had a large degree of influence on construction workers’ productivity. The last factor, c4, was assigned to the group with a very high degree of influence on the productivity of construction workers, as the mean value of the responses was the highest. All the values were assigned on the basis of the assumptions of the Likert scale. The results of the survey were such that the set of factors having a very small degree of influence on workers’ productivity remained empty.
The next step, aimed at the simplification of the work productivity model, involved the assignment of weight coefficients to the particular groups. This was conducted on the basis of fuzzy set theory. The singleton sharpened form of the Likert scale was used, which allowed the assigning of values from the set <0, 0.25, 0.5, 0.75, 1> to individual groups of factors. Since there were no factors with a very small degree of influence on workers’ productivity, the subsequent analysis excluded this group. A full assignment is presented in Table 3.
The analysis of factors influencing construction workers revealed that four of them required a separate approach: ergonomics, air temperature, wind, and precipitation.

3.4. Formula for Determining the Productivity of Construction Workers by Considering the Influencing Factors

To obtain a formula capturing the productivity of construction workers, each factor labelled c1, c2, …, c17 was described using two variables. According to Table 2, each of the factors was assigned a function μA(c), where c∈<c1, c2, …, c17> and the function value of μA(c) ∈<0,1>. The other variable was the weight coefficient w, for which the values w(c)∈<0.25,0.5,0.75,1> are predefined in Table 4, where c∈<c1, c2, …, c17>. Summing up, all the factors were described in terms of pairs of numbers, which are the results of the previously specified functions and w(c).
A formula for calculating the work productivity of construction workers, as defined by the Wp function in formula (12), was proposed.
W p = [ ( i = 1 17 μ A ( c i ) w ( c i ) i = 1 17 w ( c i ) ) + 0.5 ] y
where: Wp refers to labour productivity; μA(ci) refers to the value of the membership function of the set of high productivities for the i-th factor; w(ci) refers to the value of the function of the degree of the impact of the i-th factor on labour productivity, and the y–coefficient correcting the interval width of the possible occurrences of the Wp function values.
In formula (12), the value of the quotient of the sum in each case is in the interval <0, …, 1>; hence, the necessity arises to move the center of the interval by 0.5 so that for the average quotient value, interpreted as average productivity, the result obtained is equal to 1, implying 100% productivity, or the accomplishment of the assumed standard. The exponential form of the function is related to the possibility of adjusting the width of the interval of possible results. Example intervals <z1, …, z2>, depending on the value of the power of y, are presented in Table 4. Value z1 is the minimum theoretical value of the function Wp, while z2 is the maximum.
For the power exponent in the formula for Wp, accepting the value of 0 does not make sense, due to the previously known results of the value of the function. Seeking a range for y > 5 is also illogical, due to the extremely large dispersion of results; for y = 5, the theoretical possible performance at high values of μA(ci) can exceed 700%, which is doubtful, if not impossible. Choosing the width of the productivity range depends on the nature of the worker’s activity and his or her sensitivity to the changing factors. Simple and repetitive tasks have less sensitivity to the variability of factors, while complicated and atypical tasks are less predictable. Therefore, determining the appropriate value of the exponent y is vital for obtaining reliable results. It is proposed that its value should be determined by using the standard deviation of the test sample. This assumption is based primarily on the lack of sensitivity of the model to the change of exponent y. The basic assumption is the alignment of the standard deviation of the actual results with the theoretical results. It is therefore possible to present the assumption using formula (13):
σ w = ( σ t ) y
where: σw—standard deviation of the actual results; σt—standard deviation of the theoretical results, y—expected exponent of formula (1).
To find the expected exponent, formula (14) is used, taking the natural logarithms of the values:
y = ln σ w ln σ t
The coefficient y calculated by Equations (13) and (14) will result in a very good scaling of the theoretical results for empirical research but will not result in any change in the way the model operates. Thus, in the previously described Equation (12), it is possible to scale the results by adjusting the width of the range of productivity results of construction workers by changing the exponent y.
The proposed formula assumes that the impact of all identified factors is taken into account. It is possible to use fewer factors, but it should be remembered that a reduction in the number of factors will result in lower accuracy of the result obtained.

3.5. Example of Formula Usage

To present the way the formula operates, a single assessment of ceiling formwork was undertaken on October 14, 2015. In this example, based on measurements and observations, all 17 identified factors were analyzed. The results, together with the calculation of the values of the function μA(ci), are presented in Table 5. The data in the column “measurement result” come from observations and membership functions were determined on the basis of graphs (Figure 1 and Figure 2).
For further calculations, coefficients of the degree of influence of individual factors on productivity, that is, w(ci), were used. All the necessary values for calculating Wp were determined. The calculations proceeded as follows:
W p = 0.75 0.75 + 0.2 0.5 + 1 0.25 + + 0.2 0.25 + 0.88 0.5 + 0.07 0.5 0.75 + 0.5 + 0.25 + + 0.25 + 0.5 + 0.5
giving the final result Wp = 1.04.
The standard working time retrieved from the available directories, taking into account average working conditions, is 0.769 m2/w-h. Therefore, taking into account the conditions determined in Table 5, the productivity of the worker should be 0.800 m2/w-h.
The correctness of the mathematical model of productivity of construction workers was supported by a statistical comparative analysis between empirical and theoretical results. For this purpose, 236 measurements were made on various construction sites. The research was conducted for a dozen or so different works for several groups of construction works: reinforcement works (ceilings, walls), carpentry works (walls, ceilings, poles), bricklaying work, finishing works (laying of cladding of steps, filling flat surfaces, laying linings of landings and corridors, assembly of plinths).
All results of empirical studies were subjected to the Shapiro-Wilk normality test in order to check the data for approximation to the normal distribution. Then, basing on the result obtained which determined the logical value of the null hypothesis about the normality of data, Spearman’s rank correlation coefficient (rejected null hypothesis) or Pearson’s coefficient (the null hypothesis not rejected). Correlation studies between the empirical results and the results obtained through the model operation indicate the existence of strong links between them using the base values of the coefficients of factor influence on the productivity of construction workers.
Of the listed works, only for one was an (at least) moderate correlation not specified. The results of statistical activities confirmed the correctness of the model’s operation.

4. Discussion

In the literature we can find a considerable number of mathematical models capable of predicting productivity of construction workers. However, the models are usually developed and verified for the selected scope of construction works and include only a few selected factors affecting the productivity level. The complicated mathematical methods used in models often discourage users in applying the models in practice.
The novelty of the approach proposed by the authors is rooted in taking into account various factors that have the potential to influence the productivity of construction workers. On the basis of an analysis of the literature, 17 factors having a fundamental impact on the productivity of construction workers were selected, analyzed and introduced to the model.
The study has developed a formula for determining the productivity of construction workers, which can be used for a variety of construction works. The effect of the calculations is: to predict the amount of work done by the workers; to evaluate the ability to complete the task within the time limit set in advance; to indicate the factors that negatively affect the productivity for verification purposes; and to improve and enable the use of the results in establishing bonus systems and wage differentiations.
The development of the mathematical model requires more work. The present model needs more empirical tests on the construction site. Testing the model for construction of various sizes, scope and specificity of construction works will allow it to adapt to various conditions, while increasing its universality.
Building a database of coefficients of the degree of influence on the productivity of construction workers, depending on the type of work, is planned in future research. It will be developed on the basis of one of the existing classifications of construction tasks. Creating an application supporting personnel decision making on construction sites related to the employed construction workers is being considered, along with the possibility of using the elements of building information modeling technology to describe labor inputs.

5. Conclusions

The aim of this study was to build a mathematical model of the productivity of construction workers. It does so by selecting 17 factors that influence the productivity of construction workers and categorising them into five groups. For the mathematical description of the factors, fuzzy logic was used. Each of the factors was analyzed separately and the effect was to develop a membership function, which in the near way reflects its impact on productivity. To illustrate the course of the analysis, this paper presents its details regarding only one factor, which is the age of the worker.
The next step in the study was to determine the impact of the identified factors on worker productivity. The results of the survey were used to determine this. The survey covered a total of 142 respondents, comprising both supervisors (66 people) and construction workers (76 people). Such an assignment becomes the basis for further inference concerning the degree of influence that individual factors have on the productivity of construction workers. As the collected survey results proved statistically significant, a basic set of degree of influence coefficients was created. The analysis of responses allowed four characteristic groups to be specified.
The next step, aimed at the simplification of the work productivity model, involved the assignment of weight coefficients to the particular group of factors. This was conducted on the basis of fuzzy set theory. The singleton sharpened form of the Likert scale was used, which allowed the assigning of values from the set <0, 0.25, 0.5, 0.75, 1> to individual groups of factors. Since there were no factors with a very small degree of influence on workers’ productivity, the subsequent analysis excluded this group. A formula for calculating the work productivity of construction workers is proposed.
Verification of the model confirmed its capability of analyzing, evaluating, and predicting the productivity of construction workers with satisfying accuracy.

Author Contributions

The individual contribution and responsibilities of the authors were as follows: J.M.: conceptualization, methodology, data curation; E.P.: conceptualization, literature review, writing—original draft preparation, writing—review and editing; M.J.: formal analysis, investigation, writing—review and editing.

Funding

This research received no external funding.

Conflicts of Interest

The authors declare no conflict of interest.

References

  1. Juszczyk, M.; Leśniak, A.; Zima, K. ANN based approach for estimation of construction costs of sports fields. Complexity 2018, 2018, 11. [Google Scholar] [CrossRef]
  2. Leśniak, A.; Juszczyk, M.; Piskorz, G. Modelling delays in bridge construction projects based on the logit and probit regression. Arch. Civ. Eng. 2019, 65, 107–120. [Google Scholar] [CrossRef]
  3. Hoła, B.; Nowobilski, T. Analysis of the influence of socio-economic factors on occupational safety in the construction industry. Sustainability 2019, 11, 4469. [Google Scholar] [CrossRef]
  4. Halligan, D.W.; Demsetz, L.A.; Brown, J.D.; Pace, C.B. Action-response model and loss of productivity in construction. J. Constr. Eng. Manag. 1994, 120, 47–64. [Google Scholar] [CrossRef]
  5. Moselhi, O.; Khan, Z. Significance ranking of parameters impacting construction labor productivity. Constr. Innov. 2012, 12, 272–296. [Google Scholar] [CrossRef]
  6. Hwang, B.; Soh, C.K. Trade-level productivity measurement: Critical challenges and solutions. J. Constr. Eng. Manag. 2013, 139, 04013013. [Google Scholar] [CrossRef]
  7. Yi, W.; Chan, A.P.C. Critical review of labor productivity research in construction journals. J. Manag. Eng. 2014, 30, 214–225. [Google Scholar] [CrossRef]
  8. Nguyen, H.T.; Nguyen, L.D. Relationship between building floor and construction labor productivity. Eng. Constr. Arch. Manag. 2013, 20, 563–575. [Google Scholar] [CrossRef]
  9. Panas, A.; Pantouvakis, J.P. Evaluating Research Methodology in Construction. Built Hum. Environ. Rev. 2010, 3, 63–85. [Google Scholar]
  10. Smith, S.D. Earthmoving productivity estimation using linear regression techniques. J. Constr. Eng. Manag. 1999, 125, 133–141. [Google Scholar] [CrossRef]
  11. Sander, S.R.; Thomas, H.R. Masonry productivity forecasting model. J. Constr. Eng. Manag. 1993, 119, 163–179. [Google Scholar] [CrossRef]
  12. Thomas, H.R.; Sakarcan, A.S. Forecasting labor productivity using the factor model. J. Constr. Eng. Manag. 1994, 120, 228–239. [Google Scholar] [CrossRef]
  13. Zayed, T.M.; Halpin, D.W. Pile Construction Productivity Assessment. J. Constr. Eng. Manag. 2005, 131, 705–714. [Google Scholar] [CrossRef]
  14. Fayek, A.R.; Oduba, A. Predicting Industrial Construction Labor Productivity Using Fuzzy Expert Systems. J. Constr. Eng. Manag. 2005, 131, 938–941. [Google Scholar] [CrossRef]
  15. El-Rayes, K.; Moselhi, O. Impact of Rainfall on the Productivity of Highway Construction. J. Constr. Eng. Manag. 2001, 127, 125–131. [Google Scholar] [CrossRef]
  16. Song, L.; AbouRizk, S.M. Measuring and Modeling Labor Productivity Using Historical Data. J. Constr. Eng. Manag. 2008, 134, 786–794. [Google Scholar] [CrossRef]
  17. Portas, J.; AbouRizk, S.M. Neural network model for estimating construction productivity. J. Constr. Eng. Manag. 1997, 123, 399–410. [Google Scholar] [CrossRef]
  18. Choy, E.; Ruwanpura, J.Y. Situation Based Modeling for Construction Productivity. Can. J. Civil. Eng. 2006, 33, 1585–1600. [Google Scholar] [CrossRef]
  19. Hanna, A.S.; Peterson, P.; Lee, M.J. Benchmarking productivity indicators for electrical/mechanical projects. J. Constr. Eng. Manag. 2002, 128, 331–337. [Google Scholar] [CrossRef]
  20. Graham, D.; Smith, S.D. Estimating the productivity of cyclic construction operations using case-based reasoning. Adv. Eng. Inform. 2004, 18, 17–28. [Google Scholar] [CrossRef]
  21. Huang, R.; Chen, J.; Sun, K. Planning gang formwork operations for building construction using simulations. Automat. Constr. 2004, 13, 765–779. [Google Scholar] [CrossRef]
  22. Hsie, M. A model used in creating a work-rest schedule for labores. Automat. Constr. 2009, 18, 762–769. [Google Scholar] [CrossRef]
  23. Townsend, K.; Lingard, H.; Bradley, L.; Brown, K. Complicated working time arrangements: Construction industry case study. J. Constr. Eng. Manag. 2012, 138, 443–448. [Google Scholar] [CrossRef]
  24. Ahn, S.; Lee, S.; Steel, R.P. Effects of workers social learning: Focusing on absence behaviour. J. Constr. Eng. Manag. 2013, 139, 1015–1025. [Google Scholar] [CrossRef]
  25. Lee, H.S.; Shin, J.W.; Park, M.; Ryu, H.G. Probabilistic duration estimation model for high-rise structural work. J. Constr. Eng. Manag. 2009, 135, 1289–1298. [Google Scholar] [CrossRef]
  26. Zhao, J.; Zhu, N.; Lu, S.L. Productivity model in hot and humid environment based on heat tolerance time analysis. Build. Environ. 2009, 44, 2202–2207. [Google Scholar] [CrossRef]
  27. Helmer, O. Social Technology; Basic Books: New York, NY, USA, 1966. [Google Scholar]
  28. Chan, A.P.C.; Wong, F.K.W.; Wong, D.R.; Lam, E.W.M.; Yi, W. Determining an optimal recovery time after exercising to exhaustion in controlled climatic environment: Application to construction works. Build. Environ. 2012, 56, 28–37. [Google Scholar] [CrossRef]
  29. Bowen, P.; Edwards, P.; Lingard, H. Workplace stress experienced by construction professionals in South Africa. J. Constr. Eng. Manag. 2013, 139, 393–403. [Google Scholar] [CrossRef]
  30. Malara, J. Research on working time in the construction sector. Tech. Trans. 2014, 19, 169–175. [Google Scholar]
  31. Plebankiewicz, E.; Juszczyk, M.; Malara, J. Estimation of task completion times with the use of the PERT method on the example of a real construction project. Arch. Civ. Eng. 2015, 61, 51–62. [Google Scholar] [CrossRef]
  32. Chen, J.; Yang, L.; Su, M. Comparison of som-based optimization and particle swarm optimization for minimizing the construction time of a secant pile wall. Automat. Constr. 2009, 18, 844–848. [Google Scholar] [CrossRef]
  33. Gonzalez, V.; Alarcon, L.; Maturana, S.; Bustamante, J. Site management of work-in-process buffers to enhance project performance using the reliable commitment model: Case study. J. Constr. Eng. Manag. 2011, 137, 707–715. [Google Scholar] [CrossRef]
  34. Gouett, M.; Haas, C.; Goodrum, P.; Caldas, C. Activity analysis for direct-work rate improvement in construction. J. Constr. Eng. Manag. 2011, 137, 1117–1124. [Google Scholar] [CrossRef]
  35. Renna, P. Influence of maintenance policies on multi-stage manufacturing systems in dynamic conditions. Int. J. Prod. Res. 2012, 2, 345–357. [Google Scholar] [CrossRef] [Green Version]
  36. Russell, M.M.; Howell, G.; Hsiang, S.M.; Liu, M. Causes of time buffers in construction project task duration. J. Constr. Eng. Manag. 2014, 140, 325–336. [Google Scholar] [CrossRef]
  37. Wambeke, B.W.; Hsiang, S.M.; Liu, M. Causes of variation in construction project task starting times and duration. J. Constr. Eng. Manag. 2011, 9, 663–677. [Google Scholar] [CrossRef]
  38. Chao, L.C. Fuzzy logic model for determining minimum bid markup. Comput.-Aided Civ. Infrastruct. Eng. 2007, 22, 449–460. [Google Scholar] [CrossRef]
  39. Tah, J.H.M.; Carr, V. A proposal for construction project risk assessment using fuzzy logic. Constr. Manag. Econom. 2000, 18, 491–500. [Google Scholar] [CrossRef]
  40. Taylor, P. Employment Initiatives for an Ageing Workforce in the eu15; European Foundation for the Improvement of Living and Working Conditions: Dublin, Ireland, 2006.
  41. Naegele, G.; Walker, A. A Guide to Good Practice in Age Management; European Foundation for the Improvement of Living and Working Conditions: Dublin, Ireland, 2006.
Figure 1. Graphic interpretation of the fuzzy value of the membership function to the high productivity sets for the worker’s age factor.
Buildings 09 00240 g001
Figure 2. Shapes of the membership functions for factors: (a) with the membership functions described as linguistic values; (b) noise; (c) duration of the work shift; (d) regeneration of strength; (e) precipitation; (f) wind; (g) air temperature; (h) worker’s absence; (i) adaptation to new working conditions.
Buildings 09 00240 g002
Table 1. Classification of the factors affecting labour productivity.
Factor GroupFactorsStudy
Time spent outside workworker’s absenceHsie (2009) [22]; Ahn et al. (2013) [24]
time spent with the family (WLB)Townsend (2012) [23]
Weather conditionsair temperatureMoselhi and Khan (2012) [5]; Lee et al. (2009) [25]; Zhao et al. (2009) [26]
wind
precipitation
Psychophysical conditionsstressBowen et al. (2013) [29]
fatigueBowen et al. (2013) [29]
healthHelmer (1996) [27]
ageHelmer (1996) [27]
recoveryChan et al. (2012) [28]
Organization and management of the workerergonomics
noise
duration of work shift
salary
organization of work and workstations
Malara (2014) [30]; Plebankiewicz et al. (2015) [31]
Remaining factorsday of the week
adaptation to new operating conditions or a new technology
Malara (2014) [30]
Table 2. Assigning average survey values to the factors identified.
Factor NumberFactor NameAverage Value
c1Ergonomics4.01
c2Noise3.65
c3Duration of work shift 3.20
c4Salary4.51
c5Organization of the workstations4.17
c6Stress3.38
c7Fatigue4.18
c8Health4.27
c9Age of the worker3.83
c10Recovery of strength3.09
c11Precipitation3.49
c12Air temperature 3.49
c13Wind3.49
c14Time spent with the family3.16
c15Worker’s absence3.16
c16Day of the week3.65
c17Adaptation to new operating conditions3.73
Table 3. The division of the degree of factor influence on individual groups.
Group Name—Influence on Work Performance of Construction WorkersLowAverageHigh (Important)Very High (Very Important)
Factors assignedc3, c10, c14, c15c2, c6, c9, c11,
c12, c13, c16, c17
c1, c5, c7, c8c4
Weight coefficient0.250.50.751
Table 4. Examples of interval values dependent on exponent y.
y00.250.50.7512345
z110.840.710.590.50.250.130.060.03
z211.111.221.361.52.253.385.067.59
Table 5. Results of calculation of function values.
Factor SymbolFactor NameMeasurement ResultFunction µA(ci) Value
c1Ergonomicsgood0.75
c2Noiseapprox. 78 dB0.2
c3Duration of work shift9 h1
c4Salarygood0.8
c5Organization of the workstationsgood0.8
c6Stresslow0.8
c7Fatiguehigh0.25
c8Healthaverage0.5
c9Age of the workerapprox. 42 years1
c10Recovery of strength8%0.28
c11PrecipitationN/A1
c12Air temperature 8 °C0.33
c13Wind5 m/s0.5
c14Time spent with the family2 days1
c15Worker’s absence1 workday0.2
c16Day of the weekThursday0.88
c17Adaptation to new operating conditions2nd day0.07

