Article

A Production Model for Construction: A Theoretical Framework

Department of Civil and Environmental Engineering, University of Auckland, 20 Symonds Street, Auckland 1142, New Zealand
*
Author to whom correspondence should be addressed.
Buildings 2015, 5(1), 209-228; https://doi.org/10.3390/buildings5010209
Submission received: 3 December 2014 / Revised: 13 February 2015 / Accepted: 15 February 2015 / Published: 3 March 2015

Abstract

:
The building construction industry faces challenges, such as increasing project complexity and scope requirements, but shorter deadlines. Additionally, economic uncertainty and rising business competition with a subsequent decrease in profit margins for the industry demands the development of new approaches to construction management. However, the building construction sector relies on practices based on intuition and experience, overlooking the dynamics of its production system. Furthermore, researchers maintain that the construction industry has no history of the application of mathematical approaches to model and manage production. Much work has been carried out on how manufacturing practices apply to construction projects, mostly lean principles. Nevertheless, there has been little research to understand the fundamental mechanisms of production in construction. This study develops an in-depth literature review to examine the existing knowledge about production models and their characteristics in order to establish a foundation for dynamic production systems management in construction. As a result, a theoretical framework is proposed, which will be instrumental in the future development of mathematical production models aimed at predicting the performance and behaviour of dynamic project-based systems in construction.

Graphical Abstract

1. Introduction

The construction industry faces ongoing challenges. From an external perspective, economic uncertainty, increased competition within the industry and the growing influence of regulatory agencies drive profit margins down. From an internal viewpoint, the increase in the numbers of features in a project’s scope, against shorter construction deadlines and restricted budgets raise the complexity of building construction projects. Additionally, building construction often occupies the bottom of industrial productivity rank reports worldwide [1], even showing negative productivity rates [2]. The construction sector relies on management practices based on intuition, experience and poor risk management. These practices often preclude the appropriate level of ability to handle the uncertainty and complexity [3,4] involved in construction projects, resulting in project failures in terms of finishing projects within deadlines and budgets [5]. As a common practice, the building construction industry utilizes ordinary project management practices and frameworks. Practices are limited to assessing the consequences of deviations from the project plan rather than dealing with the causes of delays in the production system [6]. “Heisenberg’s principle indicates that the conventional construction management practice of measuring the overall timeliness and budgetary status (position) of a project using schedule/cost variances will result in a less precise assessment of the throughput (momentum) of the project” [4]. At the tactical management level, little attention has been paid to production management in building and construction [7]. Traditional scheduling approaches in construction, such as the critical path method, have been used unrestrictedly, producing unfinished and erratic plans [4]. Even more, a developed estimation practice, such as the line of balance, fails to deliver a reliable outcome. Instead of being derived from manufacturing practices, the line of balance was purely copied regardless of the inherent production differences between manufacturing and construction projects. Both approaches assume that construction processes are constant with some degree of variability, setting constant estimation values for production and adding an extra measure to accommodate variations. In summary, the dynamics of the production system is overlooked [8]. In fact, the building construction industry has no history of applying mathematical approaches to model and manage production [9]. Mathematical models have enabled a comprehensive understanding of production mechanisms [10]. For instance, manufacturing has a record of successfully developing and using robust mathematical models to improve productivity, system comprehension and event forecasting [11,12]. Nevertheless, the manufacturing model does not directly apply to construction. Steady-state conditions, nonterminating events, long production runs, medium to low levels of uncertainty and permanent production facilities characterize production in manufacturing [12]. Production in construction takes place under a mix of steady- and unsteady-state conditions, with terminating events, short production runs and various levels of uncertainty, all conducted in temporary production facilities [13,14,15].
The impacts of World War II in Japan restricted market demand and the production model. Mass production changed to the production of a high variety of products in small quantities. Moreover, in order to adapt to the post-war scenario of the financial incapability of acquiring new machinery, the Japanese industry had to work with the existing production equipment in a more efficient manner. The new diversified small-batch production and post-war recession pushed the industry to re-evaluate the use of resources and production methods and resulted in a shift in production paradigms in the manufacturing industry. Consequently, a new production model should be developed to increase productivity while using existing resources. The production philosophy named just-in-time (JIT) together with automatization established the foundations of the Toyota Production System (TPS) in 1945. TPS is a compilation of observations from Taiichi Ohno and Shigeo Shingo and driven by Toyota’s goal of “catching up” with the American automotive industry. TPS only received notable exposure during the oil crisis in the autumn of 1973, when the improvements brought by the relentless elimination of waste helped Toyota through the Japanese economic crisis [16]. In an attempt to reproduce the success achieved by Toyota, the automotive industry adopted TPS as a production model and then forged a new manufacturing philosophy, later entitled “lean manufacturing” [17]. The lean principles—waste eradication, flow, value, value-stream and zero-defect—crossed the boundaries of manufacturing. These principles permeated several productive systems and industries, such as software development [18], even reaching business models [19]. At the same time, manufacturing was formulating mathematical explanations of production management. Studies about the variables of the productive process—a process is a repetitive collection of interrelated tasks aimed at achieving a specific goal—provided a quantitative meaning to production management practices in manufacturing. Equations could now represent queueing systems [10], lead time [20], machine maintenance [21], Kanban [22], inventory management [23], throughput, cycle time and work in progress [11]. The set of equations enabled a deeper understanding of the current practices and the outcomes of their interaction.
The building construction industry has also demonstrated interest in lean principles [7]; later named lean construction [24]. The transformation, flow and value generation views associated with a set of principles constitute the transformation-flow-value (TFV) theory of production. However, the implementation of lean principles has been sporadic, rather than an industry standard [25]. Several contradictions to the lean values, such as excessive consumption of raw material [26], disconnection of activities, preventing the establishment of a flow [7], a focus on costs over value [27], an inefficient measurement system [28], high levels of rework due to production errors or changes in technical specifications [29] and worker safety [30], still populate the list of the most common problems in construction endeavours. Inefficiency at the tactical level is only one barrier to the adoption of manufacturing principles. Intrinsic project characteristics also increase the challenges to the industry. Uniqueness—each project produces a distinct product, service or result with individual features of the project work [31]—temporality—“indicates that a project has a definite beginning and end” [32]—and uncertainty [32,33,34] are some attributes that set apart projects and manufacturing. As a matter of fact, even repetitive construction projects—projects characterized by repetitive activities, as, for instance, pipelines, tunnels, mass housing projects and high-rise buildings [35,36]—are exposed to the effects of uniqueness, temporality and uncertainty. Despite an insufficient pace to “catching up” with market demand, construction has progressed towards the incorporation of TPS practices [7] and an understanding of its production.
Construction has successfully comprehended the effects of variability in production [37] and the influence of buffers on sequential activities [38]. Researchers consistently advance the design and management of work-in-progress buffers. Additionally, approximate models can be obtained by approaches, such as discrete simulation [39], fuzzy logic [40], neural networks [41], statistics [42] and control theory [43]. However, the results are still theoretical and restrictively applied [15,44,45]. Moreover, obtaining mathematical expressions that quantitatively explain the production mechanisms of different repetitive construction projects has been a challenge [15,46] and is still to be formulated. Much work has been carried out on how manufacturing practices apply to construction projects, mostly lean principles. Nevertheless, there has been little research to understand the fundamental mechanisms of production in construction. The current knowledge is at a rudimentary stage and has not yet fully established the foundations of the production model in construction projects. This research entails an in-depth literature review to examine the existing knowledge about production models and their characteristics in order to establish a foundation for the production model in construction. This literature review does not intend to pursue lean construction or its production models. This study searches outside the construction scenario for best practices in production and then inside for the barriers to the implementation of these practices. The study retraces production characteristics from manufacturing that are applicable to building construction projects in order to obtain a similar system view that propitiates the development of manufacturing production laws, such as variability, conservation of material and capacity laws [11]. Furthermore, the concepts are reviewed from a microeconomic/strategic/tactical vantage point required for project management development, regardless of the project technical specificities. As a result, a theoretical framework, which may serve as a basis for the further development of a mathematical production model aimed at predicting the performance and behaviour of dynamic project-based production systems in construction is proposed.

2. A Theoretical Framework

2.1. A Brief Understanding of Construction

The understanding of what is construction extrapolates its technical characteristics. In this research, construction is not restricted to civil engineering and architecture, but comprehends a broader understanding of building, putting up, setting up, establishing and assembling. Construction is the materialization of a concept through design, taking into account functional requirements and technical specifications for a project product utilizing specialized labour. In other words, it is the creation of a product that will fulfil a strategic goal. This study excludes prototyping as the final product; however, a project scope may include prototyping as a deliverable or stage, as, for example, in the design phase. Prototype objectives test a process or concept in real situations and then provide information about what works and what needs improvement before the final product. In contrast to prototypes, the project product is final and definitive. Project products, according to the design specifications, have usability in a first and unique building. Project products of building construction are, for instance, software, pipelines, roads, bridges, tunnels, house building and oil well construction. In summary, project deliverables with different technical backlogs and fields of application are in accordance with the definition of construction stated in this study. Moreover, the existence of a technical backlog brings a dimension of repetitiveness. Because these projects require specialized labour, the project executive is likely to be involved in projects with a similar technical background. For instance, an offshore oil well construction company is more likely to have future endeavours in the same technical field rather than in a road building. In this case, the repetitiveness occurs horizontally across different projects with a similar scope. A project can also have repetitiveness within an endeavour: for instance, the construction of similar products, such as housing units, floors of a skyscraper or the installation of cases in an oil well. These processes illustrate a vertical dimension of repetitiveness, i.e., process repetition in a unique project.
In order to understand how construction applies to different fields and where construction is placed in project life cycles, ten different project management frameworks were analysed. Figure 1 displays the organization of several project-driven approaches in four clustered stages grouped by fundamental characteristics. The initial stage (feasibility) consists of a group of processes aimed at identifying the best possible solution to achieve the strategic business goal intended by the project sponsor. Additionally, these processes should determine if the project product corresponding to the selected solution can actually be built or created (several applicable practices can be found in [47]). The second stage (design) presents a group of processes where the project and technical teams examine the outcome of the feasibility stage. The teams produce design specifications and project plans that contain the information about how to make a suitable project product based on the best possible solution. The next stage (construction) is to build the product following the technical instructions and executing the management plans from the previous stage. The final step (operation) is delivering the finished product to the user, who will use the project product to generate the benefits and consequently achieve the benefits of the business goal [34]. Operation is not considered a project stage, although the beginning of this stage commonly determines the termination of the project life cycle [31].
Figure 1. Characteristics of project stages (projects stages of various approaches adapted from Smith, Merna and Jobling [48], originally from McGetric, The Project Life Cycle, 1996). For additional information about the Project in Controlled Environment (PRINCE) and Association for Project Management Book of Knowledge (APM BoK), refer to [34] and [49], respectively.
Buildings 05 00209 g001

2.2. Production Facilities

The project takes place in different locations through the three project stages (feasibility, design construction) and is frequently related to where the main phase stakeholders are located. First, it originates from strategic demand, and feasibility studies take place where the sponsor is located. At this stage, the management has recognized that normal operation is unable to address a particular business requirement [50]. Consequently, the management sponsors a unique endeavour to address this outstanding business requirement, initiating the project. Once initiated, it is up to the sponsor to choose the best solution and investment to solve the issue. Altogether, the feasibility stage is likely to occur as an internal business routine.
Project and product design require strong technical knowledge, which is usually not the sponsor’s forte, since the initial motive for the project’s existence is the inability of routine operations to accomplish a specific business requirement [50]. Hence, it may be necessary for a specialist third party to join the project and develop the technical features, collect all requirements, and plan and design the project product to execution. For this reason, the design stage tends to move from the project sponsor’s office to third party offices with regular interaction between stakeholders. Thus, the influence of stakeholders is less than at the previous stage [51].
Similar reasoning about technical development is valid for the construction stage, where each task of the construction plan often requires either a specialist in the trade or a contractor. For this reason, work packages are broken down and distributed to several independent third parties. Frequently, these third parties are only connected to each other by the current project, without a prior collaboration background between the companies or teams involved. The location, where the final project product takes place, is undoubtedly a strategic decision. Nevertheless, the work packages of the project may be produced in different facilities, on-site or off-site. The work packages are spread and distributed to suppliers according to the project procurement management plan [25] and are, in general, produced in facilities subject to the supplier’s business model, rather than the project owner’s choice. Again, the influence of stakeholders is diminished [51]. The production facility is distinctively important, because this stage gathers most of the resources and labour needed for building the project product as designed and planned. This resource convergence is responsible for the majority of expenditures in the project [25,31], and it reveals any faults and inaccuracies of the plan developed in previous project stages.
Clients perceive several benefits of off-site production over on-site [52]. Benefits, such as production time, quality and safety, are often mentioned. Interestingly, the most important benefit of off-site production is not being executed on-site. In the rank of benefits, according to importance and likelihood, the top three answers refer directly or indirectly to the reduction of activity on-site. The benefits from the highest to lowest rating are: minimize on-site operation; reduce congested work areas; and multi-trade interfaces to minimize on-site duration [52,53]. Construction’s on-site production implies challenging logistics. The location of a construction site solely depends on the final user needs, which are different from manufacturing, where the choice of factory location fulfils strategic logistic goals of product distribution and supplier connection. From a logistic perspective, “the delivery is to a temporary location, without permanent facilities for handling material” [14]. The provisional storehouse complicates the employment of optimal delivery routes and connections to preferred suppliers, further hindering the formation of an efficient supply chain. Location may severely interfere with the supply chain. Depending on the construction site location, several nontechnical restrictions may apply. For instance, building a skyscraper in the city centre may require obeying municipal restrictions. Timetables and regulations for moving load, material delivery and dispatch and also additional safety procedures due to population proximity [54] may be necessary. On the opposite side, construction in isolated locations endures materials transportation, because of the long distances from suppliers and improper or even inexistent transportation routes [55]. A long distance from preferred suppliers often raises costs to a level where the chain becomes unfeasible, forcing executors to work with alternatives sources. New parties are most likely to experience a slower project learning curve than the usual partners, because previous involvements support the creation of both product and process know-how via lessons learned.
For the building construction industry, the supply chain is critical due to the excessive amount of raw materials required for product assembly [56]. Expressly in the construction phase, the raw materials need to arrive on-site in the correct amount and sequence, since there is a minimal warehouse installed on-site, which is incapable of handling massive amounts of material [57]. Arriving and queueing coordination is essential to not overload the warehouse nor starve the production line. Material surplus may impact how material flows to the production line, because overstocks may delay picking activities, further reducing the necessary space for cargo handling inside the warehouse. Starving the production line is more critical, since it may switch off the production line or part of it.

2.3. Production Run

By definition, the short run is the window frame when steady factors drive production. Moreover, the addition of capital is not possible, so increased output requires more labour [58]. Scope, budget and schedule constraints are core characteristics of the production of projects [31], i.e., steady factors that restrict the amount of work, the addition of capital and the project execution time frame. On a short production run, as in projects, the deadline, budget and total number of units to produce (scope) are clear from the beginning. Although clearly and explicitly stated in the project scope, the estimations of these constraints are, unfortunately, not always realistic. In contrast, a long production run is unclear about both the production end and total units to produce, thus relying on forecasts and market conditions [59]. For instance, upstream oil production rig expects, based on the oil prospect, to extract a set number of oil barrels in a set time. This notwithstanding, the extraction from the reservoir will continue until the extinction of oil or until its operation becomes unfeasible.
Consequently, the average cost (cost/units) [59] for a short production run is more accurate than for the long run, because the units to be produced can be considered constant. Initially, the long run (forecasted units) has a higher potential risk than the short run (exact units) for the same total cost. However, the long run may produce more units than the forecasted number, creating a more favourable cost/units relation [59]. Moreover, the short-run production aggregates higher costs per unit than long-run production, because the number of units to produce is much smaller than on that for long-run production. This value concentration makes short-run production more sensitive to risk in the case of unit variation. In other words, the expected value is higher because the risk impact is higher for the same risk probability (expected value = risk probability × impact) [60]. In summary, short-run production has a lower potential risk, but requires more accuracy, because value concentrates in the production units. Consequently, small variations in labour may affect production and the overall cost.

2.4. Event Termination

Projects by definition are finite terminating endeavours [31,34]. There are some divergences in the literature [31,33,34] about when exactly a project starts, although the termination is clear. The handover to the user sets the final milestone of product construction, marking the project’s end. Any activities later on relate to project documentation and formal closure. Considering every stage, deliverable or activity startup and ending, the system (in this study, the project) receives several sequential on and off switches. These interruptions cause work fragmentation [42]. This fragmentation implies numerous transient states, i.e., a timeframe in which the system is either adapting to a state change or responding to a disturbance, e.g., after the impact of a risk. Such variation may affect the state condition of production, changing the production state from a steady- to unsteady-state condition.

2.5. State Condition

Projects involve a unique state change [61]. During project execution, the amount of work is variable and concentrated on the “carrying out the work” stage [31]. Consequently, initial and final project stages are low-speed regions. The project velocity [31,62,63] increases from zero, at project start, accelerating to its maximum at the execution stage and then slowing down to a full stop at project end. However, the velocity variation is not the determinant of the state condition of the system. The variation, or not, over time of the relation of different properties that generate the system output from the input set the state condition of that system. Therefore, the system is in a steady-state when several properties are invariant over time [64]. Once these properties are invariant, the steady-state condition gives a means to the development of simple mathematical equations. For instance, in the steady-state, average work output is strictly less than average capacity, as claimed by the law (capacity) in manufacturing [11]. The law (capacity) does not directly apply to projects. Projects have a distinctive outcome, involving different teams with different technical knowledge and learning curves [65]. Regarding the production system of the project, these properties alter the output/input relation over time, which is the main characteristic of unsteady-state systems [15]. As a consequence, projects assume the unsteady-state condition. However, parts of the project—stages, deliverables, activities or processes—might assume a steady- or unsteady-state depending on process repetitiveness [13], variability and the conservation of process properties over time.

2.6. Complexity

Vastly present in the literature, the word “complex” seems to stand for a supernatural force supposedly responsible for disturbances, a scary ghost haunting projects. With no absolute definition of what complexity means, the only consensus among researchers is that there is no agreement about the specific definition of complexity [66]. However, a characterization of what is complex is possible. A structure is complex; if composed of several interconnected pieces [67], with dynamic networks of interactions, and their relationships are not aggregations of the individual static entities [68]. A theory derived from chaos theory follows a similar principle: “The complexity theory states that critically interacting components self-organize to form potentially evolving structures exhibiting a hierarchy of emergent system properties” [69]. Both statements point to the interaction between the internal structures as complexity characteristics.
Projects are complex. Projects involve several interrelated stakeholders, deliverables [70] and activities [71] in order to deliver a strategic state change [61,72]. Given that, projects, in a broad definition, show the characteristics of what is complex. Methods to assess, classify and measure project complexity have been discussed in the literature [69,73,74,75]. Most methods are restricted to computations involving scheduling and activity relationships [73,76,77]. Although these models provide a relative comparison of the complexity of similar projects in the same industry, they fail on a broader scale. The analytical hierarchy process (AHP) [78] provides a more inclusive and simple approach to complexity evaluation. AHP can assess a set of pre-chosen project criteria of a variety of projects, providing a calculated numerical grade from zero to one for complexity comparison [74]. Despite the fact that it is possible to use AHP to congregate projects into clusters, such a study does not exist. As a consequence, no explicit information comparing the complexity of projects in building construction with other industries could be traced.

2.7. Uncertainty

Similarly to complexity, there is no consensus about a pure definition of uncertainty. Uncertainty is an unintelligible expression without a straightforward description. Keynes was the first economist to incorporate uncertainty as a theory pillar, adding a factor of distrust to economic science. Keynes’ studies explored how to be rational in an uncertain world, in what degree and how to specify uncertainty (refer to Mello [79] about Keynes’ life and work). Later, Keynes studied the nature and effect of uncertainty on statistics. “Human decisions affecting the future, whether personal or political or economic, cannot depend on strict mathematical expectation since the basis for making such calculations does not exist” [80]. In the final analysis, uncertainty is beyond any prediction, forecast, calculation or measurement notably when considering human behaviour [49]. The main reason for the existence of a project is to achieve the value perceived by the stakeholders [33,34,49,61,72]. Nevertheless, value is relative [65]. Therefore, internal and external, direct and indirect stakeholders may have a different perception of the achieved project business outcome depending on their vantage points and individual backgrounds [17,65,81]. That, according to Keynes, is a fertile soil for uncertainty. Inevitably, projects are conducted in an uncertain scenario.

2.8. Risk

The viewpoint of uncertainty and risk vary from different disciplines [82]. However, uncertainty is not risk [83]. While uncertainty is a potential, unpredictable, unmeasurable and uncontrollable outcome [83,84], risk is a consequence of action taken in spite of uncertainty [85]. As an illustration, two men are about to skydive from an airplane, but there is only one parachute on-board. At this point, the level of uncertainty experienced by the men is equal, as to whether or not the parachute will open. The moment that one man chooses jumping, the uncertainty is the same to both, and he bears all the risk. The uncertainty ceases when the parachute opens during the skydiving, through time passing, event and action. Nevertheless, there is still risk regarding a safe landing even after uncertainty about the parachute opening has come to an end [85]. Similarly, in projects, the decrease of uncertainty and risk through time passing applies [86].
Projects are risky. The action of conducting an endeavour upon uncertainty is the intrinsic nature of risk [83,84]. Hence, dealing with risk is crucial in project management to achieve successful business results [31]. Controlling uncertainty is impossible [80,83]. However, it is possible to identify, measure, and formulate plans to transfer, provoke, mitigate, avoid or embrace the impact of risk [84], i.e., manager risk. Risk management’s objective is to assure uncertainty does not deviate the project from the business goals [84]. In detail, risk managers triumph by maximizing opportunities, minimizing threads and hedging against the risk of a contingent, uncertain loss [87]. The primary manoeuvring instrument against uncertainty is the contingency plan [88], whose determination counts on the summation of expected value [60]. The contingency plan consists of the probability of risk occurring multiplied by the financial impact if it occurs [60] plus an amount judged sufficient to handle unforeseen risks. In addition to the contingency plan, calculating how the contingency could spread over the project lifespan is paramount, especially in projects with a high concentration of events, such as construction projects. Value-at-risk (VaR) “describes the quantile of the projected distribution of gains and losses over the target horizon” [87]. In other words, VaR forecasts the expected value distributed across the project life, so the expected value can be used as a buffer to possible variations, positive or negative, in the project plan.

2.9. Variability

Variability is a measurement of variation, i.e., the difference between results. Variability expresses a dataset that is clustered [89]. Risk impact causes variability, as more risk motivates a broader span of “potential scenarios of outcomes” [85]. The impacts of variability in construction production processes are well known and proven as a decrease in productivity [37], scheduled delays and cost overrun [38]. Considering short runs, the manipulation of the production output requires the administration of labour as an input. Hence, the understanding of the relation between labour and productivity potentially enables the control of production. However, correlating variability to labour is challenging. In statistics, the productivity of labour in building construction does not fit a normal distribution; provided that the variance is undefined, the curvature is leptokurtic [90]. Leptokurtosis may influence the productivity of labour analysis, while estimations made using a normal distribution overestimate at low levels of significance and underestimate at high levels of significance. The wider end of a leptokurtic distribution means risk is coming from outlier events, and extreme observations are likely to occur.
Projects are extremely exposed to variability caused by risk. On the one hand, the short-run production nature of projects requires the manipulation of labour input to control the output [91]. Labour is a prominent human factor in construction projects [42] and a primary source of uncertainty [80], which translates into an increase of risk probability. On other hand, the short-run production concentration of the average cost contributes to an increasing of risk impact. Consequently, both factors—probability and impact—of the risk expected value are affected. In conclusion, at the occurrence of a risk event, a higher expected risk value implies a higher difference between the plan and the actual result, i.e., higher variability.

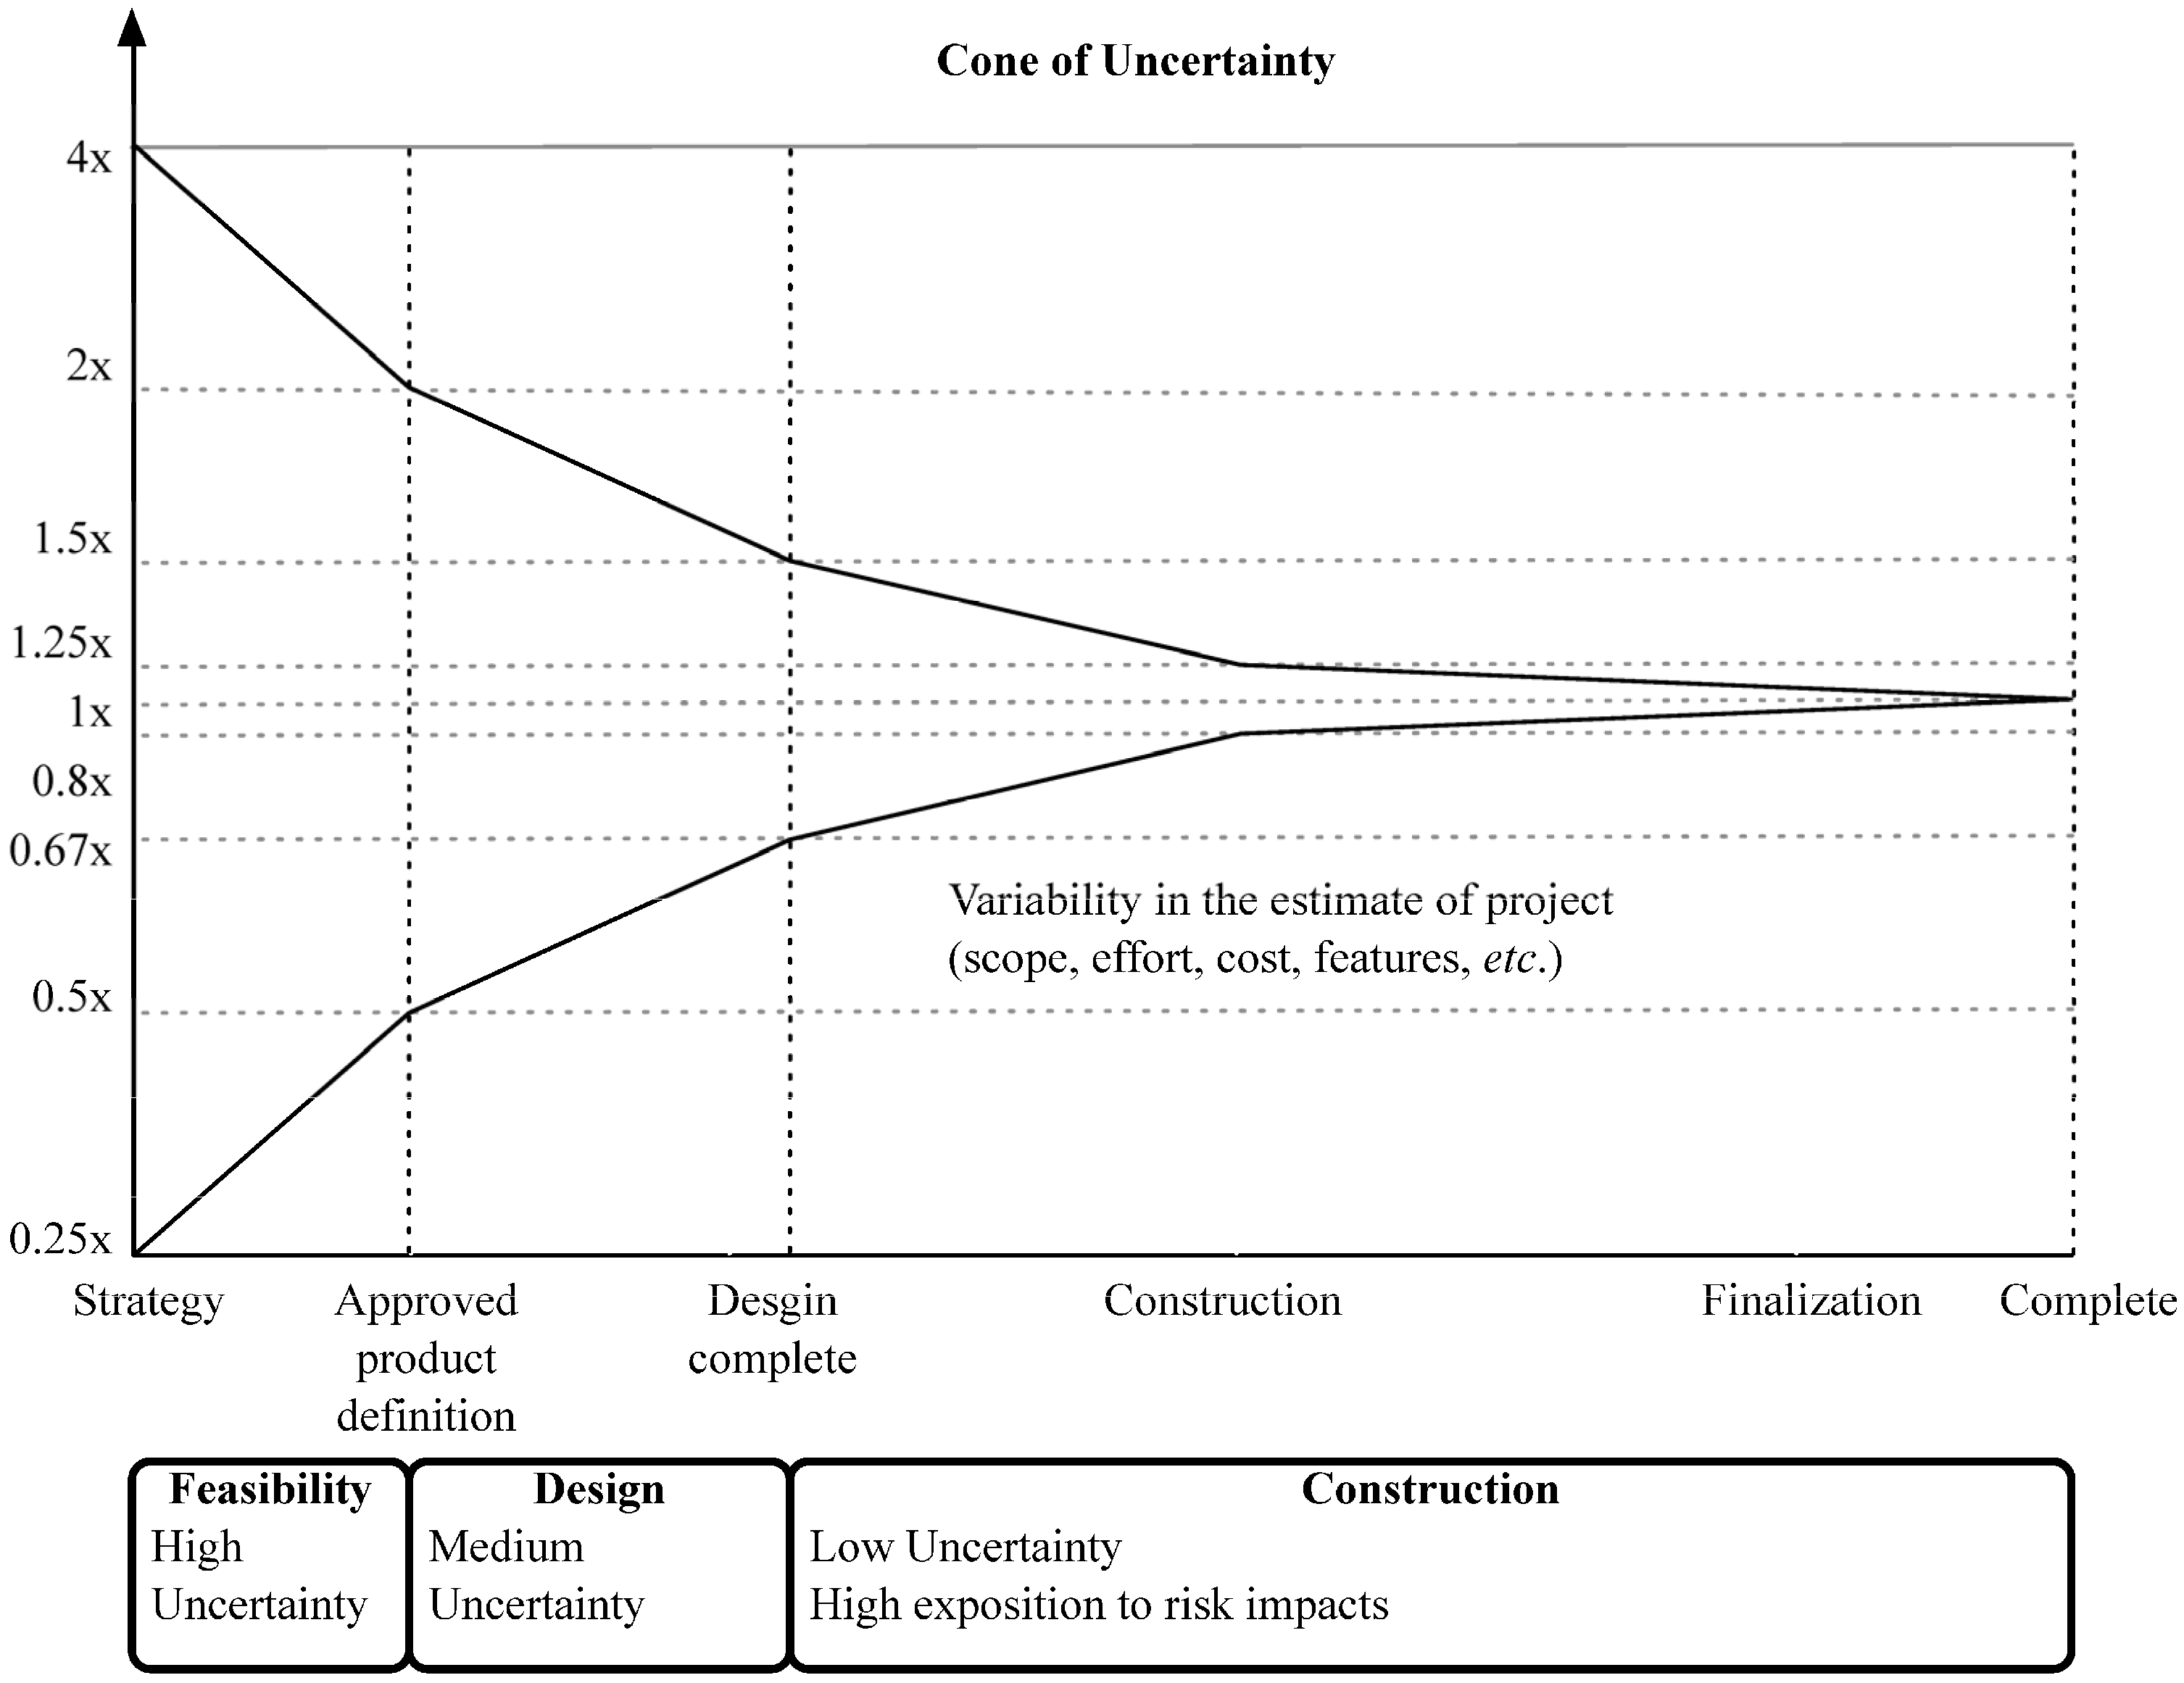
2.10. Cone of Uncertainty

Uncertainty not only decreases over time passing, but it also diminishes its impact by risk management, specifically by decision-making. In other words, the impact of uncertainty strongly depends on the decision of the risks taken. Researchers’ findings indicate that the project estimation builds on foreseen quantities of uncertain events distributed at several stages, resulting in the process of resolving decisions [92]. Figure 2 shows a decrease in variability and the consequent increase in the accuracy of estimates over project progression. Still, the cone does not form itself naturally. It is a product of various decisions made as the project progresses concerning the plan and product. Narrowing the cone implies removing sources of variability sooner. On the contrary, a wider cone results from later decisions [92]. Figure 3 presents a parallel analysis illustrating the impact of decisions made in early and late stages on possible cost reduction in construction projects. Hence, to protect subsequent events from variability and its effects, decisions should be made in early stages to narrow the range of possible later events that will impact the project and cause variability.
Figure 2. The cone of uncertainty for sequential project development (adapted from McConnell [92]).
Buildings 05 00209 g002
Experience from past projects supports decision-making. Commonly called “lessons learned” by project literature and practitioners, the term defines the practice of learning from successful and unsuccessful past events. Insights from assessing captured outstanding project events in post-project reviews can dramatically narrow the cone of future projects. Despite having a remarkable potential to reduce variability in a project, in practice the “lessons learned” process frequently ends with capturing the outstanding events [91], dismissing further steps. The likelihood of reusing lessons learned depends on their applicability to future projects and the similarity between projects, in other words, project receptiveness.
Figure 3. Graph of percentage cost over time demonstrating how early correct decisions may impact cost reduction (adapted from Smith et al., [50]).
Buildings 05 00209 g003

2.11. Repetitiveness

“Repetitive manufacturing is the production of discrete units in a high volume concentration of available capacity using fixed routings. Products may be standard or be assembled from standard modules. Production management is usually based on the production rate” [93]. Construction produces multiple products in low volume coupled with the process structured in the midway of the batch, matching the major stages of product and process life cycles from Spencer [93]. A construction production run is short and easily countable considering the final project product. Nonetheless, the project product or a deliverable may be broken into several units, creating an artificial repeatability. For instance, the installation of the windows on the World Trade Center One (or Freedom Tower) is unique and not repeatable. However, this deliverable can be subdivided into floors. Therefore, instead of one unique product, there are 94 repetitions of the same product of “windows installed by floor”. The deliverable can be subdivided even more. If each of the 21,800 windows to install is considered, the window installation process can be interpreted as very repetitive [94].
Repetitiveness provides the opportunity for greater use of lessons learned, inevitably proportionating improvement in processes and products. A high level of repetitiveness may propitiate continuous enhancements due to the product likeness, ease of measurement and comparison between construction cycles [35,93]. Formed by four basic sequential activities, plan-do-check-act (PDCA)—also known as Shewhart’s cycle—founded an unceasing circle of quality enhancement [31]. Likewise, Six Sigma, a set of techniques and tools for process improvement, aims for defect riddance and variability minimization [95]. At the sixth sigma level, processes in a state of statistical control expect no more than 3.4 defects per million opportunities. Additionally, the short-term process capability index (Cpk) is equal to two. These values typify a stable process almost free of variability. Consequently, processes at the sixth sigma level are steady state [96]. Measurement of Six Sigma levels can provide a useful form to qualify the state condition of the process. Higher Six Sigma levels correlate with a process at steady state (low variability), and lower six sigma levels correlate with the unsteady state (high variability). The levels of Six Sigma can be accurately calculated [96], as can the process variability. It is possible to establish a mathematical correlation between these variables, quantifying the state condition of a process through its variability. In summary, repetitiveness creates the opportunity for improvement based on the use of lessons learned, PDCA or Six Sigma and variability reduction through decreasing uncertainty and narrowing the cone of uncertainty earlier. In terms of system description, repetitiveness creates a feedback connection with activities or processes [11]. Furthermore, repetitiveness defines a closed loop system where deviations of past events may be used as input to correct and control [11] current and future system output.

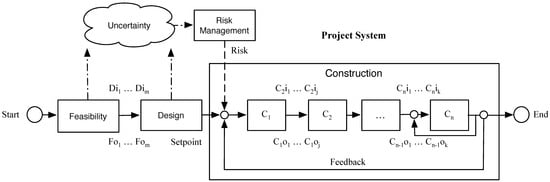
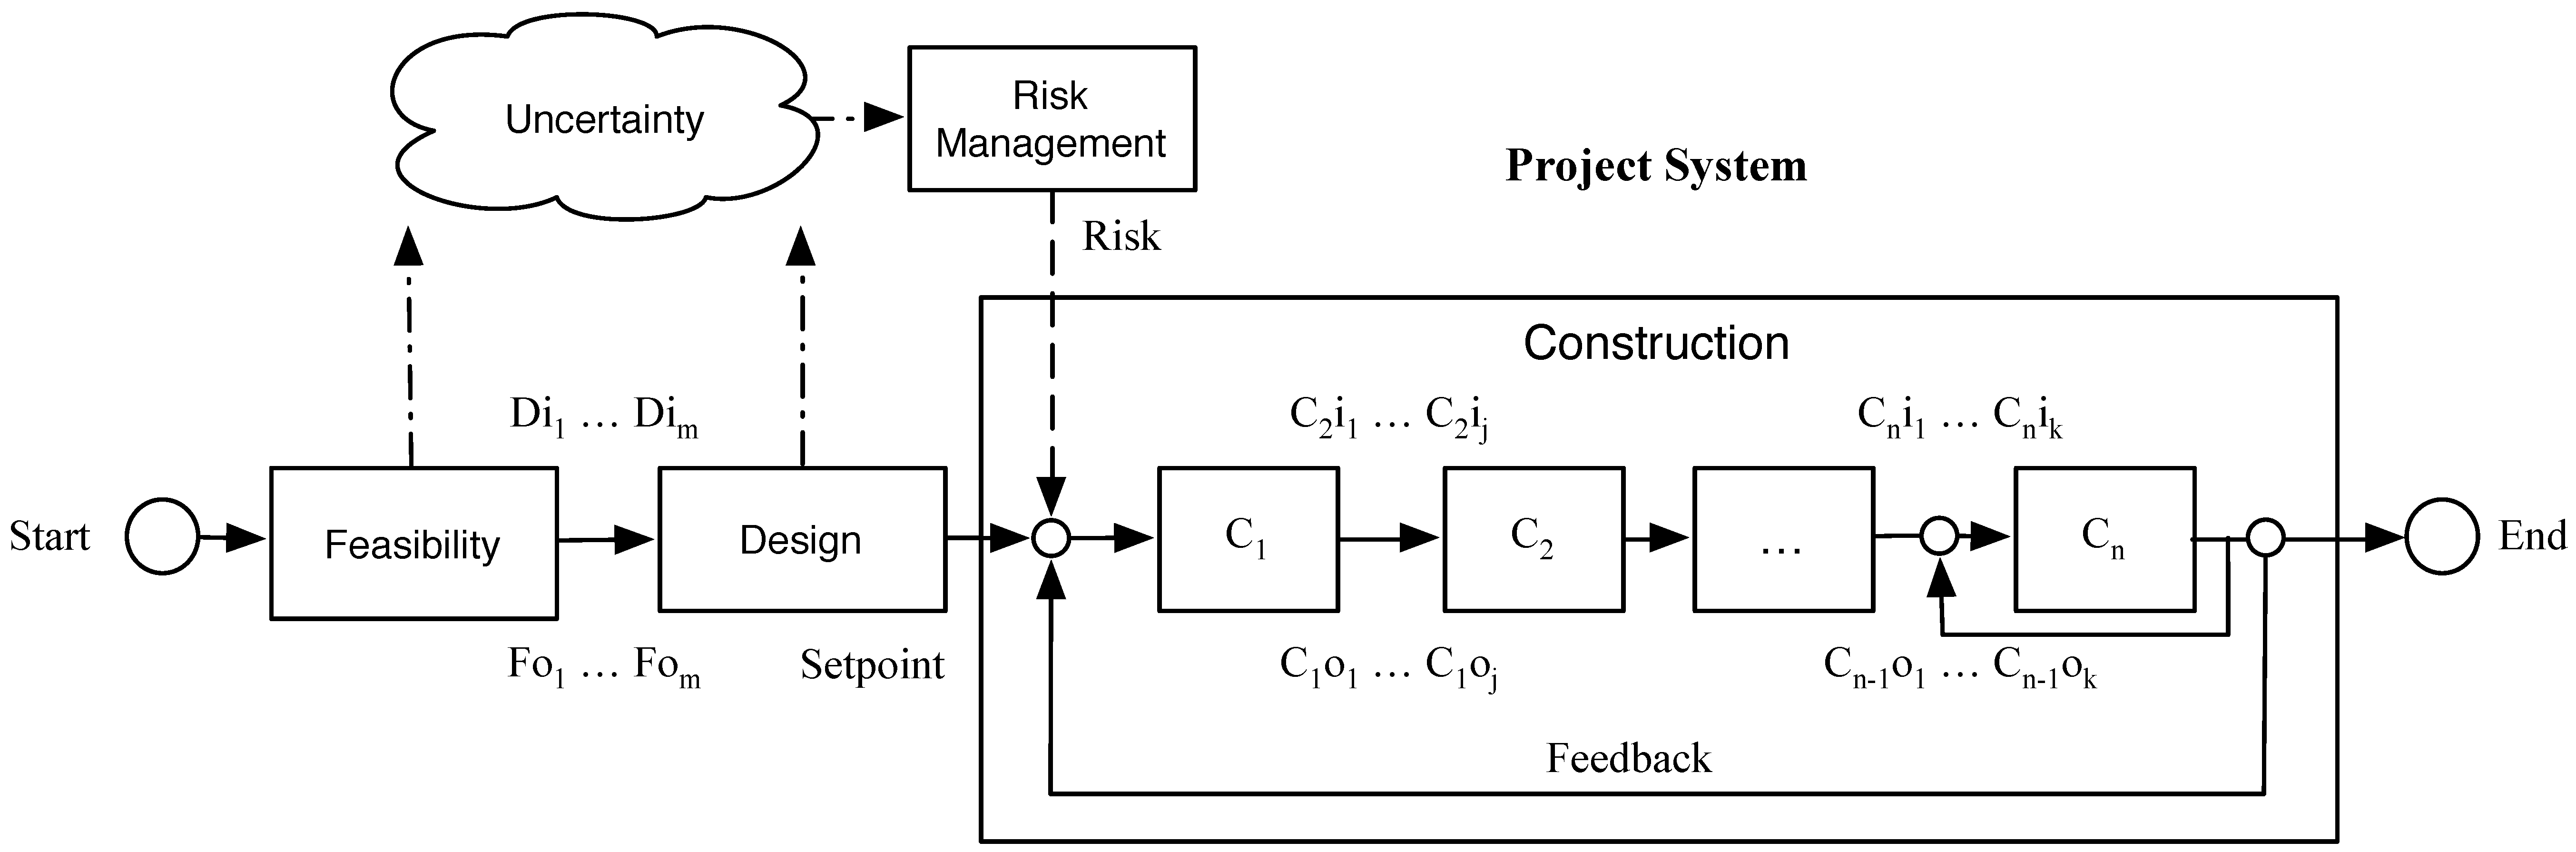
3. Construction Project System

Several elements found in this literature review connect the characteristics of construction projects to the characteristics of a dynamic system. As shown in Figure 4, the interconnectivity is explicit between project stages, in the event that subsequent phases rely on the accomplishment and performance of previous ones. This dependent connection remains valid for divided n-substages or n-activities and also applies to the proposed framework. The dependence of processes and/or activities is well documented in the literature and well known by practitioners. An activity or stage may impair or favour a successive action depending on the level of correlation and dependence. The interdependence of activities forms a conduit to the propagation of unsure events. Potential risks captured through the entire project life may impact project execution whenever not properly treated, resulting in project deviations. This sequence of events is represented in the system by the flow of uncertainty to risk and the occurrence of risk events, through risk management filtering actions—avoidance, acceptance, sharing, transference, mitigation, motivation—and, finally, to variability. This flow resembles an intrinsic characteristic of systems in the presence of disturbance or noise. Control systems may transmit unfiltered noise across connections affecting vulnerable components and causing disturbances or unpredicted behaviour. Although the level of influence in this flow of sequential, parallel or overlapping relationships in the process or activity network have not been investigated at this point, understanding how risk transforms into variability, and especially how variability affects networked activities, propitiates an opportunity to develop methods aimed at avoiding and mitigating (filtering) the propagation of risk (noise). Regarding risk materialization in variability, different outcomes build on how concentrated or distributed the risk impact was. This scenario requires a function capable of scale variation and energy conservation (impact) when calculating the functional energy. The wavelet network evolved from the Fourier transformation: “wavelet network is a type of building block for approximation of unknown functions based on the concept of the multi-resolution approximation. The building block is formed by shifting and dilating the basis functions, the mother wavelet and father wavelet” [97]. A wavelet network may be used as universal function approximator (“a universal function approximator is a system that, given a set of predictor variables, can output an accurate estimate of some predicted variable” [97]) to estimate unknown nonlinear functions and to attain a required control performance. A new concept in the control area, wavelets have been successfully used in several applications, such as physics, signal processing and statistics, where small complicated details matter [98]. Operating on possibly the same conditions of wave theory—linear/nonlinear, deterministic/stochastic, time-domain/frequency domain, direct/inverse problems, discrete/continuous models [99]—control theory may create a proxy theory to explain the effects of variability in construction projects by extending the elements of the dynamic systems.
Figure 4. The project construction system from the theoretical framework.
Buildings 05 00209 g004
The opportunity for improvement created by process repetitiveness reveals a similarity between the resulting theoretical framework and the concept of the control loop, or feedback loop, which controls the dynamic behaviour of the system. The block diagram shows the flow of signals across a system. The block diagram is common to control systems, where a system output may determine an input for the following system. Alternatively, a posterior system can affect the output of previous systems in the chain [100] as in the case of a closed-loop system. Possible categories of inputs on a construction system are tools, equipment, labour, management, time, conditions, product, e.g., a meter of the floor installed, or material, e.g., concrete mix, which may constitute the system output [13]. As an illustration, a manager in charge takes corrective action when an activity deviates from tolerances defined in the plan, i.e., management by exception [34]. The control loop in the process control works in an identical manner. Once a set-point (equivalent to project plan) is defined, three tasks occur: measurement (how the activity is going), comparison (whether the activity is performing within the plan limits) and adjustment (corrective actions). If other feedback or an inner controller are added to the activity Cn (characterized by the interaction of the operational manager, for example), the system will be structured by two closely linked processes that encapsulate feedback, which constitutes a cascade-control system.

4. Conclusions

This literature review conducted an exploration of elements in the building construction project cycle, which possibly influence the project performance, mostly affecting production behaviour. Furthermore, connections and comparisons were made between projects and manufacturing, aimed at identifying key components that could serve as pivotal to the application of successfully proven theories and methods from manufacturing in construction projects. The outcome is a theoretical framework structured as a system. The system connects project stages—feasibility, design and construction—and activities (Cm), as well as proposes a flow of uncertainty to risk and the risk impact causing variability. This system structure representing the production provides a means to analyse the effects of interconnected elements in a micro and macro view. Although this literature review was comprehensive, the list of unmentioned factors that affect production in construction is still endless. Further research needs to be conducted to identify and describe the effect of construction project particularities on the construction production system. Additionally, further research needs to be conducted to develop a mathematical explanation of the production system that will supply the building construction industry with ways to measure and predict the performance of a production system. System identification approaches hereafter can be used to understand, model and predict tasks, processes and project performance within the proposed framework. Furthermore, the quantification of variability across the building construction system will enable a comprehensive understanding of the behaviour of repetitive processes in projects at the unsteady and steady state, applicable to any current production model that considers a system view. Moreover, in the future, the development of management practices to handle processes at both state conditions will take place.

Author Contributions

The study was part of a thesis undertaken by the author for correspondence, Ricardo Antunes. It was supervised by Vicente Gonzalez (principal supervisor).

Conflicts of Interest

The authors declare no conflict of interest.

References

  1. Levy, S.M. Project Management in Construction; McGraw-Hill: New York, NY, USA, 2012; p. 478. [Google Scholar]
  2. United States Department of Labor. Bureau of Labor Statistics. Available online: http://www.bls.gov/ (accessed on 24 September 2014).
  3. McCray, G.E.; Purvis, R.L. Project management under uncertainty: The impact of heuristics and biases. Proj. Manag. J. 2002, 33, 49–57. [Google Scholar]
  4. Abdelhamid, T.S. The Self-Destruction and Renewal of Lean Construction Theory: A Prediction From Boyd-S Theory. In Proceedings of the 12th Annual Conference of the International Group for Lean Construction, Helsingør, Denmark, 3–5 August 2004.
  5. Mills, A. A systematic approach to risk management for construction. Struct. Surv. 2001, 19, 245–252. [Google Scholar] [CrossRef]
  6. Lutz, J.D.; Hijazi, A. Planning repetitive construction: Current practice. Constr. Manag. Econ. 1993, 11, 99–110. [Google Scholar] [CrossRef]
  7. Koskela, L. Application of the New Production Philosophy to Construction; Stanford University: Stanford, CA, USA, 1992; pp. 1–81. [Google Scholar]
  8. Bertelsen, S. Construction as a Complex System. In Proceedings of the 11th Annual Conference of the International Group for Lean Construction, Blacksburg, VA, USA, 21–24 July 2003.
  9. Laufer, A. Simultaneous Management: Managing Projects in a Dynamic Environment; American Management Association: New York, NY, USA, 1997; p. 313. [Google Scholar]
  10. Duenyas, I.; Hopp, W.J. Estimating variance of output from cyclic exponential queueing systems. Queueing Syst. 1990, 7, 337–353. [Google Scholar] [CrossRef]
  11. Hopp, W.J.; Spearman, M.L. Factory Physics: Foundations of Manufacturing Management, 2nd ed.; Irwin McGraw-Hill: New York, NY, USA, 1996; p. 726. [Google Scholar]
  12. Kumar, S.A.; Suresh, N. Operation Management; New Age International: New Delhi, India, 2009. [Google Scholar]
  13. Bernold, L.E. Simulation of nonsteady construction processes. J. Constr. Eng. Manag. 1989, 115, 163–178. [Google Scholar] [CrossRef]
  14. Koskela, L. An Exploration towards a Production Theory and Its Application to Construction; VTT Technical Research Centre of Finland: Espoo, Finland, 2000. [Google Scholar]
  15. Walsh, K.D.; Sawhney, A.; Bashford, H.H. Production equations for unsteady-state construction processes. J. Constr. Eng. Manag. 2007, 133, 245–261. [Google Scholar] [CrossRef]
  16. Ohno, T. O sistema toyota de produção além da produção em larga escala; Bookman: Sao Paolo, Brazil, 1988; p. 139. [Google Scholar]
  17. Womack, J.P.; Jones, D.T.; Roos, D. The Machine that Changed the World; Harper Perennial: New York, NY, USA, 1991; p. 323. [Google Scholar]
  18. Poppendieck, M.; Poppendieck, T. Lean Software Development—An Agile Toolkit; Addison-Wesley: New York, NY, USA, 2003. [Google Scholar]
  19. Ries, E. The Lean Startup: How Today’s Entrepreneurs Use Continuous Innovation to Create Radically Successful Businesses; Crown Business: New York, NY, USA, 2011. [Google Scholar]
  20. Hopp, W.J.; Spearman, M.L.; Woodruff, D.L. Practical strategies for lead time reduction. Manuf. Rev. 1990, 3, 1–15. [Google Scholar]
  21. Hopp, W.J.; Wu, S.-C. Machine maintenance with multiple maintenance actions. IIE Trans. 1990, 22, 226–233. [Google Scholar] [CrossRef]
  22. Spearman, M.L.; Woodruff, D.L.; Hopp, W.J. CONWIP—A pull alternative to Kanban. Int. J. Prod. Res. 1990, 28, 879–894. [Google Scholar] [CrossRef]
  23. Simon, J.T.; Hopp, W.J. Availability and average inventory of balanced assembly-like flow systems. IIE Trans. 1991, 23, 161–168. [Google Scholar] [CrossRef]
  24. Koskela, L. Proceedings of the Lean Construction, National Construction and Management Conference, Sydney, Australia, 17–18 February 1994; Wakefield, R.R., Carmichael, D.G., Eds.; Institution of Engineers: Sydney, Australia, 1994; pp. 205–217.
  25. Project Management Institute. Project Management Institute. Construction Extension to the Pmbok Guide Third Edition, 2nd ed.; Project Management Institute: Newtown Square, PA, USA, 2007; p. 208. [Google Scholar]
  26. Bossink, B.; Brouwers, H. Construction waste: Quantification and source evaluation. J. Constr. Eng. Manag. 1996, 122, 55–60. [Google Scholar] [CrossRef]
  27. Hoffman, T.L. Construction management: Added value or added cost? J. Prop. Manag. 1998, 63, 6531300. [Google Scholar]
  28. Baily, M.N.; Gordon, R.J.; Nordhaus, W.D.; Romer, D. The productivity slowdown, measurement issues, and the explosion of computer power. Brook. Papers Econ. Act. 1988, 19, 347–431. [Google Scholar] [CrossRef]
  29. Hossain, M.A.; Chua, D.K.H. Overlapping design and construction activities and an optimization approach to minimize rework. Int. J. Proj. Manag. 2014, 32, 983–994. [Google Scholar] [CrossRef]
  30. Li, R.Y.M.; Poon, S.W. Construction Safety; Springer: Berlin/Heidelberg, Germany, 2013; p. 161. [Google Scholar]
  31. Project Management Institute. A Guide to the Project Management Body of Knowledge (Pmbok Guide), 5th ed.; Project Management Institute: Newtown Square, PA, USA, 2013; p. 616. [Google Scholar]
  32. Project Management Institute. A Guide to the Project Management Body of Knowledge (Pmbok Guide), 1st ed.; Project Management Institute: Newtown Square, PA, USA, 1996; p. 182. [Google Scholar]
  33. International Project Management Association. IPMA Competence Baseline Version 3.0, 3rd ed.; International Project Management Association: Nijkerk, The Netherlands, 2006; p. 212. [Google Scholar]
  34. Office of Government Commerce. Managing Successful Projects with Prince2, 5th ed.The Stationery Office: London, UK, 2009; p. 346.
  35. Cho, K.; Hong, T.; Hyun, C. Scheduling model for repetitive construction processes for high-rise buildings. Can. J. Civil Eng. 2010, 38, 36–48. [Google Scholar] [CrossRef]
  36. Bhoyar, S.; Parbat, D.K. Optimal scheduling for repetitive construction projects with multiple resource crews. Int. J. Emerg. Technol. Adv. Eng. 2014, 4, 302–307. [Google Scholar]
  37. Tommelein, I.; Riley, D.; Howell, G. Parade game: Impact of work flow variability on trade performance. J. Constr. Eng. Manag. 1999, 125, 304–310. [Google Scholar] [CrossRef]
  38. Alarcon, L.F.; Ashley, D.B. Playing Games: Evaluating the Impact of Lean Production Strategies on Project Cost and Schedule. In Proceedings of the IGLC-7, Berkeley, CA, USA, 26–28 July 1999; pp. 263–274.
  39. Halpin, D.W.; Kueckmann, M. Lean Construction and Simulation. In Proceedings of the 2002 Winter Simulation Conference, San Diego, CA, USA, 8–11 December 2002; pp. 1697–1703.
  40. Farag, M.A.M. A bridge between increasing reliability and reducing variability in construction work flow: A fuzzy-based sizing buffer model. J. Adv. Manag. Sci. 2014, 2, 287–294. [Google Scholar] [CrossRef]
  41. Benjaoran, V.; Dawood, N. Intelligence approach to production planning system for bespoke precast concrete products. Autom. Constr. 2006, 15, 737–745. [Google Scholar] [CrossRef]
  42. Thomas, H.R.; Maloney, W.F.; Horner, R.M.W.; Smith, G.R.; Handa, V.K.; Sanders, S.R. Modeling construction labor productivity. J. Constr. Eng. Manag. 1990, 116, 705–726. [Google Scholar] [CrossRef]
  43. Handa, M.V.K.; Barcia, R.M. Linear scheduling using optimal control theory. J. Constr. Eng. Manag. 1986, 112, 387–393. [Google Scholar] [CrossRef]
  44. Bashford, H.H.; Walsh, K.D.; Sawhney, A. Production system loading-cycle time relationship in residential construction. J. Constr. Eng. Manag. 2005, 131, 15–22. [Google Scholar] [CrossRef]
  45. Gonzalez, V.; Alarcon, L.F.; Yiu, T.W. Integrated methodology to design and manage work-in-process buffers in repetitive building projects. J. Oper. Res. Soc. 2013, 64, 1182–1193. [Google Scholar] [CrossRef]
  46. Gonzalez, V.; Alarcon, L.F.; Molenaar, K. Multiobjective design of work-in-process buffer for scheduling repetitive building projects. Autom. Constr. 2009, 18, 95–108. [Google Scholar] [CrossRef]
  47. American Society for Testing and Materials. Building Economics. Available online: http://www.astm.org (accessed on 27 October 2014).
  48. Smith, N.J.; Merna, T.; Jobling, P. Managing Risk in Construction Projects, 2nd ed.; Blackwell Publishing: Malden, MA, USA, 2006; p. 257. [Google Scholar]
  49. Association for Project Management. APM Body of Knowledge, 5th ed.; Association for Project Management: Buckinghamshire, UK, 2006; p. 197. [Google Scholar]
  50. Anderson, D.K.; Merna, T. Project management strategy—Project management represented as a process based set of management domains and the consequences for project management strategy. Int. J. Proj. Manag. 2003, 21, 387–393. [Google Scholar] [CrossRef]
  51. Project Management Institute. A Guide to the Project Management Body of Knowledge (Pmbok Guide), 3rd ed.; Project Management Institute: Newtown Square, PA, USA, 2004; p. 405. [Google Scholar]
  52. Gibb, A.; Isack, F. Re-engineering through pre-assembly: Client expectations and drivers. Build. Res. Inf. 2003, 31, 146–160. [Google Scholar] [CrossRef] [Green Version]
  53. Blismas, N.; Pasquire, C.; Gibb, A. Benefit evaluation for off-site production in construction. Constr. Manag. Econ. 2006, 24, 121–130. [Google Scholar] [CrossRef] [Green Version]
  54. Borg, R.; Gambatese, J.; Haines, K.; Hendrickson, C.; Hinze, J.; Horvath, A.; Koehn, E.; Moritz, S.; Mass, M.; Haughney, R. Rebuilding the world trade center. Pract. Period. Struct. Des. Constr. 2003, 8, 137–145. [Google Scholar] [CrossRef]
  55. Wyrik, D.A.; Eschenbach, T.G. Remote oil and gas facility construction. J. Constr. Eng. Manag. 1989, 115, 228–236. [Google Scholar] [CrossRef]
  56. Briscoe, G.; Dainty, A.R.J.; Millett, S. Construction supply chain partnerships: Skills, knowledge and attitudinal requirements. Eur. J. Purch. Supply Manag. 2001, 7, 243–255. [Google Scholar] [CrossRef]
  57. Said, H.; El-Rayes, K. Optimal utilization of interior building spaces for material procurement and storage in congested construction sites. Autom. Constr. 2013, 31, 292–306. [Google Scholar] [CrossRef]
  58. Baye, M.R. Magerial Economics and Business Strategy, 7th ed.; McGraw-Hill: New York, NY, USA, 2010; p. 658. [Google Scholar]
  59. McGuigan, J.R.; Moyer, R.C.; Harris, F.H.D. Managerial Economics: Applications, Strategy, and Tactics, 12th ed.; South-Western: Mason, OH, USA, 2011; p. 792. [Google Scholar]
  60. AACE International. Risk Analysis and Contingency Determination Using Expected Value. In TCM Framework: 7.6—Risk Management; AACE International: Morgantown, WV, USA, 2012; Volume 44R-08, pp. 1–14. [Google Scholar]
  61. Project Management Institute. Managing Change in Organization: A Practice Guide; Project Management Institute: Newtown Square, PA, USA, 2013; p. 141. [Google Scholar]
  62. Sutherland, J. Scrum Log Jeff Sutherland: Why Gantt Charts Were Banned in the First Scrum. Available online: http://scrum.jeffsutherland.com/2006/02/why-gantt-charts-were-banned-in-first.html (accessed on 14 April 2014).
  63. Deemer, P.; Benefield, G.; Larman, C.; Vodde, B. The Scrum Primer. A Lightweight Guide to the Theory and Practice of Scrum. Available online: http://assets.scrumfoundation.com/downloads/1/scrumprimer20.pdf?1352449266 (accessed on 2 July 2014).
  64. Mandal, A.K. Introduction to Control Engineering Modeling, Analysis and Design; New Age International Publishers: New Delhi, India, 2006; p. 633. [Google Scholar]
  65. Weiss, S.I. Product and Systems Development a Value Approach; John Wiley & Sons: Hoboken, NJ, USA, 2013; p. 275. [Google Scholar]
  66. Vidal, L.-A.; Marle, F.; Bocquet, J.-C. Modelling project Complexity. In Proceedings of the International Conference on Engineering Design, ICED’07, Paris, France, 28–31 July 2007; pp. 1–10.
  67. Baccarini, D. The concept of project complexity a review. Int. J. Proj. Manag. 1996, 14, 201–204. [Google Scholar] [CrossRef]
  68. Mitchell, M. Complexity a Guided Tour; Oxford University Press: Oxford, UK, 2009; p. 366. [Google Scholar]
  69. Curlee, W.; Gordon, R.L. Complexity Theory and Project Management; John Wiley & Sons: Hoboken, NJ, USA, 2011; p. 419. [Google Scholar]
  70. Project Management Institute. Practice Standard for Work Breakdown Structures, 2nd ed.; Project Management Institute: Newtown Square, PA, USA, 2006; p. 123. [Google Scholar]
  71. Project Management Institute. Practice Standard for Work Breakdown Structures, 2nd ed.; Project Management Institute: Newtown Square, PA, USA, 2006; p. 156. [Google Scholar]
  72. Kezner, H. Strategic Planning for Project Management Using a Project Management Maturity Model; John Wiley & Sons: New York, NY, USA, 2001; p. 271. [Google Scholar]
  73. Kaimann, R.A. Coefficient of network complexity. Manag. Sci. 1974, 21, 172–177. [Google Scholar] [CrossRef]
  74. Vidal, L.-A.; Marle, F.; Bocquet, J.-C. Measuring project complexity using the analytic hierarchy process. Int. J. Proj. Manag. 2010, 29, 718–727. [Google Scholar] [CrossRef]
  75. Project Management Institute. Navigating Complexity: A Practice Guide; Project Management Institute: Newtown Square, PA, USA, 2014; p. 114. [Google Scholar]
  76. Temperley, H.M.V. Graph Theory and Applications; Halsted Press: New York, NY, USA, 1981; p. 130. [Google Scholar]
  77. Nassar, K.M.; Hegab, M.Y. Developing a complexity measure for project schedules. J. Constr. Eng. Manag. 2006, 132, 554–561. [Google Scholar] [CrossRef]
  78. Saaty, T.L. Multicriteria Decision Making: The Analytic Hierarchy Process: Planning, Priority Setting, Resource Allocation, 2nd ed.; RWS Pubns: Pittsburgh, PA, USA, 1990. [Google Scholar]
  79. Mello, P.C.D. John Maynard Keynes, Presidente de Companhia de Seguros; Pedro Carvalho de Mello: São Paulo, Brazil, 2011; pp. 1–152. [Google Scholar]
  80. Keynes, J.M. The General Theory of Employment, Interest, and Money; Harcourt Brace & World: New York, NY, USA, 1936; p. 403. [Google Scholar]
  81. European Commission. Value Management; European Commission: Brussels, Belgium, 1995; p. 190. [Google Scholar]
  82. Perminova, O.; Gustafsson, M.; Wikstrom, K. Defining uncertainty in projects—A new perspective. Int. J. Proj. Manag. 2008, 26, 73–79. [Google Scholar] [CrossRef]
  83. Knight, F.H. Risk, Uncertainty and Profit; Library of Economics and Liberty: Boston, MA, USA, 1921; p. 381. [Google Scholar]
  84. Crouhy, M.; Galai, D.; Mark, R. The Essentials of Risk Management; McGraw-Hill: New York, NY, USA, 2005; p. 416. [Google Scholar]
  85. Mun, J. Modeling Risk: Applying Monte Carlo Simulation, Real Options Analysis, Forecasting, and Optimization Techniques; John Wiley & Sons: Hoboken, NJ, USA, 2006; p. 623. [Google Scholar]
  86. Project Management Institute. A Guide to the Project Management Body of Knowledge (Pmbok Guide), 4th ed.; Project Management Institute: Newtown Square, PA, USA, 2008; p. 507. [Google Scholar]
  87. Jorion, P. Value at Risk the New Bechmark for Managing Financial Risk, 3rd ed.; McGraw-Hill: New York, NY, USA, 2007; p. 594. [Google Scholar]
  88. Cleden, D. Managing Project Uncertainty; Gower: Surrey, UK, 2009; p. 146. [Google Scholar]
  89. Wikipedia. Variability. Available online: https://en.wikipedia.org/wiki/Variability (accessed on 22 April 2014).
  90. Radosavljević, M.; Horner, R.M.W. The evidence of complex variability in construction labour productivity. Constr. Manag. Econ. 2002, 20, 3–12. [Google Scholar] [CrossRef]
  91. Atkinson, R.; Crawford, L.; Ward, S. Fundamental uncertainties in projects and the scope of project management. Int. J. Proj. Manag. 2006, 24, 687–698. [Google Scholar] [CrossRef]
  92. McConnell, S. Software Estimation: Demystifying the Black Art; Microsoft Press: Redmond, WA, USA, 2006; p. 352. [Google Scholar]
  93. Spencer, M.S.; Cox, J.F. An analysis of the product-process matrix and repetitive manufacturing. Int. J. Prod. Res. 1995, 33, 1275–1294. [Google Scholar] [CrossRef]
  94. Public Broadcasting Service (PBS). One World Trade Center. In Super Skyscrapers; PBS: Arlington, VA, USA, 2014. [Google Scholar]
  95. Shaked, D. Strength-Based Lean Six Sigma: Building Positive and Engaging Business Improvement; Kogan Page Ltd.: London, GBR, 2013. [Google Scholar]
  96. Taghizadegan, S. Essentials of Lean Six Sigma; Elsevier: Amsterdam, NL, USA, 2006; p. 275. [Google Scholar]
  97. University of Alberta Dictionary. Universal Function Approximator. Available online: http://www.bcp.psych.ualberta.ca/~mike/Pearl_Street/Dictionary/contents/U/universalfn.html (accessed on 5 July 2014).
  98. Xu, J.-X.; Tan, Y. Linear and Nonlinear Iterative Learning Control; Springer: Berlin, Germany, 2003; Volume 291, p. 177. [Google Scholar]
  99. Dager, R.; Zuazua, E. Wave Propagation, Observation and Control in 1-d Flexible Multi-Structures; Springer: New York, NY, USA, 2006; Volume 50, p. 227. [Google Scholar]
  100. Ogata, K. Modern Control Engineering, 5th ed.; Prentice Hall: Upper Saddle River, NJ, USA, 2010; p. 905. [Google Scholar]

