Article

Research on Formulating Energy Benchmarks for Various Types of Existing Residential Buildings from the Perspective of Typology: A Case Study of Chongqing, China

1
School of Architecture and Urban Planning, Chongqing University, Chongqing 400030, China
2
Key Laboratory of New Technology for Construction of Cities in Mountain Area, Chongqing 400030, China
*
Author to whom correspondence should be addressed.
Buildings 2023, 13(5), 1346; https://doi.org/10.3390/buildings13051346
Submission received: 17 April 2023 / Revised: 14 May 2023 / Accepted: 19 May 2023 / Published: 21 May 2023

Abstract

:
The full exploration of the energy-saving potential during the operation of buildings is an essential aspect of energy-efficiency retrofitting for existing residential buildings. Setting reasonable energy consumption quotas can promote the improvement of energy efficiency. The energy benchmark is one of the energy consumption quotas, which represents the general energy consumption level of similar buildings and serves as the energy-saving goal for high-energy-consuming buildings. This study aims to classify existing residential buildings based on their forms and actual energy consumption data and to set energy benchmarks for each building type. Taking typical existing residential buildings built before 2000 in Chongqing, a city in southwestern China, as an example, from the perspective of building typology, the study classified residential buildings into four types and determined the energy benchmarks. Then, energy-efficiency retrofitting measure evaluation and potential analysis were carried out for each type. The study shows that energy for cooling and heating accounts for a high proportion of energy use in existing residential buildings. The energy consumption of residential buildings is greatly affected by orientation and floor area. Point-like buildings with smaller areas facing west have higher energy benchmarks, while slab-like buildings with larger south-facing areas have lower energy benchmarks. The results and methods of the study can provide a basis for the formulation of energy benchmarks for residential buildings, as well as regional energy analysis, energy-saving potential prediction, and energy-saving measure evaluation.

1. Introduction

The energy crisis is a survival challenge that countries worldwide need to face together. With economic development, residential energy consumption is becoming more active. According to the “China Energy Big Data Report (2022)” [1,2], in 2021, China’s urban and rural residents’ electricity consumption for daily life reached 1.17 trillion kWh, a year-on-year increase of 7.3%. Therefore, studying the current energy status of residential buildings and exploring their energy-saving potential during their operation is one of the critical ways to achieve the carbon neutrality goal. At the same time, the “14th Five-Year Plan for Building Energy Efficiency and Green Building Development” [3] also clearly required improvement of the energy-efficiency retrofitting of existing residential buildings, while the guiding opinions of the State Council of China [4] emphasized the retrofitting of old residential buildings built before 2000. To improve the energy efficiency of residential buildings, accurately assessing the energy status and setting energy-efficiency targets are vital elements.
The objects of this study are located in Shapingba District, Chongqing, in southwestern China. Chongqing has a subtropical monsoon humid climate and is categorized as a hot summer and cold winter region in the classification of China’s building thermal climate zones. Its annual average temperature ranges between 16 and 18 °C, and the hottest month has an average temperature of 26–29 °C. The coldest month experiences an average temperature of 4–8 °C, owing to a winter sunshine rate of only 13% [5]. In recent years, the frequency of extreme heat events in Chongqing has increased significantly. According to public data from the Chongqing Meteorological Service, Shapingba District experienced a total of 58 days of high-temperature weather of 35 °C and above, including 27 days of extremely high-temperature weather of 40 °C and above from July to October 2022 [6], leading to a significant rise in air conditioning energy consumption. As for the existing residential buildings in Chongqing, with the urbanization rate exceeding 70%, the stock of existing residential buildings by the end of 2018 was 559 million square meters, of which 153 million square meters were built between 1950 and 2000, accounting for 27.32%. The energy consumption of urban residential buildings in Chongqing has increased by more than four times [7]. Since the earliest building energy-efficiency design standards in Chongqing were published in 2002 (“Design standard for energy efficiency of residential buildings in hot summer and cold winter zone” DB 50/5024-2002, (“2002 Standard”)), very few of the residential buildings constructed before then adopted energy-efficiency design. For those buildings, the energy for cooling and heating accounted for more than 44% of the total annual household energy consumption [8]. Therefore, conducting forms and energy characteristics analyses for existing residential buildings will help achieve the energy-saving goal of improving energy efficiency and reducing overall energy consumption.
Inspired by the above research and practical situation, we selected representative existing residential buildings constructed before 2000 in Shapingba District, Chongqing City, as the research objects, aiming to explore the method for formulating energy benchmarks for existing residential buildings. The main contents of the article are as follows: (1) analyzed the existing residential building forms and energy consumption status; (2) classified the existing residential buildings from a typological perspective; (3) established the energy benchmark for each type of residential building; (4) analyzed energy-efficiency retrofitting strategies and the energy-saving potential of each type of building.
Through the discussion and study of the above issues, evaluation criteria for the energy efficiency of the sample residential buildings have been established, and targeted advice has been provided for the measures of energy-efficiency retrofitting. In addition, it was also a beneficial exploration of the formulation method of energy quota standards for residential buildings in Chongqing.

2. Review of the Literature

Formulating energy-saving goals requires the establishment of evaluation standards. As a data-based, objective standard, energy benchmarks form the basis for energy efficiency evaluation [9,10,11,12]. Energy benchmarking of buildings is a method of evaluating current building energy efficiency by comparing it with a standard energy scenario [13], which can be derived from an idealized virtual model, buildings with similar characteristics, or historical energy data [14,15,16]. The comparison can clarify buildings’ actual energy efficiency level and identify energy-inefficient buildings for targeted energy savings [17]. It is an important part of most building energy efficiency rating systems and is also the basis for energy efficiency diagnosis and the development of energy-saving measures [14].
Studies have well documented that energy benchmarking, as a macro-level assessment, can help promote building energy performance [18,19]. According to a 2012 survey by the U.S. Environmental Protection Agency, buildings that participated in the ENERGY STAR program had an average annual energy savings rate of 2.4% [20]. Large buildings participating in the National Australian Built Environment Rating System reduced energy consumption by an average of 3.3% per year over ten years [21]. It has been shown that comparisons between similar buildings and publicly available energy performance information can motivate energy-efficient behaviors [22]. Energy-efficient buildings can reduce economic costs, making them more popular in the trading market, which motivates homeowners to improve building energy efficiency and achieve a positive cycle continuously. As a result, relevant government departments worldwide have started to implement building benchmarking or energy disclosure policies [23,24].
The energy benchmarks in previous studies were mainly determined by three methods: establishing energy consumption benchmark models, establishing energy prediction models, and establishing statistical models [25,26,27].
In the first method, energy simulation software like EnergyPlus is usually used for modeling. Standard conditions such as building forms, thermal parameters, and equipment conditions are artificially set to obtain an energy consumption value as the benchmark, which is commonly used for individual building energy diagnosis [17]. In a study of energy consumption in five-star hotels in China in 2018, through the investigation of building form, equipment, utilization rate, and other data from 300 high-end hotels, typical values of parameters were selected to establish a DeST energy consumption simulation model to describe the energy intensity distribution [28]. In 2022, researchers in Brussels developed an energy benchmark model for near-zero-energy residential buildings. A typical building was selected through field measurements and energy data testing of 39 dwellings over several months. An energy simulation model was developed to calculate an average annual energy use intensity (EUI) of 29 kWh/m2 for typical near-zero energy buildings [29]. However, because of the strict requirements for the dimension and accuracy of boundary condition parameters, establishing energy simulation models is unsuitable for large-scale building energy consumption evaluations [10,26,30]. In recent studies, attempts have been made to improve the representativeness of energy consumption models as prototypes. Researchers delineated multilevel intervals for simulation parameters to cover a broader range of building types [31]. However, the multilevel delineation of variable values led to an exponential increase in the number of simulations. Additionally, due to the high data completeness and accuracy requirements, some studies have attempted to use Bayesian inference to predict the modeling parameters for the data requirements [32], which may contain errors with actual data. Thus, the high demand for data granularity limits the use of simulation models in the urban context [33].
In the second way, energy prediction models are established based on the intricate relationship between building characteristics and energy consumption. The tested building obtains the predicted energy consumption value, which will be used as the benchmark to compare with its actual energy consumption for the energy efficiency ratio (EER). The EER, defined as the ratio of the actual energy to the model-predicted value, is used to quantify the relative energy performance of a building [34], with a lower EER indicating better energy efficiency relative to comparable buildings. The cumulative frequency statistics of EER allow rating or scoring of building energy performance; for example, a score of 75 or higher qualifies for Energy Star certification, which means the building outperforms 75% of similar buildings nationwide [9]. Regression models [9,35,36], such as the US Energy Star program [37], are commonly used. Roth et al. used quantile regression to perform an energy benchmarking analysis of more than 1000 commercial buildings [38]; Ding et al. used a linear regression model to benchmark the energy of campus buildings by considering subcomponent electricity use data such as lighting, air conditioning, and electrical equipment. They assessed the energy-saving potential of each component of the target building [39]. The regression model is often linear, but the relationship between the energy and properties of a building, such as building age, operating hours, number of occupants, and other factors, was found to be nonlinear sometimes [40,41,42]. Due to the application of machine learning (ML) and the Internet of Things (IoT), nonlinear models such as Artificial Neural Network (ANN) [43], Decision Tree (DT) [44], Adaptive Network-based Fuzzy Inference System (ANFIS) [45], and Random Forests (RF) [25,26] have been increasingly utilized. Nonlinear energy prediction models usually use ML algorithms, which do not require much knowledge of building physics and rely on pre-selected models and actual historical data sets to estimate reasonable building energy [33]. Under reliable and sufficient data, various nonlinear models have been widely used in energy consumption prediction, load forecasting, and energy assessment at urban scales [21,46]. However, data-driven methods rely on a large amount of reliable public data and have high requirements for energy data platforms. On the other hand, because ML is a black-box model, it is poorly interpretable and difficult to uncover the actual causes of low energy efficiency [18], limiting its applicability in providing information in the energy efficiency policymaking process [47,48]. The study has concluded that interpretable models are more helpful in gaining the users’ trust in the energy evaluation process and can improve the execution and confidence of decision-makers in implementing their decisions [9].
In the third approach, energy benchmarks for similar buildings are determined based on building classification and actual energy consumption data using statistical methods. In the statistical benchmarking methods, the EUI of the building under test is compared with the median EUI of similar buildings [14]. The median, which indicates the general energy performance, is used as the benchmark. For example, the UK published the guide “Energy Performance in the Government’s Civil Estate”, which divided office buildings with a floor area over 1000 m2 into four categories and proposed “typical” and “good practice” energy benchmarks based on the average and quartile values of building energy use data [49].
Statistical benchmarking is more concerned with comparing energy efficiency among similar buildings than with highly accurate energy predictions [50]. Investigating building energy performance relies mainly on building characteristics such as building age, building type, floor area, and actual energy consumption data. It considers less easily changed details such as equipment energy efficiency, lighting power, and heat transfer coefficients of doors and windows. Because the energy benchmark based on statistics is a conventional energy consumption level determined by the inherent properties of the buildings, objects with energy-efficient behaviors and equipment usually have better energy efficiency performance in similar building energy consumption comparisons [51], which is consistent with the intent of energy benchmark evaluation and can promote the adoption of energy efficiency measures in high-energy-using buildings.
The energy benchmark obtained from statistics has a lower requirement for the granularity of energy data, and even annual energy consumption data can be used for analysis [17]. Moreover, with good scalability and generality, it can be adapted to different climates, building types, data quality, and coverage in different cities and regions, which is often applied to energy assessment [52] and energy strategy development for large-scale buildings [53]. A study comparing the results of the regression model, stochastic frontier analysis, and statistical method for benchmarking building energy, respectively, demonstrated that the statistical method performed more consistently and reliably when more attention was paid to the relative energy performance of buildings. For countries and regions where multi-dimensional data are difficult to obtain, the statistical method with limited data can reliably develop building energy efficiency evaluation criteria and has considerable advantages regarding interpretability [54].
The benchmark based on statistics represents an energy consumption limit for constraining total energy consumption and energy efficiency. Buildings with actual energy consumption exceeding the limit are identified as high-energy-consuming buildings (HEBs) and are targets for energy-efficiency retrofitting. It is also the method and path that Chinese government agencies use to set energy quota standards. In this study, such energy benchmark indicators were formulated as criteria for evaluating the energy efficiency of existing residential buildings and served as the basis for energy-efficiency retrofitting research.
Since energy benchmarks are used for comparing the energy efficiency of similar buildings, it is necessary to first classify existing residential buildings based on their current situation and then formulate corresponding energy benchmarks for various types of residential buildings. There is a massive stock of existing residential buildings, and collecting information about their current situation requires a lot of effort. The building typology method, which is compatible with the large and diverse existing residential buildings, can be an effective means of scientifically analyzing regional building characteristics. Under similar building conditions such as site, economy, culture, and social background, residential buildings as a basic building type tend to be constructed in similar forms, which can be abstracted as “archetypes” [55]. Since buildings can be classified based on factors such as construction time, function, and form characteristics, representative prototypes can be extracted to characterize a group of buildings with similar features [56,57,58,59]. It has been validated that the building typology method is an effective strategy for responding to the demand for large-scale building energy-efficiency retrofitting in cities and even nationwide [56,60,61,62,63,64,65,66]. The European Typology Approach for Building Stock Energy Assessment (TABULA) project is establishing a building typology system in 13 countries [56]. The determined building archetypes can be used for energy-saving potential assessments and energy-efficiency retrofit recommendations. At the same time, studies have shown that the geometric form of buildings has an important impact on energy consumption: building plan form, aspect ratio, and orientation all affect cooling load [67]; Zhang et al. [68] confirmed the correlation between room space dimensions and energy consumption in a simulation study; shape coefficient was positively correlated with building energy for cooling and heating [69]; Jalali [70] optimized the shape coefficient and building area to change the solar radiation heat gain, resulting in an 8% reduction in cooling load and a 21% reduction in heating load; and appropriate building form and orientation could reduce overall energy consumption by 40% [71]; in Bamdad’s [72] sensitivity analysis of building energy factors, building orientation and window-wall ratio were identified as priority factors. Therefore, building form analysis based on typology can provide a foundation for existing residential buildings’ classification and energy status assessment.
The above research reviews the theoretical and methodological paths of using typological thinking to study building energy benchmarks in building energy-efficiency retrofitting. However, most studies indicate that tracking the progress of energy-efficiency retrofitting on a large scale and setting reasonable energy-saving targets depend on a trusted building and energy data platform [60,73,74,75]. Data collection on the form and energy use of residential buildings remains a widespread challenge [76]. In China, the current statistical data mainly pertain to public buildings, and the energy benchmark standards have been implemented in public buildings first. Collecting building information and formulating energy benchmarks for residential buildings needs to be urgently carried out.

3. Materials and Methods

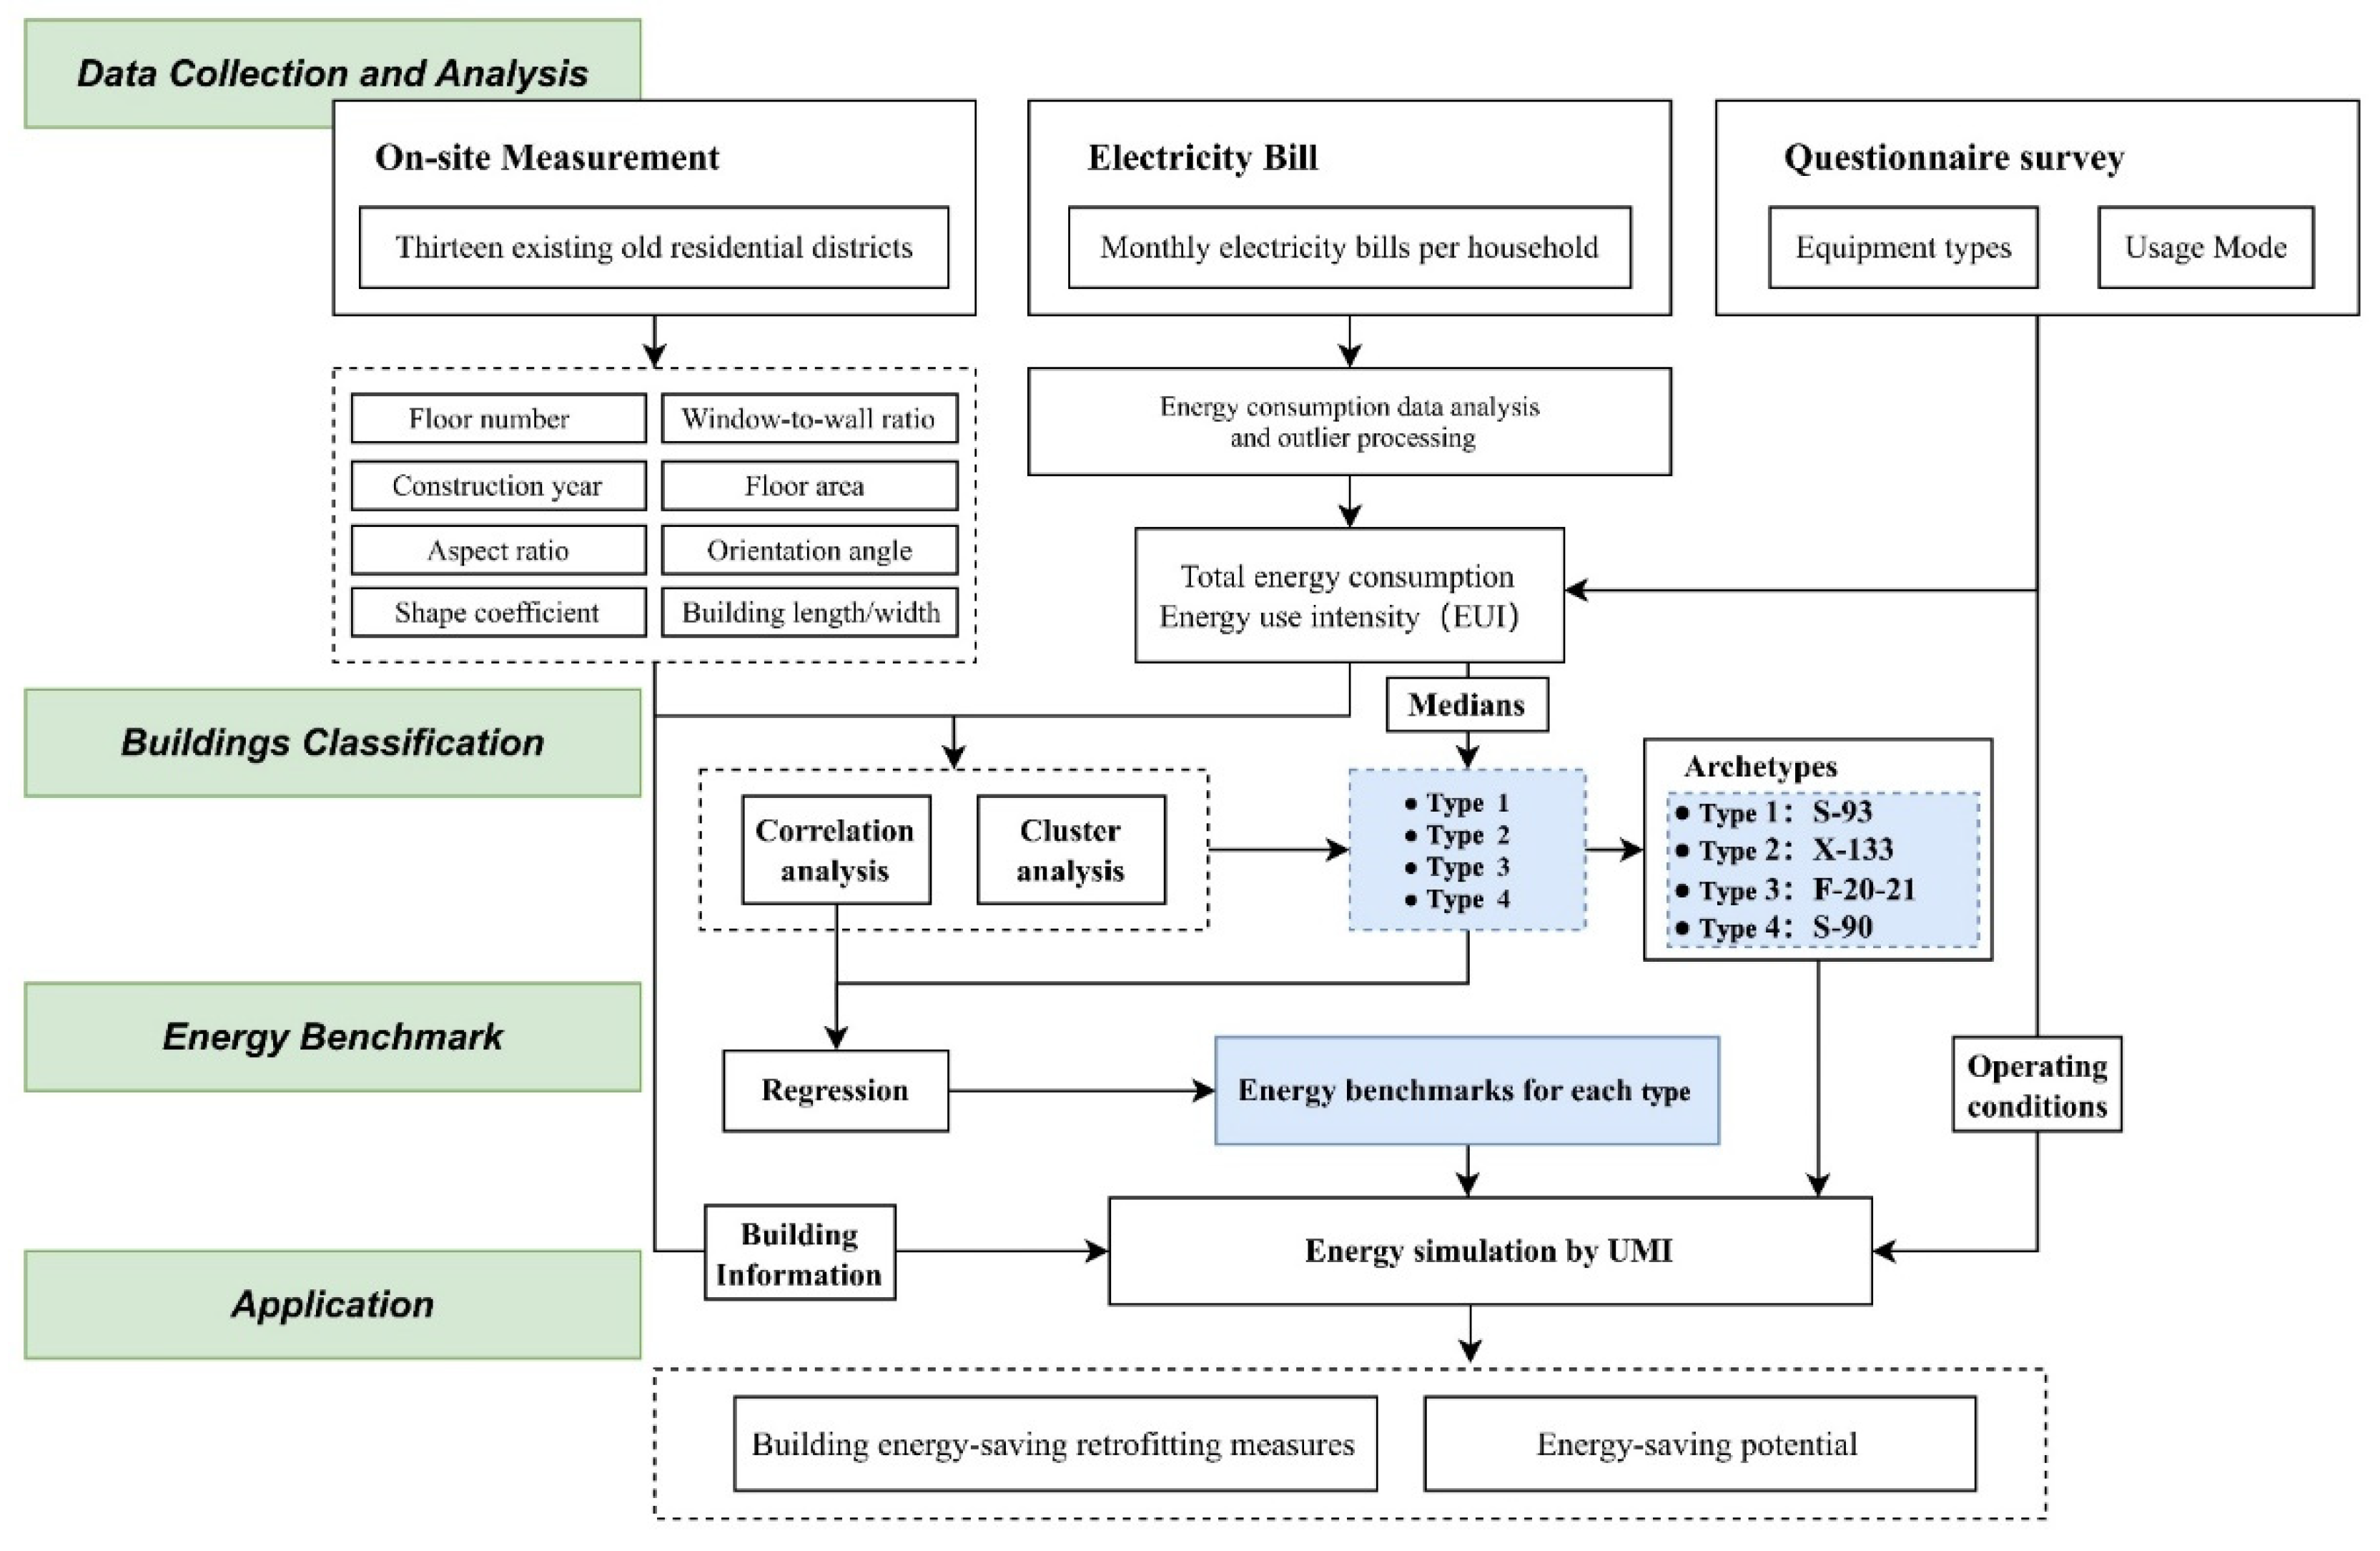
3.1. Methodological Framework

In this paper, building energy consumption is measured by household electricity consumption. According to the source of energy input, the energy involved in residential buildings mainly contains three types: water, electricity, and fossil energy (such as coal, oil, natural gas, etc.) [77], which can be divided into two major parts in terms of usage: daily life energy and thermal comfort regulation energy. The energy for daily life is related to the energy use behaviors of residents and the type, quantity, and power of the equipment, which is less affected by building forms. In contrast, the energy required for thermal comfort regulation is strongly related to the building’s form characteristics. Relevant studies show that the energy consumption for cooling and heating residential buildings in hot summer and cold winter zones accounts for more than 40% of the total annual energy consumption [8]. At the same time, according to the research on residents’ energy use behaviors, electric devices such as air conditioners, electric fans, and electric heaters dominate the thermal comfort regulation methods in Chongqing in winter and summer, and the proportion of devices using gas for heating is low. Gas is mainly used for cooking, which contributes to residents’ daily energy consumption. Therefore, in the discussion of the relationship between energy consumption and the form of residential buildings in this article, only electricity consumption is used as the evaluation standard without considering gas or water, and the electricity consumption per unit building area (kWh/m2) is used to describe EUI.
The methodological framework of this study is shown in Figure 1. We first collected the form information and energy consumption behavior information of 370 residential buildings in 13 old residential districts built before 2000 in Chongqing, as well as the energy bills of 7 districts from 2017 to 2021. After handling abnormal data from residential buildings, we calculated the total energy consumption and EUI of each building under the condition of an expected occupancy rate of 100%. Then we analyzed the energy characteristics of residential buildings in Chongqing. Next, the typology method was employed to identify the key building form parameters that influence EUI through correlation analysis. Sample buildings were then classified using clustering analysis, and the archetype buildings were determined. Subsequently, multiple linear regression equations were established to correct the EUI value of each building, and then the energy benchmarks of each type of building were obtained. Finally, the energy-efficiency retrofitting measures for different types of buildings and the energy-saving potential of HEBs were briefly discussed.

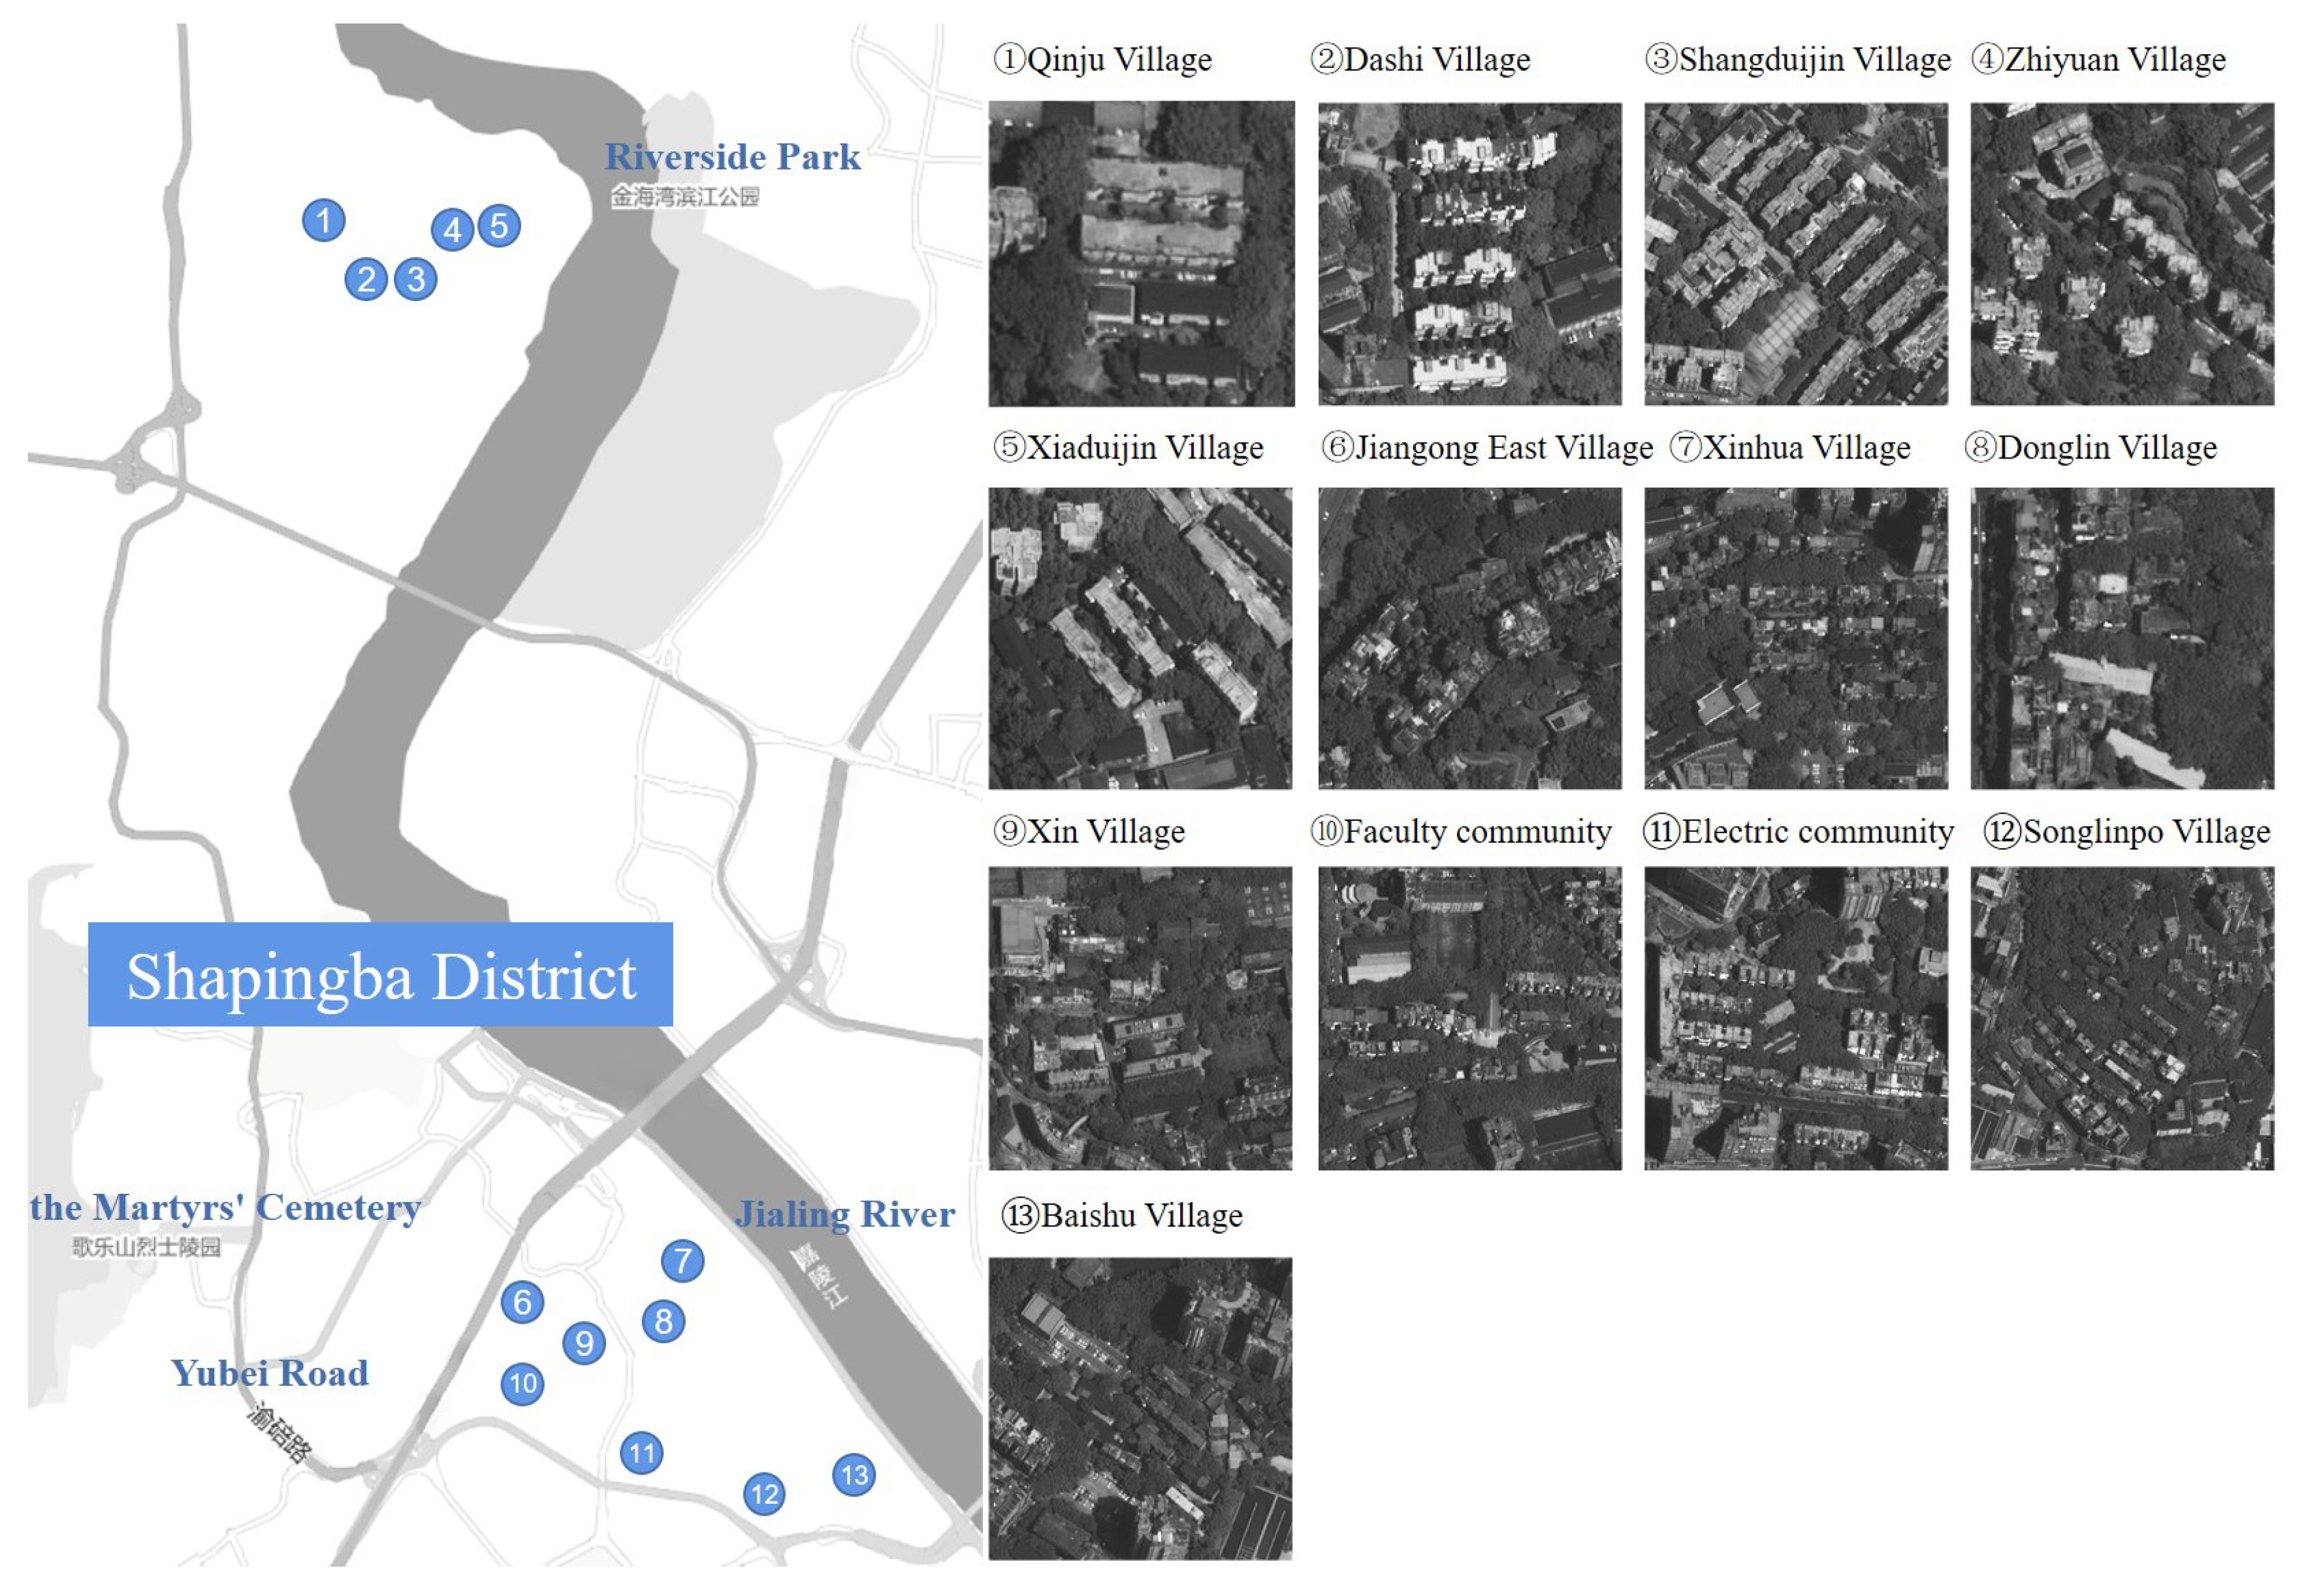
3.2. Data Collection and Analysis

Based on research and the literature analysis, as one of the core old urban areas in Chongqing, Shapingba still retains a large number of representative residential buildings from different periods, and they are relatively concentrated in distribution. Therefore, the study takes the old residential districts in Shapingba as the sample area, with a north-south range of about 6 km and an east-west range of about 3 km, selecting 13 residential districts (Figure 2), with a total of 373 buildings, including 370 buildings built before 2000, which contained 816 units and 11,868 households, with a total building area exceeding 780,000 m2. A field survey of building forms, a questionnaire survey of residents’ energy consumption behaviors, and data collection of residents’ energy bills were conducted in the selected old districts.
For building form information, based on expert opinions and the results of previous studies, the following building form parameters related to energy consumption were selected for participation in the study.
(1) Construction year (CY): For residential buildings in China, their construction methods, structural practices, thermal performance of materials, and other characteristics are constrained by the construction standards promulgated by relevant government departments. The standards have been revised and updated over time. For example, from 1986 to 1995, it was a trial period for China’s energy-saving design standards. In 1995, the “Energy conservation design standard for new heating residential buildings” JGJ26-1995 was officially released. In 2001, the national “Design standard for energy efficiency of residential buildings in hot summer and cold winter zone” JGJ134-2001 was issued. The relevant standards in Chongqing were promulgated in 2002. Thus, the CY is correlated with the building scale, form characteristics, and material thermal properties of the envelope. Moreover, the CY is easier to identify and collect than building materials; therefore, it was considered one of the research parameters.
(2) Floor number (FN), building length (BL), and building width (BW): The correlation between the spatial forms of residential buildings and energy consumption has been confirmed in relevant research [68]. Therefore, the three-dimensional data on building geometry were included in the study. Due to the difficulty in measuring building height, the floor number was used to replace building height, as the floor height of residential buildings was generally uniform.
(3) Floor area (FA): The dimension of building geometry affects the building area, and energy per unit building area is the most commonly used indicator to measure building energy performance (kWh/m2). Meanwhile, in some studies, the contribution of building area to energy consumption prediction and analysis was significant [78], and building area was one of the most important indicators suitable for establishing energy benchmark models [79].
(4) Aspect ratio (AR): AR refers to the ratio of the length to the width of a building plan. Buildings with an AR less than 2 are usually regarded as point-like buildings, while buildings with an AR greater than or equal to 2 are classified as slab-like buildings. Under the same floor area conditions, a higher AR corresponds to a greater shape coefficient of the building, resulting in an increased likelihood of high energy consumption [80].
(5) Shape coefficient (SC): The SC of a building is determined by the ratio of the building’s surface area (excluding the bottom) to its volume, which is influenced by the building’s three-dimensional geometric data and floor area. A larger SC implies a greater surface area for heat exchange between the building envelope and the air, and studies have indicated an inverse relationship between the SC and building energy consumption [51]. Following the “2002 Standard”, the SC value is restricted based on different AR; specifically, the SC of point-like buildings must not exceed 0.4, and the SC of slab-like buildings must not exceed 0.35 [81].
(6) Orientation angle (OA): The orientation of buildings directly affects the efficiency of solar radiation and natural lighting, thereby affecting the energy consumption for cooling, heating, and artificial lighting. In the energy-saving design optimization algorithm for low-energy buildings [82], the optimal building orientation was always the same, demonstrating the significant impact of orientation on building energy. In the data statistics of this study, the orientation of the long side facade was taken as the standard, with 0° indicating a south-facing angle, positive numbers indicating clockwise westward deviation, and negative numbers indicating counterclockwise deviation.
(7) Window-to-wall ratio (WWR): The WWR refers to the ratio of window area to exterior wall area on each facade, and the restrictions on the WWR vary for different orientations. Houcem [83] considered that the WWR and SC were the two factors that had the greatest impact on heating energy consumption, while the WWR had the greatest impact on cooling energy consumption.
We utilized institutional resources such as the Infrastructure Department and Archives to obtain design documents and drawings for basic building information. Satellite maps, online resources, and on-site surveys were conducted for facade images and form information (Figure 3). Eventually, a table of building information was created, including the construction year, floor number, floor area, building length, building width, aspect ratio, orientation angle, shape coefficient, and window-to-wall ratio, providing the basis for subsequent quantitative research on building energy consumption.
A questionnaire survey was used to collect information on residents’ energy use behaviors. A total of 112 questionnaires were distributed, with 103 valid responses received. The survey included information on the methods used to improve heat comfort during summer and winter, the types of equipment used, the temperature that air conditioning (AC) sets, and the regular operating time of equipment. Considering the small sample size of the questionnaire, the relevant results were supplemented and verified from existing research on a larger sample of thermal comfort regulations and air conditioning usage patterns in Chongqing.
To collect residential energy consumption data, we collaborated with the energy management platform to obtain the monthly electricity bills for each household in seven sample districts from 1 January 2017 to 31 December 2021, covering 141 residential buildings and 4289 households. The total energy consumption and EUI of each building were obtained by cumulatively calculating the annual energy consumption of each household in the building, which served as the basis for the energy analysis.
In addition, there were more detailed steps in processing electricity bills. Based on the survey results of the questionnaire, electricity consumption dominated over gas consumption for winter heating in residential buildings; therefore, the EUI of residential buildings is characterized by electricity consumption only. For the reliability of the energy data of the sample buildings, it is necessary to verify and process the collected energy data. During preliminary analysis, redundant data, zero energy consumption, and extremely low/high energy values were observed in the electricity bill data due to various objective influences such as changing the electricity meter, deviation in the data collection time, and occupancy rate. From the histogram of the EUI value distribution of each household (Figure 4), it shows that the EUI value distribution is skewed, resulting in energy analysis results based on the original data being underestimated. Therefore, the boxplot method was used to remove outliers [84]. As the logarithmic function is sensitive to changes in values between 0 and 1, the natural logarithm with e = 2.718282 can be used to transform the EUI values logarithmically and remove extremely small values. In contrast, the EUI values that have not been logarithmically transformed can remove extremely large outliers. Afterwards, the interpolation method replaced the outlier values with the median of the remaining household EUI values after removing the outliers for each building. The entire building was removed where the proportion of outlier households exceeded 50%. Then, the total energy consumption and E U I s under the assumption of a 100% occupancy rate for each building, were obtained. The calculation process is as follows:
E t o t a l = i = 1 n E i
E = j = 1 m E j + m E M e
E t o t a l , s = E t o t a l + E
ω = E t o t a l , s E t o t a l E t o t a l
E U I = E t o t a l S
E U I s = E t o t a l , s S
where E t o t a l is the total energy consumption of each building obtained from the electricity bills in kWh; n is the total number of households, E i is the total energy consumption of each household in kWh; E is the correction amount of the total energy consumption of each building in kWh; m is the number of households with outliers, E j is the energy consumption of outlier households in kWh; E M e is the median energy consumption per household in the building after removing outliers in kWh; E t o t a l , s is the corrected total energy consumption of the building in kWh; E U I is the energy use intensity from the electricity bills in kWh/m2; E U I s is the energy use intensity of the building after correcting in kWh/m2; S is the building area of each building.

3.3. Formulating Energy Benchmarks

3.3.1. Classification Method of Residential Buildings Based on Typology

The sample residential buildings can be classified into different types based on their form characteristics. Moreover, a representative archetype building can be extracted from each type. By conducting energy analyses on these archetypes, specific energy-saving measures can be proposed for each type of building, thus allowing for large-scale energy-efficient retrofitting [66]. Sample buildings were classified based on E U I s and building forms. Due to the non-normal distribution of some form parameters of buildings, Spearman correlation analysis was used to analyze the correlation between the CY, AR, BL, BW, FN, FA, SC, OA, and E U I s of buildings to determine the classification indicators. Afterwards, sample buildings were classified using clustering analysis. K-means clustering and hierarchical clustering are common methods. Hierarchical clustering was used to obtain a reliable number of classifications, and the final classification results were determined by K-means clustering. The building cases closest to the clustering center were selected as the archetype buildings for each cluster [85], and the parameter sets were set.

3.3.2. Formulating Energy Benchmark for Each Type of Residential Buildings

When determining energy benchmarks based on statistical data, the median EUI of buildings of the same type is usually selected to represent the general level of energy efficiency, which serves as the energy-saving target for HEBs [10,17,51,86]. Based on the results of the building classification and E U I s , the E U I s medians were used to determine the energy benchmarks for each type of residential building.
In addition, the energy consumption intensity per unit building area only considers a single indicator of building area, while changes in the form under the same area conditions will lead to differences in EUI [51,87,88,89].
The EUI values can be corrected according to the method used for public buildings in the “Standard for energy consumption of building” GB/T51161-2016 (“Standard 2016”) [90]. The correction considered key factors such as annual service time and average room occupancy rate, which have been identified as having the most significant impact on public building energy. Statistical data from energy audits and energy consumption monitoring in cities such as Beijing, Shanghai, and Shenzhen was used to determine the standard deviation and average value of these factors, which were then used to standardize the actual EUI of public buildings. Our study identified important influencing parameters for different residential building types by analyzing the correlation between variables and EUI. A process model between EUI and standardized characteristic parameters was established using multiple linear regression equations. Afterwards, the EUI values of residential buildings in each type were corrected, and then the medians of the EUI were finally used as the energy benchmarks.

3.4. Energy Simulation of Energy-Saving Measures and Potential

The “Technical specification for the retrofitting of residential buildings on energy efficiency” DBJ50/T-248-2016 (“Technical specification 2016”) [91] was issued by the Chongqing Housing and Urban Rural Construction Commission in 2016. “Technical specification 2016” emphasized that energy diagnosis should be carried out first for retrofitting, and technical reliability, operability, and economy should be considered. Depending on the project’s actual situation, individual or comprehensive energy-efficiency retrofitting can be conducted. However, energy diagnosis requires professional institutions and detailed technical engineering documents, making it difficult to perform for a large number of existing buildings. Therefore, it is not feasible for large-scale implementation. The primary focus of the retrofitting principles is on summer insulation, while winter insulation is also considered. The retrofitting content mainly involves improving the building envelope structures, which include external windows, shading, exterior walls, and roofs, and secondly, improving the energy efficiency of household equipment. For roof retrofitting, the focus is on transforming flat roofs into sloping roofs in buildings with damaged roofs. Due to the different form characteristics of residential buildings of different types, the energy-saving measures may have varying effects on cooling and heating energy consumption. Therefore, there may be better options than adopting a unified energy-saving measure for buildings. Furthermore, applying all energy-saving measures to every building would also be a waste of resources. Therefore, the sensitivity of various building types to energy-saving measures can be analyzed based on prototype buildings, which will help evaluate the energy-saving effects and priorities of different measures.
Following the principle of minimizing the impact on building functionality, four commonly used retrofitting measures were selected: Measure 1 (M1): replacement of window glass (from ordinary gray absorbing glass to transparent insulated glass, reducing the heat transfer coefficient (HTC) from 5.7 W/m2·K to 2.8 W/m2·K); Measure 2 (M2): addition of movable exterior shading (reducing the overall shading coefficient of the window from 0.65 to 0.15); Measure 3 (M3): enhancement of exterior wall insulation performance (reducing the wall HTC from 1.5 W/m2·K to 1.05 W/m2·K); and Measure 4 (M4): use of AC with higher energy efficiency ratio (the energy efficiency ratio for cooling increased from 2.3 to 2.6, and that for heating increased from 1.9 to 2.35, which meets the minimum requirement for the higher-level energy efficiency standard).
Energy simulations were performed based on each archetype building to analyze the energy-saving rates of various retrofitting measures on cooling and heating energy consumption. The results were used to determine better priority energy-saving measures. Additionally, these energy-saving measures were implemented on HEBs to evaluate the energy-saving potential of the four building types.

4. Results

4.1. Existing Residential Building Form and Energy Consumption Characteristics

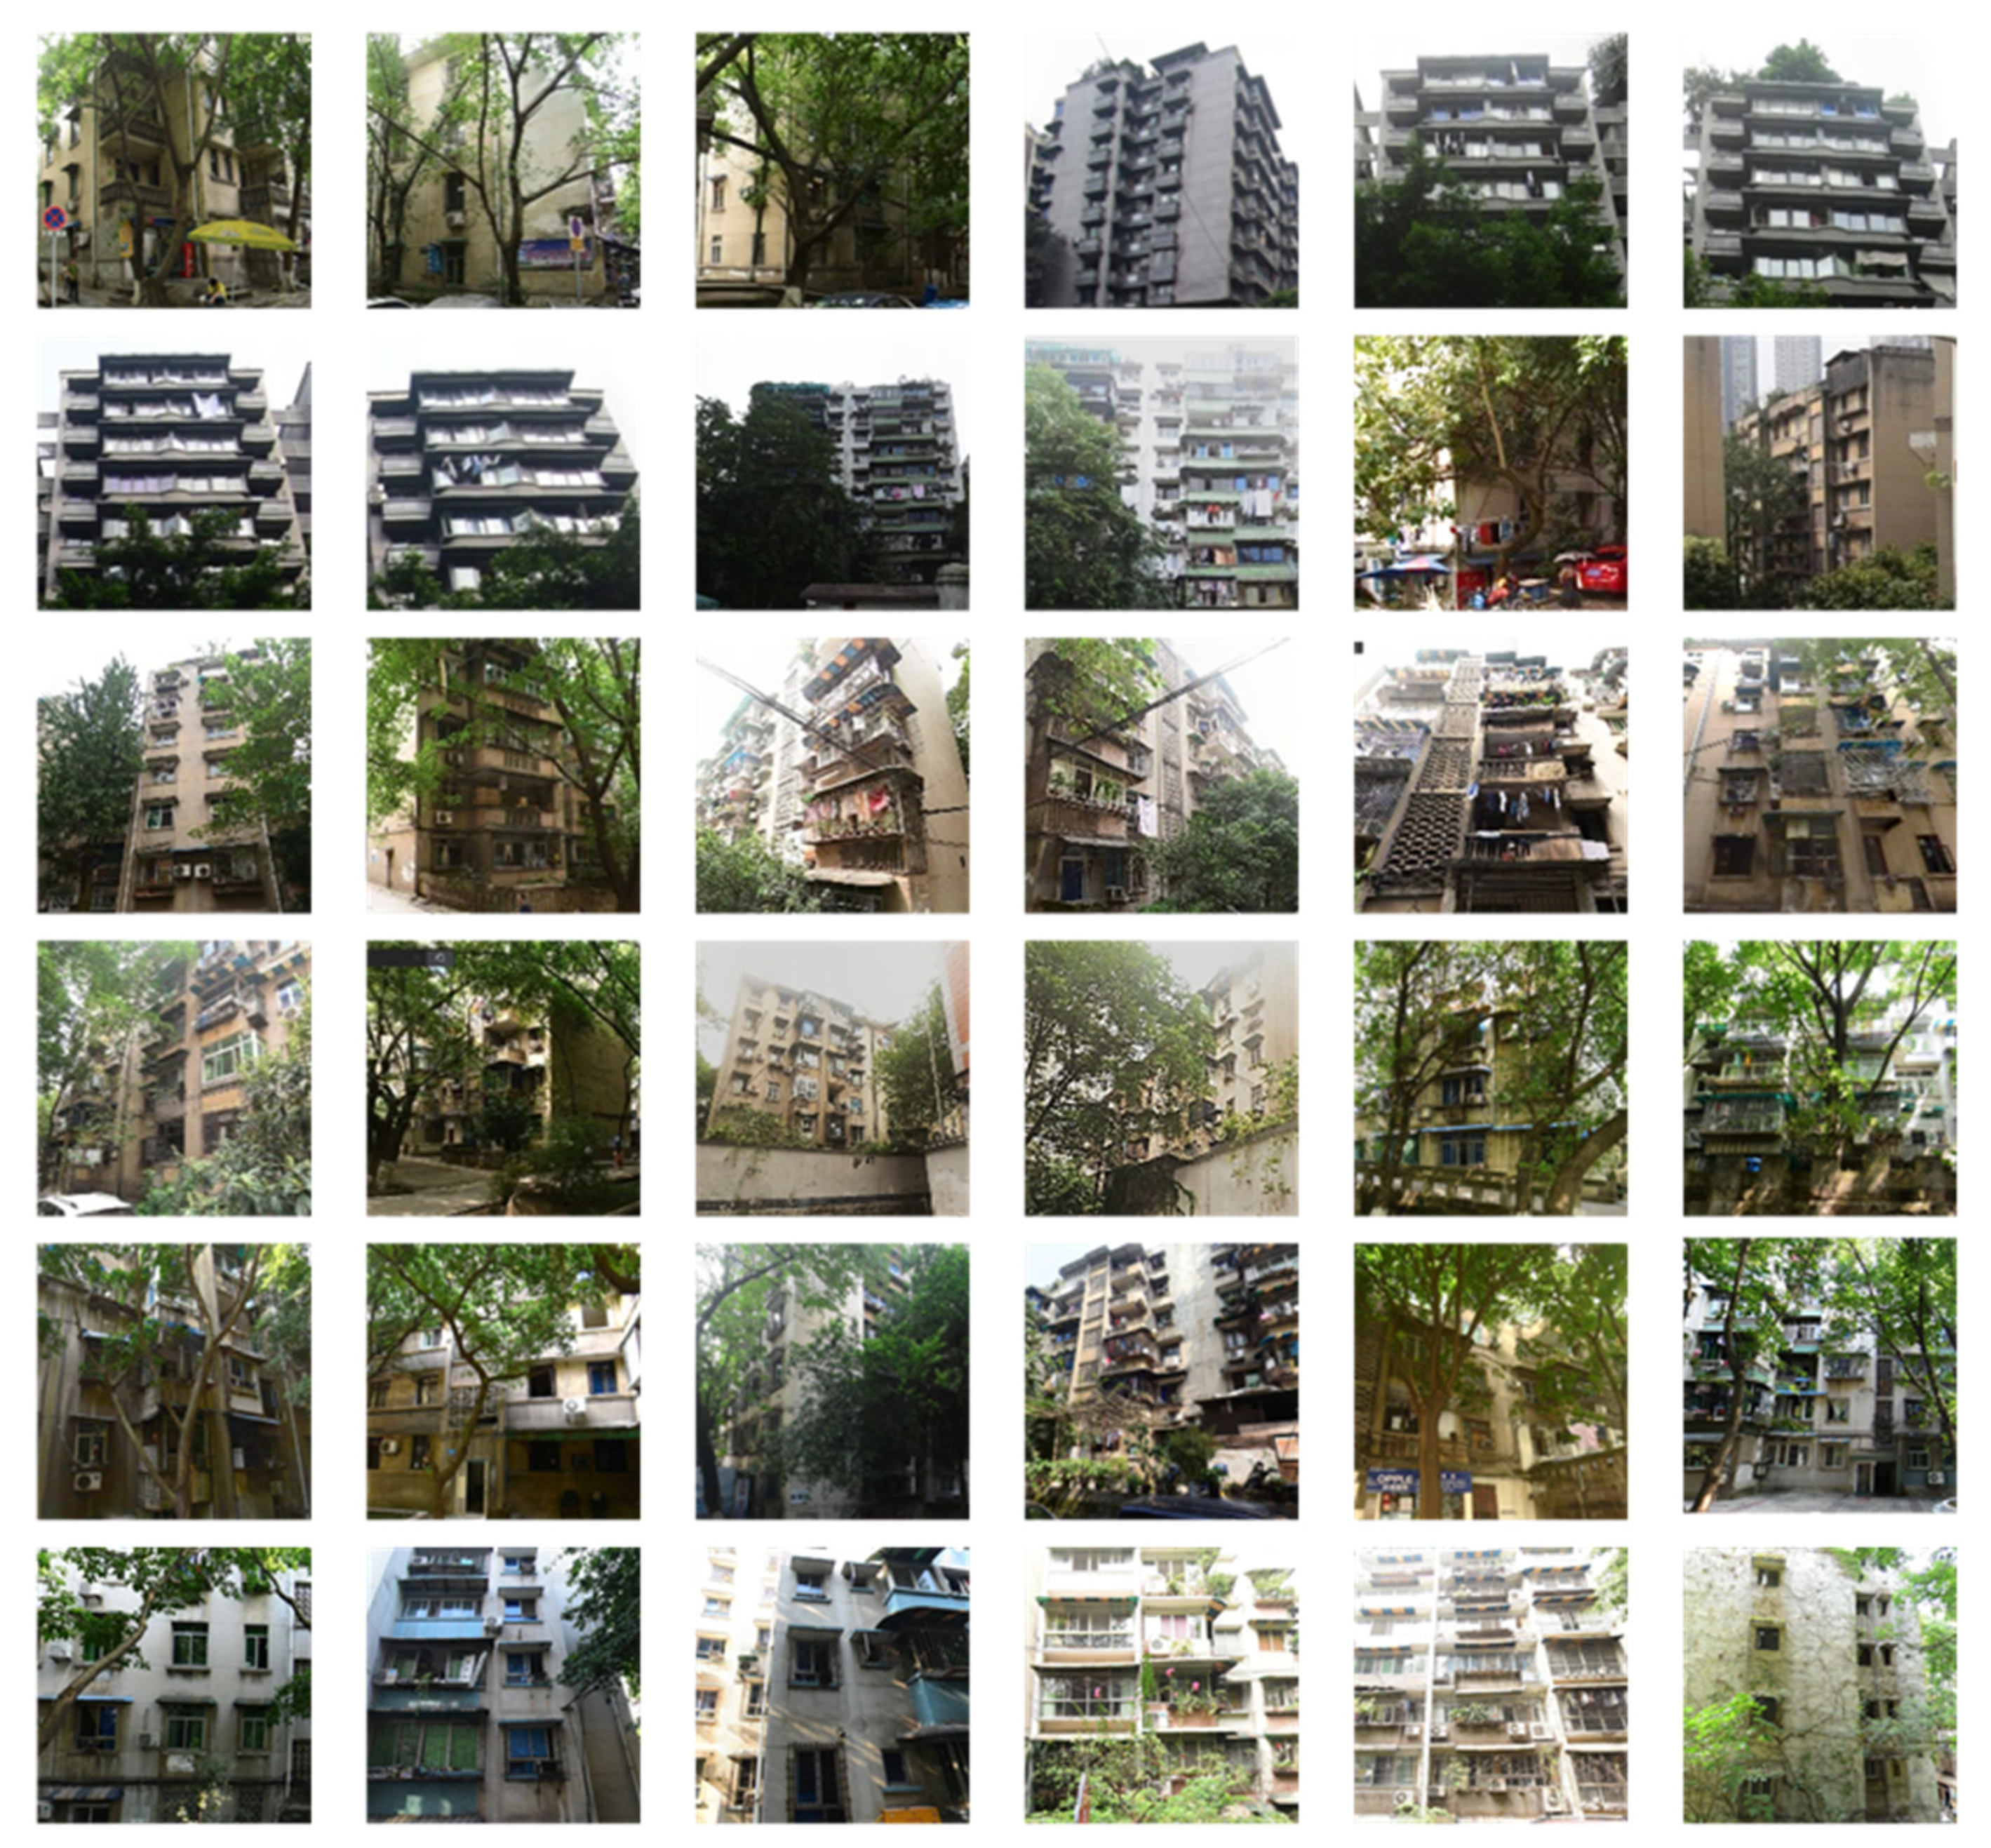
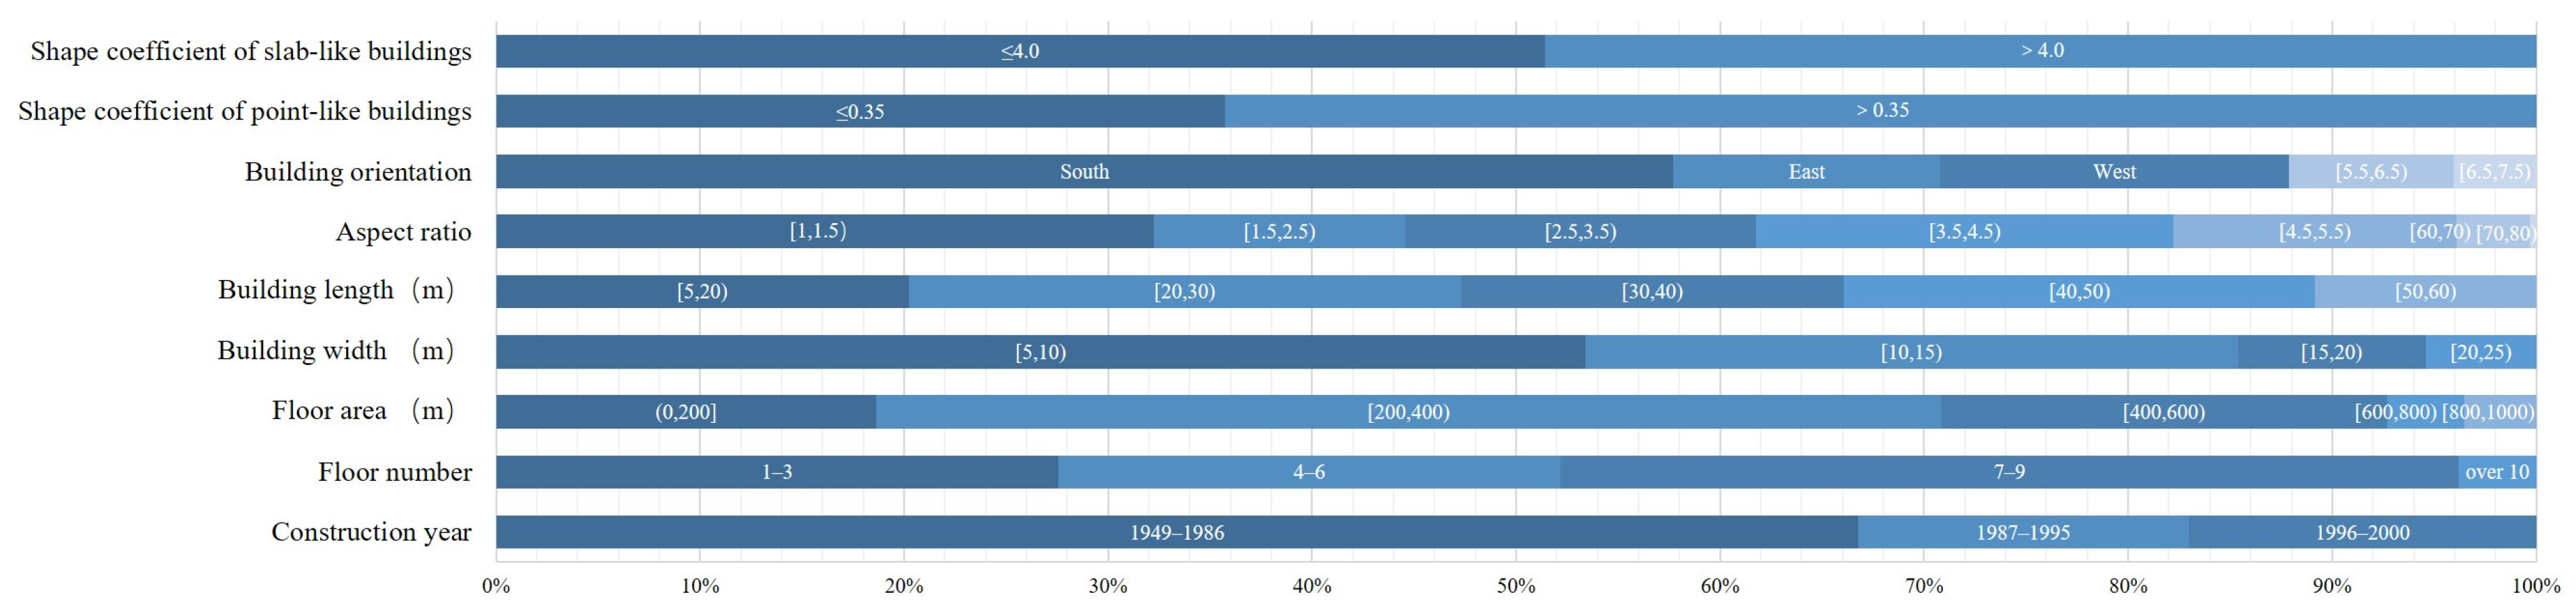
4.1.1. Form Characteristics of Sample Buildings

The form information of the sample buildings was investigated on-site. According to statistical analysis (Figure 5), the buildings constructed before 1986 accounted for the largest proportion, reaching 67%. A total of 96% of buildings had floors below 10, with 44% of buildings with 7–9 floors accounting for the most. Buildings with a FA of 200–400 m2 had the highest proportion, accounting for 52%. The AR distribution showed that the majority of buildings were slab-like in shape. The main distribution intervals of building length were 20–30 m and 40–50 m; 53% of buildings had a width range of 5–10 m, mainly 7–9 m. The OA data showed that the south was the main orientation, followed by the west. A total of 64% of the point-like buildings had a shape coefficient exceeding the standard value of 0.35, while 49% of the slab-like buildings exceeded the standard value of 0.4, indicating more energy-saving potential. The WWR on the west facade of the slab-like buildings was mostly less than 0.1, while on the other facades it was mainly distributed between 0.25 and 0.35.

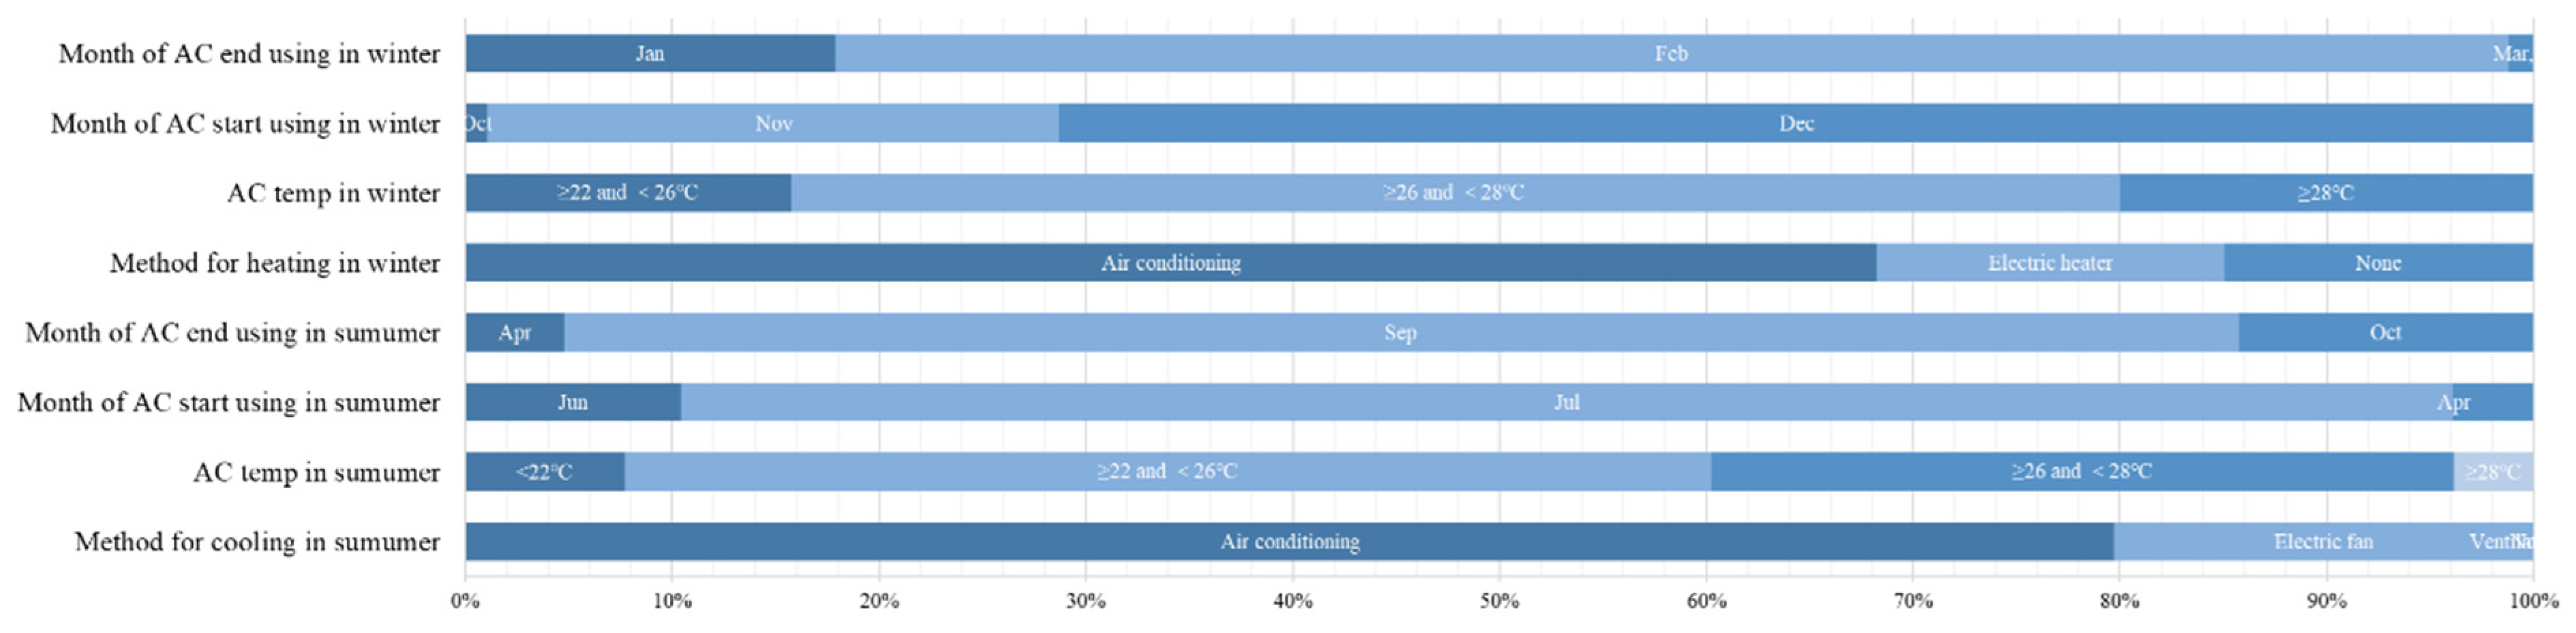
4.1.2. Energy Use Behavior Characteristics of Sample Buildings

The collection of energy use behavior information in the study mainly included the methods used to improve heat comfort in summer and winter, types of equipment used, AC temperature setting, and operating time (Figure 6). The results showed that AC was the main cooling method in summer, accounting for 76%; the temperature setting was mostly between 22 °C (inclusive) and 26 °C, which was not energy-efficient, accounting for the largest proportion of 52%. The peak usage of AC in the summer was from July to September. AC was also mainly used for heating, accounting for 68% in winter. The temperature was mostly set between 26 °C (inclusive) and 28 °C, accounting for 64%. The AC usage in the winter was from December to February of the following year.
Simultaneously analyzing the existing large-scale research on the utilization of thermal comfort adjustment equipment in residential buildings in Chongqing, it was observed that a high frequency of AC use occurred when the average outdoor temperature was above 30 °C during summer and below 13 °C during winter, according to the monitoring of the use of 575 ACs [92], which was consistent with the results of our questionnaire survey. In the survey of 2735 households [93], split AC was the primary cooling method in summer, and over 90% of households combined electric fans with AC for cooling. Furthermore, 54.55% of households set the temperature below 26 °C during the summer. The utilization of gas for heating during the winter was only 5.15%, and 20.94% of households did not use heating equipment. The rest of the households used AC or electric heating equipment, with 34.78% of households setting the temperature between 26 and 28 °C during the winter.
Considering the relevant research evidence, the qualitative conclusions regarding the primary use of electrical equipment in households for maintaining thermal comfort, the duration of equipment usage, and the preferred AC temperature settings were credible.

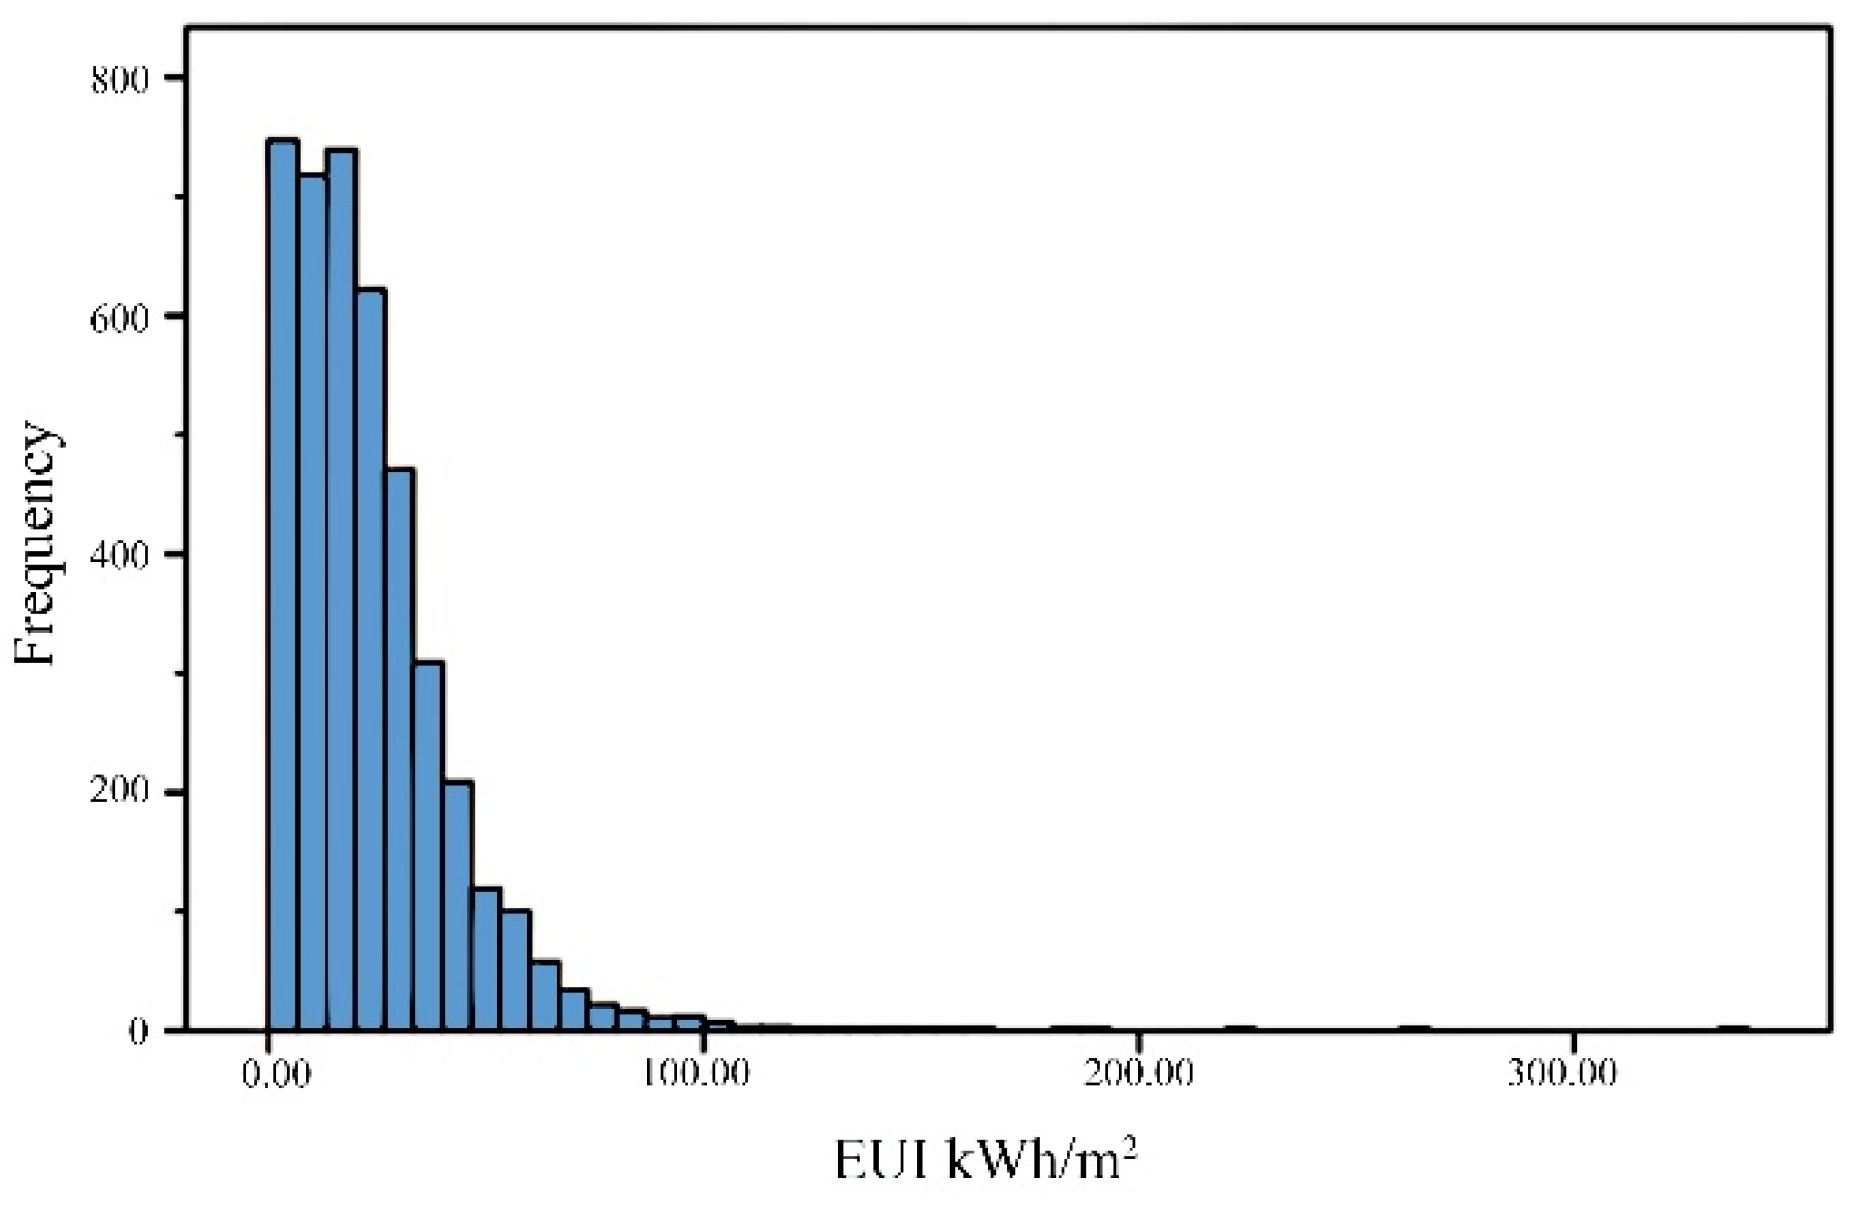
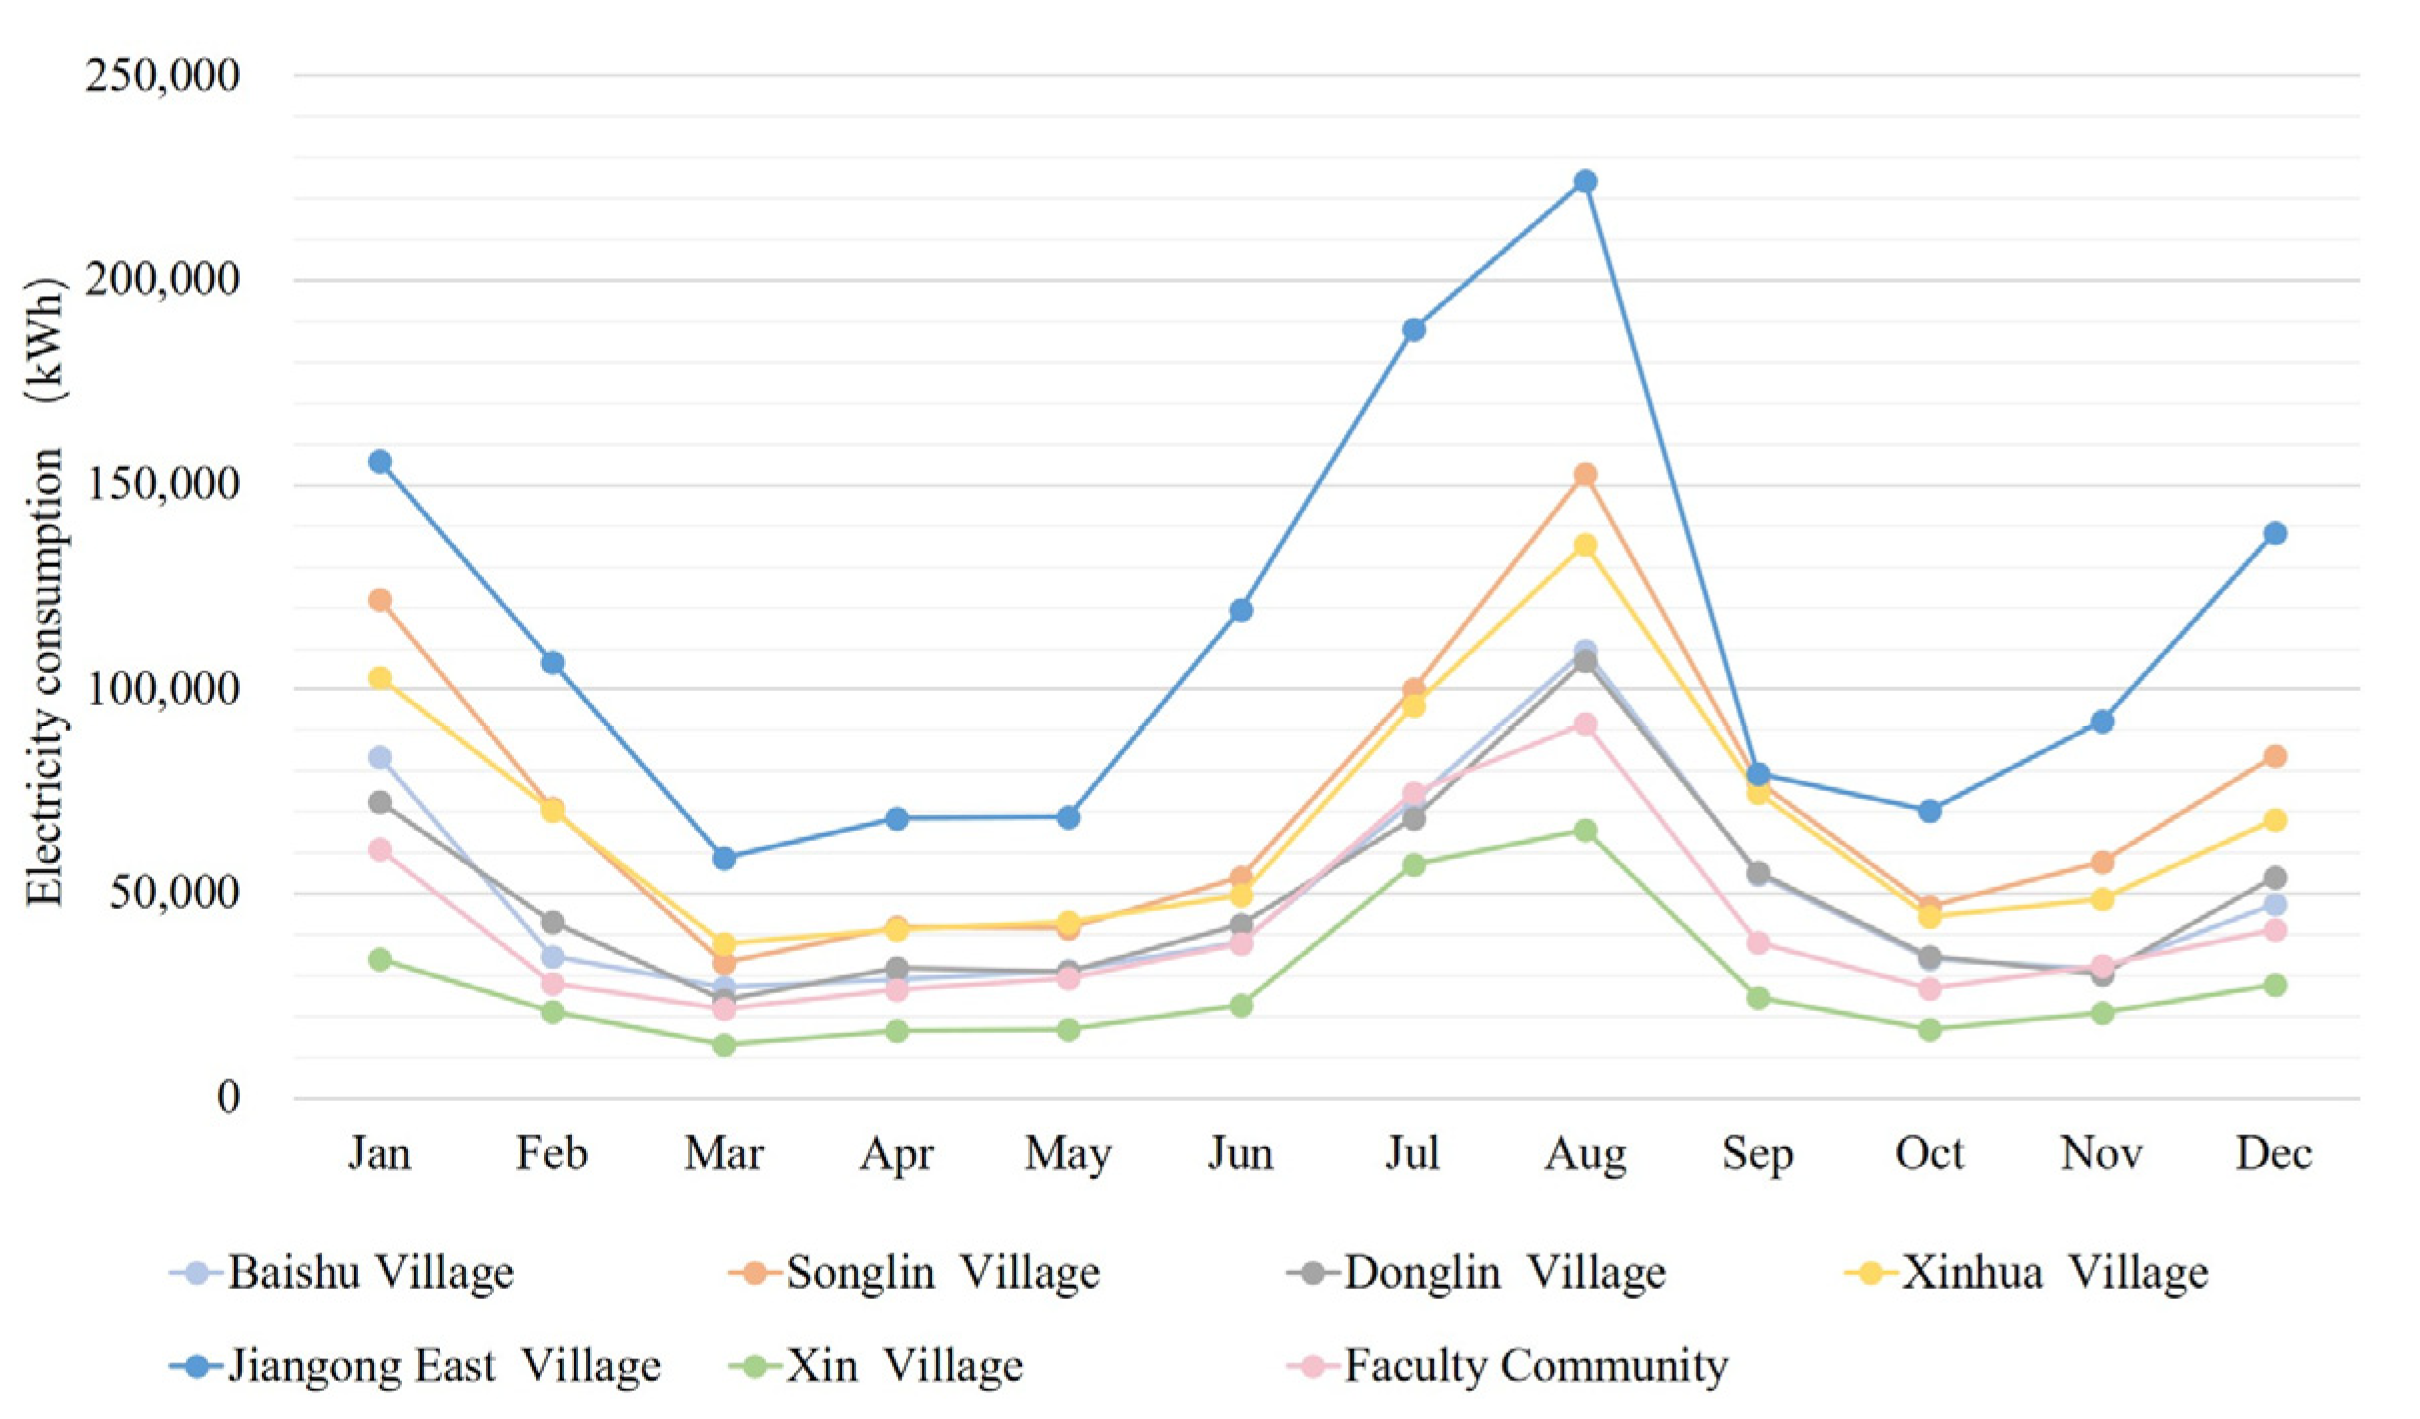
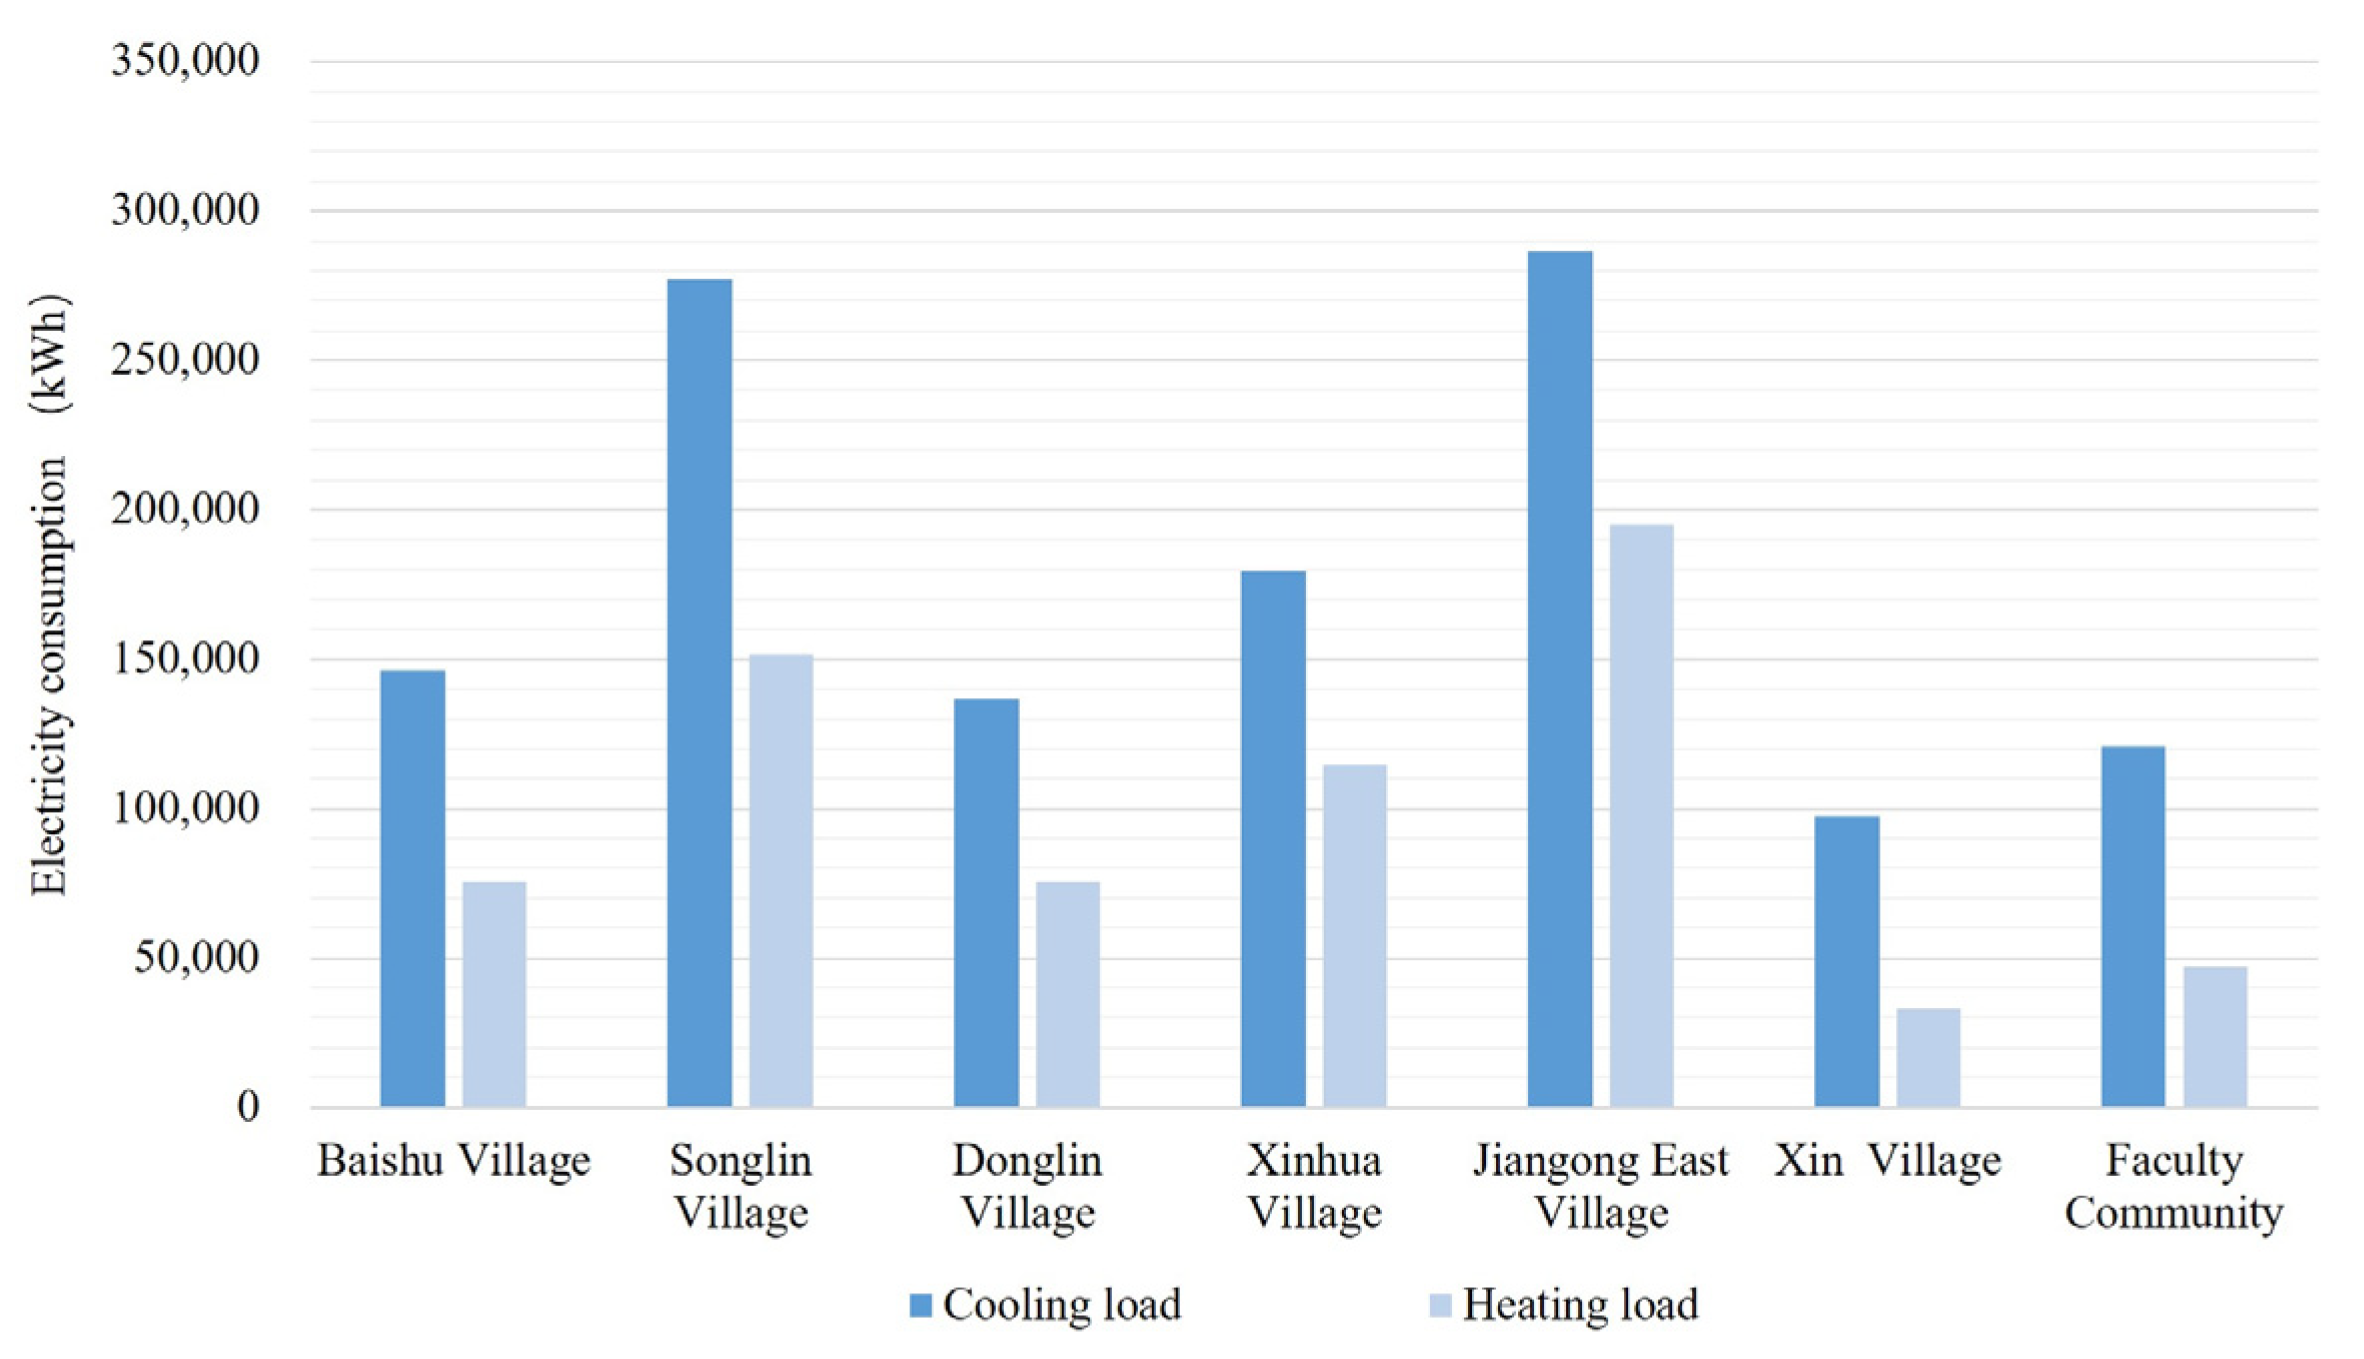
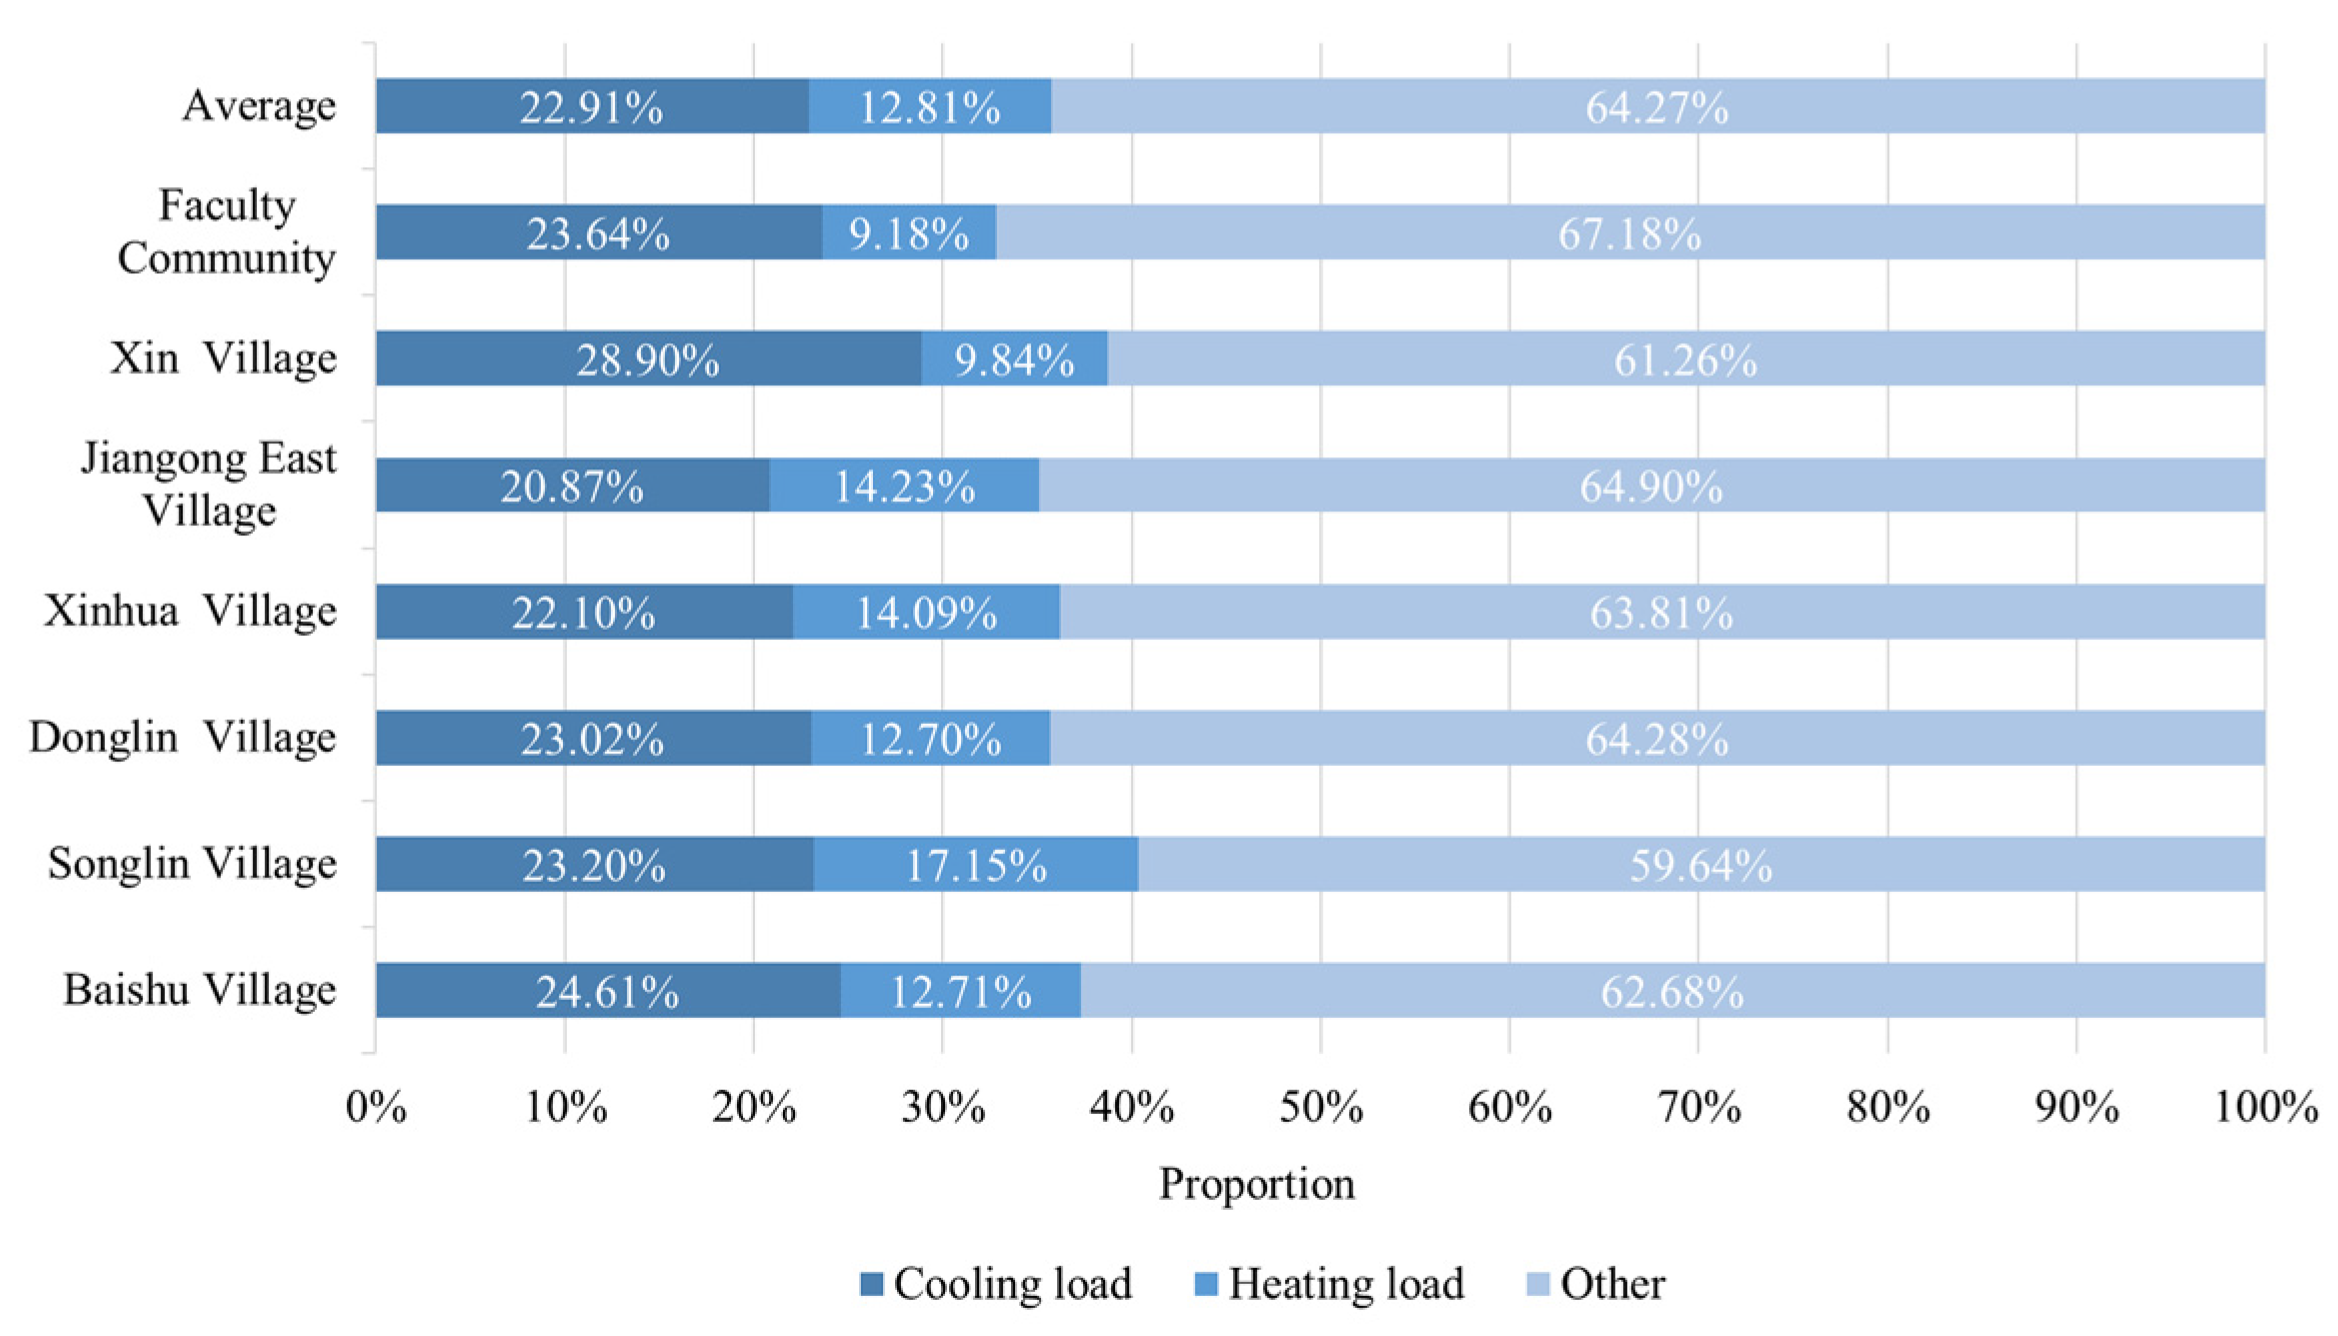
4.1.3. Energy Consumption Characteristics of Sample Buildings

After sorting the electricity data, a total of 677 outliers were screened out, and 17 outlier buildings were removed. The remaining 124 sample buildings were kept to study energy consumption characteristics. The average annual electricity consumption per household was 1431.29 kWh, with a median of 1293.60 kWh. The average EUI was 22.77 kWh/m2, with a median of 20.79 kWh/m2.
The annual energy consumption of each residential district is shown in Figure 7. The distribution trends were similar, with the peak energy consumption in the summer occurring from July to September and the peak in the winter occurring from December to February of the following year. The energy consumption during the steady period from April to May could be considered the daily energy consumption of residents. Therefore, the energy for cooling and heating could be calculated by subtracting the energy during the steady period from the sum of energy consumption during the summer and winter. The calculation formulas are as follows:
E d a i l y = E e , A p r + E e , M a y 2
E c o o l i n g , f = E e , J u l + E e , A u g + E e , S e p 3 × E d a i l y
E h e a t i n g , f = E e , J a n + E e , F e b + E e , D e c 3 × E d a i l y
where E d a i l y is the monthly energy consumption of daily life that does not include cooling and heating, E e , m o n t h is the energy consumption of each month, and E c o o l i n g , f and E h e a t i n g , f are the energy for cooling and heating, respectively.
The statistical results are shown in Figure 8, where the energy for cooling was much higher than that for heating. Based on the data from all households, the energy consumed for heating during the winter accounted for 55.91% of the energy consumed for cooling during the summer. As shown in Figure 9, the proportion of energy for cooling was 22.91% of the total annual consumption, while the proportion for heating was 12.81%, which accounted for 35.73% of the total annual energy consumption. The EUI for cooling was 5.21 kWh/m2, and for heating it was 2.91 kWh/m2.

4.2. Results of Energy Benchmarks

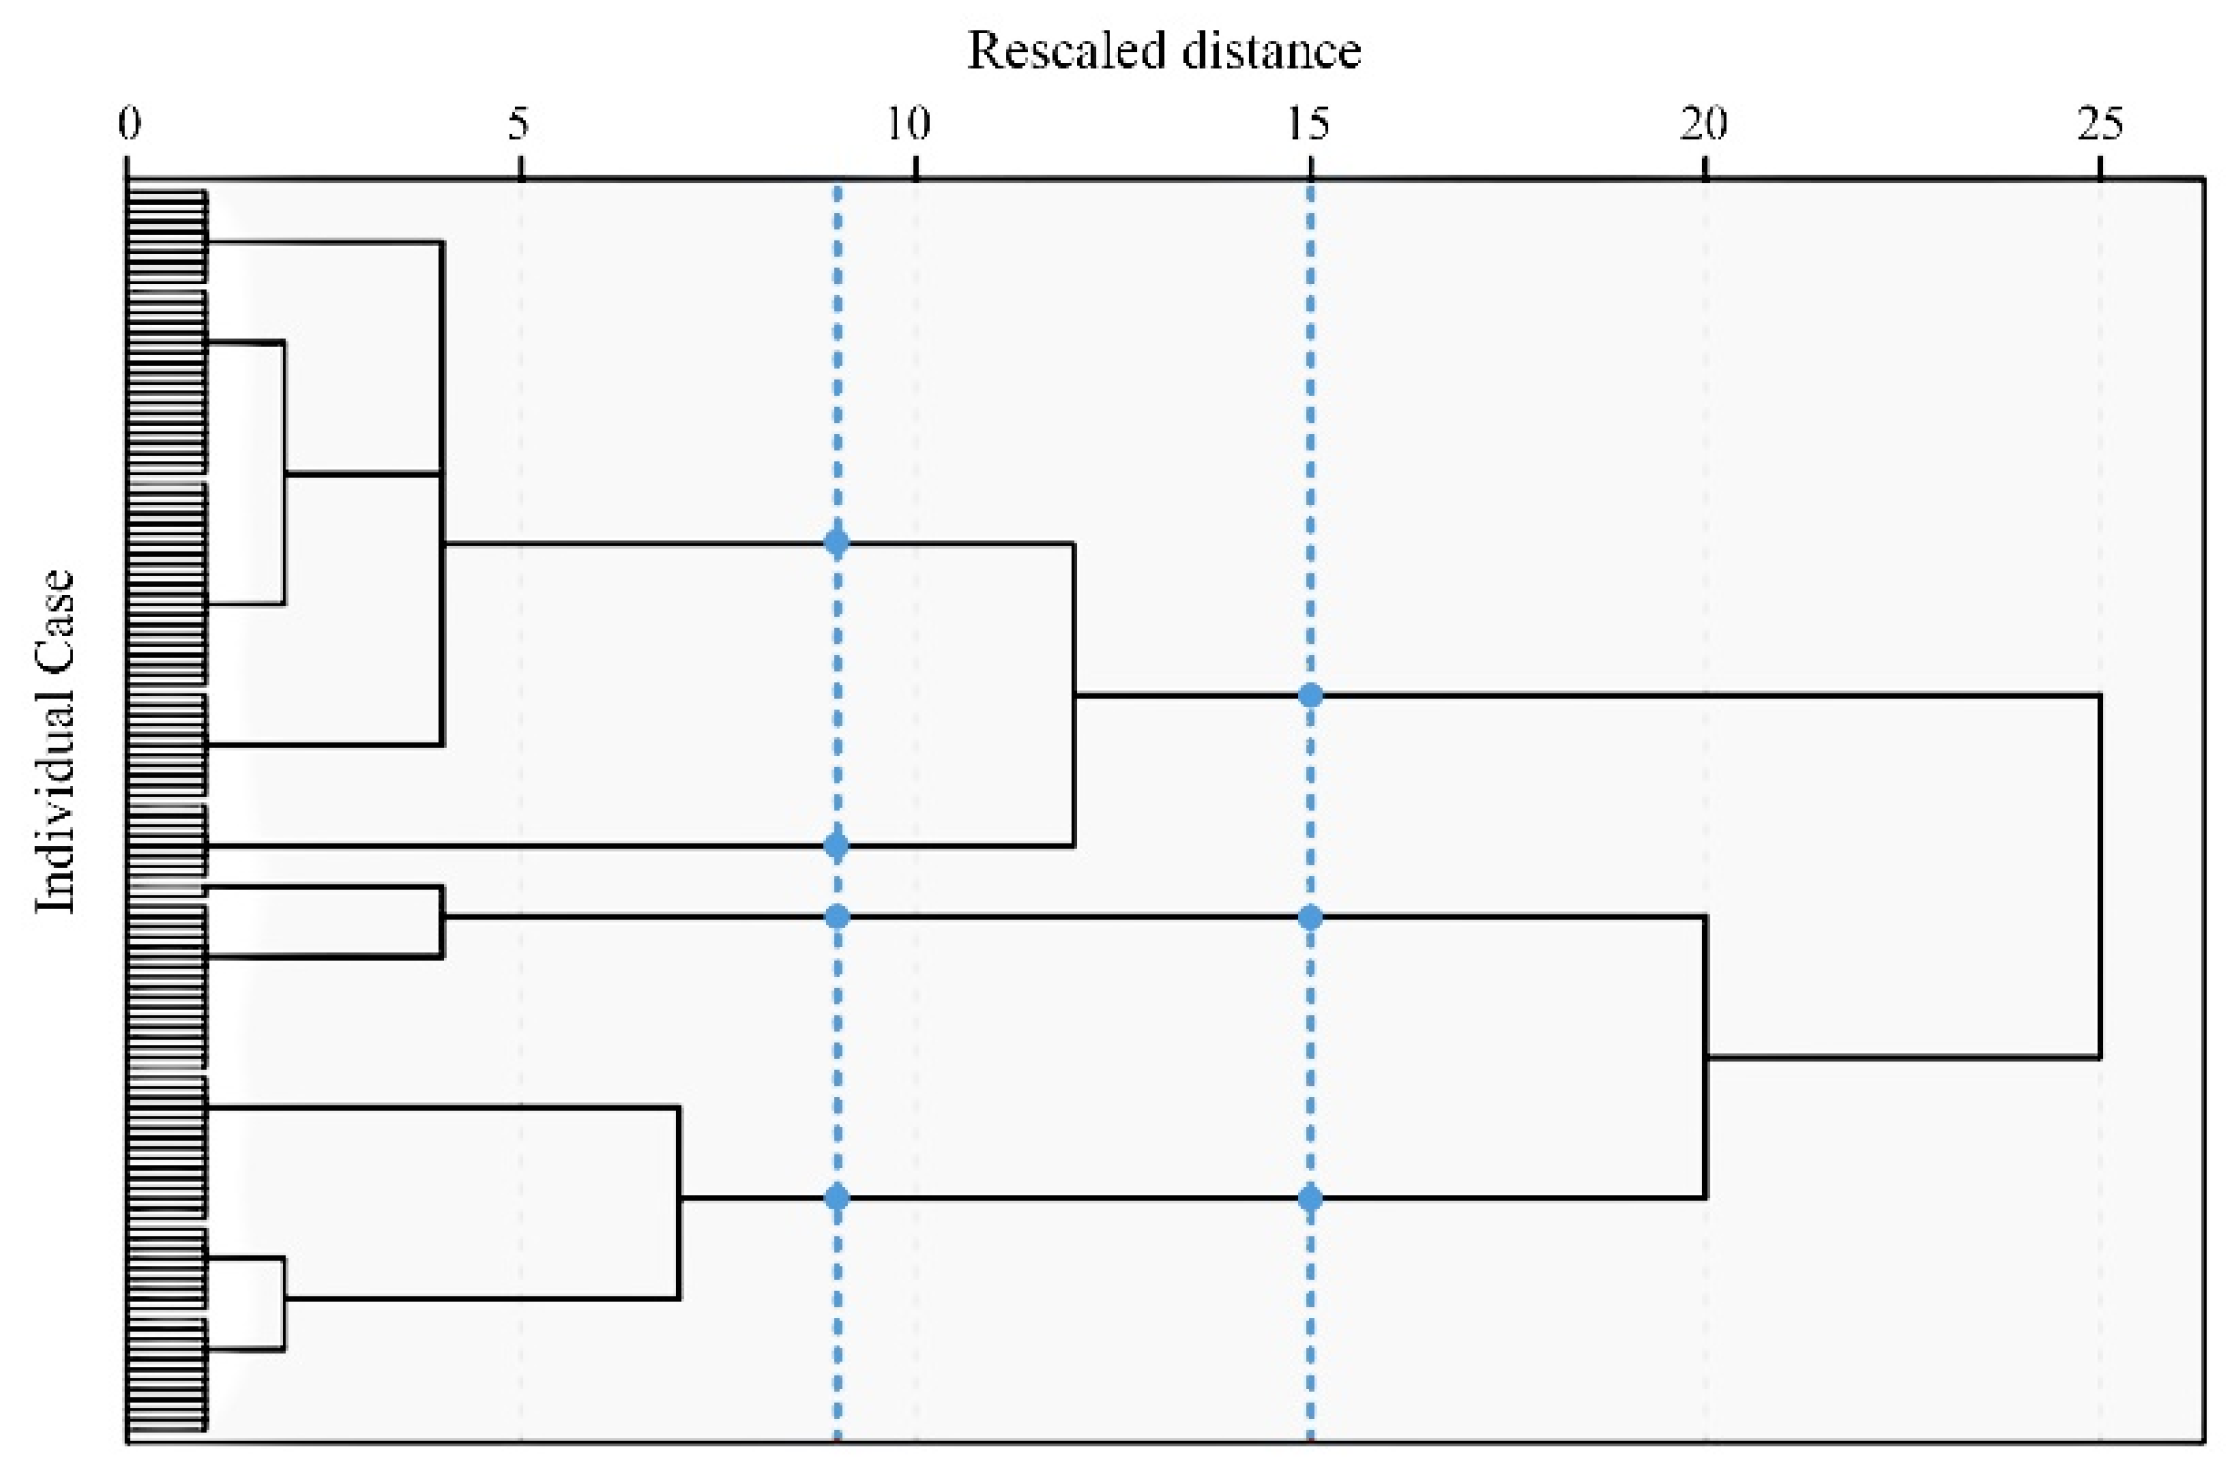
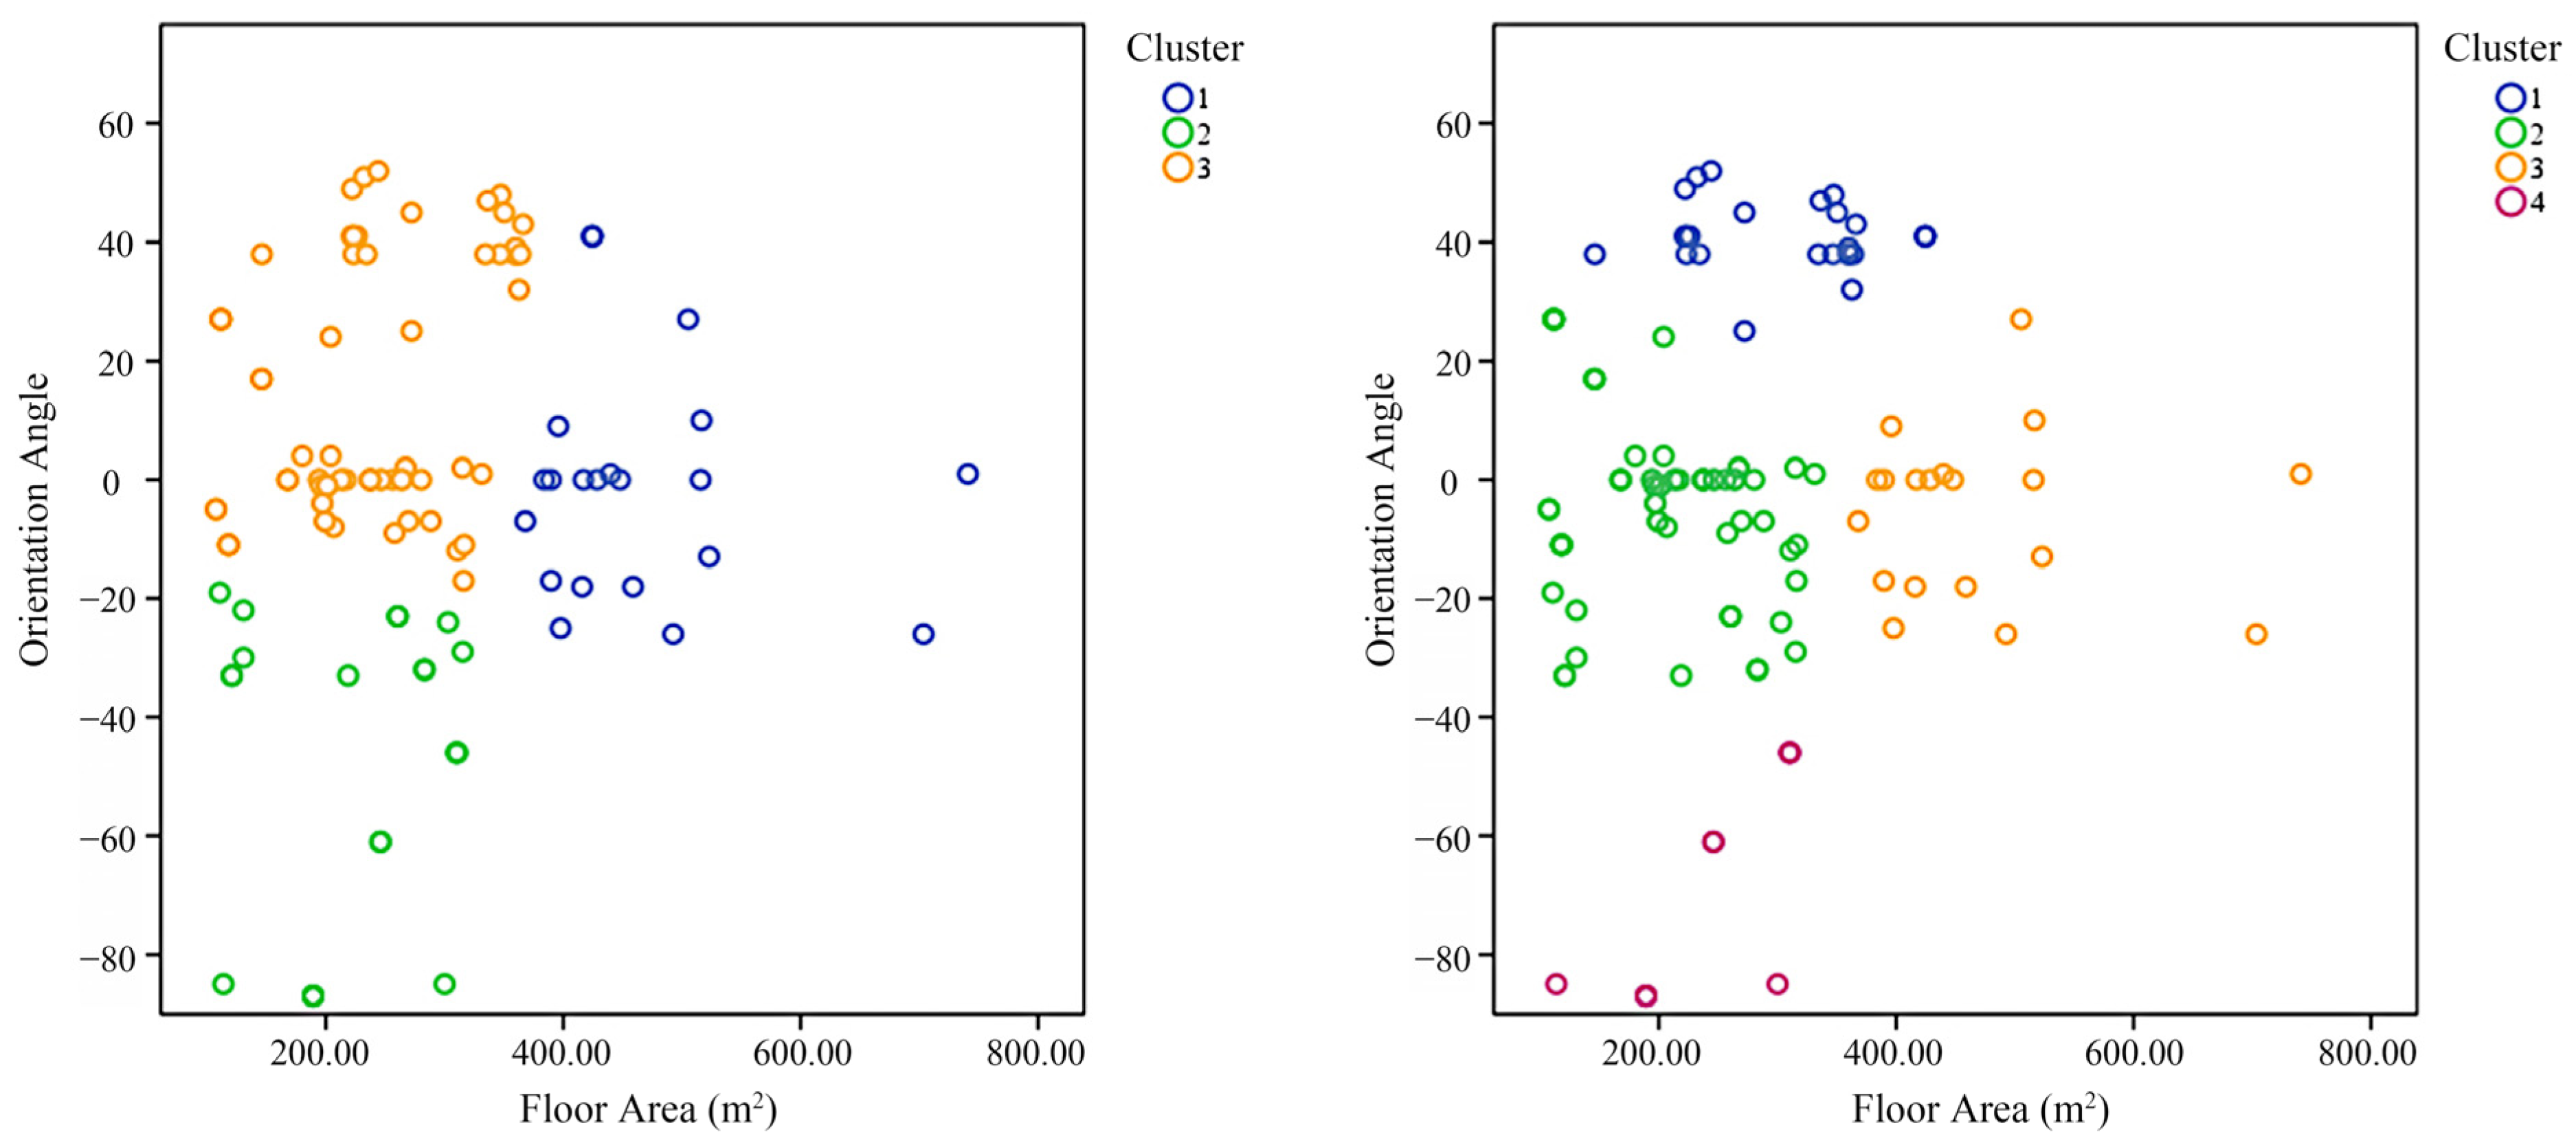
4.2.1. Results of Residential Building Classification

Table 1 shows the results of the correlation analysis between building form parameters and E U I s for each building in the sample. The analysis indicated a weak negative correlation between CY and E U I s , suggesting that newer buildings tended to have better energy efficiency due to the construction standards of different eras. The OA had a strong negative correlation with E U I s , meaning that as the orientation angle value increased, the energy efficiency of buildings decreased. In the sample, many buildings facing west had higher energy consumption levels due to the influence of solar radiation, while buildings facing south had lower energy consumption levels. FA had a strong negative correlation with E U I s , indicating that larger buildings tended to have lower energy consumption levels. Buildings with larger areas in the sample were mostly slab-like in shape, with many units side by side facing south, which had adequate natural lighting and reduced artificial lighting, leading to decreased overall energy consumption. The FN, AR, and SC of the buildings did not show significant correlations with E U I s in the sample. Therefore, cluster analysis was based on the most relevant parameters, FA and OA.
As shown in Figure 10, two vertical lines were drawn on the horizontal axis of the pedigree, and every intersection point of the vertical lines and the pedigree represents a type. When the sample buildings were divided into 3 or 4 types, the rescaled distances were relatively large, indicating that the grouping is relatively stable. The results were compared by setting 3 and 4 as the number of K values for K-means clustering. When divided into three types, the proportions of sample buildings in each cluster were 17.74%, 19.35%, and 62.90%, while the proportions were 20.97%, 54.84%, 15.32%, and 8.87% for four types, which led to a more uniform distribution. Meanwhile, the scatter plots in Figure 11 show that the classification criteria were more precise when divided into four types. Therefore, dividing the sample buildings into four types was chosen as the final result. At this point, box plots were used to analyze the E U I s of different residential building types (Figure 12), which showed significant differences in quartiles, medians, and overall data distribution of E U I s among the four types, indicating a reasonable classification [89]. Specifically, Type 1 had the characteristics of a FA less than 450 m2, facing eastward, and a lower overall EUI. Type 2 was characterized by a FA of less than 350 m2, mainly facing south. Type 3 was characterized by FA greater than 350 m2, facing southward. Type 4 was characterized by a FA of less than 350 m2, facing westward, and the highest overall EUI.
The sample sizes in each type are 26, 68, 19, and 11, and the archetype buildings for each type were S-93, X-133, F-20-21, and S-90. The parameter set was established as a data basis for energy simulation (Table 2).

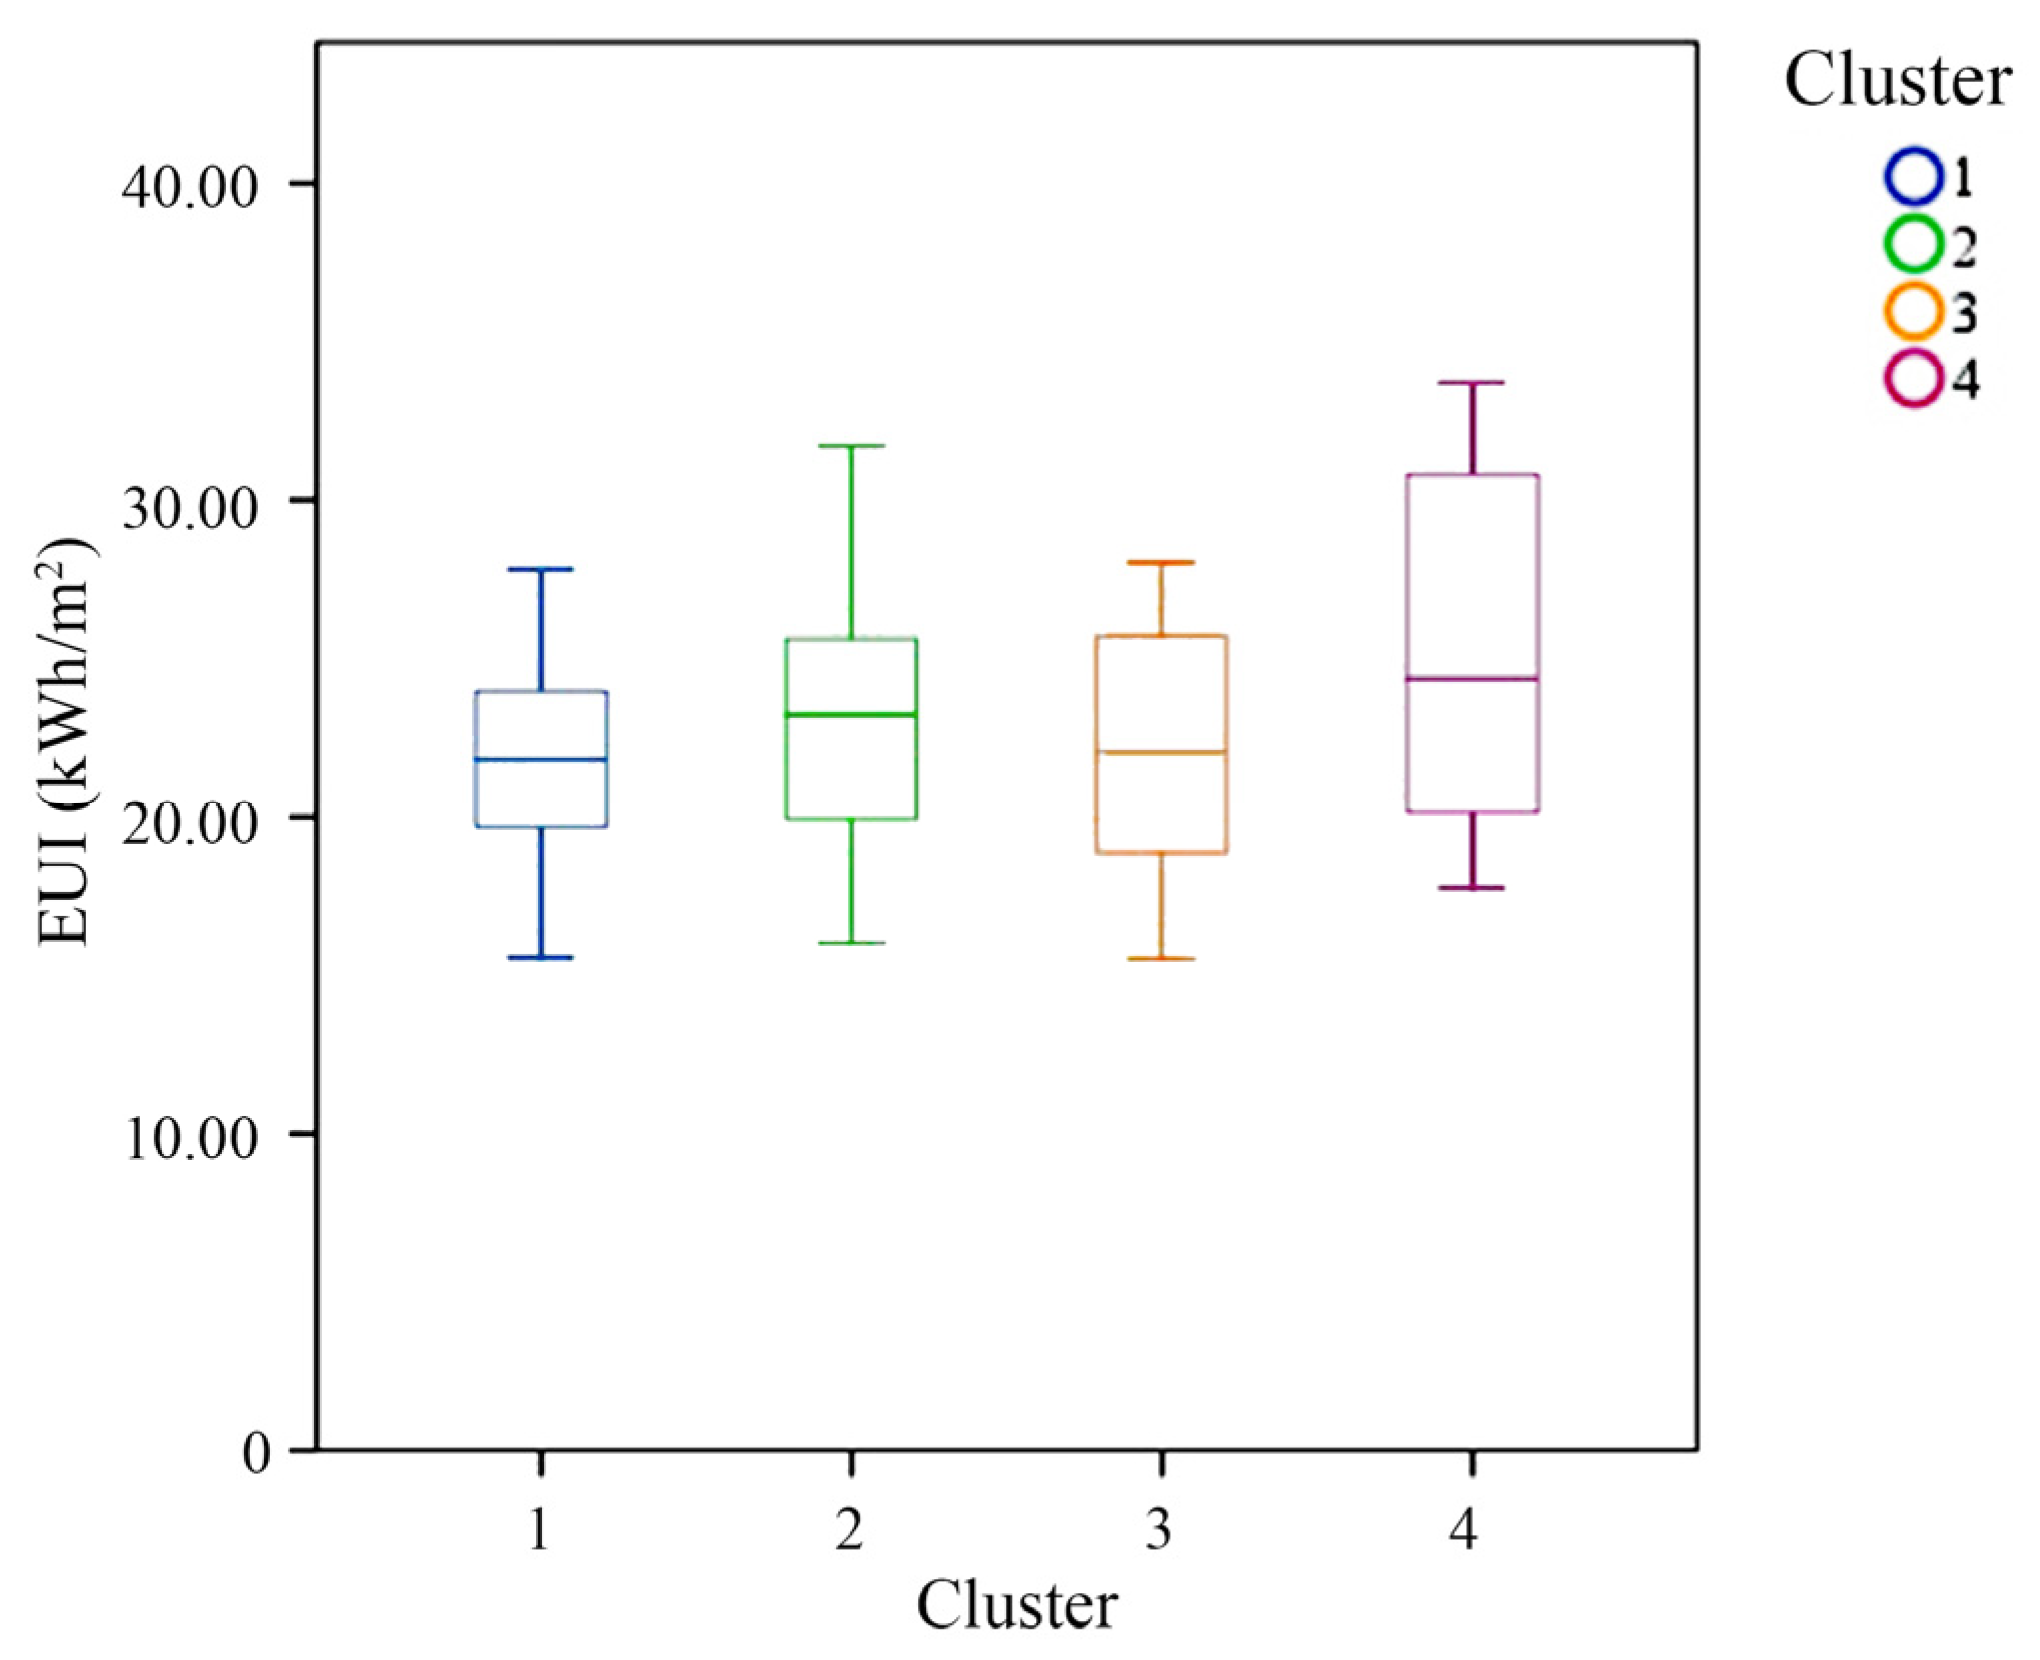
4.2.2. Residential Building Energy Benchmarks

Before using the medians to identify energy benchmarks, a correction was made to the E U I s values using regression equations. The multiple linear regression model of EUI is usually used for energy calculation or prediction, and its general form is [94]:
E U I = a + b 1 x 1 + + b k x k + ε = a + i = 1 k b i X i X i ¯ S i + ε
where a represents the constant term, b 1 b k , and b i are the regression coefficients, x 1 x k are the significant influencing factors, S i is the standard deviation, X i represents the measured value, and X i ¯ represents the average value. ε is the error term influenced by other random factors. The multivariate linear regression correction model for EUI is in the form of [89,95,96]:
E U I n o r m = E U I s b 1 x 1 b k x k = E U I s i = 1 k b i x i x i S i
where E U I n o r m is the corrected value. When the measured values of influencing factors are equal to the mean values ( x k = x k ), E U I n o r m = E U I s , Therefore, E U I n o r m can be regarded as a standardized energy efficiency indicator after eliminating the biased impact of building characteristic factors. The following multivariate linear regression models were established for each type (Table 3). All regression models passed the tests for the significance of regression coefficients, the significance of independent variables, and collinearity detection. R2 represents the proportion of data that can be explained, and a value higher than 0.5 indicates that the equation fits well.
In Type 1, the parameters significantly related to EUI were FN and CY, with an average value of 6.53 and 1984.63, respectively. The EUI values of buildings in Type 1 were then corrected based on the standard deviation of the two parameters. The main influencing factors in Type 2 were OA and BW, with an average value of −1.46° (south facing) for building orientation and 19.73 m for width; FA was the main factor influencing EUI in Type 3, with an average value of 478.46 m2. In Type 4, the primary influencing factors were OA and AR, with average levels of 70.73° (west-facing) and 1.22° (point-like buildings).
It should be noted that the correction equations derived only standardized the EUI based on the building characteristics within the type. These equations were not intended for predicting energy consumption or correcting E U I s of other buildings, which was also an inevitable requirement for targeted energy research and energy-efficiency retrofitting of residential buildings.
After the E U I s values were corrected by the regression equations, the median value was taken as the final energy benchmark for each building type. The results are shown in Table 4 for comparison.
Type 4 had the highest energy benchmark, mainly due to the west-facing orientation, which brought more solar radiation in the afternoon, leading to higher cooling energy consumption. Type 3 had the lowest energy benchmark and was mainly composed of slab-like buildings with a short facade facing west. The WWR on the west facade was generally less than 0.1, reducing the area of solar radiation and cooling energy consumption. At the same time, the long facade mainly faced south, with shallow room depth, which reduced heating energy and artificial lighting energy, resulting in a lower overall EUI. In Type 1, buildings were mainly oriented towards the east and southeast and received more heat from western solar radiation than Type 2, resulting in a relatively higher EUI.

4.3. Energy-Efficiency Retrofitting Strategies for Residential Buildings

We used the energy simulation plugin Urban Modeling Interface (UMI) to evaluate the energy-saving measures on four archetype buildings. UMI was developed by the Sustainable Design Lab at the Massachusetts Institute of Technology based on EnergyPlus, which had certain advantages in terms of low simulation errors compared to EnergyPlus and ease of use [97,98,99]. It was suitable for the rapid energy evaluation of buildings.
When setting the boundary conditions for energy simulation, the AC operating period was set from 1 July to 30 September for summer and from 1 December to 28 February of the following year for winter. The meteorological data were obtained from Shapingba. Building form information was set based on parameter sets. The thermal parameters of the building envelope and the equipment efficiency ratio were referenced to the minimum limit values specified in the “2002 Standard”. The distribution of buildings was set according to the actual site conditions. The simulation results are shown in Figure 13.
The results showed obvious differences in the energy-saving rate of the four measures in summer and winter. For M2, the energy-saving effect was significant for all building types in the summer, but its contribution to reducing heating energy was insignificant. M1 had limited effectiveness in reducing cooling energy, but it had a benefit in reducing heating energy. M4 had a more balanced effect on reducing heating energy, but its effect on reducing cooling energy varied with the building type. On the other hand, there were significant differences in the sensitivity of each archetypal building to energy-saving measures. For the energy-saving rate of cooling energy, M2 and M4 had a similar effect on S-93 and X-133, but M3 had a better energy-saving effect on X-133 than on S-93. M3 had a minimal effect on F-20-21, accounting for only 1.46%. M4 greatly reduced the energy of the first three archetype buildings, but its effect on S-90 was very limited. M1 obviously contributed to S-90, with an energy-saving rate of 16.81%. For heating energy consumption, M1 was more effective for F-20-21 and S-90 than for S-93 and X-133, but the overall sensitivity of each archetype building to energy-saving measures was relatively less obvious. For the overall energy-saving benefits throughout the year, except for M4, M2 had the best overall effect for S-93 and S-90, X-133 had the highest benefit using M3, and M1 could significantly reduce the overall energy consumption of F-20-21.
According to the simulation analysis results above, M4 and the energy-saving measures with the optimal overall energy-saving rate for each type were applied to the HEBs in four types. The energy-saving potential of HEBs of each type is shown in Figure 14. When using M4 and M2, Type 1 and Type 4 had more significant potential for reducing cooling energy, with energy-saving rates of 23.5% and 23.28%, respectively. Types 2 and 3 had greater potential for reducing heating energy, exceeding 30%. Meanwhile, the overall energy-saving potential of Type 3 was the largest.

5. Discussion

This study analyzed the form characteristics, energy consumption characteristics, classification methods, energy benchmarks, and targeted retrofitting strategies of existing buildings in Chongqing. The indicators for classifying residential buildings were building orientation and floor area, which came from the correlation analysis between building energy data and forms. It was different from commonly used classification criteria such as construction year, building type (single or multi-family), equipment type [56,84], or other form parameters without referring to energy data [97,100]. The study emphasized the direct relationship between building form and energy consumption, which was also verified by the box plot of the classification results. Specifically, building orientation affected the heat from direct solar radiation, while floor area was related to building plan forms. Among the sample buildings, those with larger floor areas were often slab-like buildings composed of multiple units side by side with a high aspect ratio. Moreover, the short sides of the building faced west with a WWR of less than 0.1 to reduce solar radiation heating from the west, while the long sides mainly faced south to increase daylighting and reduce artificial lighting and heating energy. In contrast, point-like buildings with smaller floor areas had a higher proportion of west-facing heated areas, resulting in increased cooling energy consumption.
Similar studies on energy benchmarks for residential buildings have been conducted in other cities in China, and their perspectives and methods are worth discussing in comparison to our research. For instance, a study on energy efficiency standards for residential buildings in Yunnan Province [101] set energy consumption quotas based on per capita energy consumption. The study analyzed the relationship between per capita income, per capita living area, and per capita annual energy consumption of 200 households in four cities of Yunnan Province. It established a linear regression model to determine the per capita annual energy consumption corresponding to quota level 0.5 as the general level of residential building energy consumption. The energy consumption of residential buildings was divided into three parts based on the purpose: energy for household hot water, energy for household electrical equipment, and energy for cooking. Energy consumption per unit building area and per household are two commonly used indicators for measuring the energy of residential buildings, while per capita energy consumption is a valuable reference measurement standard as it highlights energy use behaviors and includes a broader range of energy types. However, family size distribution fluctuates, and the per capita energy consumption index cannot reflect the correlation between the building itself and energy during energy-efficiency retrofitting. Hence, it may be a weak guide for achieving overall energy-saving goals for residential buildings. Meanwhile, different classification standards have been adopted in other studies. In a study on the energy quota of residential buildings in Wuhan, Hubei Province [102], residential buildings were classified into three types based on the proportion of local residential building unit area and the quality of residential communities: (1) buildings with a unit area less than 90 m2, (2) buildings of high-end residential types with a unit area of 90 m2 and above, and (3) buildings of ordinary residential types with a unit area of 90 m2 and above. Then a three-level energy efficiency evaluation index was designated, measured by the energy use per unit building area using the cumulative frequency method. The classification reflects the scale of buildings and economic levels, providing a new perspective for analyzing the energy characteristics of various residential communities built at different levels. However, its classification basis was relatively rough. We believe that the classification based solely on the area of a household is less exploratory of the particularity of energy consumption in residential buildings, and there may be a lack of explanation for the energy performance of individual residential buildings. When considering providing suggestions and a basis for building energy-efficiency retrofitting, energy-efficiency evaluation standards for building forms can be more informative.
Regarding energy benchmark values, there is no official standard for residential building energy consumption in Chongqing. According to the regulations in “Standard 2016”, the limit for energy consumption of residential buildings in hot summer and cold winter zones is 3100 kWh per household per year (calculated as three people per household). According to the report published by the Chongqing Municipal Bureau of Statistics in 2021, the per capita living area in Chongqing is 46.1 m2 [89]. Based on the reference data in “Standard 2016”, the residential building quota indicator in Chongqing should be 22.42 kWh/m2, which is close to the energy benchmarks obtained in this article, indicating that the research conclusion is reliable. Moreover, a more targeted classification of energy benchmarks has been proposed based on the form characteristics of residential buildings, providing a more precise criterion for the energy efficiency evaluation of existing residential buildings in Chongqing.
Based on the current research findings, there are some limitations that need to be addressed and aspects of future research that require improvement:
  • The clustering method used in this study has inherent limitations due to its black-box nature [63]. Therefore, the archetype buildings extracted from this research could not be directly applied in other regions. It is for this reason that targeted research on residential buildings is necessary;
  • Given the unique features of residential buildings constructed before 2000, they were selected as the focus of this study. However, residential buildings built between 2000 and 2010, the first batch to adhere to local construction standards, possess new characteristics and could be included in future studies to broaden the range of sample buildings;
  • It should be noted that as the energy benchmarks discussed in this study are derived from actual energy consumption data and as energy-saving measures are implemented and the building’s energy consumption is reduced, the benchmarks should be dynamically adjusted to meet the increasing energy-saving standards.

6. Conclusions

The study focused on the existing residential buildings built in Chongqing before 2000 and investigated the form and energy characteristics of these buildings, as well as the classification method based on forms and building energy benchmarks. The study came to the following conclusions:
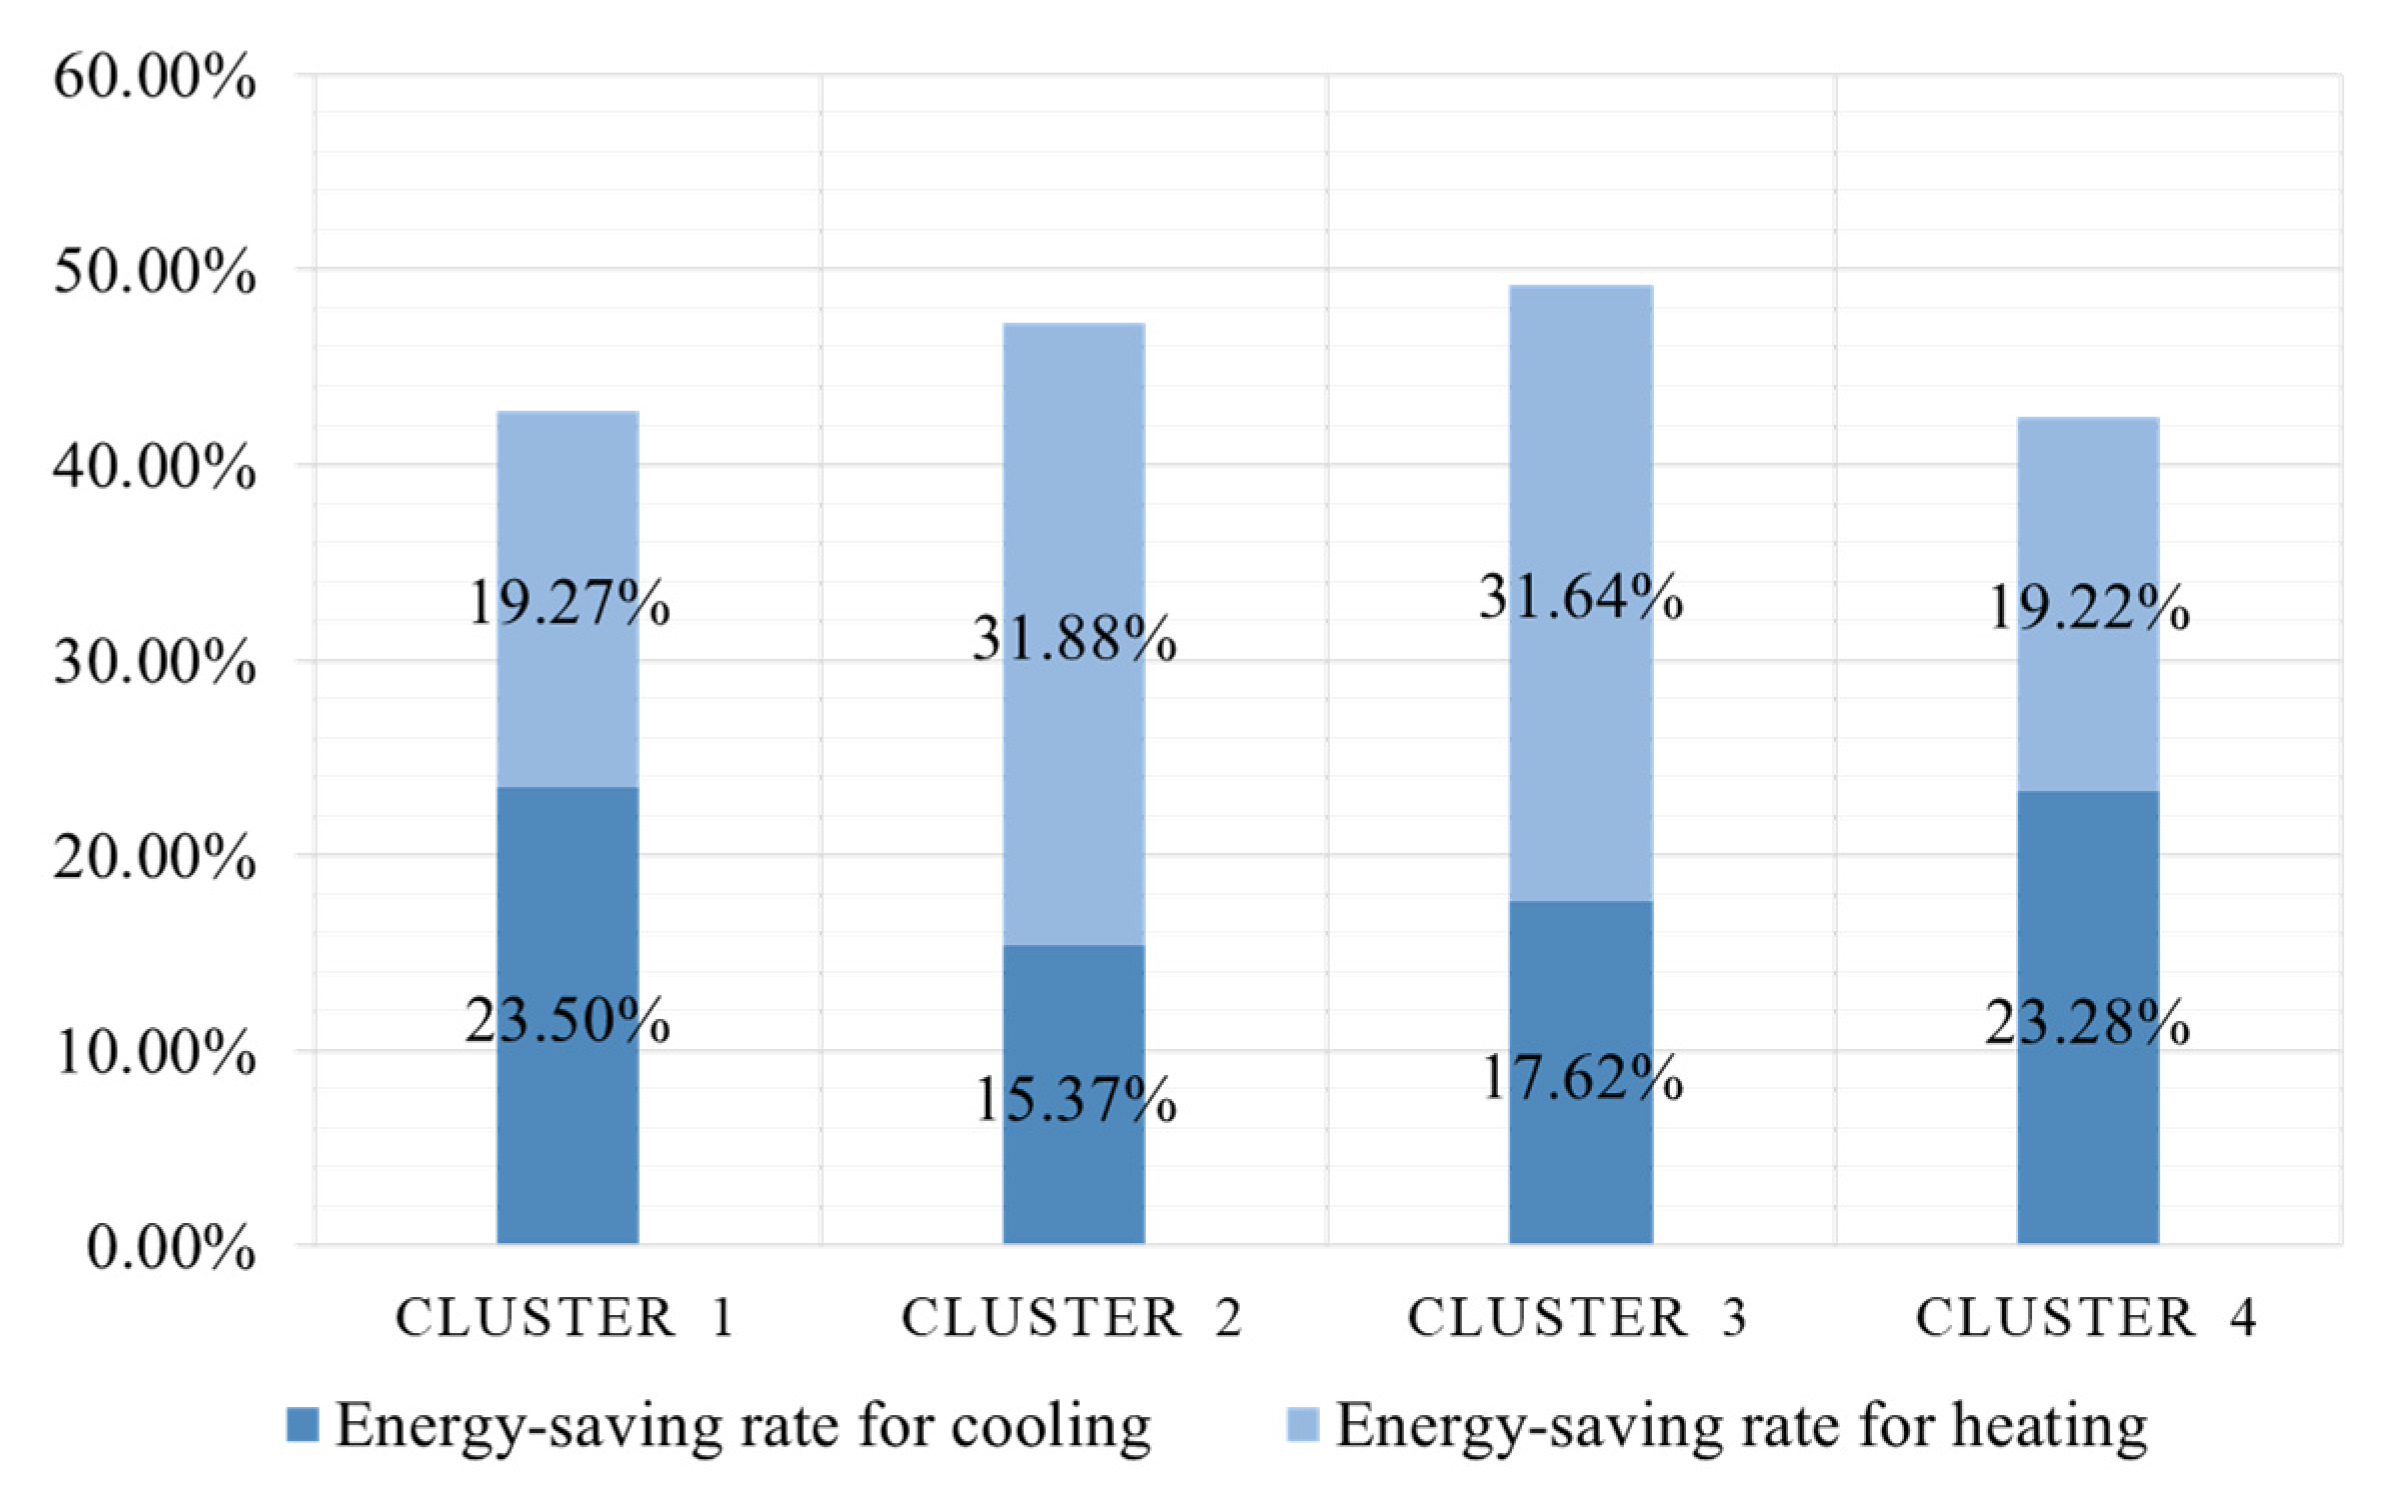
  • The average annual energy consumption per household is 1431.29 kWh, and the average EUI is 22.77 kWh/m2. The energy for heating is 55.91% of that for cooling, indicating that summer heat insulation is the priority direction for energy-efficiency retrofitting of residential buildings in Chongqing. The total energy consumption for cooling and heating accounts for 35.73% of the annual energy consumption and shows great potential for energy-efficiency retrofitting;
  • From a typology perspective, residential buildings can be divided into four types. Type 4 buildings (west-facing, area < 350 m2) have a higher energy consumption than the others, indicating that orientation significantly impacts the energy consumption of residential buildings. Buildings of Types 2 and 3 are south-facing. Type 2 buildings have a smaller floor area and tend to be point-like, while Type 3 buildings with an area > 350 m2 are mostly slab-like, with a smaller proportion of west-facing area, usually with a WWR of less than 0.1 or without windows. At the same time, the long south-facing facades help to obtain more daylight, making it more energy-efficient in winter and for daily energy use. Type 1 buildings are mainly east-southeast, and the impact of west-facing is smaller than that of Type 4, resulting in a lower EUI;
  • The energy benchmarks have been established for residential buildings for the four types, which are 21.96 kWh/m2, 22.51 kWh/m2, 21.85 kWh/m2, and 24.95 kWh/m2, respectively. The energy benchmark values are derived from the median EUI of each type of building, which has been corrected by regression equations. The energy benchmark represents the general energy consumption level of a building type. Targeted energy-efficiency retrofitting for high-energy-consuming buildings above energy benchmarks can help achieve energy-saving goals faster;
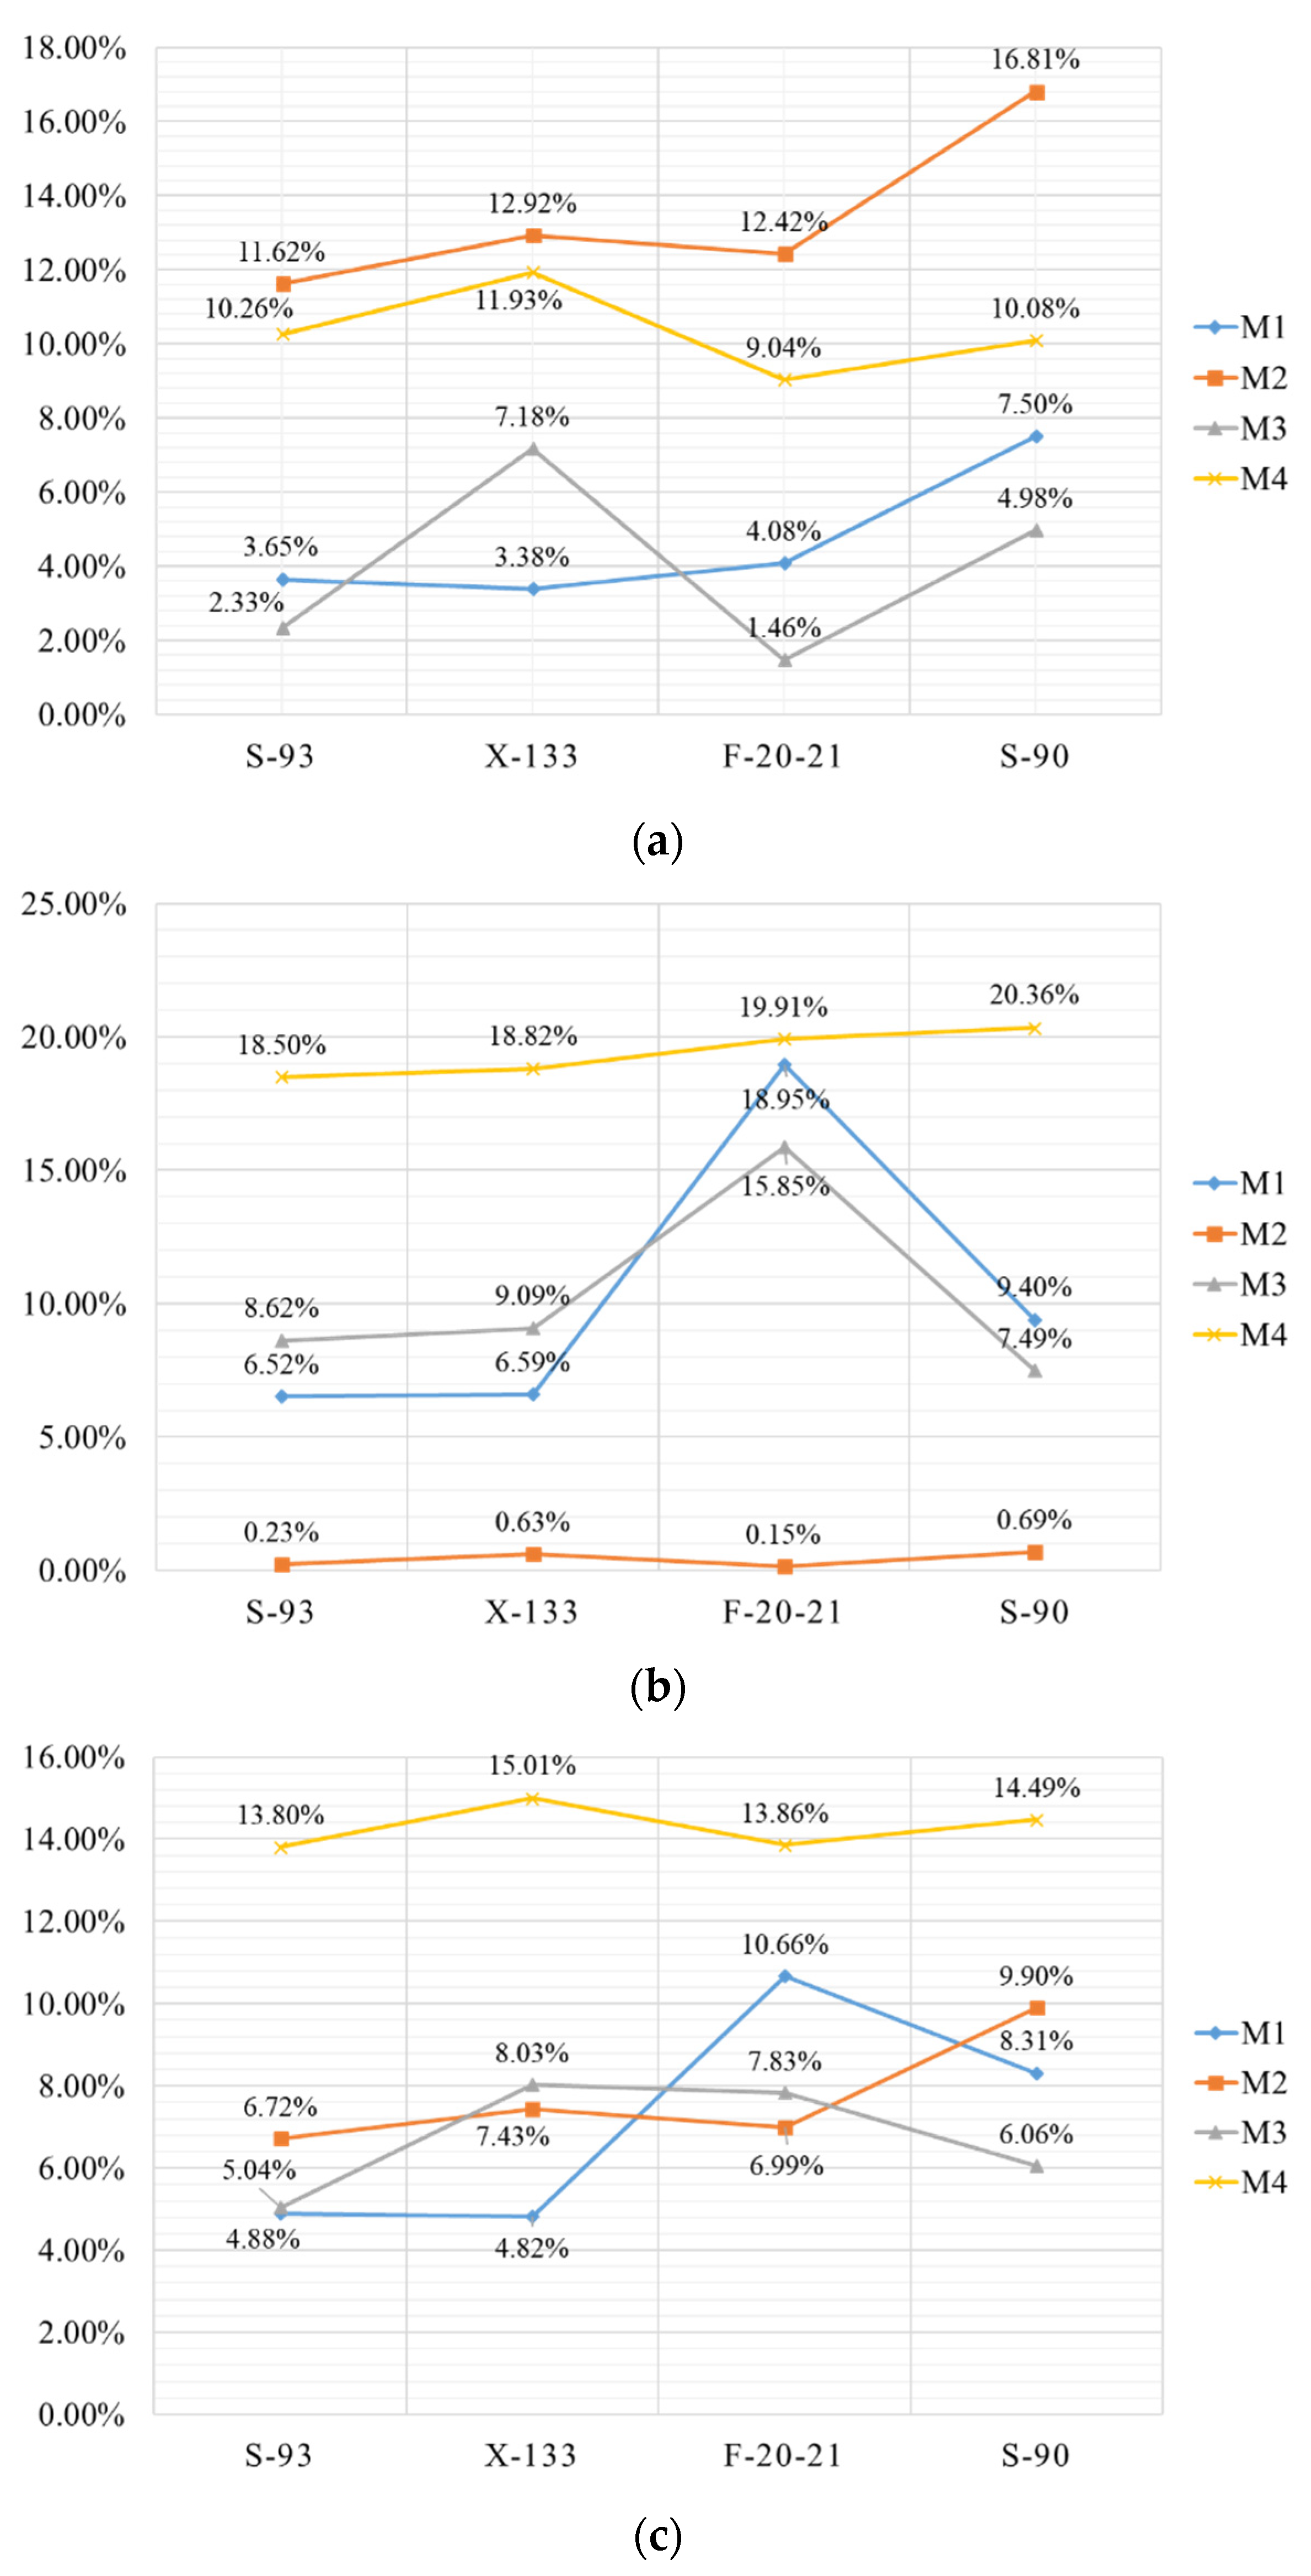
  • Different energy-saving measures should be taken according to the building’s characteristics. For instance, point-like buildings facing the west require special attention to prevent indoor heat gain by utilizing heat prevention measures on the west facade. Similarly, slab-like buildings facing south should improve the external wall insulation performance and fully utilize daylighting from the southward facade to reduce the overall energy of the building. For buildings of Type 1, the priority should be renovating the shading equipment on the west facade, followed by replacing the exterior windows. Type 2 buildings should add external insulation measures, followed by external shading. For Type 3 buildings, improving the thermal performance of external windows should be prioritized, followed by increasing external insulation. Lastly, Type 4 buildings should upgrade the performance of external windows, followed by external shading.
This study analyzed the form and energy characteristics of residential buildings and categorized them from the perspective of building typology without a large amount of publicly available data. Moreover, energy benchmarks were established for each type of building, and recommendations for energy-saving measures and retrofitting directions were provided accordingly. The study’s methods and ideas also offered insights into the future development of energy benchmarks for existing residential buildings and provided a theoretical basis for large-scale research on regional building status, energy consumption analysis, prediction, regulation, and energy-efficiency retrofitting work.

Author Contributions

Conceptualization, H.H., K.Z. and X.L.; methodology, H.H., K.Z. and X.L.; software, K.Z.; validation, K.Z.; formal analysis, K.Z.; investigation, K.Z. and X.L.; resources, H.H., K.Z. and X.L.; data curation, K.Z.; writing—original draft preparation, K.Z.; writing—review and editing, H.H. and K.Z.; visualization, K.Z.; supervision, H.H.; project administration, H.H.; funding acquisition, H.H. All authors have read and agreed to the published version of the manuscript.

Funding

This research was funded by the National Natural Science Foundation of China: “Study on Typology Approach and Energy Saving Potential of Energy Efficiency Retrofitting for Existing Residential Buildings––A Case Study in Chongqing, grant number 52078071”.

Institutional Review Board Statement

Not applicable.

Informed Consent Statement

Not applicable.

Data Availability Statement

The data presented in this study are available upon request from the corresponding author. The data are not publicly available due to privacy restrictions.

Conflicts of Interest

The authors declare no conflict of interest. The funders had no role in the design of the study; in the collection, analyses, or interpretation of data; in the writing of the manuscript; or in the decision to publish the results.

Nomenclature

EUIEnergy Use Intensity
WWRWindow-to-wall ratio
HEBsHigh-energy-consuming buildings
ACAir-conditioning
CYConstruction year
FNFloor number
FAFloor area
BLBuilding length
BWBuilding width
ARAspect ratio
OAOrientation angle
SCShape coefficient
HTCHeat transfer coefficient

References

  1. National Bureau of Statistics. National Data. Available online: https://data.stats.gov.cn/adv.htm?m=advquery&cn=C01 (accessed on 1 April 2023).
  2. China Energy Media Group. China Energy Big Data Report (2022); China Energy Media Group: Beijing, China, 2022. [Google Scholar]
  3. Ministry of Housing and Urban-Rural Development of the People’s Republic of China. Notice of the Ministry of Housing and Urban Rural Development on Issuing the “14th Five Year Plan” for Building Energy Efficiency and Green Building Development. Available online: https://www.mohurd.gov.cn/gongkai/zhengce/zhengcefilelib/202203/20220311_765109.html (accessed on 1 April 2023).
  4. General Office of the State Council of the People’s Republic of China. Guiding Opinions on Comprehensively Promoting the Renovation of Old Urban Residential Areas. Available online: http://www.gov.cn/zhengce/content/2020-07/20/content_5528320.htm?fromapp108sq=subject_9408 (accessed on 1 April 2023).
  5. Administrative Normative Document. Available online: http://nyncw.cq.gov.cn/xxgk_161/zfxxgkml/zcwj/xzgfxwj/202204/t20220408_10599353.html (accessed on 12 May 2023).
  6. Chongqing Meteorological Service. Statistics of High-Temperature Days. Available online: http://cq.cma.gov.cn/sqxj/qxfw/gwrs/ (accessed on 1 April 2023).
  7. Huang, J. Study on Peak Energy Consumption and Carbon Emission of Urban Residential Buildings in Chongqing. Master’s Thesis, Chongqing University, Chongqing, China, 2021. [Google Scholar]
  8. Deng, Y.; Cao, S.; Li, X. Comparison of energy saving effects of Chongqing residential buildings under different energy saving standards. Shanxi Archit. 2017, 43, 175–176. [Google Scholar] [CrossRef]
  9. Arjunan, P.; Poolla, K.; Miller, C. EnergyStar++: Towards More Accurate and Explanatory Building Energy Benchmarking. Appl. Energy 2020, 276, 115413. [Google Scholar] [CrossRef]
  10. Chung, W. Review of Building Energy-Use Performance Benchmarking Methodologies. Appl. Energy 2011, 88, 1470–1479. [Google Scholar] [CrossRef]
  11. Beihmanis, K.; Rosa, M. Energy Management System Implementation in Latvian Municipalities: From Theory to Practice. Energy Procedia 2016, 95, 66–70. [Google Scholar] [CrossRef]
  12. Khoshbakht, M.; Gou, Z.; Dupre, K. Energy Use Characteristics and Benchmarking for Higher Education Buildings. Energy Build. 2018, 164, 61–76. [Google Scholar] [CrossRef]
  13. Geraldi, M.S.; Ghisi, E. Integrating Evidence-Based Thermal Satisfaction in Energy Benchmarking: A Data-Driven Approach for a Whole-Building Evaluation. Energy 2022, 244, 123161. [Google Scholar] [CrossRef]
  14. Zhan, S.; Liu, Z.; Chong, A.; Yan, D. Building Categorization Revisited: A Clustering-Based Approach to Using Smart Meter Data for Building Energy Benchmarking. Appl. Energy 2020, 269, 114920. [Google Scholar] [CrossRef]
  15. Djuric, N.; Novakovic, V. Review of Possibilities and Necessities for Building Lifetime Commissioning. Renew. Sustain. Energy Rev. 2009, 13, 486–492. [Google Scholar] [CrossRef]
  16. Nikolaou, T.; Kolokotsa, D.; Stavrakakis, G. Review on Methodologies for Energy Benchmarking, Rating and Classification of Buildings. Adv. Build. Energy Res. 2011, 5, 53–70. [Google Scholar] [CrossRef]
  17. Vaisi, S.; Varmazyari, P.; Esfandiari, M.; Sharbaf, S.A. Developing a Multi-Level Energy Benchmarking and Certification System for Office Buildings in a Cold Climate Region. Appl. Energy 2023, 336, 120824. [Google Scholar] [CrossRef]
  18. Li, K.; Sun, Y.; Robinson, D.; Ma, J.; Ma, Z. A New Strategy to Benchmark and Evaluate Building Electricity Usage Using Multiple Data Mining Technologies. Sustain. Energy Technol. Assess. 2020, 40, 100770. [Google Scholar] [CrossRef]
  19. Gnecco, V.; Geraldi, M.; Fossati, M.; Triana, M. Comparison between National and Local Benchmarking Models: The Case of Public Nursery Schools in Southern Brazil. Sustain. Cities Soc. 2022, 78, 103639. [Google Scholar] [CrossRef]
  20. United States Environmental Protection Agency. Document Display|NEPIS|US EPA. Available online: https://nepis.epa.gov/Exe/ZyNET.exe/P100TBKD.txt?ZyActionD=ZyDocument&Client=EPA&Index=2016%20Thru%202020%7C1991%20Thru%201994%7C2011%20Thru%202015%7C1986%20Thru%201990%7C2006%20Thru%202010%7C1981%20Thru%201985%7C2000%20Thru%202005%7C1976%20Thru%201980%7C1995%20Thru%201999%7CPrior%20to%201976&Docs=&Query=energy%20star%20data%20trend&Time=&EndTime=&SearchMethod=2&TocRestrict=n&Toc=&TocEntry=&QField=&QFieldYear=&QFieldMonth=&QFieldDay=&UseQField=&IntQFieldOp=0&ExtQFieldOp=0&XmlQuery=&File=D%3A%5CZYFILES%5CINDEX%20DATA%5C11THRU15%5CTXT%5C00000029%5CP100TBKD.txt&User=ANONYMOUS&Password=anonymous&SortMethod=h%7C-&MaximumDocuments=15&FuzzyDegree=0&ImageQuality=r85g16/r85g16/x150y150g16/i500&Display=hpfr&DefSeekPage=x&SearchBack=ZyActionL&Back=ZyActionS&BackDesc=Results%20page&MaximumPages=1&ZyEntry=1&SeekPage=x (accessed on 1 April 2023).
  21. Jin, X.; Xiao, F.; Zhang, C.; Li, A. GEIN: An Interpretable Benchmarking Framework towards All Building Types Based on Machine Learning. Energy Build. 2022, 260, 111909. [Google Scholar] [CrossRef]
  22. Papadopoulos, S.; Kontokosta, C.E. Grading Buildings on Energy Performance Using City Benchmarking Data. Appl. Energy 2019, 233–234, 244–253. [Google Scholar] [CrossRef]
  23. Meng, T.; Hsu, D.; Han, A. Estimating Energy Savings from Benchmarking Policies in New York City. Energy 2017, 133, 415–423. [Google Scholar] [CrossRef]
  24. Galli, A.; Piscitelli, M.; Moscato, V.; Capozzoli, A. Bridging the Gap between Complexity and Interpretability of a Dataanalytics-Based Process for Benchmarking Energy Performance of Buildings. Expert Syst. Appl. 2022, 206, 117649. [Google Scholar] [CrossRef]
  25. Wu, T.; Wang, B.; Zhang, D.; Zhao, Z.; Zhu, H. Benchmarking Evaluation of Building Energy Consumption Based on Data Mining. Sustainability 2023, 15, 5211. [Google Scholar] [CrossRef]
  26. Pham, A.-D.; Ngo, N.-T.; Ha Truong, T.T.; Huynh, N.-T.; Truong, N.-S. Predicting Energy Consumption in Multiple Buildings Using Machine Learning for Improving Energy Efficiency and Sustainability. J. Clean. Prod. 2020, 260, 121082. [Google Scholar] [CrossRef]
  27. Ding, Y.; Zhang, D.; Lv, J. Comparison of the Applicability of City-Level Building Energy Consumption Quota Methods. Energy Build. 2022, 261, 111933. [Google Scholar] [CrossRef]
  28. Sheng, Y.; Miao, Z.; Zhang, J.; Lin, X.; Ma, H. Energy Consumption Model and Energy Benchmarks of Five-Star Hotels in China. Energy Build. 2018, 165, 286–292. [Google Scholar] [CrossRef]
  29. Attia, S.; Canonge, T.; Popineau, M.; Cuchet, M. Developing a Benchmark Model for Renovated, Nearly Zero-Energy, Terraced Dwellings. Appl. Energy 2022, 306, 118128. [Google Scholar] [CrossRef]
  30. Amasyali, K.; El-Gohary, N.M. A Review of Data-Driven Building Energy Consumption Prediction Studies. Renew. Sustain. Energy Rev. 2018, 81, 1192–1205. [Google Scholar] [CrossRef]
  31. Geraldi, M.S.; Ghisi, E. Data-Driven Framework towards Realistic Bottom-up Energy Benchmarking Using an Artificial Neural Network. Appl. Energy 2022, 306, 117960. [Google Scholar] [CrossRef]
  32. da Silva, F.L.C.; Cyrino Oliveira, F.L.; Souza, R.C. A Bottom-up Bayesian Extension for Long Term Electricity Consumption Forecasting. Energy 2019, 167, 198–210. [Google Scholar] [CrossRef]
  33. Chang, C.; Zhu, N.; Yang, K. Using a Novel Method to Obtain Heating Energy Benchmarks in a Cold Region of China for the Preparation of Formulating Incentive Energy Policies. Sustain. Cities Soc. 2020, 56, 102101. [Google Scholar] [CrossRef]
  34. Ding, Y.; Liu, X. A Comparative Analysis of Data-Driven Methods in Building Energy Benchmarking. Energy Build. 2020, 209, 109711. [Google Scholar] [CrossRef]
  35. Ocampo Batlle, E.A.; Escobar Palacio, J.C.; Silva Lora, E.E.; Martínez Reyes, A.M.; Melian Moreno, M.; Morejón, M.B. A Methodology to Estimate Baseline Energy Use and Quantify Savings in Electrical Energy Consumption in Higher Education Institution Buildings: Case Study, Federal University of Itajubá (UNIFEI). J. Clean. Prod. 2020, 244, 118551. [Google Scholar] [CrossRef]
  36. Ouf, M.M.; Issa, M.H. Energy Consumption Analysis of School Buildings in Manitoba, Canada. Int. J. Sustain. Built Environ. 2017, 6, 359–371. [Google Scholar] [CrossRef]
  37. Benchmark Your Building Using ENERGY STAR® Portfolio Manager®. Available online: https://www.energystar.gov/buildings/benchmark (accessed on 12 April 2023).
  38. Roth, J.; Rajagopal, R. Benchmarking Building Energy Efficiency Using Quantile Regression. Energy 2018, 152, 866–876. [Google Scholar] [CrossRef]
  39. Ding, Y.; Zhang, Z.; Zhang, Q.; Lv, W.; Yang, Z.; Zhu, N. Benchmark Analysis of Electricity Consumption for Complex Campus Buildings in China. Appl. Therm. Eng. 2018, 131, 428–436. [Google Scholar] [CrossRef]
  40. Kavousian, A.; Rajagopal, R.; Fischer, M. Determinants of Residential Electricity Consumption: Using Smart Meter Data to Examine the Effect of Climate, Building Characteristics, Appliance Stock, and Occupants’ Behavior. Energy 2013, 55, 184–194. [Google Scholar] [CrossRef]
  41. Brounen, D.; Kok, N.; Quigley, J.M. Residential Energy Use and Conservation: Economics and Demographics. Eur. Econ. Rev. 2012, 56, 931–945. [Google Scholar] [CrossRef]
  42. Kontokosta, C.E. A Market-Specific Methodology for a Commercial Building Energy Performance Index. J. Real Estate Financ. Econ. 2015, 51, 288–316. [Google Scholar] [CrossRef]
  43. Wu, X.; Kumar, V.; Ross Quinlan, J.; Ghosh, J.; Yang, Q.; Motoda, H.; McLachlan, G.J.; Ng, A.; Liu, B.; Yu, P.S.; et al. Top 10 Algorithms in Data Mining. Knowl. Inf. Syst. 2008, 14, 1–37. [Google Scholar] [CrossRef]
  44. Killian, M.; Kozek, M. Ten Questions Concerning Model Predictive Control for Energy Efficient Buildings. Build. Environ. 2016, 105, 403–412. [Google Scholar] [CrossRef]
  45. Xie, Q.; Ni, J.-Q.; Bao, J.; Su, Z. A Thermal Environmental Model for Indoor Air Temperature Prediction and Energy Consumption in Pig Building. Build. Environ. 2019, 161, 106238. [Google Scholar] [CrossRef]
  46. Ali, U.; Shamsi, M.; Bohacek, M.; Hoare, C.; Purcell, K.; Mangina, E.; O’Donnell, J. A Data-Driven Approach to Optimize Urban Scale Energy Retrofit Decisions for Residential Buildings. Appl. Energy 2020, 267, 114861. [Google Scholar] [CrossRef]
  47. Roth, J.; Lim, B.; Jain, R.; Grueneich, D. Examining the Feasibility of Using Open Data to Benchmark Building Energy Usage in Cities: A Data Science and Policy Perspective. Energy Policy 2020, 139, 111327. [Google Scholar] [CrossRef]
  48. Yang, Z.; Roth, J.; Jain, R.K. DUE-B: Data-Driven Urban Energy Benchmarking of Buildings Using Recursive Partitioning and Stochastic Frontier Analysis. Energy Build. 2018, 163, 58–69. [Google Scholar] [CrossRef]
  49. Wei, Z.; Zou, Y.; Wang, H. Introduction on British Public Building Energy Consumption Benchmark Evaluation Methods and Enlightenment for China. Build. Sci. 2011, 27, 7–12. [Google Scholar] [CrossRef]
  50. Gulliford, M.J.S.; Orlebar, R.H.; Bird, M.H.; Acha, S.; Shah, N. Developing a Dynamic Carbon Benchmarking Method for Large Building Property Estates. Energy Build. 2022, 256, 111683. [Google Scholar] [CrossRef]
  51. Vaisi, S.; Firouzi, M.; Varmazyari, P. Energy Benchmarking for Secondary School Buildings, Applying the Top-Down Approach. Energy Build. 2023, 279, 112689. [Google Scholar] [CrossRef]
  52. Hong, S.-M.; Paterson, G.; Burman, E.; Steadman, P.; Mumovic, D. A Comparative Study of Benchmarking Approaches for Non-Domestic Buildings: Part 1—Top-down Approach. Int. J. Sustain. Built Environ. 2013, 2, 119–130. [Google Scholar] [CrossRef]
  53. Shang, L.; Lee, H.W.; Dermisi, S.; Choe, Y. Impact of Energy Benchmarking and Disclosure Policy on Office Buildings. J. Clean. Prod. 2020, 250, 119500. [Google Scholar] [CrossRef]
  54. Chen, Y.; Tan, H.; Berardi, U. A Data-Driven Approach for Building Energy Benchmarking Using the Lorenz Curve. Energy Build. 2018, 169, 319–331. [Google Scholar] [CrossRef]
  55. Cataldi, G.; Maffei, G.L.; Vaccaro, P. Saverio Muratori and the Italian School of Planning Typology. Urban Morphol. 2002, 6, 3–14. [Google Scholar] [CrossRef]
  56. Ballarini, I.; Corgnati, S.P.; Corrado, V.; Talà, N. Definition of Building Typologies for Energy Investigations on Residential Sector by TABULA IEE-Project: Application to Italian Case Studies. In Proceedings of the 12th International Conference on Air Distribution in Rooms, Trondheim, Norway, 19–22 June 2011; pp. 19–22. [Google Scholar]
  57. Dascalaki, E.G.; Droutsa, K.; Gaglia, A.G.; Kontoyiannidis, S.; Balaras, C.A. Data Collection and Analysis of the Building Stock and Its Energy Performance—An Example for Hellenic Buildings. Energy Build. 2010, 42, 1231–1237. [Google Scholar] [CrossRef]
  58. Dascalaki, E.G.; Droutsa, K.G.; Balaras, C.A.; Kontoyiannidis, S. Building Typologies as a Tool for Assessing the Energy Performance of Residential Buildings—A Case Study for the Hellenic Building Stock. Energy Build. 2011, 43, 3400–3409. [Google Scholar] [CrossRef]
  59. Theodoridou, I.; Papadopoulos, A.M.; Hegger, M. A Typological Classification of the Greek Residential Building Stock. Energy Build. 2011, 43, 2779–2787. [Google Scholar] [CrossRef]
  60. Ward, W.O.C.; Li, X.; Sun, Y.; Dai, M.; Arbabi, H.; Tingley, D.D.; Mayfield, M. Estimating Energy Consumption of Residential Buildings at Scale with Drive-by Image Capture. Build. Environ. 2023, 234, 110188. [Google Scholar] [CrossRef]
  61. Filogamo, L.; Peri, G.; Rizzo, G.; Giaccone, A. On the Classification of Large Residential Buildings Stocks by Sample Typologies for Energy Planning Purposes. Appl. Energy 2014, 135, 825–835. [Google Scholar] [CrossRef]
  62. Cerezo Davila, C.; Reinhart, C.F.; Bemis, J.L. Modeling Boston: A Workflow for the Efficient Generation and Maintenance of Urban Building Energy Models from Existing Geospatial Datasets. Energy 2016, 117, 237–250. [Google Scholar] [CrossRef]
  63. Ballarini, I.; Corrado, V. Application of Energy Rating Methods to the Existing Building Stock: Analysis of Some Residential Buildings in Turin. Energy Build. 2009, 41, 790–800. [Google Scholar] [CrossRef]
  64. Tommerup, H.; Svendsen, S. Energy Savings in Danish Residential Building Stock. Energy Build. 2006, 38, 618–626. [Google Scholar] [CrossRef]
  65. Gustavsson, L.; Joelsson, A. Life Cycle Primary Energy Analysis of Residential Buildings. Energy Build. 2010, 42, 210–220. [Google Scholar] [CrossRef]
  66. Huang, H.; Lin, X. A Typological Approach of Energy Efficiency Retrofitting for Existing Building—European Experience and Its Inspiration to China. Archit. J. 2020, Z1, 164–170. [Google Scholar] [CrossRef]
  67. Feng, J.; Luo, X.; Gao, M.; Abbas, A.; Xu, Y.-P.; Pouramini, S. Minimization of Energy Consumption by Building Shape Optimization Using an Improved Manta-Ray Foraging Optimization Algorithm. Energy Rep. 2021, 7, 1068–1078. [Google Scholar] [CrossRef]
  68. Zhang, J.; Liu, N.; Wang, S. A Parametric Approach for Performance Optimization of Residential Building Design in Beijing. Build. Simul. 2020, 13, 223–235. [Google Scholar] [CrossRef]
  69. Depecker, P.; Menezo, C.; Virgone, J.; Lepers, S. Design of Buildings Shape and Energetic Consumption. Build. Environ. 2001, 36, 627–635. [Google Scholar] [CrossRef]
  70. Jalali, Z.; Noorzai, E.; Heidari, S. Design and Optimization of Form and Facade of an Office Building Using the Genetic Algorithm. Sci. Technol. Built Environ. 2020, 26, 128–140. [Google Scholar] [CrossRef]
  71. Tibermacine, I.; Zemmouri, N. Effects of Building Typology on Energy Consumption in Hot and Arid Regions. Energy Procedia 2017, 139, 664–669. [Google Scholar] [CrossRef]
  72. Bamdad, K.; Cholette, M.E.; Guan, L.; Bell, J. Building Energy Optimisation under Uncertainty Using ACOMV Algorithm. Energy Build. 2018, 167, 322–333. [Google Scholar] [CrossRef]
  73. López-González, L.M.; López-Ochoa, L.M.; Las-Heras-Casas, J.; García-Lozano, C. Energy Performance Certificates as Tools for Energy Planning in the Residential Sector. The Case of La Rioja (Spain). J. Clean. Prod. 2016, 137, 1280–1292. [Google Scholar] [CrossRef]
  74. Johansson, T.; Vesterlund, M.; Olofsson, T.; Dahl, J. Energy Performance Certificates and 3-Dimensional City Models as a Means to Reach National Targets—A Case Study of the City of Kiruna. Energy Convers. Manag. 2016, 116, 42–57. [Google Scholar] [CrossRef]
  75. Collins, M.; Curtis, J. Bunching of Residential Building Energy Performance Certificates at Threshold Values. Appl. Energy 2018, 211, 662–676. [Google Scholar] [CrossRef]
  76. Jamieson, M.; Brajterman, O.; Verstraeten, Y.; Arbon, J. Energy Performance of Buildings Directive (EPBD) Compliance Study; European Commission: Brussels, Belgium, 2015. [Google Scholar]
  77. Classification and Presentation of Civil Building Energy Use. Available online: https://std.samr.gov.cn/gb/search/gbDetailed?id=71F772D824B9D3A7E05397BE0A0AB82A (accessed on 13 May 2023).
  78. Andrews, A.; Jain, R.K. Beyond Energy Efficiency: A Clustering Approach to Embed Demand Flexibility into Building Energy Benchmarking. Appl. Energy 2022, 327, 119989. [Google Scholar] [CrossRef]
  79. Papadopoulos, S.; Bonczak, B.; Kontokosta, C.E. Pattern Recognition in Building Energy Performance over Time Using Energy Benchmarking Data. Appl. Energy 2018, 221, 576–586. [Google Scholar] [CrossRef]
  80. Song, D.; Zhang, Z. Energy Conservation Analysis for Plans and Forms of Buildings with Different Features. New Archit. 2000, 3, 8–11. [Google Scholar]
  81. Detailed Application Rules in Chongqing of Design Standard for Energy Efficiency of Residential Buildings in Hot Summer and Cold Winter Zone. Available online: https://std.samr.gov.cn/db/search/stdDBDetailed?id=91D99E4D456B2E24E05397BE0A0A3A10 (accessed on 1 April 2023).
  82. Bamdad, K.; Cholette, M.E.; Guan, L.; Bell, J. Ant Colony Algorithm for Building Energy Optimisation Problems and Comparison with Benchmark Algorithms. Energy Build. 2017, 154, 404–414. [Google Scholar] [CrossRef]
  83. Mechri, H.E.; Capozzoli, A.; Corrado, V. USE of the ANOVA Approach for Sensitive Building Energy Design. Appl. Energy 2010, 87, 3073–3083. [Google Scholar] [CrossRef]
  84. Heidenthaler, D.; Leeb, M.; Reindl, P.; Kranzl, L.; Bednar, T.; Moltinger, M. Building Stock Characteristics of Residential Buildings in Salzburg, Austria Based on a Structured Analysis of Energy Performance Certificates. Energy Build. 2022, 273, 112401. [Google Scholar] [CrossRef]
  85. Gao, X.; Malkawi, A. A New Methodology for Building Energy Performance Benchmarking: An Approach Based on Intelligent Clustering Algorithm. Energy Build. 2014, 84, 607–616. [Google Scholar] [CrossRef]
  86. Kim, D.W.; Kim, Y.M.; Lee, S.E. Development of an Energy Benchmarking Database Based on Cost-Effective Energy Performance Indicators: Case Study on Public Buildings in South Korea. Energy Build. 2019, 191, 104–116. [Google Scholar] [CrossRef]
  87. He, P.; Xue, J.; Shen, G.Q.; Ni, M.; Wang, S.; Wang, H.; Huang, L. The Impact of Neighborhood Layout Heterogeneity on Carbon Emissions in High-Density Urban Areas: A Case Study of New Development Areas in Hong Kong. Energy Build. 2023, 287, 113002. [Google Scholar] [CrossRef]
  88. Kim, H.G.; Jeong, D.W.; Kwon, S.J.; Kim, S.S. Development of Building Energy Performance Benchmark for Hospitals. Buildings 2023, 13, 12. [Google Scholar] [CrossRef]
  89. Geraldi, M.S.; Gnecco, V.M.; Barzan Neto, A.; de Mafra Martins, B.A.; Ghisi, E.; Fossati, M.; Melo, A.P.; Lamberts, R. Evaluating the Impact of the Shape of School Reference Buildings on Bottom-up Energy Benchmarking. J. Build. Eng. 2021, 43, 103142. [Google Scholar] [CrossRef]
  90. Ministry of Housing and Urban-Rural Development. Announcement on Issuing the National Standard “Standard for Energy Consumption of Building”. Available online: https://www.mohurd.gov.cn/gongkai/zhengce/zhengcefilelib/201605/20160519_227497.html (accessed on 1 April 2023).
  91. Chongqing Housing and Urban Rural Construction Commission Notice on Issuing the “Technical Specification for the Retrofitting of Residential Buildings on Energy Efficiency”. Available online: http://zfcxjw.cq.gov.cn/zwxx_166/gsgg/201611/t20161116_4216343.html (accessed on 1 April 2023).
  92. Liu, M.; Yan, L.; Li, J.; Xun, Z.; Du, S. Analysis of operation schedule of room air conditioners in Chongqing based on datamonitoring platform. Heat. Vent. Air Cond. 2020, 50, 1–9+116. [Google Scholar]
  93. Yang, P. Research on Energy Consumption Characteristics and Energy-Saving Strategies of Residential Buildings. Master’s Thesis, Chongqing University, Chongqing, China, 2021. [Google Scholar]
  94. Yuan, Y. Research on Energy Consumption Baseline for Government Office Buildings in Chongqing Area. Master’s Thesis, Chongqing University, Chongqing, China, 2015. [Google Scholar]
  95. Chung, W.; Hui, Y.V.; Lam, Y.M. Benchmarking the Energy Efficiency of Commercial Buildings. Appl. Energy 2006, 83, 1–14. [Google Scholar] [CrossRef]
  96. Zhao, J.; Xin, Y.; Tong, D. Energy Consumption Quota of Public Buildings Based on Statistical Analysis. Energy Policy 2012, 43, 362–370. [Google Scholar] [CrossRef]
  97. Li, X.; Yao, R.; Liu, M.; Costanzo, V.; Yu, W.; Wang, W.; Short, A.; Li, B. Developing Urban Residential Reference Buildings Using Clustering Analysis of Satellite Images. Energy Build. 2018, 169, 417–429. [Google Scholar] [CrossRef]
  98. Timur, D.; Christoph, R. Automated Conversion of Architectural Massing Models into Thermal ‘Shoebox’ Models. In Proceedings of the 13th Conference of International Building Performance Simulation Association, Chambéry, France, 25–28 August 2013; pp. 3745–3752. [Google Scholar]
  99. Dogan, T.; Reinhart, C. Shoeboxer: An Algorithm for Abstracted Rapid Multi-Zone Urban Building Energy Model Generation and Simulation. Energy Build. 2017, 140, 140–153. [Google Scholar] [CrossRef]
  100. Ma, Y.; Deng, W.; Xie, J.; Heath, T.; Xiang, Y.; Hong, Y. Generating Prototypical Residential Building Geometry Models Using a New Hybrid Approach. Build. Simul. 2022, 15, 17–28. [Google Scholar] [CrossRef]
  101. Li, C. Study on Energy Consumption Limits of Residential Buildings in Different Climate Zones of Yunnan Province. Master’s Thesis, Kunming University of Science and Technology, Kunming, China, 2017. [Google Scholar]
  102. Yu, Y.; Li, Y.; Xiang, D.; Jiang, X. Study on Energy Consumption Quota of Civil Buildings in Wuhan. Build. Sci. 2014, 30, 106–112. [Google Scholar] [CrossRef]
Figure 1. The methodological framework of the study.
Buildings 13 01346 g001
Figure 2. Distribution of sample buildings.
Buildings 13 01346 g002
Figure 3. On-site investigation of sample building.
Buildings 13 01346 g003
Figure 4. EUI distribution histogram per household.
Buildings 13 01346 g004
Figure 5. Statistical analysis of the form characteristics of sample buildings.
Buildings 13 01346 g005
Figure 6. Statistical analysis of energy use behavior characteristics.
Buildings 13 01346 g006
Figure 7. Statistical results of the annual energy consumption distribution of each residential district.
Buildings 13 01346 g007
Figure 8. Statistical results of energy for cooling and heating in each residential district.
Buildings 13 01346 g008
Figure 9. Statistical results of the energy for cooling and heating proportions of each residential district.
Buildings 13 01346 g009
Figure 10. Cluster dendrogram results of the sample buildings classified by hierarchical clustering.
Buildings 13 01346 g010
Figure 11. Scatter distribution of clustering analysis results.
Buildings 13 01346 g011
Figure 12. Box plot of E U I s distribution when divided into 4 clusters.
Buildings 13 01346 g012
Figure 13. Comparison of energy-saving measures: (a) is the energy-saving rate on cooling energy consumption; (b) is the energy-saving rate on heating energy consumption; and (c) is the energy-saving rate on overall energy consumption.
Buildings 13 01346 g013
Figure 14. Comparison of the energy-saving potential of HEBs in each building type.
Buildings 13 01346 g014
Table 1. Correlation analysis between building form and E U I s .
Construction YearFloors NumberAspect RatioBuilding LengthBuilding WidthOrientation AngleFloor AreaShape Coefficient
E U I s Spearman correlation−0.184 *−0.1330.141−0.095−0.216 *−0.371 **−0.340 **0.134
Sig. (2-tailed)0.0410.1420.1190.2930.0160.0000.0000.136
**: Significantly correlated at the 0.01 level (2-tailed); *: Significantly correlated at the 0.05 level (2-tailed).
Table 2. Archetype building parameter set.
Form ParametersData Sources
IDS-93X-133F-20-21S-90
GraphicBuildings 13 01346 i001Buildings 13 01346 i002Buildings 13 01346 i003Buildings 13 01346 i004On-site measurement
Number of case26681911
FN9778
OA38−41−61
AR1.041.351.981.16
SC0.360.420.360.44
FA(m2)334.50197.19439.74245.93
WWRS0.340.220.330.24
N0.320.230.320.24
E0.320.540.240.38
W0.370.370.260.33
Table 3. The EUI correction equations for the four types of buildings.
TypeRegression EquationR2
1 E U I n o r m = E U I s + 2.037 × F N 6.53 0.91 1.564 × C Y 1984.63 6.39 0.633
2 E U I n o r m = E U I s + 0.724 × O A + 1.46 14.82 0.437 × B L 19.73 5.24 0.697
3 E U I n o r m = E U I s + 0.878 × F A 479.46 127.27 0.743
4 E U I n o r m = E U I s + 0.679 × O A + 70.73 18.68 0.442 × A R 1.22 0.11 0.938
Table 4. Comparison of building form characteristics and median EUI of each type before and after correction.
TypeCharacteristics E U I s (kWh/m2) E U I n o r m (kWh/m2)
1East, FA < 450 m221.8221.96
2South, FA ≤ 350 m223.2222.51
3South, FA > 350 m222.0621.85
4West, FA < 350 m224.3624.95
Disclaimer/Publisher’s Note: The statements, opinions and data contained in all publications are solely those of the individual author(s) and contributor(s) and not of MDPI and/or the editor(s). MDPI and/or the editor(s) disclaim responsibility for any injury to people or property resulting from any ideas, methods, instructions or products referred to in the content.

