
Assessment of Mould Risk in Low-Cost Residential Buildings in Urban Slum Districts of Surakarta City, Indonesia

1
Faculty of Engineering Sciences, Kyushu University, Fukuoka 816-8580, Japan
2
Interdisciplinary Graduate School of Engineering Sciences, Kyushu University, Fukuoka 816-8580, Japan
3
Department of Architecture, Faculty of Engineering, Universitas Sebelas Maret, Surakarta 57126, Indonesia
*
Author to whom correspondence should be addressed.
Buildings 2023, 13(5), 1333; https://doi.org/10.3390/buildings13051333
Submission received: 19 April 2023
/
Revised: 11 May 2023
/
Accepted: 17 May 2023
/
Published: 19 May 2023
(This article belongs to the Topic Built Environment and Human Comfort)
Abstract
:Prolonged exposure to indoor dampness in dwellings triggers excessive mould, causing health problems for residents and damage to building structures. This study investigated dampness and mould growth in low-cost dwellings in the slum districts of Surakarta, Indonesia. A VTT mould growth model predicted mould risk in 17 dwellings by employing a set of time-series data of indoor air temperature and relative humidity (RH). Interviews were conducted with 11 houses to understand the residents’ perceptions and lifestyles related to mould risk. The daily average dampness (RH > 80%) ranged from 2.2 to 12.3 h. Low-cost dwellings with plywood board walls had a high risk of cumulative mould growth. Statistical correlation analysis revealed that volumetric heat capacity was significantly positively correlated with mould growth at higher percentiles (75th and 97.5th). Thus, dwellings with smaller volumes and plywood board walls were more susceptible to moulding. Moreover, the majority of the participants expressed dissatisfaction with indoor air quality owing to the presence of unpleasant odours from sewage and dampness, which coincided with their perception of inadequate air ventilation. This study provides a reference for developing standard guidelines for building and upgrading dwellings in Indonesia, focusing on assessing and mitigating mould risks and ensuring moisture safety.
1. Introduction
Indonesia is a rapidly urbanising and developing country among those worldwide [1]. Currently, approximately 55% of Indonesians live in cities, and this figure is projected to increase by 70% by 2045 [2]. More than one-fifth of Indonesia’s urban population lives in slums or vulnerable houses [3]. Insufficient funding has become a major issue, as it has led to poor living conditions in substandard dwellings [4,5]. As people typically spend approximately 70% of their time indoors, dwellings are an essential determinant of health and productivity [6,7]. Epidemiological studies have revealed a link between substandard dwellings and an increased risk of serious illness [8,9,10,11,12,13]. In 2019, the World Health Organization reported that household air pollution was responsible for 3.2 million deaths annually, including 237,000 deaths in children under the age of five [14]. Dwellings are also essential for health, as children, the elderly, and people with disabilities are likely to spend most of their time at home [15,16,17,18].
To address the issues related to substandard housing in urban slums, the Indonesian government has introduced a program, namely the “Kampung Improvement Program”, which was launched in 1969 [19,20,21,22]. It focuses on improving standard public services such as sanitation, health, and education facilities in slum areas [20]. However, since 2010, Surakarta, which is the most populous city in the Central Java province, has implemented the upgrading of urban slums through a bottom-up planning approach that includes the participation of local communities [23]. Furthermore, in 2016, according to the Ministry of Public Works and Housing of Indonesia, Surakarta was among the 30 priority cities in the National Slum Upgrading Program (NUSP) [24]. Owing to these attempts, the ratio of slum areas to the total city area has recently decreased from 6.5% in 2016 to 3.1% in 2020 in Surakarta. Nevertheless, there remained 28 slum settlement areas with a total area of 3.6 km2 and 18,625 substandard dwellings in the city by 2021. There have been numerous impediments to fully resolve the problems of current informal settlements, including financial limitation, issues related to land ownership, and challenges in achieving consensus among Kampung residents [25,26,27].
Few studies have been conducted on the substandard housing conditions and/or the accompanying health risks to Indonesian residents. For example, based on a survey in Semarang City, Indonesia, Gasem et al. [28] reported that poor housing conditions, such as a lack of water supply and sanitation facilities, are risk factors for typhoid fever. Komarulzaman et al. [29] investigated the association between diarrhoea prevalence and water and sanitation facilities at the household and community levels, based on an Indonesian demographic and health survey. Widawati et al. [30] reported that dirty toilets and unhealthy house status had a significant effect on the increase in dengue cases in Bandung, Indonesia, based on a univariate analysis of data from 781 households. Murtyas et al. [13] analysed the association between occupant health problems, demographic factors, and indoor environmental quality using a questionnaire survey of 443 respondents collected on Java Island, Indonesia. These data indicate a higher risk of health problems such as odynophagia, diarrhoea, headache, and fidgeting to people living in urban informal settlements than for others. In addition, they revealed that people with frequent thermal discomfort in their houses had more health problems.
Regarding the indoor air environment, several studies have analysed the adverse health effects caused by indoor mould, fungal spore dispersal, particulate matter (PM), and volatile organic compounds in unplanned urban slums in various countries, including Indonesia. For instance, a case-control study in Palestine reported that 56% of poverty-stricken residents diagnosed with asthma had seen mould on the walls and ceilings of their temporary housing [31]. Pratali et al. [32] reported that PM from biomass and fuel burning is associated with an increased incidence of cardiovascular and respiratory diseases, based on statistical analysis of data collected in Nepal. Murtyas et al. [33] conducted field measurements of the indoor thermal conditions in 17 low-cost houses located in an urban slum in Surakarta, Indonesia. This study revealed that the time fraction of indoor air temperature over 30 °C ranged from 50 to 80%, suggesting a high risk of heatstroke. In relation to the indoor hygrothermal conditions specific to tropical climate zones, including Indonesia, high temperature throughout the year and high humidity are primary features that can negatively impact the comfort and health of occupants living in a substandard house with no air-conditioning facility. Previous studies have highlighted that excessive indoor mould can lead to building damage and the release of allergens and unpleasant odours [34,35,36,37]. Additionally, prolonged exposure to damp conditions can result in additional costs and effort for building maintenance [38]. The prevalence of indoor dampness and mould growth has been widely reported across urban slum settlements in Indonesia, particularly during the wet season. Adinugraha et al. [35] reported field measurements of indoor air temperature, relative humidity, dust levels, and airflow rate in five houses located in the unplanned urban districts of Bandung City. Furthermore, mould growth was evaluated using fungal detectors developed by Abe [39]. They also reported the results of building observations and interviews with the residents of the target houses. Visible mould was observed in all the target houses, particularly in the kitchen and shower rooms, which implied that mould was caused mostly by internal sources of water vapour from cooking and showering. Furthermore, Sani et al. [36] investigated the indoor mould risk and its impact on respiratory health in 102 unplanned houses in urban slums in Bandung using fungal detectors. They reported that the majority of houses suffered from severe mould risk, mainly because of extremely humid weather conditions, particularly during the rainy season, and 60% of the respondents experienced water leakage in their houses.
Although the aforementioned surveys on indoor thermal environments and air quality in substandard houses located in Indonesian urban slums have provided valuable insights to focus the public’s attention on countermeasures, most studies have been conducted in Bandung, which is located in the highlands of western Java Island. It is notable that the climate of Bandung is classified as a tropical highland climate (Köppen climate classification: Cwb) with relatively cool temperatures and high levels of precipitation throughout the year [40]. Considering that Indonesia has a diverse climate owing to its large size, such as tropical rainforests (Köppen climate classification: Af), tropical monsoons (Am), and tropical savannas (Aw) [41], further investigation of the indoor hygrothermal environment and relevant health risks of urban slum housing in regions other than tropical highland climate zones is required.
With this background, this study aims to understand the indoor hygrothermal conditions of substandard houses located in urban slums in the Am climate, which is one of the major climate zones in Indonesia and covers a large part of the country. Specifically, we investigated indoor humidity conditions in 17 low-cost dwellings located in the slum districts of Surakarta City, Central Java. Data analysis was conducted based on our previous field measurements conducted in 2019 for 41 days [33,42]. In one of our previous studies [33], we analysed indoor temperature, thermal comfort, and the risk of high temperature. The focus of this research is the problem induced by high indoor humidity, namely mould growth. The indoor susceptibility to mould was estimated using the VTT mould growth model [43,44,45,46] based on measured indoor temperature and humidity data obtained from the field survey. In addition, the results of the interviews conducted with residents of 11 of the 17 houses are discussed to understand people’s perceptions and lifestyles related to mould risk.
2. Materials and Methods
2.1. Outline of Surveyed Dwellings
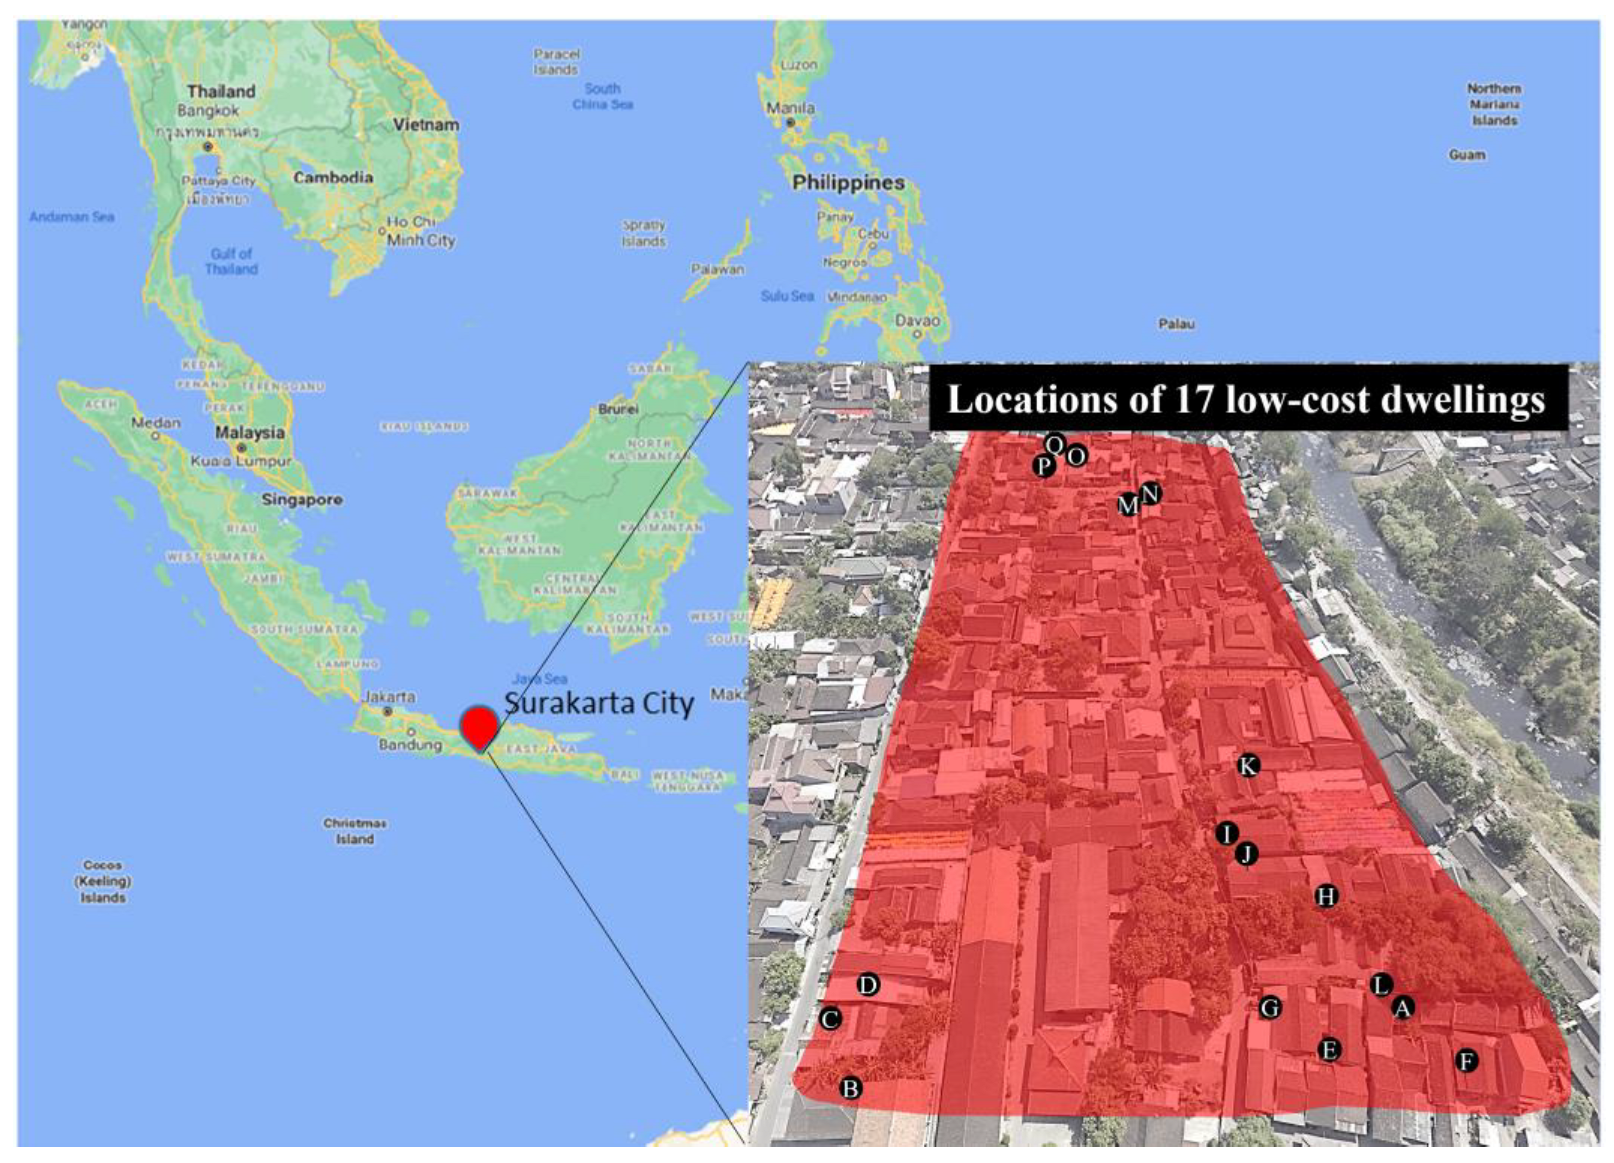
We conducted field measurements of the indoor hygrothermal environments in 17 low-cost residential buildings located in the Pasar Kliwon district (Figure 1), Surakarta City, Central Java Province, Indonesia. This area is densely populated and has inadequate infrastructure, including limited access to clean water and sanitation facilities. In addition, it is particularly vulnerable to flooding during heavy rainfall events. Surakarta City is classified as having an Af climate [41]. This climate zone is characterised by high temperatures and humidity. According to BPS-Statistics Indonesia 2012–2018, the average value of air temperature and relative humidity throughout the year were approximately 27–28 °C and 50–70%, respectively. The dry season occurs for five months from May to September, and the wet season lasts for seven months from October to April [47].
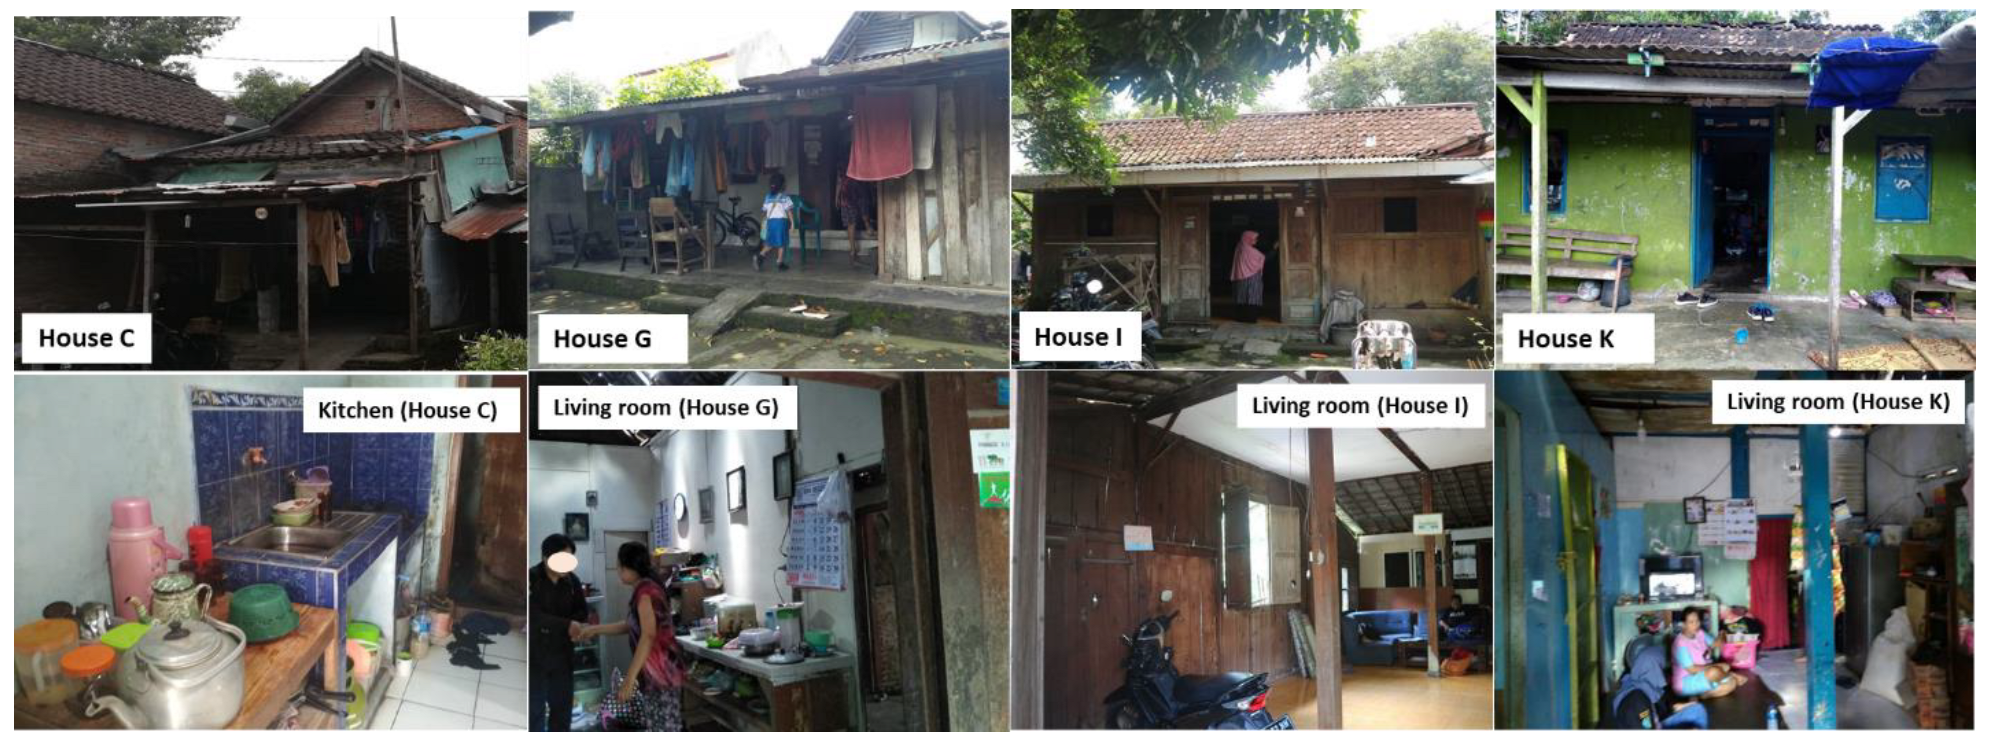
Seventeen dwellings were selected to collect representative yet diverse samples of residential buildings in urban slums in terms of building construction and materials, floor areas, and number of occupants. Figure 2 shows the front view and indoor environment of four of the surveyed dwellings. Table 1 summarises the building characteristics of the 17 dwellings, including floor, ventilation, wall, roof area, wall materials, and heat capacity per volume, which were calculated using Equation (1):
where V is the interior volume of houses [m3], is the component area [m2] of the building envelope such as the wall and roof, is the density of the material used [kg m−3], is the specific heat [J kg−1K−1], and is the thickness of layer j of the building envelope [m]. In terms of wall materials, the majority of the dwellings were constructed using cement plaster and brick, while four used plywood boards for wall construction.
2.2. Field Measurement of Indoor Hygrothermal Conditions and Questionnaire
In all the dwellings, the air temperature and relative humidity in living rooms or bedrooms were measured at intervals of 10 min from 26 March to 5 May 2019 for 41 days. During this period, we measured climatic variables, including outdoor air temperature, relative humidity, solar radiation, precipitation, and wind speed. This measurement period was established during the transition between the wet and dry seasons. Furthermore, a questionnaire survey of 102 residents of 17 houses on their demographic conditions, thermal perception, and daily behaviours was conducted at their houses between 10 June and 8 August 2019. The details of the measurement and questionnaire as well as the results of the analysis of the indoor temperature and thermal comfort are reported in [33].
2.3. The VTT Mould Growth Model
To assess mould risk, the mould growth index was estimated based on the VTT model using the measured data from the 17 dwellings [44]. The VTT model consists of mathematical relationships between mould growth and indoor relative humidity under various exposure times, temperatures, and types of building materials [48,49,50]. This method was derived from a laboratory experiment, allowing for early detection and intervention before mould occurs, by monitoring data, owing to its simple formulation. It has been widely used, particularly in tropical regions, to analyse mould growth on the wall materials of dwellings [38,51,52,53].
The mould growth index, which ranges from 0 to 6, represents the visually inspected mould growth levels from no growth (MI = 0) to visually detected coverage of 100% (MI = 6), as shown in Table 2. A favourable condition for mould growth is defined by the critical value of relative humidity (RHc), which is the lowest relative humidity level that allows mould to grow on a substrate after a certain exposure [38]. This condition is expressed by Equation (2) as a function of temperature [43,44]:
Furthermore, the complete model under favourable conditions for mould growth, interpreted as a differential relation employing temperature and relative humidity, is expressed in Equation (3):
where is the mould growth index, t is the time interval, W is the wood species (0 = pine and 1 = spruce), and is the surface quality (0 = sawn surface, 1 = kiln-dried quality). Viitanen et al. [50] suggested that materials other than pine (W = = 0) are commonly used [48]. is a correction factor that depends on the state of mould growth (), and is a coefficient related to the retardation of mould growth in the later stages when the mould index approaches levels 4–6, or the maximum growth level. Table 3 depicts the detail coefficients for mould sensitivity levels of different materials.
In terms of unfavourable conditions when the relative humidity is below the critical value, a formulation of declining mould growth can be expressed by using the time passed from the beginning when RH is less than 80%, or RH < period , as shown in Equation (7):
Regarding the sensitivity level related to the material type of the target dwellings, Houses C, G, I, and K with plywood wall surfaces were classified as having mould-sensitive materials. The other 13 dwellings were classified as medium resistant to mould growth owing to the use of cement plaster, brick, and gypsum-based rendering. The value of the mould growth index was assumed to be zero at the beginning of the measurement period.
2.4. Statistical Analysis
Spearman’s rank correlation was used to analyse the relationship between the mould growth index and building characteristics. This method measures the strength and direction of the association between two ranked variables. Spearman’s rank correlation can assume a value ranging from −1 to 1, indicating perfectly negative and positive correlations, respectively. The formulas are given by Equation (8), where is the correlation coefficient, is the difference between the two ranks for each observation, and n is the number of observations. Statistical analyses were performed using R software version 4.1.1.
2.5. Field Observation of Building Conditions and Resident Interviews
In addition to assessing indoor hygrothermal conditions, in-depth interviews were conducted with residents of 11 of the 17 targeted dwellings (Houses B, C, F, H, I, J, L, M, N, O, and P) in March 2023. We developed 41 questions regarding socioeconomic background, subjective assessment of indoor dampness, daily activities affecting indoor air quality and humidity, satisfaction with the indoor environment, sanitation status, and resident health problems. Using this pre-prepared questionnaire, interviews were conducted in the target dwellings. Throughout the interaction between the responder and observer, the order of the questions was altered or new questions were added as required to make it simpler for respondents to convey their feelings without hesitation. Interviews at a single residence typically lasted between 30 min and 1 h. In addition, a visual inspection of the interior and exterior conditions, especially in areas where moisture is more likely to accumulate, such as bathrooms, bedrooms, and kitchens, was performed to identify any vapour emission sources, water leakage, or visible mould growth.
3. Results and Discussion
3.1. Outdoor Air Temperature and RH
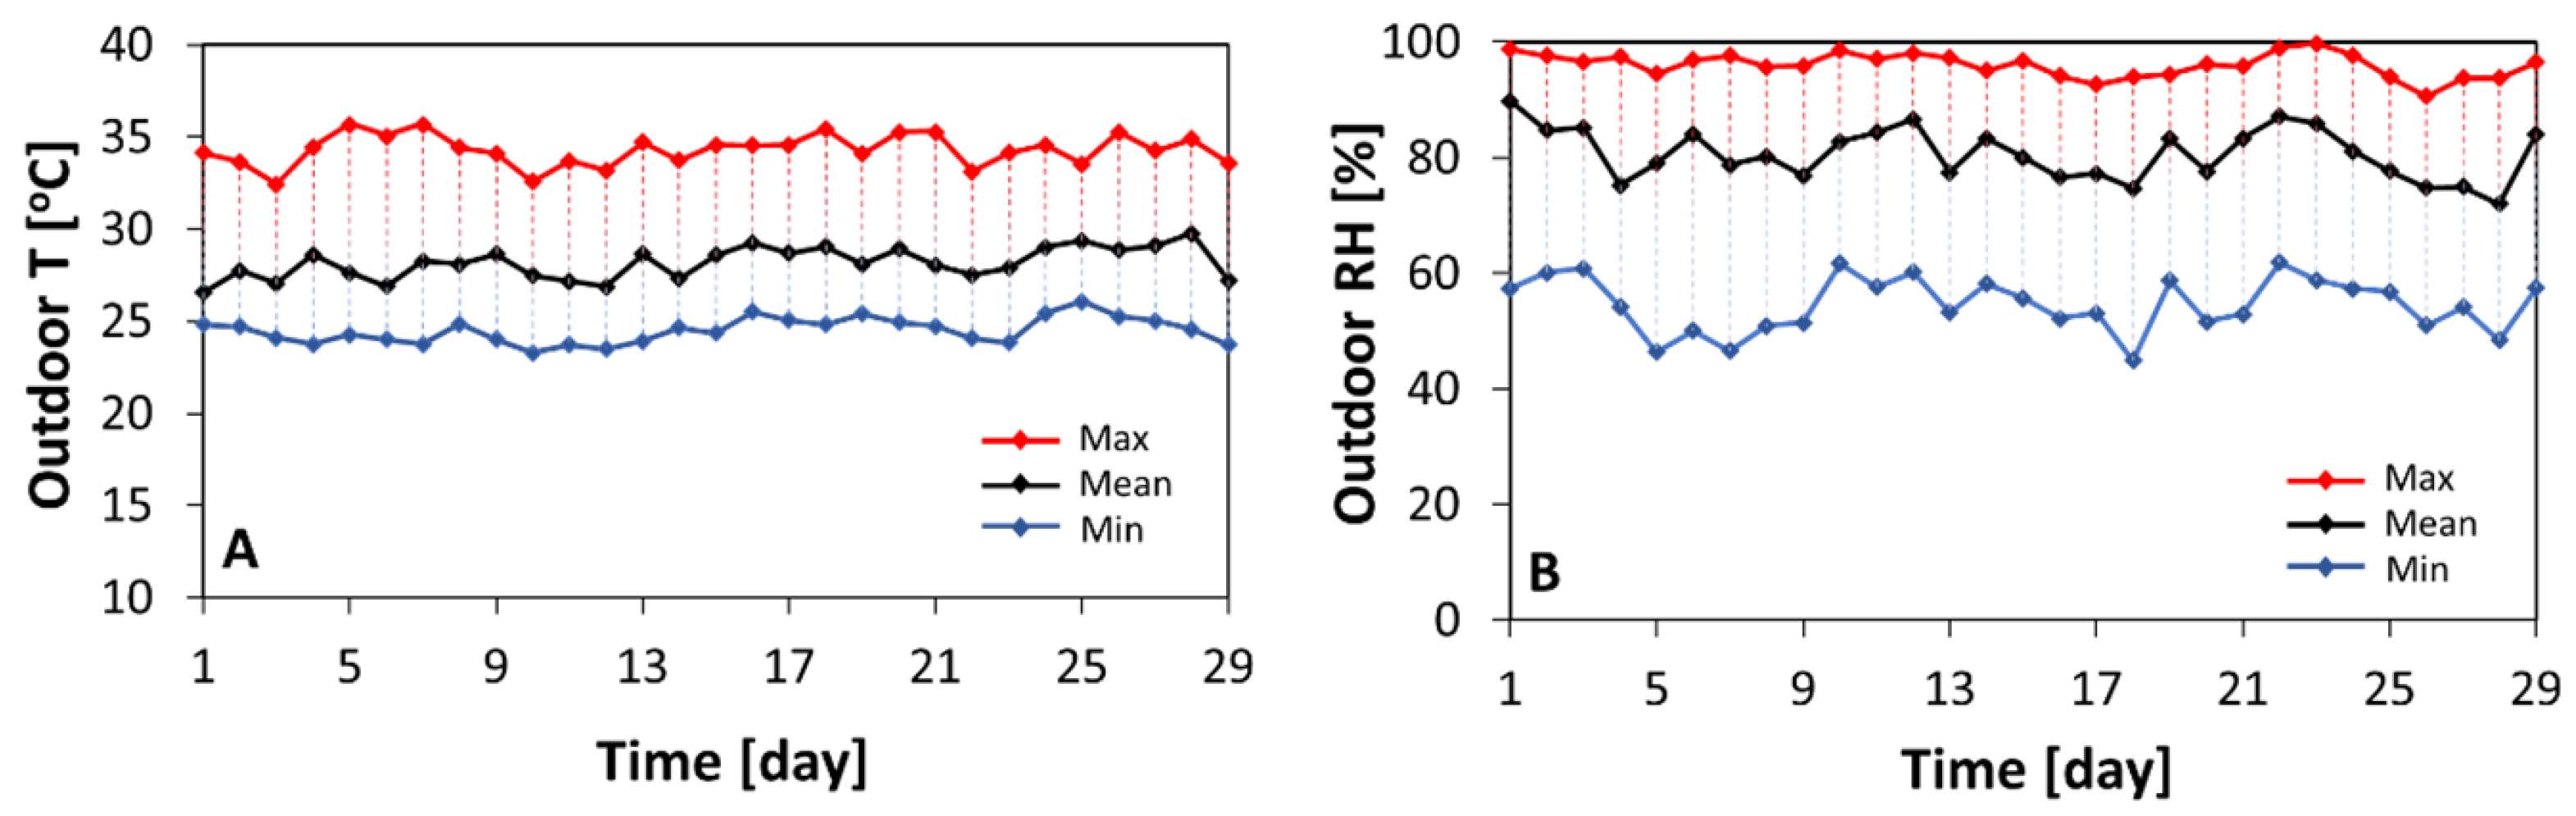
A time-series plot of the weather conditions, including air temperature and RH, during the monitoring period is presented in Figure 3. Each parameter, originally collected with a 1 min recording interval, was converted into an hourly averaged data plot. Accordingly, it indicated that the outdoor temperature ranged from 23.3 to 35.7 °C with a mean value of 28.1 °C. In addition, 29.3% of the daily outdoor temperatures were higher than 30 °C. Meanwhile, the relative humidity fluctuated from 44.9% to 99.8%, with 59.3% of the daily outdoor relative humidity exceeding RHc, which was favourable for mould growth. According to the Meteorological, Climatological, and Geophysical Agency of Indonesia, this measurement period (March–April) typically has an average relative humidity of 85% and is classified as the most humid period of the year [47]. Mean total daily rainfall was 8.4 mm. In terms of the average daylight length in this district, on the first day of the measurement period, sunrise and sunset occurred at 5:41 am and 5:56 pm, respectively.
3.2. Indoor Thermal and Humidity Environment
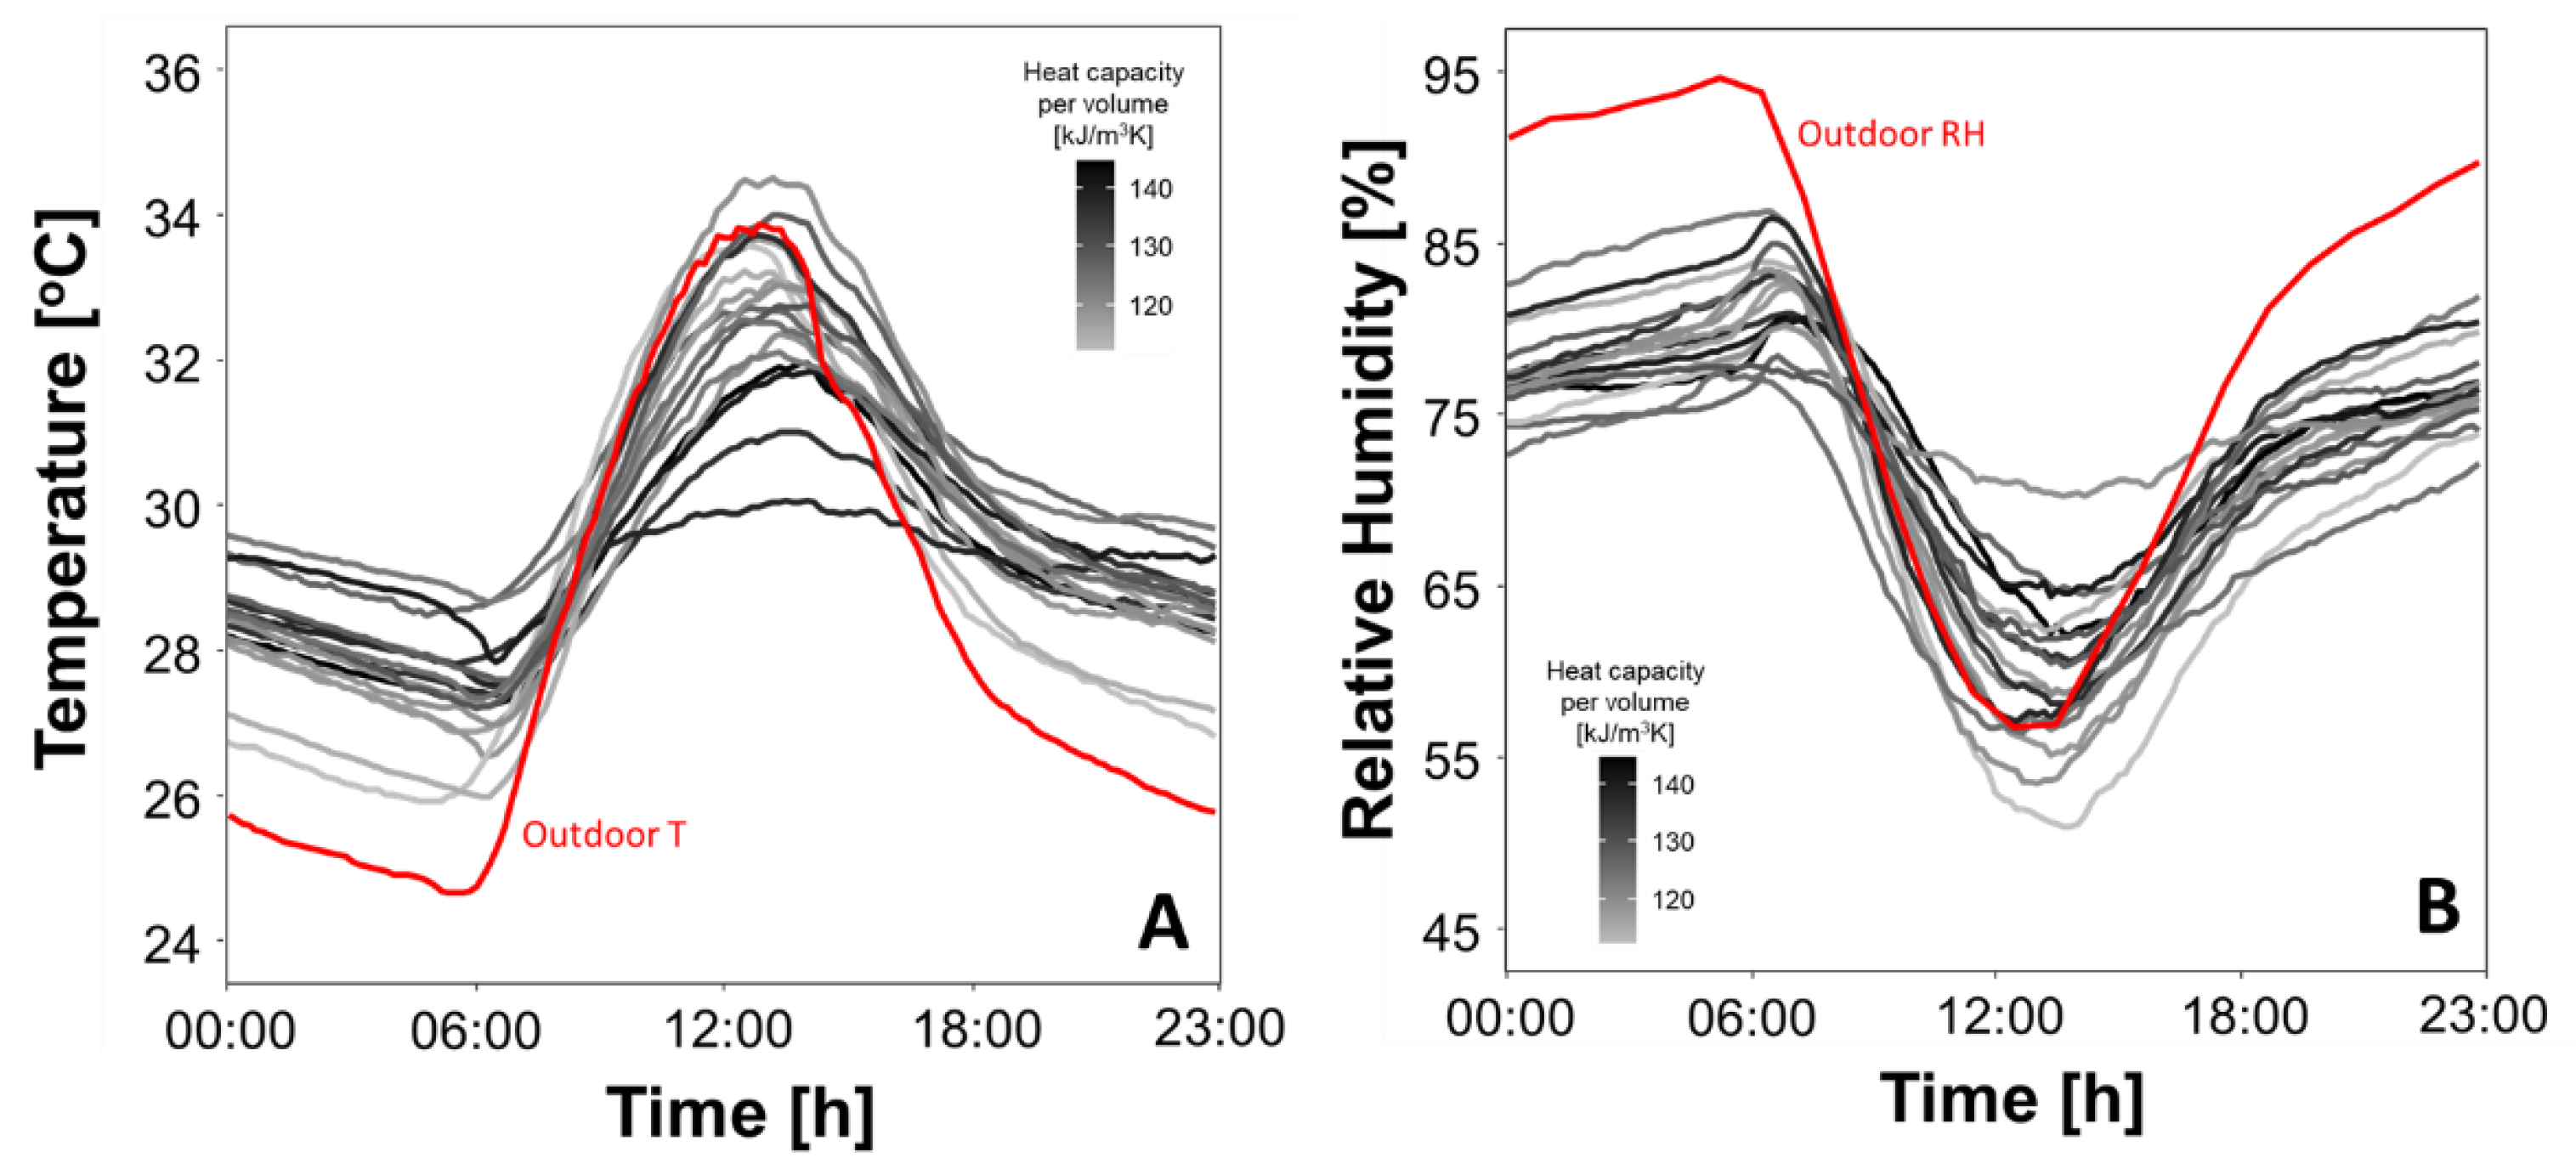
Figure 4 shows the daily average patterns of the indoor temperature and relative humidity for each dwelling. The grey-to-black colour gradation of the plots indicates the effect of the building heat capacity per volume. These graphs reveal the diverse humidity conditions among the dwellings despite them being located in the same district. In addition, dwellings with low indoor temperatures tended to have higher relative humidity, as expected.
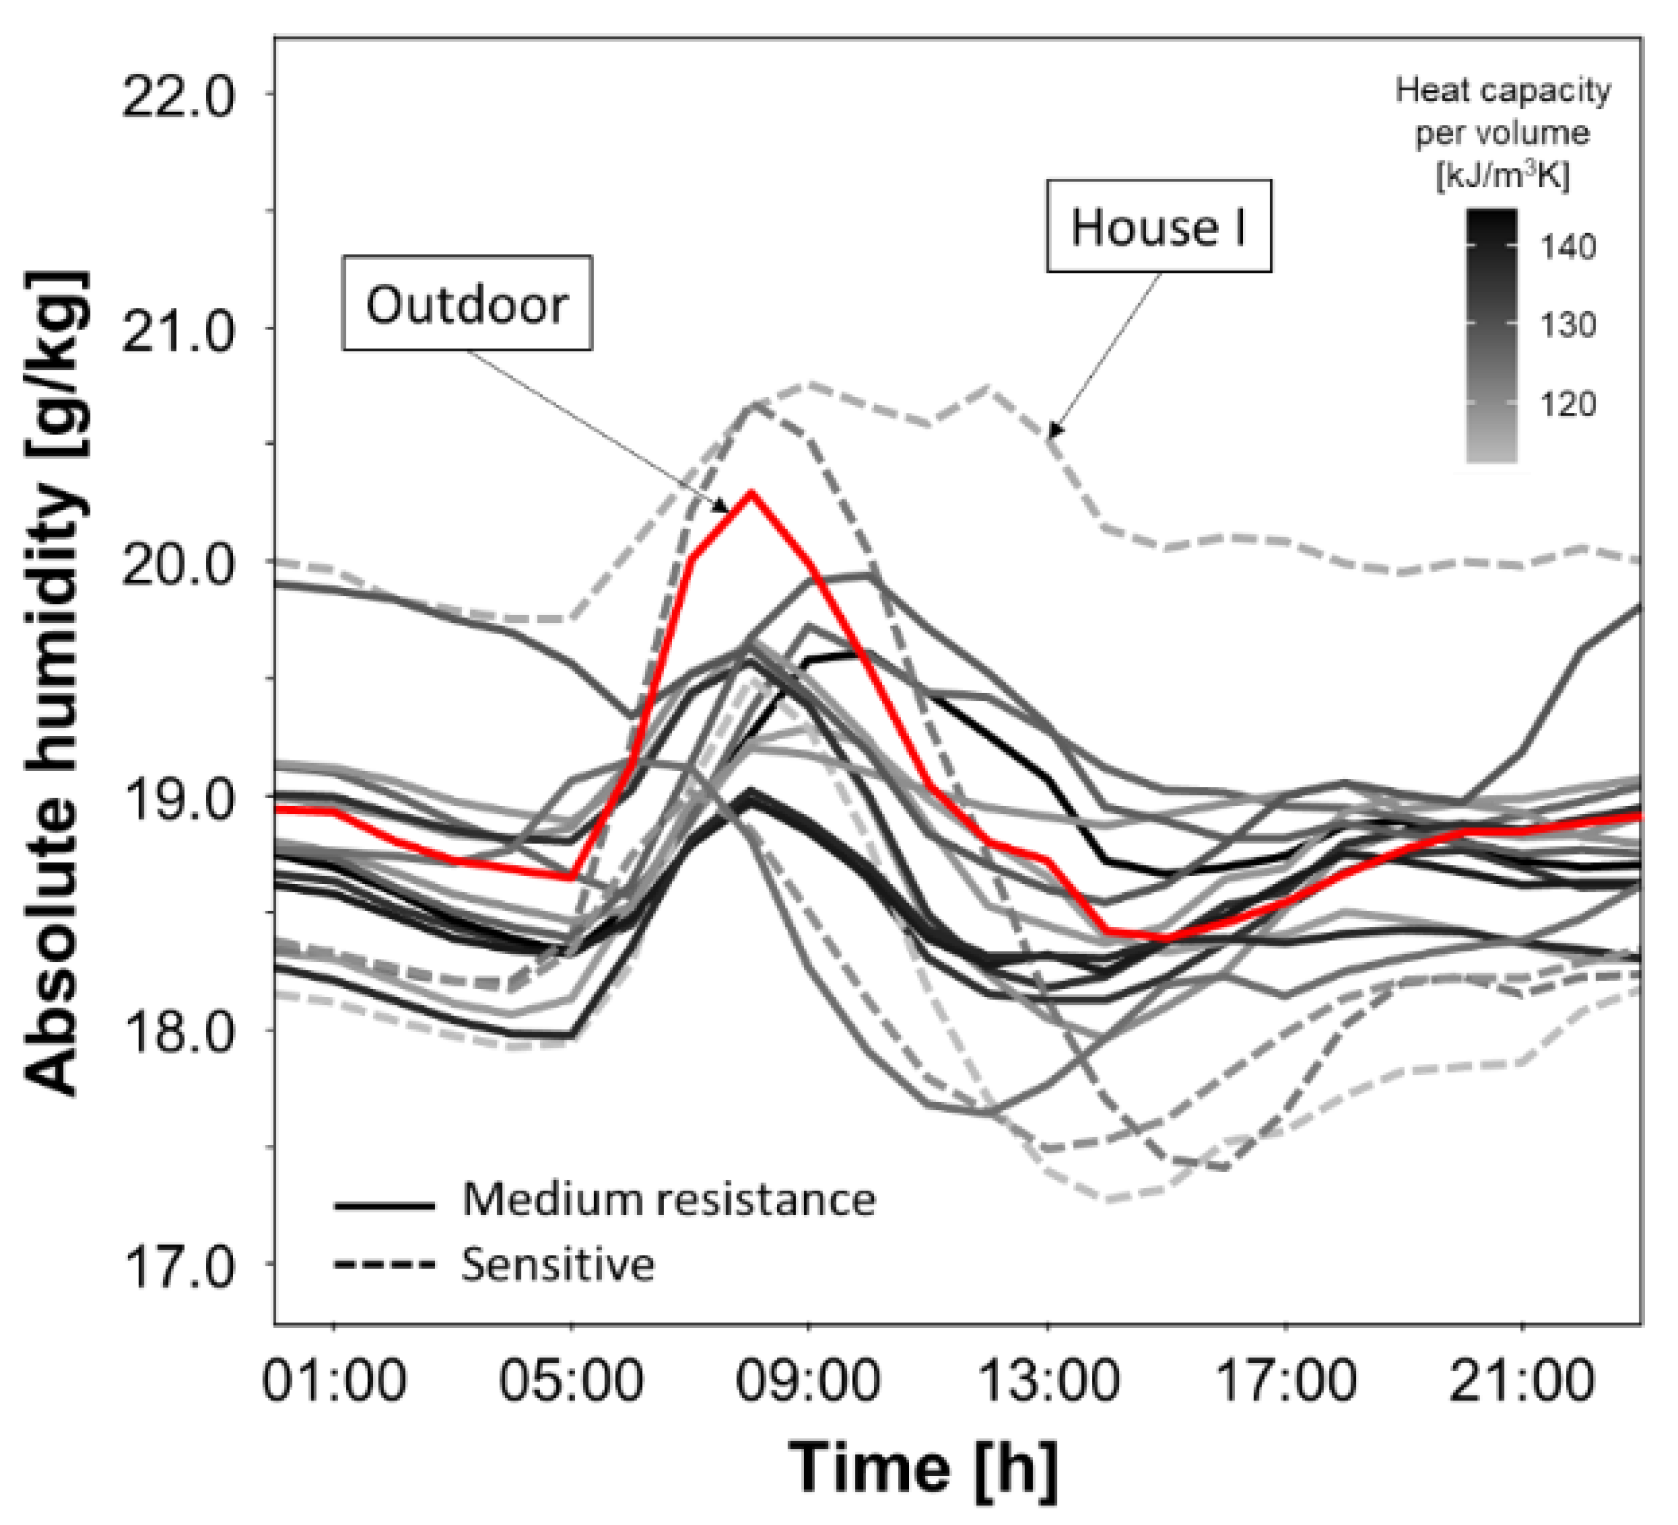
Water vapour transport phenomena in indoor and outdoor air are governed by the spatial distribution of physical variables that express the concentration of water vapour in air, such as absolute humidity, specific humidity, and water vapour partial pressure, rather than relative humidity. Thus, absolute humidity (AH) was estimated from the measured temperature and relative humidity values. Figure 5 shows the average daily variation pattern of absolute humidity in the indoor and outdoor environments. The colour gradation of the plots indicates the building heat capacity per volume in the same manner as in Figure 4. The daily outdoor absolute humidity ranged from 18.4 to 20.2 g/kg. At night, the outdoor absolute humidity exhibited smaller variation than during the daytime. It rose at approximately 5 a.m. and reached a peak at approximately 9:00 a.m., which was likely caused by enhanced vapour release by evaporation on the ground surface. On the other hand, the indoor absolute humidity varied widely among the dwellings, ranging from 16.2 to 20.8 g/kg. Nevertheless, most dwellings showed a maximum value in the morning and a minimum value after noon, which was similar to that of the outdoor air. The similarity between outdoor air and indoor absolute humidity was natural, as all the surveyed dwellings were naturally ventilated without air conditioning. As expected, unlike the patterns of room temperature and relative humidity depicted in Figure 4, no systematic influence of building heat capacity could be identified in the various patterns of absolute humidity for each residence. This variation in absolute humidity among dwellings suggested that the amount of water vapour emission and the ventilation efficiency varied from dwelling to dwelling. Among all the dwellings, House I showed an exceptional trend with constantly high values compared with those of other dwellings and outdoor air.
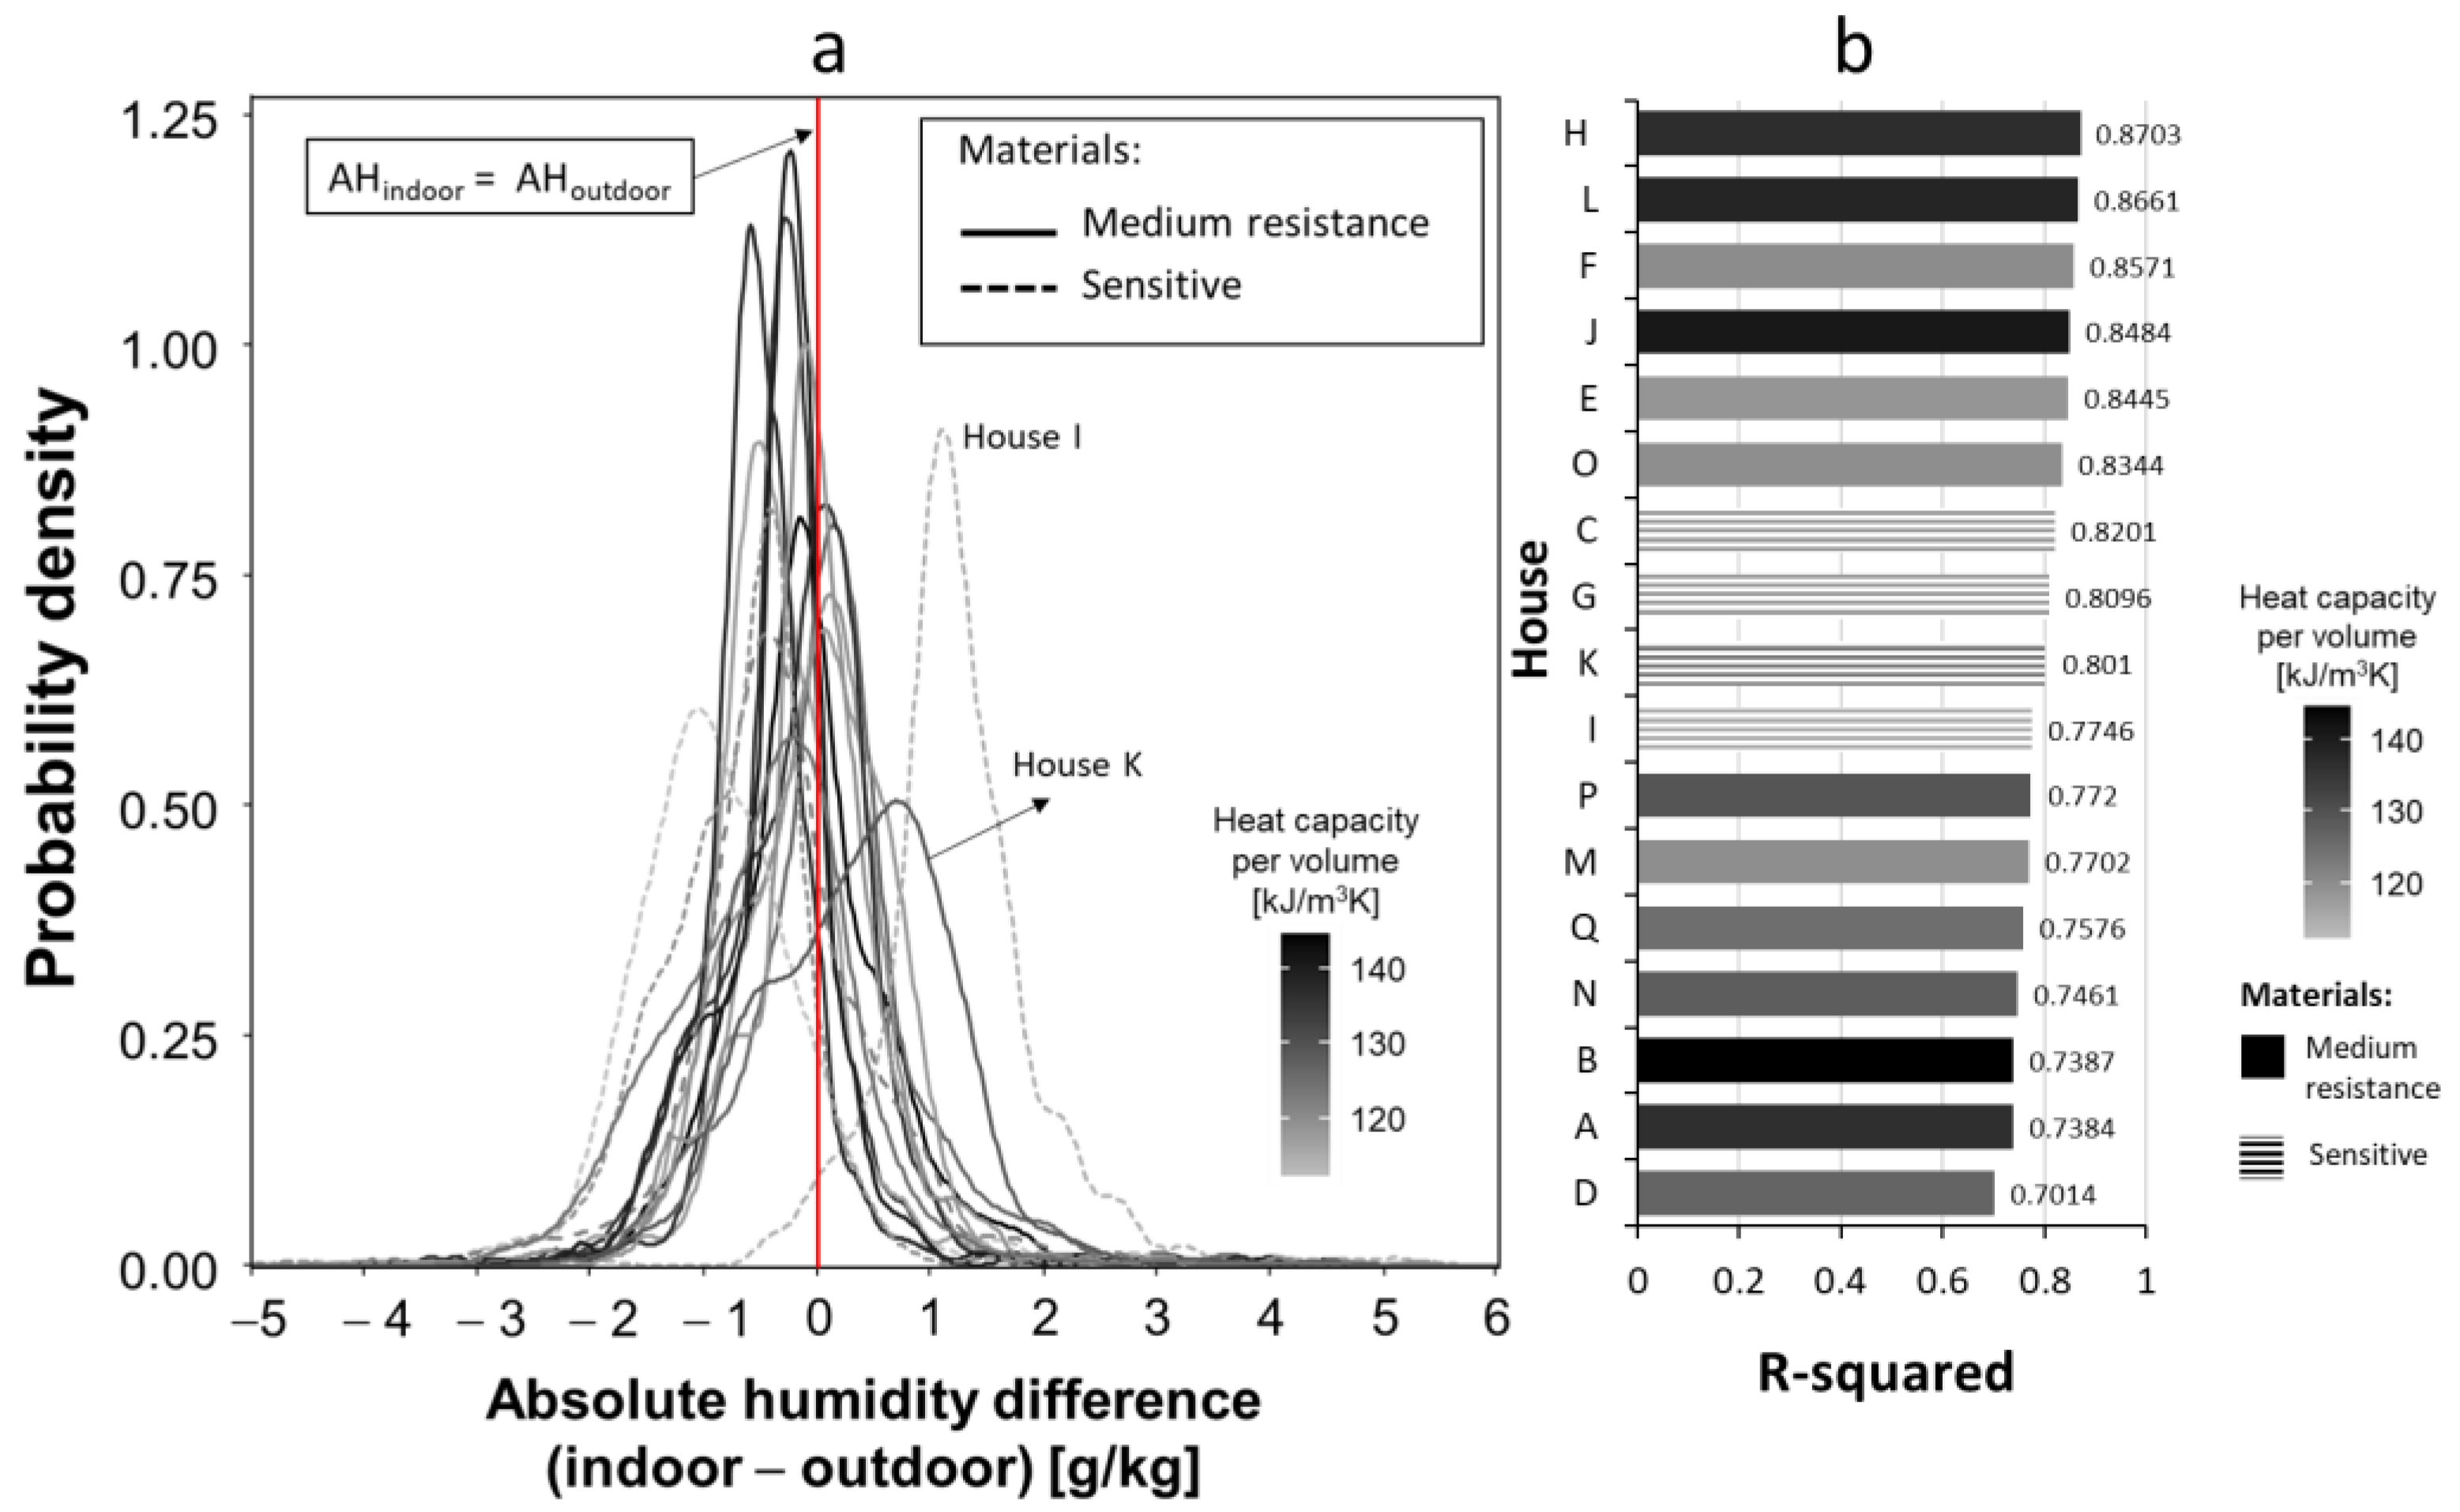
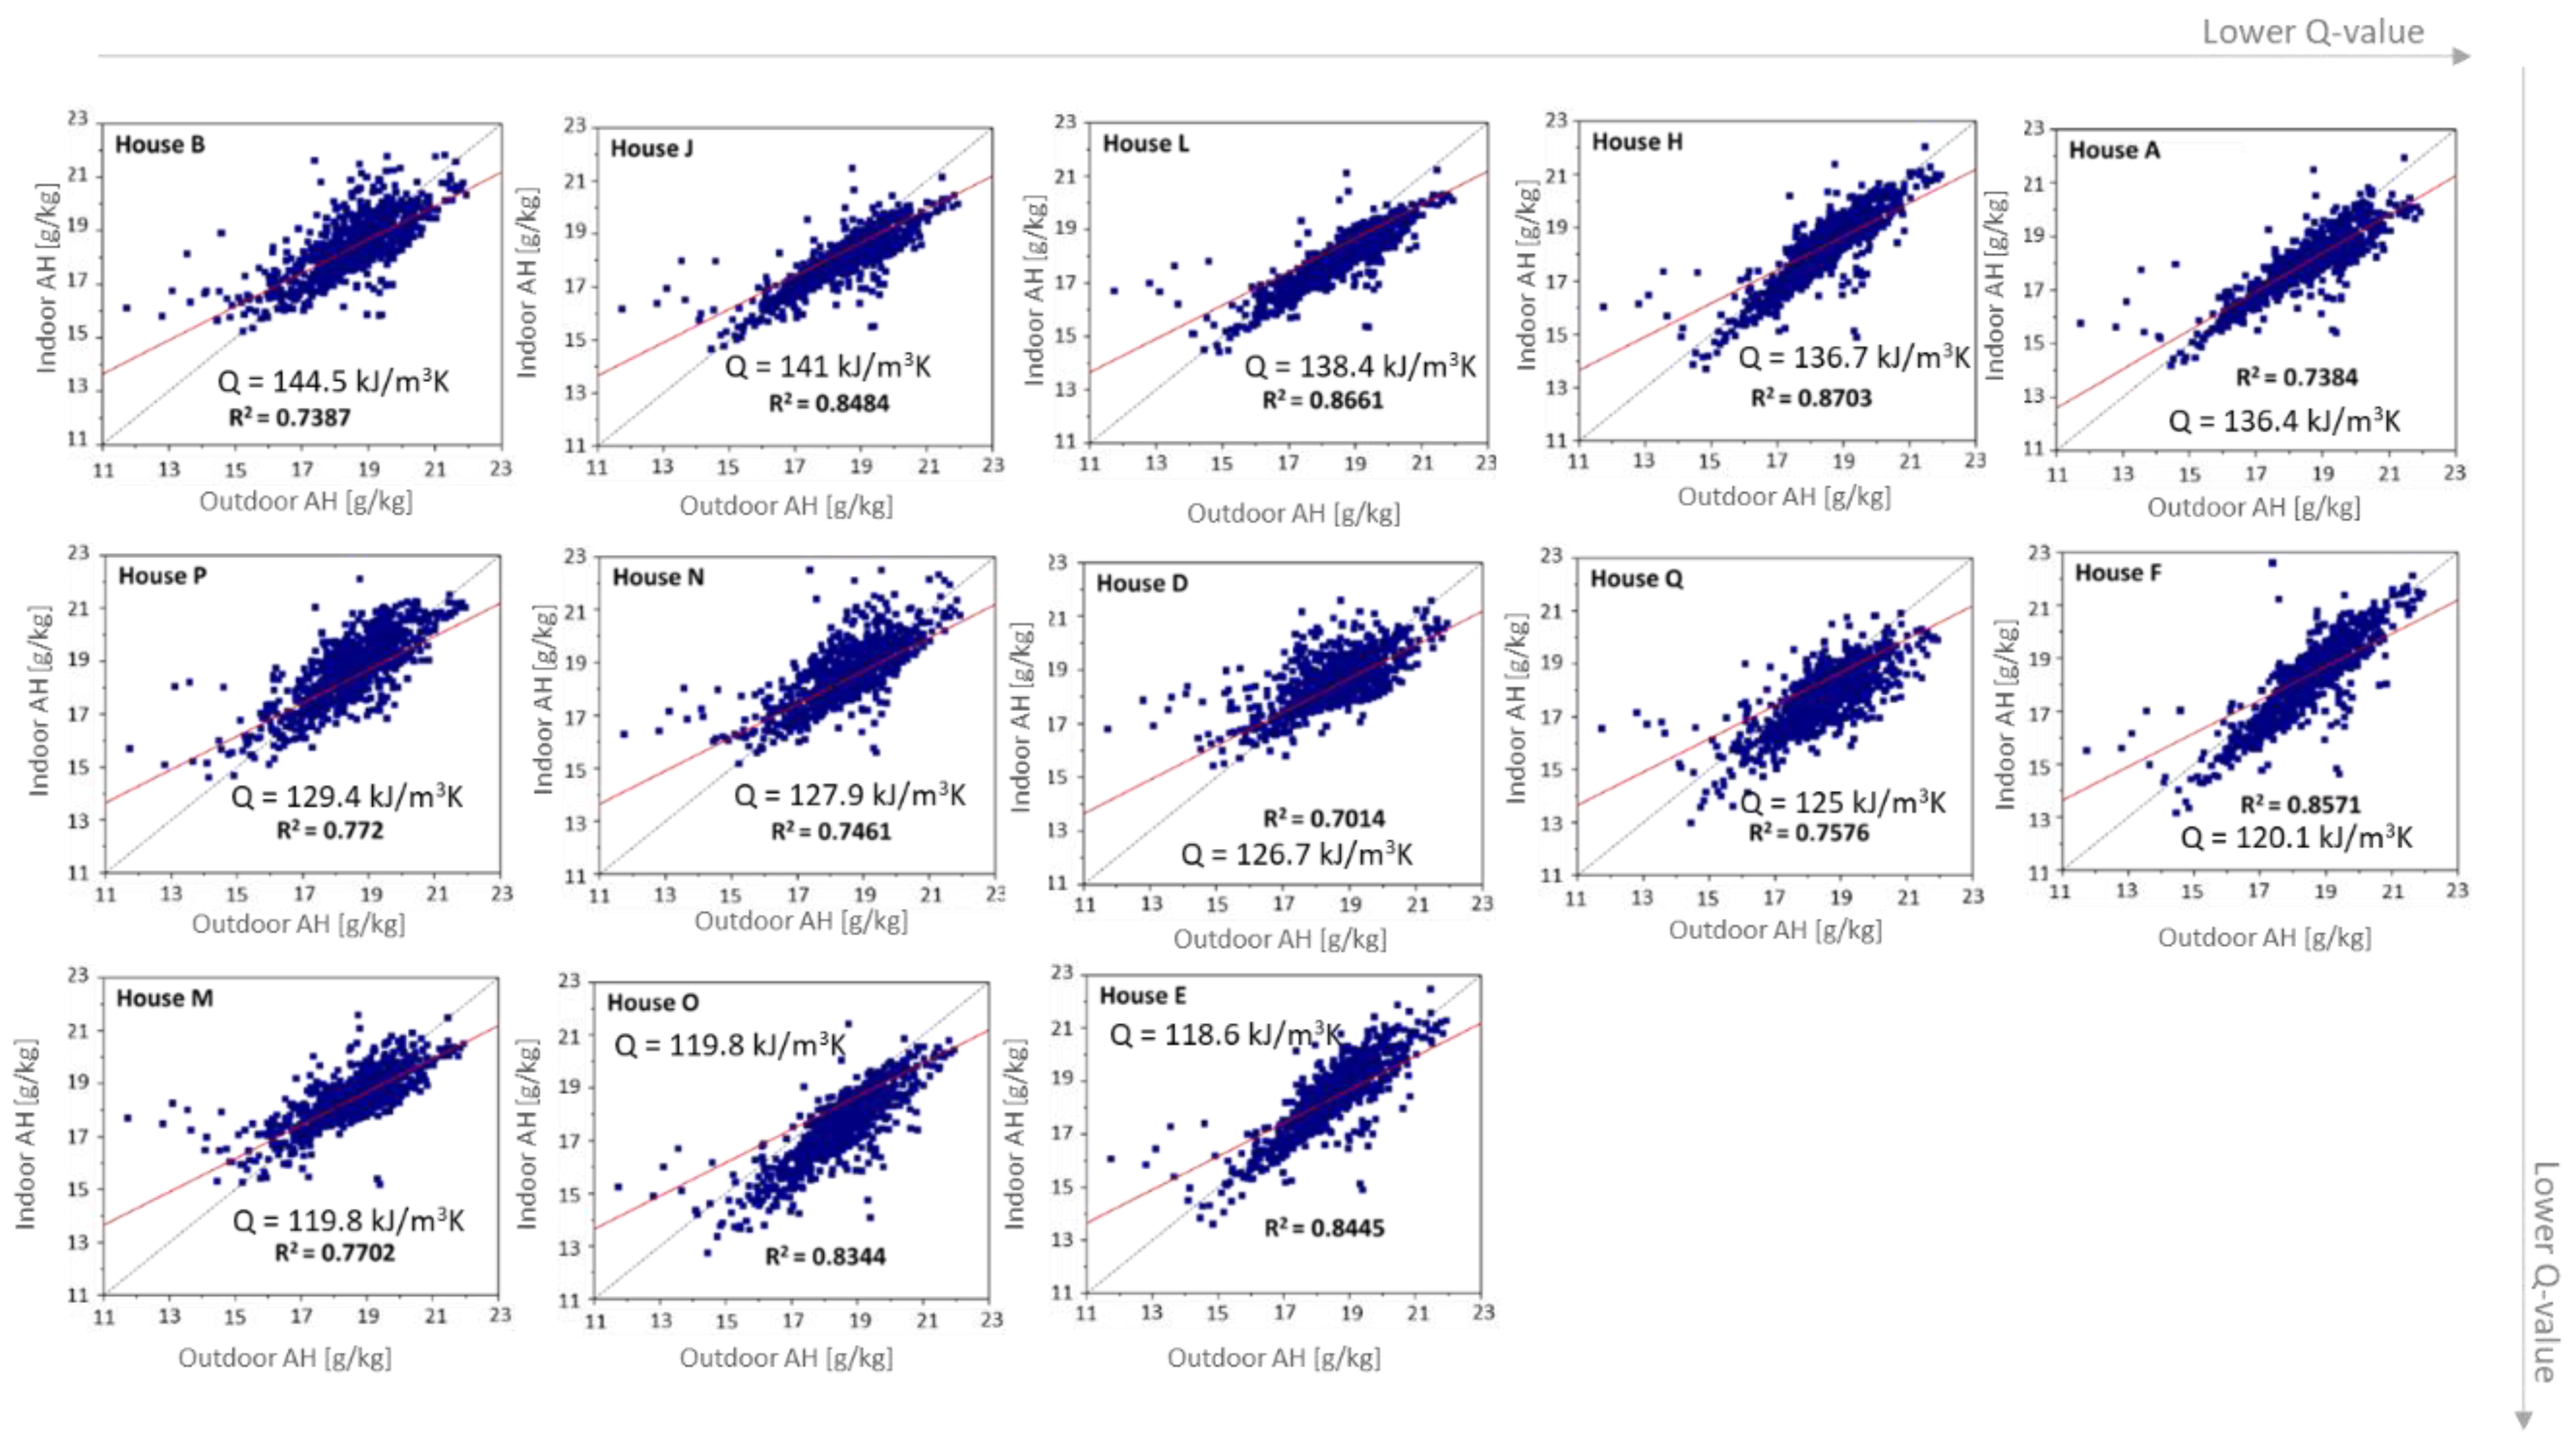
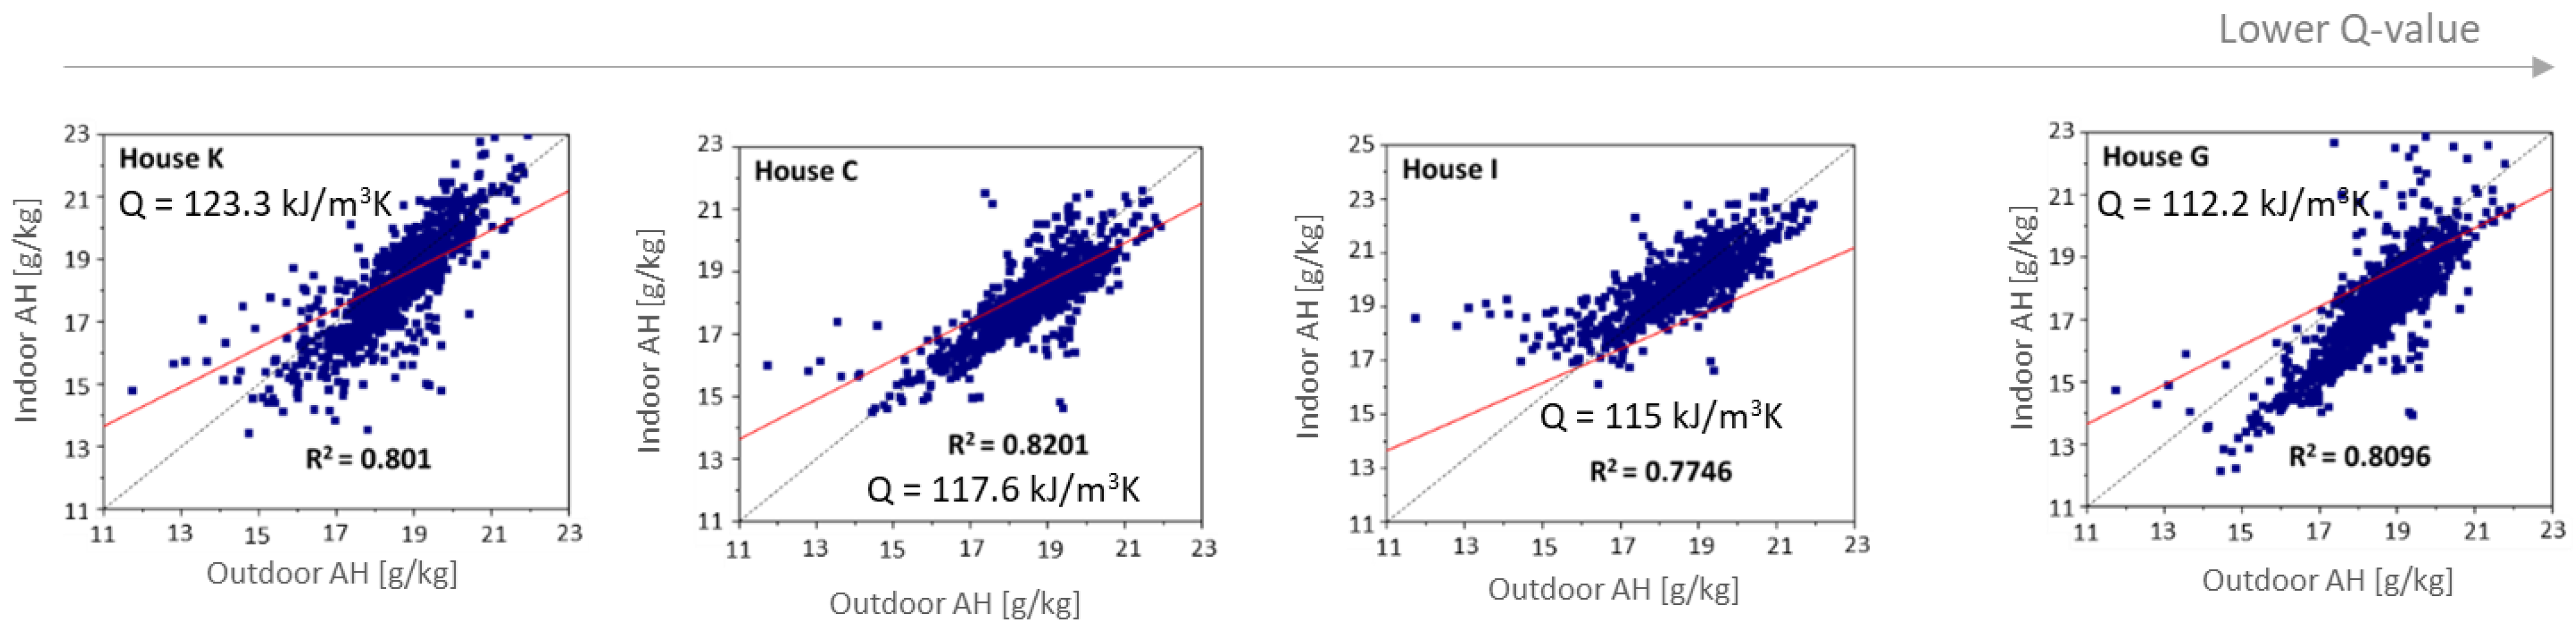
Figure 6a shows the probability density distribution of AH differences between indoors and outdoors (AHin–AHout) for each dwelling, which indirectly indicates the different influences of indoor vapour emission and ventilation among the dwellings. Dashed lines and solid lines refer to the classification of the indoor building materials in terms of the susceptibility against mould. In addition, Figure 6b shows the coefficient of determination (R2) between indoor and outdoor AH. Most of the dwellings exhibited high probability within the range of ±1 g/kg; in contrast, the distributions of House I and House K indicated high probability for over 1 g/kg. This implies that there were some possible emission sources of water vapour inside these dwellings, such as occupants and kitchens. Regarding the correlation coefficients, all the dwellings indicated high R2 values ranging from 0.7014 (House D) to 0.8703 (House H) (see Appendix A). It is not surprising that Figure 6b does not show any substantial relationship between R2 and building materials or building heat capacity. In contrast, although the indoor humidity level is affected not only by natural ventilation but also by indoor vapour emission sources, the lowest R2 for House D was consistent with the smallest ventilation opening area that could be recognised as having an effect to weak air exchange rate conditions.
3.3. Favourable Indoor Conditions for Mould to Grow
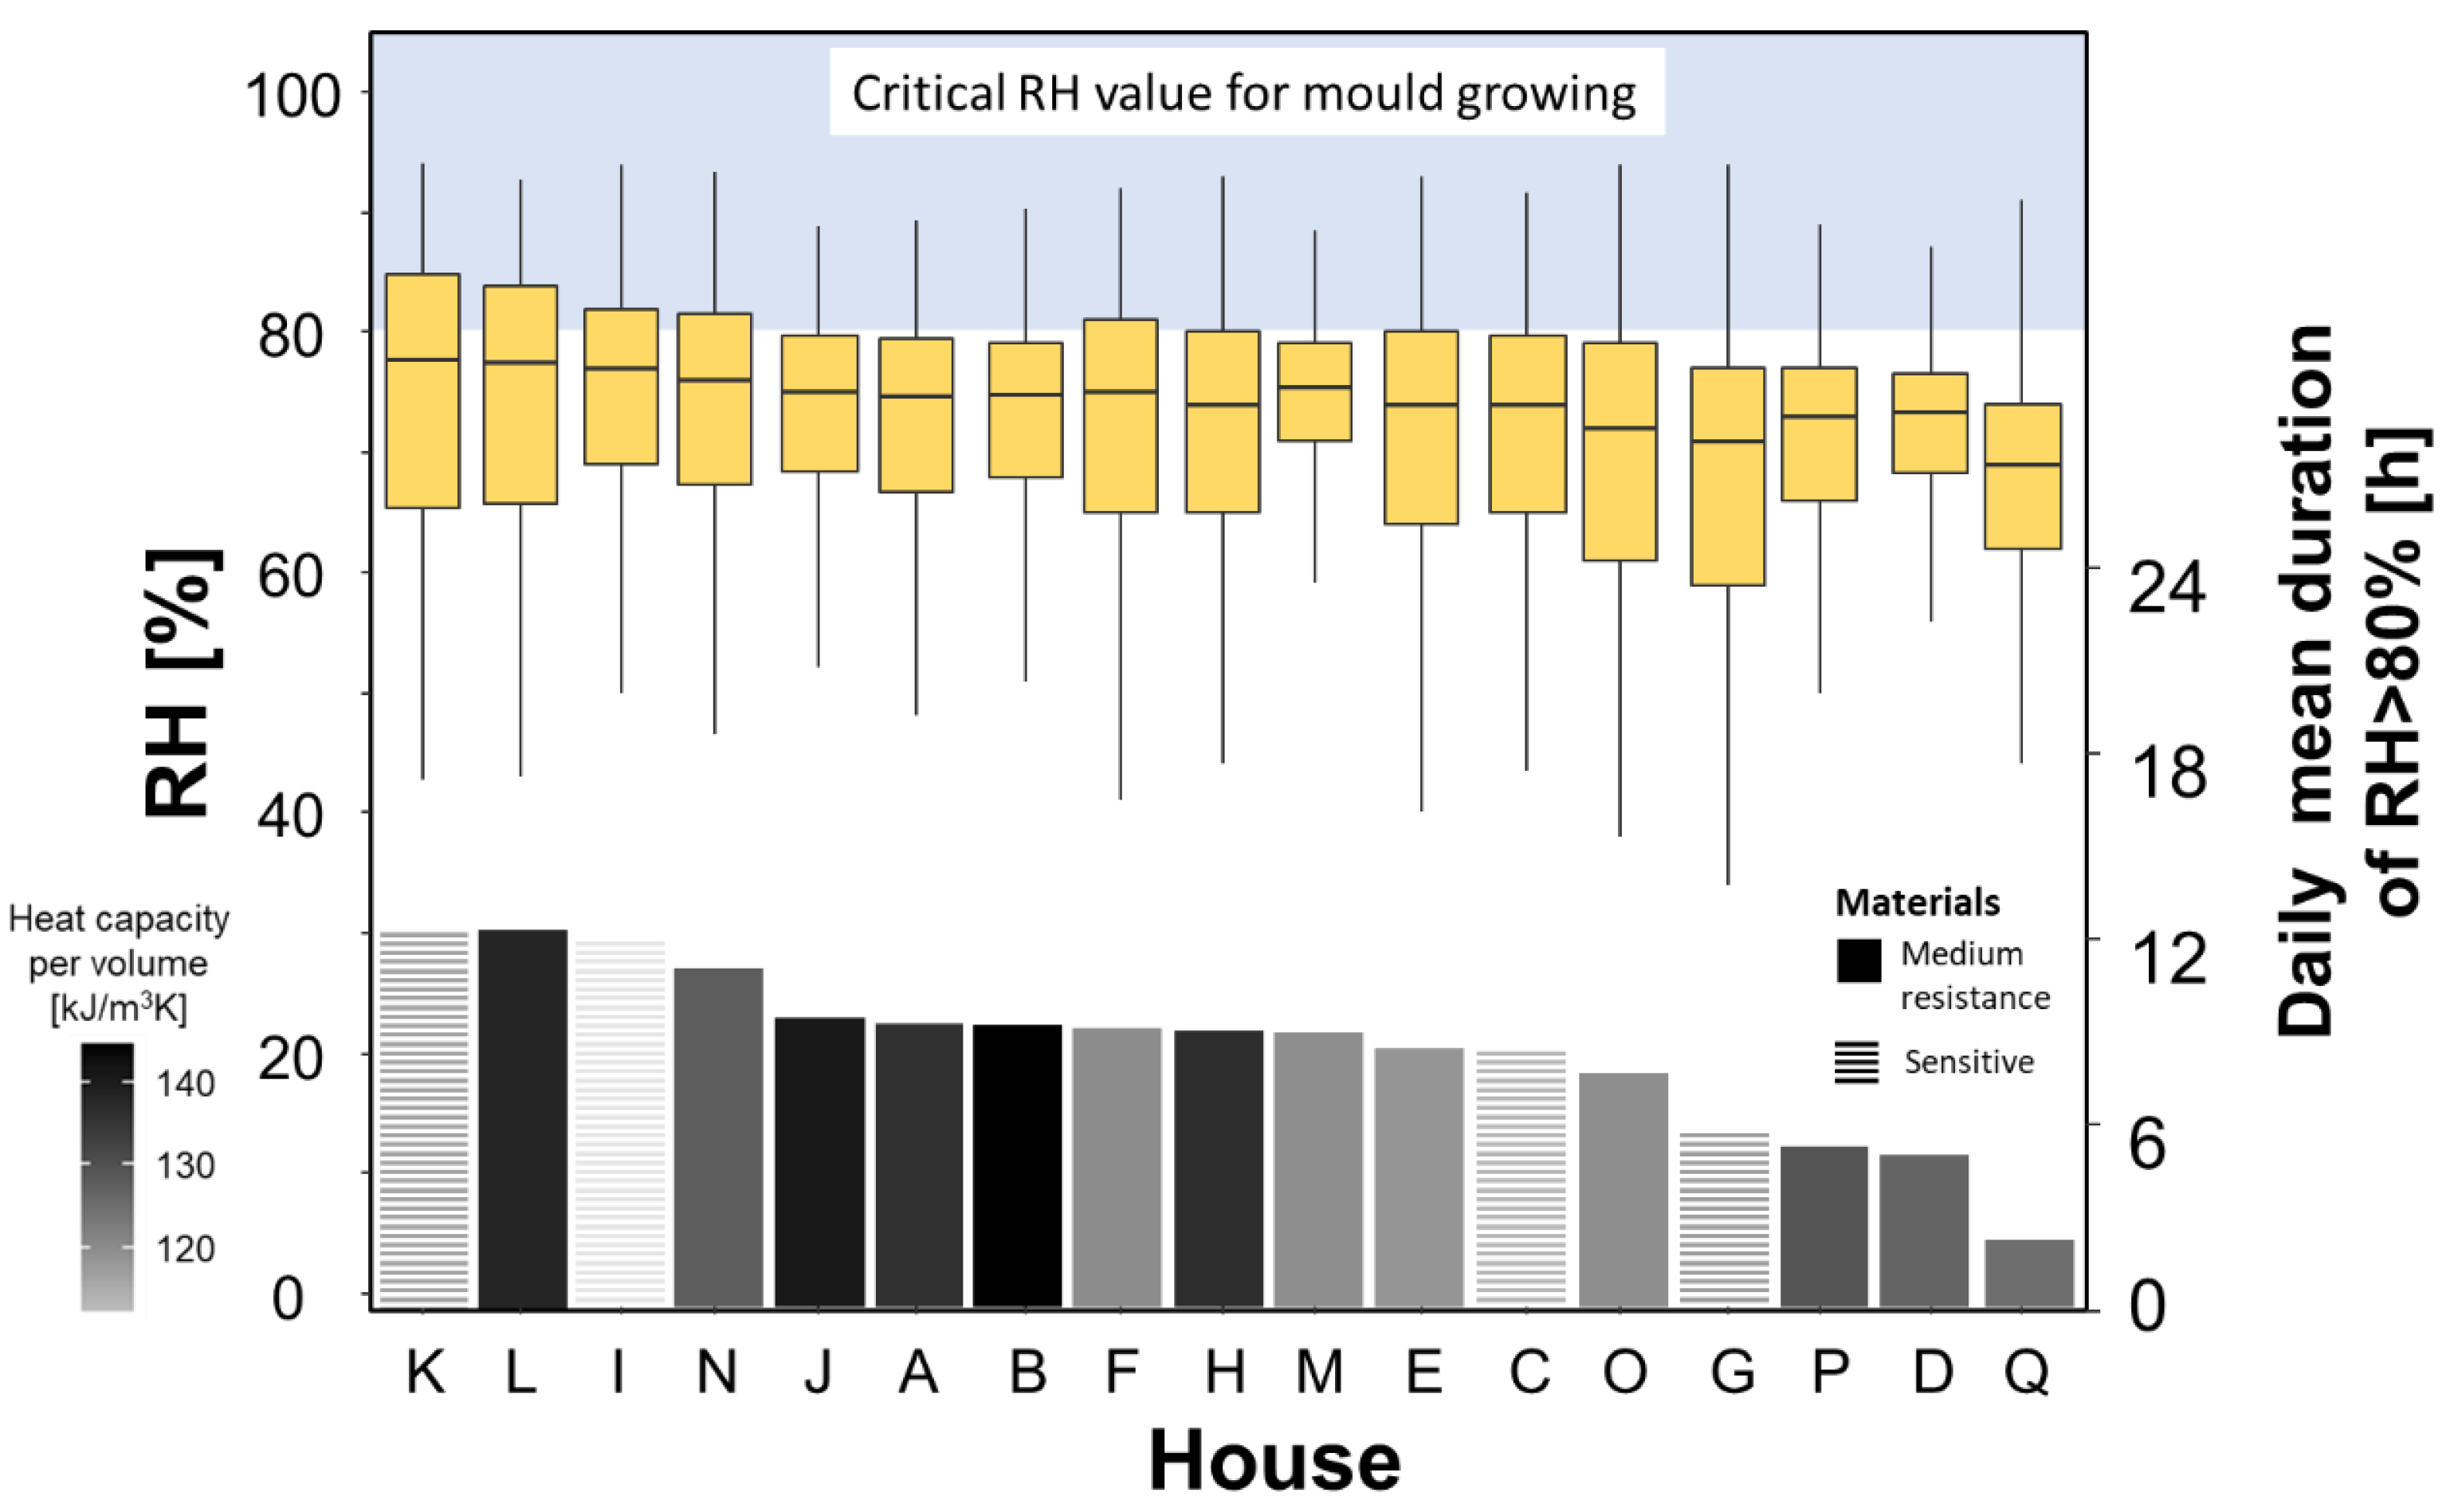
Indoor dampness is a significant determinant of potential mould formation and dispersion. As expressed by the VTT model, the daily average duration of high humidity favourable for mould growth (RH > RHc) observed in the dwellings during the measurement period is shown in Figure 7. The box plot of indoor relative humidity of each dwelling is also included in the figure. The relative humidity quartile range varied from house to house, with comparatively low values below 10% (Houses D and M) and high values around 20% (Houses K and L). The third quartile of relative humidity for the majority of dwellings was around 80%, which was the lower limit of favourable conditions for mould growth, and more than 8.5 h a day were humid. Specifically, the top three dwellings (Houses K, L, and I) in terms of the duration of RH > 80% showed around 12.3 h per day. Among these three dwellings, the walls of Houses K and I were made of materials that are susceptible to mould growth, indicating that their residents need to pay special attention to preventing the spread of mould. Conversely, House Q showed the shortest period of favourable mould growth conditions of 2.2 h per day.
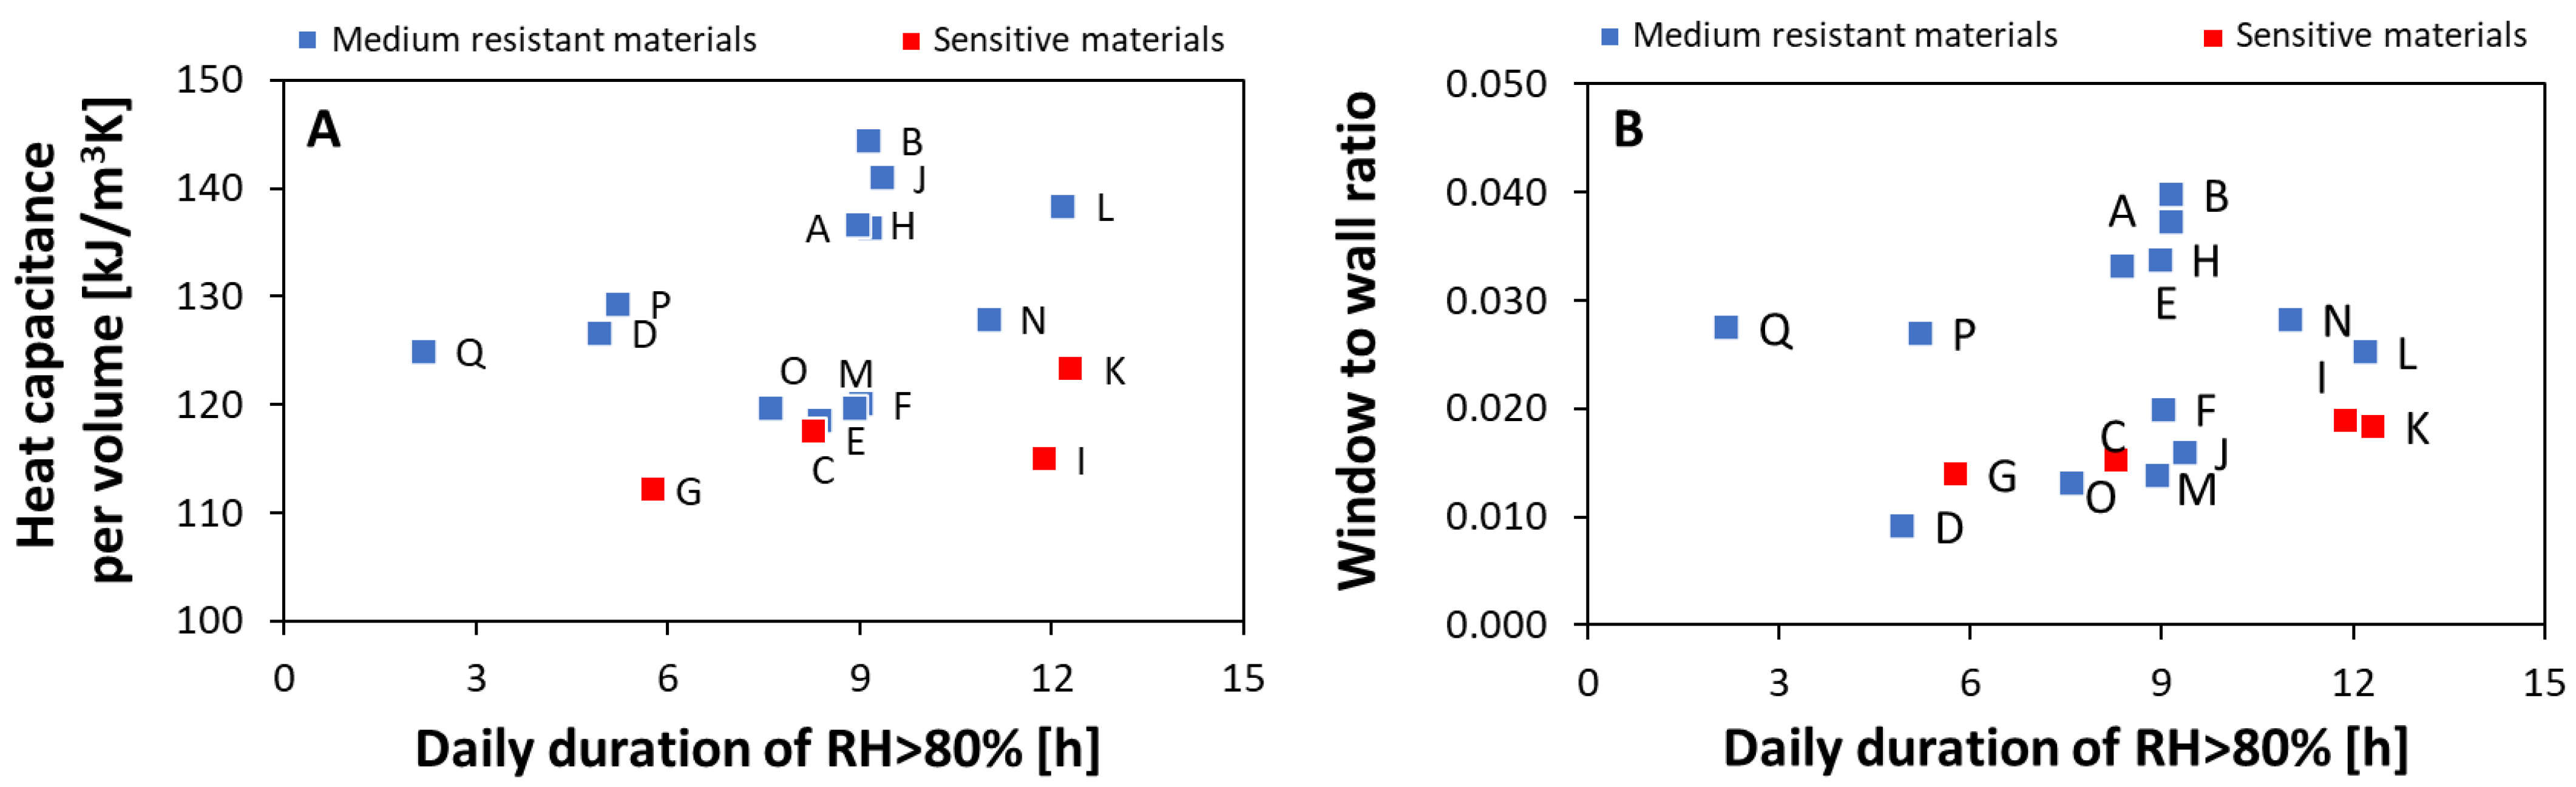
Figure 8 shows the relationship between high-humidity duration and building-related variables, that is, the building heat capacity per volume and window-to-wall ratio. Although these showed a relatively large scatter, a positive relationship was observed among these variables, with a daily duration of RH > 80%. Regarding the influence of the window-to-wall ratio, this result is consistent with a previous finding highlighted by Woloszyn et al. (2009), who confirmed that a higher air change rate has a considerable impact on indoor humidity and temperature as part of the accelerating air renewal process in naturally ventilated buildings [55]. In addition, in terms of moisture, a lower window-to-wall ratio of dwellings denotes an indoor space with poor ventilation, which causes moist air to become stuck within the rooms [37]. On the other hand, the tendency of the dwellings constructed with higher heat capacity materials to have a longer duration is unsurprising and is likely caused by the attenuated daily variation of indoor air temperature reported in a previous study [33,46,56,57].
3.4. Mould Growth Index and Influencing Factors
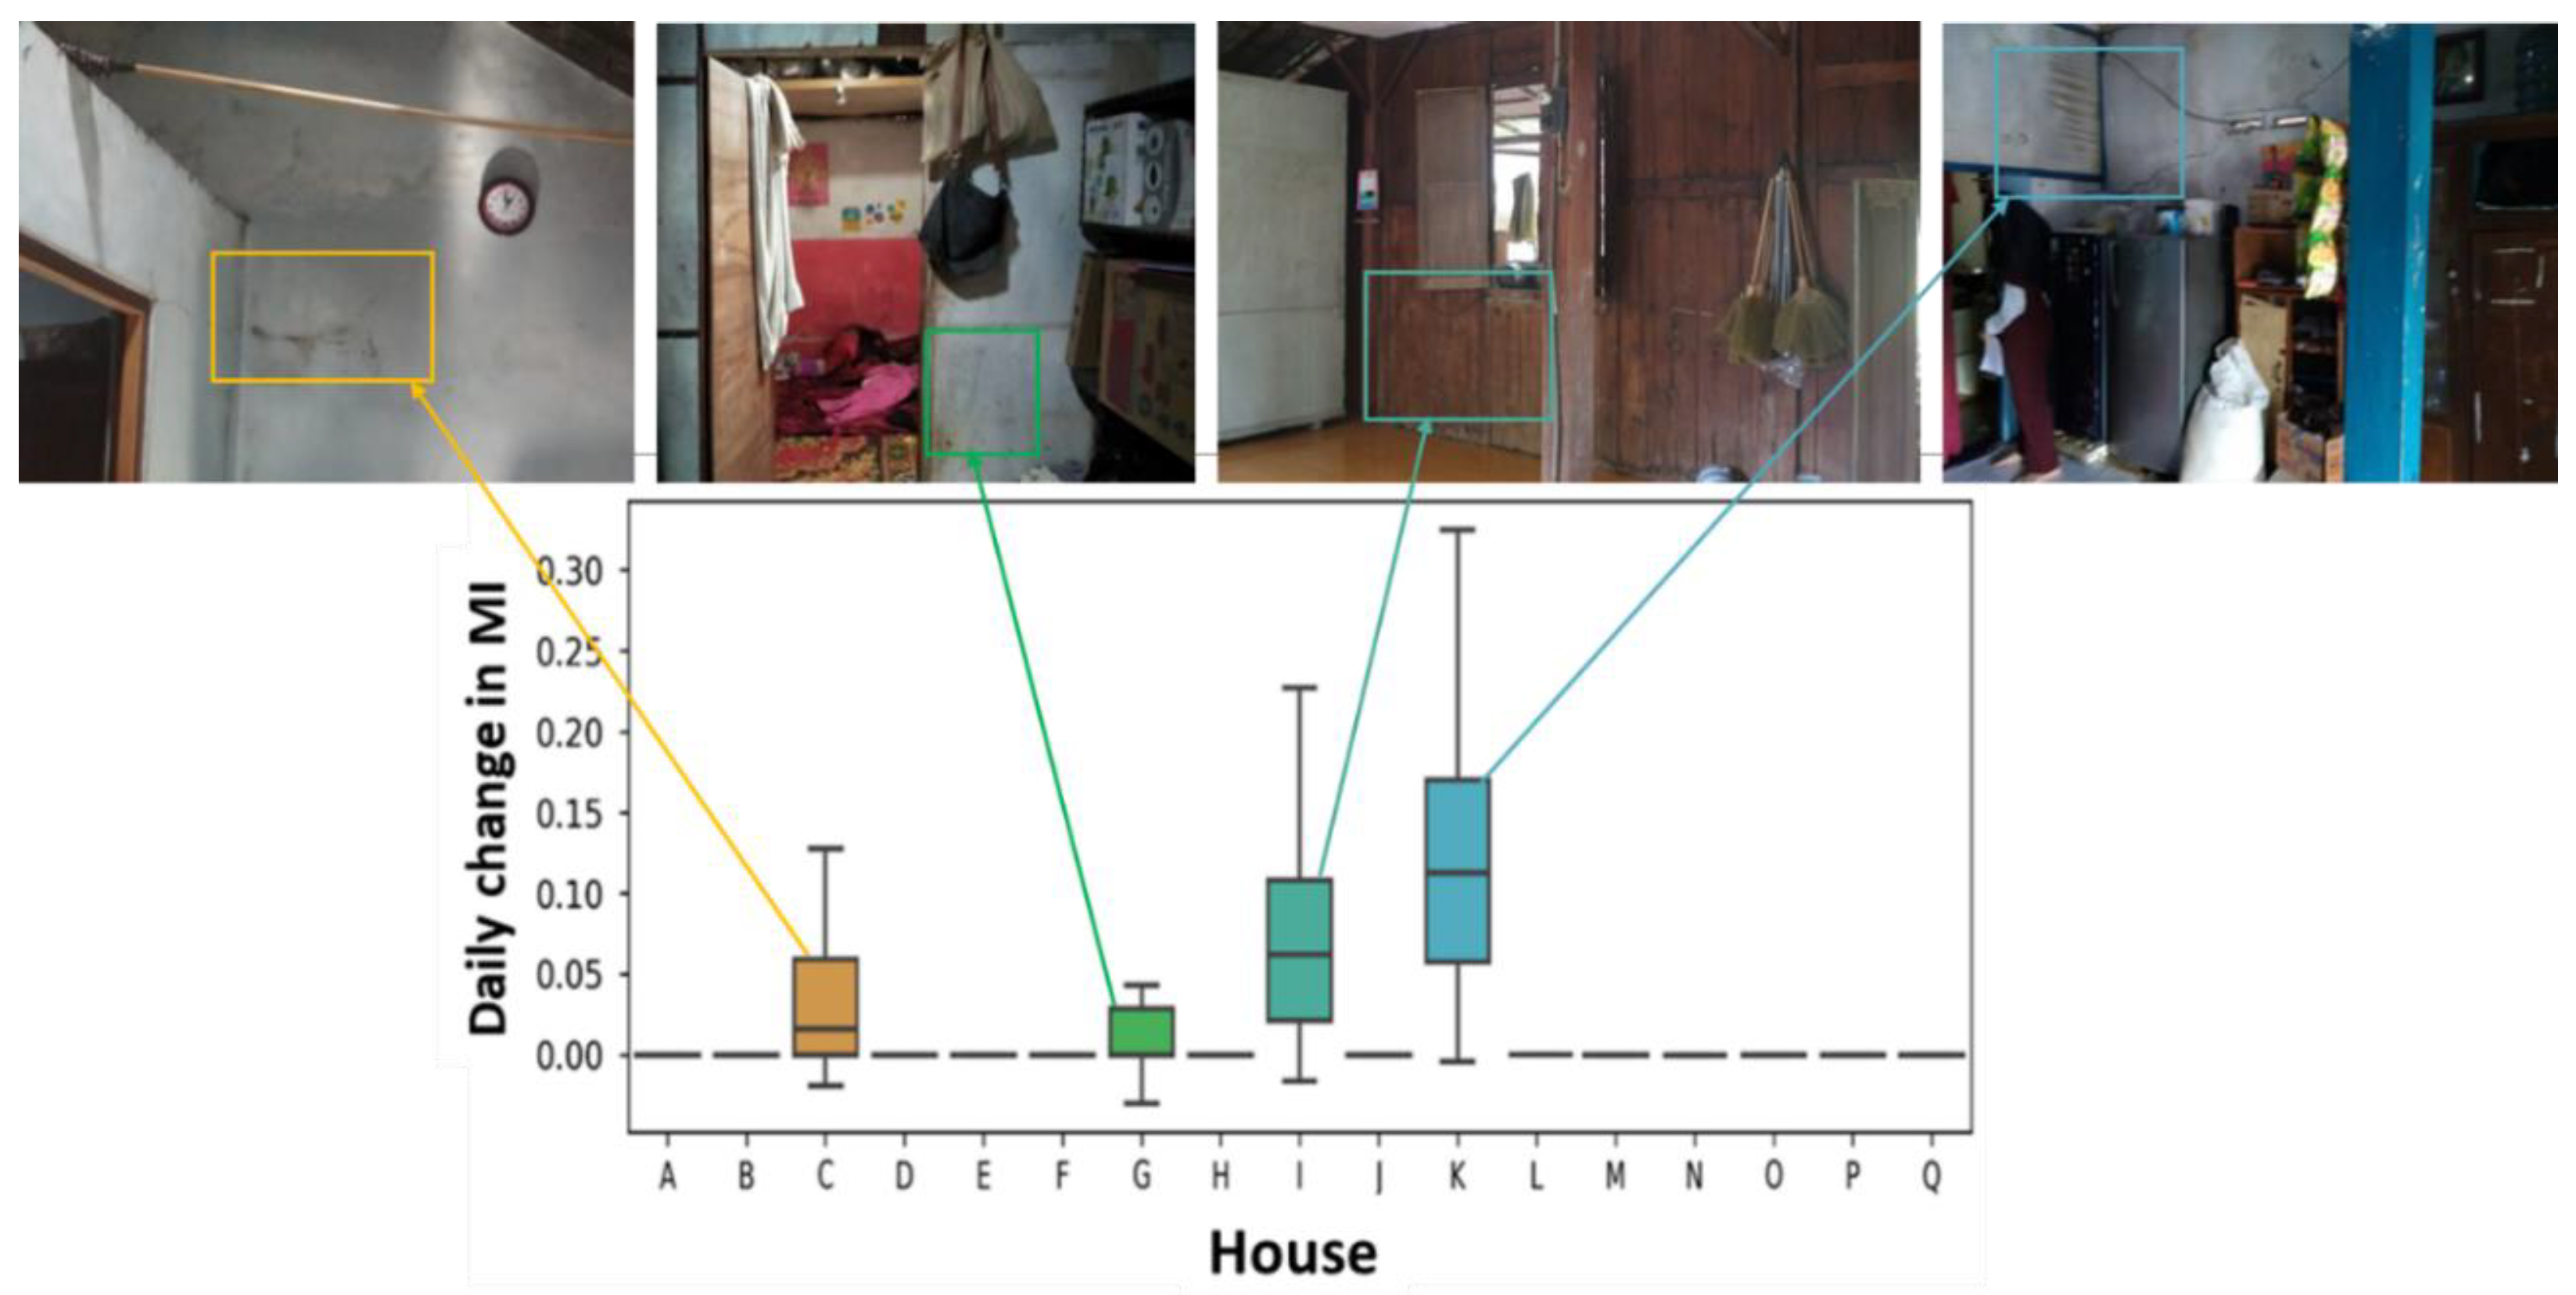
Figure 9 shows boxplots of the daily changes in the mould growth index. The indoor appearance of the dwellings that were made of wall materials susceptible to mould is also shown for reference. Even though the duration of RH > 80% was relatively high for dwellings L and N, with medium resistance of wall surface materials, daily mould growth was estimated to be very small. On the other hand, the four dwellings constructed using plywood boards, which were classified as sensitive to mould, showed significantly larger values than others did. Furthermore, as evidenced by the photographs, we observed the growth of mould on certain portions of the interior walls of these dwellings during the survey period.
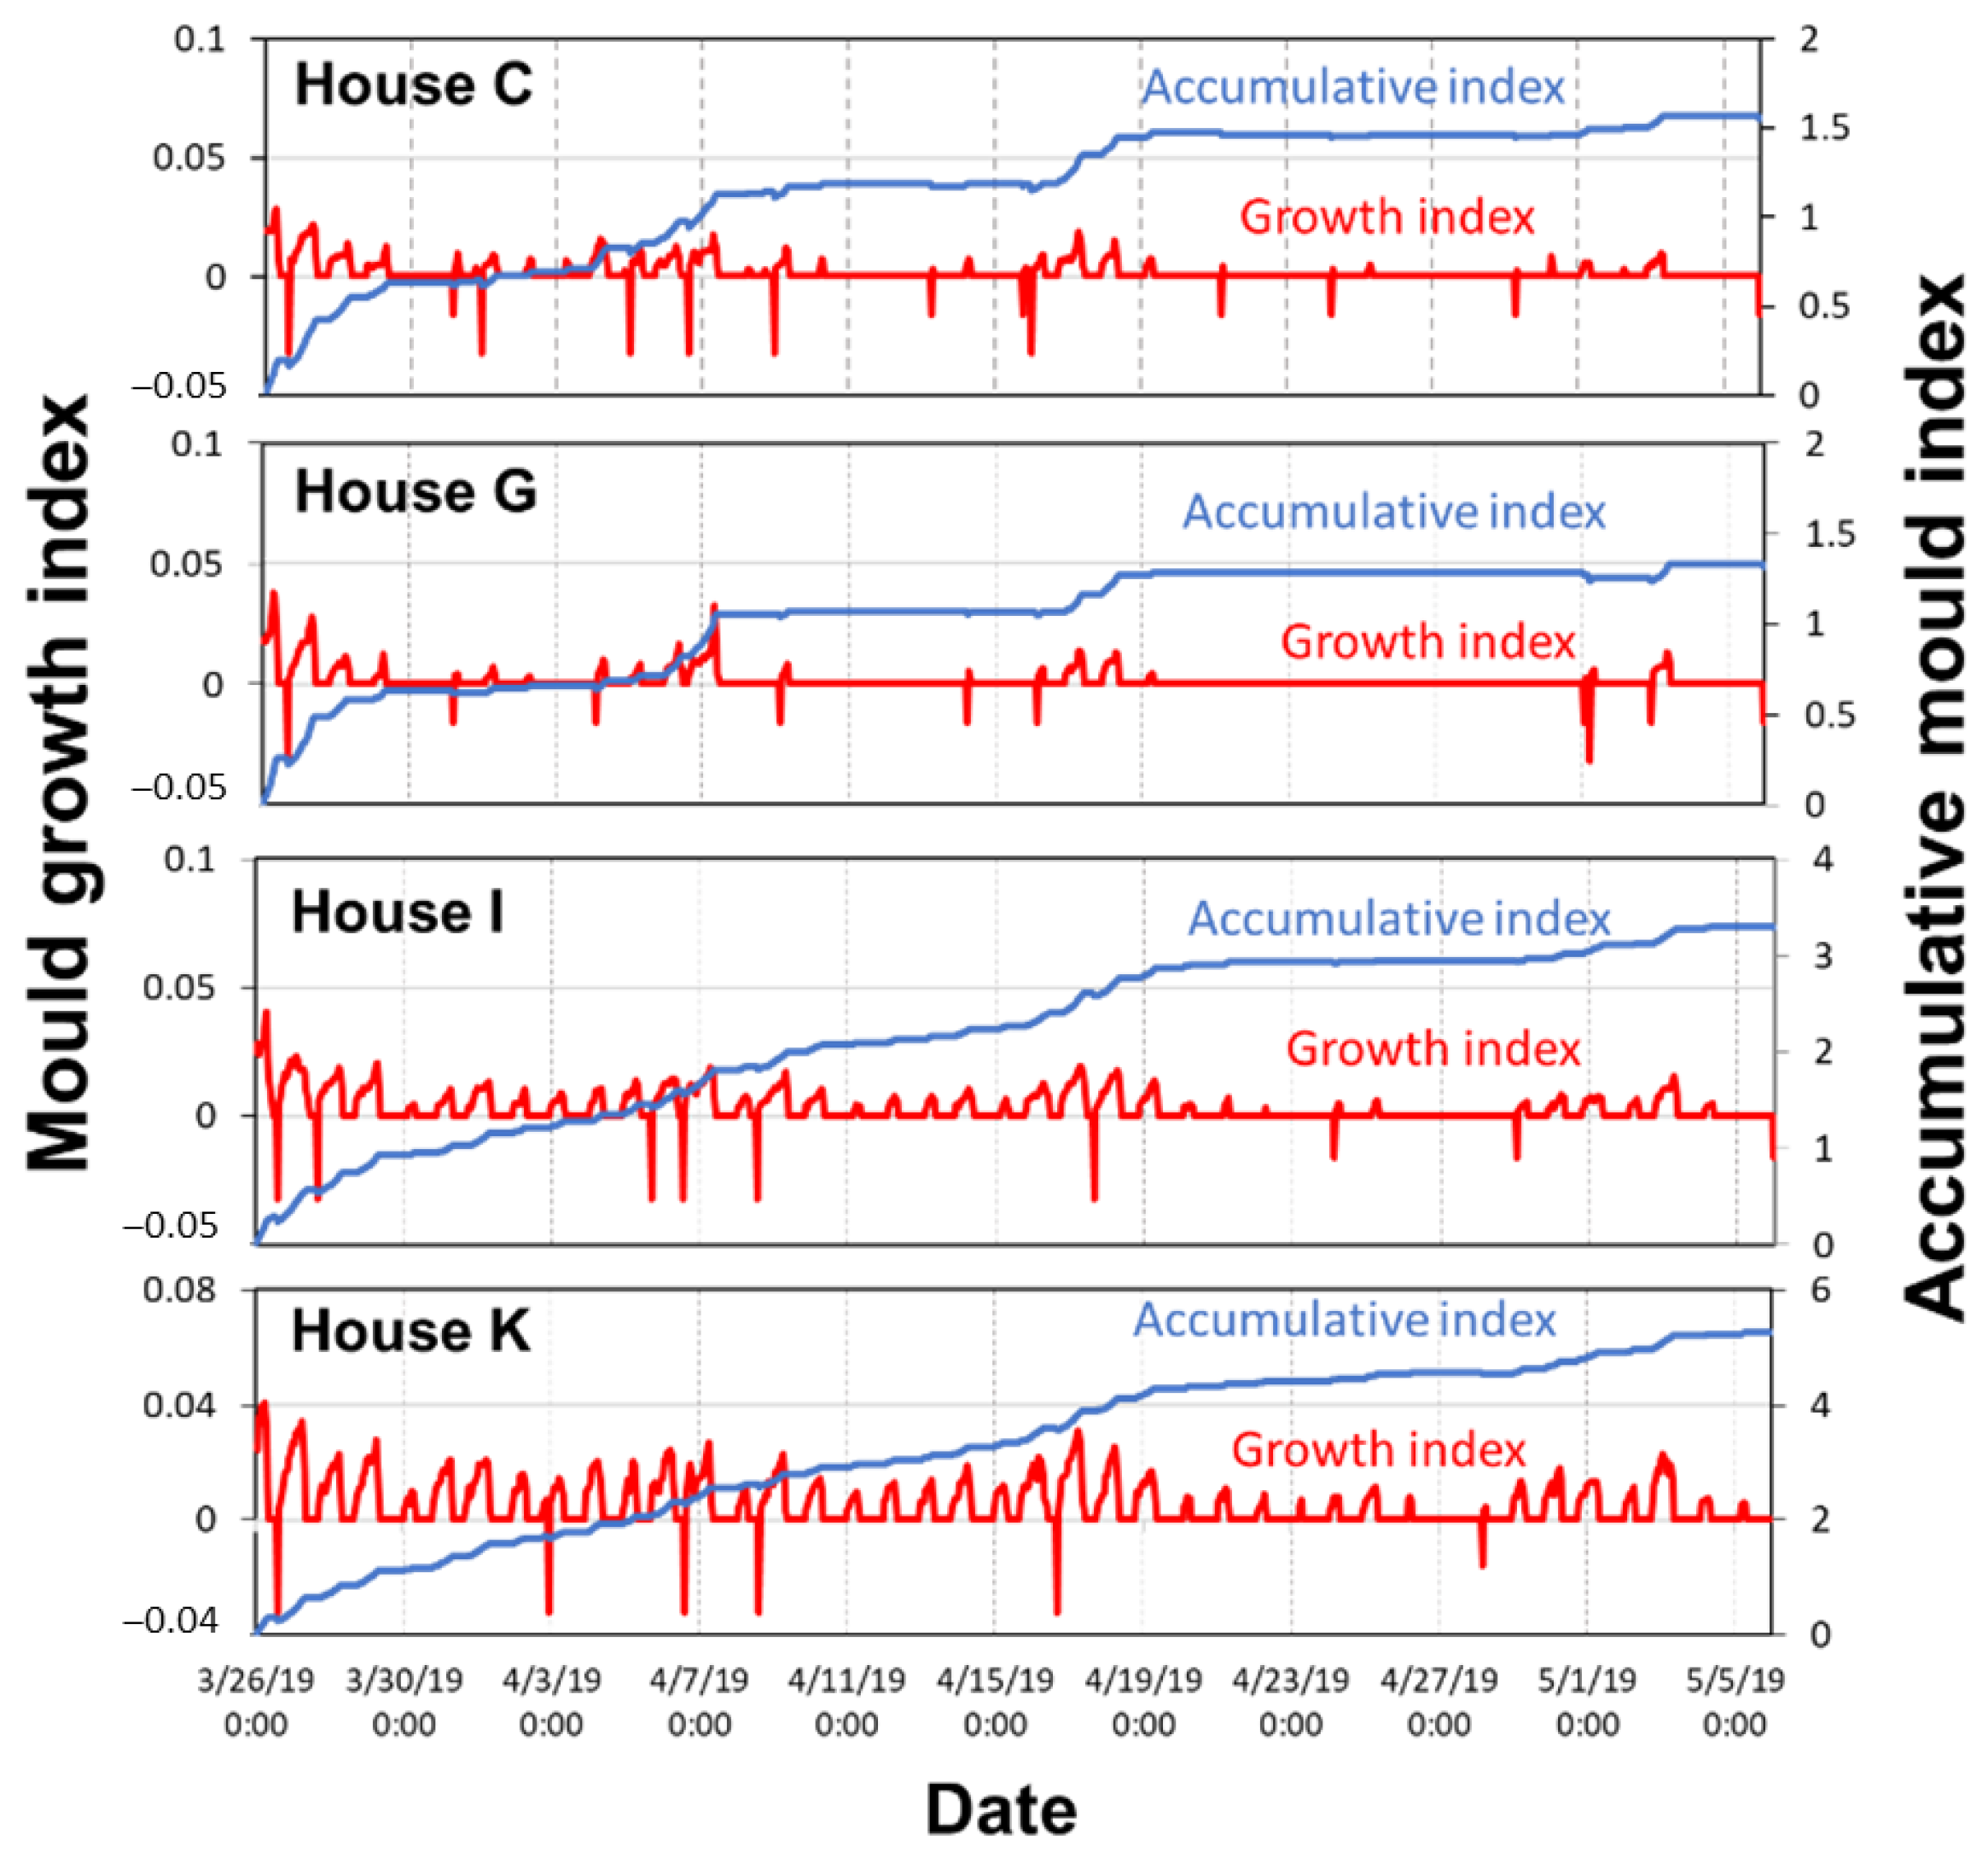
Figure 10 presents the time-series data of the dynamic and accumulative mould growth index M for the entire measurement period (26 March to 5 May 2019) for the four dwellings with sensitive wall surface materials. As we assumed the initial values of M to be zero, historic influences on the mould index level before the measurement period were neglected. The highest mould growth index among the four dwellings was 5.3 (House K) at the end of the measurement period. In terms of dynamic fluctuation per time interval of 1 h, the maximum value was 0.040 for Houses I and K, and 0.030 for Houses C and G. Zero and negative values of dynamic mould growth indicate the declining stage of mould growth when conditions become unfavourable (RH drops below RHc).
Table 4 shows the Spearman’s rank correlation coefficient between dwelling characteristics and percentiles (2.5th, 25th, 50th, 75th, and 97.5th) of the mould growth index. In this analysis, we focused on dwellings that were potentially sensitive to mould growth (houses C, G, I, and K). Spearman’s rank correlation was employed, with a confidence interval of 95%, to observe the strength and direction of the relationship between these factors. We observed that volumetric heat capacity showed a significant positive correlation with mould growth at higher percentiles, i.e., 75th and 97.5th, with significant levels of (p-value) 0.036 and 0.008, respectively. This implies that the observed dwellings with smaller heat capacity per room volume were likely to be susceptible to mould. Additionally, despite a smaller window-to-wall ratio (WWR) demonstrating a longer daily duration of RH > 80%, in terms of the mould index, no significant correlations were observed. Additionally, the relationship between mould growth and daily frequency at which the occupants opened their windows was also identified as statistically insignificant.
3.5. Building Conditions and Occupants’ Behaviours Related to Indoor Air Quality and Dampness
Based on an in-depth interview of the residents of 11 dwellings, 10 of the 11 houses were found to have a family income of <2 million rupiah (approximately USD 150), which was below the regional standard income, and one house had a family income of >2 million rupiah (House L). Nonetheless, all the dwellers confirmed that they had legal ownership of their houses. Furthermore, regarding job status, eight of 11 dwellers were street vendors and scavengers. The remainder were shop market workers. Regarding the subjective evaluation of indoor dampness and air quality, one dweller alone was satisfied with the current air quality condition. The majority of them reported that the indoor air condition was poor owing to the unpleasant odour from the sewage and dampness. This low satisfaction with indoor air conditions was aligned with their opinions on the effectiveness of air ventilation. Nine of 11 dwellers explained that their houses lacked air circulation. Interestingly, when asked about their sanitation status, specifically “How do you rate about the level of cleanliness in your house?”, eight of 11 dwellers claimed that their houses were clean enough, and only three reported that the houses were not clean enough to nurture the health status of the occupants.
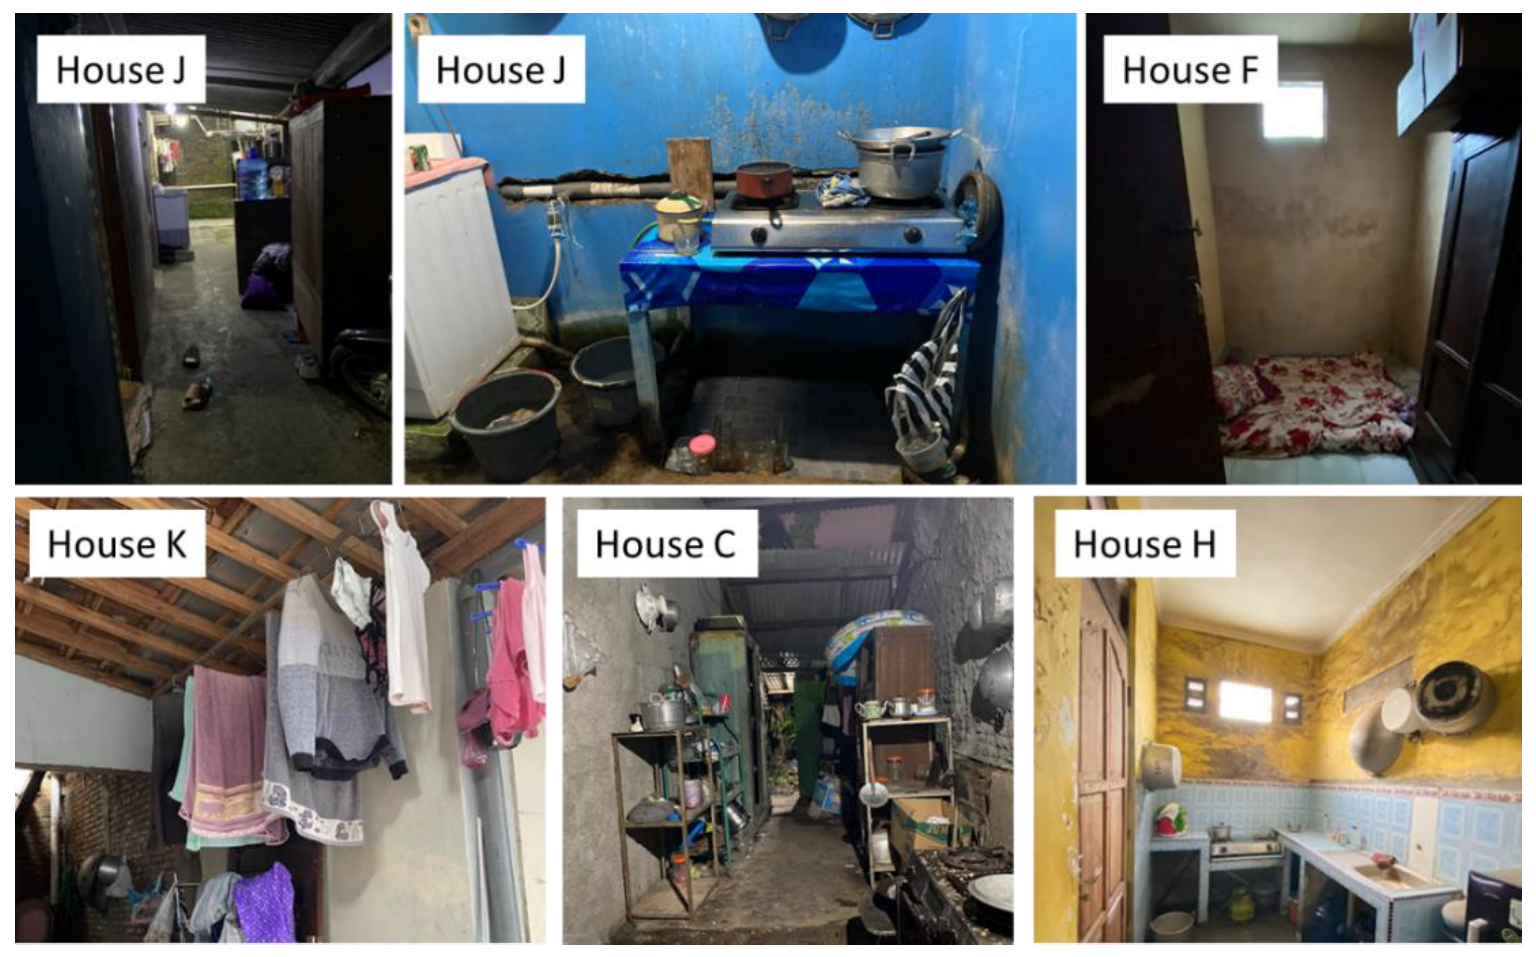
In addition, we asked questions related to the occupants’ indoor activities, and identified cooking, bathing, and laundry inside rooms with limited openings for ventilation with outdoor air and a lack of mechanical ventilation facilities and airtight doors separating the water space from the living room as the major sources of dampness. Particularly in Houses J and K, many wet clothes were hung to dry inside the house and under the eaves of the houses’ perimeters when we conducted the interviews. Furthermore, many water-filled buckets were placed on the kitchen floors for washing and cooking. Moreover, in the majority of the houses, mattresses for sleeping were placed directly on the floor and neither regularly cleaned nor sun-dried (see Figure 11). This could result in significant amounts of moisture being retained in the mattress and released into the air, leading to an increase in room-air humidity. In addition, six of 11 dwellings regularly experienced rainwater leakage owing to low construction quality.
Regarding building geometry features, the major rooms in 6 of 11 dwellings featured single-sided ventilation, in which only one wall contained access to the outdoors. This was because these houses were located in close proximity to adjacent houses and, as a result, had only one or two external walls with doors or openings, or because multiple families occupied one building and each family’s space was totally separated by an internal wall. Such situations of single-sided ventilation hinder the circulation of fresh air through indoor spaces, resulting in stagnant air and increased mould risk. Moreover, as shown in Table 1, this was exacerbated by the fact that the WWRs in all the dwellings were <5%, which was below the minimum standard of 10% suggested by the local government for healthy housing [23]. This finding is consistent with the reports from the Indonesian Ministry of Public Works and Housing, which indicated that approximately 40% of households residing in the slum areas of Surakarta City lack adequate ventilation [24].
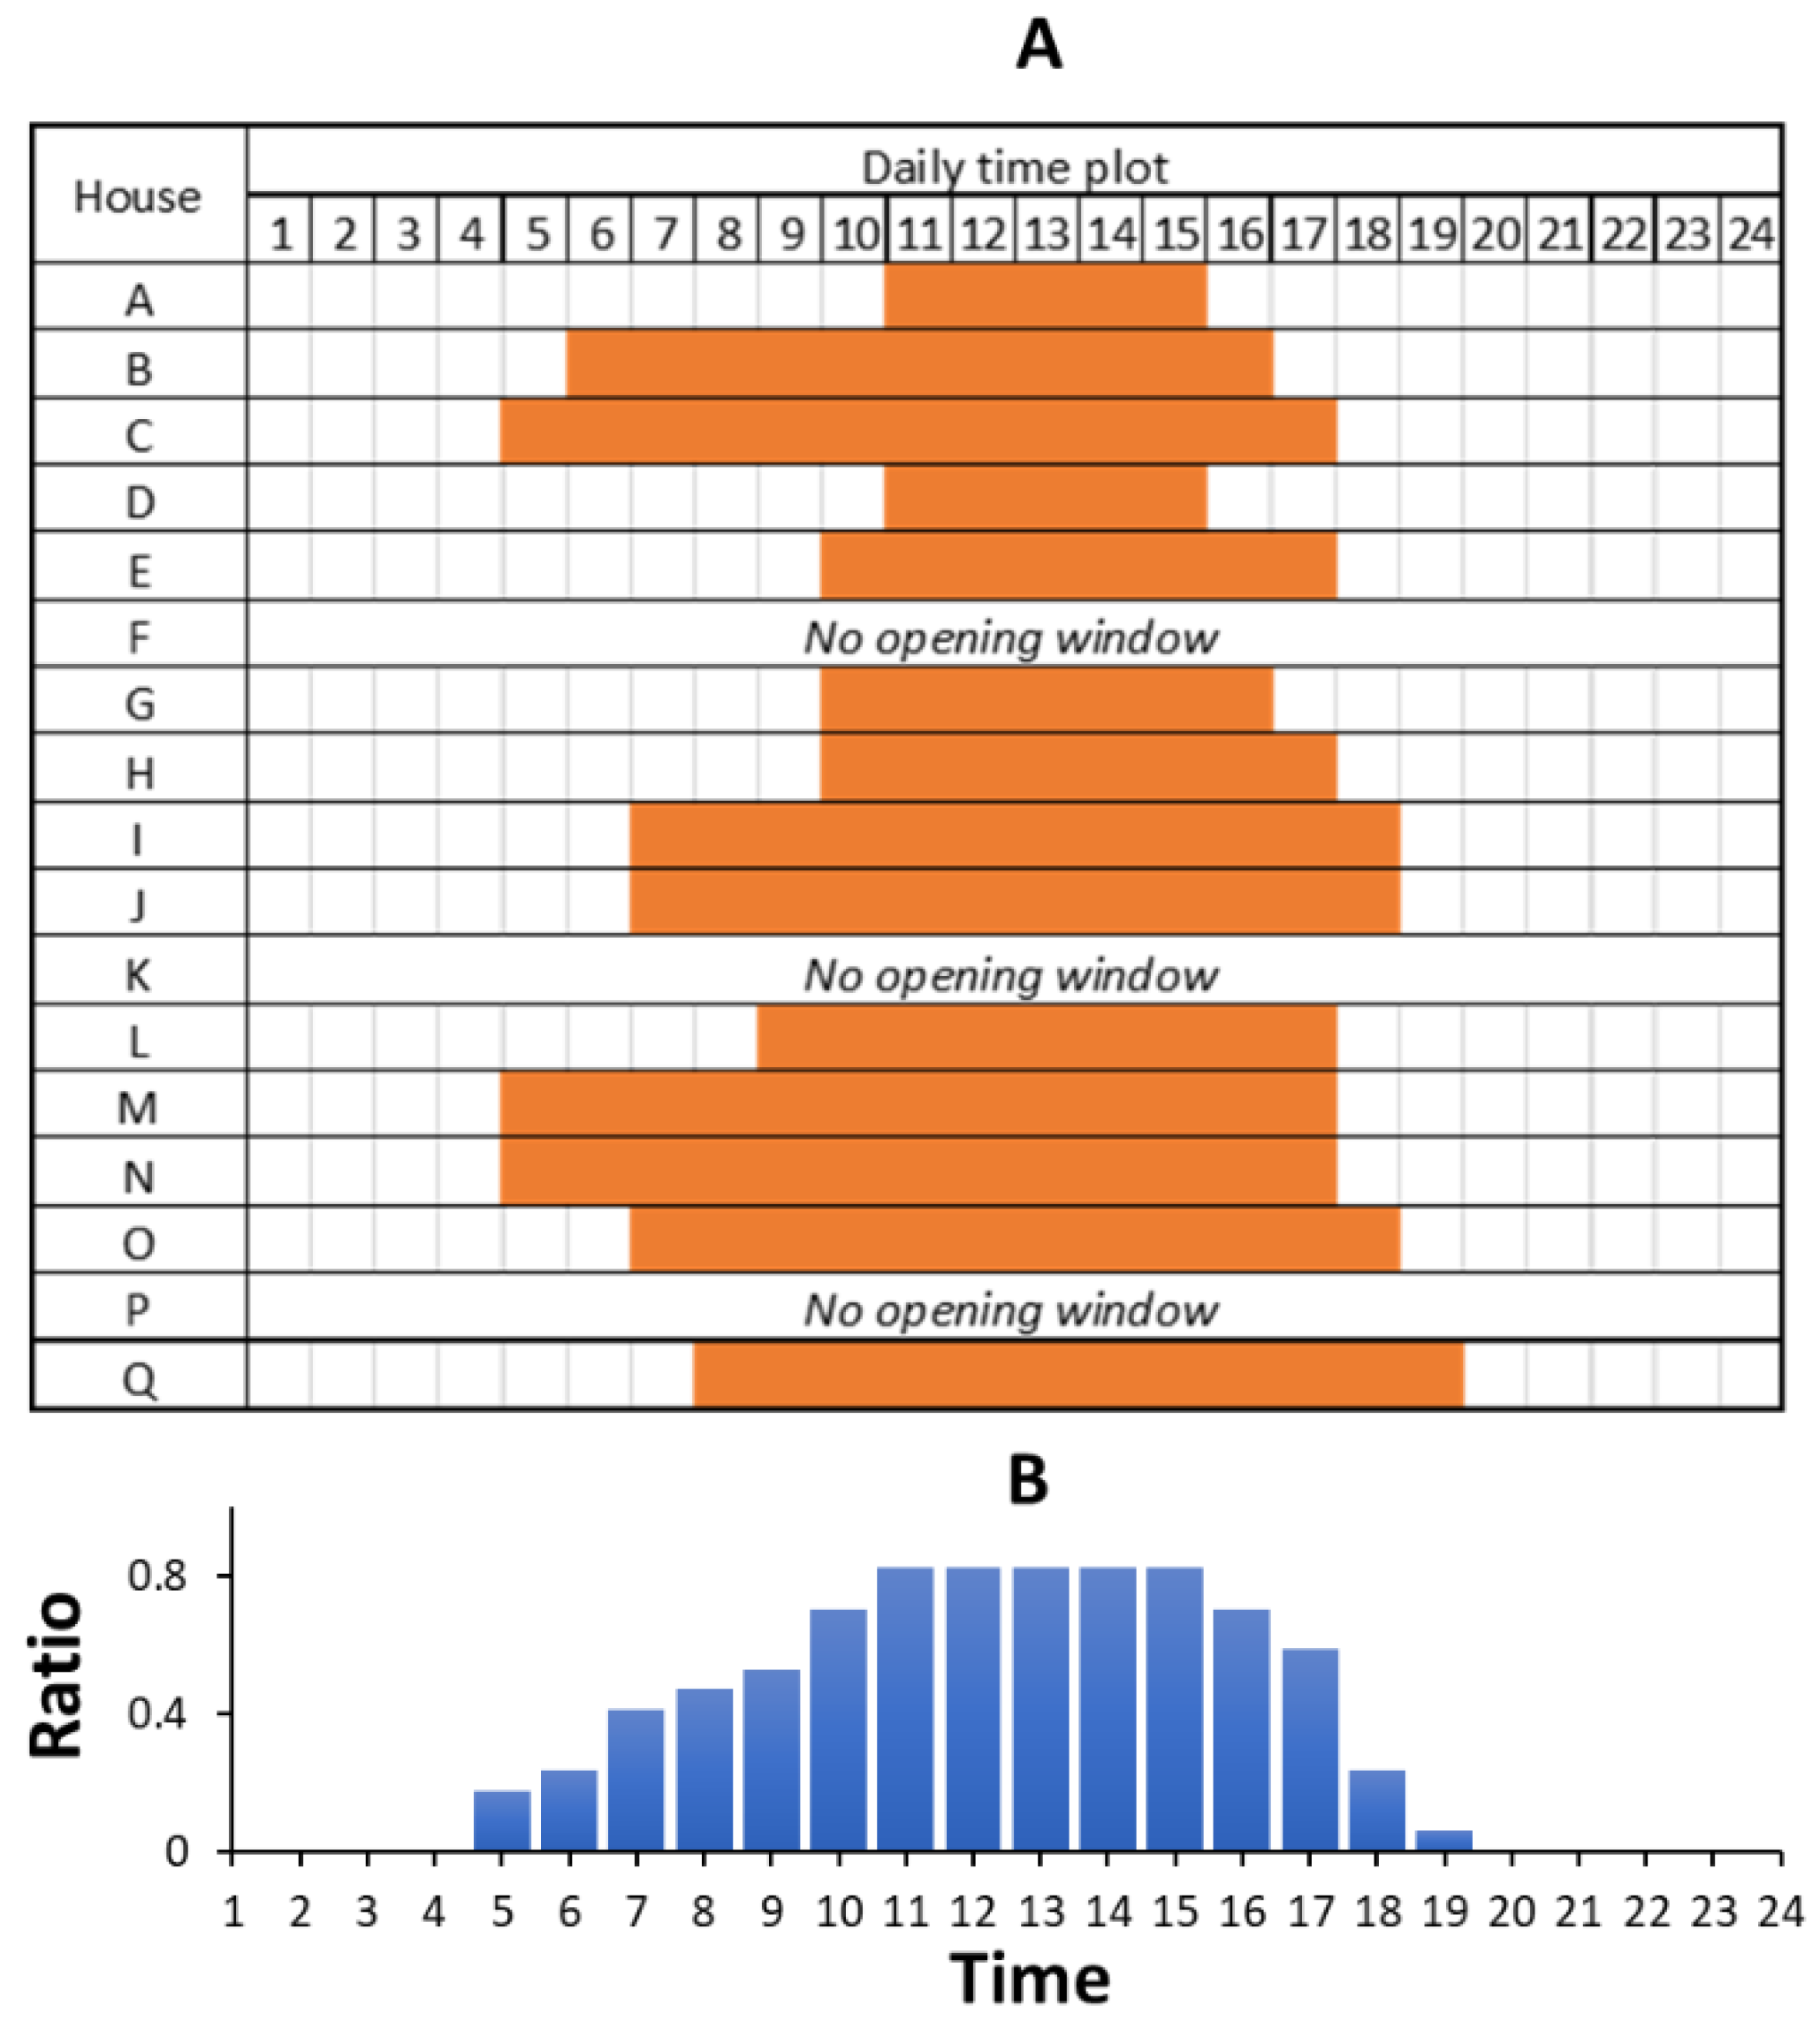
The daily schedules of occupant behavior related to the opening of windows in all observed dwellings are depicted in Figure 12. The daily variation of the ratio of dwellings that opened windows is also included. In general, the dwellers usually opened their windows during the daytime for 5 to 13 h per day starting from 5:00 to 19:00. Most of the dwellings had the windows open between 11:00 and 15:00, and three dwellings, namely Houses F, K, and P, kept the windows closed due to safety issues. As depicted in Figure 4b, indoor relative humidity was generally high during the night-time, whereas Figure 12 demonstrates that all dwellings closed their windows at this time. Such a circumstance resulted in stagnant room air, which promotes mould growth and wall condensation.
4. Conclusions
This study examined indoor dampness conditions in urban slum dwellings located in a tropical monsoon climate for 41 days based on field measurements of indoor air and relative humidity at 17 dwellings in Surakarta City, Central Java Province, Indonesia. In addition, potential mould growth was assessed using the VTT model. Furthermore, the results of in-depth interviews about residents’ perceptions and lifestyles related to mould risk conducted with residents of 11 of the 17 dwellings were also reported. The main findings of this study are as follows:
- The indoor AH of most dwellings had daily variations similar to that of outdoor air, with relatively constant values at night, whereas it increased and peaked in the morning after sunrise, then decreased and peaked negatively in the afternoon. Nevertheless, the relationship between indoor and outdoor AHs differed among the 17 dwellings, suggesting diverse conditions for vapour emission sources and ventilation efficiency.
- The duration of favourable indoor humidity conditions for mould growth (RH > 80%) ranged from 2.2 to 12.3 h with a mean daily duration of 8.5 h.
- The four dwellings with plywood board walls exhibited high mould risk with a daily mould index of up to 0.4. Spearman’s rank test results indicated that the heat capacity of the building envelope per room volume showed a significant positive correlation (p < 0.05) with mould growth at the higher percentiles (75th and 97.5th).
- The major rooms of six dwellings featured single-sided ventilation, with only one wall containing access to outdoor air. In addition, the WWRs from all the dwellings were <5%. These facts implied stagnant indoor air and increased mould growth risk. In fact, residents of nine of the 11 interviewed dwellings explained that their houses lacked proper air circulation.
- The majority of the occupants of the surveyed dwellings did not have knowledge or adequate measures to reduce indoor vapour release, such as mechanical ventilation facilities, airtight doors separating the water space from living rooms, and the practice of drying.
Considering the year-round hot and humid climate and harsh economic conditions of slum residents, it is extremely challenging to improve high-humidity indoor environments and prevent mould growth. Nevertheless, the above findings suggest several prospective and feasible countermeasures for people currently living in urban slums. For example, daily routines such as not having sources of water vapour in living rooms and bedrooms, tidying and arranging furniture and items to prevent air stagnation in rooms, proper drying of mattresses and other items that are large water vapour absorbers, and frequent cleaning of areas made of mould-prone materials are considered to have certain benefits. These findings can be used to establish design strategies for upgrading substandard slum dwellings. In particular, the necessity of cross-ventilation and proper separation between water spaces and other spaces is noteworthy.
Collaborative and large-scale research efforts are necessary to enhance the efficacy of lifestyle interventions, create institutional frameworks for disseminating knowledge among slum dwellers, and establish building design guidelines for urban slum improvement initiatives. This should involve experts from various fields, including the built environment, public health, and urban planning. Although such an endeavour represents a formidable challenge, it remains a vital objective for future studies and implementation.
Author Contributions
Conceptualisation, S.M. and A.H.; methodology, S.M.; validation, S.M.; formal analysis, S.M. and Y.M.; investigation, S.M. and K.N.H.; data curation, S.M., K.N.H. and Y.M.; writing—original draft preparation, S.M.; writing—review and editing, A.H.; visualisation, S.M. and Y.M.; supervision, A.H.; funding acquisition, A.H. All authors have read and agreed to the published version of the manuscript.
Funding
This research was funded by MEXT KAKENHI grant number JP22H01652, Sumitomo Foundation 2021, Grant for Environmental Research Projects.
Data Availability Statement
No new data were created or analysed in this study. Data sharing is not applicable to this article.
Acknowledgments
The authors are grateful for the support and assistance with the field survey and measurements to the students and staff of the Urban-Rural Design and Conservation Laboratory, Department of Architecture, Universitas Sebelas Maret, Surakarta, Indonesia.
Conflicts of Interest
The authors declare no conflict of interest.
Appendix A
Scatter plot of outdoor (X-axis) versus indoor (Y-axis) absolute humidity and its coefficient of determination (R2) of the observed dwellings.
Figure A1.
Scatter plot of outdoor and indoor AH of dwellings with materials with medium resistance to mould growth, ordered by heat capacity per house volume (Q-value).
Figure A1.
Scatter plot of outdoor and indoor AH of dwellings with materials with medium resistance to mould growth, ordered by heat capacity per house volume (Q-value).

Figure A2.
Scatter plot of outdoor and indoor AH of dwellings with sensitive materials, ordered by heat capacity per house volume (Q-value).
Figure A2.
Scatter plot of outdoor and indoor AH of dwellings with sensitive materials, ordered by heat capacity per house volume (Q-value).

References
- Roberts, M.; Gil Sander, F.; Tiwari, S. Time to ACT: Realizing Indonesia’s Urban Potential; World Bank Publications: Washington, DC, USA, 2019. [Google Scholar]
- Mardiansjah, F.H.; Rahayu, P.; Rukmana, D. Urban population growth and the growth of towns and cities in Indonesia. In Proceedings of the 55th ISOCARP World Plan Congress, Jakarta-Bogor, Indonesia, 9–13 September 2019; Volume 2019, pp. 624–643. [Google Scholar]
- WRI Indonesia. Seizing Indonesia’s Urban Opportunity Compact, Connected, Clean and Resilient Cities as Drivers of Sustainable Development; WRI Indonesia: Jakarta, Indonesia, 2019; pp. 1–22. [Google Scholar]
- World Bank Group. Indonesia poverty & equity. In Brief; World Bank Group: Washington, DC, USA, 2021. [Google Scholar]
- Anindito, D.B.; Indriansyah, N.R.; Maula, F.K.; Akbar, R. A quantitative perspective on kampung kota: Elaborating definition and variables of Indonesian informal settlements: Case study: Kelurahan Tamansari, Bandung City. Int. Rev. Spat. Plan. Sustain. Dev. 2019, 7, 53–74. [Google Scholar] [CrossRef] [PubMed]
- Vardoulakis, S.; Heaviside, C. Health Effects of Climate Change in the UK 2012: Current Evidence, Recommendations and Research Gaps; Health Protection Agency: London, UK, 2012; pp. 1–242. [Google Scholar]
- Lai, H.K.; Kendall, M.; Ferrier, H.; Lindup, I.; Alm, S.; Hänninen, O.; Jantunen, M.; Mathys, P.; Colvile, R.; Ashmore, M.R.; et al. Personal exposures and microenvironment concentrations of PM2.5, VOC, NO2 and CO in Oxford, UK. Atmos. Environ. 2004, 38, 6399–6410. [Google Scholar] [CrossRef]
- Krieger, J.; Higgins, D.L. Housing and health: Time again for public health action. Am. J. Public Health 2002, 92, 758–768. [Google Scholar] [CrossRef] [PubMed]
- Vardoulakis, S.; Dimitroulopoulou, C.; Thornes, J.; Lai, K.M.; Taylor, J.; Myers, I.; Heaviside, C.; Mavrogianni, A.; Shrubsole, C.; Chalabi, Z.; et al. Impact of climate change on the domestic indoor environment and associated health risks in the UK. Environ. Int. 2015, 85, 299–313. [Google Scholar] [CrossRef] [PubMed]
- Haddad, S.; Paolini, R.; Synnefa, A.; De Torres, L.; Prasad, D.; Santamouris, M. Integrated assessment of the extreme climatic conditions, thermal performance, vulnerability, and well-being in low-income housing in the subtropical climate of Australia. Energy Build. 2022, 272, 112349. [Google Scholar] [CrossRef]
- Suzuki, N.; Nakayama, Y.; Nakaoka, H.; Takaguchi, K.; Tsumura, K.; Hanazato, M.; Hayashi, T.; Mori, C. Risk factors for the onset of sick building syndrome: A cross-sectional survey of housing and health in Japan. Build. Environ. 2021, 202, 107976. [Google Scholar] [CrossRef]
- Fan, L.; Ding, Y. Research on risk scorecard of sick building syndrome based on machine learning. Build. Environ. 2022, 211, 108710. [Google Scholar] [CrossRef]
- Murtyas, S.; Toosty, N.T.; Hagishima, A.; Kusumaningdyah, N.H. Relation between occupants’ health problems, demographic and indoor environment subjective evaluations: A cross-sectional questionnaire survey study in Java Island, Indonesia. PLoS ONE 2021, 16, e0254460. [Google Scholar] [CrossRef]
- WHO. Air Pollution. In Compendium of WHO and Other UN Guidance on Health and Environment, 2022 Update; (WHO/HEP; ECH/EHD/22; 01). WHO Fact Sheet 2022; World Health Organization: Geneva, Switzerland, 2019; p. 5. Available online: https://www.who.int/en/news-room/fact-sheets/detail/arsenic (accessed on 14 January 2023).
- Sharfstein, J.; Sandel, M.; How, A.S. Housing Crisis Threatens the Health of Its Children; 1998; Volume 48. [Google Scholar]
- SMERU. Addressing Urban Poverty Increasing Learning on Urban Poverty Reduction in Kota Surakarta and Kota Makassar, Indonesia Increasing Learning on Urban Poverty Reduction; SMERU: Jakarta, Indonesia, 2011. [Google Scholar]
- Latif, M. Penataan Kawasan Permukiman Kumuh di Kelurahan Semanggi Dengan Konsep Urban Sustainable Settlement. Bachelor’s Thesis, Universidad Muhammadiyah Surakarta, Jawa Tengah, Indonesia, 2020. [Google Scholar]
- Kusumaningdyah, N.H.; Amalia, J.D.; Titis, S.P. The productive space of Kampung Kota settlement: A case study Semanggi District, Surakarta-Indonesia. Proc. Int. Exch. Innov. Conf. Eng. Sci. (IEICES) 2018, 4, 2018–2028. [Google Scholar] [CrossRef]
- Juliman, D.; The World’s First Slum Upgrading Programme. World Urban Forum III Sustain Cities-Turning Ideas into Action 2006. Available online: https://unhabitat.org/world-urban-forum-3-report (accessed on 20 January 2023).
- Santosa, H.; Astuti, W. Comprehensive kampung improvement programme to support better settlement and poverty reduction. In CIB Work Comm W110 Informal Settlements Afford Hous; CIB Report Publication: Surabaya, Indonesia, 2009; Volume 2, pp. 32–42. [Google Scholar]
- Djajadiningrat, H.M. Sustainable Urban Development in the Kampung Improvement Programme: A Case Study of Jakarta, Indonesia. 1994. Available online: https://etheses.whiterose.ac.uk/14841/1/390208.pdf (accessed on 26 January 2023).
- Davis, Z.; Guhn, M.; Jarvis, I.; Jerrett, M.; Nesbitt, L.; Oberlander, T.; Sbihi, H.; Su, J.; van den Bosch, M. The association between natural environments and childhood mental health and development: A systematic review and assessment of different exposure measurements. Int. J. Hyg. Environ. Health 2021, 235, 113767. [Google Scholar] [CrossRef]
- Sunarti, S.; Syahbana, J.A.; Manaf, A. Slum upgrading without displacement at Danukusuman Sub-District Surakarta City. Int. Trans. J. Eng. Manag. Appl. Sci. Technol. 2014, 5, 213–225. [Google Scholar]
- World Bank Group. Kotaku: Delivering Healthy, Safe and Vibrant Neighborhoods in Indonesia. 2022, pp. 2016–2022. Available online: https://www.thegpsc.org/sites/gpsc/files/indonesia.pdf (accessed on 27 January 2023).
- Rukmana, D. Upgrading housing settlement for the urban poor in Indonesia. In Metropolitan Governance in Asia and the Pacific Rim; Grant, B., Liu, C.Y., Ye, L., Eds.; Springer: Singapore, 2018; pp. 75–94. [Google Scholar] [CrossRef]
- Bank, W. Evaluation Report: Enhancing the Quality of Life in Urban Indonesia: The Legacy of Kampung Improvement Program. Impact Publications: Jakarta, Indonesia, 1995. Available online: http://www-wds.worldbank.org/external/default/WDSContentServer/WDSP/IB/1999/07/28/000009265_3961029220705/Rendered/PDF/multi_page.pdf (accessed on 29 January 2023).
- Taylor, J. A tale of two cities: Comparing alternative approaches to reducing the vulnerability of riverbank communities in two Indonesian cities. Environmentalist 2015, 27, 621–636. [Google Scholar] [CrossRef]
- Gasem, M.H.; Dolmans, W.M.V.; Keuter, M.; Djokomoeljanto, R.R. Poor food hygiene and housing as risk factors for typhoid fever in Semarang, Indonesia. Trop. Med. Int. Health 2001, 6, 484–490. [Google Scholar] [CrossRef]
- Komarulzaman, A.; Smiths, J.; Jong, E.D. Clean water, sanitation and diarrhoea in Indonesia: Effects of household and community factors. Glob. Public Health 2017, 12, 1141–1155. [Google Scholar] [CrossRef]
- Widawati, M.; Astuti, E.P.; Prasetyowati, H.; Hendri, J.; Nurindra, R.W.; Hodijah, D.N. Risk factors associated with dengue incidence in Bandung, Indonesia: A household based case-control study. Health Sci. J. Indones. 2020, 11, 45–51. [Google Scholar] [CrossRef]
- Al-Khatib, I.A.; Ju’ba, A.; Kamal, N.; Hamed, N.; Hmeidan, N.; Massad, S. Impact of housing conditions on the health of the people at al-Ama’ri refugee camp in the West Bank of Palestine. Int. J. Environ. Health Res. 2003, 13, 315–326. [Google Scholar] [CrossRef]
- Pratali, L.; Marinoni, A.; Cogo, A.; Ujka, K.; Gilardoni, S.; Bernardi, E.; Bonasoni, P.; Bruno, R.M.; Bastiani, L.; Vuillermoz, E.; et al. Indoor air pollution exposure effects on lung and cardiovascular health in the High Himalayas, Nepal: An observational study. Eur. J. Intern. Med. 2019, 61, 81–87. [Google Scholar] [CrossRef]
- Murtyas, S.; Hagishima, A.; Kusumaningdyah, N.H. On-site measurement and evaluations of indoor thermal environment in low-cost dwellings of urban Kampung district. Build. Environ. 2020, 184, 107239. [Google Scholar] [CrossRef]
- Asian Development Bank. Building Resilience of The Urban Poor in Indonesia. 2022, pp. 1–13. Available online: https://www.adb.org/sites/default/files/publication/763146/building-resilience-urban-poor-indonesia.pdf (accessed on 29 January 2023).
- Adinugraha, K.B.; Kubota, T.; Sumi, J.; Surahman, U.; de Almeida Parisi, C. Dampness, mold, and health conditions of residents in kampongs: A case study of Bandung, Indonesia. In EduARCHsia & Senvar 2019 International Conference; Atlantis Press: Yogyakarta, Indonesia, 2020; Volume 192, pp. 19–29. [Google Scholar] [CrossRef]
- Sani, H.; Kubota, T.; Sumi, J.; Surahman, U. Impacts of air pollution and dampness on occupant respiratory health in unplanned houses: A case study of Bandung, Indonesia. Atmosphere 2022, 13, 1272. [Google Scholar] [CrossRef]
- Li, Y.; Dang, X.; Xia, C.; Ma, Y.; Ogura, D.; Hokoi, S. The effect of air leakage through the air cavities of building walls on mold growth risks. Energies 2020, 13, 1177. [Google Scholar] [CrossRef]
- Brambilla, A.; Gasparri, E. Mould growth models and risk assessment for emerging timber envelopes in Australia: A comparative study. Buildings 2021, 11, 261. [Google Scholar] [CrossRef]
- Abe, K. Assessment of home environments with a fungal index using hydrophilic and xerophilic fungi as biologic sensors. Indoor. Air. 2012, 22, 173–185. [Google Scholar] [CrossRef] [PubMed]
- Adi, R.F.; Sugiarto, Y.; Arifah, A.; Arini, E.Y.; Atmaja, T. Climate regionalization for main production areas of Indonesia; Case study of West Java. IOP Conf. Ser. Earth Environ. Sci. 2017, 54, 1–8. [Google Scholar] [CrossRef]
- Hamed, M.M.; Nashwan, M.S.; Shaid, S.; Wang, X.J.; Ismail, T.B.; Dewan, A.; Asaduzzaman, M. Future Koppen-Geiger climate zones over Southeast Asia using CMIP6 Multimodel Ensemble. Atmos. Res. 2023, 283, 106560. [Google Scholar] [CrossRef]
- Crook, B.; Burton, N.C. Indoor moulds, Sick Building Syndrome and building related illness. Fungal Biol. Rev. 2010, 24, 106–113. [Google Scholar] [CrossRef]
- Menneer, T.; Mueller, M.; Sharpe, R.A.; Townley, S. Modelling mould growth in domestic environments using relative humidity and temperature. Build. Environ. 2022, 208, 108583. [Google Scholar] [CrossRef]
- Johansson, S.; Wadsö, L.; Sandin, K. Estimation of mould growth levels on rendered façades based on surface relative humidity and surface temperature measurements. Build. Environ. 2010, 45, 1153–1160. [Google Scholar] [CrossRef]
- Du, C.; Li, B.; Yu, W. Indoor mould exposure: Characteristics, influences and corresponding associations with built environment—A review. J. Build. Eng. 2021, 35, 101983. [Google Scholar] [CrossRef]
- Mendell, M.J. Indoor residential chemical emissions as risk factors for respiratory and allergic effects in children: A review. Indoor. Air. 2007, 17, 259–277. [Google Scholar] [CrossRef]
- BPS. Surakarta Figure; BPS: Surakarta, Indonesia, 2019; pp. 2012–2018. [Google Scholar]
- Berger, J.; Le Meur, H.; Dutykh, D.; Nguyen, D.M.; Grillet, A. Analysis and improvement of the VTT mold growth model: Application to bamboo fiberboard. Build. Environ. 2018, 138, 262–274. [Google Scholar] [CrossRef]
- Hukka, A.; Viitanen, H.A. A mathematical model of mould growth on wooden material. Wood Sci. Technol. 1999, 33, 475–485. [Google Scholar] [CrossRef]
- Viitanen, H.; Krus, M.; Ojanen, T.; Eitner, V.; Zirkelbach, D. Mold risk classification based on comparative evaluation of two established growth models. Energy Procedia 2015, 78, 1425–1430. [Google Scholar] [CrossRef]
- Kuswara; Winayanti, L.; Argo, T.A.; Indrasari, F.; Rachman, A.P.; Widiyanti, S.D.; Firdaus, A.S.; Senjaya, S.M.; Firdaus, A. Voluntary National Review for Implementation of New Urban Agenda: Final Report; Ministry of Public Works and Housing: Jakarta, Indonesia, 2021.
- Starakiewicz, A.; Miąsik, P.; Krasoń, J.; Lichołai, L. Methods for determining mold development and condensation on the surface of building barriers. Buildings 2020, 10, 4. [Google Scholar] [CrossRef]
- Udawattha, C.; Galkanda, H.; Ariyarathne, I.S.; Jayasinghe, G.Y.; Halwatura, R. Mold growth and moss growth on tropical walls. Build. Environ. 2018, 137, 268–279. [Google Scholar] [CrossRef]
- Murtyas, S.; Hagishima, A.; Kusumaningdyah, N.H. Observed diverse indoor thermal environments of low-cost dwellings located in a Kampung district. Evergreen 2021, 8, 229–238. [Google Scholar] [CrossRef]
- Woloszyn, M.; Kalamees, T.; Olivier Abadie, M.O.; Steeman, M.; Sasic Kalagasidis, A. The effect of combining a relative-humidity-sensitive ventilation system with the moisture-buffering capacity of materials on indoor climate and energy efficiency of buildings. Build. Environ. 2009, 44, 515–524. [Google Scholar] [CrossRef]
- Sahlberg, B.; Gunnbjörnsdottir, M.; Soon, A.; Jogi, R.; Gislason, T.; Wieslander, G.; Janson, C.; Norback, D. Airborne molds and bacteria, microbial volatile organic compounds (MVOC), plasticizers and formaldehyde in dwellings in three north European cities in relation to sick building syndrome (SBS). Sci. Total Environ. 2013, 444, 433–440. [Google Scholar] [CrossRef]
- Wahab, A.N.S.; Khamidi, M.F.; Ismail, M.R. An Investigation of mould growth in tropical climate buildings. In Proceedings of the 2013 IEEE Business Engineering and Industrial Applications Colloquium (BEIAC), Langkawi, Malaysia, 7–9 April 2013; Volume 2013, pp. 316–321. [Google Scholar] [CrossRef]
Figure 1.
Map of Surakarta City (Google Maps) and aerial photograph of slum district of Pasar Kliwon acquired by the authors.
Figure 1.
Map of Surakarta City (Google Maps) and aerial photograph of slum district of Pasar Kliwon acquired by the authors.

Figure 2.
The appearances of Houses C, G, I, and K.

Figure 3.
Daily outdoor temperature (A) and relative humidity (B) during the measurement period.

Figure 4.
Averaged daily patterns of (A) indoor temperature and (B) relative humidity.

Figure 5.
Averaged daily patterns of absolute humidity (AH) from each dwelling and the outdoor measurement.
Figure 5.
Averaged daily patterns of absolute humidity (AH) from each dwelling and the outdoor measurement.

Figure 6.
(a) Probability density distribution of AH difference between indoors and outdoors and (b) coefficient of determination (R2) between indoor and outdoor AH ordered from the highest to the lowest value.
Figure 6.
(a) Probability density distribution of AH difference between indoors and outdoors and (b) coefficient of determination (R2) between indoor and outdoor AH ordered from the highest to the lowest value.

Figure 7.
Boxplot of indoor RH and bar plot of daily mean duration of RH >80% of observed dwellings ordered from the longest to the shortest daily mean duration of RH >80%.
Figure 7.
Boxplot of indoor RH and bar plot of daily mean duration of RH >80% of observed dwellings ordered from the longest to the shortest daily mean duration of RH >80%.

Figure 8.
Scatter plots between duration of RH of more than 80% and building-related variables, (A) heat capacity per volume (Q), and (B) window-to-wall ratio (WWR).
Figure 8.
Scatter plots between duration of RH of more than 80% and building-related variables, (A) heat capacity per volume (Q), and (B) window-to-wall ratio (WWR).

Figure 9.
Daily variation in the predicted mould index and the observed mould spread in the houses that had materials sensitive to mould growth (House C, G, I, and K).
Figure 9.
Daily variation in the predicted mould index and the observed mould spread in the houses that had materials sensitive to mould growth (House C, G, I, and K).

Figure 10.
Time series of mould growth and accumulative mould index with 1 h intervals during the measurement period of 26 March to 5 May 2019, specifically in dwellings with materials sensitive to mould growth.
Figure 10.
Time series of mould growth and accumulative mould index with 1 h intervals during the measurement period of 26 March to 5 May 2019, specifically in dwellings with materials sensitive to mould growth.

Figure 11.
Indoor environment conditions of Houses C, F, H, J, and K that were potentially related to indoor dampness.
Figure 11.
Indoor environment conditions of Houses C, F, H, J, and K that were potentially related to indoor dampness.

Figure 12.
(A) Daily windows’ opening schedule of each house and (B) daily variation ratio of dwellings that opened windows.
Figure 12.
(A) Daily windows’ opening schedule of each house and (B) daily variation ratio of dwellings that opened windows.


Table 1.
Thermophysical characteristics of modelled houses.
| House | Floor Area [m2] | Room Volume [m3] | Window-to-Wall Ratio (WWR) | Building-Opening-Area-to-Wall Ratio | Wall Materials | Heat Capacity per Volume Q [kJ/m3K] |
|---|---|---|---|---|---|---|
| A | 41.7 | 146.0 | 0.037 | 0.074 | Cement plaster and bricks | 136.4 |
| B | 63.3 | 221.6 | 0.040 | 0.076 | Cement plaster and bricks | 144.5 |
| C | 31.3 | 109.6 | 0.015 | 0.044 | Cement plaster, bricks, and plywood | 117.6 |
| D | 67.9 | 237.7 | 0.009 | 0.049 | Cement plaster and bricks | 126.7 |
| E | 25.8 | 90.3 | 0.033 | 0.074 | Bricks | 118.6 |
| F | 91.5 | 320.3 | 0.020 | 0.078 | Cement plaster and bricks | 120.1 |
| G | 79.1 | 276.9 | 0.014 | 0.076 | Bricks and plywood boards | 112.2 |
| H | 48.5 | 169.8 | 0.034 | 0.078 | Cement plaster and bricks | 136.7 |
| I | 105.6 | 369.6 | 0.019 | 0.068 | Plywood boards | 115.0 |
| J | 52.7 | 184.5 | 0.016 | 0.063 | Cement plaster and bricks | 141.0 |
| K | 44 | 154.0 | 0.018 | 0.045 | Bricks and plywood boards | 123.3 |
| L | 51 | 178.5 | 0.025 | 0.051 | Cement plaster and bricks | 138.4 |
| M | 98 | 343.0 | 0.014 | 0.057 | Cement plaster and bricks | 119.8 |
| N | 50.1 | 175.4 | 0.028 | 0.088 | Cement plaster and bricks | 127.9 |
| O | 25.5 | 89.3 | 0.013 | 0.054 | Cement plaster and bricks | 119.8 |
| P | 53.3 | 186.6 | 0.027 | 0.070 | Cement plaster and bricks | 129.4 |
| Q | 26.9 | 94.2 | 0.028 | 0.060 | Cement plaster, bricks, and porcelain tiles | 125.0 |
Table 2.
Mould index descriptions.
| Index | Description of the Mould Growth Rate |
|---|---|
| 0 | No growth |
| 1 | The initial stages of growth, small amounts on surface (microscopic) |
| 2 | Several local mould growth colonies on surface (microscopic) |
| 3 | Less than 10% visual findings/coverage of mould on surface |
| 4 | Moderate growth, 10 to 50% visual findings/coverage of mould on surface |
| 5 | Plenty of growth, more than 50% visual findings/coverage of mould on surface |
| 6 | Heavy and tight growth, 100% visual findings/coverage of mould on surface |
| Materials | Sensitivity Levels | , M < 1 | , M > 1 | B | C | ||
|---|---|---|---|---|---|---|---|
| Pine sapwood, surface with nutrients | Very sensitive | 1 | 1 | 1 | 7 | 2 | 80 |
| Wooden boards, wood-based products | Sensitive | 0.578 | 0.386 | 0.3 | 6 | 1 | 80 |
| Concrete, glass wool, polyester wool | Medium resistant | 0.072 | 0.097 | 0 | 5 | 1.5 | 85 |
| Glass, metal, polyurethane polished surface | Resistant | 0.033 | 0.014 | 0 | 3 | 1 | 85 |
Table 4.
Spearman’s rank test correlation between daily mould growth and building characteristics in the context of dwellings with sensitive materials.
Table 4.
Spearman’s rank test correlation between daily mould growth and building characteristics in the context of dwellings with sensitive materials.
| Building Characteristics | Correlation Coefficient between MI Percentile and Building Characteristics | ||||
|---|---|---|---|---|---|
| 2.5th | 25th | 50th | 75th | 97.5th | |
| WWR | 0.056 | −0.022 | −0.049 | −0.145 | −0.103 |
| Daily window opening duration [hour] | 0.186 | 0.065 | −0.078 | −0.174 | −0.253 |
| Heat capacity per house volume [kJ/m3K] | −0.260 | 0.441 | 0.478 | 0.517 * | 0.630 * |
* p-value < 0.05.
Disclaimer/Publisher’s Note: The statements, opinions and data contained in all publications are solely those of the individual author(s) and contributor(s) and not of MDPI and/or the editor(s). MDPI and/or the editor(s) disclaim responsibility for any injury to people or property resulting from any ideas, methods, instructions or products referred to in the content. |
© 2023 by the authors. Licensee MDPI, Basel, Switzerland. This article is an open access article distributed under the terms and conditions of the Creative Commons Attribution (CC BY) license (https://creativecommons.org/licenses/by/4.0/).
Share and Cite
MDPI and ACS Style
Murtyas, S.; Minami, Y.; Handayani, K.N.; Hagishima, A. Assessment of Mould Risk in Low-Cost Residential Buildings in Urban Slum Districts of Surakarta City, Indonesia. Buildings 2023, 13, 1333. https://doi.org/10.3390/buildings13051333
AMA Style
Murtyas S, Minami Y, Handayani KN, Hagishima A. Assessment of Mould Risk in Low-Cost Residential Buildings in Urban Slum Districts of Surakarta City, Indonesia. Buildings. 2023; 13(5):1333. https://doi.org/10.3390/buildings13051333
Chicago/Turabian StyleMurtyas, Solli, Yuki Minami, Kusumaningdyah Nurul Handayani, and Aya Hagishima. 2023. "Assessment of Mould Risk in Low-Cost Residential Buildings in Urban Slum Districts of Surakarta City, Indonesia" Buildings 13, no. 5: 1333. https://doi.org/10.3390/buildings13051333
Note that from the first issue of 2016, this journal uses article numbers instead of page numbers. See further details here.