1. Introduction
In the last century, the rapid growth of urbanization and the consequential vehicular traffic have affected the states of conservation of several historical constructions. The city of Rome has numerous examples of important historical structures surrounded by urban traffic. It is therefore essential to monitor the states of conservation of these structures and carry out periodical assessments with the support of modern, accurate technologies [
1].
Since the early 2000s, Pau and Vestroni [
2,
3] have brought attention to the problem of important monuments, such as the Colosseum and the Basilica of Maxentius, in Rome that are undergoing traffic-induced vibration. In the Colosseum, it was found that a significant increment of the radial component of acceleration reached the higher levels of the monument due to dynamic amplification. The same effect was found in the Basilica of Maxentius, where the RMS of the vertical component at the highest level of the construction was much greater than the others. Thus is the challenge of monitoring different control points, especially at higher levels, which require major efforts to safely reach these locations as well as to isolate sensors from weather effects (sun exposure and humidity altering the recorded signal), besides the obvious limitation of connecting the sensors to the acquisition system, which is usually placed at the ground level to be properly powered and interrogated (excessively long cables would distort the signal).
There are several studies in the literature on applications of finite-element models to study dynamic analyses with use of experimental measurements; a large part of the scientific literature concerns slender structures, such as towers and minarets [
4,
5,
6,
7,
8]. There are also works regarding ancient Roman constructions, such as the Colosseum [
3,
9,
10], the Basilica of Maxentius [
2], the Baths of Diocletian [
11], the Trajan Arch [
12], the Circus Maximum [
13], the
Frontinus Gate [
14], the Verona Arena [
15], and the so-called Temple of Minerva Medica [
16,
17]; the main focus of these studies is dynamic identification, thus processing of site-recorded data to extract the modal features of these constructions.
Dynamic identification records the response accelerations of a structure in a limited number of measurement points, which are chosen based on the theoretical largest displacements, accessibility, and, of course, budget. Santini et al. [
18] employed a FEM to estimate the dynamic features of the Octagonal Hall at the Baths of Diocletian and optimally plan the dynamic monitoring system and the testing campaign. This preliminary simulation is also useful to comprehend structural behavior and evaluate the validity of the model’s assumptions.
In a work by Manso et al. [
19], bidimensional numerical models were calibrated using the monitoring records of three different sites to study the influence of high-speed vehicles in urban areas. The excitation sources of a passing train were modeled as quasistatic loads, which correspond to constant forces moving along the track with a constant train speed. The results showed that the effective velocities obtained using the numerical models for the actual situation were slightly lower than the values previewed for the high-speed train.
However, there are few works that have conducted three-dimensional numerical simulations to study the responses of historical constructions to traffic vibrations, and uncommonly the dynamic behavior of a model is calibrated with experimental data (both input excitations and modal properties). It is of a certain value to numerically estimate the dynamic response of a structure because it is burdensome to collect experimental data on the entire construction for extended periods, and it is complex to estimate the range of stresses that the structure undergoes during these events.
This paper investigates the effects of rail-traffic vibrations on an important Ancient Roman construction, the so-called Temple of Minerva Medica, which is one of the most significant examples of late Roman Imperial architecture. The location of the monument is extremely sensitive to the surrounding urban traffic, being that the monument is positioned between the rails of the local tramway along Via Giolitti and the rail tracks of the main Roman train station (Roma Termini). The monument is protected as Cultural Heritage by the Soprindendenza dei Beni Archeologici; this restraint allows the noncompliance of the construction to the national regulations and it imposes minor interventions to safeguard the authenticity of the site. Drastic seismic retrofitting measures, such as the base isolation system studied by Matsagar and Jangid [
20], are not considered suitable with the conservation approach that the administration has been following in past years. Moreover, the complex archeological stratification of the site imposes a clear technical limitation to such an invasive retrofitting intervention that would irreparably alter the integrity of the archeological remains. For this reason, the monument has been recurrently studied in different research projects (i.e., the CO.B.RA project and the SISMI project [
21]).
In previous experimental campaigns [
22], data on the masonry elements was collected through sonic testing, and the dynamic features of the temple were extracted with different instruments, recordings, and extraction methods. In addition, the rail-traffic vibrations were also monitored with two MEMS accelerometers positioned at the base of the temple. The simulation of the rail-traffic vibrations started with the elaboration of the heritage building information model (HBIM) of the site based on historical information on the evolution of the construction, the geometrical surveys of the temple and its foundations, and the soil stratification. The structural model was defined accordingly, and the results from the previous experimental campaigns were implemented. First, the sensitivity of the structural parameters of the model to its dynamic features was investigated. The soil stiffness expressed the most uncertain and influential parameters; thus, the values of the soil moduli of elasticity were tuned to reduce the average error between the numerical and experimental modal frequencies. The remaining model parameters were subsequently updated through a semiautomated method proposed by Douglas and Reid [
23], which contemporarily minimizes relative frequency error and maximizes the modal assurance criterion (MAC) [
24] between the numerical and experimental results. The nonlinear parameters of the materials were estimated from the compressive strength, which was derived by correlating the Young’s modulus with the compressive strength resulting from laboratory testing performed by Giavarini [
25] on cores drilled from Roman constructions of the same period, the correlation law was used to estimate the compressive strength from the calibrated Young’s modulus defined by the model updating. The FEM was employed to perform two different nonlinear dynamic analyses that simulated tram passage. In one analysis, dynamic action was modeled with a moving load acting on the rails and transmitted to the temples through the soil. In the other analysis, tram vibrations were simulated as three-dimensional time histories imposed at the base nodes of the structure equal to the signal recorded during the dynamic monitoring. The results returned a complete description of the dynamic response of the temple in terms of principal tensile stress, displacement, velocity, and acceleration. Control of the numerical solution was performed by comparing the responses of two nodes (at the base and top of the construction) with the experimental values recorded during the dynamic monitoring. The drawbacks and limitations of the two numerical analyses were identified, and it was verified that the response velocity fell in the limits defined by the national regulations [
26,
27].
2. The So-Called Temple of Minerva Medica in Rome
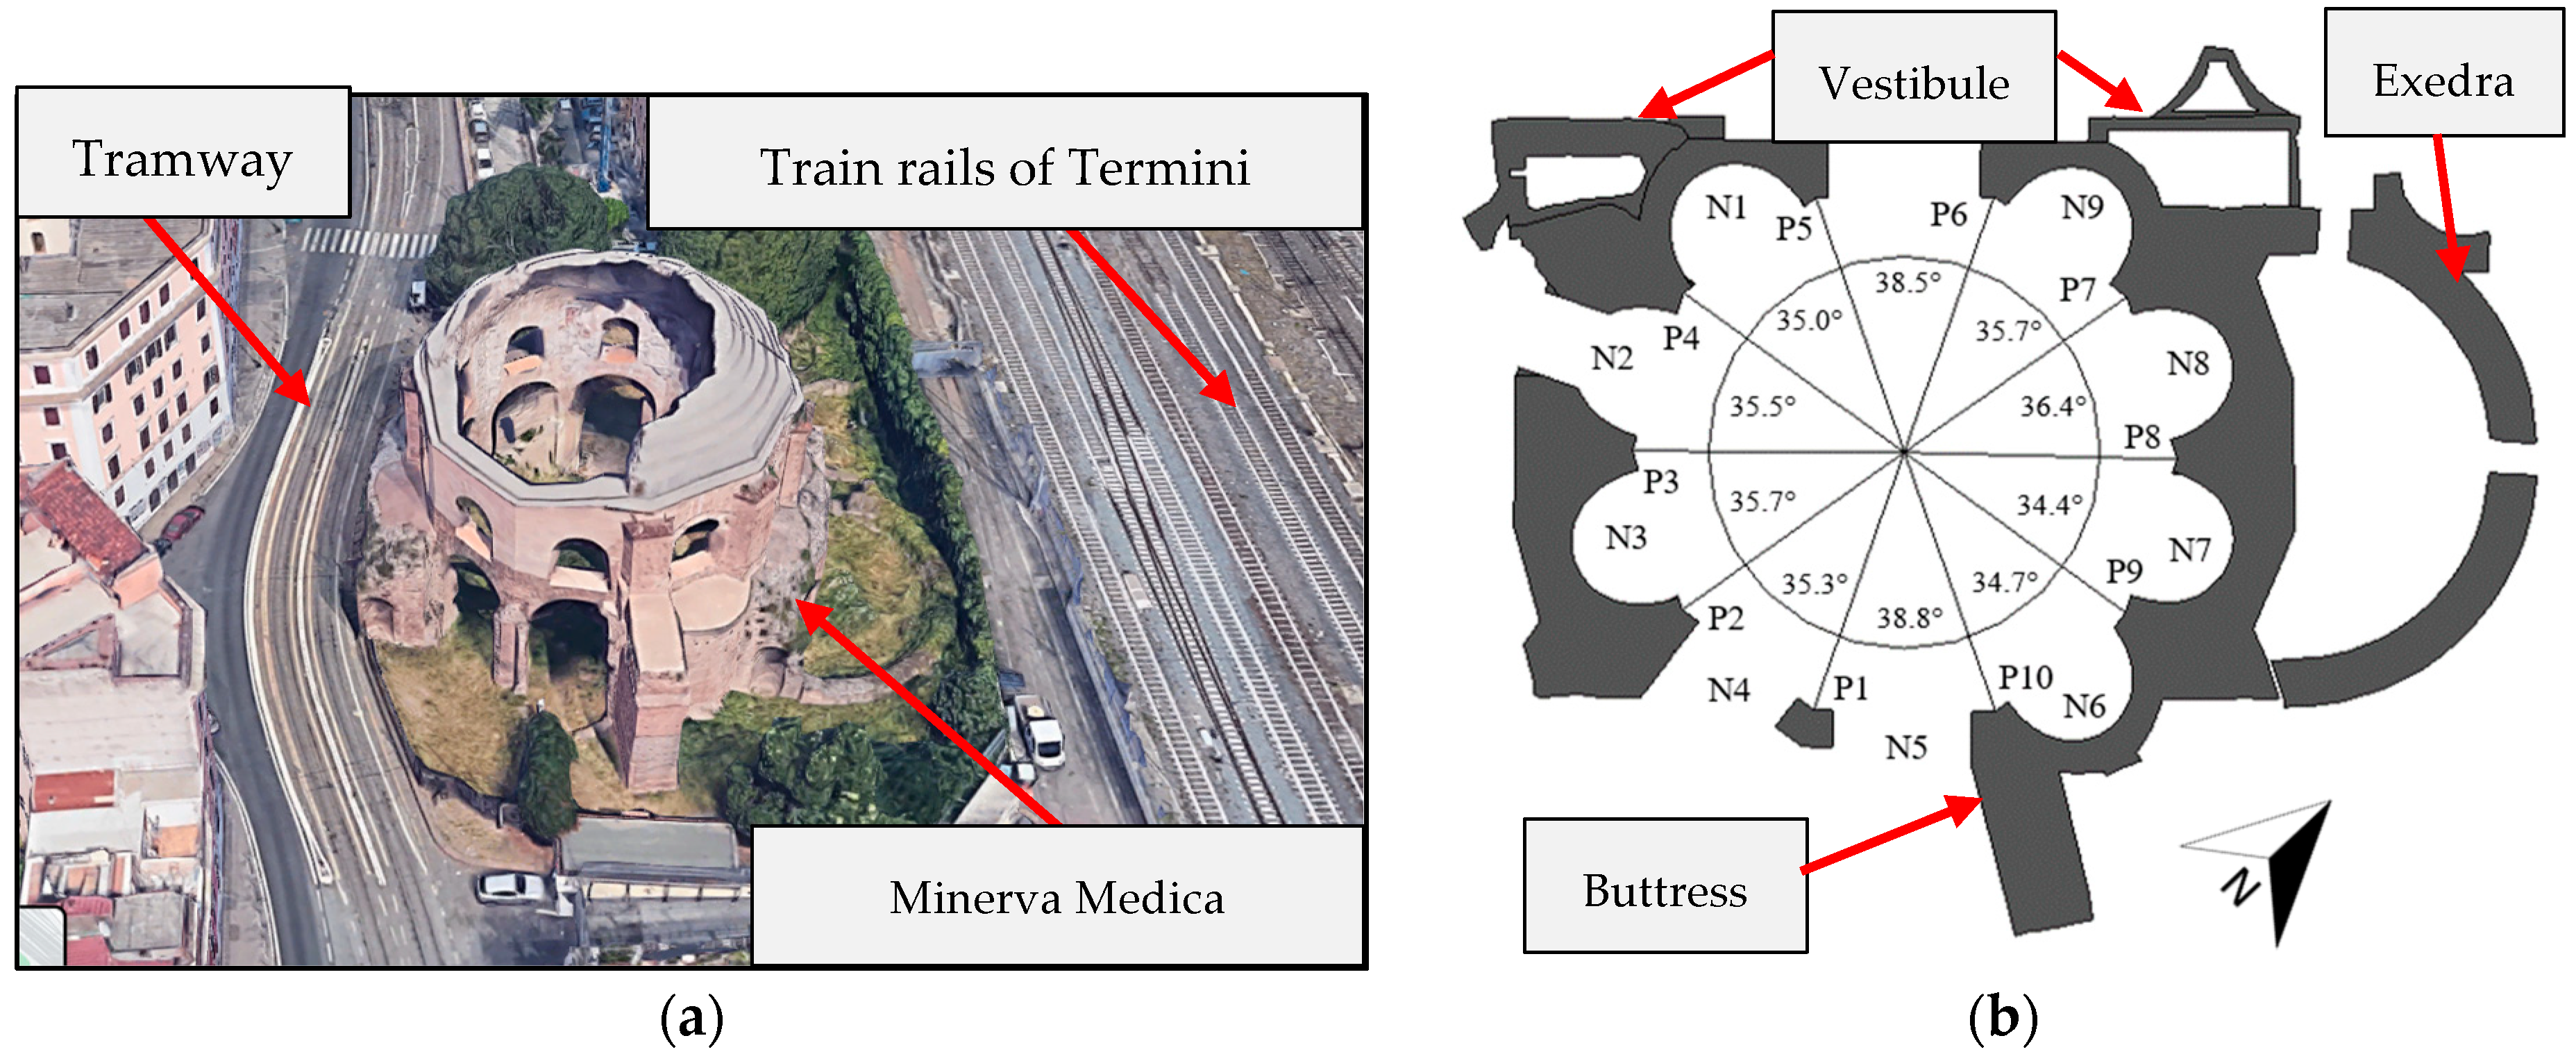
The so-called Temple of Minerva Medica is an ancient construction in the city center of Rome between the train rails of Termini station and Via Giolitti, where, in the 20th century, an important urban tramway was built (
Figure 1a). The original structure was built around the 4th century A.D., and it was entirely made of
opus latericium formed by a Roman concrete core of
opus caementicium and two brick-masonry external layers in
opus testaceum. From the beginning, the construction manifested structural problems, and it was necessary to build additional stabilizing elements (the exedras, the vestibule, and the buttresses) to counteract the outward thrust of the dome [
28] (
Figure 1b), which is highlighted by the use of different materials and techniques (
opus mixtum with rough-hewn tuff stone and Roman bricks [
29]).
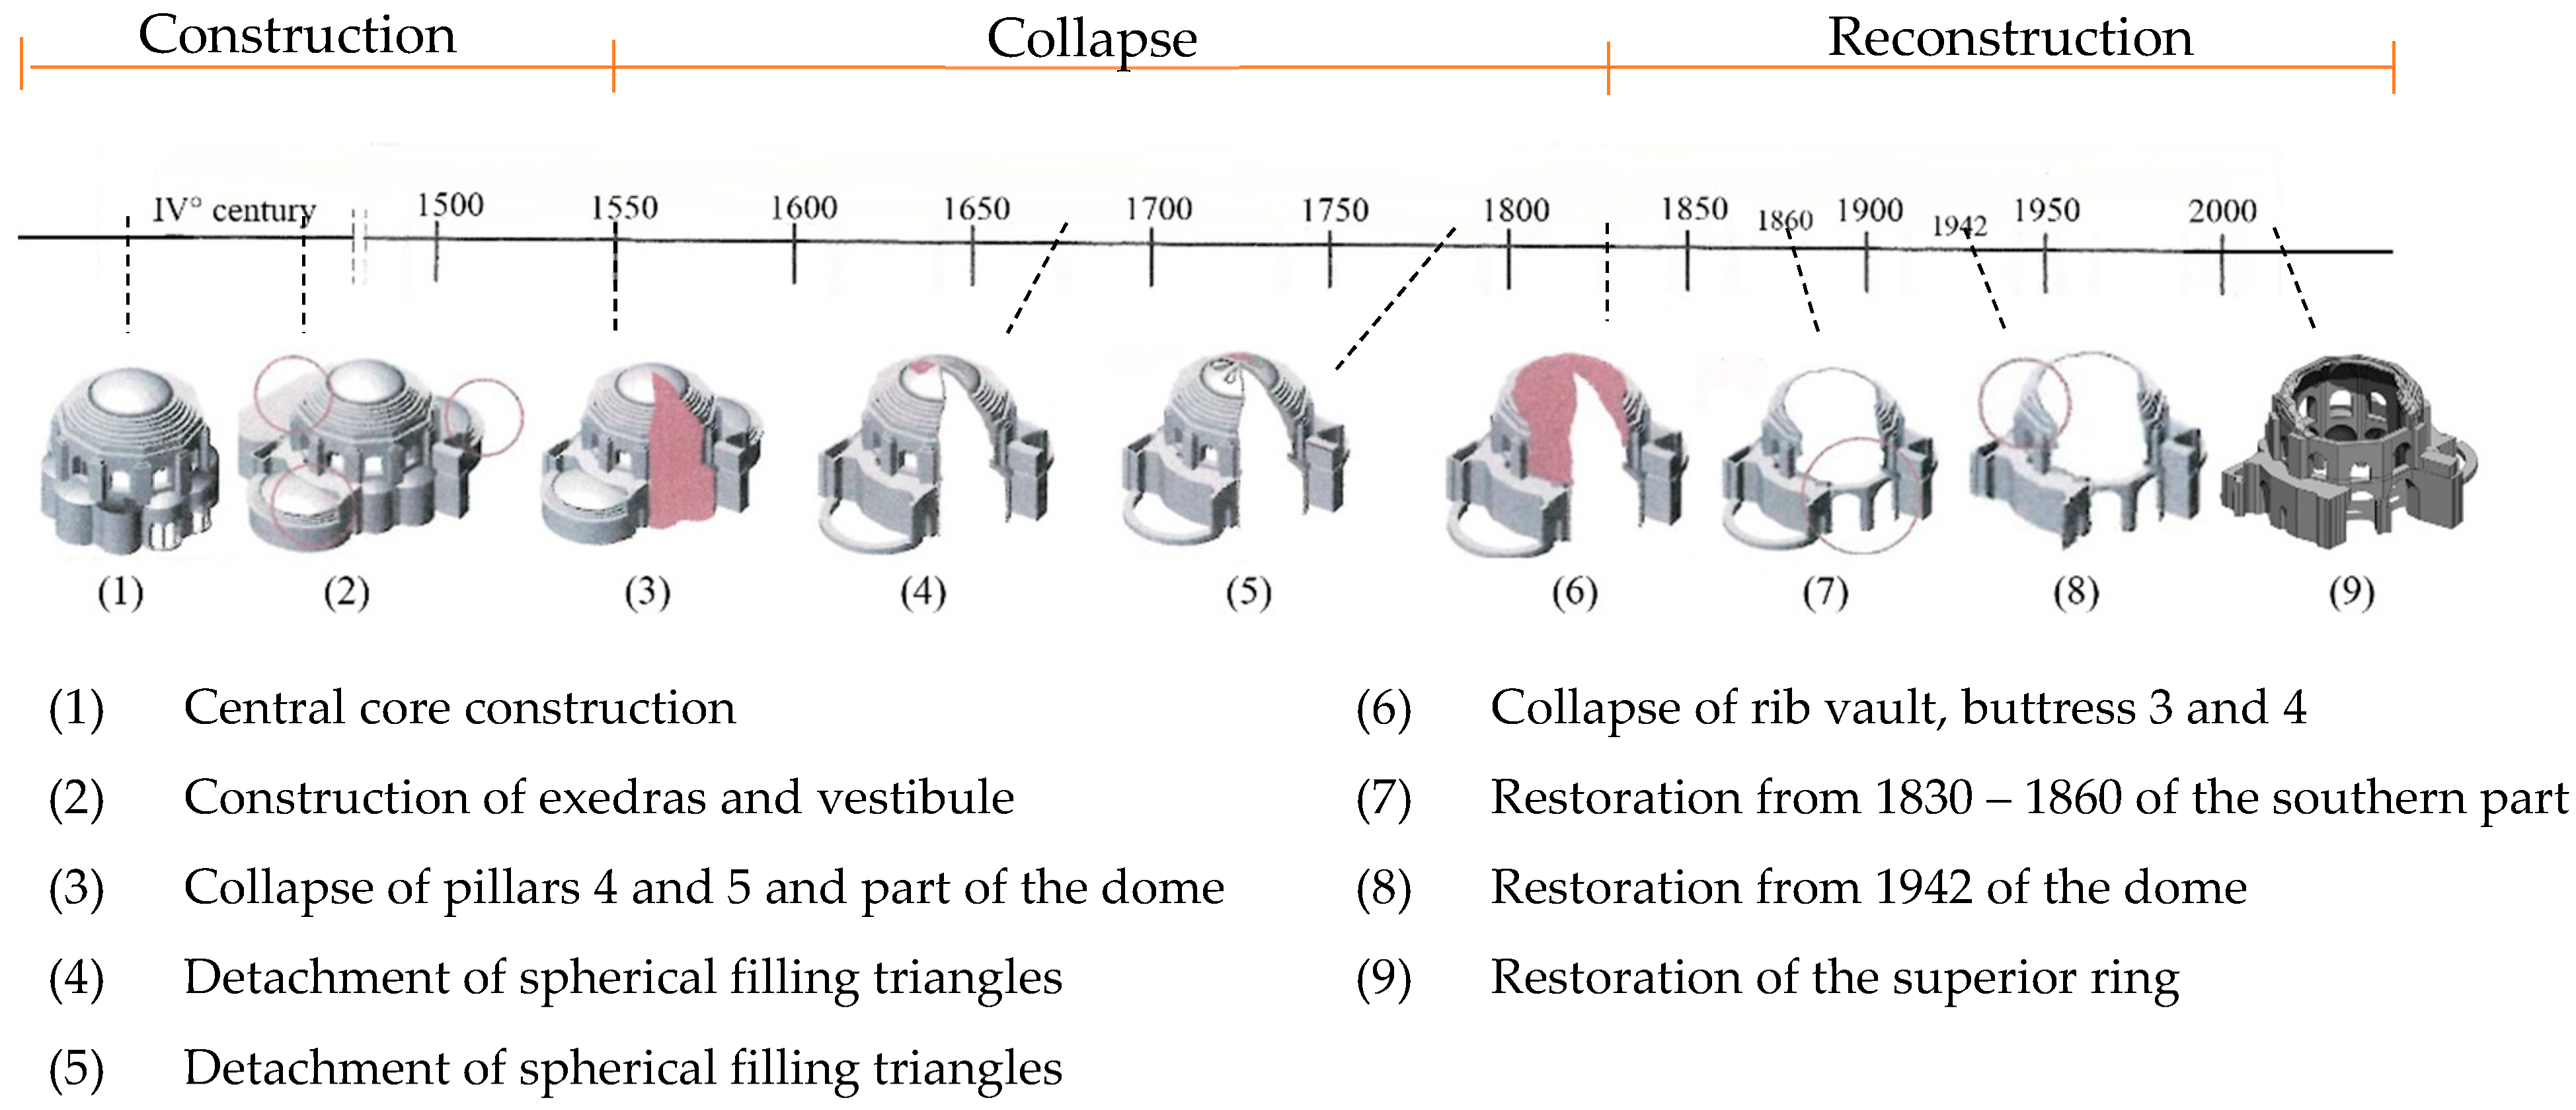
The main construction phases of the monument were identified with analysis of the archival sources, followed by direct observations on site. The historical evolution can be divided into three main periods: construction (between the 4th century and 1550), collapse (between 1550 and 1828), and reconstruction (between 1828 and 2022) [
29].
Figure 2 summarizes the evolution of the Temple of Minerva Medica.
It is evident that the structure, from the very beginning, presented critical issues, probably due to the bold dimensions of the building. As a result of these critical aspects and deterioration that occurred over time due to long periods of neglection, a series of collapses recurrently occurred, which led to the loss of the exedras, a large part of the dome, and pillars 1 (P1) and 2 (P2) (
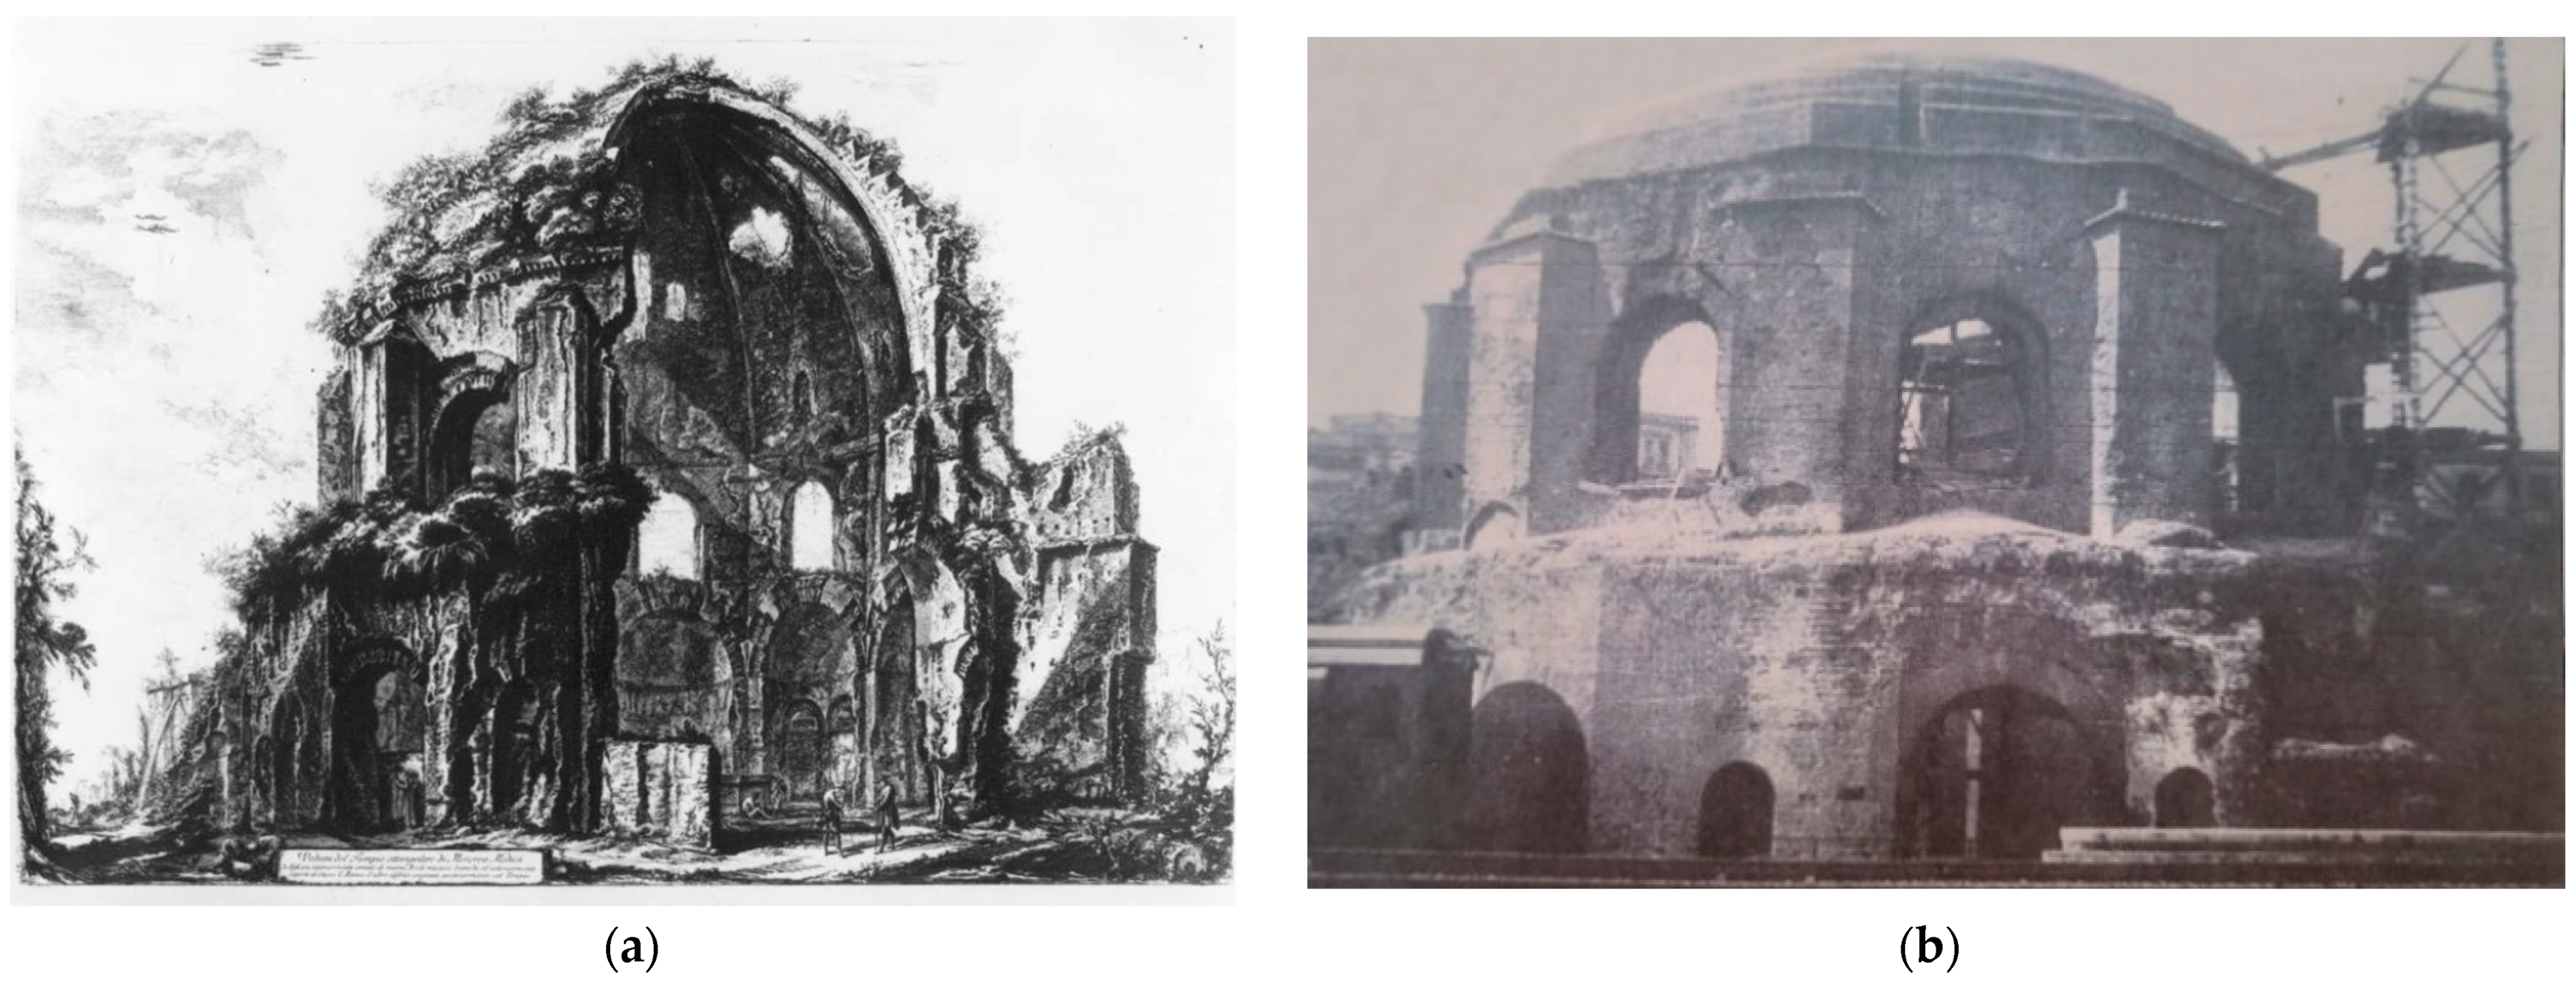
Figure 1b). In the Piranesi’s etchings from the 18th century (
Figure 3a) is recorded the loss of two veloidic segments of the dome after the collapse of pillars 1 and 2, as a consequence the areas between the ribs were largely compromised by the crumble of the pumice mixture [
30].
The continuous reduction of the veloidic segments over time and the progressive lack of maintenance of the temple led to a further collapse of the dome in 1828 [
28,
32]. Later, it was decided to intervene with multiple restorations to stabilize the structure. Particularly important was the reconstruction of pillar 5, on the first level, between 1830 and 1860, which restored the plan continuity up to the first level. Another significant intervention was carried out in 1942 by architect Guido Caraffa (
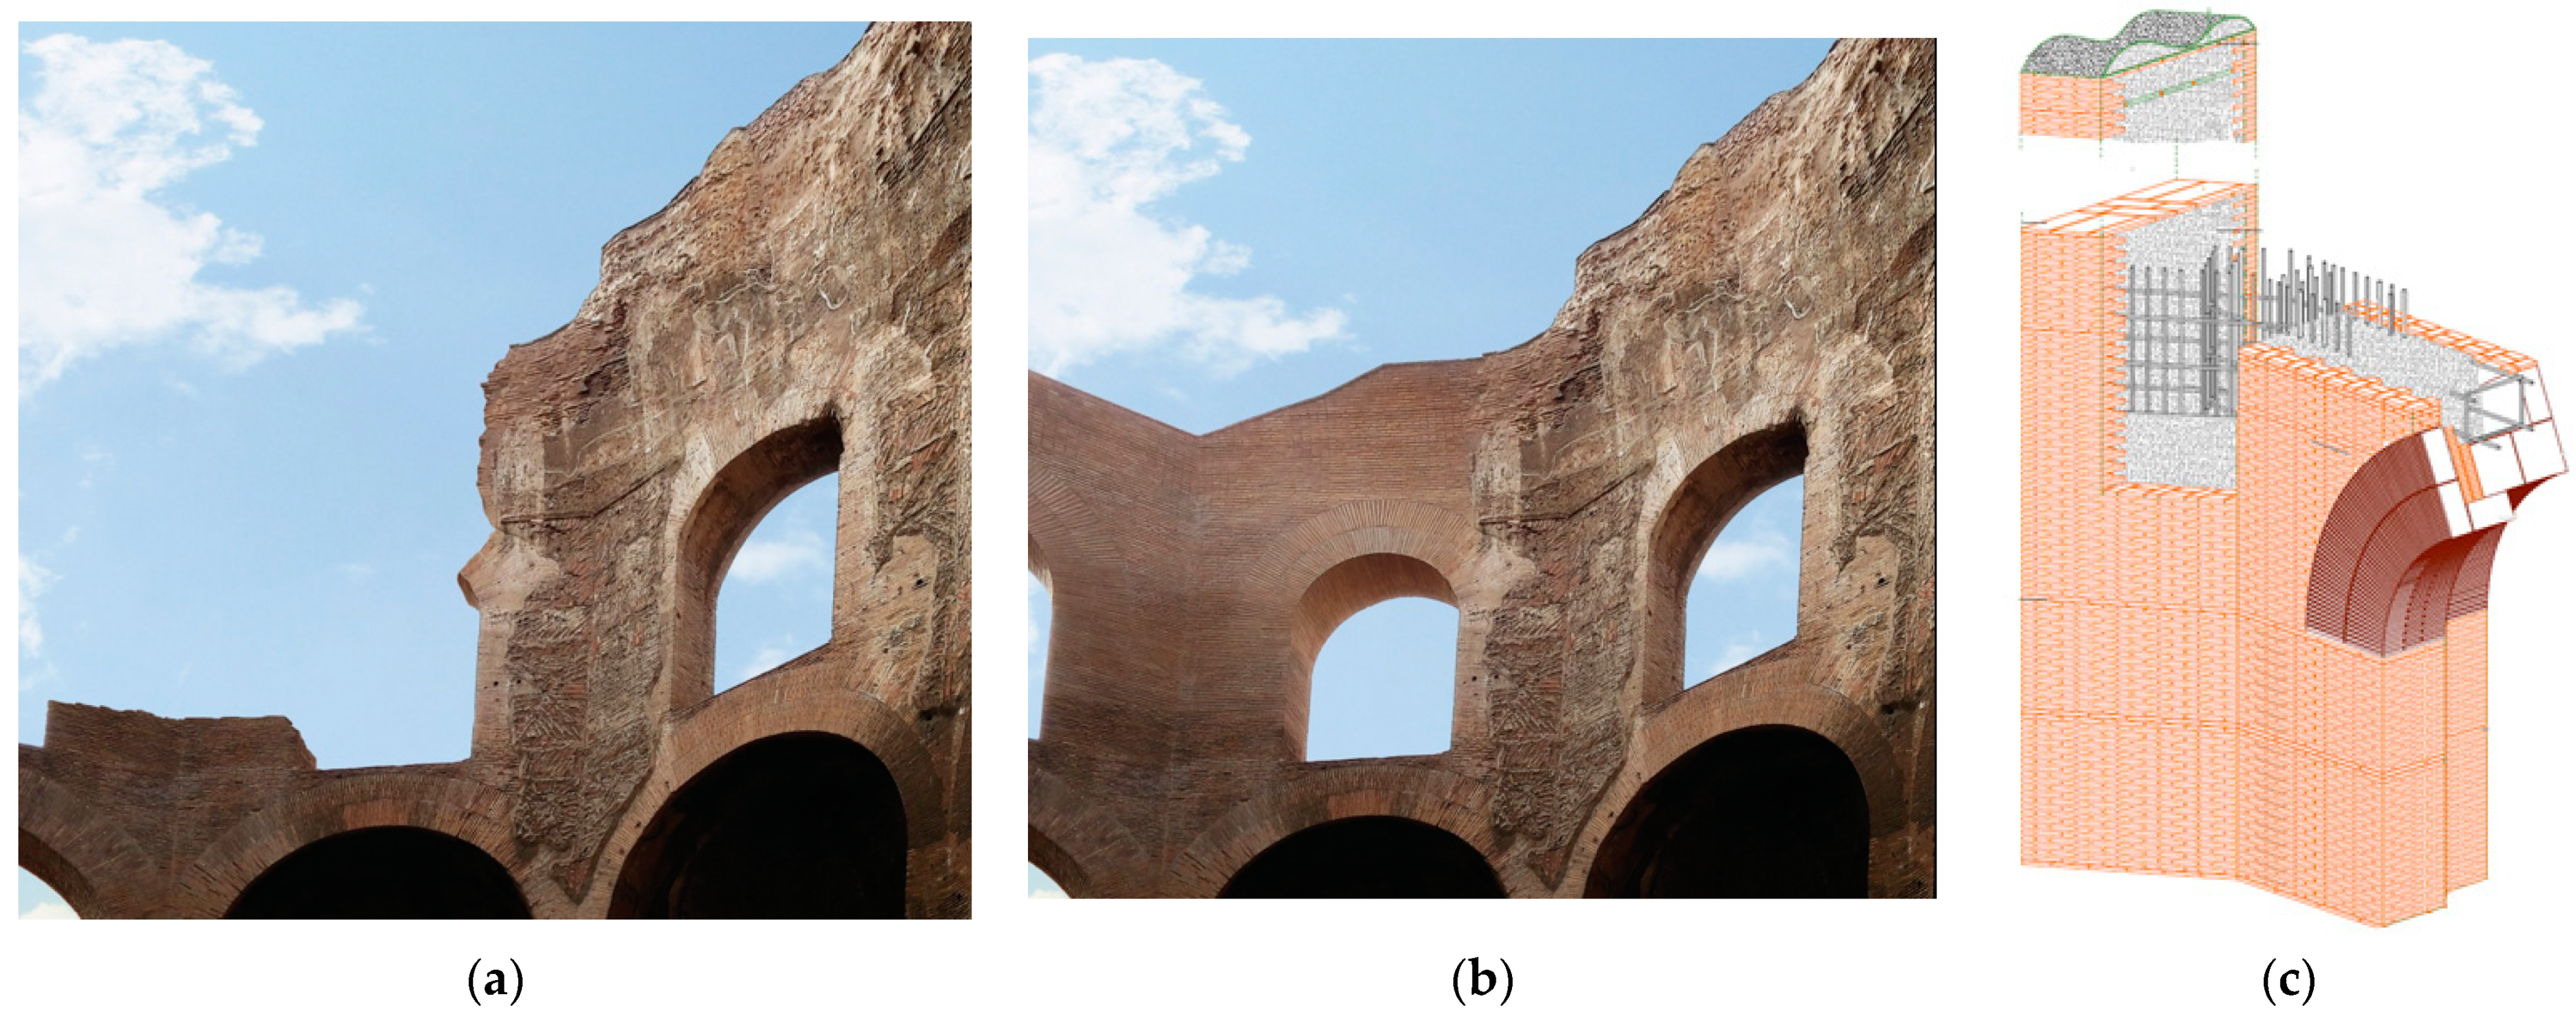
Figure 3b), who reconstructed the upper parts of the monument. In this intervention, the extrados of the dome was reconstructed, as well as the top covering of the buttresses and the missing brick face. In 2014, it was fully restored, the plan continuity along the elevation with the reconstruction of the upper ring (pillar 5, P5) in reinforced concrete (R.C.) comprehending the foundation, pillar, and beam covered in brick masonry [
31] (
Figure 4).
The so-called Temple of Minerva Medica is a majestic structure with a decagonal polylobate plan that delimits an interior space of about 25 m of diameter. The dome, partly collapsed, originally reached a height of 32 m, nowadays reduced to 24 m [
32]. The disposition in-plan of the vertical elements presents minimal variations; the only exception concerns the southeast (between P1 and P10) and northwest (between P5 and P6) sides, which subtend an angle in the center of approximately 39 degrees instead of the same 35 degrees as the other eight arcs [
31] (
Figure 1b). The dome varies in thickness from 1.5 m at the impost to approximately 60 cm at the top; this gives to the dome an extremely audacious geometry. The intrados of the dome has a circular profile, which, according to Caraffa, is formed by double-curvature sails with variable radii, alternated with ribbing arches composed of bipedal brickwork. The extrados has a stepped profile that is connected to the intrados by a middle layer of conglomerate. The connection between the circular imprint of the dome and the decagonal perimeter of the masonry is realized with an imperceptible narrowing of the dome itself [
28]. The presence of the oculus in the central top of the dome (typical in Roman architecture) has not yet been verified. The drum presents large, arched windows and has the role of raising the dome in height. The entire structure is supported by 10 pillars placed at the corners of the decagonal drum, interrupted by 10 niches [
32].
The original configuration immediately presented structural problems that were solved in the 4th century A.D. with additions and restorations in mixed tuff and brick masonry, erected while construction was still in progress. The structure was strengthened with the construction of three groups of stabilizing elements: two large external exedras were built on the northeast and southwest side of the structure; the thicknesses of pillars 2, 3, 4, 7, 8, and 9 were incremented with the addition of external masonry elements; and pillar 10 was externally restrained by a large buttress (a similar intervention was hypothetically installed on pillar 1 and later failed or was removed) [
31].
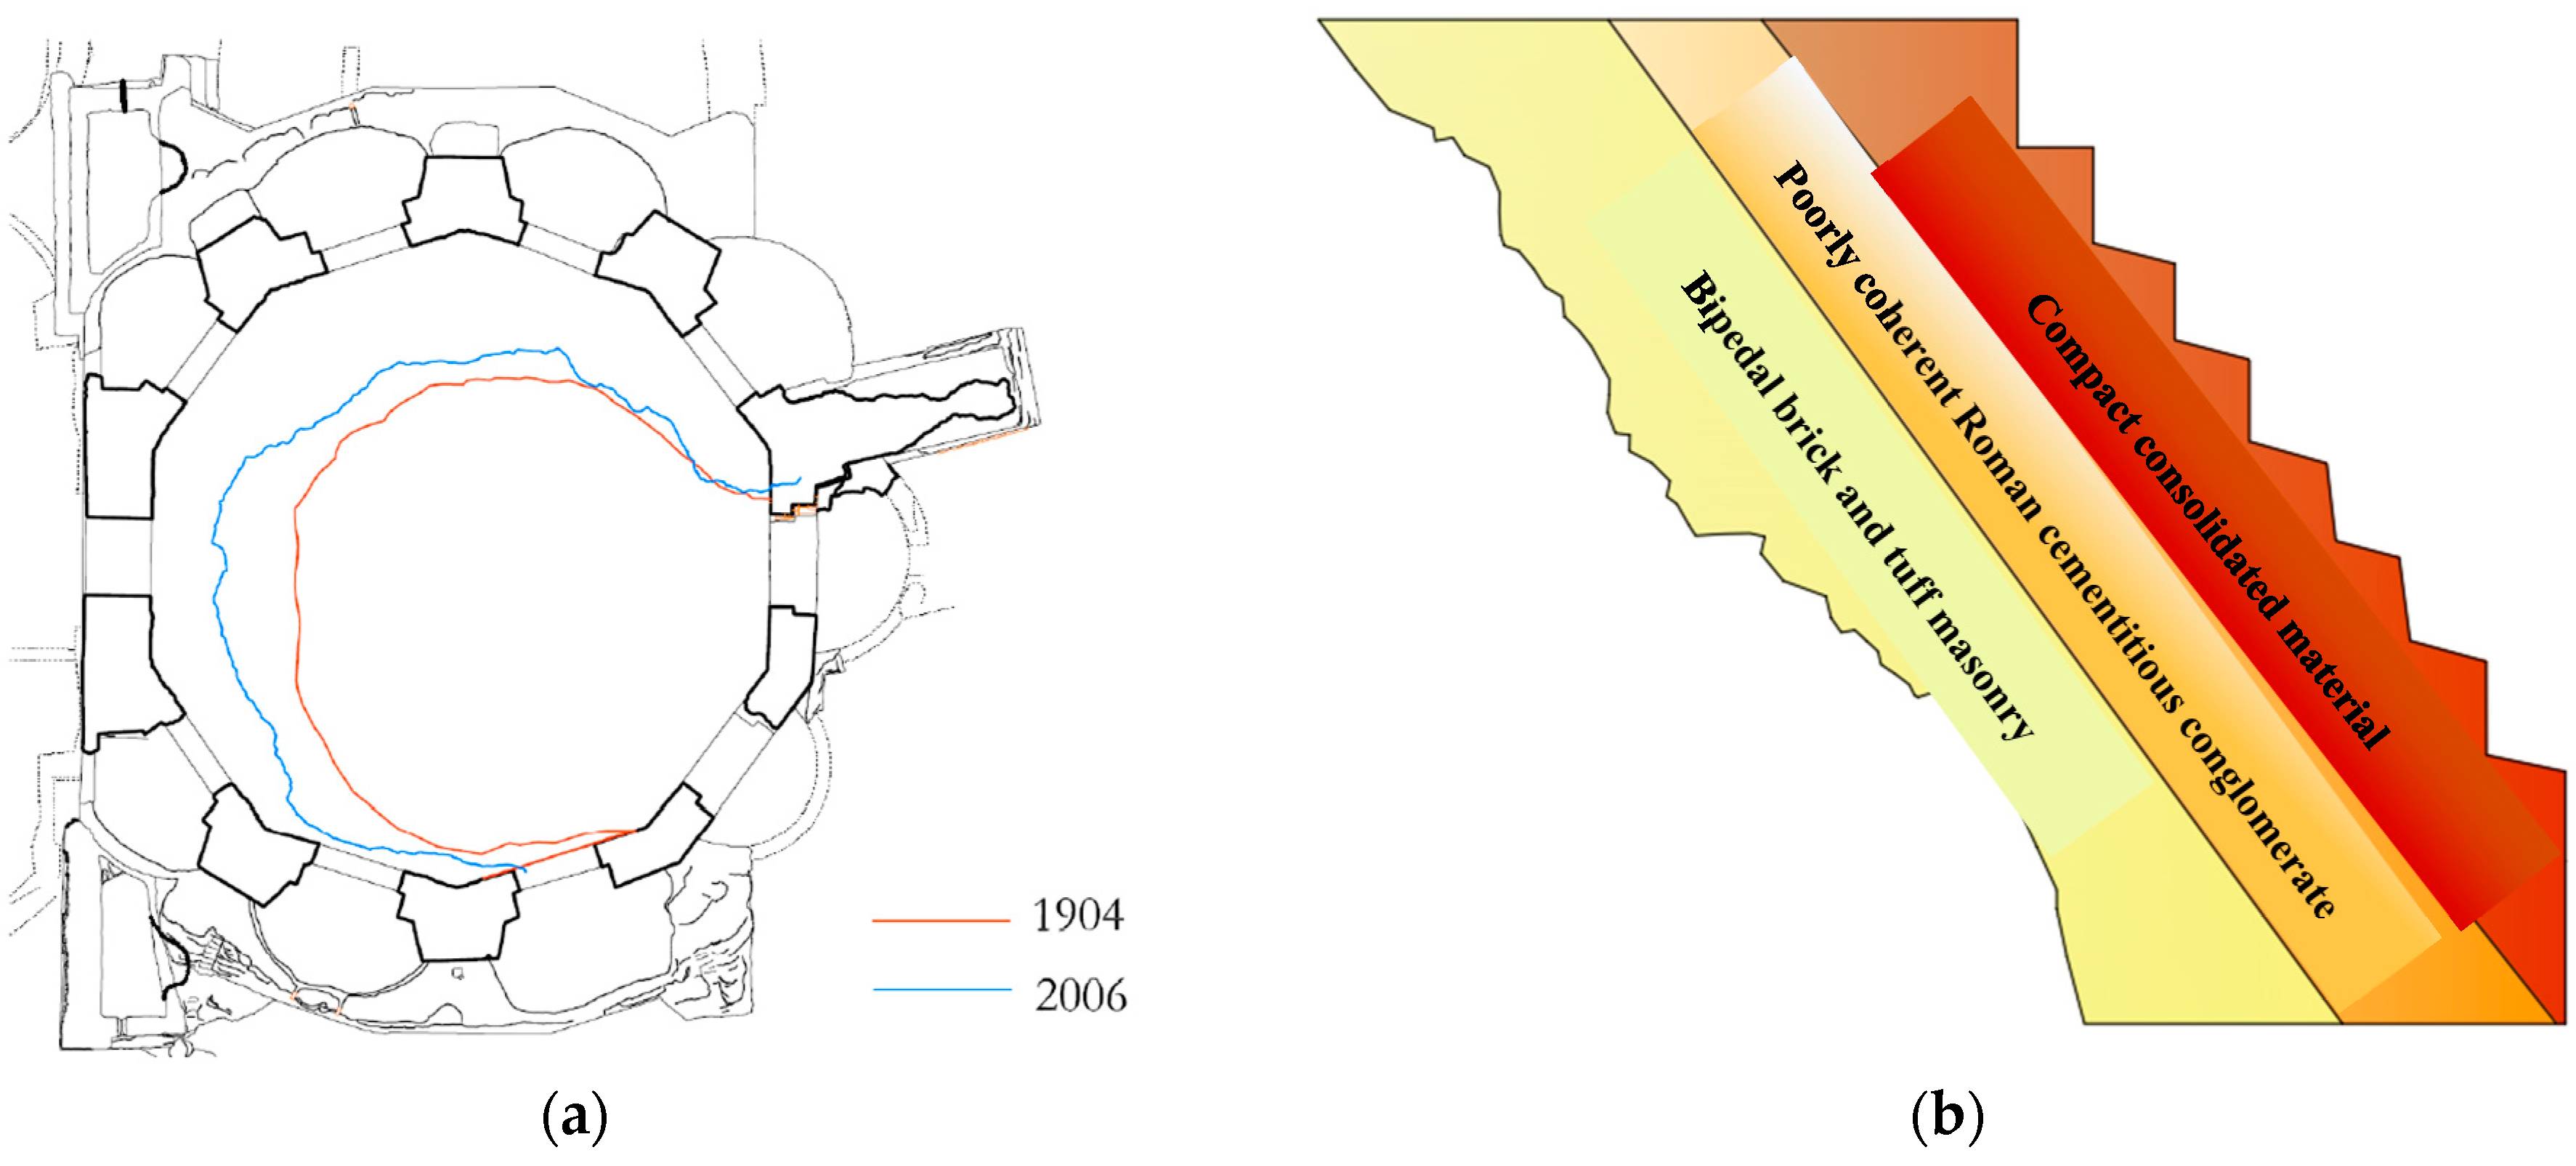
As a result, the structure presents some vulnerabilities due to the nonuniform distribution of masses, stiffnesses, and stress concentration in the arches of niches N4 and N5 and pillar P5. The succession of collapses, although not precisely dated, shows that the temple was affected by a chain of events of degradation that were linked to each other. After the first collapse, the original configuration of the dome was transformed into a reduced number of fragile arches. With increments of loss and degradation, these elements became cantilever elements that underwent relevant tensile stress; today, the remaining part of the dome presents a slender profile. In
Figure 5a, the progressive degradation of the dome is shown by comparing Giovannoni’s drawings of 1904 with the configuration from 2006 [
28,
31]. In 2013, several carbon-fiber-reinforced polymer rods (CFRP) of 12 mm in diameter were inserted through the stepped extrados of the dome. Despite this, the remaining dome is still the main vulnerable element of the construction.
Another aspect of vulnerability concerns the decay of the materials. The dome is composed of three layers of materials (
Figure 5b): the intrados layer, consisting of the supporting masonry framework of the ribs in bipedal bricks with sail segments of ashlar tuff; the middle layer of poorly coherent Roman cementitious conglomerate; and the extrados layer of compact consolidated material. The evident deterioration of the intrados and the difficult cohesion between the three layers has reduced the load-bearing capacity of the dome. The decay is still in progress, but it has been partially slowed down on the extrados by the already mentioned interventions; the intrados continues to suffer material decay worsened by the erosive actions of rain and wind [
28,
31].
Being that the construction is located in a central, urban part of the city, the temple was erected on different previous Roman remains. According to Lombardo [
31], there are multiple stratifications of archaeological phases that occurred before the construction of the temple; the area was excavated, and the identified remains are reported in
Figure 6 [
28,
31]. The foundations of the temple were laid in continuity with the existing niches and were built approximately four meters below the current walking surface. The structure originally had radial plan symmetry so that the loads were equally transferred to each pillar. Nevertheless, the presence of previous subfoundations and subsequent additions of stabilizing elements have altered the thrust lines of the structure. This situation could have led to a progressively increasing stress concentration in the southeast area of the temple where the collapses were initiated.
The “Soprindendenza dei Beni Archeologici” previously commissioned geotechnical investigations from which the soil stratification of the site was defined [
28,
32]. As usual in Rome, the first three meters of soil below the ground present anthropogenic composition; deeper underground are three main identified soil layers:
From 3 to 6 m underground, there are altered and clayey pyroclastites (Pa);
From 6 to 14 m underground, there are thickened (with earthy appearance) pyroclastites (Pt);
From 14 to 20 m underground, there are coherent to semilithoid pyroclasts (Pc).
The geotechnical parameters of the soil stratification are reported in
Table 1.
The soil properties exclude significant long-term subsidence; it follows that setting should have been almost immediate when loads were applied. The modest levels of the moduli of elasticity of the soil identified during the geotechnical investigations and the subfoundation distribution support the hypothesis that the problems that occurred in the initial phase of construction may have been related to setting. In 2014, the upper ring was reconstructed and the foundation of pillar 1 was strengthened with micropiles, which certainly incremented the load-bearing capacity of the structure. However, periodical rail-traffic vibrations, even if they express low levels of vibration, may lead to soil settlements when granular soil with modest relative density (less than 50%), and saturated conditions are present at a site [
34].
3. The Experimental Campaign
Several diagnostic campaigns were carried out on the so-called Temple of Minerva Medica. In 2018, the Italian National Agency for New Technologies, Energy and Sustainable Economic Development (ENEA) performed nondestructive testing (NDT) on the temple [
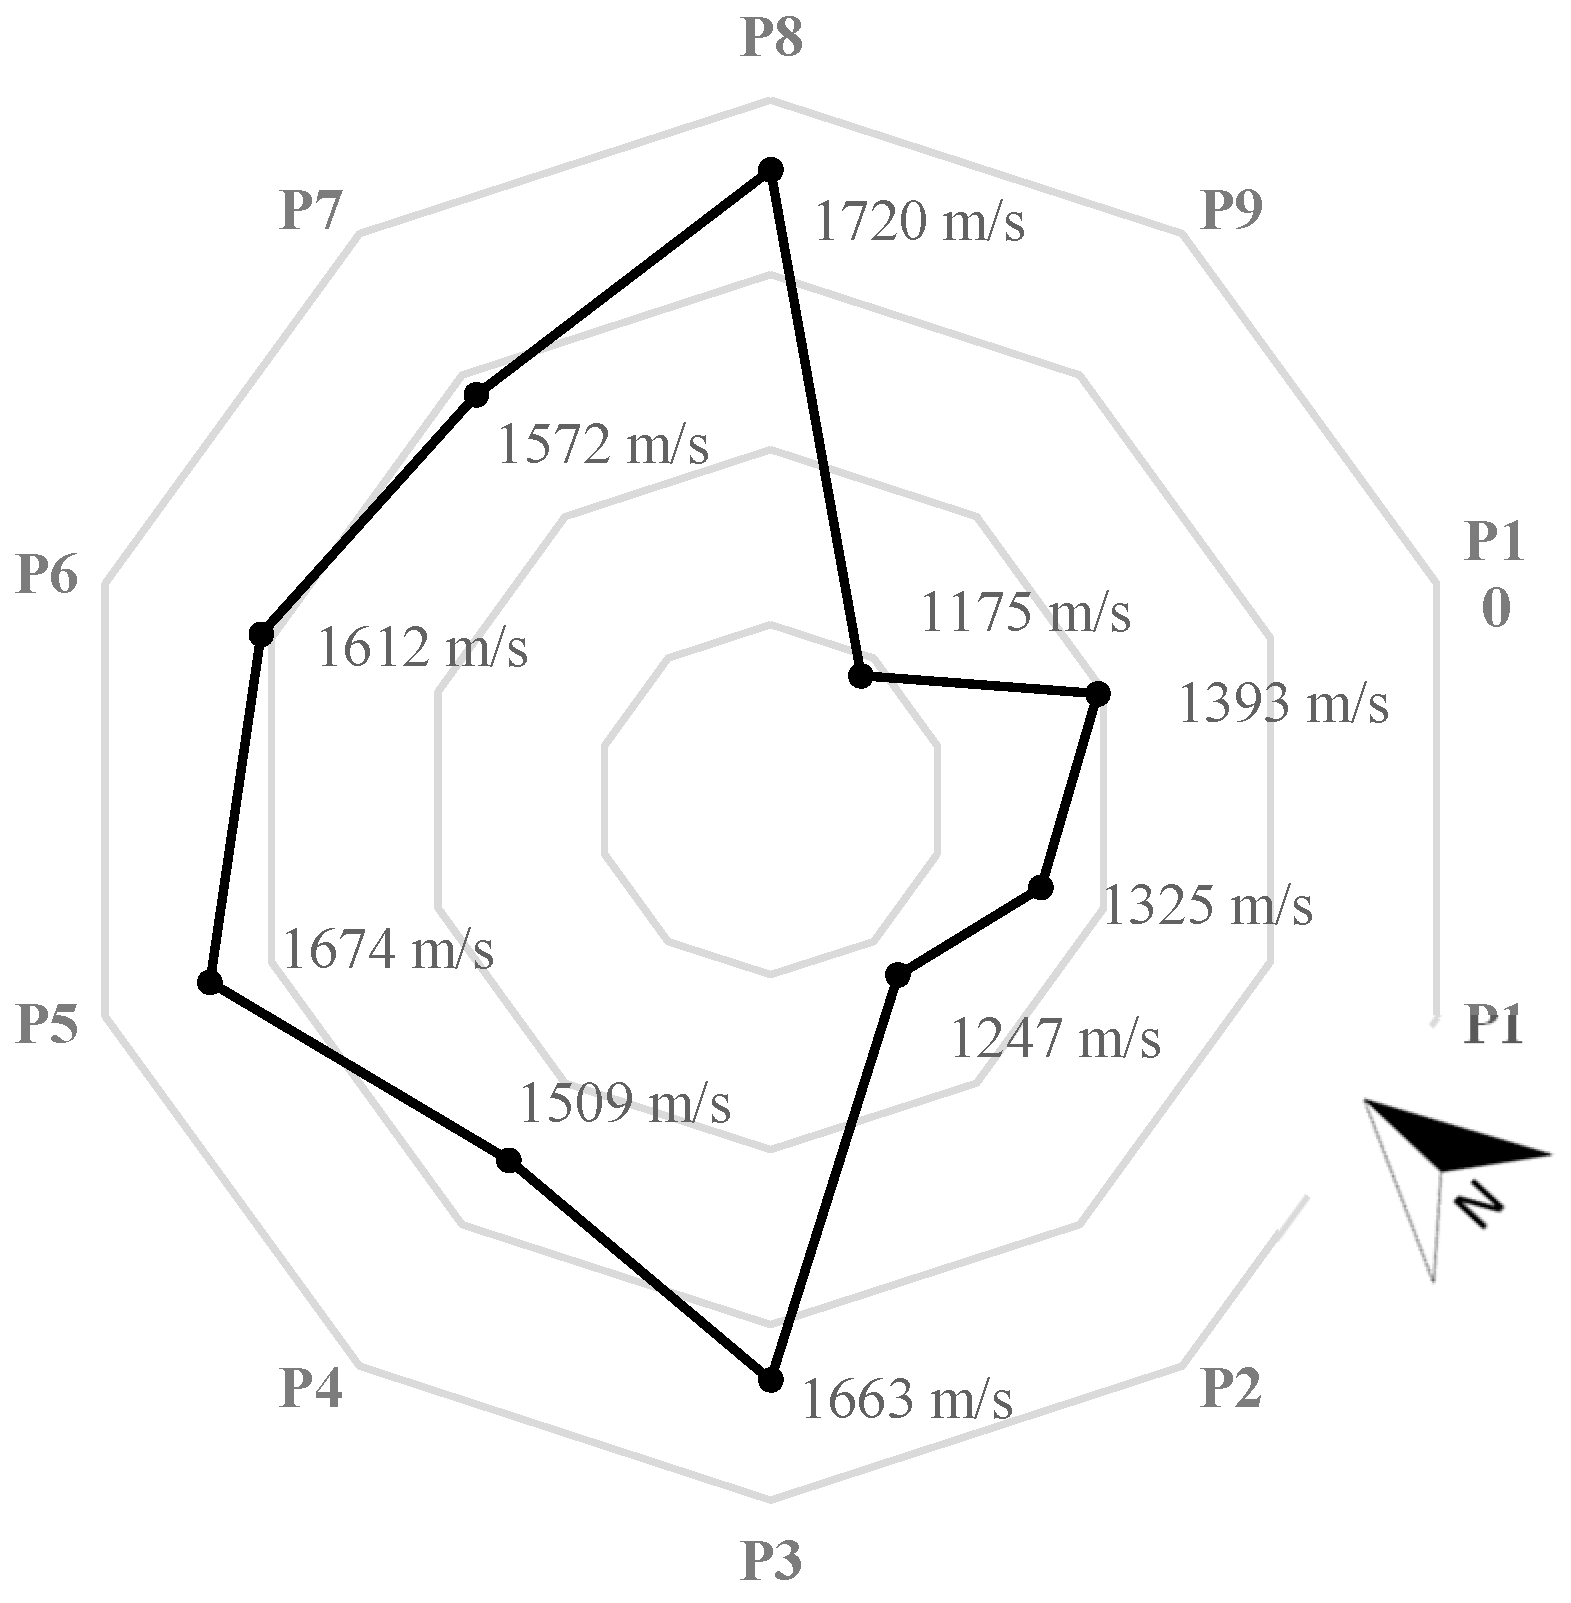
16]. The results provided by ENEA include the sonic velocity of the P-wave recorded through the ten pillars at the ground level, reported in
Figure 7. The values have been calculated as averages of the velocities measured at six points of each pillar. The results highlight a group of pillars (P9, P10, P1, and P2), in the east and south sections, with lower velocities, and the remaining pillar with higher velocities. This result identifies less-compact material in the southeast section of the monument, in agreement with the recorded collapses, the widest niche (N5), and the reconstructed pillar (the first arcade of pillar P1 was rebuilt in brick masonry during the 1830–1860 restoration).
Dynamic monitoring of the temple was performed with different types of instrumentations [
35,
36]. Twelve ICP (Integrated Circuit–Piezoelectric) accelerometers (10 V/g sensitivity, measure range of ±0.5g, frequency range from 0.15 to 1000 Hz, and 8 μg rms resolution) were positioned at five different locations for acquisition. Two setups were recorded, each one for a period of approximately 45 min; only one location was kept unvaried (A) as a three-dimensional reference to merge the results of the operational modal analysis (OMA). Another set of two MEMS accelerometers recorded the vibrations at the base of the construction to monitor the input. The dynamic monitoring setup is reported in
Figure 8.
The ICP measurements were recorded with a sampling frequency of 441 Hz and were later resampled at 60 Hz according to the significant frequency band of the building. The data was filtered with a band-pass filter between 0.2 and 30 Hz; the cross-spectra were calculated with 1024 time lags and 1% windowing. The modal parameters were extracted with the PolyMAX method implemented in the software Simcenter Testlab [
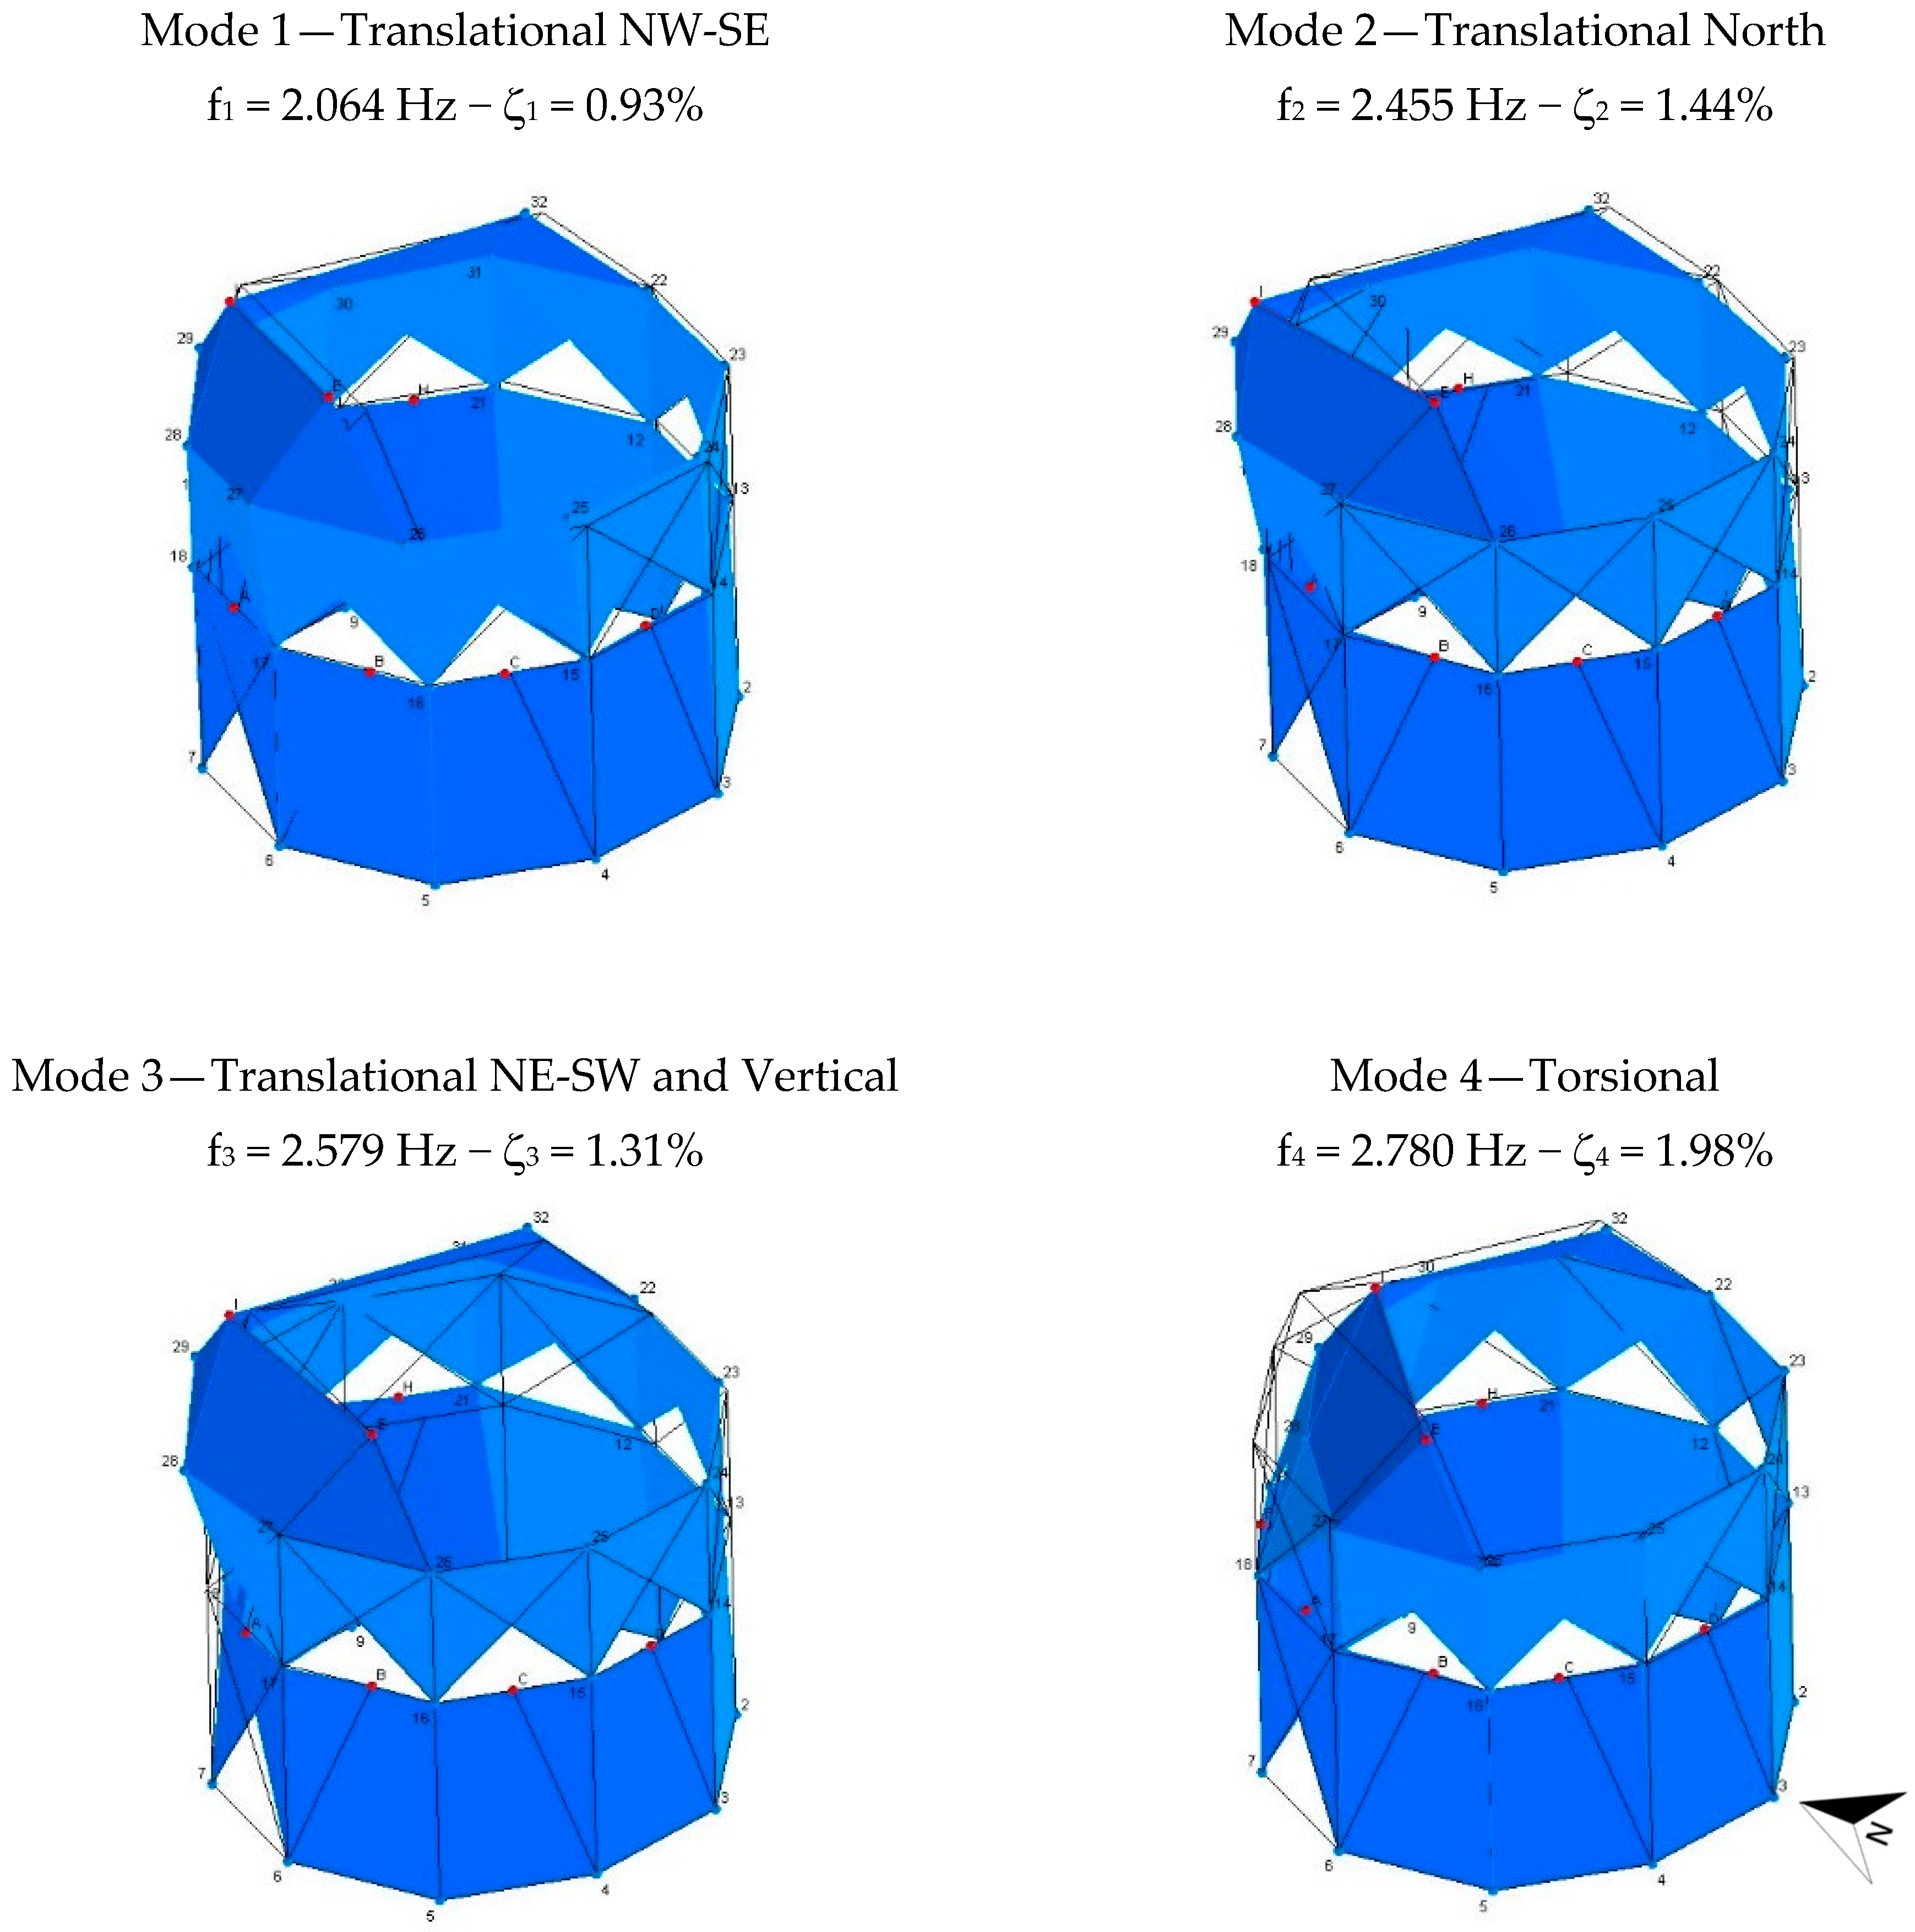
37]. The merging and scaling of the modes extracted in Run 1 and Run 2 were performed in accordance with the modal assurance criterion (MAC) correspondence in the band to the three common degrees of freedom (DOFs) of reference node A, as reported in the previous works of these authors. The extracted mode results were independent, considering most of the cross-MAC was between 10 and 20%. Mode 2 and mode 3 represent the only exceptions, with a higher MAC, of 50%, and thus a medium correlation of the two modes. The modal parameters and the main features are summarized in
Figure 9.
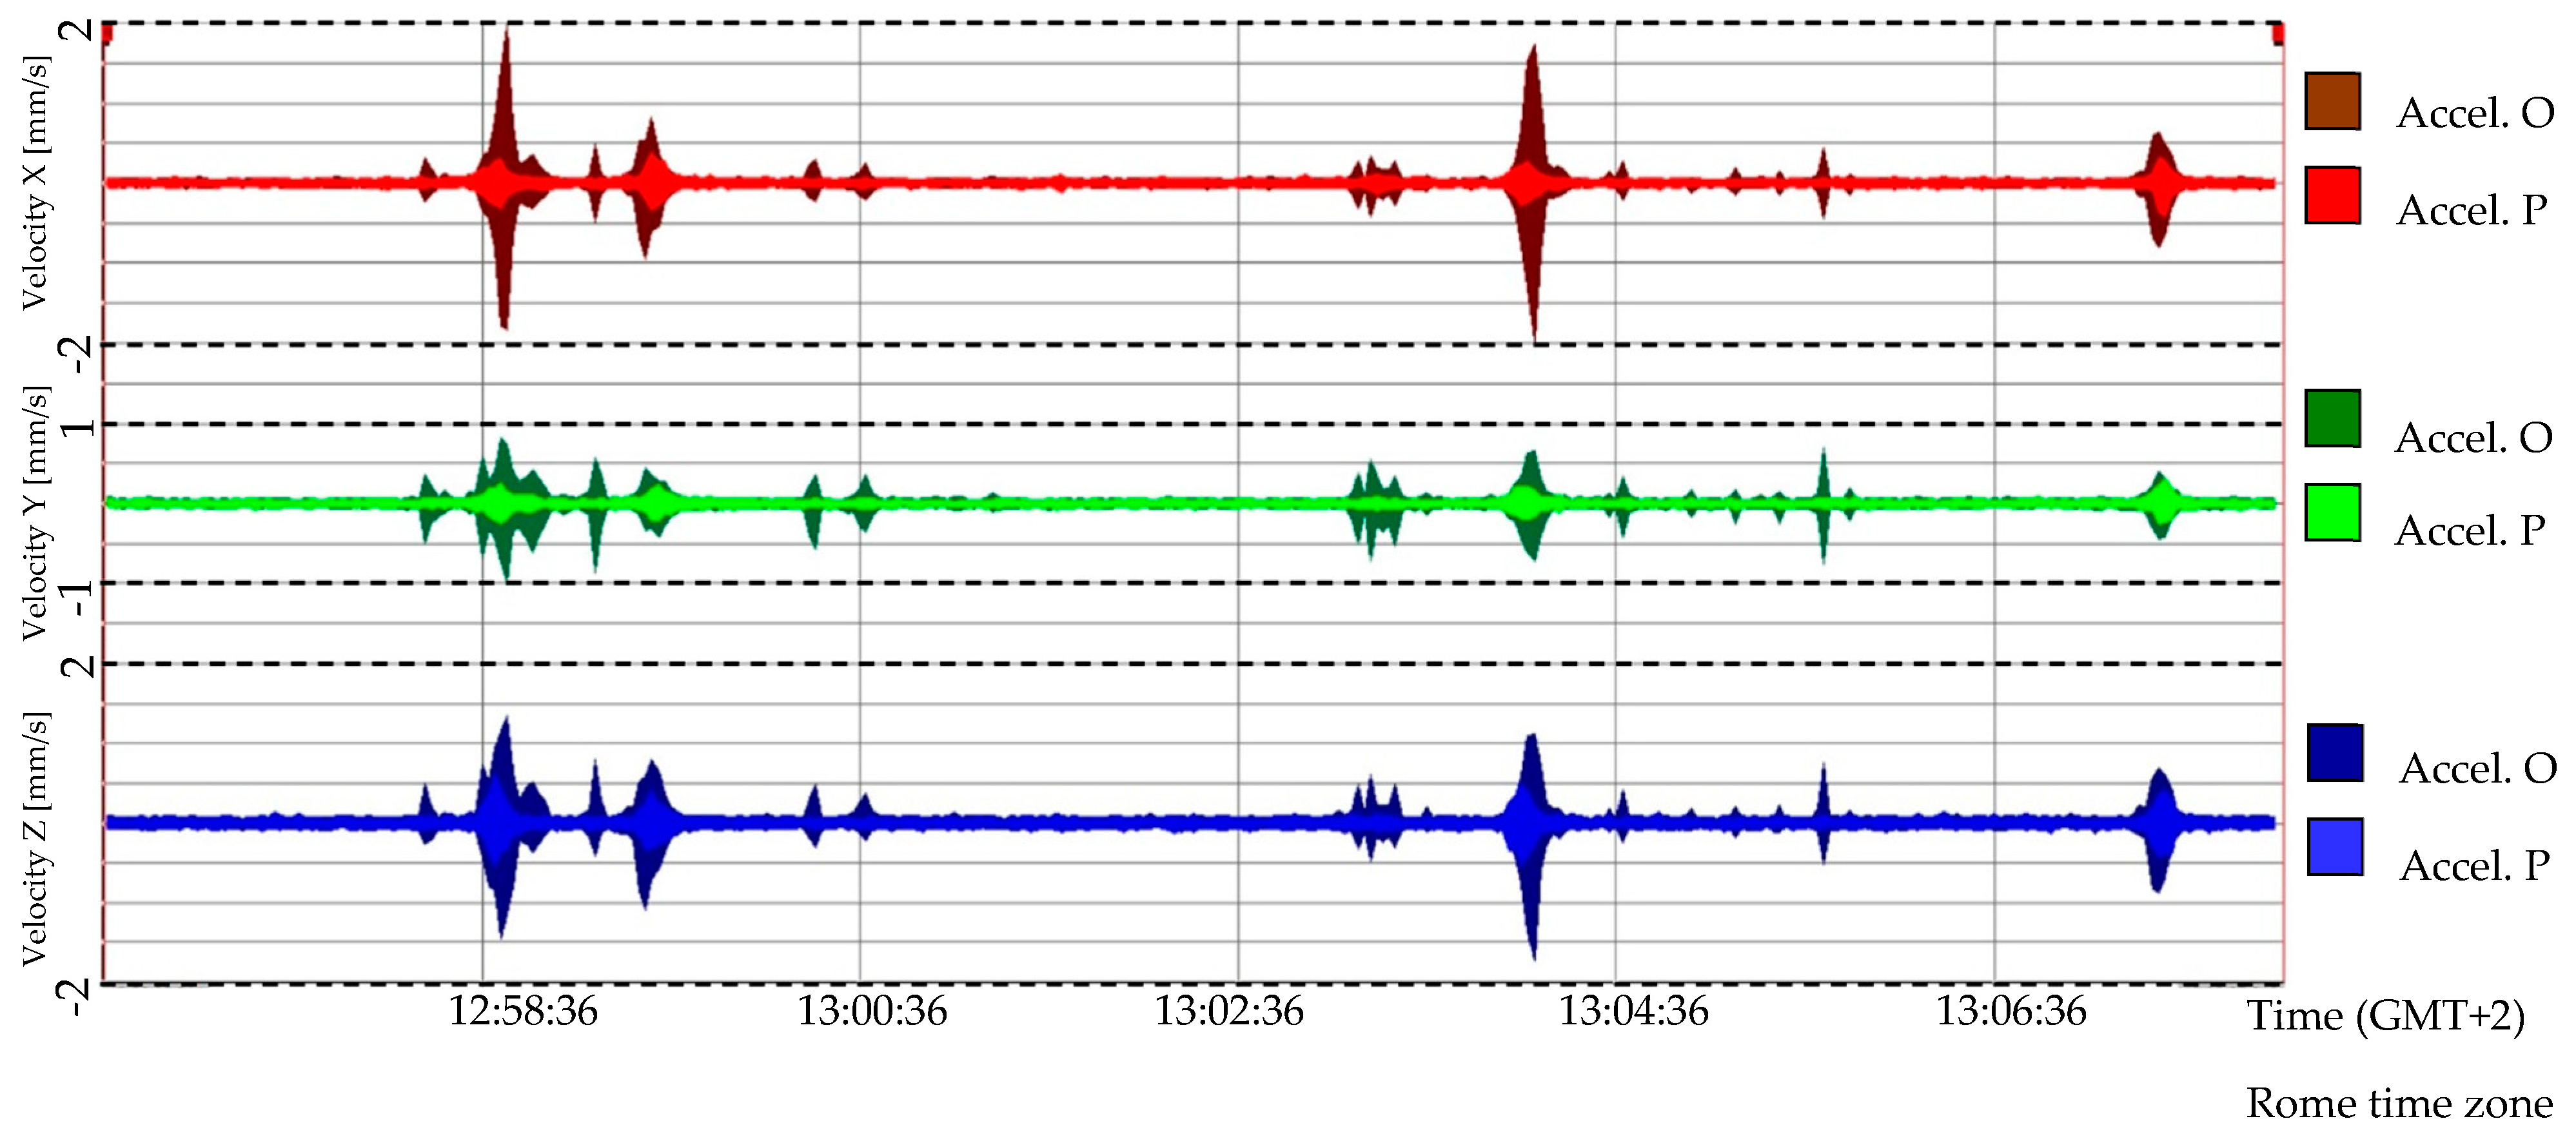
The quantification of the vibrations induced by rail traffic was carried out with the MEMS triaxial accelerometers positioned on the southwest side of the construction. The accelerations were converted into velocities to compare the data with the limit values suggested by Italian regulation UNI 9916:2004 [
27]. In
Figure 10, the velocities recorded by accelerometers O and P in a time window of 10 min are reported; it is evident that in the disturbance caused by the tram at 12:58:44, the velocity of accelerometer O in the X-direction reached the maximum value of 2 mm/s, which is close to the limit value for the horizontal component of velocity, namely the Peak Component Particle Velocity (PCPV), imposed by the regulation (2.5 mm/s). The difference in amplitude of the accelerations depending on location is interesting, considering that both sensors had an equal distance, of approximately 4 m, from the rails.
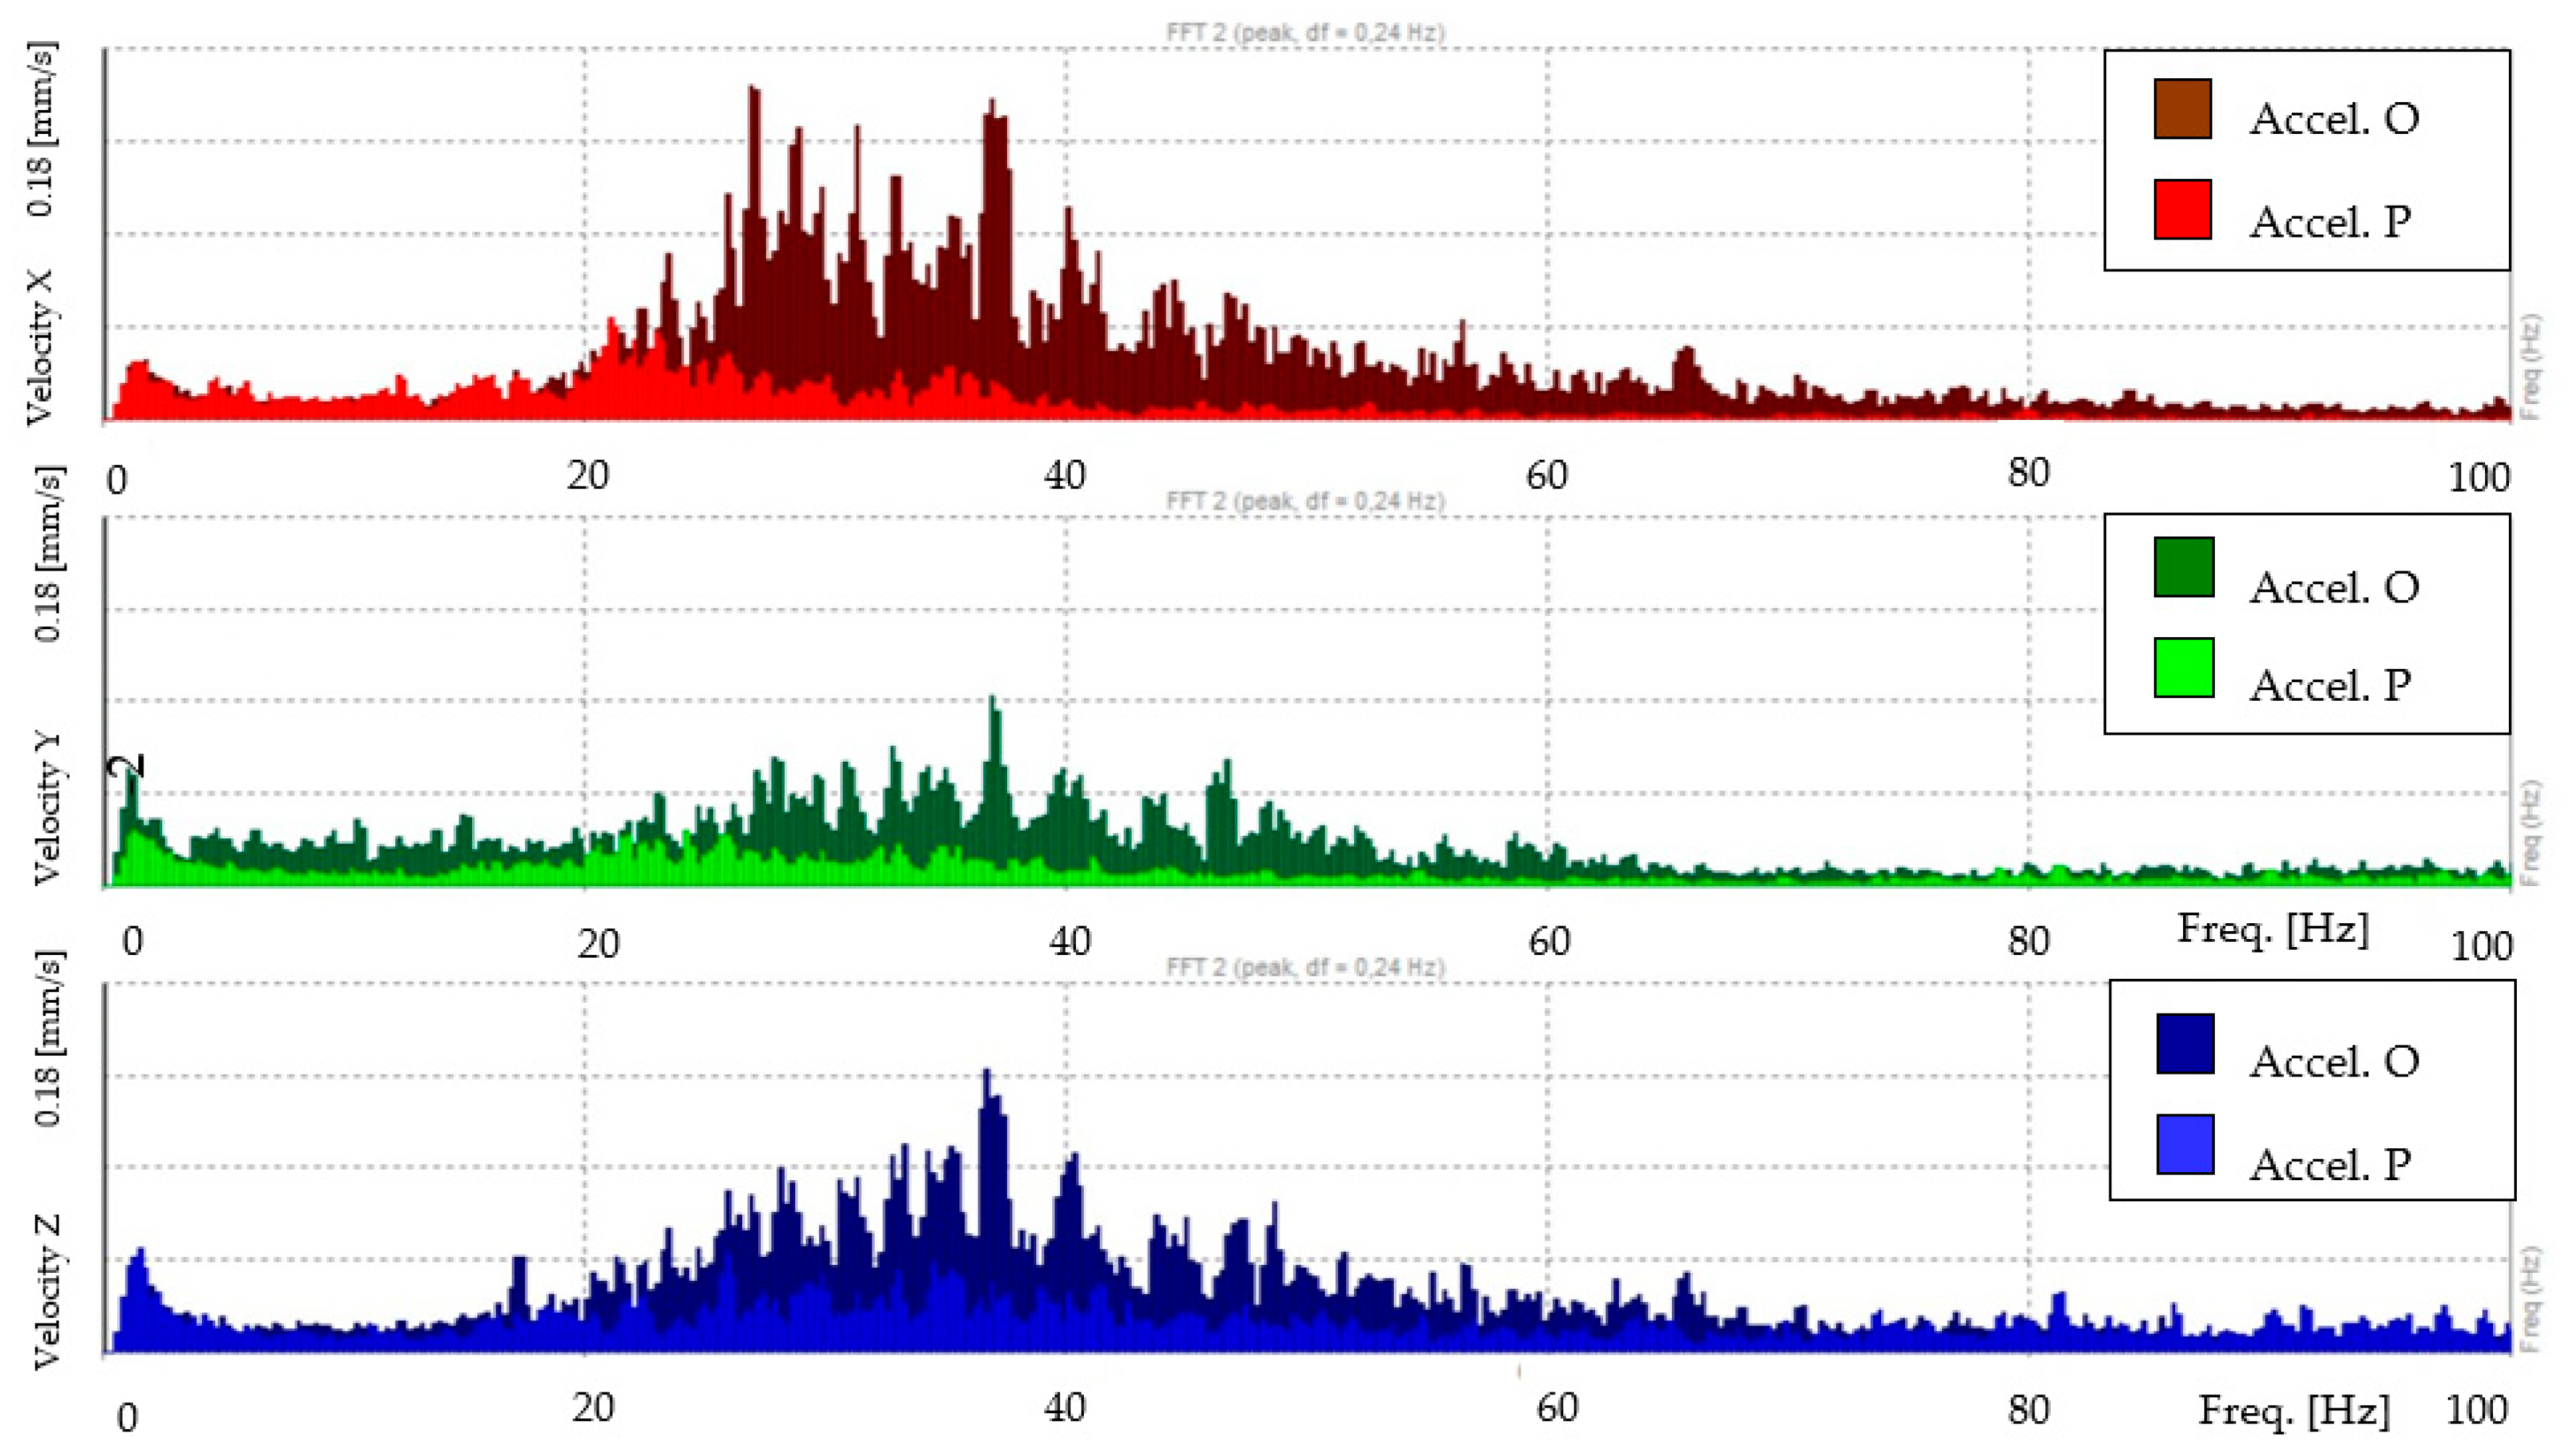
The signals were also analyzed in the frequency domain through the fast Fourier transform;
Figure 11 shows the concentration of the signals in the range between 20 and 60 Hz, which is essentially the spectrum of the disturbance caused by the tram vibrations.
4. Numerical Model of the Site
The complexity of the problem required the use of a numerical model of the site, which included the temple, its foundations, and the soil. The temple was the primary objective of this research, and its response was highly dependent on the soil, which transmits input vibrations and influences the dynamic features of the structure. For this purpose, the HBIM was employed to connect historical, geometrical, and experimental information. The structure, its foundations, the archeological remains (subfoundations), and the three soil layers were modeled in Revit [
38]. Afterward, the geometry was used to define the structural model, considering the finite-element method. The FEM was calibrated, and two different nonlinear dynamic analyses were performed and compared with the experimental results recorded at two measurement points (at the base and top of the construction). Following is a description of the methodology.
4.1. Heritage Building Information Model
The geometrical survey (plans, elevations, and sections) provided by Soprintendenza Speciale Archeologica, Belle Arti e Paesaggio di Roma [
31] was employed to define the geometry of the HBIM. The BIM allows archival of information into a single three-dimensional model; in this case, the geometrical information was related to the testing results. The model was developed in three stages. In the first stage, the foundations, subfoundations (archeological remains), and soil layers were modeled using both the archeological drawings (
Figure 6a) and the geotechnical information in
Table 1; the result is reported in
Figure 12.
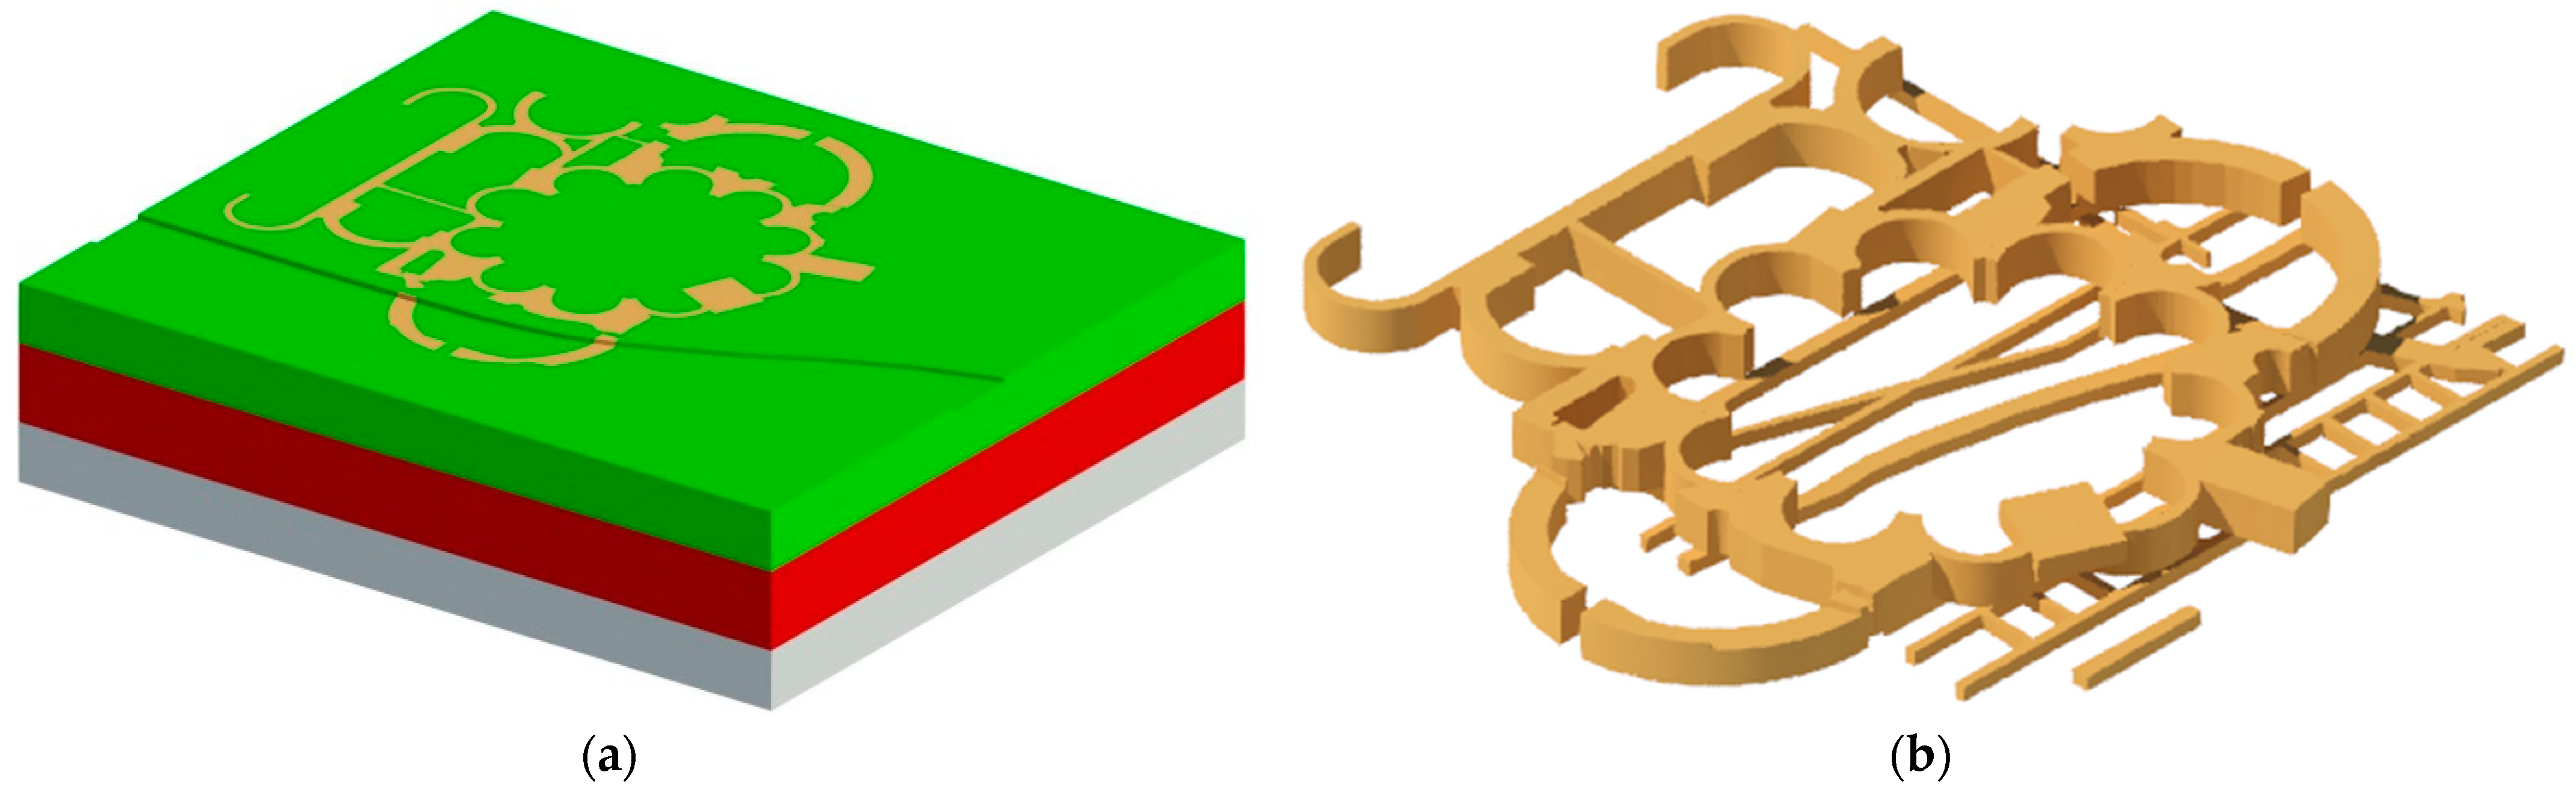
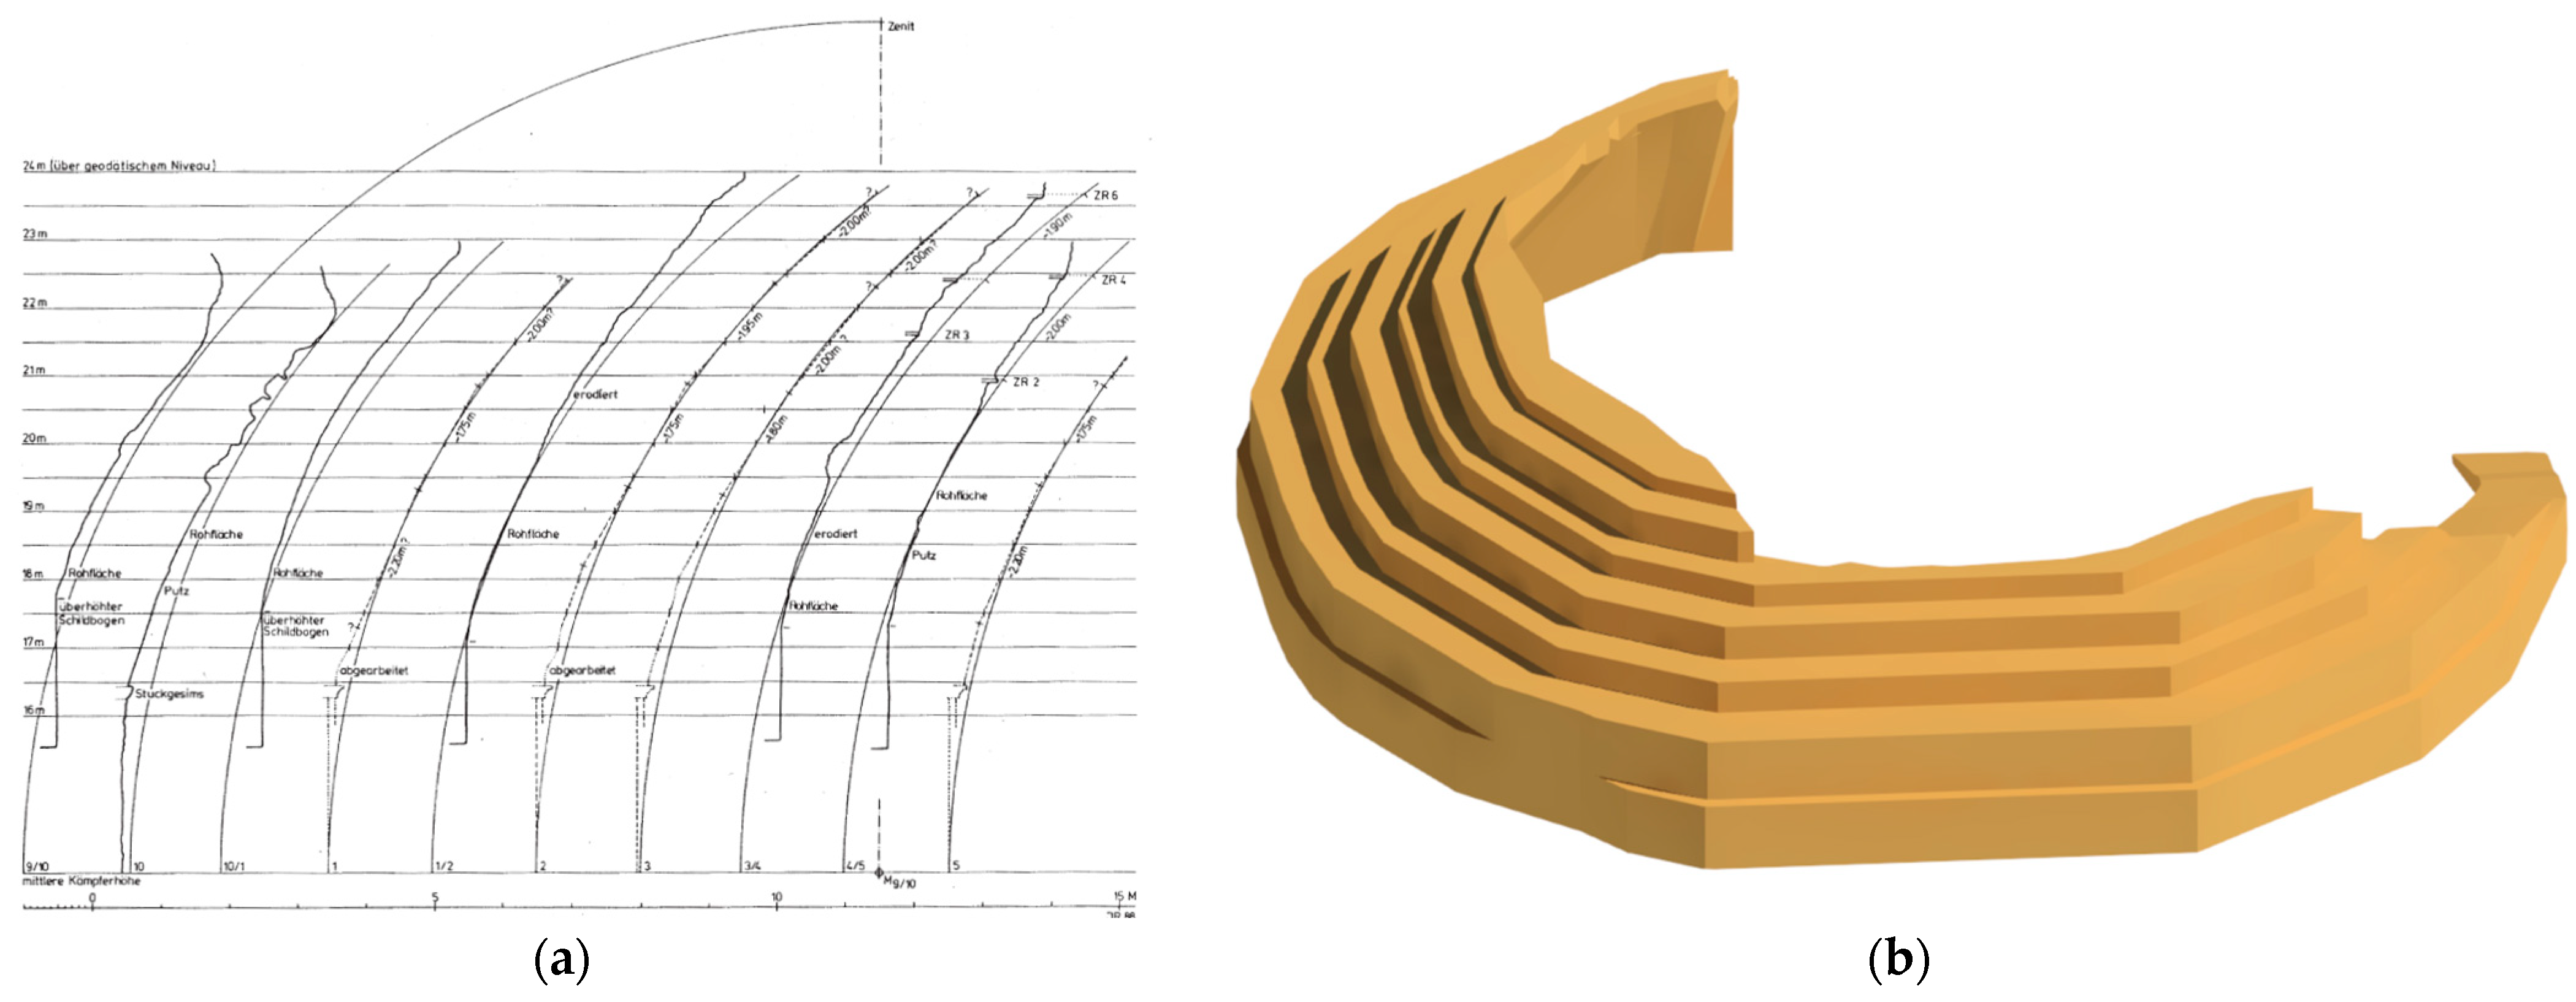
In the second stage, the architectural line drawings of the construction were imported in Revit and used as references for three-dimensional modeling of the main structure. Particular attention was paid to the reconstructed arcade in reinforced concrete (R.C.) on the second level in correspondence to niches N4 and N5. Then, the partially collapsed dome was modeled, starting from profiles represented in the cross-section of the veloidic elements reported by Rasch [
39] (
Figure 13a), which were swept and joint along the plan of the dome (
Figure 13b).
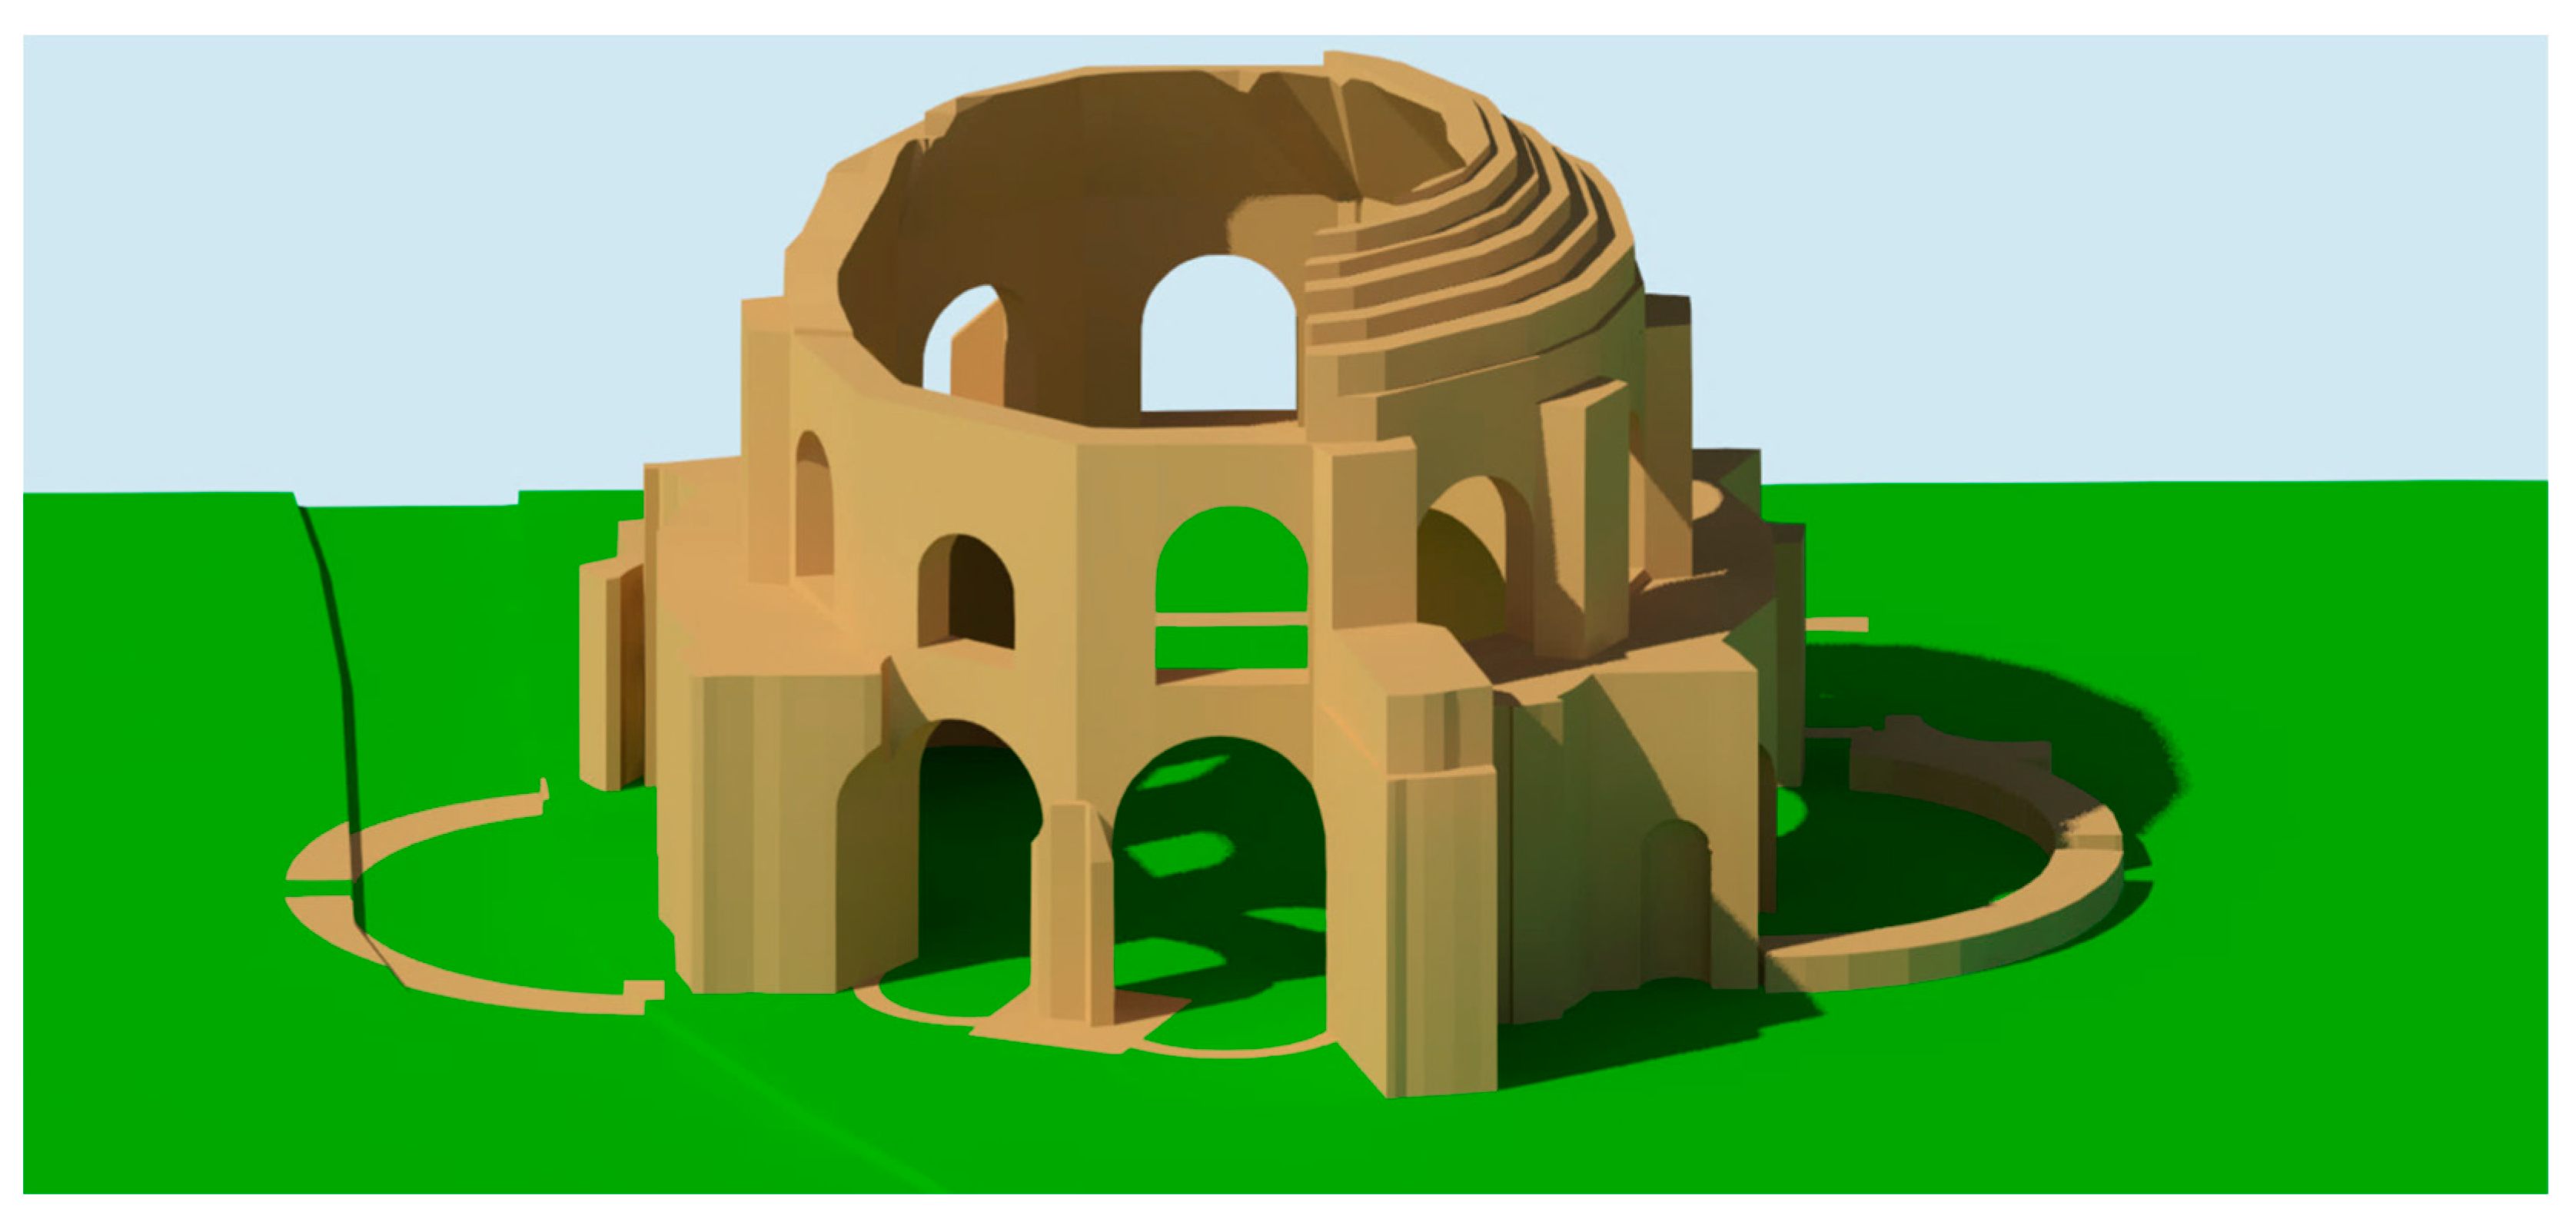
The complete HBIM of the site is reported in
Figure 14.
4.2. Finite-Element Model
The geometry and information of the HBIM were used to define the finite-element model in Midas FEA NX [
40]. The FEM was formed of 110’056 nodes and 163’636 hexahedral and pyramidal elements of variable sizes between 80 to 20 cm. The structure was modeled with an equivalent isotropic material that was substantially heterogeneous. The material was subdivided into six typologies depending on the construction period (subfoundations and foundations, original configuration, Roman stabilizing additions, 19th CE intervention, modern R.C. intervention) and differences due to the construction technique (the dome).
The mass density of the
opus cementitius was assumed equal to the average experimental results found by Giavarini and Ferretti [
25] for similar Roman constructions. In particular, an average value of about 1550 kg/m
3 was assumed for the main structure, and with respect to ancient Roman construction techniques, lighter masonry (with lower mass density) was assumed for the dome. The dynamic elastic modulus of the original structure has been defined from the sonic velocities provided by Roselli et al. [
22], who applied the well-known equation of wave transmission. The experimental results highlighted two groups of pillars with similar sonic velocities; consequently, the south masonry was evaluated using the average velocities of pillars P1, P2, P9, and P10 while the north masonry was evaluated using the average velocities of the remaining pillars, P3, P4, P5, P6, P7, and P8 (
Figure 1b). For the ancient Roman additions and the system of foundations, a modulus derived from the average of all of the experimental velocities was assumed. Being that the elements in the
opus cementitium were composed, in the majority, of cementitious material, the dynamic modulus of elasticity was correlated to Young’s modulus (static) with the relationship from Lee et al. [
41]. The material parameters employed for the 19
th CE and modern R.C. interventions were assumed with engineering judgment supported by the values suggested in the Italian code [
42] (brick masonry and C30/35).
The mass density and elastic moduli of the soil were defined using the average values from the geotechnical characterization [
33,
43].
The material parameters adopted in the modal analysis of the initial model are summarized in
Figure 15.
4.3. Model Updating
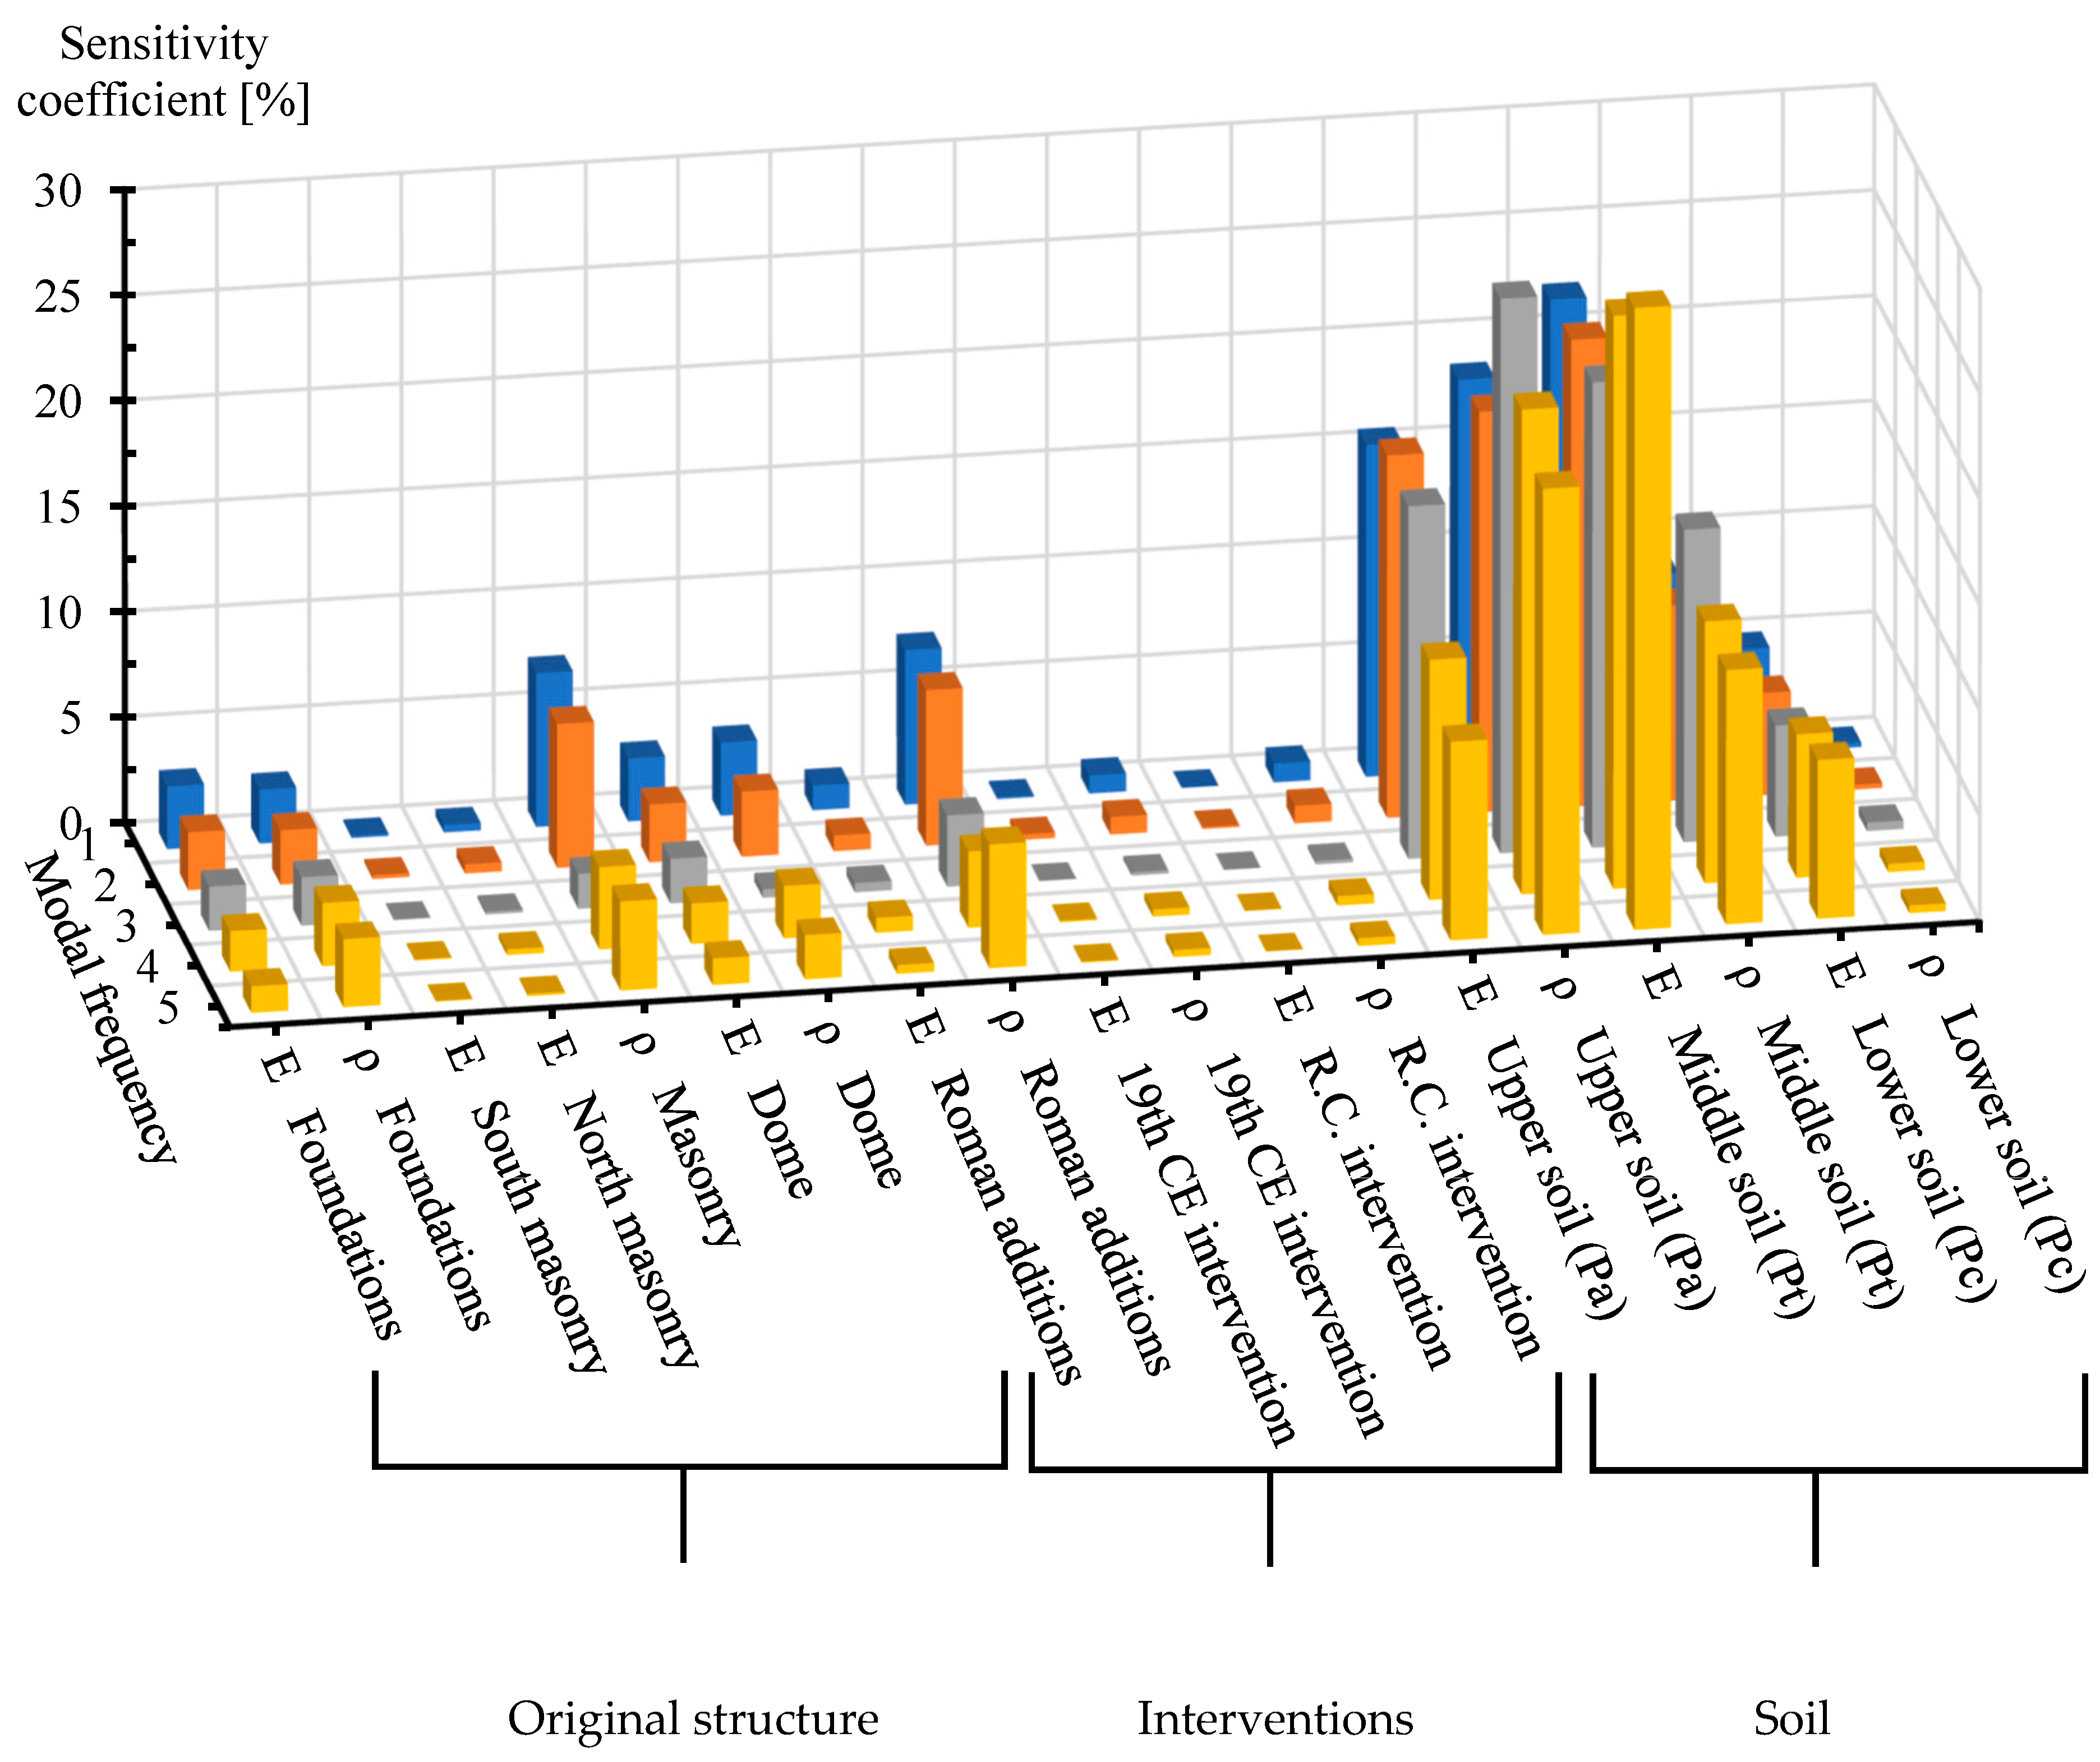
The influences of the main material parameters (Young’s modulus and mass density) on the modal features of the temple were investigated with a sensitivity analysis. Each parameter was incremented by 5% from its initial value and was related to the consequent variation of the modal frequencies. This process is described by the sensitivity coefficient defined in (1):
- -
Xj represents the j-th material parameter (Young’s modulus or mass density);
- -
represents the range of variation of the material parameter (5% of );
- -
represents the i-th output of the analysis (the modal frequency);
- -
represents the variation of the output of the analysis (the variation of modal frequency).
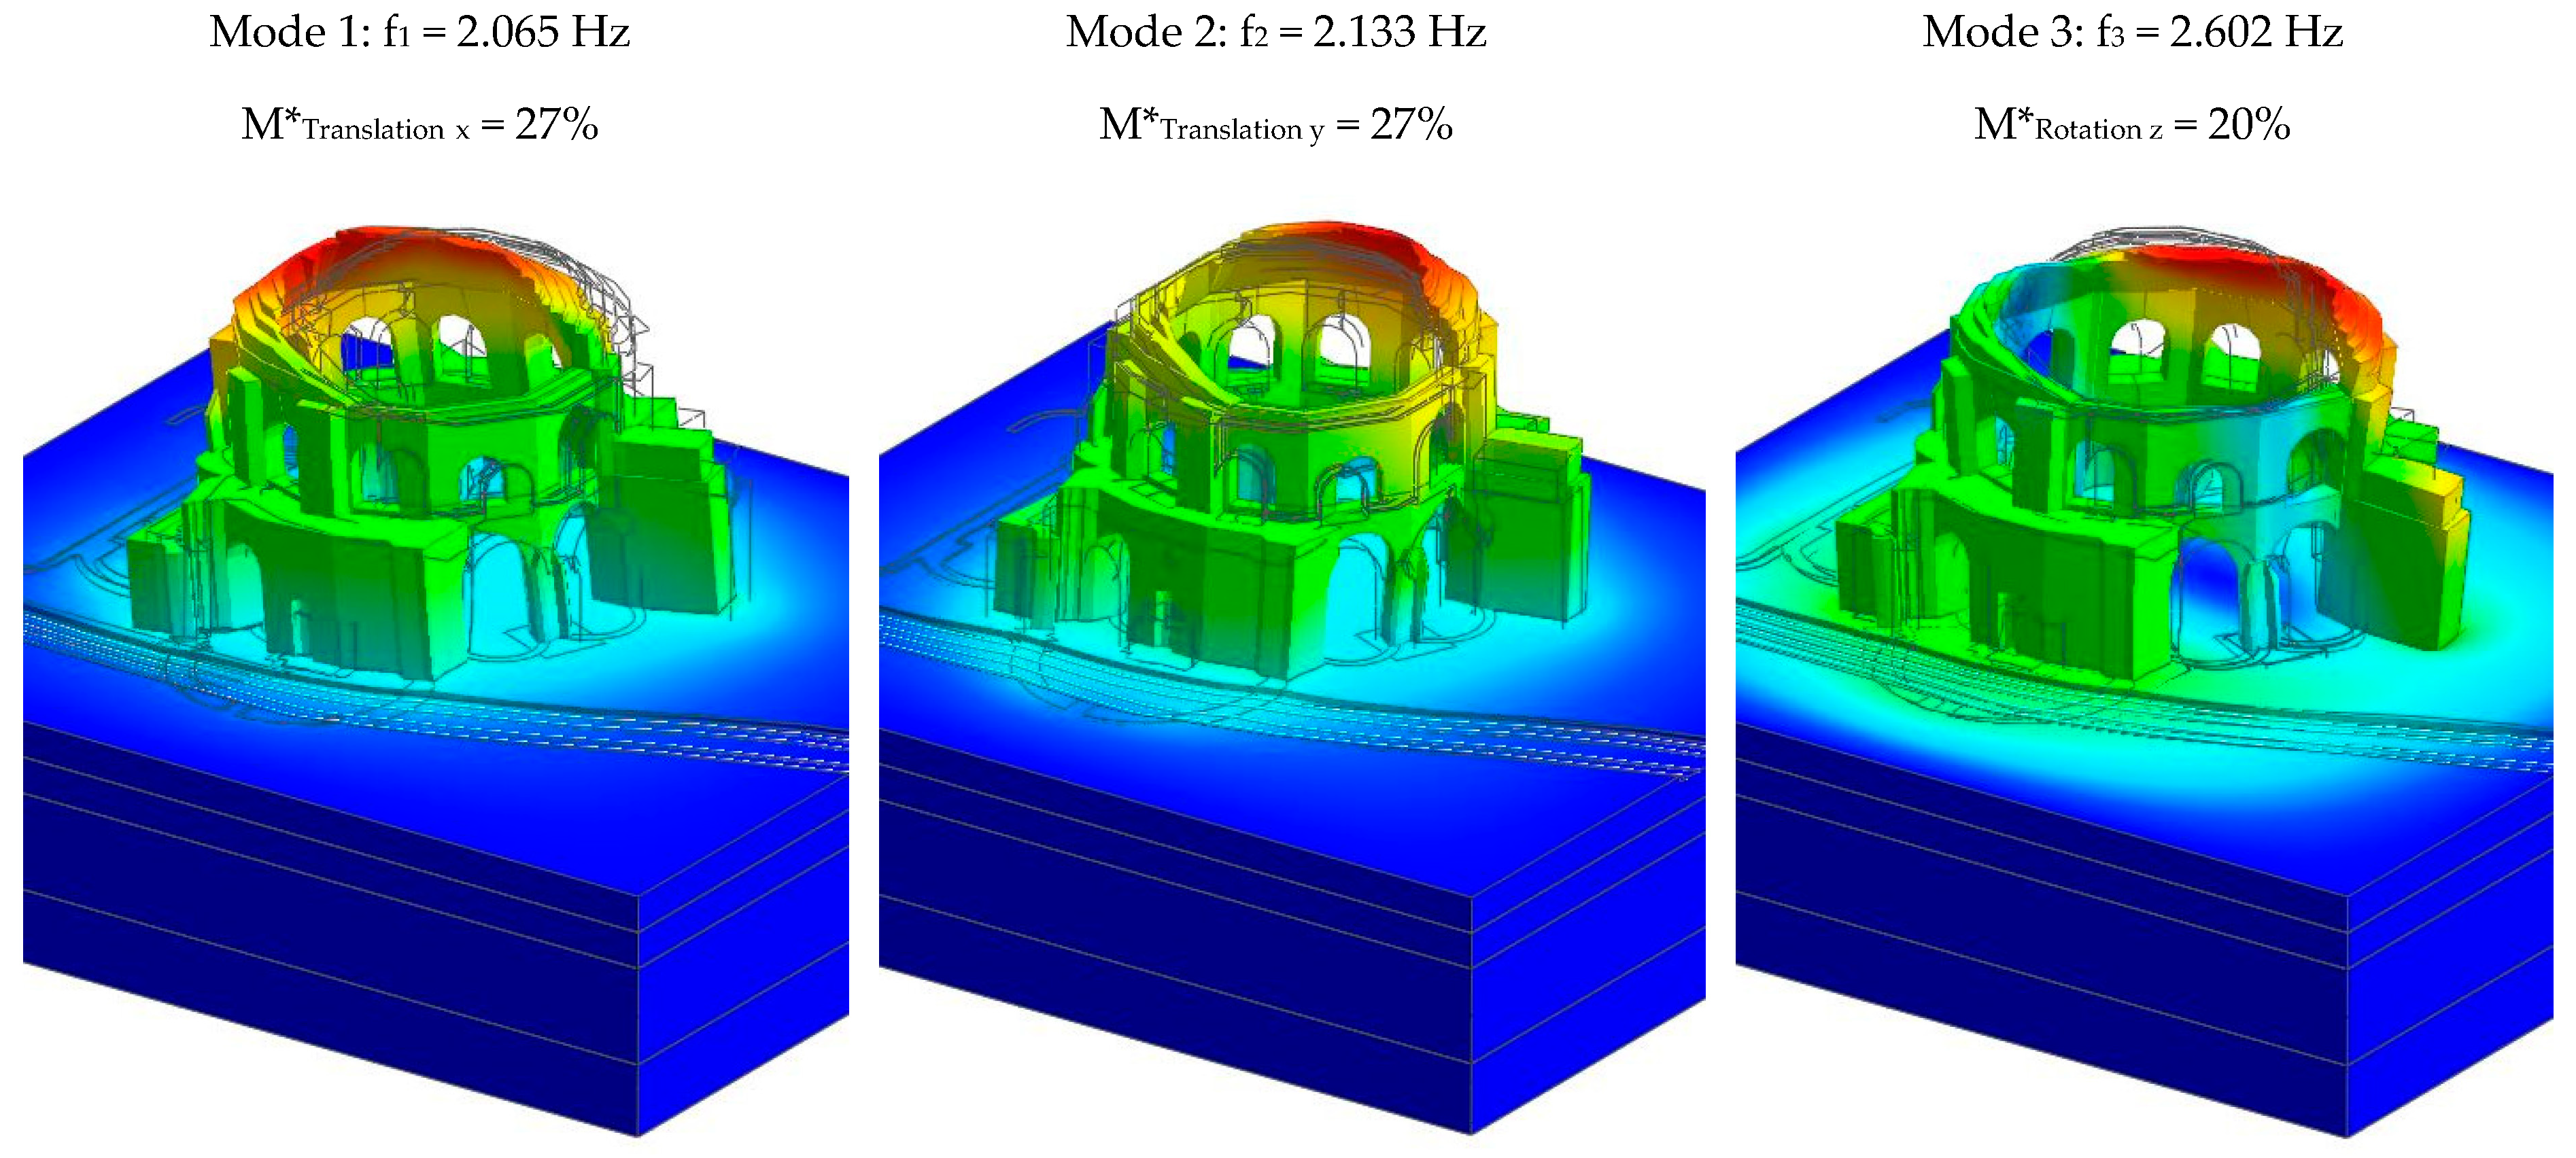
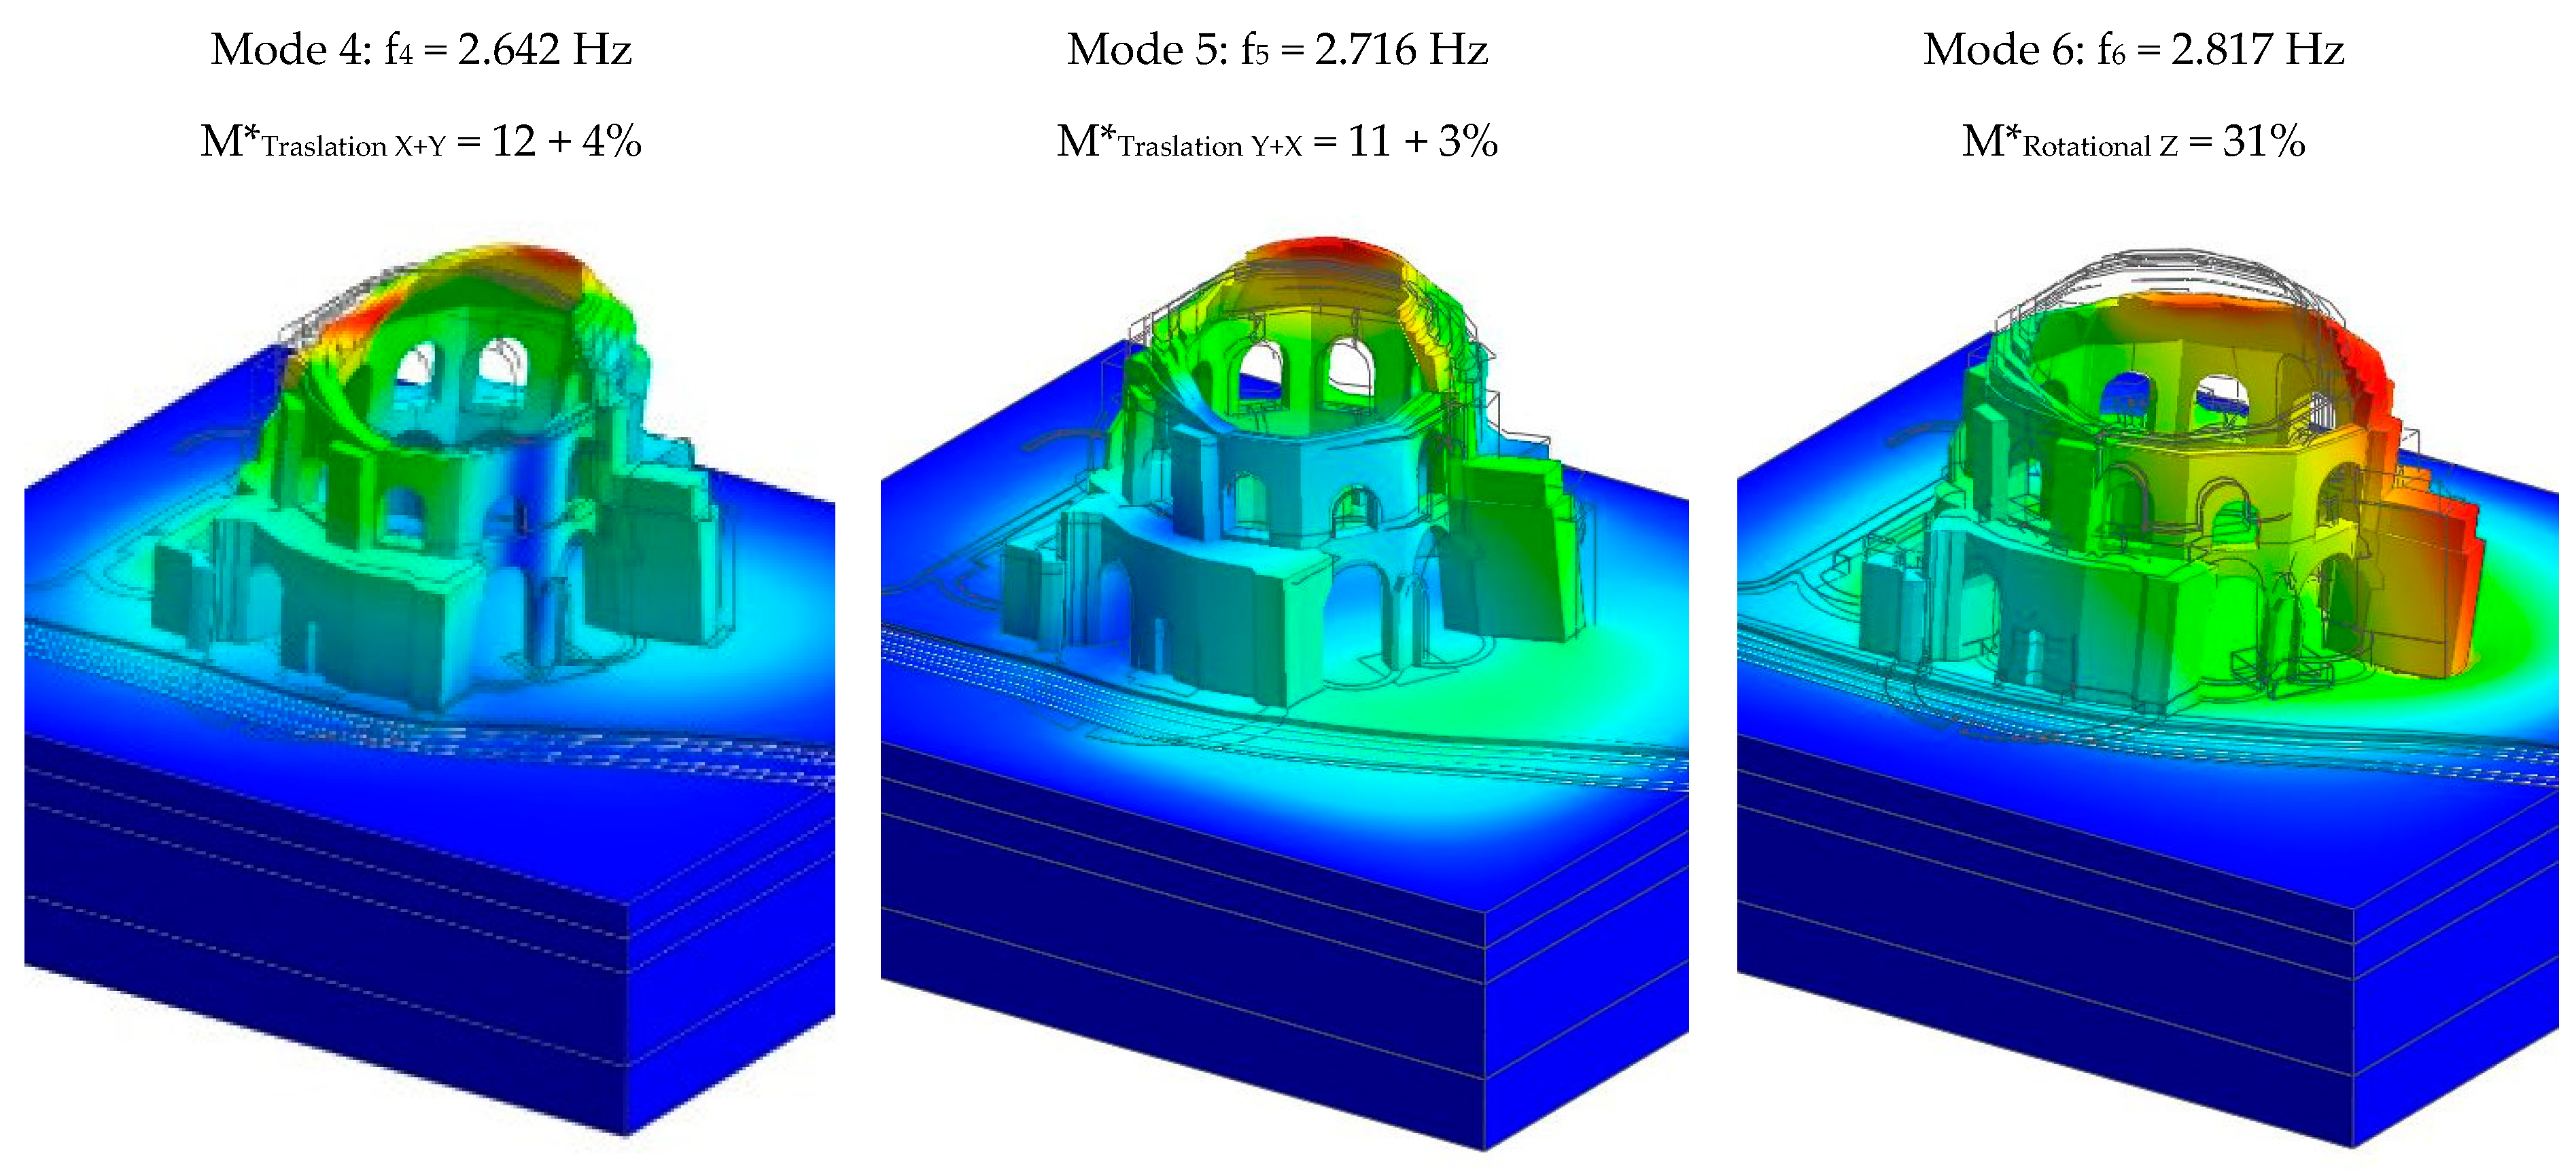
According to the eigenvalue analysis, the most significant modes of vibration were the first three modes, which contained the highest modal effective masses: 26% in the X-direction for the 1st mode, 26.2% in the Y-direction for the 2nd mode, and 21.7% torsion around the Z-direction for the 3rd mode. The sensitivity coefficients for each significant material parameter are reported in
Figure 16.
It is of interest that the soil had the largest influence on the modal frequencies, followed by the original structure (with a main role for the dome) and the mass density of the Roman additions. In general, the results for the mass density of the materials were more influential than Young’s modulus, besides the moduli of elasticity of the soil (which expressed a restraining function for the main structure) majorly affecting the modal frequencies. Being a physical quantity, mass density is not affected by large uncertainties or variations from defined reference values. On the other hand, being a mechanical elastic property, Young’s modulus is more affected by variations produced by external factors: for example, damage, material morphology, and environmental parameters. Soil is a highly heterogeneous medium, and its mechanical properties vary significantly with depth and water content. This aspect, along with transmission of dynamic forces between soil and structure, is manifested in the phenomenon of the soil–structure interaction (SSI). Considering the complexity in modeling of SSI and the intrinsic variability of geotechnical parameters, a parametric analysis was carried out to calibrate the modulus of elasticity of the soil in order to reduce the gap between the numerical and experimental modal frequencies.
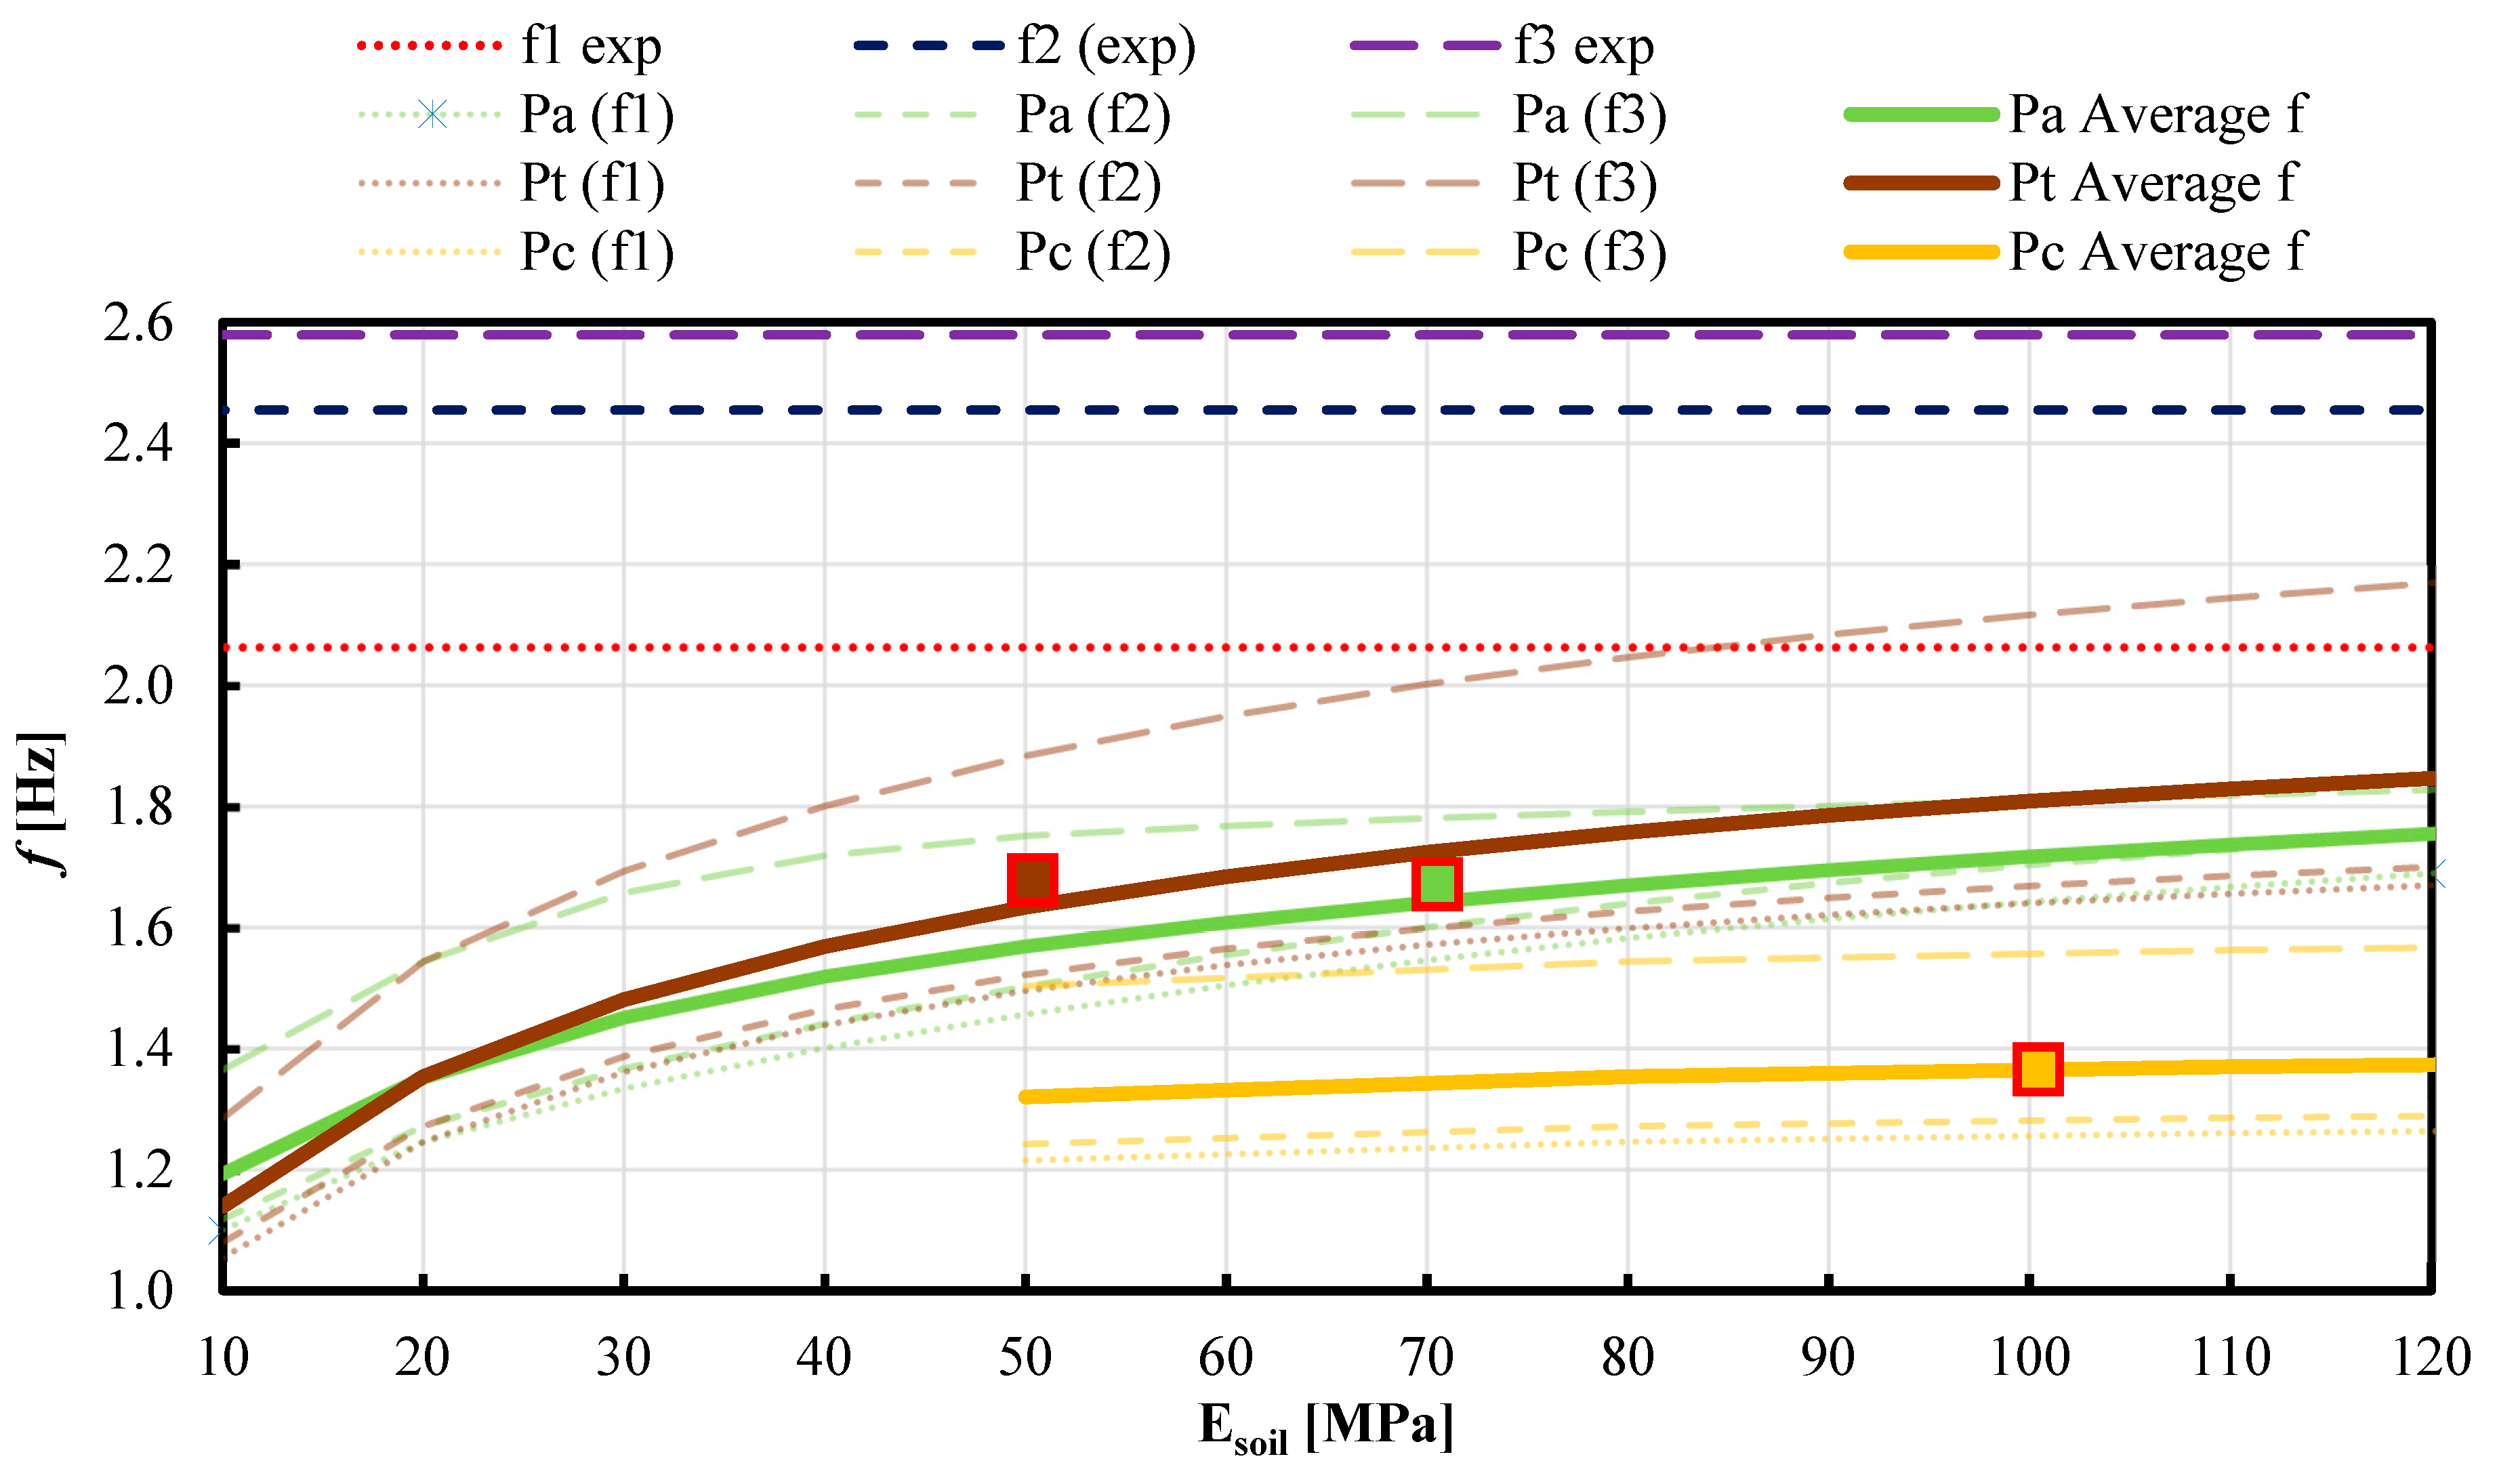
Different eigenvalue analyses were performed by varying the moduli of elasticity of the three soil layers to evaluate the effect of soil stiffness on the first three modal frequencies (
Figure 17). Similar trends of variation were observed for the upper (Pa) and middle (Pt) layers, while the lower layer (Pc) minorly influenced the modal frequencies (as confirmed with the sensitivity analysis). The parametric analysis highlighted underestimation of soil stiffness in the FEM, considering the proposed modeling of the SSI. Thus, the initial values of the modulus of elasticity were incremented considering the soil characterization reported by Ventriglia [
43] for the same soil typology in proximity of the site.
The numerical modal analysis provides the dynamic properties of the structure by finding the eigenvalues of the characteristic system of equations composed of the mass and stiffness matrices. Being this a mathematical problem, the modal frequencies are incrementally defined from the lowest to the highest eigenvalue, thus it is was possible to encounter them in mismatched relations to the experimental modes. On the other hand, it is also possible to miss identification of some modes during the dynamic monitoring, when the setup of the accelerometers is not optimally positioned (to properly detect structural vibrations) or in case of local modes, which would have required a greater amount of energy to be excited (not available with the ambient vibrations). For these reasons, the correlation between the experimental and numerical dynamic features was evaluated with the modal assurance criterion [
24], and the relative frequency error is displayed in
Table 2 and
Table 3The numerical modal deformation of mode 2 did not sufficiently match any of the experimental modes; thus, it was discarded. The optimum correlation between the models was found between experimental modes 1, 2, and 4, with numerical modes 1, 3, and 5. This consideration agrees with the medium correlation identified between experimental mode 2 and mode 3, which represents a similar modal behavior of the structure, thus possibly assumed to be a single relevant feature.
The model parameters were finally calibrated with the Douglas–Reid (DR) approach. A system of quadratic functions was introduced to approximate the numerical modal frequencies and deformations around the selected reference values of the structural parameters, expressed in (2):
- -
i represents the i-th target parameter;
- -
K represents the k-th structural parameter of the model;
- -
represents the structural response of the approximated model;
- -
, , and are the 2N+1 coefficients of the interpolating quadratic function.
The algorithm “find minimum of constrained nonlinear multivariable” was implemented to minimize the objective function (3) that expresses the gap between experimental frequencies (
f EXP) and modal deformation,
, with respective numerical results.
The field of optimization was constrained by defining the upper and lower bounds of variation of each parameter. Mass density is generally affected by minor deviation and uncertainty from reference values; thus, it was assumed to have a variation range of ±10%. The moduli of elasticity of the original structure were set with a variation range of ±20%, since there are available experimental data on the pillars (sonic test). The moduli of elasticity missing any experimental data (dome, Roman additions, and foundations) were set with a range of variation of ±40%. The moduli of elasticity of the soil, which were previously calibrated during the parametric analysis, were set with a range of variation of ±30% (being influential parameters for the modal features).
The 19th CE intervention and the modern reinforced concrete reconstruction were discarded from the updating of the parameters because of their minor contributions to the modal features (as highlighted by the sensitivity analysis).
Optimization of the parameters was performed with a Matlab [
44] routine, which returned the values reported in
Table 4 and
Figure 18.
The dynamic features of the final updated model are reported in
Figure 19.
4.4. Nonlinear Dynamic Analysis
Generally, structural monitoring records significant quantities in punctual locations where the most meaningful effect is expected; however, in historical masonry constructions, when multiple construction periods and interventions overlap, the heterogeneity of the materials may locally affect the structural response. This aspect was investigated with two different nonlinear dynamic analyses related to the experimental data collected during dynamic monitoring in two locations: node O at the base and node I at the top (
Figure 8 as reference).
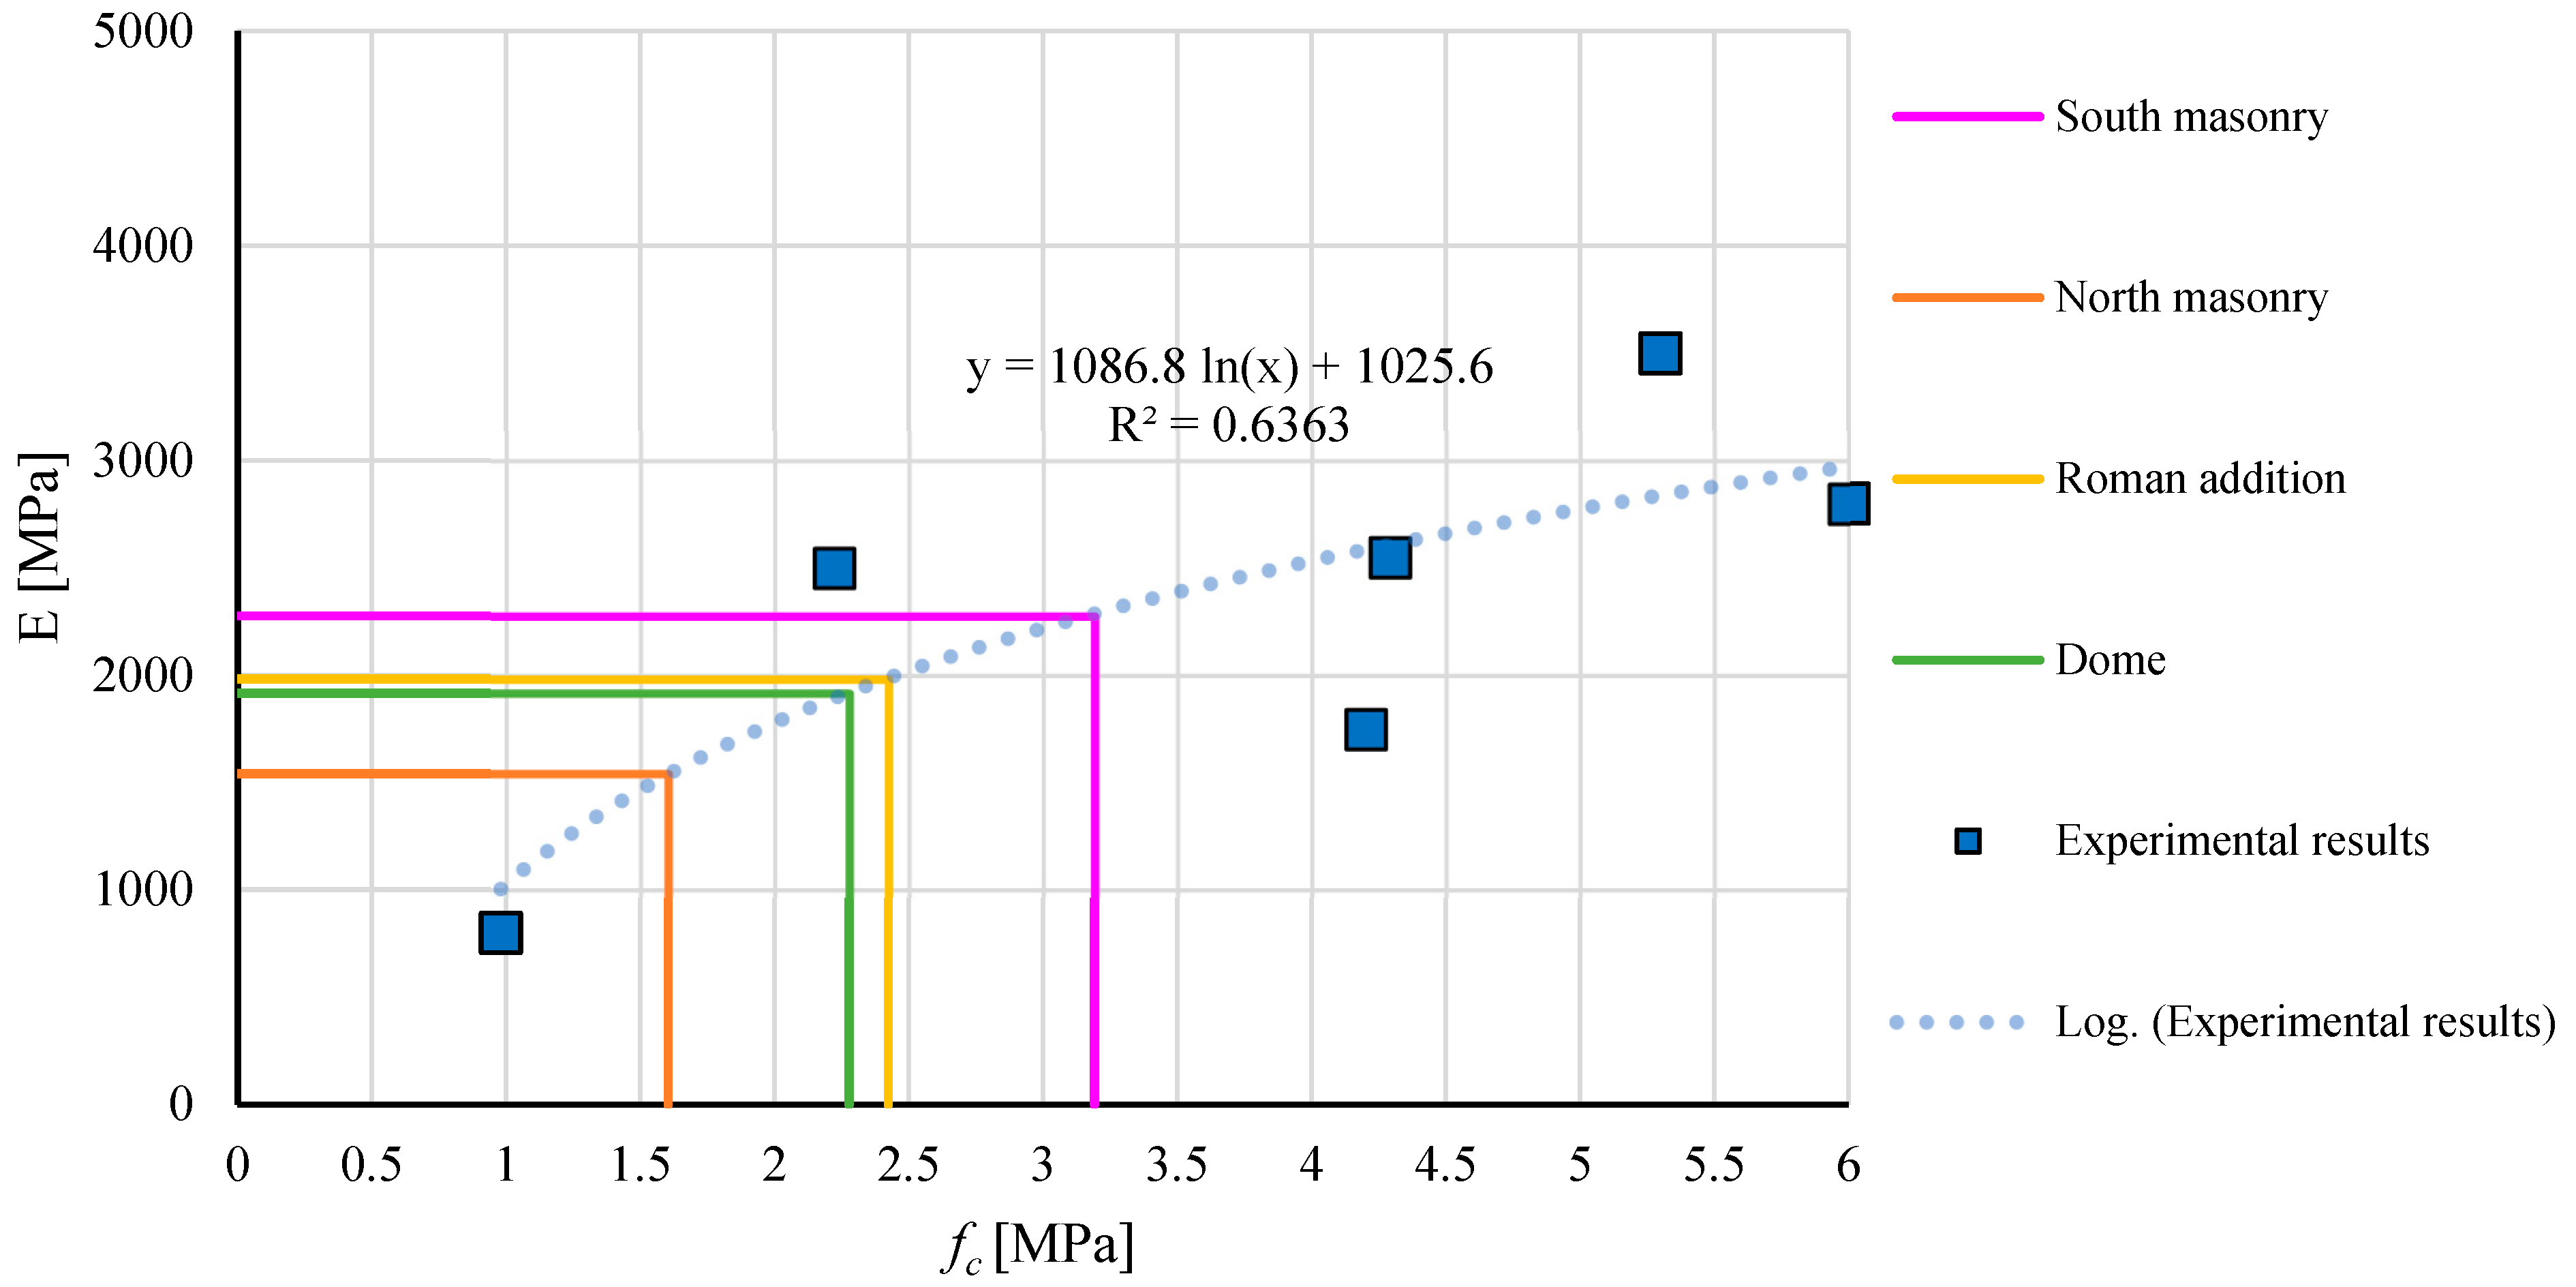
The mechanical parameters in the elastic field were calibrated with the results of the operational modal analysis. Since there is not any experimental data on the temple to define the material in the plastic field, it was considered the result from the mechanical laboratory tests conducted on ancient
opus caementicium samples by Giavarini et al. [
25]. The six drilled core samples extracted from Nerva’s warehouse and Maxentius’ Basilica reported average values of modulus of elasticity and mass density comparable to the so-called Temple of Minerva Medica (three samples from Villa Adriana were excluded because much greater average values of mass density, 1760 kg/m
3, and elastic modulus, 5970 MPa, were reported). A logarithmic statistical relationship was found between the compressive strength and the elastic modulus, as shown in
Figure 20. The coefficient of determination (R
2), equal to 0.636, expresses a good correlation between the variability of experimental data and the statistical model; thus, starting from the previously defined moduli of elasticity, the compressive strength of the
opus caementitium was derived.
The tensile strength was assumed from the average ratio between compressive and tensile strength provided by Giavarini et al. [
25]; according to the laboratory testing, it was equal to 6.26. The FEM considers a homogenized material in which compression has a typical parabolic–isotropic–elastoplastic model and tension is simulated using smeared crack formulation by adjusting stress and stiffness at the integration point without reconfiguring the mesh (the bandwidth parameter, based on the size of the element, is reflected in crack behavior to avoid mesh dependencies). Cracking occurs when stress passes the yield surface, the stress is returned using an implicit backward Euler method, and the direction of the maximum principal strain is the direction of the crack. This direction is stored to simulate this anisotropy with cracking in subsequent analyses. The FEM uses the orthogonal fixed crack model, in which any crack shall propagate in a direction orthogonal to the existing crack direction (up to three directions because of the three-dimensional model). When the elastic strain increases in the direction of the crack (after cracking has occurred), the material behaves as damaged elastic. The model considers the crack closed when in compression (there is no reduction in the modulus of elasticity).
The value of the
opus caementicium fracture energy in compression was derived from the relationship recommended by Lourenco and Gaetani [
45],
based on the data of Model Code 90 [
46] for concrete-like materials. The value of the tensile fracture energy (based on Model Code 2010 and the Lourenco and Gaetani database) was defined from the formula
. The reinforced concrete intervention and the soil were assumed to be linear elastic materials, since the solicitations under study were not sufficient to reach the plasticization of these materials.
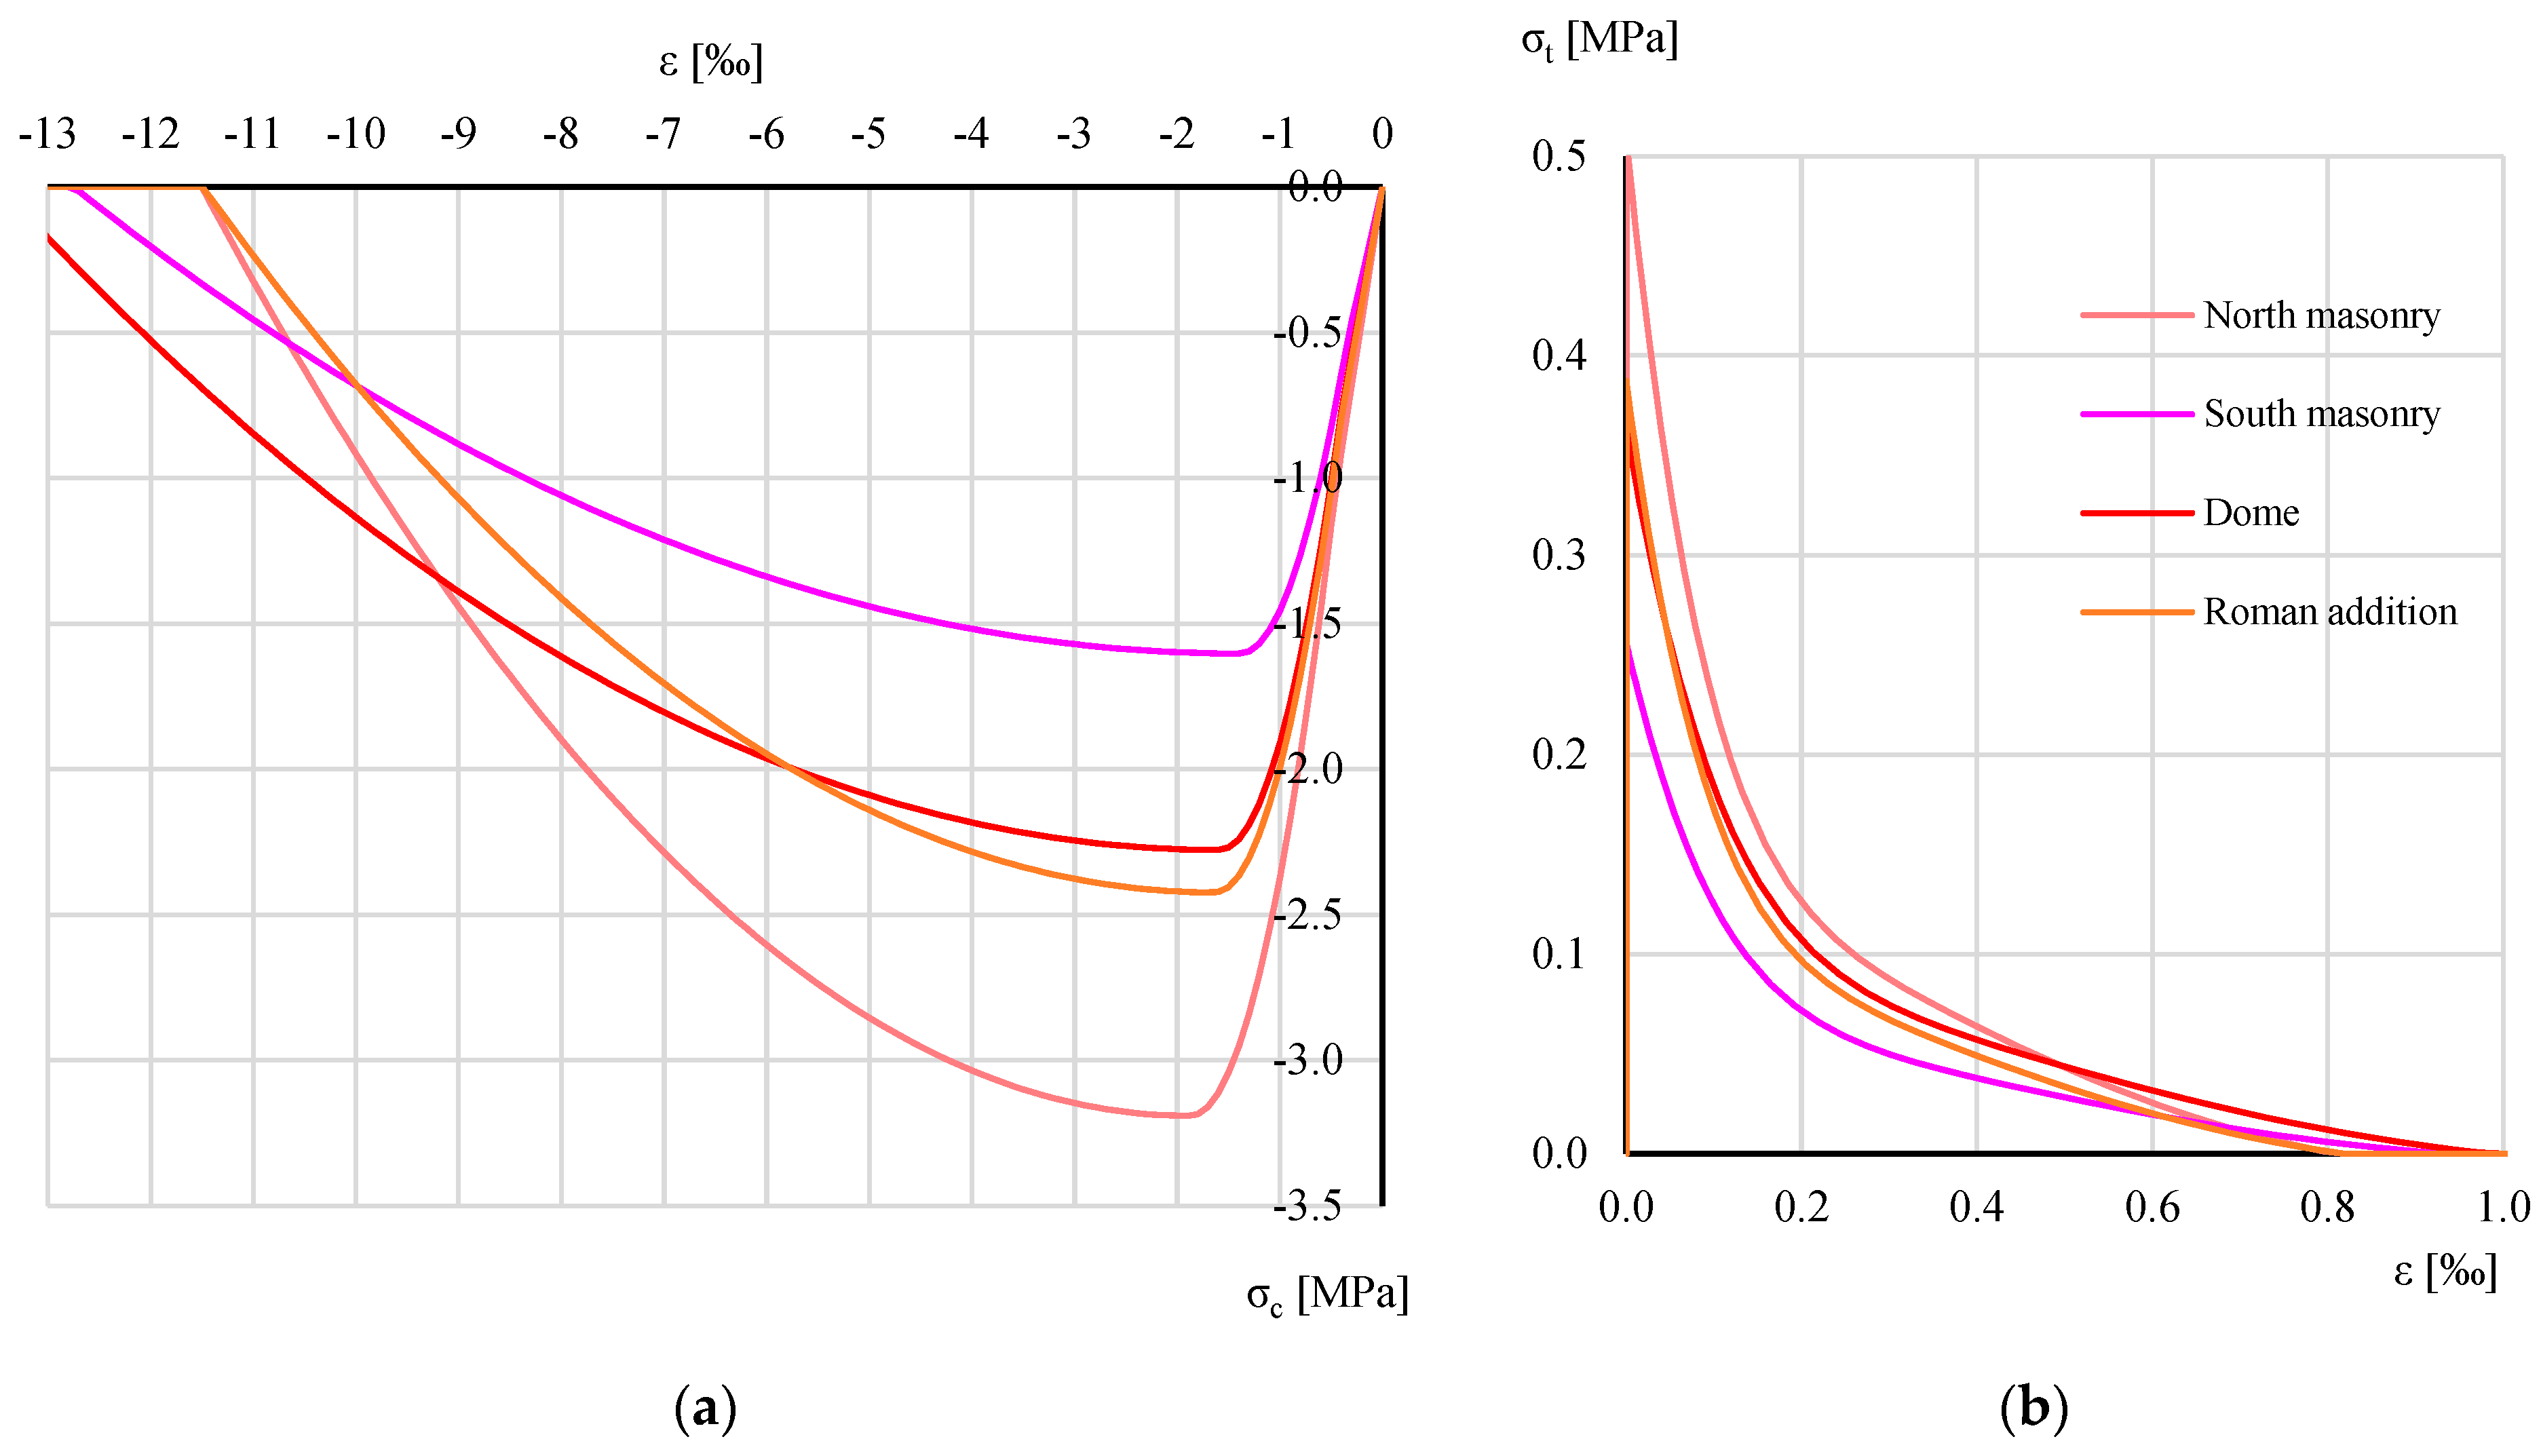
Table 5 summarizes the nonlinear mechanical parameters for the different portions of the model. The compression behavior follows the parabolic curve defined by Feenstra [
47]; in tension, the exponential relationship defined by Hordjik is assumed [
48], and the derived nonlinear stress–strain curves of the
opus caementicium are reported in
Figure 21.
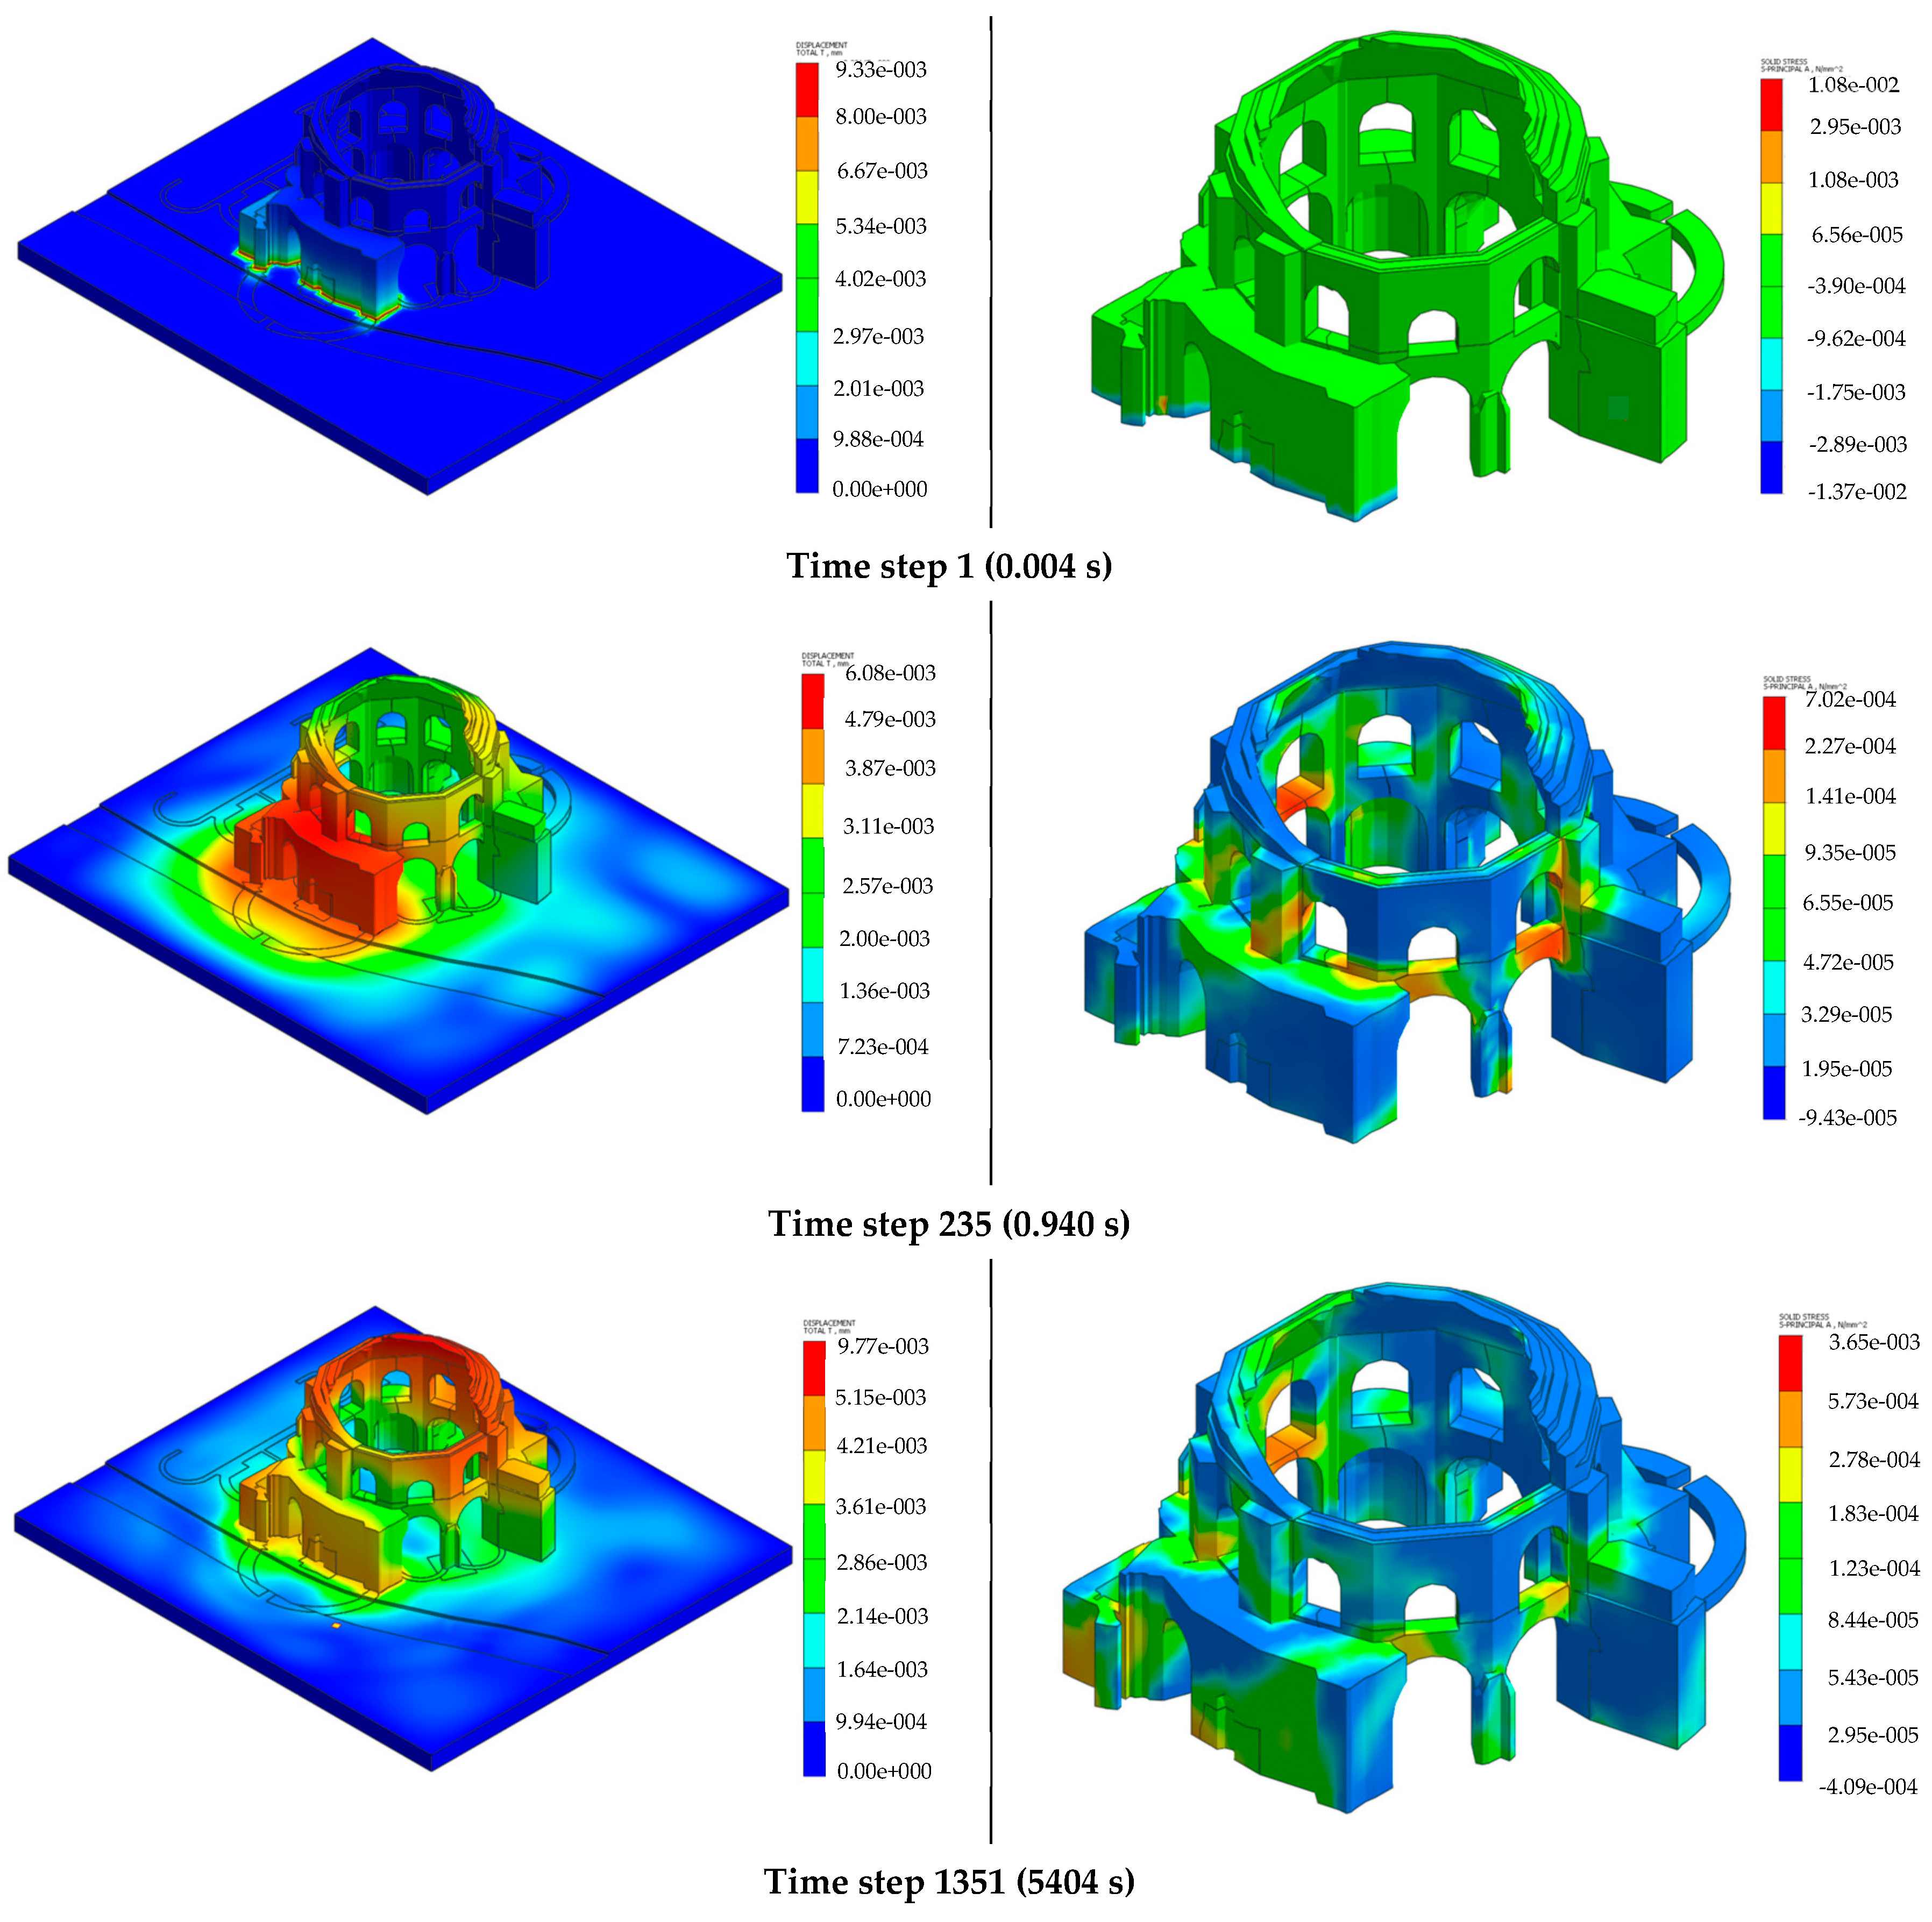
Moving-load analysis (MLA) is a type of analysis generally used on bridges and viaducts to simulate the dynamic effect of vehicles on a structure. The analysis consists of implementation of the dynamic load of a vehicle by applying various changing load conditions, at a constant velocity, as a set of quasistatic forces along a path. In this case, the load was defined as a set of 40 vertical forces (the total self-weight of the tram, inclusive of the passengers, was equal to 500 kN) applied on the two rails for the whole length of the tram (30 m), traveling at 15 km/h (the tram reported an average velocity of 15 km/h in the section of interest, probably due to a local regulation). The moving-load analysis considers the contribution of soil in stress propagation and SSI. This analysis was carried out with a time step of 0.004 s for a duration of 15 s (a total of 3750 steps) to properly detect the dynamic contributions of the main modes of vibration.
Energy dissipation in structural systems is often nonlinear; nonlinear damping is the dominant source of nonlinearity in several systems and often increases with excitation level.
The damping of the structure was formulated as classical Rayleigh damping, with a linear damping coefficient proportional to the mass and a cubic damping coefficient for stiffness set on the first and second experimental modal frequencies. The material damping was also considered to be 3% in all of the materials.
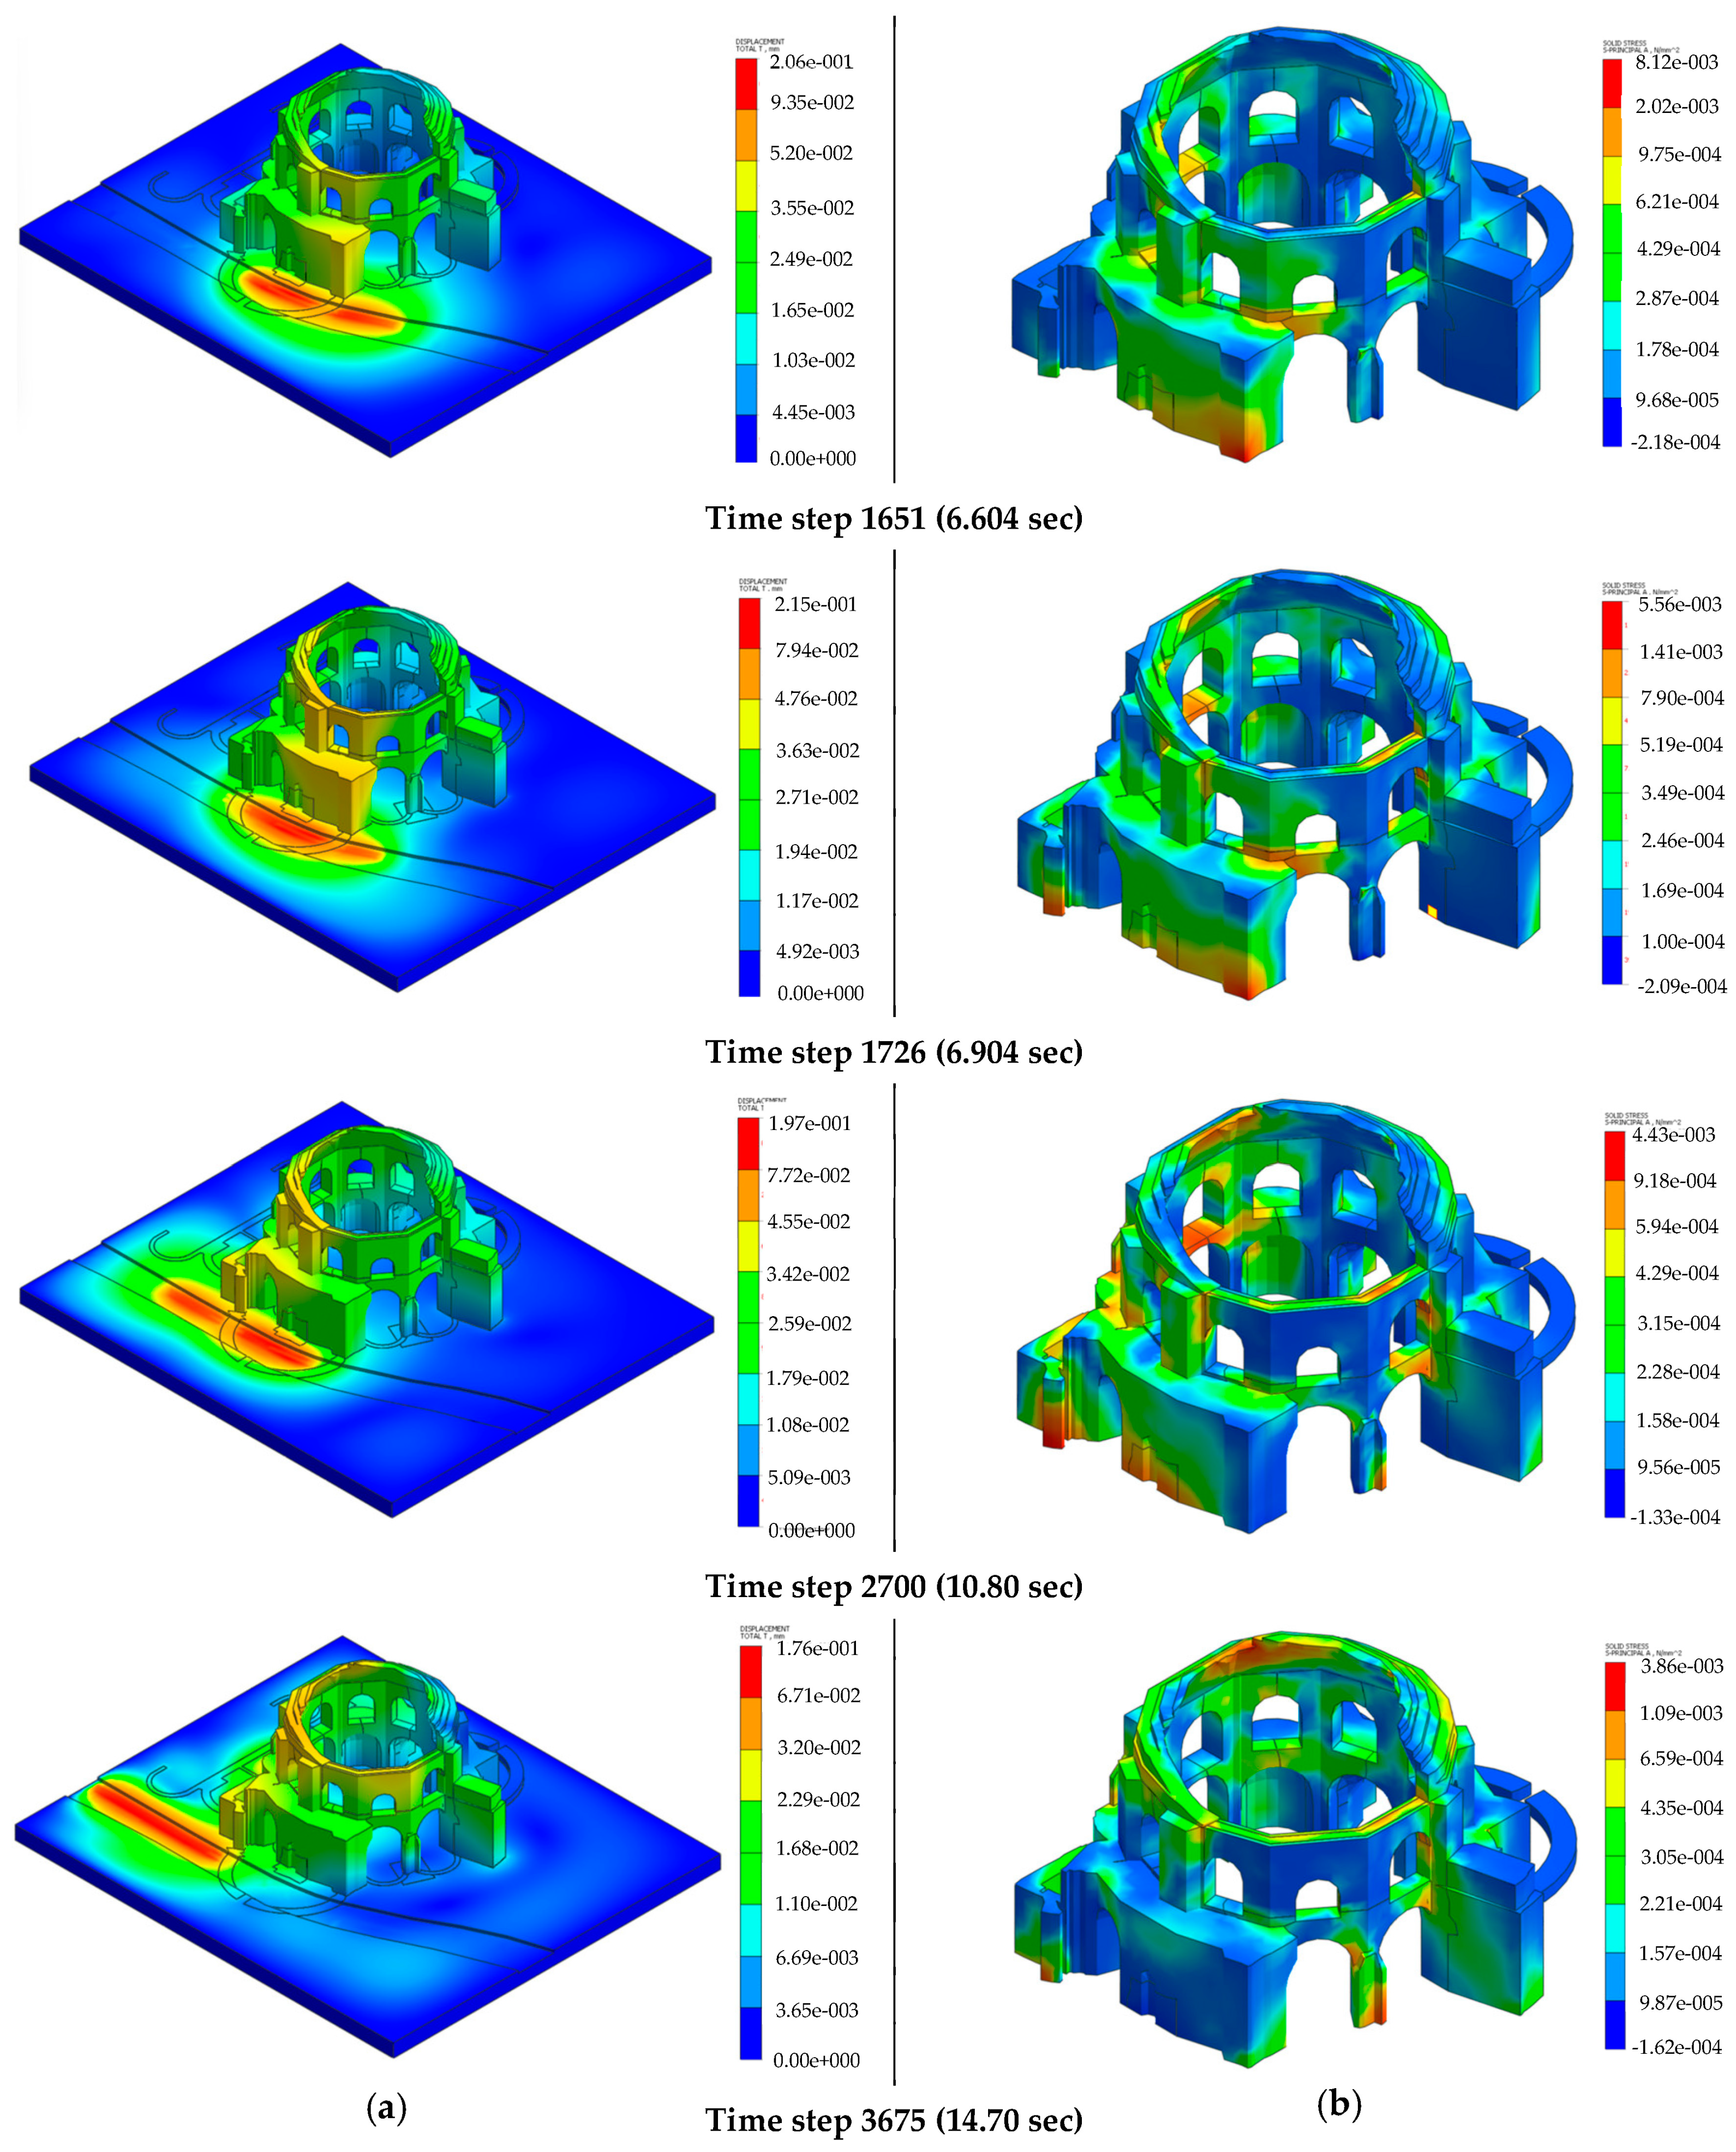
Figure 22 reports the results of the moving-load analysis in terms of displacement and principal tensile stress for the most significant time steps.
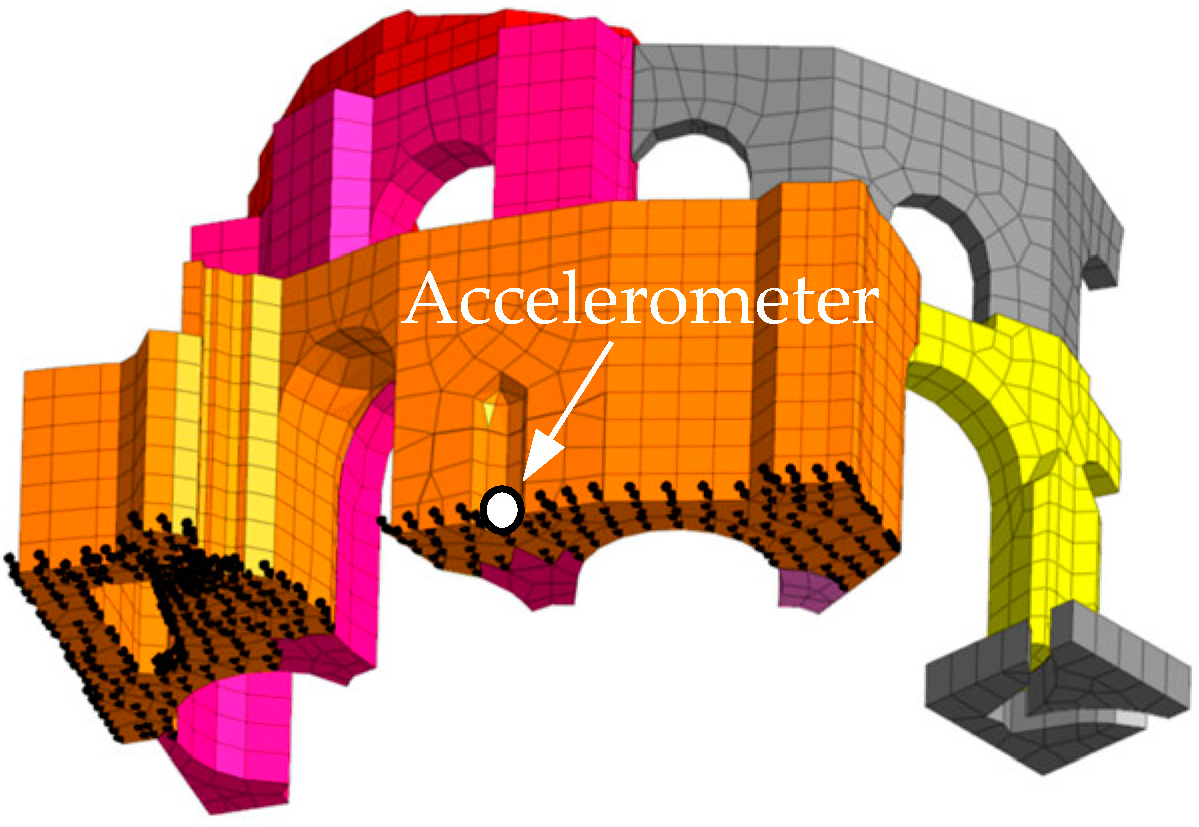
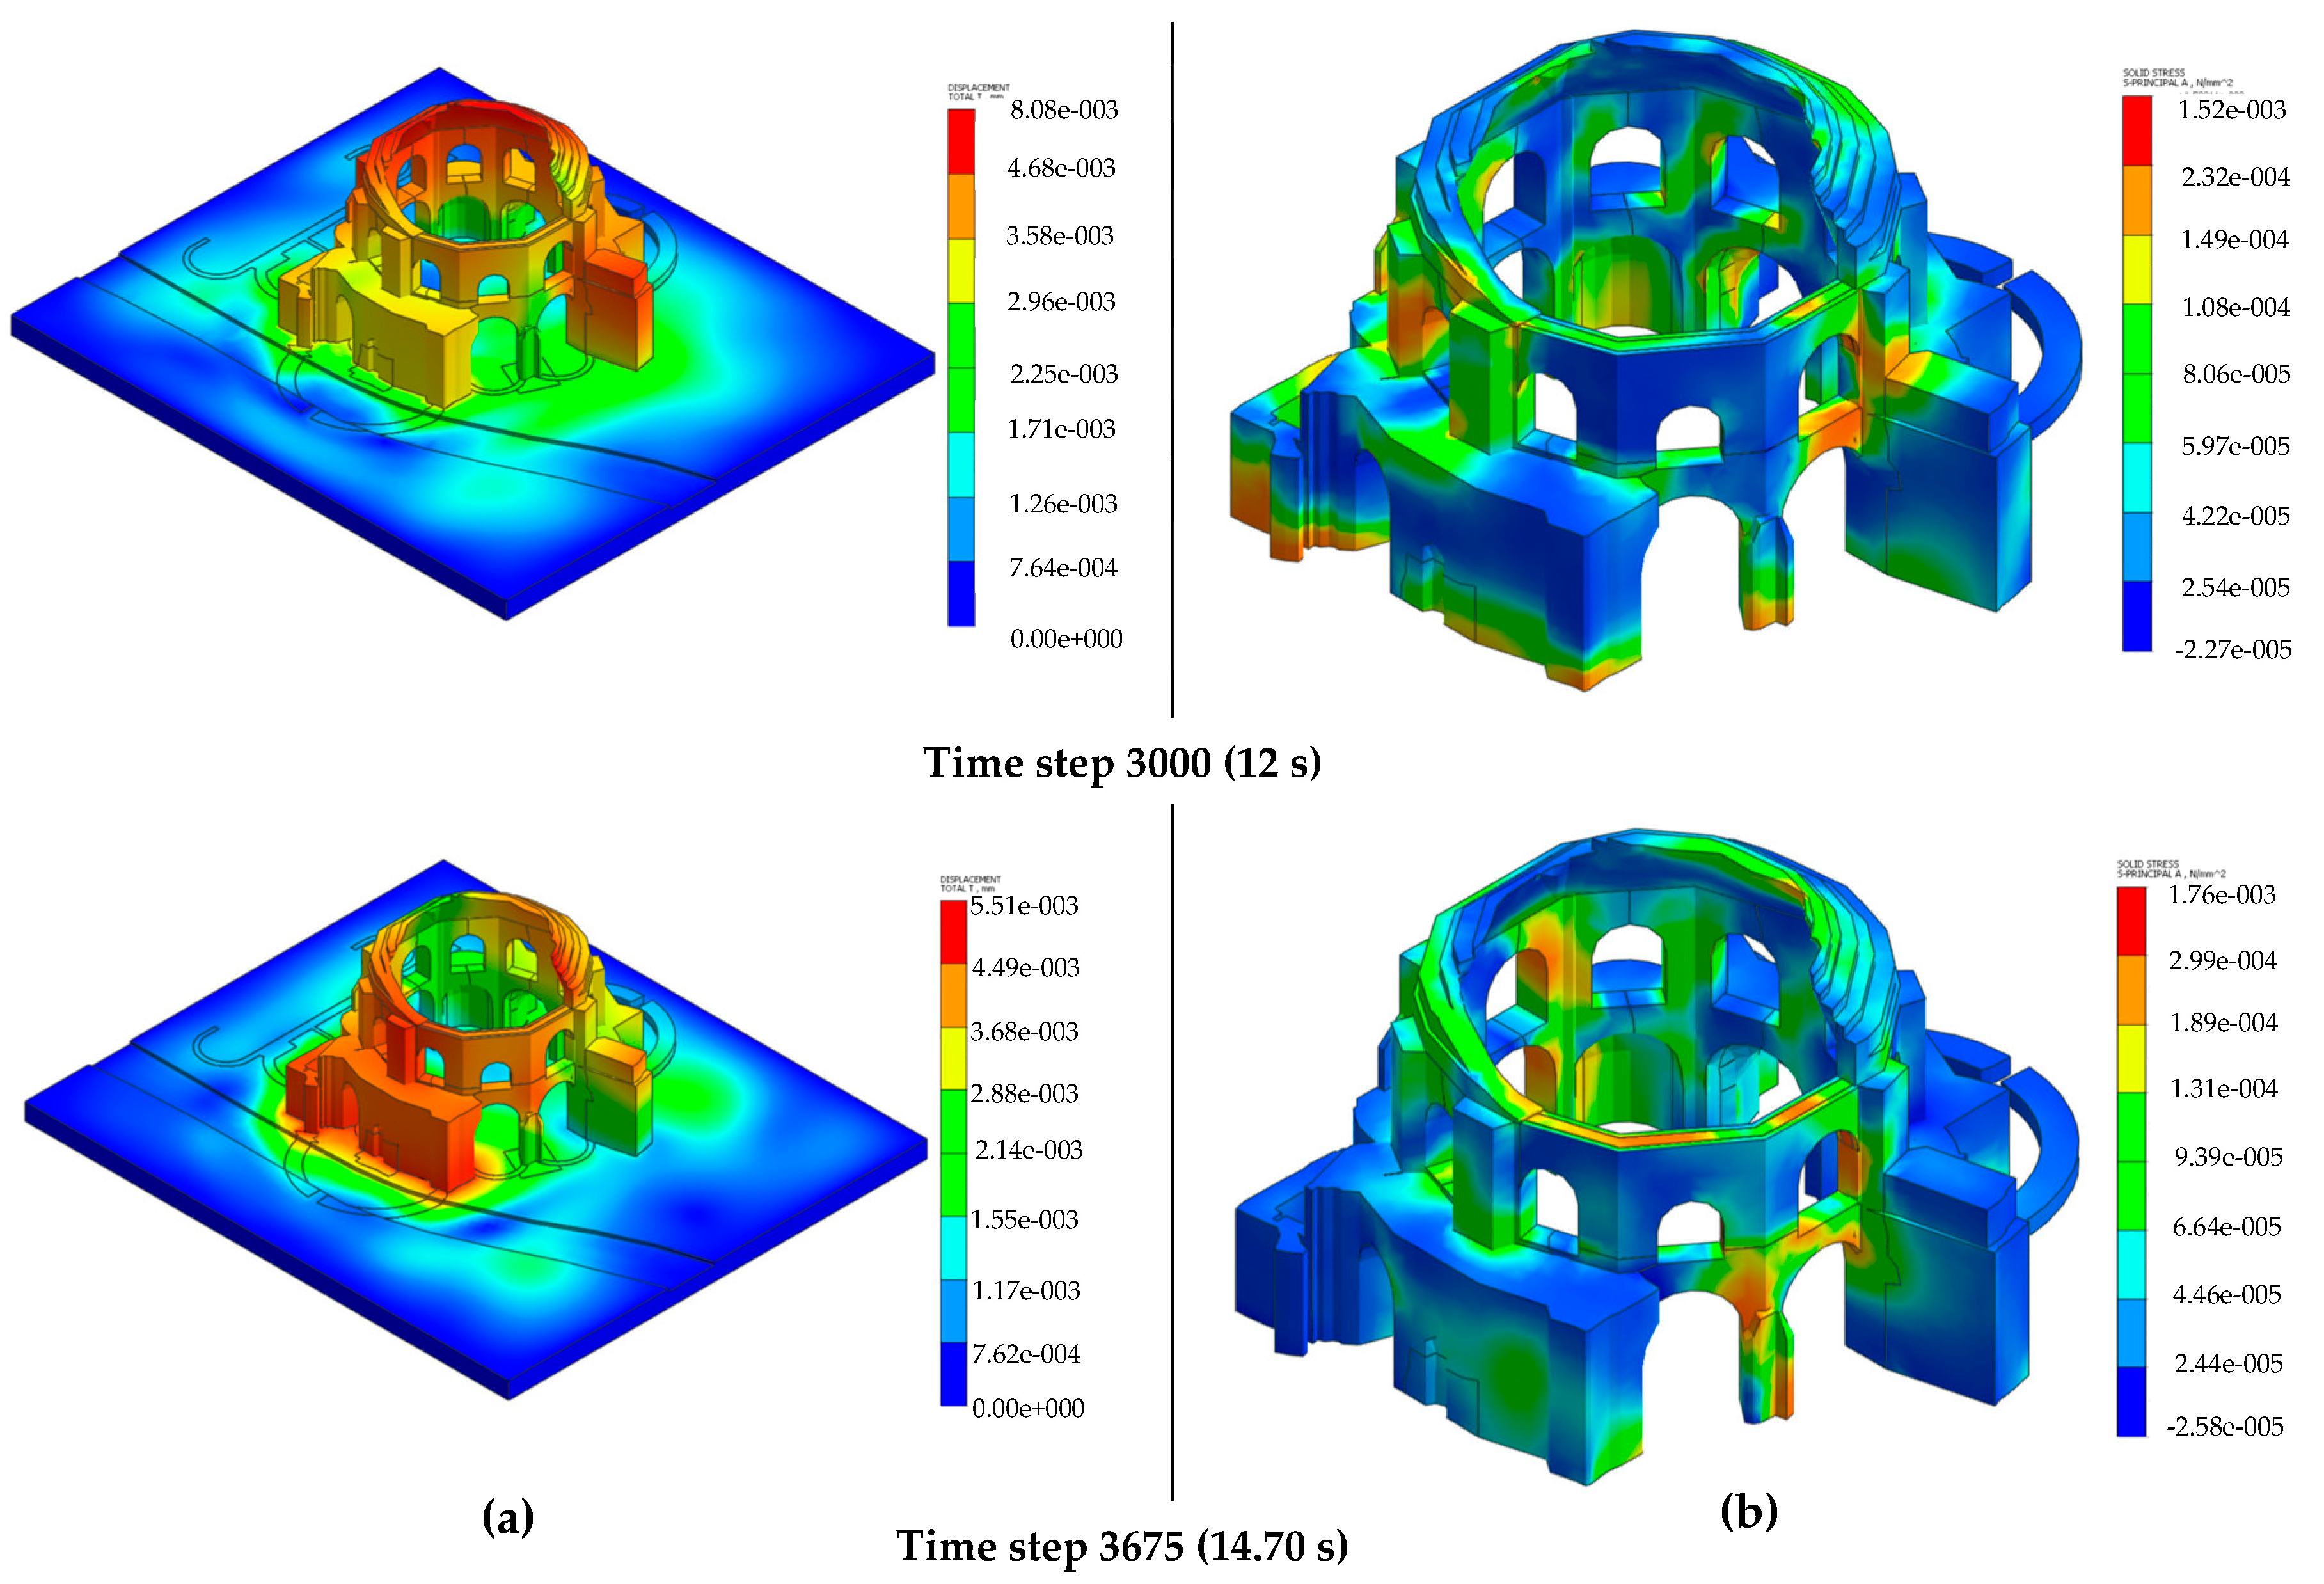
As a basis for comparison, a nonlinear time-history analysis (NLTHA) was also considered by setting of the same parameters (time step, duration, damping) as the MLA. The time history simulated the dynamic load of the tram by dynamically applying, at the base nodes of the structure, the three-dimensional displacement monitored by the accelerometer in node O during the tram passage (the displacement as the double integral of the recorded acceleration). The dynamic equilibrium equation in nonlinear time-history analysis uses the Hilber–Hughes–Taylor method [
49] (a general form of the Newmark method) as implicit time integration to calculate the convergence solution for each time step using the nonlinear finite-element solution: a method of converging accumulated incremental solutions from iterative calculations for the correct solution.
Figure 23 shows in white the position of the accelerometer that recorded tram-induced vibrations and in black the nodes of the model where displacement time history was applied.
Figure 24 shows the results of the nonlinear time-history analysis in terms of displacement and principal tensile stress for the most significant time steps.
5. Comparison of Results and Discussion
In this study, the significant contribution of the numerical simulation was the representation of the stress state of the structure, which is generally complex to detect experimentally, and if the numerical model is properly calibrated, it returns quite reliable results, at least in terms of maximum stress concentration. In both of the analyses, the structure results particularly stressed the north (between P4 and P5) and south (between P10, P1, and P2) arcades on the first level (
Figure 1 as reference). In the MLA, the northeast portion of the temple was barely affected, while in the NLTHA, the vibration affected most of the structure (even if the input were assigned at the base node of the southeast portion). This result is understandable because in the MLA, the load on the rails interested, in the first place, the closest portion of the temple located at 4.5 m, and being that the soil was interposed between the action and the structure, this operated as a damping medium and significantly reduced the dynamic action on the farthest portion of the temple (the northeast side).
Regarding the magnitude of the stress, both of the analyses returned maximum principal tensile stresses of the order of 0.003 MPa, which is significantly lower than the tensile strength of the opus caementicium (with the average stress from NLTH lower than that in the MLA, with the exception of the initial steps, in which only the southeast portion of the structure was excited and the inertia of the structure resulted in a localized stress concentration at the base); thus, no damage was reported on the model. The maximum levels of stress induced by rail traffic are not the direct cause of damage, as they are significantly lower than the tensile strength; however, they may contribute to deterioration of the structure through fatigue damage as a result of recurrent minor vibrations or by contributing to settlements after soil densification, which was not studied in this research.
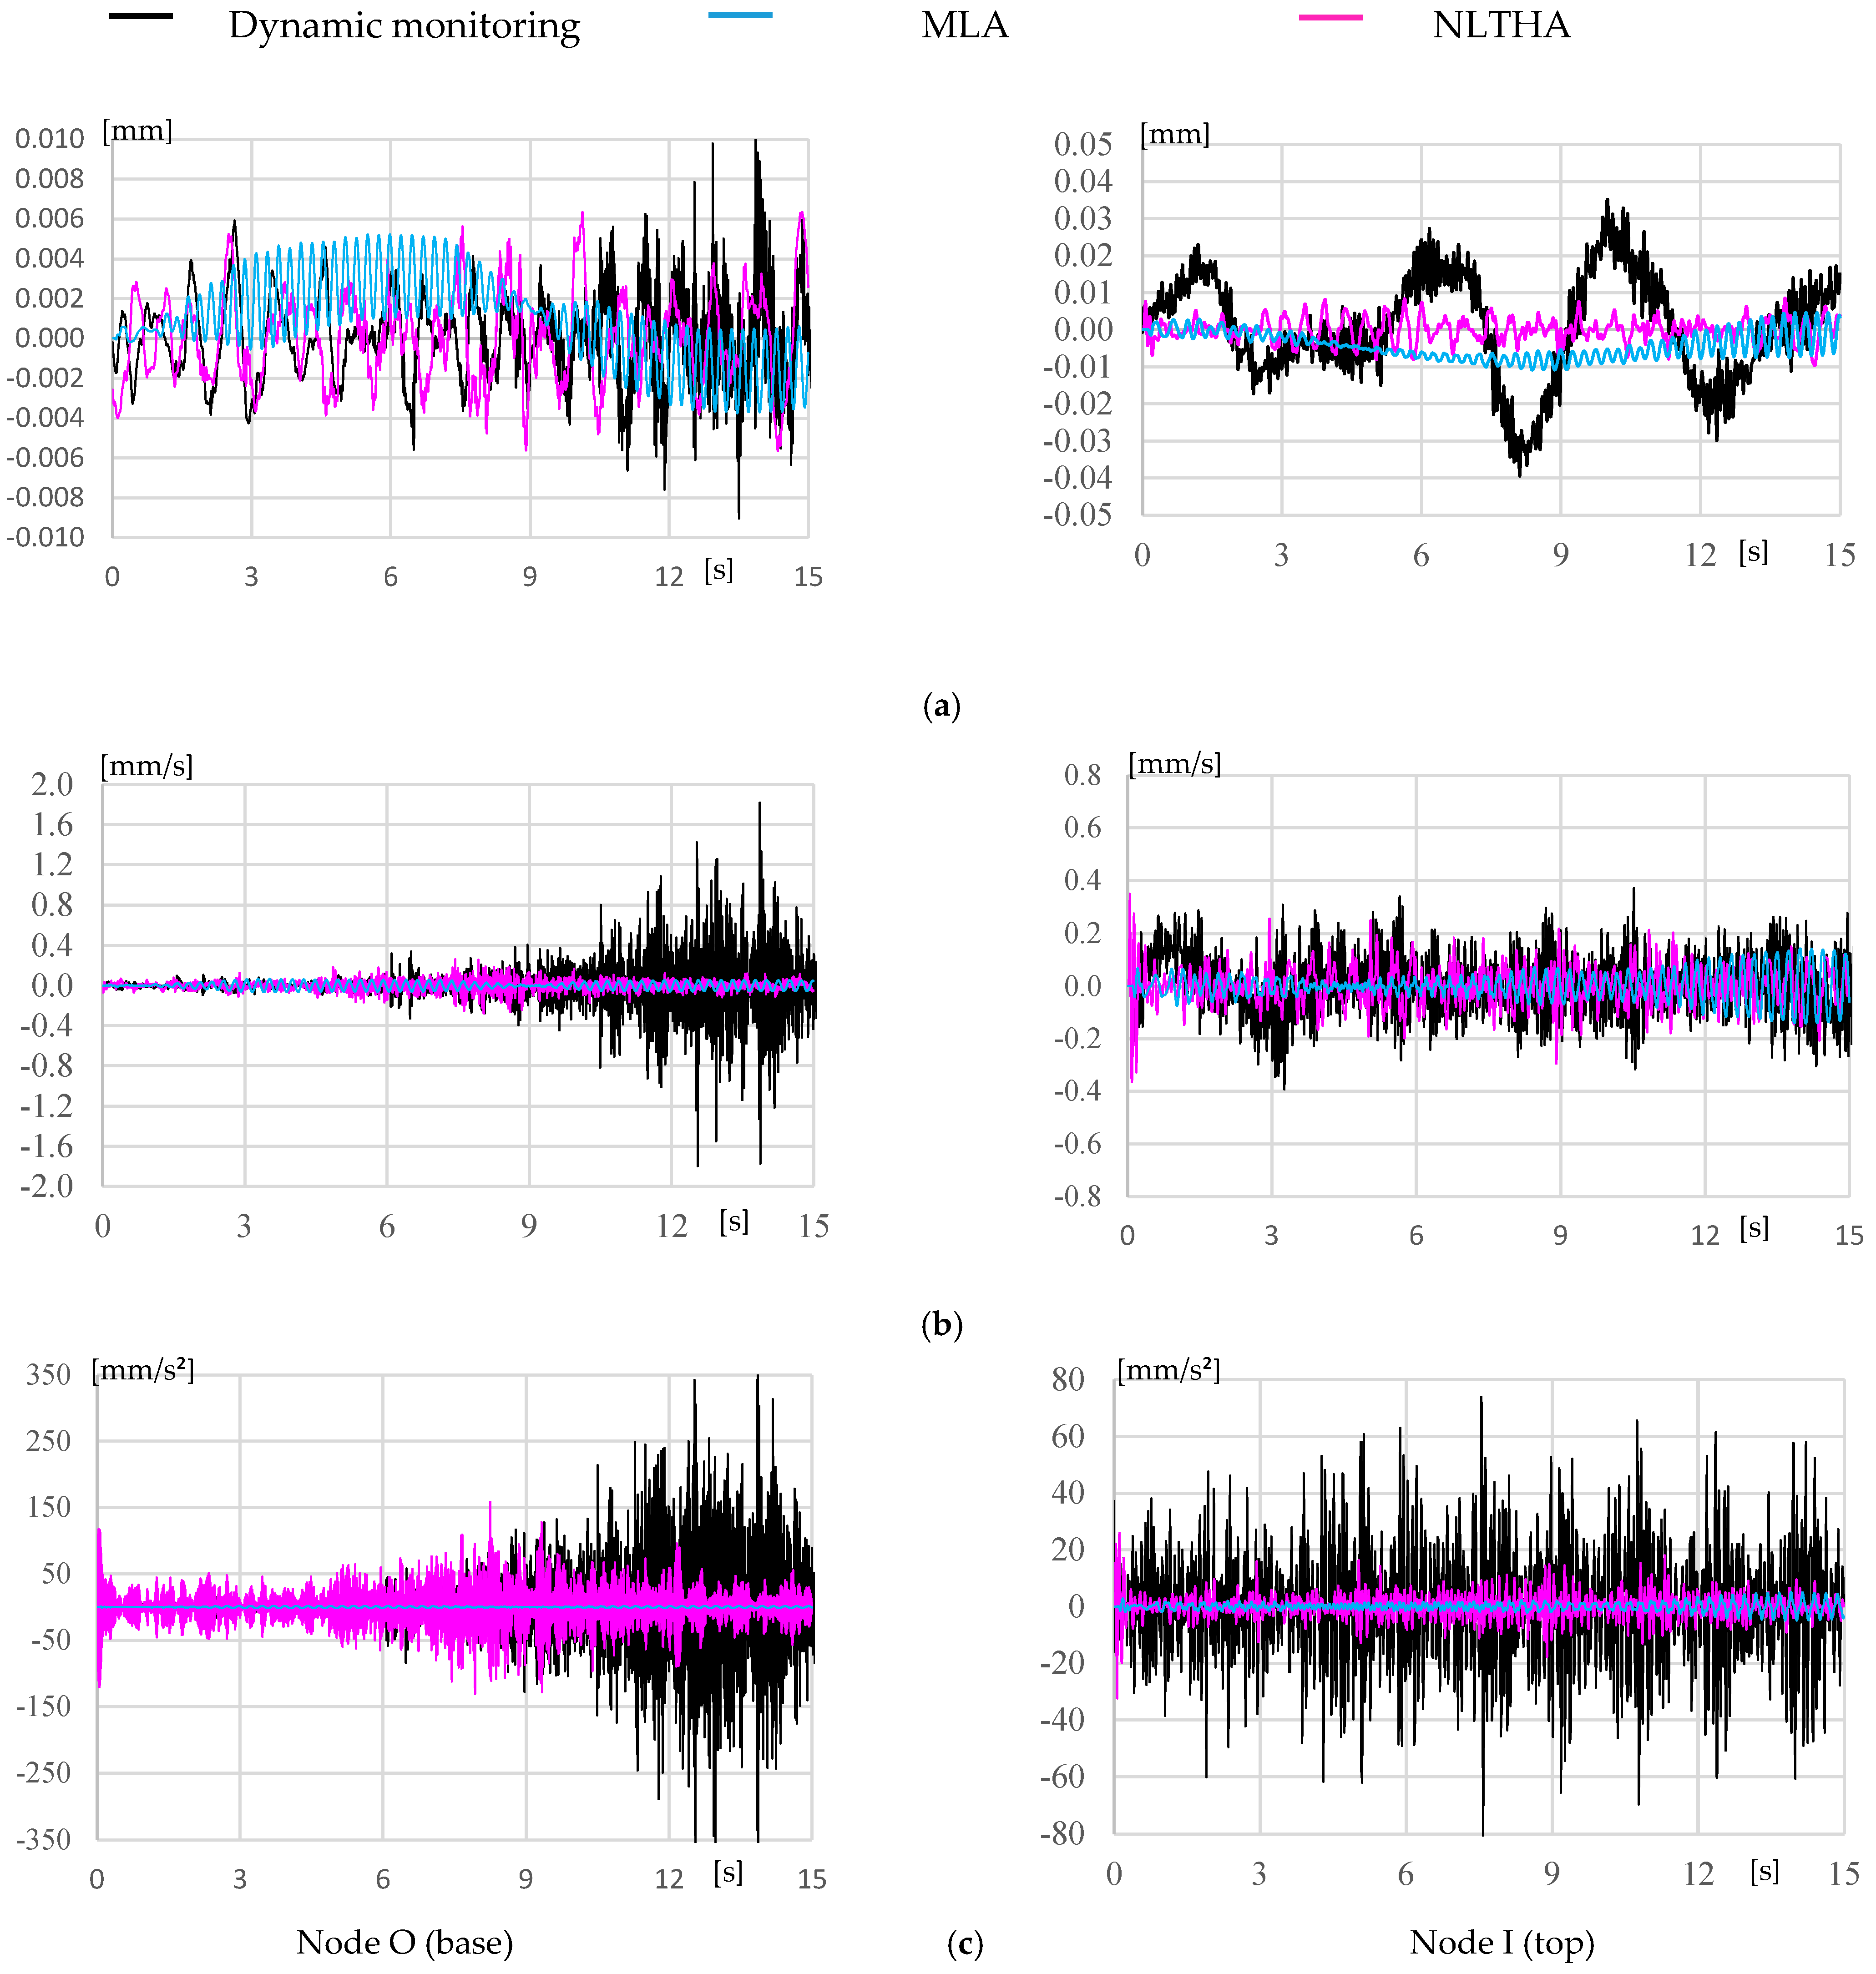
The results of the dynamic monitoring in the X-direction (parallel to the traveling direction of the tram) were compared to the two nonlinear numerical analyses in terms of displacement, velocity, and acceleration in the time and frequency domains at node O (base, about 1 m from the ground) and node I (top of the temple, at a height of 25 m), as shown in
Figure 25 and
Figure 26.
It is relevant to keep in mind that the data of the dynamic monitoring refer to different instrumentations and periods (the time frame was isolated in consideration of the tram passage); the data in node O was recorded with triaxial MEMS accelerometers (250 Hz sampling frequency) and that in node I with three monoaxial ICP accelerometers (accelerations resampled at 60 Hz; velocity and displacements kept at a 441 Hz sampling frequency). For this reason, the data must be considered in terms of amplitude and frequency content.
In terms of displacements (
Figure 25a and
Figure 26a), at the top, there was reported displacements about two times greater than at the base; the numerical and experimental amplitudes were similar; and at the base, there was a slight deamplification of the NLTH displacement after 10 s and the MLA displacements for the whole duration, possibly caused by unprecise calibration (or modeling) of damping. The frequency content differed significantly in the MLA, where the frequency narrowed around 4 Hz and highlighted a quasistatic component. The NLTHA is representative of the experimental displacements by capturing the relevant peak at 2.5 Hz. At the top, the gap between experimental and numerical increased; the dynamic monitoring data detected a large frequency content, between 0.5 and 1.5 Hz, which was not present in any of the numerical results. It is realistic to assume that this component is connected to the effect of wind pressure on the structure or on the cables of the accelerometers (being that the structure is quite high and open to wind influence from the north to the southeast side). The other peaks of displacements, between 8 and 17 Hz, are possibly connected to the higher modes excited by the tram, which were not detected in the simulation due to the defined time step for numerical integration (0.004 s).
In terms of velocity (
Figure 25b and
Figure 26b), node I reported velocity lower than at the base; the experimental and numerical data in each location reported the same order of magnitude. Once again, the NLTH velocity at the base became deamplified after 9 sec (up to eight times lower than the monitored velocity). The MLA returned slightly lower amplitudes and a concentrated peak of frequency at 4 Hz (four times greater than the experimental data). The NLTHA represents well the experimental velocity in the significant range of frequency of the temple (between 2 and 8 Hz).
In terms of acceleration (
Figure 25c and
Figure 26c), there was a significant difference between the numerical and experimental displacements at the two locations, with the values at the base about five times greater than at the top. The deamplification was similar to the velocity and displacement, which confirms a systematic error of overestimation of damping; the cause could be connected to the estimation of material damping, assumed to be 3%, which, according to the scientific literature, is considered in the low range of values for soil and masonry. Out of all of the results, the numerical accelerations presented the largest gap with the experimental data. The NLTHA was up to eight times lower than the experimental data, and the MLA concentrated the frequency content at 4 Hz and eliminated the remaining frequency response; this process yields to elimination of any amplification effects, which is generally representative of high structures.
The results were also defined with the root mean square (RMS) in the three directions as reported in
Table 6.
In terms of displacements, the numerical results at the base were similar to the experimental data, with a difference in the Z-direction of the MLA (as expected, since the moving load is vertically directed). At the top, there was a significant difference between the experimental and numerical values in all the directions; it is interesting that the MLA returned the RMS, in all of the directions, at least two times greater than did the NLTHA. Both of the numerical simulations were not capable of representing amplification of displacement in elevation (partially connected to the incomplete frequency content).
In terms of velocity, the RMS of the monitoring data was greater than that of the numerical simulations in both locations; it is relevant that the velocity in the Y-direction (transversal to the tram traveling direction) presented the lowest gap from the experimental data (5% greater than that of the NLTHA and 5% lower than that of the MLA). In this case, the MLA velocity was lower than that of the NLTHA.
The numerical acceleration reported the largest gap from the experimental data; once again, the transversal acceleration was the closest to the experimental data. The MLA significantly underestimated the acceleration, confirming the incapacity of simulating the dynamic effect of the tram advancement.
The comparison of the numerical results with the experimental data shows that the MLA is not capable of properly detecting the dynamic effect of rail vibrations, since it concentrated the response at 4 Hz, and it decently simulated only the amplitude of the displacement at the base. The NLTHA properly simulated the frequency content of the phenomenon; however, the amplitudes were substantially reduced due to damping.
6. Conclusions
The so-called temple of Minerva Medica is representative of several monuments that, due to urban development and transportation necessities, are affected by human activities. This monument was also selected for its availability of information (historical documentation on the evolution of construction, geometrical survey, archeological maps) and experimental data (NDT and dynamic monitoring), which are fundamental to properly simulating such a complex phenomenon as traffic-induced vibrations.
This research had the primary goal to study the dynamic effect of rail-traffic vibrations on a historical construction; this objective was achieved by combining NDT and dynamic-monitoring data into a finite-element model defined from the HBIM working methodology. The dynamic behavior of the structural model was calibrated with a consolidated methodology, which included sensitivity analysis, tuning of the significant parameters, and semiautomated updating with the Douglas–Reid method. The nonlinear parameters of the material were defined by correlating the modulus of elasticity with archival laboratory testing that resulted from previous research.
The velocity was always within the limits defined by Italian standards [
27], the numerical simulation reported low values of stress induced by traffic vibrations in the masonry structure, which were not considered the direct cause of damage. However, recurring events might contribute to fatigue damage because of repeated minor vibrations or by contributing to soil settlements.
The comparison of the numerical simulations with the experimental data highlighted the limitations of each analysis. The MLA was not capable of representing the dynamic action of rail-traffic vibrations because the response of the FEM in terms of displacement, velocity, and acceleration reported a concentrated frequency content of 4 Hz (
Figure 26); however, the pseudostatic load transmitted by the tram moving toward the structure was well-approximated in terms of response displacement and velocity intensity in the time domain (
Figure 25a,b). The NLTHA was capable of representing the dynamic effect of rail-traffic-induced vibrations on the structure in the range between 2 and 8 Hz (the range of the most relevant modes of vibration) and highlighted the limitations of the FEM in simulating material damping for both the soil and the structure, as shown in
Figure 25 and
Figure 26; the experimental signals tended to amplify in contrast with the numerical. Both numerical simulations returned accurate results in terms of the velocity of the structure in the transversal Y-direction (perpendicular to the moving direction of the train). The MLA included the ambitious objective of considering soil contribution in wave propagation, which was only partially achieved in terms of pseudostatic effects (by simulating the intensity of the displacements and the Y-velocity). The NLTHA intrinsically included the soil effect in the wave propagation by applying the monitoring data as input at the base of the structure; again, the numerical simulation returned partial agreement with the experimental data. The requirement of the monitoring data as input was a limit of the simulation, since without the experimental data of the traffic vibration, it would not have been possible to perform this analysis (synthetic signals do not include the soil effect). This limitation does not affect the MLA, which only necessitates vehicle velocity, load magnitude, and path.
This work employed the FEM to study the complex phenomenon of the dynamic effect of rail-traffic vibration. The use of an ambient vibration test to calibrate the numerical model resulted insufficiently to properly simulate traffic-induced vibrations. This research highlighted the potentiality of complex numerical simulations and the limitation of the NLTHA and MLA. A fundamental aspect of every simulation is availability of experimental data, in particular from material testing and monitoring, to control and calibrate the model.
A future development of this research would necessitate collection of new data on the monument to verify the variation of the modal parameters. In case of significant variations, development of this research may focus on investigation of fatigue damage and soil compaction, since the estimated stress induced by the rail traffic had modest results.


