Article

Seismic Risk of Weak First-Story RC Structures with Inerter Dampers Subjected to Narrow-Band Seismic Excitations

1
Institute of Engineering, UNAM, Mexico City 04510, Mexico
2
Faculty of Engineering, UNAM, Mexico City 04510, Mexico
3
Unidad de Investigación y Tecnología Aplicadas, UNAM, Apodaca 66629, Mexico
4
Department of Civil and Environmental Engineering, Universidad de Guanajuato, Guanajuato 36000, Mexico
*
Author to whom correspondence should be addressed.
Buildings 2023, 13(4), 929; https://doi.org/10.3390/buildings13040929
Submission received: 24 November 2022 / Revised: 17 December 2022 / Accepted: 21 December 2022 / Published: 31 March 2023
(This article belongs to the Special Issue Structural Engineering in Building)

Abstract

:
This study evaluates the seismic risk of weak first-story reinforced concrete (RC) structures retrofitted with inerter dampers at their ground level when subjected to narrow-band seismic excitations. The main advantages brought about by the ground-level inerters are the reductions in seismic demands (e.g., drifts, floor accelerations). This study shows that structures with inerters are reliable systems in terms of peak story drifts for large ground motions. For moderate ground-motion intensities, the opposite could occur, mainly for soft soil sites. The reliabilities of structures with inerter dampers at their ground level are in general higher for buildings under seismic intensities associated to limit state of incipient collapse, especially for low-height buildings. This could be reversed for intensities associated to the limit state of damage limitation. The findings of this study could guide practicing engineers to use inerter-based dampers in retrofitting ductile structures consisting of moment-resisting reinforced concrete (RC) frames subjected to narrow-band earthquake excitations in regions such as Mexico City.

1. Introduction

Recent earthquakes have exposed the high vulnerability of several ductile moment-resisting frames due to their soft story located either at ground level or several stories above ground [1,2,3,4]. According to [1], the contributing factors to soft-story failures are low lateral stiffness and the strength of one or more resisting frames within a given story level, the ground-motion amplitude and duration, as well as large plastic deformations at column joints that induce lateral instability due to p-δ effects. This collapse mechanism has been a problem for a long time not only in Mexico City [1,5] but also in other seismic regions worldwide, e.g., [6,
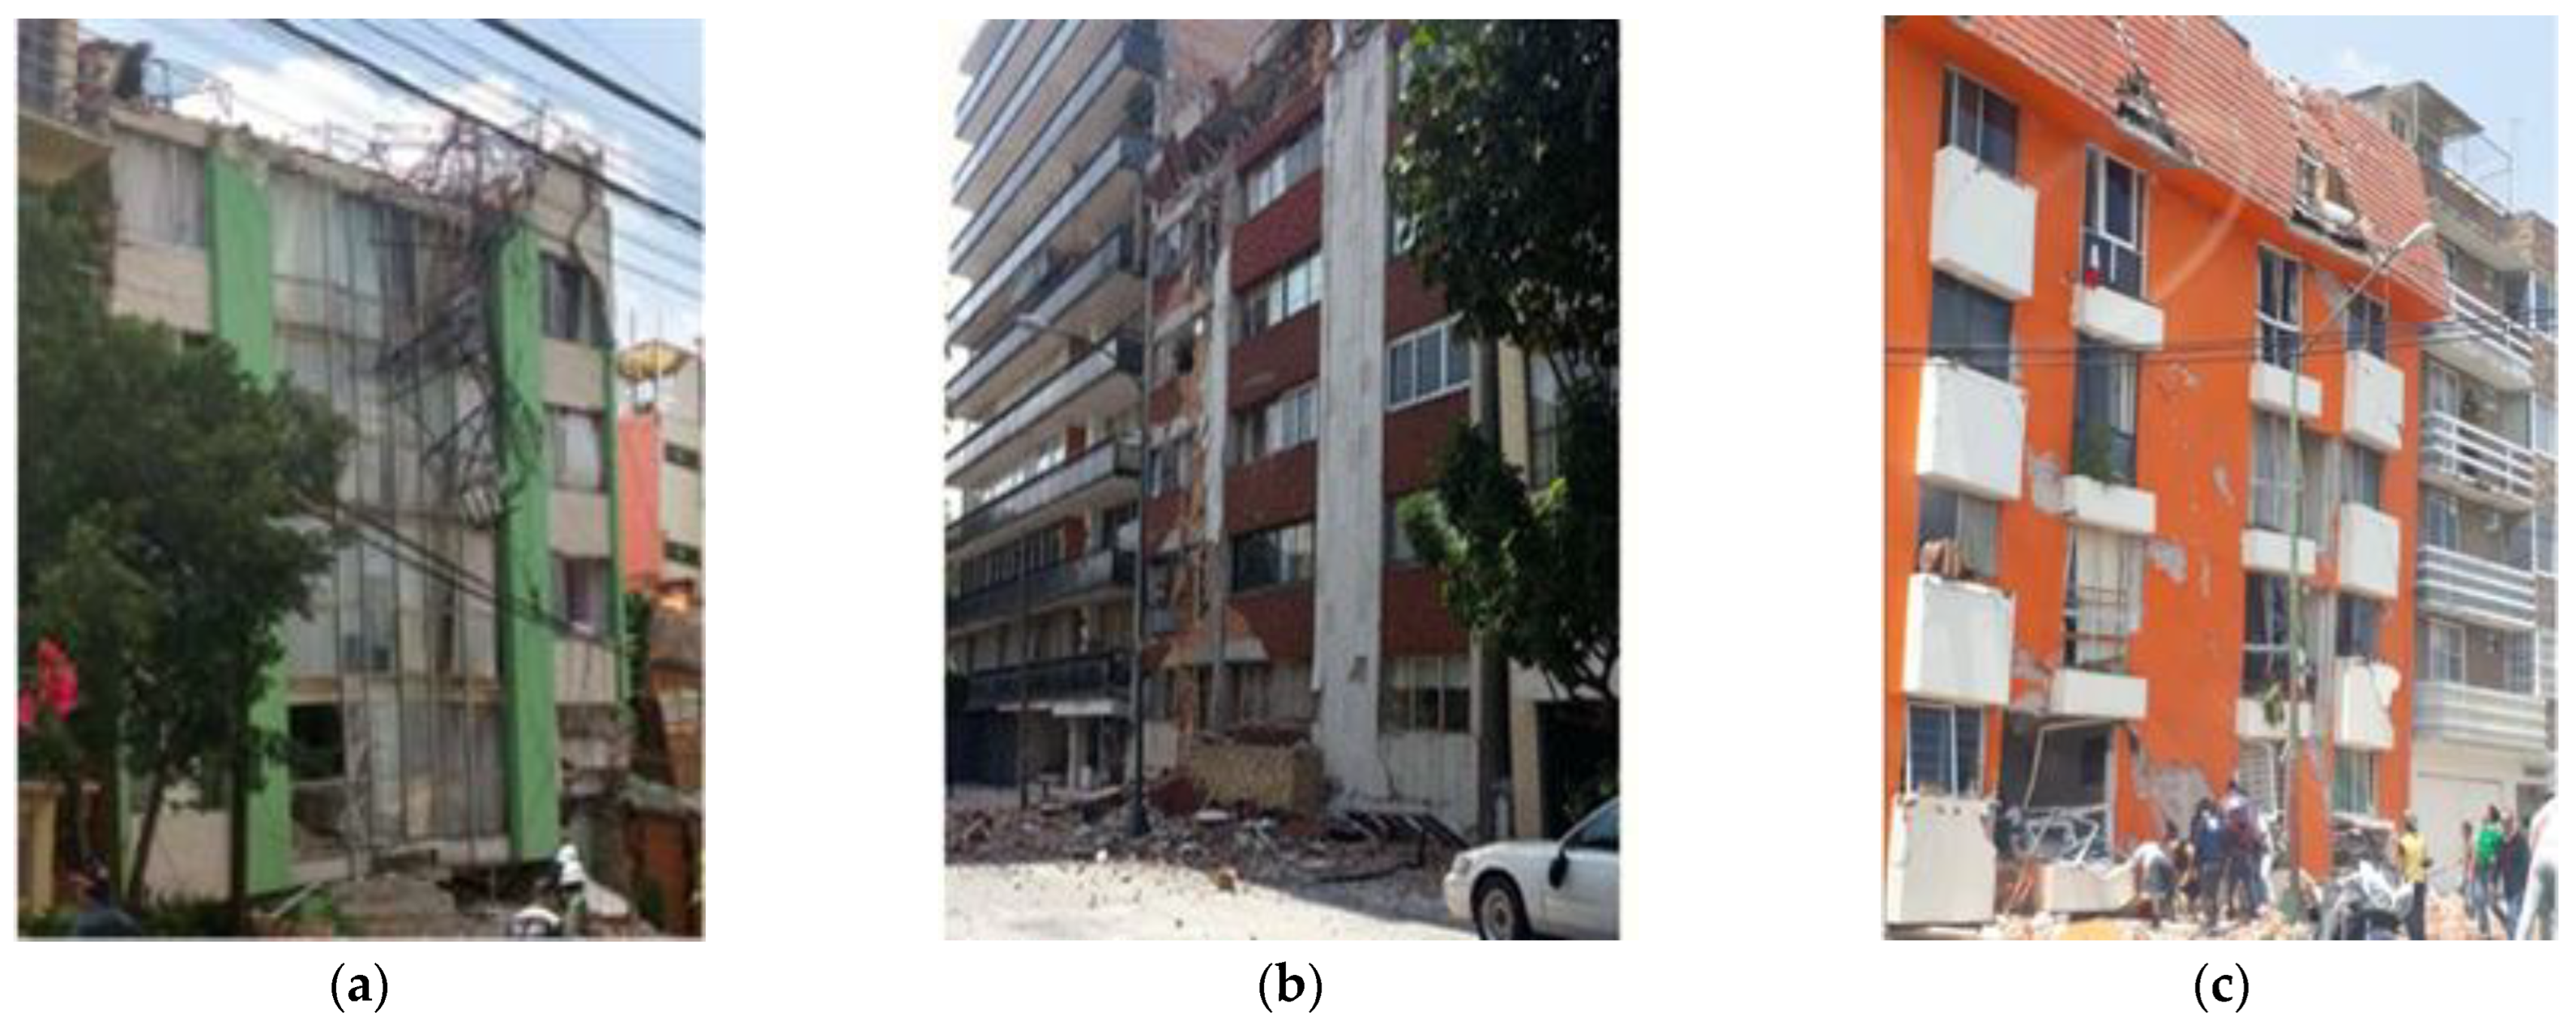
7]. One example of the high seismic vulnerability of soft-story framed structures was displayed in the Michoacan 1985 Mw8.1 earthquake, where approximately 37% of the collapsed buildings (78 out of 210) in Mexico City involved the failure of one or more soft stories. Similarly, 44 multi-story buildings collapsed due to the 2017 Mw7.1 Morelos–Puebla earthquake, 40 of which were built before 1985; a total of 25 out of the 40 presented a soft-story mechanism (Figure 1) according to Galvis et al. [8].
Therefore, it is essential to undertake actions to control excessive deformation demands in buildings that are prone to this failure mechanism. There are different strategies to improve the structural safety and resilience by implementing innovative seismic protection devices in new and existing structures, e.g., [9]. These technologies are based on passive control, isolation, and damping systems, which could be used to avoid damage in structural and non-structural elements. The most popular damping devices are those dependent on displacement and velocity; they have advantages but also limitations. However, a third category that is not as common is based on inertial dampers, in which the response is controlled by adding inertia to the structure as investigated here. Therefore, it is considered that the present study increases the understanding of the advantages and disadvantages of inerter dampers with respect to other seismic protection devices as described in the body and conclusions of this work. The inerter damper (ID) is a control mechanical device that has gained popularity to passively suppress and control vibrations in structures [10,11,12,13,14,15,16,17]. An ID is a mechanical response modification device whose resisting force is proportional to the relative accelerations between their terminal nodes [18]. An ID relies on the inertance property m r with units of mass [18,19] that can scale up independently of the weight of the device. This inertance property can be achieved, for instance, using supplemental flywheels that are engaged in motion through rack-and-pinion or ball-screw systems [10,11,
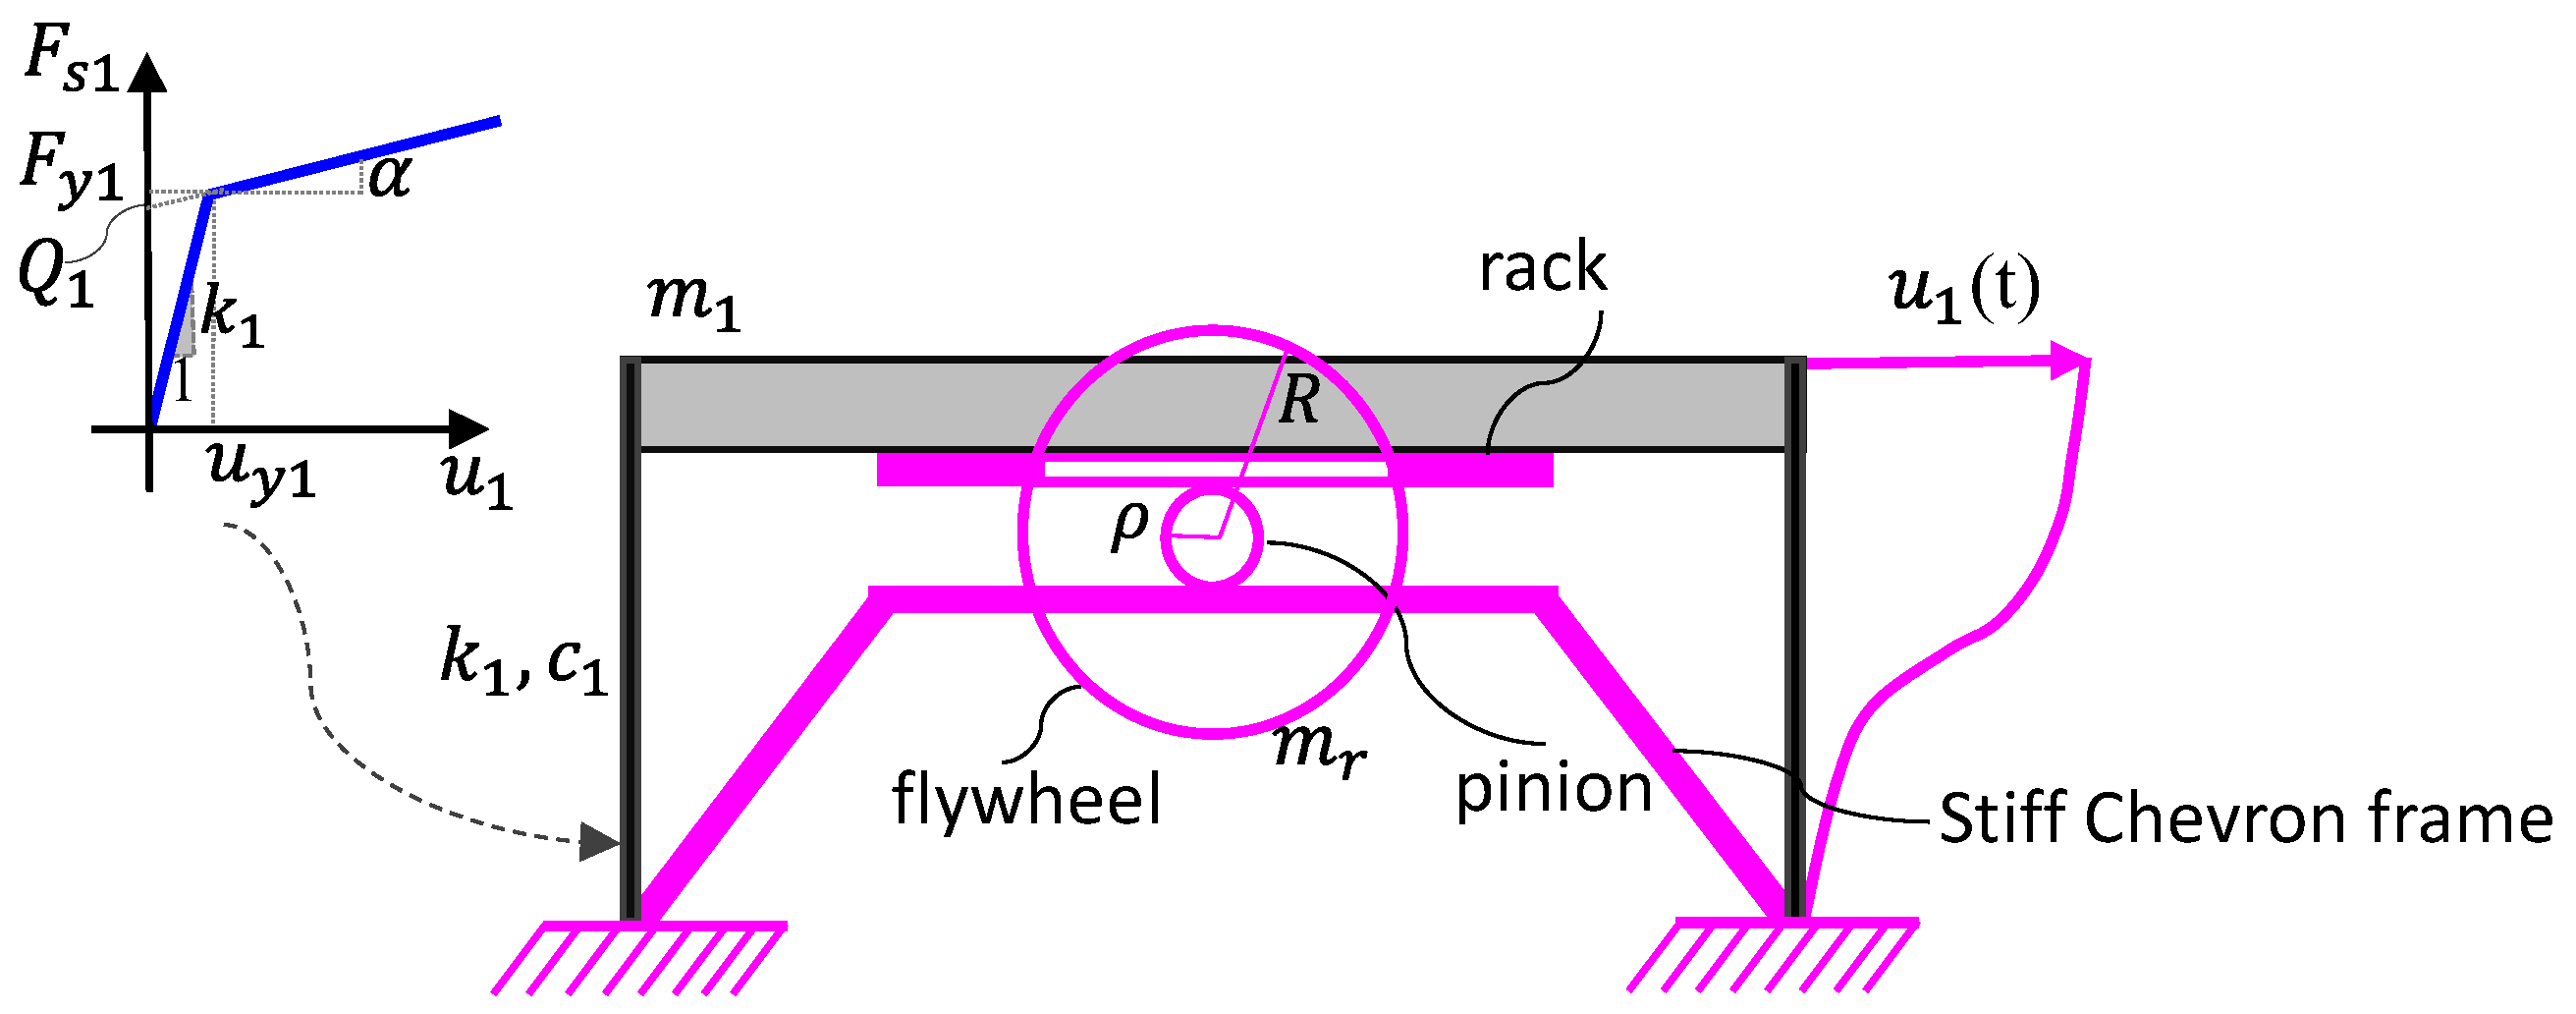
20]. The whole mechanical arrangement is called the inerter damper. If a yielding single-degree-of-freedom (SDOF) system with strength Q 1 and yield force F y 1 
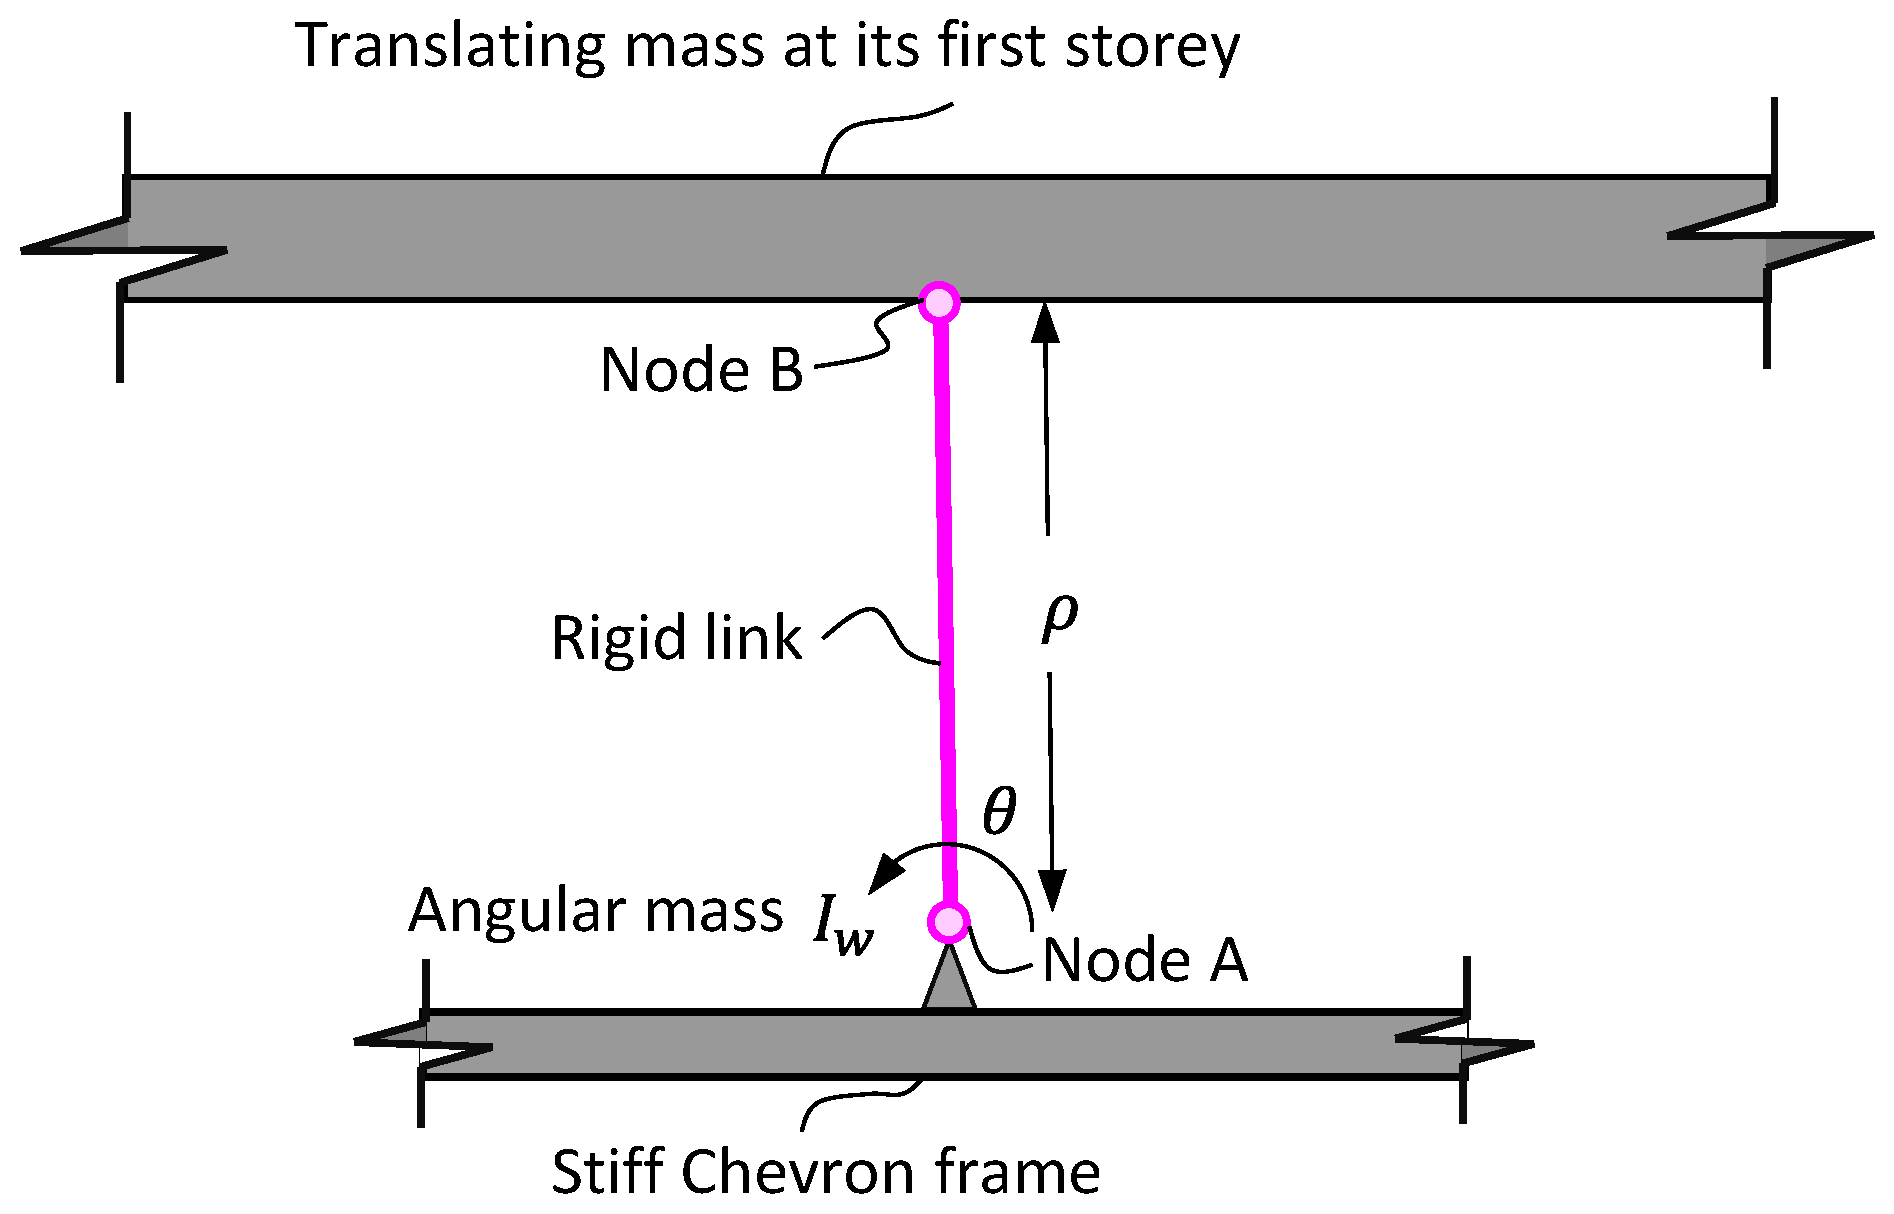
is provided with an ID supported on a stiff Chevron frame (Figure 2), the governing equation is [17]:
u ¨ 1 = 1 1 σ [ u ¨ g 2 ξ 1 ω 1 u ˙ 1 α ω 1 2 u 1 ( 1 α ) ω 1 2 u y 1 z 1 ]
z ˙ 1 = 1 u y 1 ( u ˙ 1 β u ˙ 1 | z 1 | n ζ | u ˙ 1 | z 1 | z 1 | n 1 )
In Equations (1) and (2), u ¨ g is the ground acceleration, ξ 1 is the nominal damping ratio, ω 1 = k 1 / m 1 is the nominal frequency with mass m 1 and pre-yielding stiffness k 1 , and α is the ratio of pre-yielding to post-yielding stiffnesses ratio. z 1 is a parameter, which introduces the hysteretic behavior in the columns as given by the so-called Bouc–Wen model, where β , ζ , and n are the parameters defining the hysteretic loop [21,22], and u y 1 is the yield displacement. Finally, σ = m r / m 1 is the inertance ratio or apparent mass ratio [18]. This coefficient σ can assume any desired value with sufficient size and number of supplemental flywheels engaged in motion through rack-and-pinion or ball-screw systems [10,11,20].
Given the effectiveness of IDs to control the seismic displacements, we study the seismic risk of weak first-story RC structures with IDs at their ground level to control lateral displacements. The study uses narrow-band ground motions, as those recorded at several sites located in Mexico City. Narrow-band ground motions in Mexico City are known to generate a significant amount of energy content within a narrow range of structural periods [23]. When structural systems are subjected to narrow-band ground motions with a long duration, their capacity to dissipate energy is decreased as the structural period tends to zero [23]. The amount of energy input to the structural systems due to narrow-band ground motions is substantial as compared to the energy introduced by wide-band ground motions [23]. For the scope of this study, a set of three regular RC buildings with masonry infill walls above the first story was used [24]. These buildings were designed according to the NTCS-1976 [25]. Before carrying out a retrofitting or rehabilitation, a preliminary and adequate seismic assessment is a fundamental phase in order to retrofit existent reinforced concrete structures with a suitable rehabilitation strategy [26]. Therefore, herein, we hypothesize that the performance of weak first-story RC structures can be improved, and their likelihood of experiencing a soft-story collapse during narrow-band seismic excitations can be significantly reduced by using IDs at their ground level especially for large ground motions, i.e., seismic intensities associated to limit state of incipient collapse. This study includes records of large earthquakes (1985 and 2017), since these events caused important damage to several low-to-medium rise weak first-story structures located on the Mexico City basin. As it is known, a real building has many degrees of freedom, which somewhat contributes to its irregularity, e.g., [27]. In the present study, the lateral–torsional and the inertial-damper effect coupling is neglected; this could lead to an overestimation of the effectiveness of the inerter. Therefore, a future study investigating the influence of location and direction of the inerter dampers for irregular buildings subjected to horizontal seismic excitations is recommended.

2. Designed Buildings Considered

Regular structures (symmetrical) in plan and elevation are adopted from Ruiz-García and Cárdenas [24] for this study. These buildings are considered first weak-floor structures, not only because no infill walls are provided at the first floor (leading to a much smaller rigidity in that level), but also because they are adopted as representative of typical structures with this failure mechanism observed during a field-reconnaissance report after the 2017 Mw7.1 Morelos–Puebla earthquake [24].
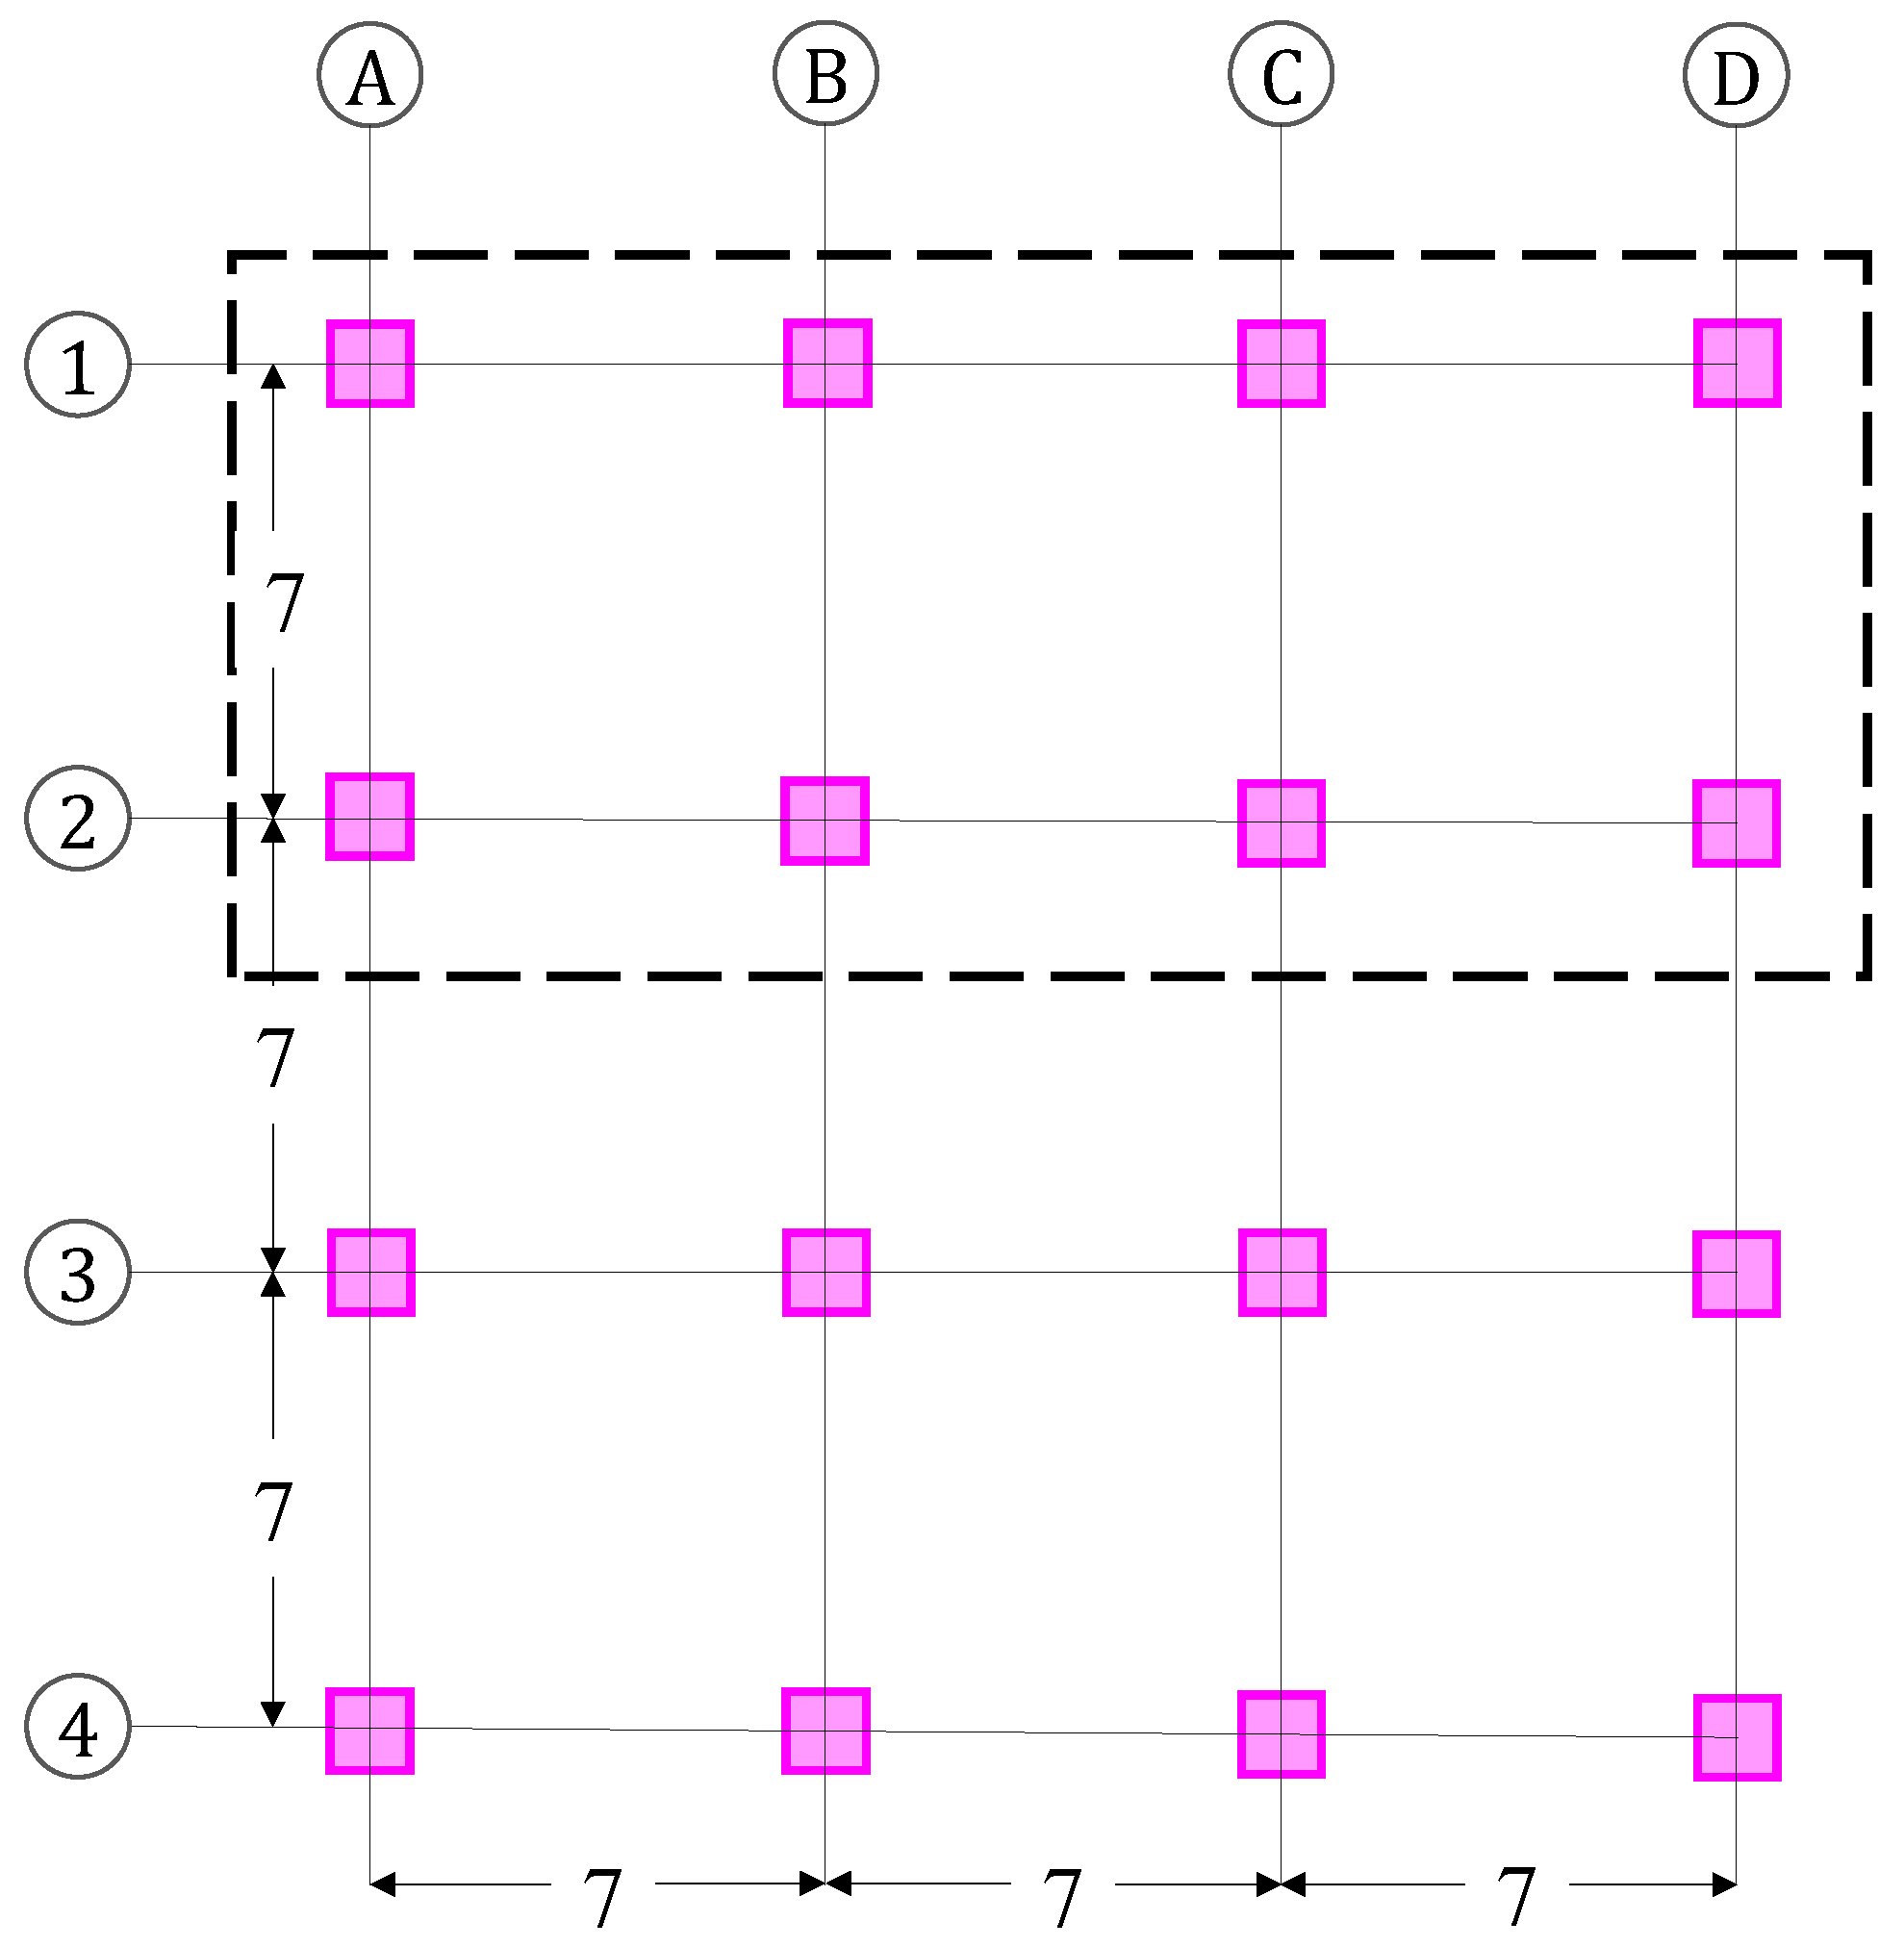
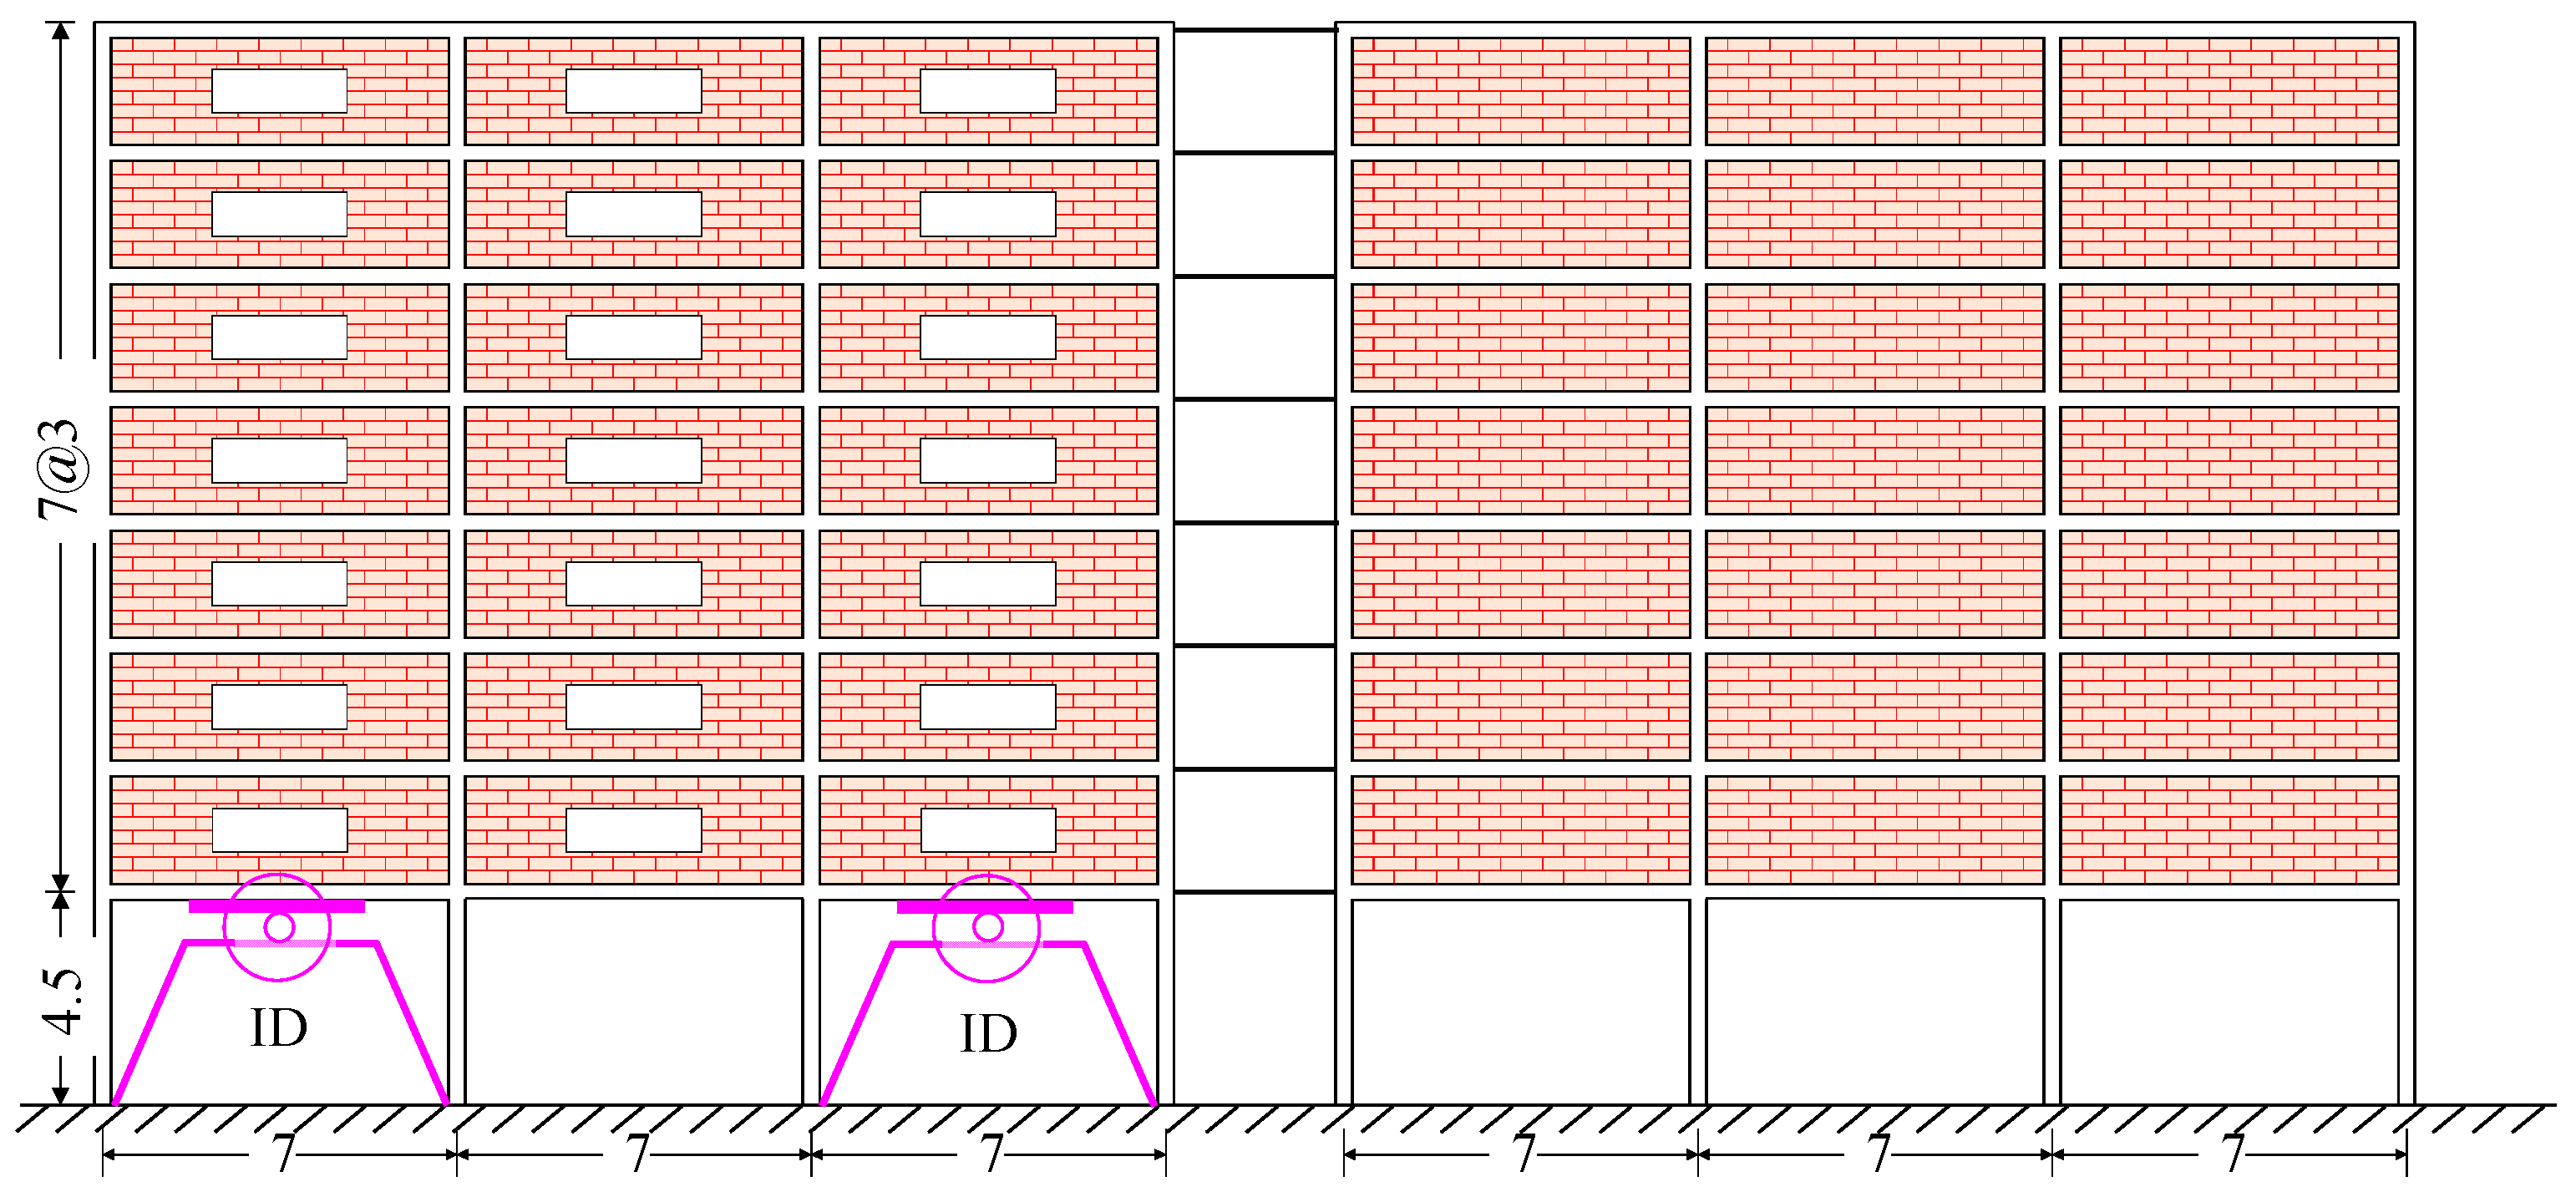
They are assumed as office buildings with a height equal to 4.5 m from the ground to the first floor, and an interstory height equal to 3 m for the other levels. They have a squared plan view with three bays in each direction.
The plan view indicated in 
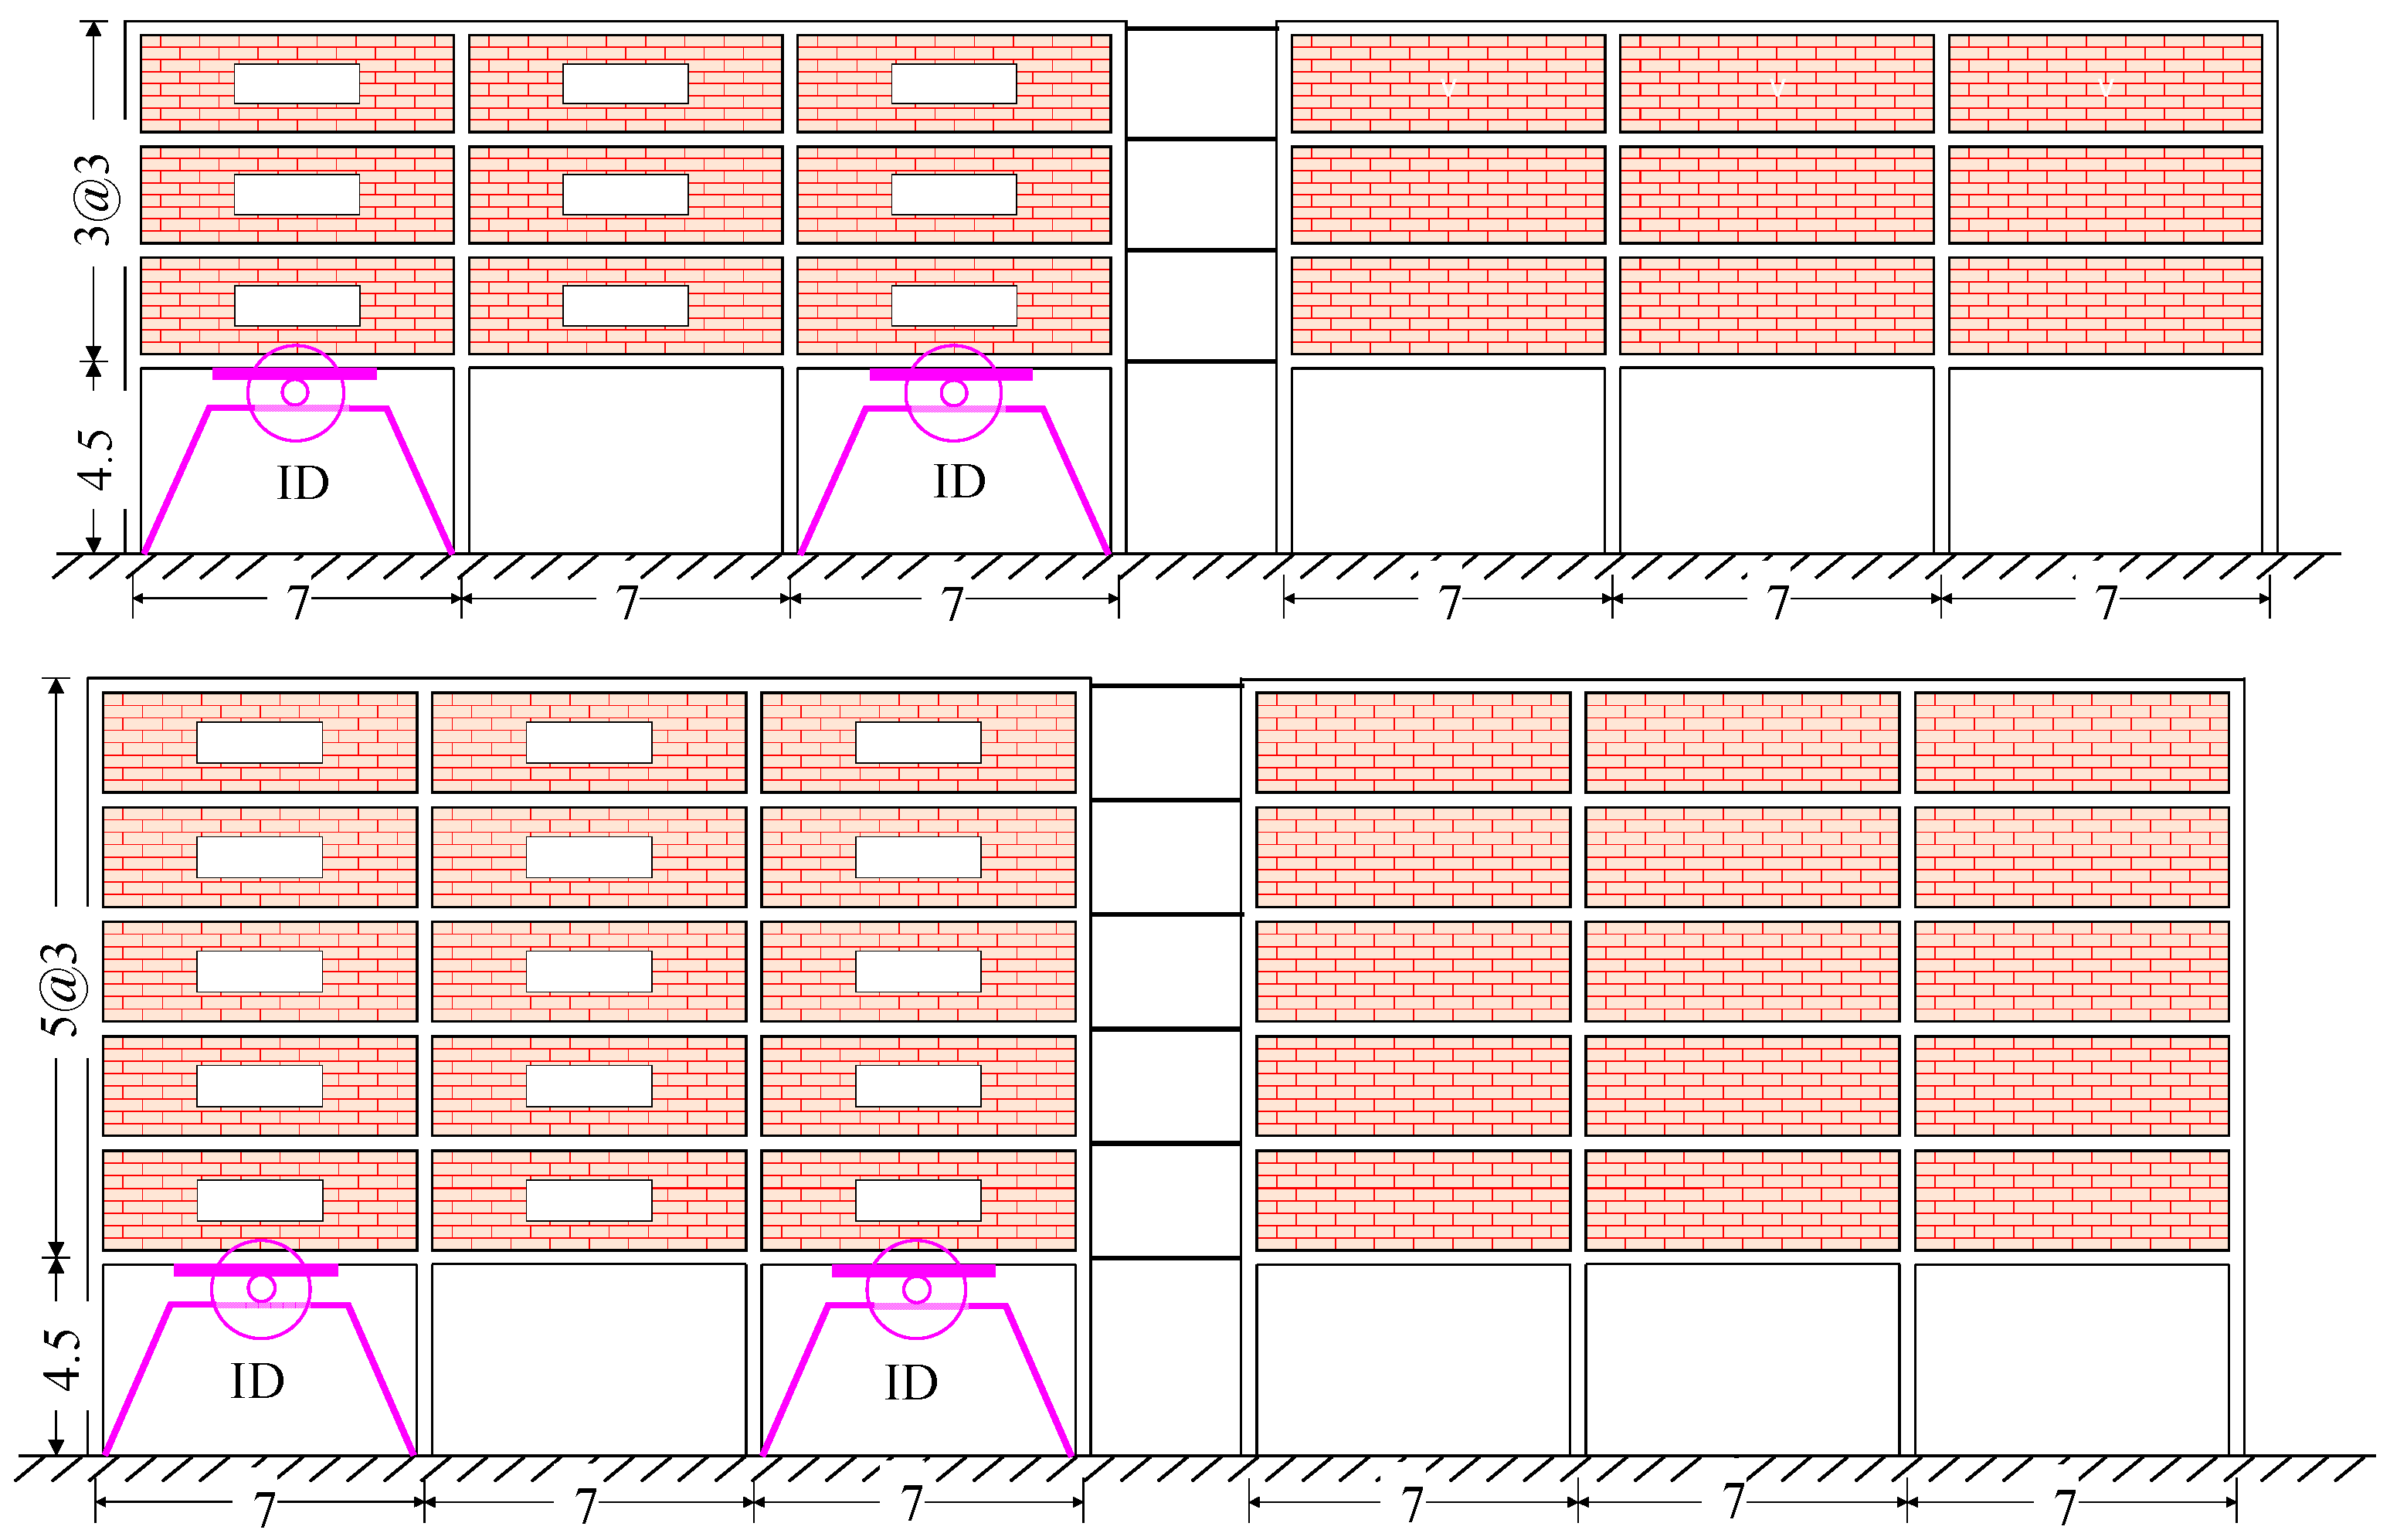
Figure 3 is common to the three considered buildings, except that they have a different number of stories: 4, 6, and 8 stories as shown in Figure 4. This figure also shows the exterior infill masonry walls with openings and the interior infill masonry walls with no openings; no walls are provided on the first floor. For the openings, a simple configuration is considered just to distinguish between façade and interior walls [24]. Extensive detailing of the reinforced concrete, column, and beam locations; sections and reinforcement steel arrangements; as well as other technical information are thoroughly described and can be inspected by interested readers in [24] and other references [28,29]. The Mexico City 1976 version of the Technical Norms for Seismic Design [25] is employed in the design using a so-called Seismic Behavior Factor Q with values of 4 and 6 (i.e., a factor related to demand reduction by ductility that is high and very high for the selected values, respectively). More details are available in the study conducted by Ruiz-García and Cárdenas [24], who compared the seismic performance of these buildings versus the performance of their counterparts, but as if they were designed with the updated version of the code, which expressively includes design regulations for first weak-floor buildings. It is noteworthy to mention that Ruiz-García and Cárdenas [24] found, in general terms, that the new regulations successfully improve the seismic behavior and are effective for the seismic demands expected in Mexico City for the ground motions considered. Nevertheless, it is also concluded that the updated regulations delay the formation of the weak-story mechanism, and that the peak drift (possibly damage) could be migrated to the upper levels. To draw a parallel between the results presented for the overall seismic behavior of the buildings designed with the old and updated Mexico City seismic provisions by Ruiz-García and Cárdenas (in terms of normalized shear versus roof drifts) and simple material behavior, it is as if the first weak-floor structures designed as per the 1976 regulations would behave as confined or unconfined concrete (in compression), and as if those designed as per the updated regulations would behave as reinforcement steel of different grades (in tension).
In the present study, we rather considered the buildings as representative of existent structures designed as per the 1976 regulations, which could be retrofitted with inerter dampers to improve their seismic behavior as urged by Ruiz-García and Cárdenas [24] and other authors regarding this type of existent buildings.

2.1. Dynamic Analysis of the Buildings

Nonlinear dynamic analyses were performed using OpenSees [30] modelling on only half of each building due to their symmetry in the plan (see the rectangle depicted with the dashed lines in Figure 3). Hence, one exterior frame and one interior frame are considered linked through rigid frame elements (i.e., two-dimensional centerline models) implying that each floor has the same lateral deformation (i.e., a rigid diaphragm assumption) as can be observed in Figure 4, where it can also be observed that the IDs are placed only in the exterior frames at the depicted locations. The reinforced concrete elements of the model (columns and beams) were modelled with the fiber section, since the most promising models for the nonlinear analysis of reinforced concrete members are, to date, flexibility-based fiber elements. In order to consider the stress–strain behavior of the concrete element under cyclic loads, Concrete02 material was implemented, which allows for the construction of a uniaxial concrete material object with tensile strength and linear tension softening behavior specified by the Kent–Park stress–strain relationship [31]. Similarly, the Giuffre–Menegotto–Pinto steel material object with isotropic strain hardening model was used to model the reinforcement steel fibers, which is identified in OpenSees as Steel02 material [32]. Total weights W , first-mode periods T 1 , and percentage of the effective mass of the required modes to accomplish the minimum 90% of the total mass required in the standards employed are listed in Table 1 for each analyzed building. All buildings have a fundamental period T 1 near unity as shown in Table 1. In Table 1, each model designation is similar to that in Ruiz-García and Cárdenas [24], i.e., the label EXQY (column 1 in Table 1) denotes the number of floors for the X and Q factor for Y (e.g., E4Q6 corresponds to a 4-story building designed for a Q factor equal to 6). As explained before, this factor is linked to the ductility behavior of the buildings and varies for different versions of the Mexico City seismic provisions; it depends on different aspects. In this study, it is only pointed out that different Q factors lead to different designed structural elements. The interested reader is referred to Ruiz-García and Cárdenas [24] and references therein [28,29] for more details.
As it is observed from the previous table, the fundamental mode participates with more than 80% of the response; however, higher modes are also considered in the computation of the lateral response of the structure. As can be observed from Table 1, the fundamental mode controls the response as each one of the higher modes contributes with less than ~10% in most of the cases. It is expected that these characteristics do not vary when the inerter dampers are allocated in the structures, as they are located in the first floor; besides, the mass of the damper is allocated over the chevron frame, which is supported directly by the foundation structure. Therefore, the mass and the stiffness of the chevron frame will not change either the vibration periods or the modal shapes of the structure, and the same applies for the effective mass associated to each mode. Although issues related to the stored energy in the inerter damper and subsequent transfer forces to the supporting system are ignored in the present study, they could be investigated in future research.

2.2. Modeling of the Inerter Damper

Figure 5 shows a schematic representation of an inerter with the main parameters used to establish the numerical model as proposed by Málaga-Chuquitaype et al. [15]. In Figure 5, two nodes connected through a rigid link with the length denoted as ρ are observed. A rotational inertia or angular mass denoted as I w is assigned to the rotational degree of freedom (Node A). This is done so that the relative lateral displacement between the two nodes (A and B) translates into a rotation in Node A. Node A corresponds to the pivot of the flywheel. On the other hand, Node B represents the pinion gear. Depending on the desired value of the inertance property obtained as m r = I w / ρ 2 , ρ and I w can be varied. The so-called apparent mass ratio σ can be determined for the considered building as = m r / i = 1 n l e v e l m i = m r / m T , where m i is the mass of story i, and m T = W / g is the mass of the whole structure (total mass). For the scope of this study, every building has ρ = 0.5   m , and σ is either equal to 0.5 or 0.7 . Such values were calculated considering the placement of the inerter dampers.

3. Seismic Hazard and Ground Motion Selection

3.1. Seismic Hazard at Soft Sites

To evaluate the influence of ground motions (e.g., frequency content) on the seismic response of weak first-story RC structures with IDs at their ground level due to narrow-band earthquakes in Mexico City, a risk analysis was carried out for these structures for two soft-soil (lakebed zone) stations: CH84 station and SCT station, both in Mexico City with a soil dominant period T s of approximately 1.35 and 1.9 s, respectively. The above-referred stations are approximately 110 and 300 km away from the epicenters of the Morelos–Puebla and Michoacan events, which occurred in 2017 and 1985 with Mw of 7.1 and 8.1, respectively. These stations are of particular importance because they have recorded the most intense and destructive seismic motions since accelerometers were installed in Mexico City, i.e., the September 19th 2017 Mw7.1 earthquake (station CH84) and the September 19th 1985 Mw8.1 earthquake (station SCT). As discussed in the Introduction section, these earthquakes caused severe damage to low-to-medium rise buildings with weak first-story configurations.
A Probabilistic Seismic Hazard Analysis (PSHA) is developed to compute the exceedance rate of spectral acceleration (SA) associated to given structural periods at the selected locations. However, due to the lack of ground-motion prediction models specific for the selected sites, we use an approximate approach, which includes site effects in the PSHA. For an intensity measure y at a soft-soil site (for this study y = S A ), the exceedance rate λ s ( y ) could be obtained using (Esteva, 1970):
λ s ( y ) = λ r ( y / A F )
where λ r ( · ) denotes the rate of exceedance for S A in rock conditions, and A F is a factor of amplification, which translates the S A in hard soil to the S A in the soft soil. Equation (3) entails a somewhat constant A F irrespective of the magnitude, distance, azimuth of earthquake, and intensity considered, and entails a deterministic nature of the factor, or that the factor is envisaged as uncertain but equal at the soft-soil site and the rock site being the uncertainty related to the motion prediction at both sites. Authors [33,34] have shown that the nonlinear response of Mexico City clays is very limited for the range of seismically induced shear deformations of past earthquakes.
The reference site considered as the basis for the rate of exceedance at a rock site is CU (Ciudad Universitaria) station, corresponding to geographical coordinate 19.326° N and 99.182° W, and installed on thick layers of basaltic lava flows. Consideration of this rock site as a reference site to investigate the seismic hazard in Mexico City is not recent; it has been the selected site par excellence to investigate dynamic amplifications in soft-soil sites in Mexico City [35,36,37,38,39]. The ground motion I M (SA herein) and also the exceedance rate for SA at CU were obtained by means of the PSHA referred to earlier, the basis of which was originally established by Esteva-Cornell [40]. Groups of seismic sources (subduction interface, intermediate-depth intraslab, and shallow crustal) are used and depicted in Figure 6 [41,42]. Different predictive models (ground-motion models, GMMs) were employed for the seismic hazard evaluation. For subduction-interface earthquakes generated along the Pacific Coast, the GMM in Jaimes et al. [39] (2006b) is considered. Likewise, for intermediate-depth intraslab events, the GMM in Jaimes et al. [43] was considered, and for shallow-crustal fault events, the GMM in Jaimes et al. [44] was considered.
Once the rate of exceedance at the reference rock site is evaluated, the amplification factors A F at soft-soil sites are determined. The seismic excitations at CU are considered as a reference value of the input seismic signal that generates the seismic excitations in the soft-soil sites of Mexico City as implied above. Evaluating the amplification for soft-soil sites is carried out through response spectral ratios [45,46]. The average of the computed ratios for the accelerometric station of interest (e.g., stations CH84 and SCT) in relation to CU station yields the empirical spectral ratios mentioned before. This is to be carried out for every earthquake that has been recorded simultaneously at every station of interest and at CU station. For the scope of this study, the response spectral ratios were computed using the earthquakes causing the largest PGA at CU station from 1964 to 2017.
The seismic hazard and Equations 1 to 2 were implemented in the software SeismicHazard V2.0 [47] leading to the curves depicted in Figure 7 for λ y (i.e., mean annual rate of exceedance of SA) for the structural period of interest (i.e., T 1 ~ 1.0 s).

3.2. Set of Earthquake Ground Motions Considered

The earthquake-induced response of weak first-story RC structures with IDs at their ground level during narrow-band ground motions is highly sensitive to SA, duration, and frequency content, as well as other intensity measures. Since there is a limited number of recordings to perform seismic risk analysis, a set of synthetic accelerograms for sites under study, as per the current version of the design seismic provisions in Mexico City, are generated. Nevertheless, the synthetic ground motions preserve the key dynamic characteristics of the studied sites, and the scaling factors are smaller than five as indicated later. The influence of the ground-motion frequency content on the weak first-story RC structure response with IDs is accounted for in this study by adopting a set of 36 synthetic ground motions at each site of study. Each set was computed in accordance with the 2017 Mexico City Seismic Design Provisions (NTCS-2017) [48] representative of high-intensity motions associated to a return period of T R = 250 years. The seed ground motions were obtained from the September 19th, 2017 Mw7.1 and September 19th, 1985 M8.2 earthquakes recorded at stations CH84 and SCT, respectively. Figure 8 presents the SA pseudo-acceleration (upper-left corner), SV pseudo-velocity (upper-right corner), and SD displacement (lower-left corner) seismic response spectra from synthetic ground motions for sites CH84 (pink lines) and SCT (blue lines). It can be observed that these ground motions preserve the main characteristics of the seed records; for instance, the frequency content and intensities take into account the variation of soil dominant period T s due to the drying process that occurs in the lacustrine zone of the city.

3.3. Criteria for Scaling Ground Motion

Ground motion scaling remains controversial, and large scaling factors should be avoided; however, the limit of 3–5 for scaling factors is possibly based on comfort level of the engineer rather than physical constraints [49]. Besides, if the selection of the ground motions accounts for the properties relevant to each engineering demand parameter E D P (other than magnitude and distance bins), Watson-Lamprey and Abrahamson [49] have shown that large scaling factors, even as large as 20, can be used without introducing bias in the median structural response. Another possibility would be to use physics-based synthetic ground motions, which have their own set of limitations and may not be justified in many engineering projects. One option to limit the scaling factors of recorded events is to use ground motions from other seismic regions (but same fault mechanism) that naturally provide large intensity measures; this approach, however, could be problematic, since every seismic environment imprints a unique signature on the acceleration records. Another possibility is to limit the extent of the risk analysis to what is actually required as in a code-based design. For instance, some seismic codes (e.g., ASCE-7 in the US or NCh2369 in Chile) use a Maximum Credible Earthquake associated to an exceedance probability of 2% in 50 yr, which would lead to significantly smaller scaling factors compared to the scaling factor of up to 20 referred to earlier. In all cases, the decision-maker needs to understand the assumptions or limitations of the methodology used to compute risk.
For this study, the selected ground motions are based on linear scaling factors (SFs) between 2.3 and 4.3 for both sites. This ensures that the intensity range required to adequately determine fragility functions is covered. These scaling factors allow for the attainment of SA exceedance rates of λ y = 10 3 events per year for each group of ground motions; larger scaling factors could affect the median displacement estimate. Recall that engineering systems in Mexico City are designed to reach seismic intensities of λ y = 4 · 10 3 annual exceedance of SA (i.e., return period T R = 250 years) according to Mexican seismic code. Therefore, the scaling factors used are considered adequate.
However, in order to gain insight on how the scaling of seismic excitations affects the assessment of seismic risk in Mexico City, an interesting aspect that is outside the scope of the present study, future studies are recommended.

4. Earthquake-Induced Response of Buildings with Inerter Dampers

To evaluate the influence of ground motions (e.g., intensity and frequency content) on the seismic response of weak first-story RC structures with IDs at their ground level due to narrow-band earthquakes in Mexico City, the earthquake-induced response demands were inspected. First, a SDOF-yielding system with inerter dampers is subjected to narrow-band seismic motions, and its response is compared to an analog system without inerter dampers. Second, the earthquake-induced response demands for weak first-story reinforced concrete (RC) structures for two limit states were examined: (1) seismic intensities associated with the limit state of incipient collapse and (2) seismic intensities associated with the limit state of damage limitation. The former limit state (i.e., incipient collapse) is associated with rare extreme events capable of generating high seismic demands, for which collapse should be prevented to avoid major structural failures and fatalities, although significant damage and residual deformations could occur and may lead to operation interruption and important retrofitting tasks. The latter limit state (i.e., damage limitation) is associate with moderate seismic demands that may occur several times during the life service of the structure, for which only minor damage should occur so that the structure operation and occupancy is not interrupted.
Despite that the studied structures were designed according to the Mexico City 1976 version of the Technical Norms for Seismic Design [25], the current accepted limit states are prescribed in the 2017 edition of the Technical Norms for Seismic Design (NTCS-2017) for Mexico City, which considers the spectral intensities of the limit state of collapse to be associated with a return period of 250 years and the intensities of the limit state of damage limitation to be associated with a return period of 10 years.
This situation obeys to the fact that, currently in Mexico City, there is an important number of structures built in the 1980s; however, due to the scarce economic sources available, it is not feasible to demolish and rebuild such structures. Instead, retrofitting strategies need to be proposed.

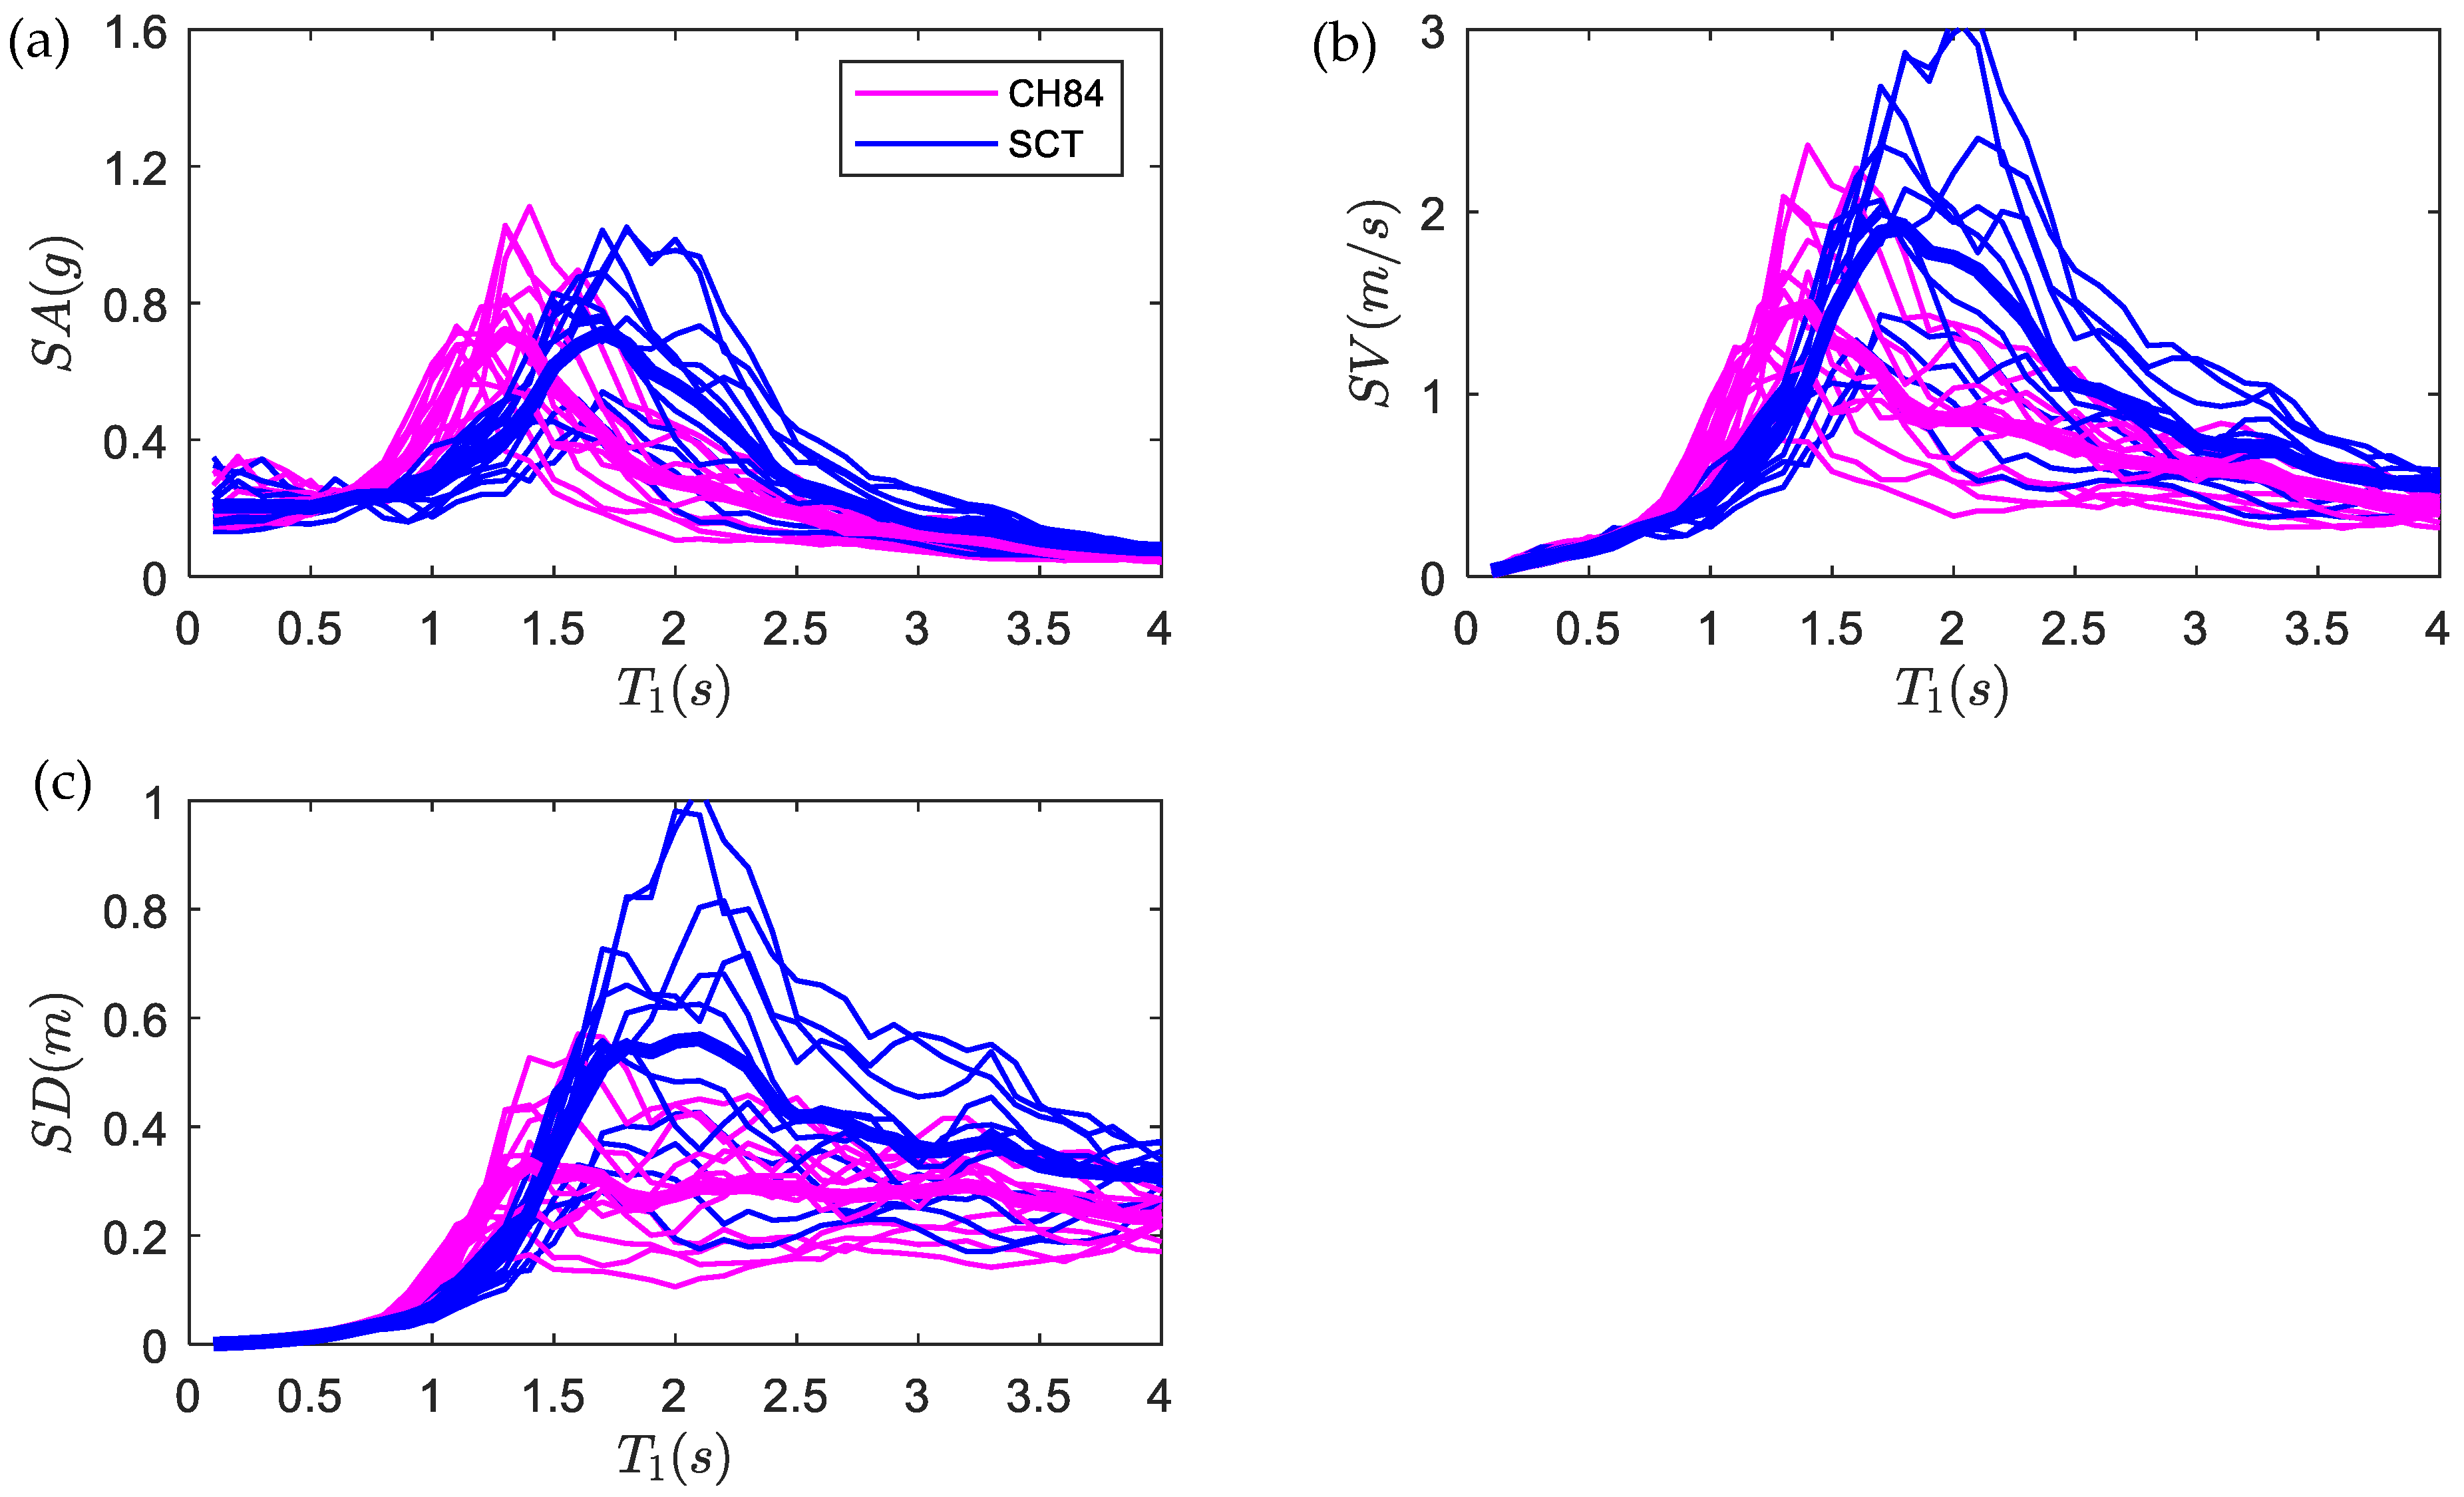
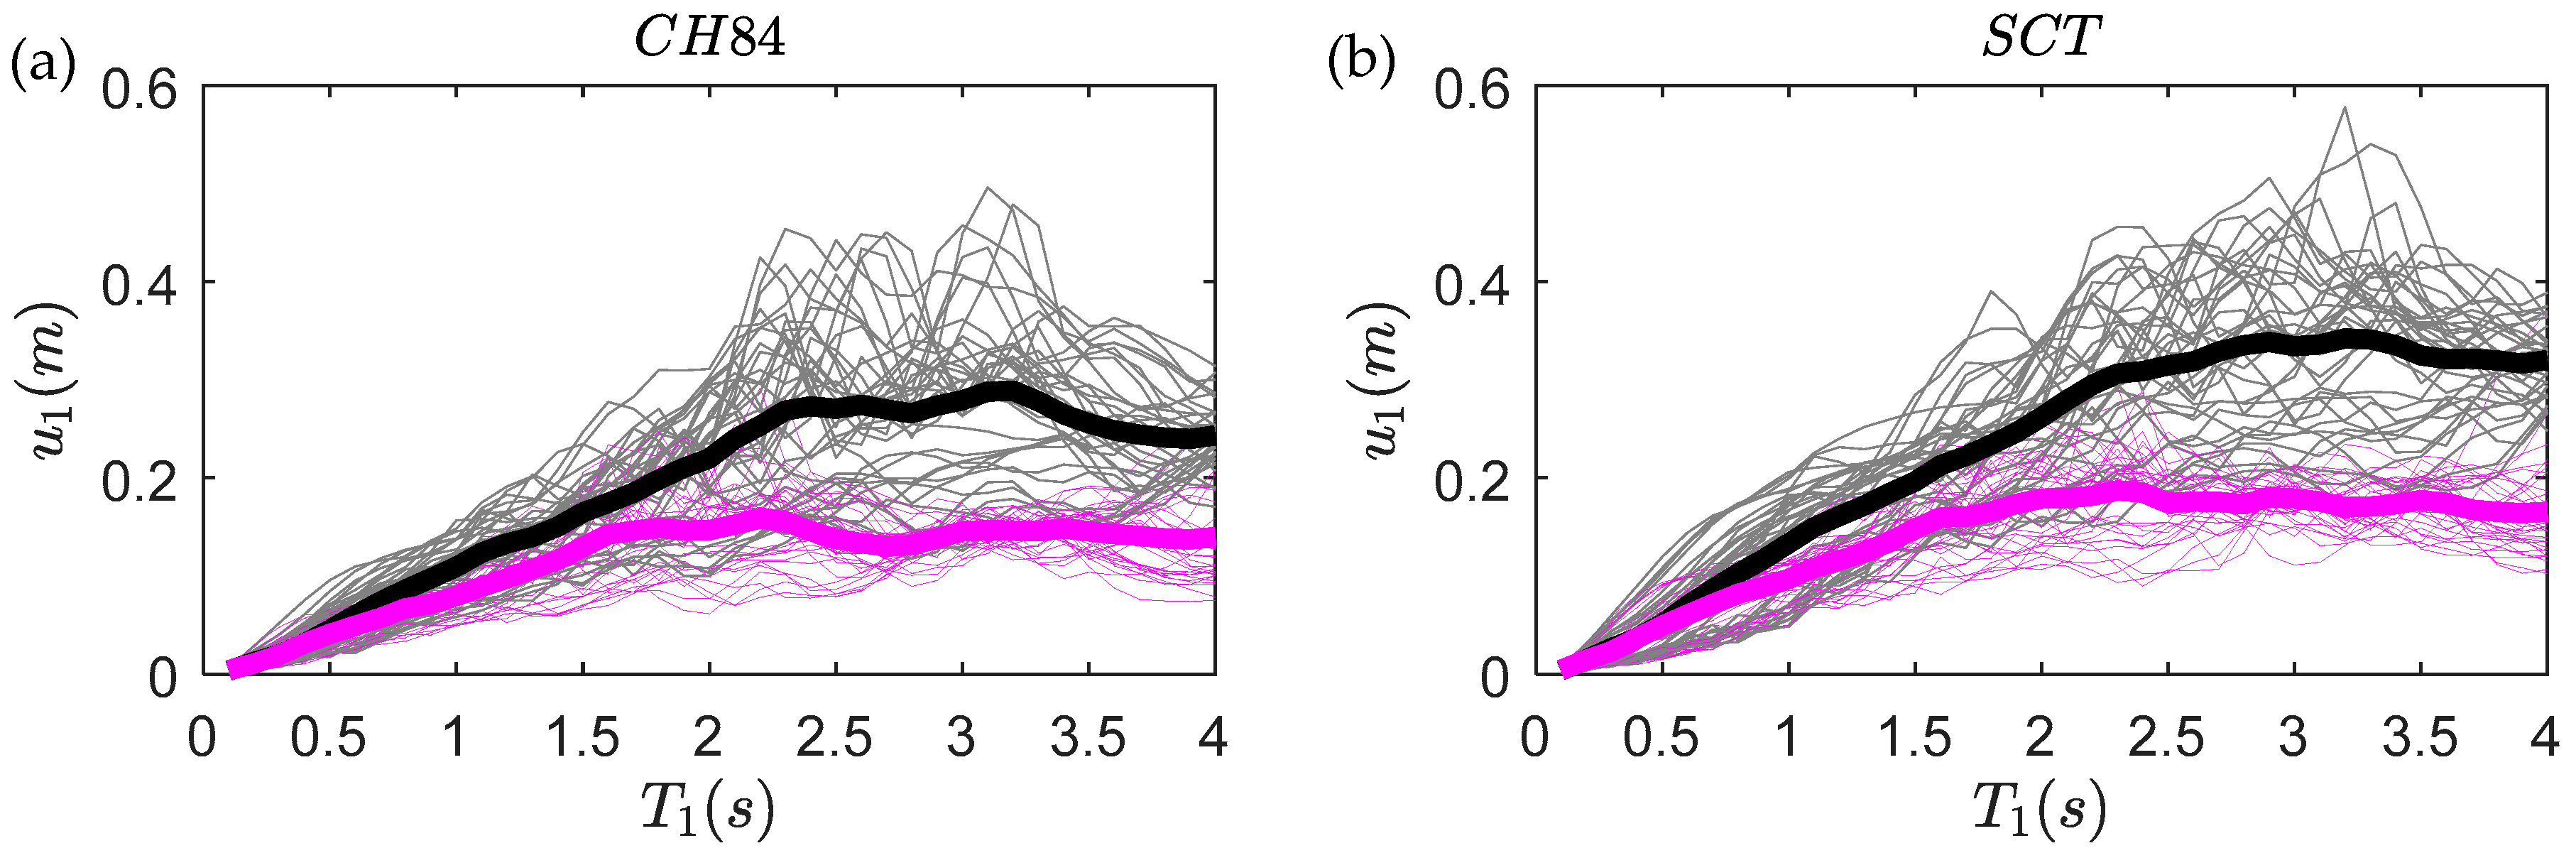
4.1. Seismic Response of Sdof Systems for Synthetic Ground Motion

Figure 9 presents the maximum seismic inelastic displacement of a bilinear ( α = 0.05 ) SDOF system with inerter dampers as described by Equations 1 to 2 with σ = 1 (pink solid lines), which is compared against the response of the same simple bilinear SDOF system but with σ = 0 (gray solid lines). The systems are subjected to the referred synthetic ground motions (station CH84, Figure 8a; station SCT, Figure 8b). The studies on yielding concrete structures to identify parameter values of the Bouc–Wen model (e.g., [50,51] Kunnath et al. 1997; Goda et al. 2009) are the basis for adopting 0.05, 0.95, and 2 for ζ , β , and n , respectively. Moreover, a pre-yielding stiffness equal to k 1 = ω 1 2 m 1 is stipulated as well as a post-yielding stiffness k 1 p o s t = a 1 k 1 and Q 1 as strength. Accordingly, assuming α = 0.05, the yield displacement u y 1 can be determined as [17] u y 1 = Q 1 / k 1 ( 1 α ) = Q 1 / m 1 · T 1 2 / 4 π 2 ( 1 α ) . The other parameter to fully define the structural properties of the SDOF system is the normalized strength Q 1 / m 1 = 0.1 g .
Figure 9 shows the efficiency of the SDOF system with inerter dampers on a stiff frame in reducing the maximum inelastic displacements (solid pink lines for the SDOF system with inerter dampers, both sites). Therefore, introducing inerter damper systems seems to be a very effective measure to reduce peak inelastic responses when they are subjected to narrow-band ground-motions.

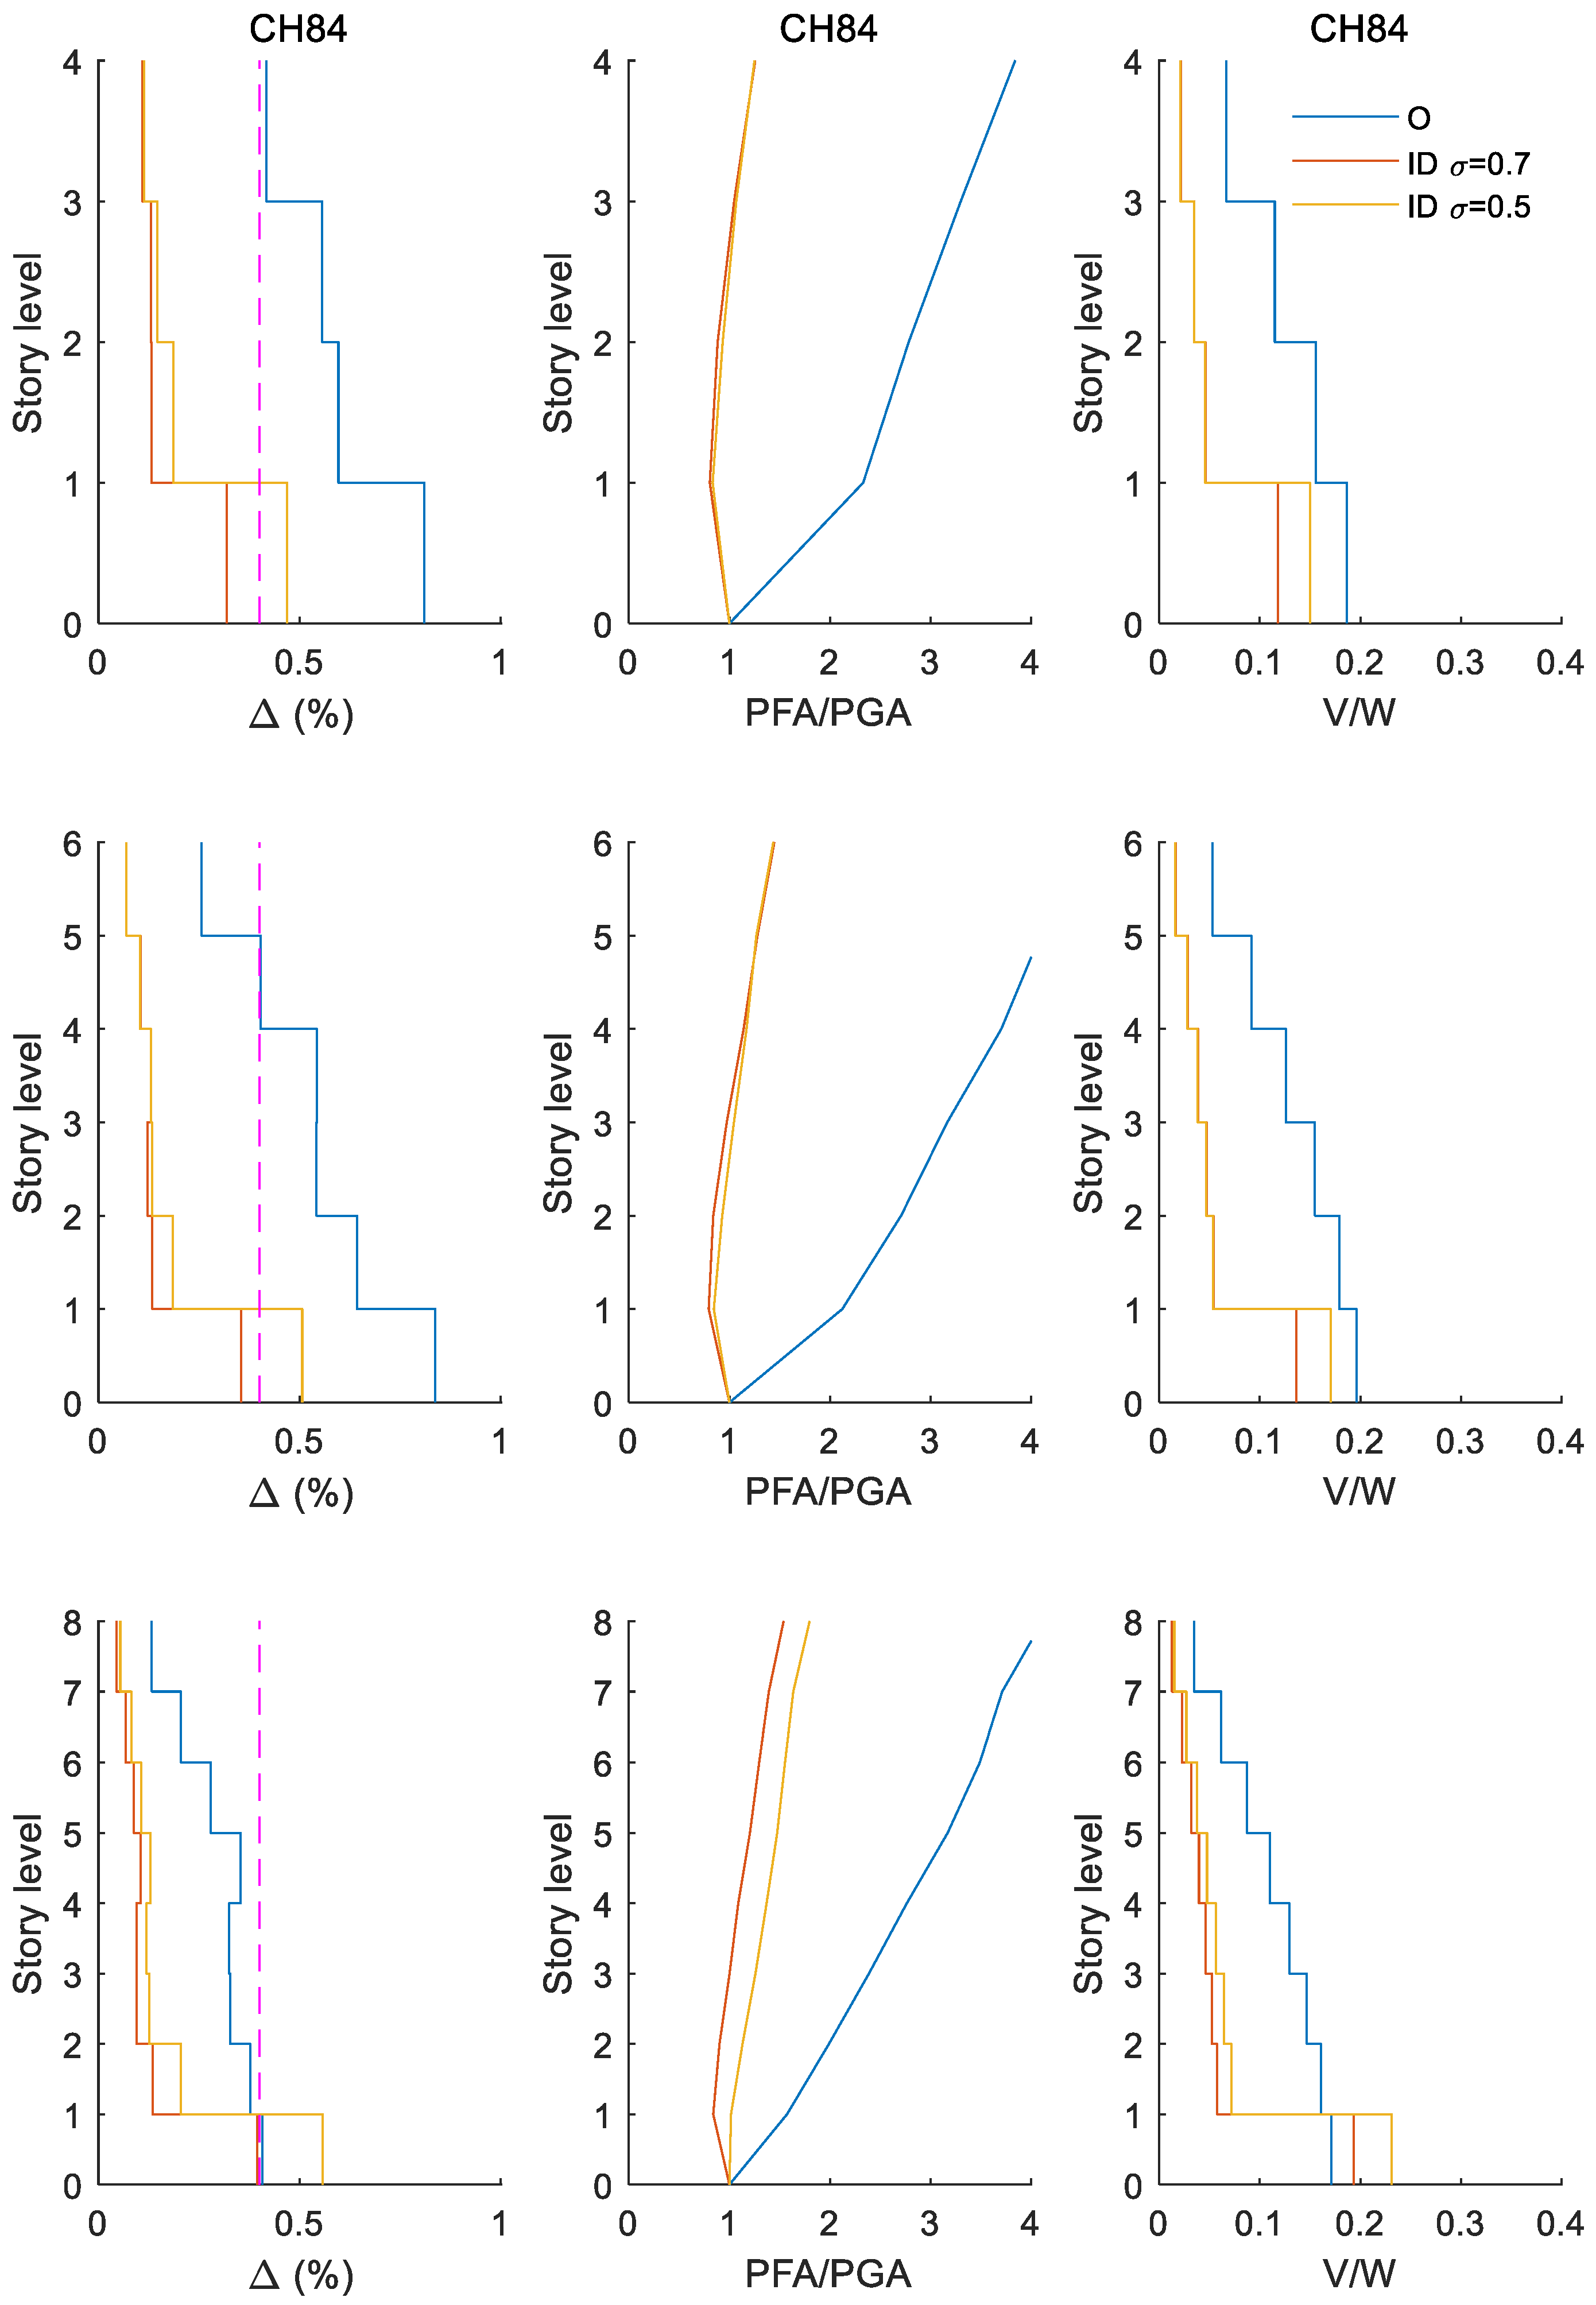
4.2. Influence of Seismic Intensities Associated to Limit State of Collapse

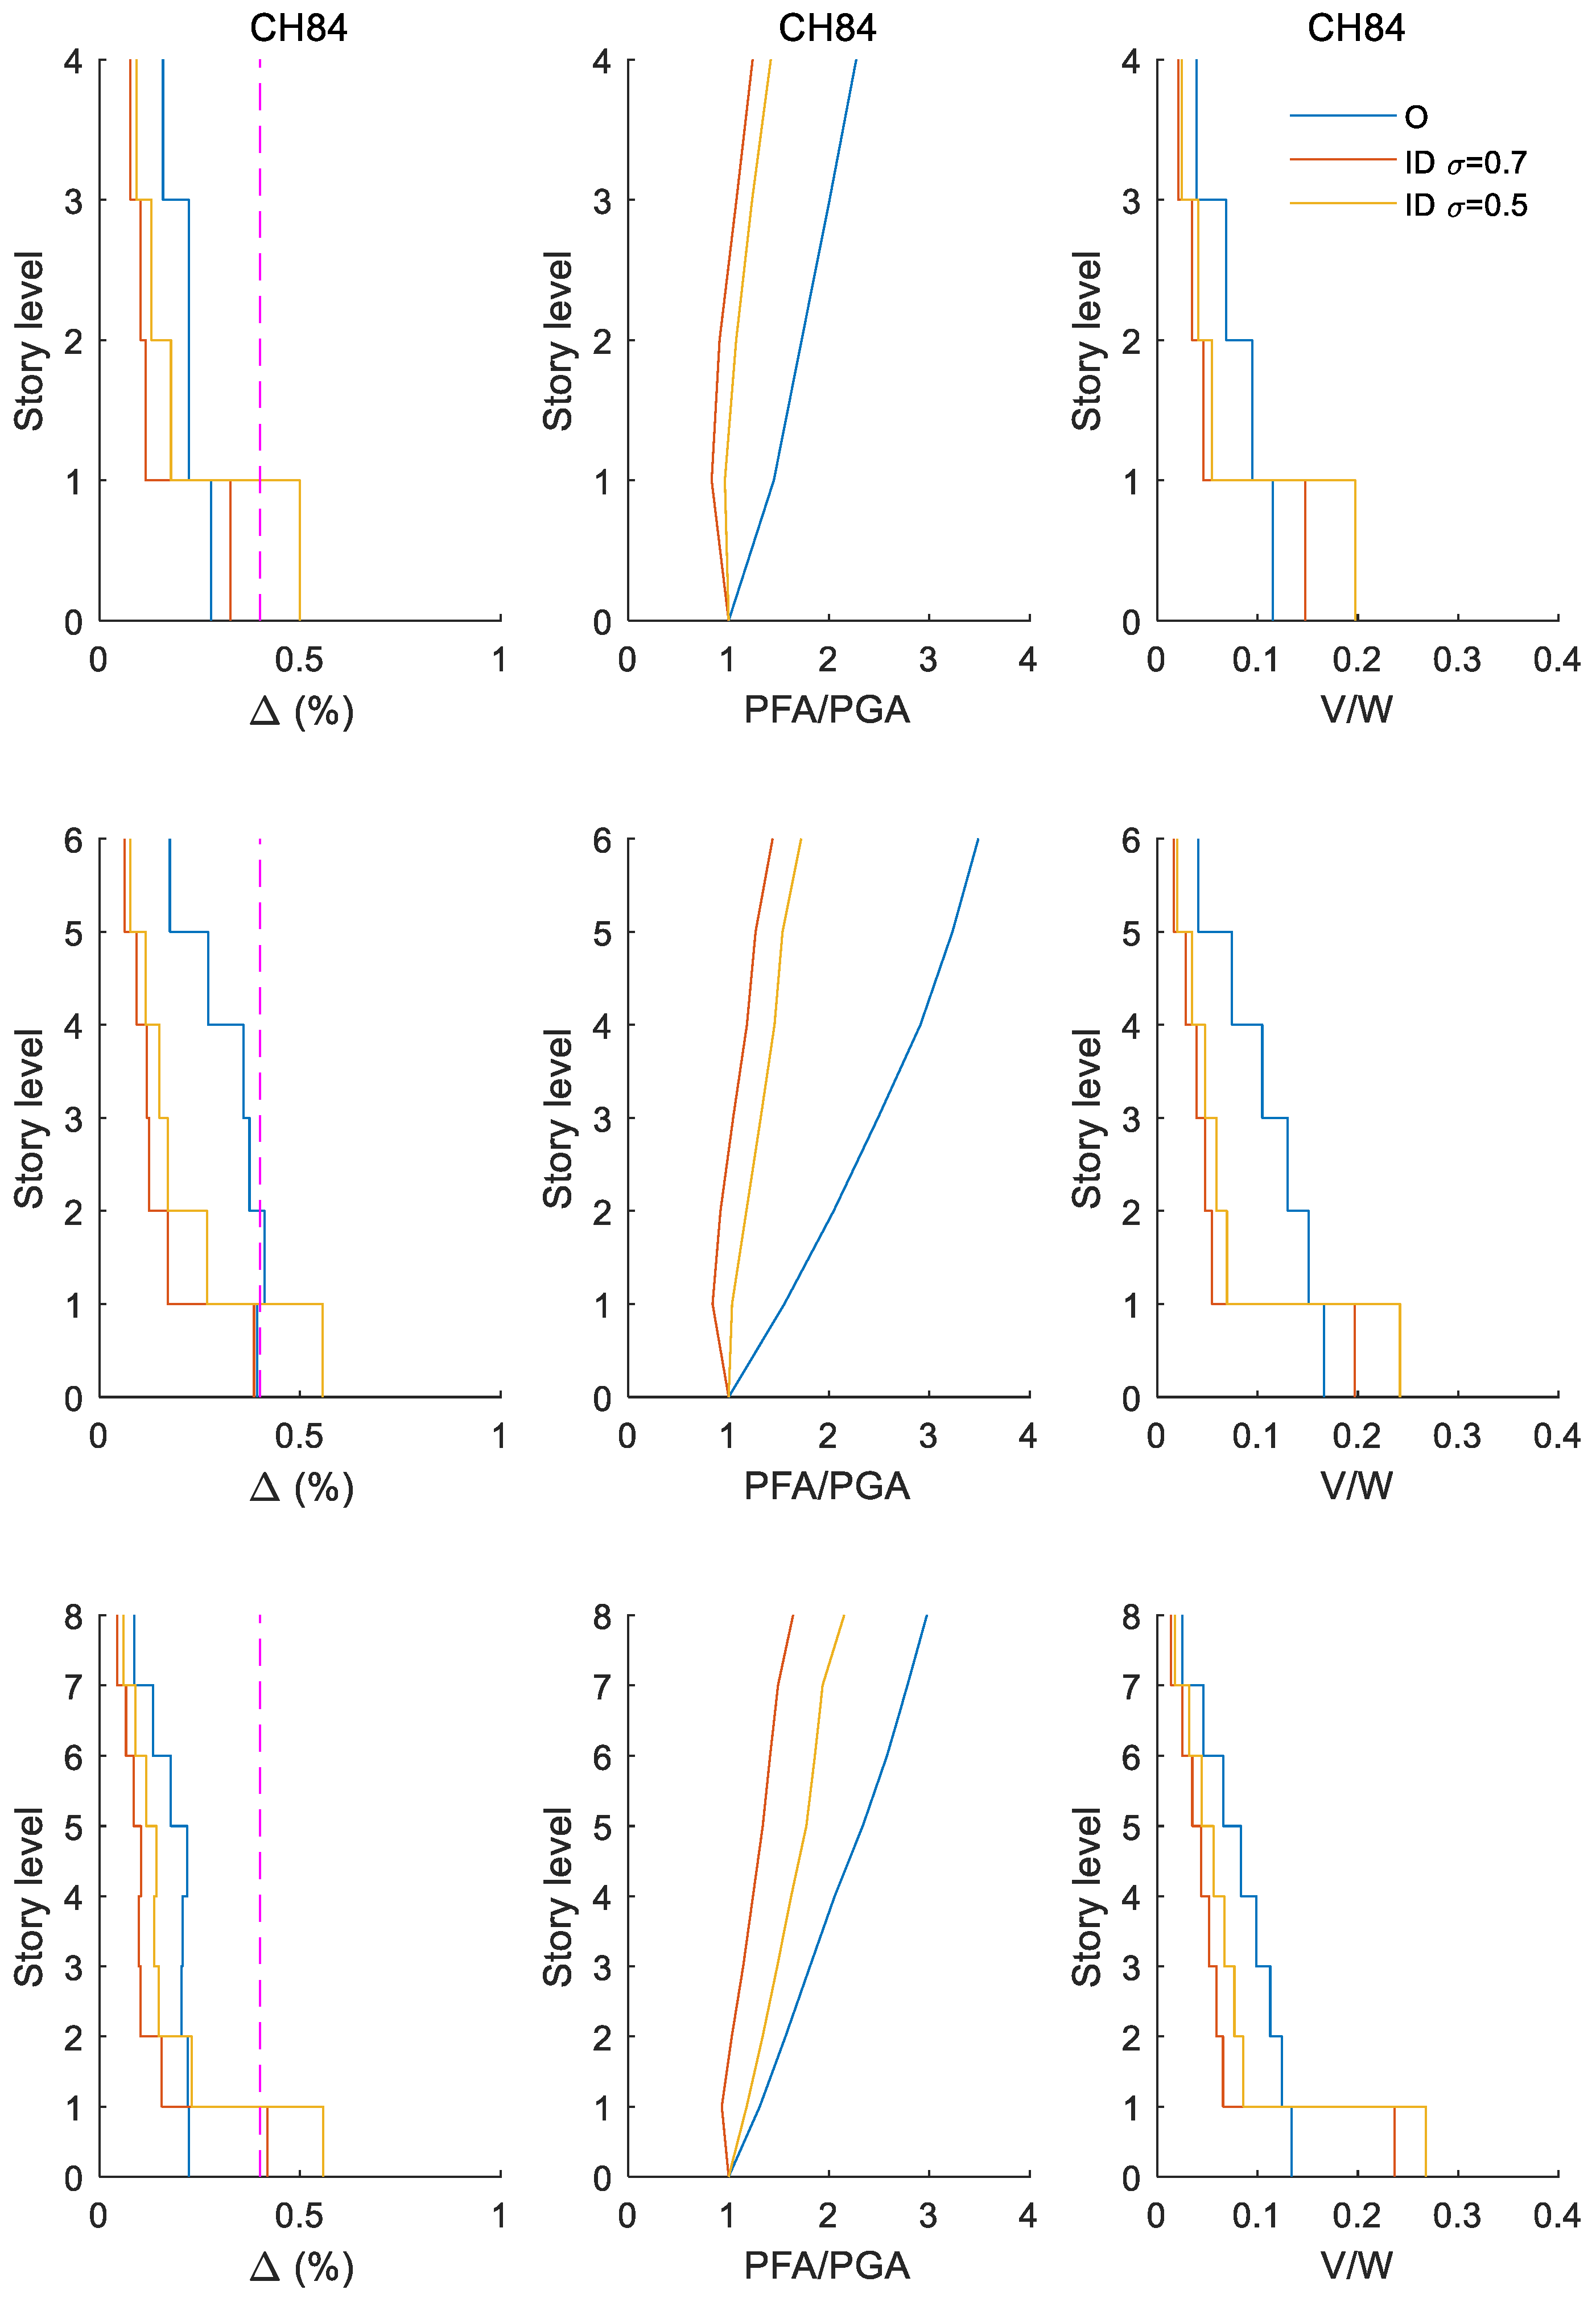
Figure 10 shows a comparison of the height-wise distribution of median peak story drift (left), normalized peak floor acceleration with respect to the ground (middle), and normalized peak shear demands with the building weight (right) for the 4-story building (top), 6-story building (middle), and 8-story building (bottom) with Q = 6 under seismic intensities associated to the limit state of collapse at site CH84 ( T s = 1.4 s), i.e., the drifts (relative displacement between two consecutive stories) should be smaller than the limiting 1.5% drift (NTCS-2017) to be code-compliant. In Figure 10, blue lines show responses for the original buildings without inerters (i.e., O), and orange and yellow lines show the responses for the buildings retrofitted with inerters (i.e., ID) for σ equal to 0.7 and 0.5, respectively. Under these intensities associated to the limit state of collapse, the buildings are considered to have a non-linear behavior. In Figure 10 (left), it can clearly be seen that the drift peak demands are concentrated in the first story, which is typical of a weak first-story mechanism. Notice that the largest drifts are concentrated in the first story for the case without inerters that occurs in the 4-story building (the lowest building); this behavior, also reported by Ruiz-García and Cárdenas [24], was partially attributed to the contribution of the higher modes, which may delay the formation of the weak first-story mechanism in the tallest building [24]. Nevertheless, it is noteworthy that the addition of IDs does not eliminate the weak story. It rather controls the problem induced by the soft-story mechanism from a dynamic standpoint provided that an adequate apparent mass ratio is selected. However, providing an ID device with a larger apparent mass ratio σ (e.g., values larger than 1 for the cases under study) leads to damage in the upper stories as indicated below. Therefore, care should be exercised to adequately select IDs to control lateral displacements.
Figure 10 shows an evident decrease in the median peak story drift as well as in the normalized peak floor acceleration when the buildings are provided with inerter dampers at their ground level (solid yellow and orange lines) versus the original case (solid blue lines). Likewise, similar or reduced median normalized peak shears can be appreciated (depending on the value of σ ) for buildings with inerter dampers with respect to the original buildings. Therefore, introducing inerter dampers can be an effective measure to reduce peak responses concentrated in the first story when buildings are subjected to narrow-band ground motions. However, inerter dampers placed at their ground level could cause drifts to migrate to upper stories because of the backstay effect introduced by the inerter [52,53]. This situation is due to the high σ values of the inerter dampers (e.g., σ = 0.7 ); this can be especially observed in the 6- and 8-story buildings. As mentioned before, the placement of IDs as a seismic displacement-control strategy should be carefully reviewed on a case-by-case basis so that proper parameters are selected to avoid self-defeating results. This migration of larger drifts to upper levels is also reported by Ruiz-García and Cárdenas [24] when the buildings are designed as per the regulations for first weak story in updated seismic provisions (rather than by retrofitting them with inerters as in this study).
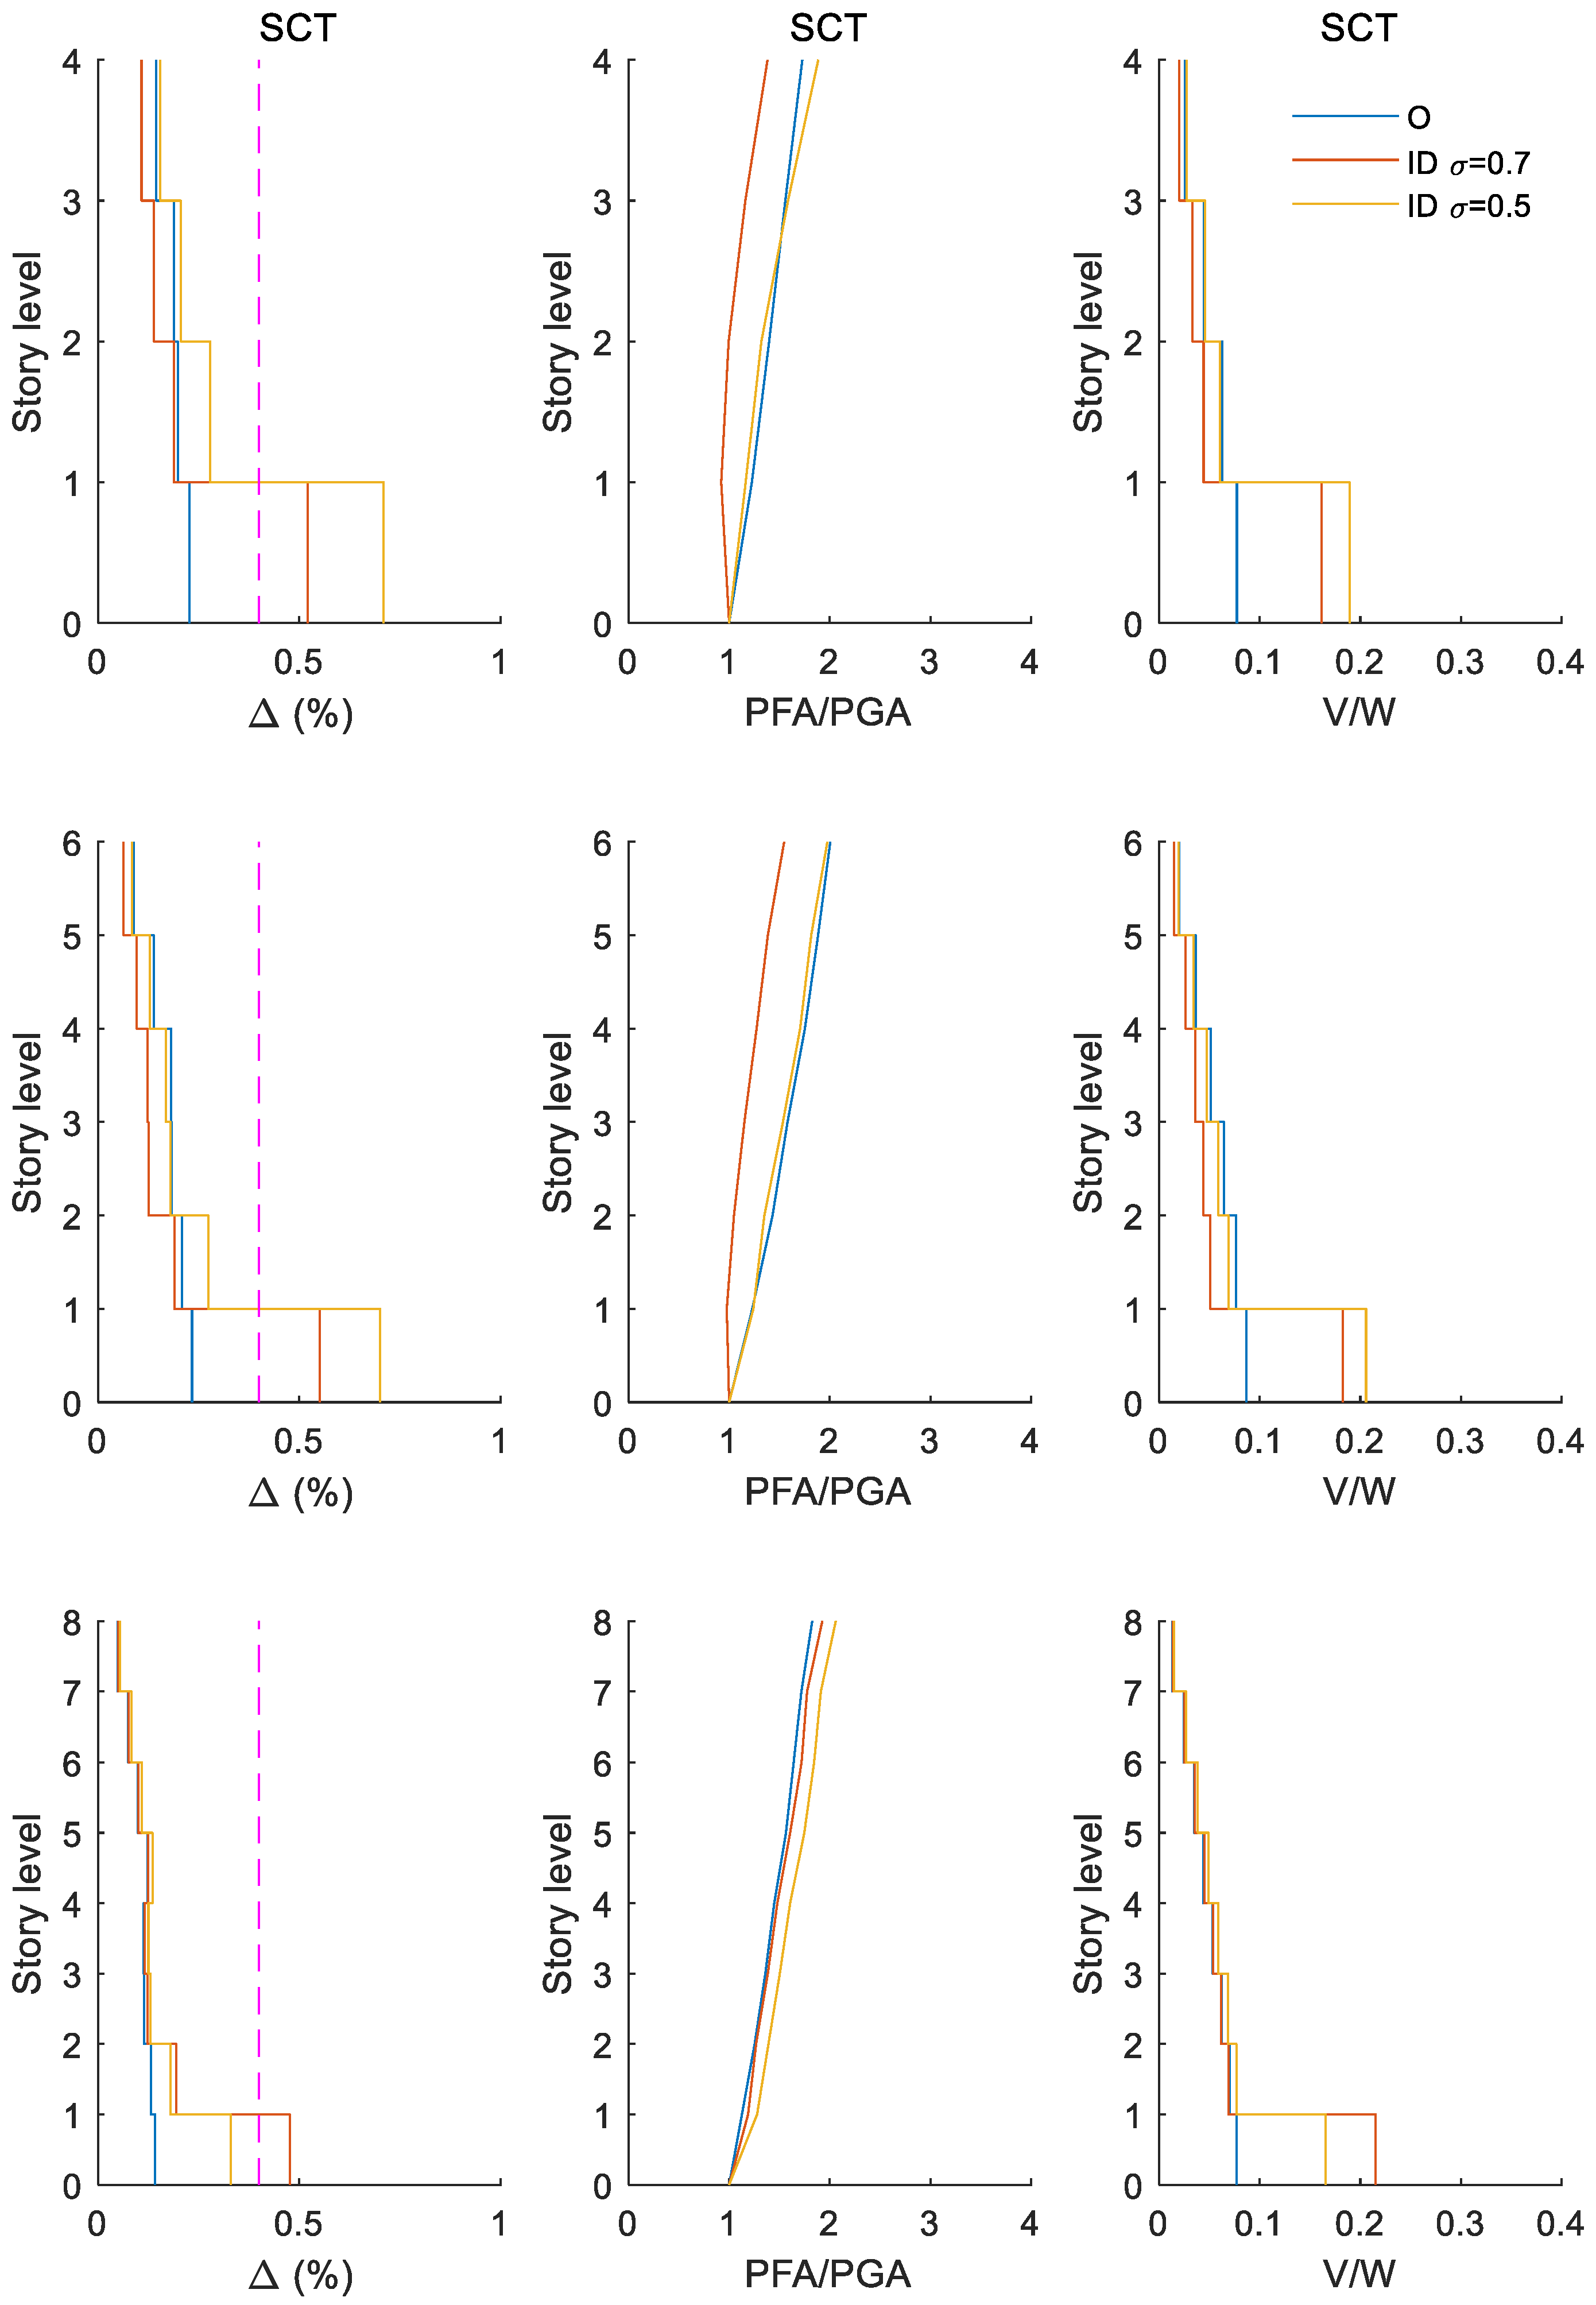
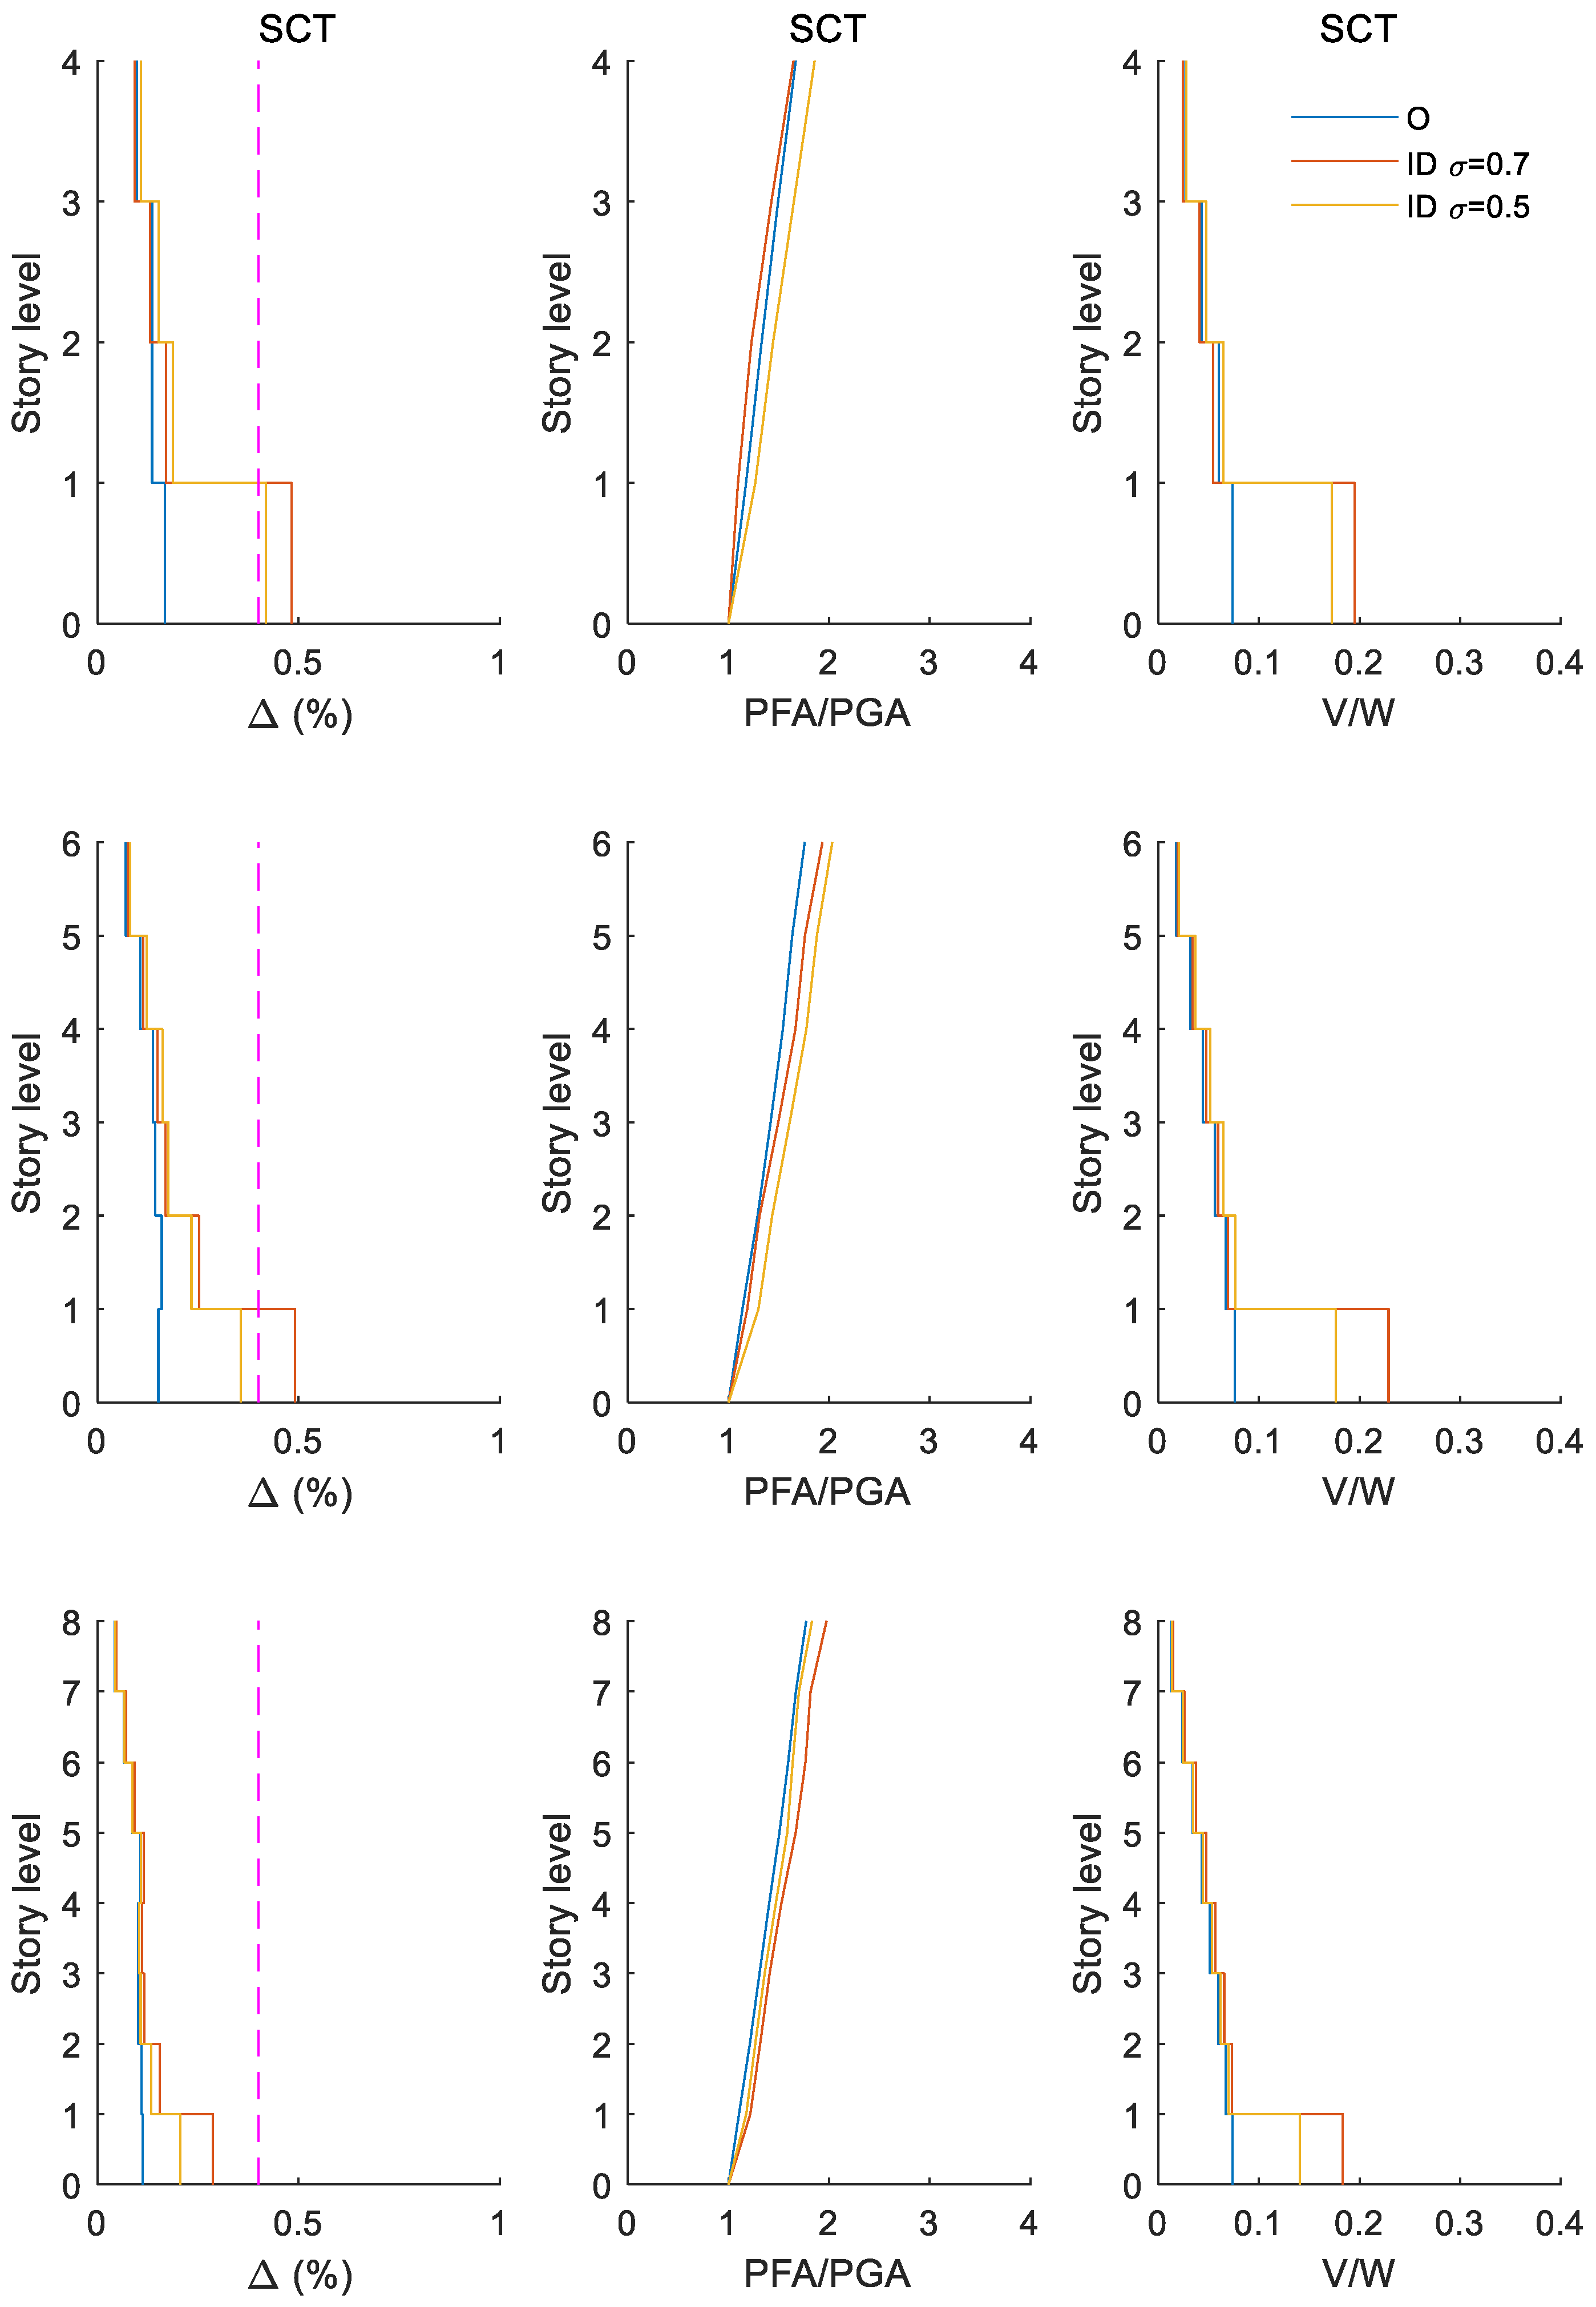
On the other hand, Figure 11 presents a similar comparison as in Figure 10 but for the SCT site ( T s = 1.4 s). It is possible to observe that the original buildings continue to exceed the drift limit value than that observed at the CH84 site (i.e., 1.5%) indicated in the current regulation. However, they present a better behavior (e.g., an evident decrease in the median peak story drift, normalized peak floor acceleration, and normalized peak shear) when the buildings are provided with inerter dampers at their ground level. Therefore, in this case, introducing inerter damper systems is a very effective measure to reduce peak responses along the height of the buildings when they are subjected to narrow-band ground motions associated to limit state of collapse and are designed with Q = 6.
Appendix A contains additional figures for the buildings with Q = 4 . They exhibit similar trends as those showed in Figure 10 and Figure 11 and are not discussed for brevity.

4.3. Influence of Seismic Intensities Associated to Limit State of Damage Limitation

Similarly depicted as in Figure 10 and Figure 11, Figure 12 and Figure 13 show a comparison of the height-wise distribution of median peak story drift (left), normalized peak floor acceleration with respect to the ground (middle), and normalized peak shear demands with the building weight (right) for the 4-story building (top), 6-story building (middle), and 8-story building (bottom) with Q=6 but under seismic intensities associated with the limit state of damage limitation at CH84 ( T s = 1.4 s, Figure 12) and SCT ( T s = 1.4 s, Figure 13), i.e., the drifts should be smaller than the limiting values of 0.4% drift when elements not being part of the structural system are not attached to the building (NTCS-2017). Under these intensities associated with the limit state of damage limitation, the buildings are considered to have a linear behavior. For buildings located at CH84 (Figure 12), it is possible to see a decrease in the median peak story drift (except in the 8-story building) as well as in the normalized peak floor acceleration and peak shear demands when the buildings are provided with inerter dampers at their ground level (solid yellow and orange lines) versus the original case (solid blue lines). Contrarily, for buildings located at SCT (Figure 13), an increase is seen in the median peak story drift and peak shear demands when the buildings are provided with inerter dampers at their ground level (solid yellow and orange lines) versus the original case (solid blue lines). Therefore, for site SCT and intensities associated with the limit state of damage limitation, the inerter dampers do not offer any tangible benefit compared to the original case; it could even be self-defeating. A possible explanation is that, since for this limit state (damage limitation) structures at site SCT are subjected to low intensities and behave linearly, it may cause a delay in the ID deacceleration leading to a faster inerter movement than that of the structure. Subsequently, the ID pushes the structure so that it moves, while in turn the ID and its support must withstand a larger load, generating larger drifts and shear demands at the first floor. This may not occur when the structure exhibits a non-linear behavior as slightly observed for the 8-story building (see Figure 11). Therefore, under high seismic intensities (non-linear behavior), the use of IDs could be beneficial, but this may be reversed under low seismic intensities (linear behavior). In any case, since the frequency content and other aspects may play a role, the design should be carefully reviewed for each case as noted before.
Appendix B contains additional figures for the buildings with Q = 4 . They exhibit similar trends as those showed in Figure 12 and Figure 13 and are not discussed here for brevity.

5. Fragility Functions

For a given engineering demand parameter ( E D P ), its fragility function is defined as the probability that EDP exceeds the demand threshold z conditioned on a ground-motion intensity I M , i.e., P ( E D P > z | I M ) . For the scope of the present work, the E D P is considered to be the peak story drift denoted as D .
The well-known incremental dynamic analysis (IDA) method [54] is used herein to obtain the fragility functions. For this aim, the ground motions were incrementally scaled at constant values of the pseudo-accelerations S A ( T 1 ) , where T 1 is the fundamental period of the weak first-story RC structure. Then, the probabilities of an E D P exceeding a test value z were obtained simply by dividing the number of simulations for which E D P > z by the total number of simulations.
For the development of the fragility functions, scaling of the ground motions to SA ( T 1 = 1 s) ranging from 0.01 to 1.4 g and 0.01 to 0.7 g for sites CH84 and SCT, respectively, was carried out.

5.1. Probability of Failure for Maximum Peak Story Drifts

The probability of failure for the maximum peak story drift demands was evaluated for peak story drifts ranging from 0.001 to 0.04, which accounts for very small or negligible drift demands to very large ones that could trigger secondary effects such as pounding against adjacent structures or lateral instability due to p- δ effects among others.
Let d represent a structure demand of interest. To separate zero and non-zero d (maximum drift demand), the conditional probability of the demand given a ground-motion intensity y is represented by
f D ( d |   y ) = δ ( d d 0 ) p ˜ + ( 1 p ˜ ) f ˜ D ( d )  
where δ ( · ) is the Dirac delta function; d 0 = 0.001 denotes the level deemed null (or practically null) for a structure; all demands that meet D d 0 are concentrated in D = d 0 corresponding to a mass probability denoted as p ˜ ; and f ˜ D ( d ) denotes the probability density function for non-zero displacements. Equation 3 can be used to derive P ( D > d | y ) (i.e., the exceedance probability for a d threshold given an intensity measure value).

5.2. Results of Probability of Failure for Maximum and Residual Displacements

By carrying out incremental dynamic analyses, fragility functions for peak story drifts are computed for each of the structure configurations described in Section 2.
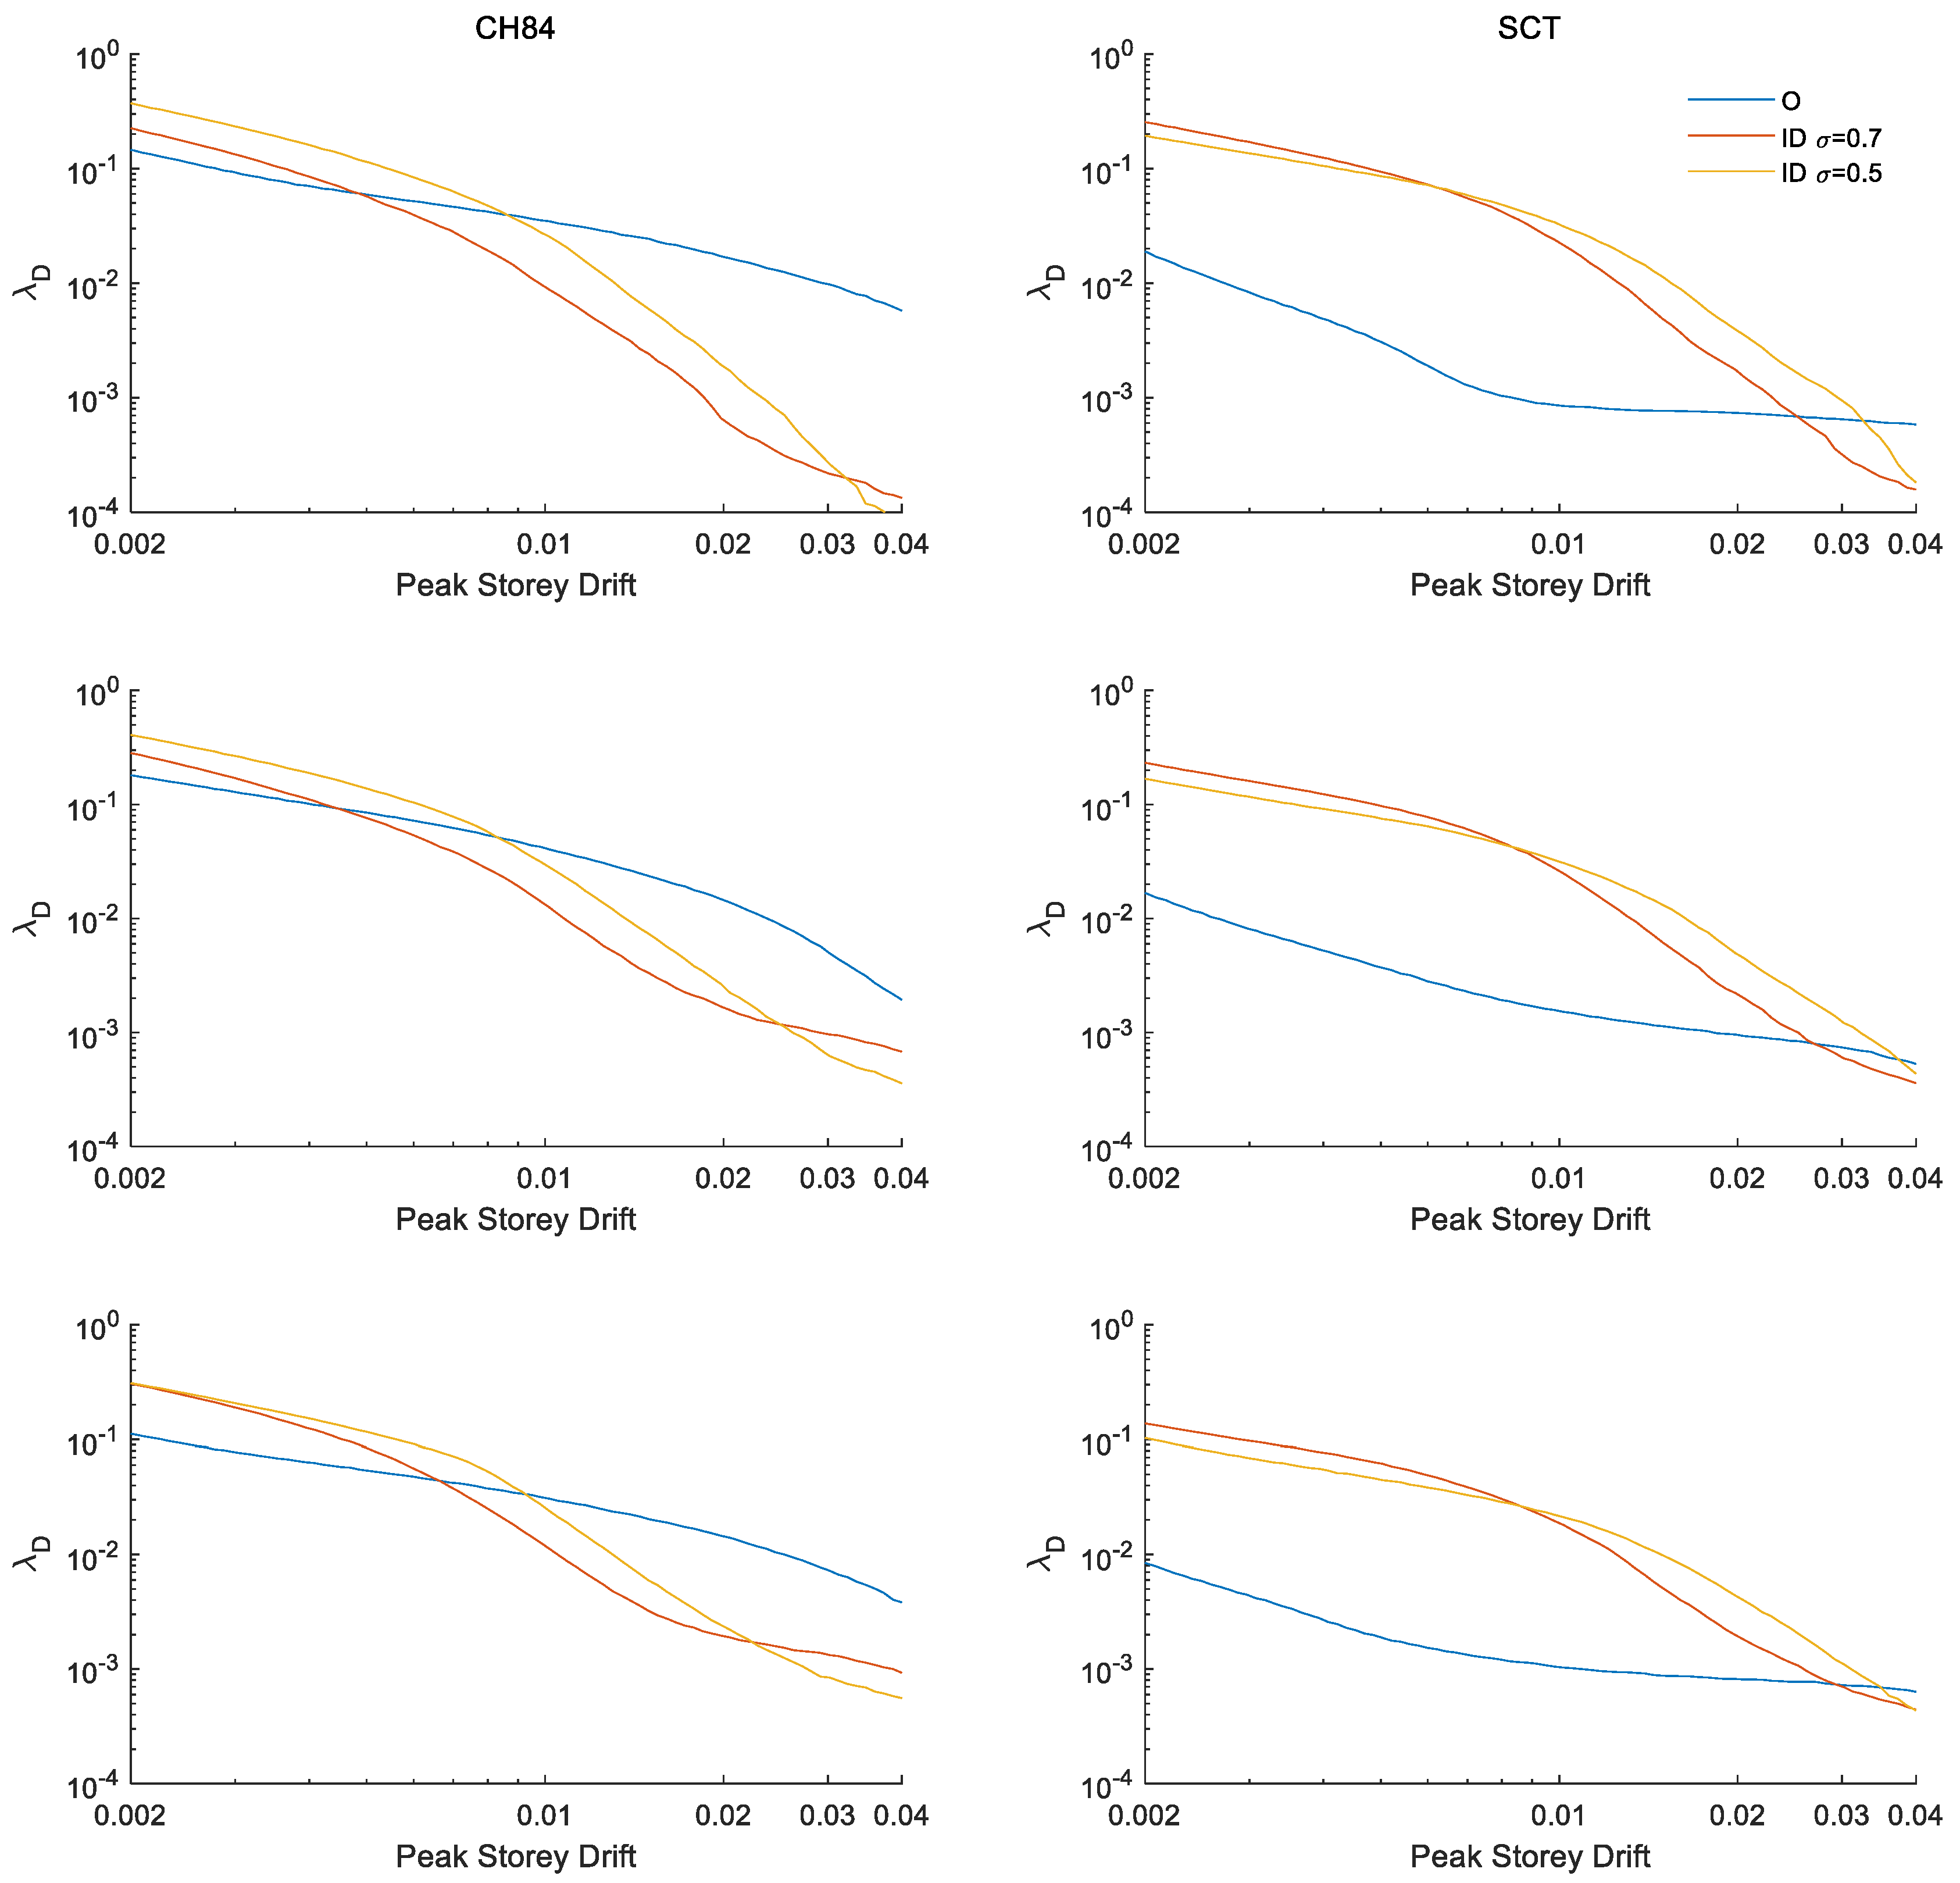
An illustrative example of the fragility functions of maximum peak story drift conditioned on three ground-motion intensities, y = 0.2 ,   0.4 , and 0.6   g , is presented in Figure 14 for the 4-story building (top), 6-story building (middle), and 8-story building (bottom) with Q = 6. Fragility functions are presented in Figure 14 for sites at CH84 (left) as well as for SCT (right). This example illustrates that the ground motion’s frequency content has a huge effect on the peak story drift fragility (right) for structures considering inerter dampers. For instance, it is apparent that the probability that D exceeds a value d as a function of the intensity y = SA ( T = 1   s ) is larger for site CH84 (i.e., high-frequency ground motions of approximately 0.71 Hz; Figure 14 left) than for site SCT (i.e., low-frequency ground motions of approximately 0.52 Hz; Figure 14 right). Finally, it is observed that, when structures include inerter dampers at their ground level, the probabilities of exceeding certain peak story drift are smaller than for a structure without inerter dampers for large ground-motion intensities (e.g., y = 0.6 g) at both sites. However, for moderate ground-motion intensities (e.g., y = 0.2 g), this trend can be reversed mainly for site SCT where the inerter dampers do not offer any benefit compared to the original case.
Appendix C contains additional figures for the buildings with Q = 4 . They exhibit similar trends as those showed in Figure 14 and are not discussed for brevity.

6. Earthquake-Induced Risk Assessment

The assessment of the seismic risk is conducted by following the studies by Esteva [55,56], Cornell [57], and Der Kiureghian [58]. Let λ y ( y ) denote the seismic hazard curve for a given site and P ( D > d   |   y ) the fragility function for d . The convolution of the latter and the former yields the drifts exceedance rate λ D ( d ) of the buildings expressed as
λ D ( d ) = y | d λ y ( y ) d y | P ( D > d   |   y ) d y
The functions defining the rate of exceedance in terms of damage λ D ( d ) were computed by solving the integral in Equation (4) numerically. Salient findings are summarized below.

6.1. Maximum Peak Story Drift

Figure 15 shows a direct comparison of the damage rate functions for the maximum peak story drift λ D ( d ) for the 4-story building (top), 6-story building (middle), and 8-story building (bottom) with Q = 6 at sites CH84 (left) and SCT (right). From the results in Figure 15, the reliability structures at sites CH84 ( T s ~ 1.35   s ) and SCT ( T s ~ 1.9   s ) with inerter dampers at their ground level in terms of maximum peak story drift is shown to be generally higher than that of structures without inerter dampers over the range of 5 · 10 2 to ~ 10 4 and 1.4 · 10 3 to ~ 10 4 annual exceedance for sites CH84 and SCT, respectively, i.e., seismic intensities where the buildings are considered to engage in non-linear behavior. For ranges larger than 5 · 10 2 and 1.4 · 10 3 of annual exceedance, the reliability begins to decrease or the risk begins to increase, i.e., for seismic intensities where the buildings are considered to have a linear behavior. Therefore, the inerter dampers effectively suppress the inelastic displacements of buildings (e.g., buildings under seismic intensities associated to limit state of collapse), especially of low-height buildings. In contrast, inerter dampers can induce larger elastic displacements for buildings under intensities associated to the limit state of damage limitation. Other dampers could be investigated in future works as a measure to prevent this behavior, e.g., clutched inerters (e.g., [52,53]).
Appendix D contains additional figures for the buildings with Q = 4 . They exhibit similar trends as those showed in Figure 15 and are not discussed for the sake of brevity.

6.2. Maximum Peak Story Drift for Buildings Q = 6 Versus Q = 4

Similar to Figure 15, Figure 16 shows a direct comparison of the risk curves for the maximum peak story drift λ D ( d ) for the 4-story building (top), 6-story building (middle), and 8-story building (bottom) with Q = 6 versus Q = 4 at sites CH84 (left) and SCT (right). It is evident that the reliability is higher or the risk is lower for buildings with Q = 4 (pink lines) compared to buildings with Q = 6 (blue lines) with or without inerter dampers at their ground level for both sites. Similarly depicted as for Figure 15, Figure 16 shows that the inerter dampers effectively suppress the inelastic displacements of buildings (e.g., buildings under seismic intensities associated to limit state of collapse), especially of low-height buildings, while inerter dampers can induce larger elastic displacements (e.g., buildings under intensities associated to the limit state of damage limitation) as was noted before. Extending the results of the present study to include wide-band excitations and buildings with different dynamic characteristics is out of the scope of this study, but it is highly recommended for future research.

7. Conclusions

This study evaluates the reliability of weak first-story reinforced concrete (RC) structures with inerter dampers at their ground level in terms of their maximum story drift due to narrow-band seismic excitations. A set of low-to-medium height buildings designed in accordance with the 1976 old edition of the Technical Norms for Seismic Design (NTC-1976) of Mexico City was used to inspect the feasibility of retrofitting old existing structures with inerter dampers. Fragility functions were determined by means of incremental dynamic analyses (IDA) and a dataset of narrow-band ground motions in Mexico City consistent with the current seismic regulations. In addition, the damage rate function for bare structures and structures equipped with inerter dampers was computed and compared.
The seismic response of weak first-story RC structures is computed considering narrow-band seismic excitations recorded during the large 1985 and 2017 Mexico earthquakes. These seismic events caused significant damage to structures in Mexico City mostly in the lakebed zone. Furthermore, the site effects for places located on soft soils are investigated thoroughly because, for these narrow-band seismic excitations, the frequency contents can differ importantly, which is very relevant in relation to the seismic demand of the structures with inerters. Low-frequency seismic excitations (i.e., predominant period Ts~1.9 s) result in larger seismic demands in relation to those from the high-frequency ground motions (i.e., Ts~1.35s) according to the findings in this study. It should be noted that different results could be obtained for structures with different dynamic characteristics (e.g., buildings with larger structural periods). This could be investigated in future research.
From the cases analyzed, the following findings can be highlighted:
1.
The results of fragility functions indicate that the ground motions with high frequency (e.g., site CH84, T s ~ 1.35   s ) yield larger peak drifts for structures with inerter dampers compared to the ground motions with low frequency (e.g., site SCT, T s ~ 1.9   s ). Likewise, it is observed that, when structures include inerter dampers at their ground level, the probabilities of exceeding certain peak story drift are less than those in structures without inerter dampers for large ground-motion intensities at both sites. On the contrary, for moderate ground-motion intensities, this trend can be reversed, which is particularly evident for site SCT where the inerter dampers do not offer benefits compared to the original case.
2.
The results show that, for the maximum peak story drift, the reliabilities of structures with inerter dampers at their ground level are in general higher or the risks are lower for buildings under seismic intensities associated with limit state of collapse (i.e., very high seismic demands), especially for low-height buildings. Improvements in order of half of the original response were observed. However, for buildings under intensities associated with the limit state of damage limitation (i.e., relatively common seismic demands during the service life of the building), the reliability of structures with inerter dampers could be less than those of structures without IDs.
3.
Therefore, it is concluded that inerter dampers are an effective retrofitting alternative for improving the seismic behavior of weak first-story buildings that undergo inelastic behavior (very large seismic intensities associated with the incipient collapse limit state); however, this is not the case (and it actually could be self-defeating) for controlling lateral demands for buildings that behave linearly (under moderate seismic intensities associated with the limit state of damage limitation). This applies to the cases studied in the present research. Further investigation is recommended for other structures and ground motions.
4.
It is noteworthy that providing inerter dampers to the building does not eliminate the weak first story, but it controls the problem induced by the weak first-story mechanism from a dynamic point of view provided that adequate parameters of the inerter dampers are selected. If an ID device with larger apparent mass ratio is selected (e.g., >1 for the studied cases), damage in the upper stories could be expected. Therefore, care should be taken to adequately select IDs to control lateral displacements.
Finally, it is considered that future investigations should be aimed at better exploring control systems for seismic protection, e.g., clutched inerters, to improve the response of structures under intensities associated to the limit state of damage limitation, and a cost- benefit analysis should be performed.

Author Contributions

Conceptualization, M.A.J., S.T. and M.N.; methodology, M.A.J.; software, M.A.J. & S.T.; validation, M.A.J., S.T., M.N., A.D.G. and I.F.; formal analysis, M.A.J., S.T., I.F. and A.D.G.; investigation, M.A.J., I.F., A.D.G., F.A.G. and M.N; resources, M.A.J.; data curation, M.A.J. and M.N.; writing—original draft preparation, M.A.J., A.D.G. and M.N.; writing—review and editing, M.A.J., A.D.G., F.A.G. and M.N.; visualization, M.A.J., S.T., F.A.G. and M.N.; supervision, M.A.J.; project administration, M.A.J.; funding acquisition, M.A.J. All authors have read and agreed to the published version of the manuscript.

Funding

This research was financially supported by the Project IN102021—PAPIIT-UNAM Estudio de riesgo sísmico de rehabilitación de edificios existentes denominados de planta baja débil con un sistema inercial rotacional. Additional support was sponsored by Instituto de Ingeniería at UNAM through the Research Fund R528.

Acknowledgments

We would like to thank Christian Málaga-Chuquitaype from Imperial College London for his comments and suggestions. The authors are also thankful for the comments made by three anonymous reviewers, all of which improved and clarified this study.

Conflicts of Interest

The authors declare no conflict of interest.

Appendix A. Seismic Response for Buildings of Q = 4 Subjected to a Set Earthquakes Whose Seismic Intensities Are Associated to Limit State of Collapse

Figure A1. Seismic response of 4- (top), 6- (middle), and 8-story buildings of Q = 4 with and without inerter dampers subjected to a set of earthquakes whose seismic intensities are associated to limit state of collapse (i.e., λ y = 4 · 10 3 annual exceedance of SA, T_R = 250 years) at site CH84. (Left) median peak story drift demands; (middle) median normalized peak floor acceleration demands with respect to the ground; and (right) median normalized peak shear demands with the building weight.
Buildings 13 00929 g0a1
Figure A2. Seismic response of 4- (top), 6- (middle), and 8-story buildings of Q = 4 with and without inerter dampers subjected to a set of earthquakes whose seismic intensities are associated to limit state of collapse (i.e., λ y = 4 · 10 3 annual exceedance of SA, T_R = 250 years) at site SCT. (Left) median peak story drift demands; (middle) median normalized peak floor acceleration demands with respect to the ground; and (right) median normalized peak shear demands with the building weight.
Buildings 13 00929 g0a2

Appendix B. Seismic Response for Buildings of Q = 4 Subjected to a Set Earthquakes Whose Seismic Intensities Are Associated to Limit State of Damage Limitation

Figure A3. Seismic response of 4- (top), 6- (middle), and 8-story buildings of Q = 4 with and without inerter dampers subjected to a set of earthquakes whose seismic intensities are associated to limit state of damage limitation (i.e., λ y = 10 1 annual exceedance of SA, T_R = 10 years) at site CH84. (Left) median peak story drift demands; (middle) median normalized peak floor acceleration demands with respect to the ground; and (right) median normalized peak shear demands with the building weight.
Buildings 13 00929 g0a3
Figure A4. Seismic response of 4- (top), 6- (middle), and 8-story buildings of Q = 4 with and without inerter dampers subjected to a set of earthquakes whose seismic intensities are associated to limit state of damage limitation (i.e., λ y = 10 1 annual exceedance of SA, T_R = 10 years) at site SCT. (Left) median peak story drift demands; (middle) median normalized peak floor acceleration demands with respect to the ground; and (right) median normalized peak shear demands with the building weight.
Buildings 13 00929 g0a4

Appendix C. Fragility Function for Maximum Peak Story Drift for Buildings of Q = 4

Figure A5. Fragility functions for maximum peak story drift for 4- (top), 6- (middle), and 8-story buildings of Q = 4 located at sites CH84 (left) and SCT (right) considering inerter dampers with σ = 0.7 (dotted lines) and without them (solid lines) at their ground level.
Buildings 13 00929 g0a5

Appendix D. Risk Curves for Maximum Peak Story Drift for Buildings of Q = 4

Figure A6. Risk curves for maximum peak story drift for 4- (top), 6- (middle), and 8-story buildings of Q = 4 located at sites CH84 (left) and SCT (right) considering inerter dampers and without them at their ground level 4.
Buildings 13 00929 g0a6

References

  1. Villaverde, R.V. Explanation for the numerous upper floor collapses during the 1985 Mexico City earthquake. Earthq. Eng. Struct. Dyn. 1991, 20, 223–2410. [Google Scholar]
  2. Hall, J.F.; Heaton, T.H.; Halling, M.W.; Wald, D.J. Near-source ground motion and its effects on flexible buildings. Earthq. Spectra 1995, 11, 569–605. [Google Scholar] [CrossRef] [Green Version]
  3. Alavi, B.; Krawinkler, H. Behavior of moment-resisting frame structures subjected to near-fault ground motions. Earthq. Eng. Struct. Dyn. 2004, 33, 687–706. [Google Scholar] [CrossRef]
  4. Alavi, B.; Krawinkler, H. Strengthening of moment-resisting frame structures against near-fault ground motion effects. Earthq. Eng. Struct. Dyn. 2004, 33, 707–722. [Google Scholar] [CrossRef]
  5. Rosenblueth, E.; Meli, R. The 1985 Mexico earthquake. Concr. Int. 1986, 8, 23–34. [Google Scholar]
  6. AIJ. Report on the Hanshin-Awaji Earthquake Disaster-Building Series. In Volume 1: Structural Damage to Reinforced Concrete Building; Architectural Institute of Japan (AIJ): Tokyo, Japan, 1997. (In Japanese) [Google Scholar]
  7. AIJ. Preliminary Reconnaissance Report of the 2011 Tohoku-Chiho Taiheiyo-Oki Earthquake; Architectural Institute of Japan (AIJ): Tokyo, Japan, 2011; pp. 105–111. (In Japanese) [Google Scholar]
  8. Galvis, F.A.; Miranda, E.; Heresi, P.; Dávalos, H.; Ruiz-García, J. Overview of collapsed buildings in Mexico City after the 19 September 2017 (Mw7. 1) earthquake. Earthq. Spectra 2020, 36, 8755293020936694. [Google Scholar] [CrossRef]
  9. Lago, A.; Trabucco, D.; Wood, A. Damping Technologies for Tall Buildings: Theory, Design Guidance and Case Studies; Butterworth-Heinemann: Oxford, UK, 2018. [Google Scholar]
  10. Arakaki, T.; Kuroda, H.; Arima, F.; Inoue, Y.; Baba, K. Development of seismic devices applied to ball screw: Part 1 Basic performance test of RD-series. AIJ J. Technol. Des. 1999, 5, 239–244. [Google Scholar] [CrossRef] [PubMed] [Green Version]
  11. Arakaki, T.; Kuroda, H.; Arima, F.; Inoue, Y.; Baba, K. Development of seismic devices applied to ball screw: Part 2 Performance test and evaluation of RD-series. AIJ J. Technol. Des. 1999, 5, 265–270. [Google Scholar] [CrossRef] [Green Version]
  12. Hwang, J.S.; Kim, J.; Kim, Y.M. Rotational inertia dampers with toggle bracing for vibration control of a building structure. Eng. Struct. 2007, 29, 1201–1208. [Google Scholar] [CrossRef]
  13. Lazar, I.F.; Neild, S.A.; Wagg, D.J. Using an inerter-based device for structural vibration suppression. Earthq. Eng. Struct. Dyn. 2014, 43, 1129–1147. [Google Scholar] [CrossRef] [Green Version]
  14. Makris, N.; Kampas, G. Seismic protection of structures with supplemental rotational inertia. J. Eng. Mech. 2016, 142, 04016089. [Google Scholar] [CrossRef]
  15. Málaga-Chuquitaype, C.; Menendez-Vicente, C.; Thiers-Moggia, R. Experimental and numerical assessment of the seismic response of steel structures with clutched inerters. Soil Dyn. Earthq. Eng. 2019, 121, 200–211. [Google Scholar] [CrossRef]
  16. Makris, N.; Moghimi, G. Displacements and forces in structures with inerters when subjected to earthquakes. J. Struct. Eng 2019, 145, 04018260. [Google Scholar] [CrossRef]
  17. Moghimi, G.; Makris, N. Seismic response of yielding structures equipped with inerters. Soil Dyn. Earthq. Eng. 2021, 141, 106474. [Google Scholar] [CrossRef]
  18. Smith, M.C. Synthesis of mechanical networks: The inerter. IEEE Trans. Autom. Control 2002, 47, 1648–1662. [Google Scholar] [CrossRef] [Green Version]
  19. Papageorgiou, C.; Smith, M.C. Laboratory experimental testing of inerters. In Proceedings of the 44th IEEE Conference on Decision and Control, Seville, Spain, 15 December 2005; pp. 3351–3356. [Google Scholar]
  20. Patton, W.J. Mechanical Power Transmission; Prentice Hall: Upper Saddle River, NJ, USA, 1980. [Google Scholar]
  21. Bouc, R. Modele mathematique d’hysteresis. Acustica 1971, 21, 16–25. [Google Scholar]
  22. Wen, Y.K. Method for random vibration of hysteretic systems. J. Eng. Mech. Div. 1976, 102, 249–263. [Google Scholar] [CrossRef]
  23. Teran-Gilmore, A.; Jirsa, J.O. Energy demands for seismic design against low-cycle fatigue. Earthq. Eng. Struct. Dyn. 2007, 36, 383–404. [Google Scholar] [CrossRef]
  24. Ruiz-García, J.; Cárdenas, Y. Seismic performance assessment of weak first-storey RC buildings designed with old and new seismic provisions for Mexico City. Eng. Struct. 2021, 232, 111803. [Google Scholar] [CrossRef]
  25. García-Ranz, F.; Gómez, R. The Mexico Earthquake of 19 September 1985—Seismic Design Regulations of the 1976 Mexico Building Code. Earthq. Spectra 1988, 4, 427–439. [Google Scholar] [CrossRef]
  26. Valente, M.; Milani, G. Alternative retrofitting strategies to prevent the failure of an under-designed reinforced concrete frame. Eng. Fail. Anal. 2018, 89, 271–285. [Google Scholar] [CrossRef]
  27. Alam, Z.; Zhang, C.; Samali, B. The role of viscoelastic damping on retrofitting seismic performance of asymmetric reinforced concrete structures. Earthq. Eng. Eng. Vib. 2020, 19, 223–237. [Google Scholar] [CrossRef]
  28. Cardenas, Y. Comportamiento Sísmico de Edificios de Concreto Reforzado con Planta Baja Débil Sujetos al Sismo del 19 de Septiembre de 2017. Bachelor Thesis, School of Engineering, Universidad Michoacana de San Nicolás de Hidalgo, Morelia, Mexico, 2020. (In Spanish). [Google Scholar]
  29. Gregorio, L. Evaluación de las Nuevas Disposiciones Normativas para el Diseño Sísmico de Edificios de Concreto Reforzado con Planta Baja Débil. Bachelor Thesis, School of Engineering, Universidad Michoacana de San Nicolás de Hidalgo, Morelia, Mexico, 2020. (In Spanish). [Google Scholar]
  30. McKenna, F. OpenSees: A framework for earthquake engineering simulation. Comput. Sci. Eng. 2011, 13, 58–66. [Google Scholar] [CrossRef]
  31. Kent, D.C.; Park, R. Flexural members with confined concrete. J. Struct. Div. 1971, 97, 1969–1990. [Google Scholar] [CrossRef]
  32. Mazzoni, S.; McKenna, F.; Scott, M.H.; Fenves, G.L. OpenSees command language manual. Pac. Earthq. Eng. Res. Cent. 2006, 264, 137–158. [Google Scholar]
  33. Reinoso, E.; Ordaz, M. Spectral ratios for Mexico City from free-field recordings. Earthq. Spectra 1999, 15, 273–295. [Google Scholar] [CrossRef]
  34. Singh, S.K.; Iglesias, A.; Ordaz, M.; Pérez-Campos, X.; Quintanar, L. Estimation of ground motion in Mexico City from a repeat of the M∼7.0 Acambay earthquake of 1912. Bull. Seismol. Soc. Am. 2011, 101, 2015–2028. [Google Scholar] [CrossRef]
  35. Singh, S.K. A study of amplification of seismic waves in the Valley of Mexico with respect to the hill zone site. Earthq. Spectra 1988, 4, 653–674. [Google Scholar] [CrossRef]
  36. Singh, S.K.; Mena, E.A.; Castro, R. Some aspects of source characteristics of the 19 September 1985 Michoacan earthquake and ground motion amplification in and near Mexico City from strong motion data. Bull. Seismol. Soc. Am. 1988, 78, 451–477. [Google Scholar]
  37. Ordaz, M.; Reinoso, E.; Singh, S.K.; Vera, E.; Jara, J.M. Espectros de Respuesta en Diversos Sitios del Valle ante Temblores Postulados en la Brecha de Guerrero. In Memorias del VIII Congreso Nacional de Ingeniería Sísmica and VII Congreso Nacional de Ingeniería Estructural; Acapulco, México, 1989; pp. A187–A198. (In Spanish) [Google Scholar]
  38. Montalvo-Arrieta, J.C.; Sánchez-Sesma, F.J.; Reinoso, E. A virtual reference site for the Valley of Mexico. Bull. Seismol. Soc. Am. 2002, 92, 1847–1854. [Google Scholar] [CrossRef] [Green Version]
  39. Jaimes, M.A.; Reinoso, E.; Ordaz, M. Comparison of methods to predict response spectra at instrumented sites given the magnitude and distance of an earthquake. J. Earthq. Eng. 2006, 10, 887–902. [Google Scholar] [CrossRef]
  40. McGuire, R.K. Probabilistic seismic hazard analysis: Early history. Earthq. Eng. Struct. Dyn. 2008, 37, 329–338. [Google Scholar] [CrossRef]
  41. Ordaz, M.; Reyes, C. Earthquake hazard in Mexico City: Observations versus computations. Bull. Seismol. Soc. Am. 1999, 89, 1379–1383. [Google Scholar] [CrossRef]
  42. Jaimes, M.A.; Reinoso, E. Comparación del comportamiento de edificios en el valle de México ante sismos de subducción y de falla normal. Rev. Ing. Sísmica 2006, 75, 1–22. (In Spanish) [Google Scholar]
  43. Jaimes, M.A.; Ramirez-Gaytán, A.; Reinoso, E. Ground-motion prediction model from intermediate-depth intraslab earthquakes at the hill and lake-bed zones of Mexico City. J. Earthq. Eng. 2015, 19, 1260–1278. [Google Scholar] [CrossRef]
  44. Jaimes, M.A.; Lermo, J.; García-Soto, A.D. Ground-motion prediction model from local earthquakes of the Mexico Basin at the hill zone of Mexico City. Bull. Seismol. Soc. Am. 2016, 106, 2532–2544. [Google Scholar] [CrossRef]
  45. Rosenblueth, E.; Arciniega, A. Response spectral ratios. Earthq. Eng. Struct. Dyn. 1992, 21, 483–492. [Google Scholar] [CrossRef]
  46. Reyes, C. El Estado Límite de Servicio en el Diseño Sísmico de Edificios. Ph.D. Thesis, UNAM, Ciudad de Mexico, México, 1999. (In Spanish). [Google Scholar]
  47. Candia, G.; Macedo JJaimes, M.A.; Magda-Verdugo, C. A new state of the art platform for probabilistic and deterministic seismic hazard assessment. Seismol. Res. Lett. 2019, 90, 2262–2275. [Google Scholar] [CrossRef]
  48. NTCS. Technical Norms for Seismic Design. Gaceta Oficial de la Ciudad de México. 15 December 2017. Available online: https://www.smig.org.mx/archivos/NTC2017/normas-tecnicas-complementarias-reglamento-construcciones-cdmx-2017.pdf (accessed on 10 October 2020).
  49. Watson-Lamprey, J.; Abrahamson, N. Selection of ground motion time series and limits on scaling. Soil Dyn. Earthq. Eng. 2006, 26, 477–482. [Google Scholar] [CrossRef]
  50. Kunnath, S.K.; Mander, J.B.; Fang, L. Parameter identification for degrading and pinched hysteretic structural concrete systems. Eng. Struct. 1997, 19, 224–232. [Google Scholar] [CrossRef]
  51. Goda, K.; Hong, H.P.; Lee, C.S. Probabilistic characteristics of seismic ductility demand of SDOF systems with Bouc-Wen hysteretic behavior. J. Earthq. Eng. 2009, 13, 600–622. [Google Scholar] [CrossRef]
  52. Thiers-Moggia, R.; Málaga-Chuquitaype, C. Seismic control of flexible rocking structures using inerters. Earthq. Eng. Struct. Dyn. 2020, 49, 1519–1538. [Google Scholar] [CrossRef]
  53. Thiers-Moggia, R.; Málaga-Chuquitaype, C. Effect of base-level inerters on the higher mode response of uplifting structures. J. Eng. Mech. 2021, 147, 04021041. [Google Scholar] [CrossRef]
  54. Vamvatsikos, D.; Cornell, C.A. Incremental dynamic analysis. Earthq. Eng. Struct. Dyn. 2002, 31, 491–514. [Google Scholar] [CrossRef]
  55. Esteva, L. Bases para la Formulación de Decisiones de Diseño Sísmico; Serie Azul 182; Instituto de Ingeniería, Universidad Nacional Autónoma de México: Ciudad de Mexico, Meico, 1968. (In Spanish) [Google Scholar]
  56. Esteva, L. Regionalizacion Sísmica para Fines de Ingeniería; Serie Azul 246; Instituto de Ingeniería UNAM: Ciudad de Mexico, Mexco, 1970. (In Spanish) [Google Scholar]
  57. Cornell, C.A. Engineering seismic risk analysis. Bull. Seismol. Soc. Am. 1968, 58, 1583–1606. [Google Scholar] [CrossRef]
  58. Der Kiureghian a Non-Ergodicity and PEER’s framework formula. Earthq. Eng. Struct. Dyn. 2005, 34, 1643–1652. [CrossRef]
Figure 1. Examples of upper soft-story failures in Mexico City caused by the 2017 Mw7.1 Morelos–Puebla seismic event. (a) 241 Rebsamen St., Narvarte neighborhood; (b) 37 Patricio Sanz St., Del Valle Norte neighborhood; and (c) 47 Gallinas St., Lomas Estrella neighborhood.
Buildings 13 00929 g001
Figure 2. Depiction of SDOF system provided with inerter damper.
Buildings 13 00929 g002
Figure 3. Squared plan view of the considered weak first-story buildings.
Buildings 13 00929 g003
Figure 4. Elevation view of the weak first-story buildings provided with inerter dampers at their ground level with 4 stories (top), 6 stories (middle), and 8 stories (bottom). Infill masonry walls with and without openings correspond to exterior and interior walls, respectively.
Buildings 13 00929 g004aBuildings 13 00929 g004b
Figure 5. Schematic representation of an inerter damper with the main parameters, after [15].
Buildings 13 00929 g005
Figure 6. Mexican seismic sources [40,41] (Ordaz and Reyes 1999, Jaimes and Reinoso 2006).
Buildings 13 00929 g006
Figure 7. Exceedance rate for SA at sites CH84 and SCT for a structural period T 1 = 1.0 s.
Buildings 13 00929 g007
Figure 8. (a) Acceleration ( S A ), (b) velocity ( S V ), and (c) displacement ( S D ) response spectra of the set of input ground motions considered for the risk analyses in Mexico City for two sites: CH84 (pink lines) and SCT (blue lines). Thick lines are the median response values.
Buildings 13 00929 g008
Figure 9. Response spectra of a simple bilinear SDOF system (gray lines) and bilinear SDOF system equipped with an inerter damper with σ = 1 on a stiff frame (pink lines) when excited by a set of input ground motions considered for the risk analyses in Mexico City for two sites: (a) CH84 and (b) SCT considering Q 1 / m 1 g = 0.1 , α = 0.5 , β = 0.5 , γ = 0.5 , n = 10 , and ξ 1 = 0.05 . Thick lines are the median response values.
Buildings 13 00929 g009
Figure 10. Seismic response of 4- (top), 6- (middle), and 8-story (bottom) buildings of Q = 6 with and without inerter dampers subjected to a set of earthquakes whose seismic intensities are associated to limit state of collapse (i.e., λ y = 4 · 10 3 annual exceedance of SA, T R = 250 years) at site CH84. Left: median peak story drift demands; middle: median normalized peak floor acceleration demands with respect to the ground; and right: median normalized peak shear demands with the building weight W T .
Buildings 13 00929 g010
Figure 11. Seismic response of 4- (top), 6- (middle), and 8-story (bottom) buildings of Q = 6 with and without inerter dampers subjected to a set of earthquakes whose seismic intensities are associated to limit state of collapse (i.e., λ y = 4 · 10 3 annual exceedance of SA, T R = 250 years) at site SCT. Left: median peak story drift demands; middle: median normalized peak floor acceleration demands with respect to the ground; and right: median normalized peak shear demands with the building weight.
Buildings 13 00929 g011
Figure 12. Seismic response of 4- (top), 6- (middle), and 8-story (bottom) buildings of Q = 6 with and without inerter dampers subjected to a set of earthquakes whose seismic intensities are associated to limit state of damage limitation (i.e., λ y = 10 1 annual exceedance of SA, T R = 10 years) at site CH84. Left: median peak story drift demands; middle: median normalized peak floor acceleration demands with respect to the ground; and right: median normalized peak shear demands with the building weight.
Buildings 13 00929 g012
Figure 13. Seismic response of 4- (top), 6- (middle), and 8-story (bottom) buildings of Q = 6 with and without inerter dampers subjected to a set of earthquakes whose seismic intensities are associated to limit state of damage limitation (i.e., λ y = 10 1 annual exceedance of SA, T R = 10 years) at site SCT. Left: median peak story drift demands; middle: median normalized peak floor acceleration demands with respect to the ground; and right: median normalized peak shear demands with the building weight.
Buildings 13 00929 g013
Figure 14. Fragility functions for maximum peak story drift for 4- (top), 6- (middle), and 8-story (bottom) buildings of Q = 6 located at sites CH84 (left) and SCT (right) considering inerter dampers with σ = 0.7 (dotted lines) and without them (solid lines) at their ground level.
Buildings 13 00929 g014
Figure 15. Risk curves for maximum peak story drift for 4- (top), 6- (middle), and 8-story (bottom) buildings of Q = 6 located at sites CH84 (left) and SCT (right) with and without inerter dampers at their ground level.
Buildings 13 00929 g015
Figure 16. Risk curves for maximum peak story drift for 4- (top), 6- (middle), and 8-story (bottom) buildings of Q = 6 (blue lines) and Q = 4 (pink lines) located at sites CH84 (left) and SCT (right) with and without inerter dampers at their ground level.
Buildings 13 00929 g016
Table 1. Total weights and periods of fundamental mode for each building designed with the NTCS-1976 [25].
ModelTotal Weight
W (kN)
Period
T 1   ( s )
Participating Mass Percentage (%)
First, Second, and Third Mode
E4Q659281.0289.4, 8.8, 1.1
E6Q691861.0487.3, 9.8, 2.0
E8Q613,5740.9883.9, 11.6, 2.5
E4Q459720.8789.3, 9.1, 1.2
E6Q493300.9787.2, 10, 1.9
E8Q413,7710.9283.8, 10.8, 2.5
Disclaimer/Publisher’s Note: The statements, opinions and data contained in all publications are solely those of the individual author(s) and contributor(s) and not of MDPI and/or the editor(s). MDPI and/or the editor(s) disclaim responsibility for any injury to people or property resulting from any ideas, methods, instructions or products referred to in the content.

