
Non-Linear Analysis of Flat Slabs Prestressed with Unbonded Tendons Submitted to Punching Shear

Abstract
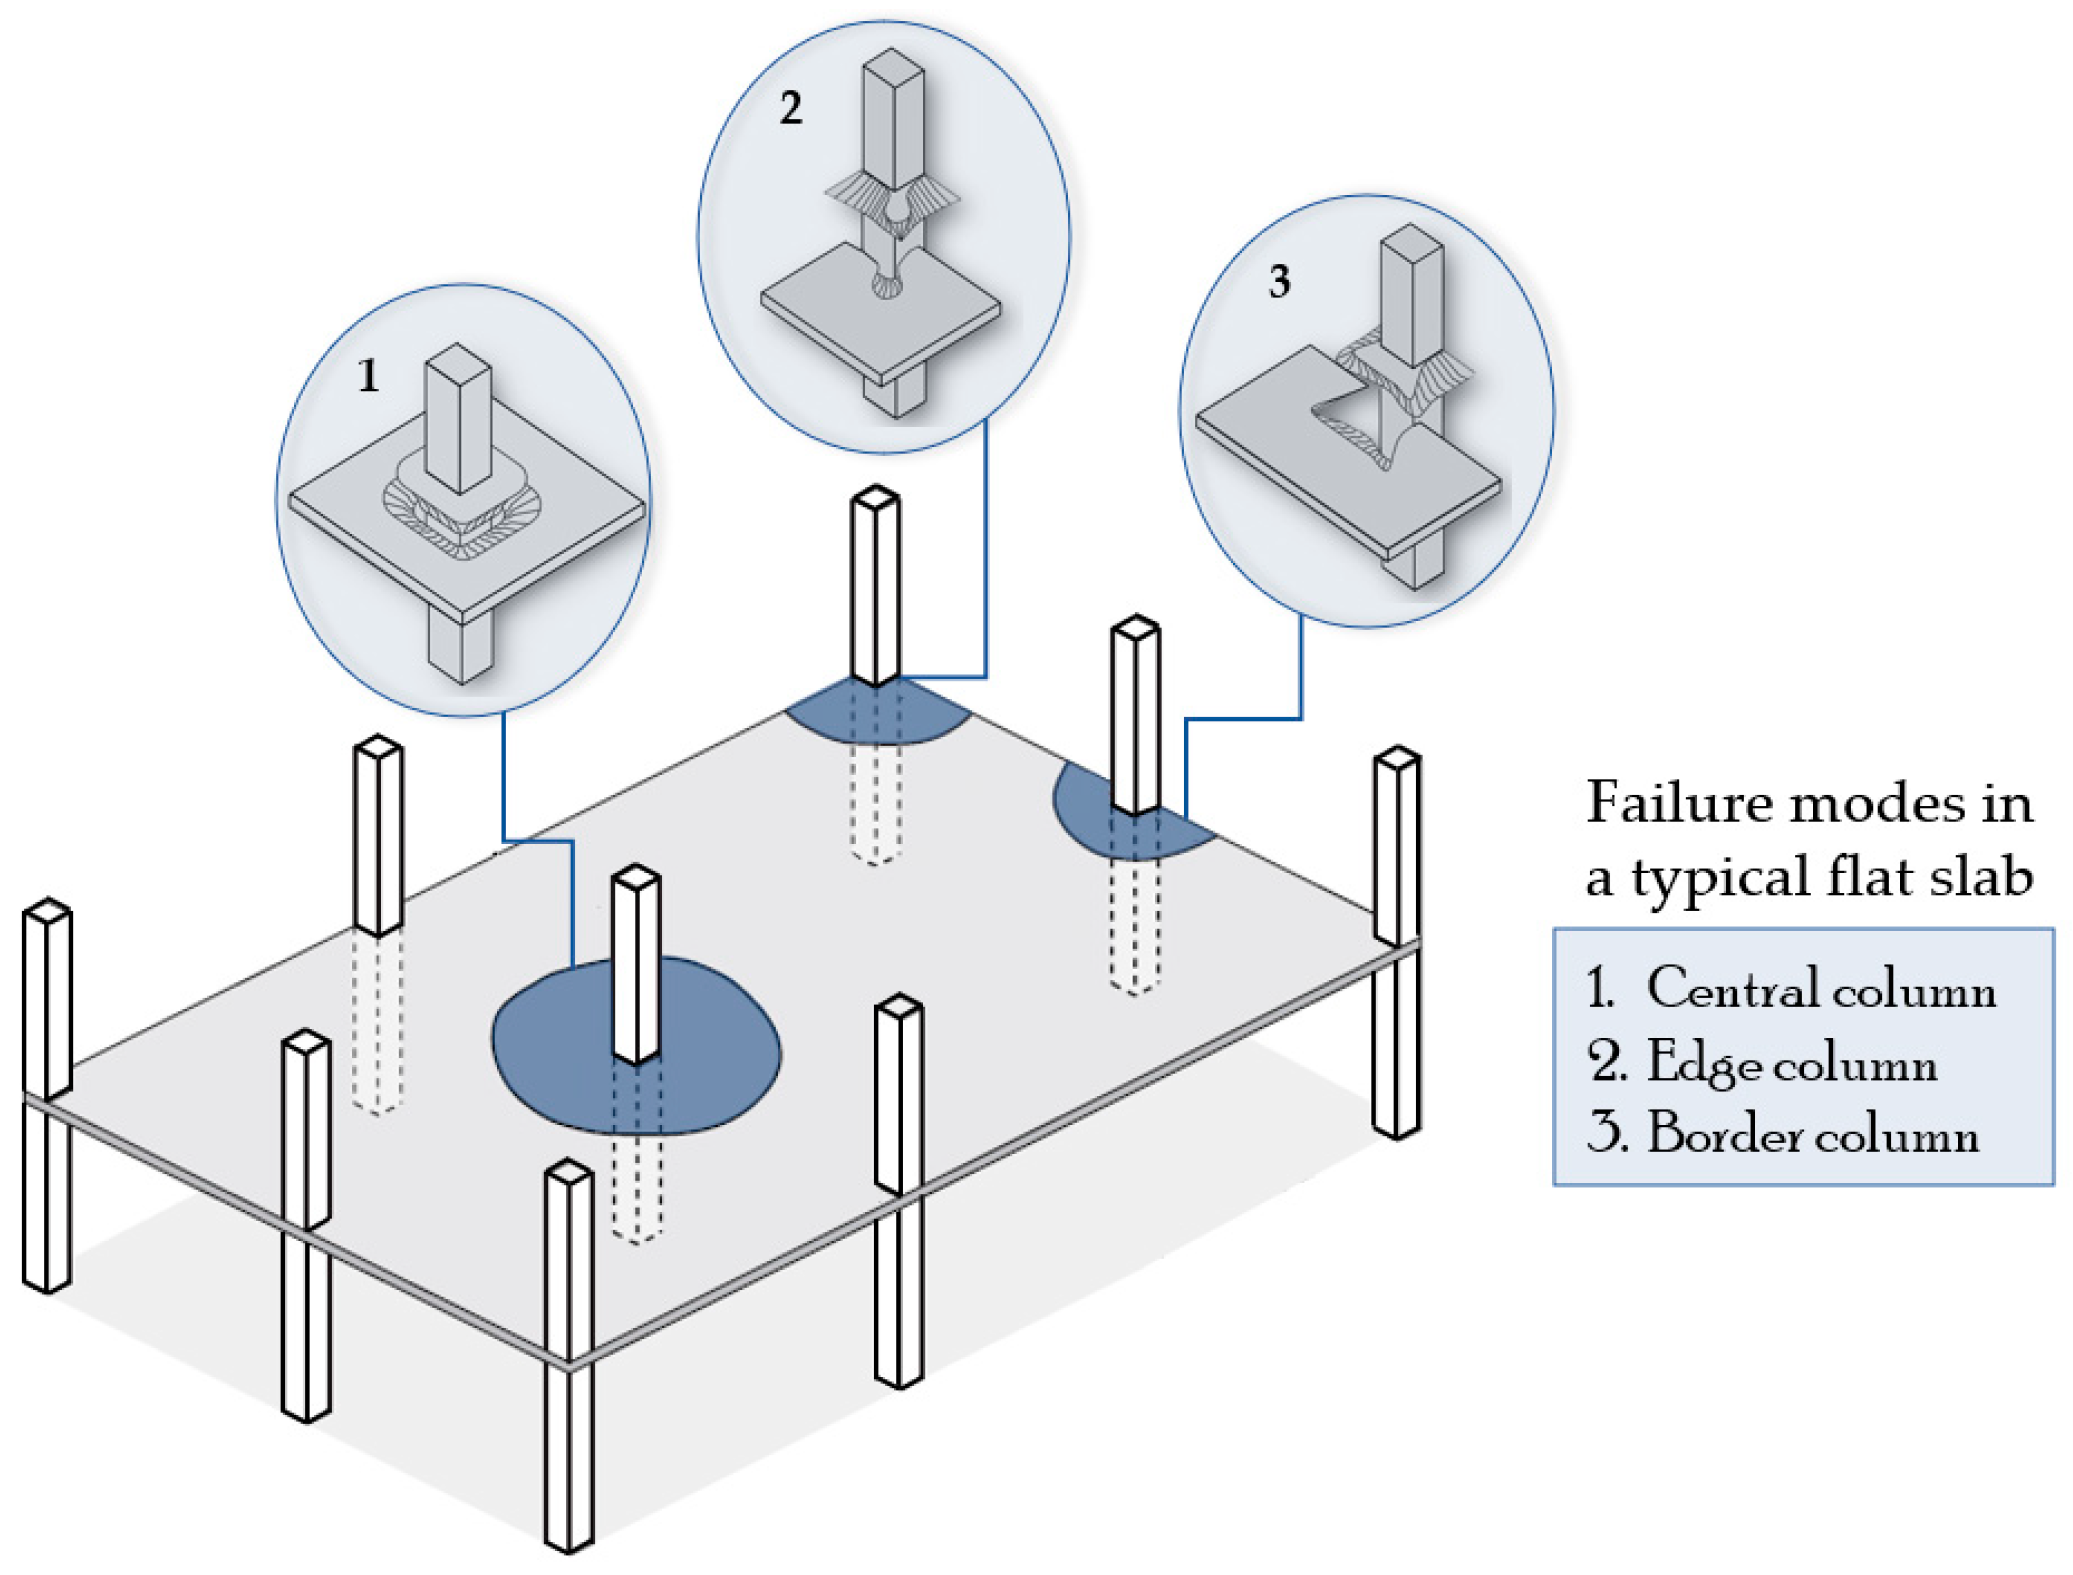
:1. Introduction
2. Numerical Analysis
2.1. Solution Methods
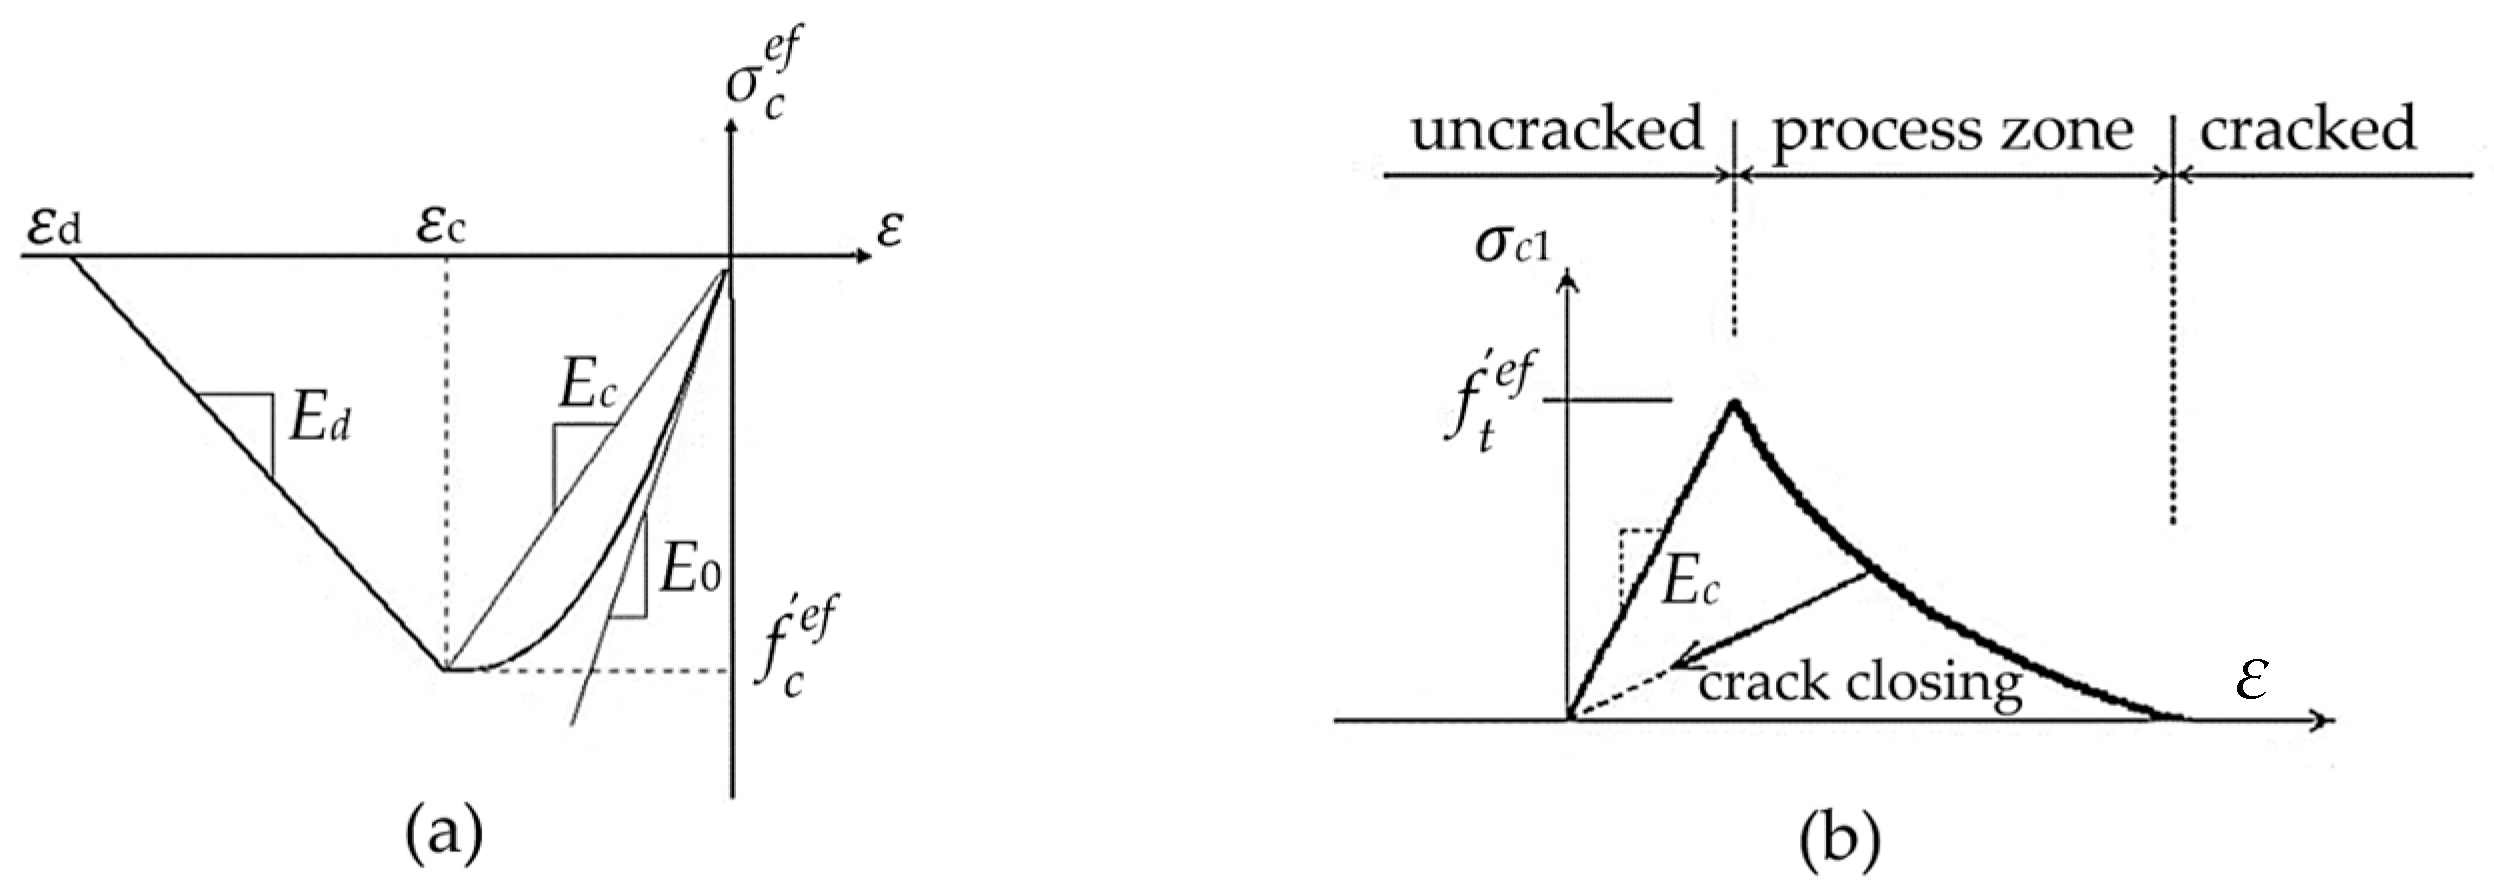
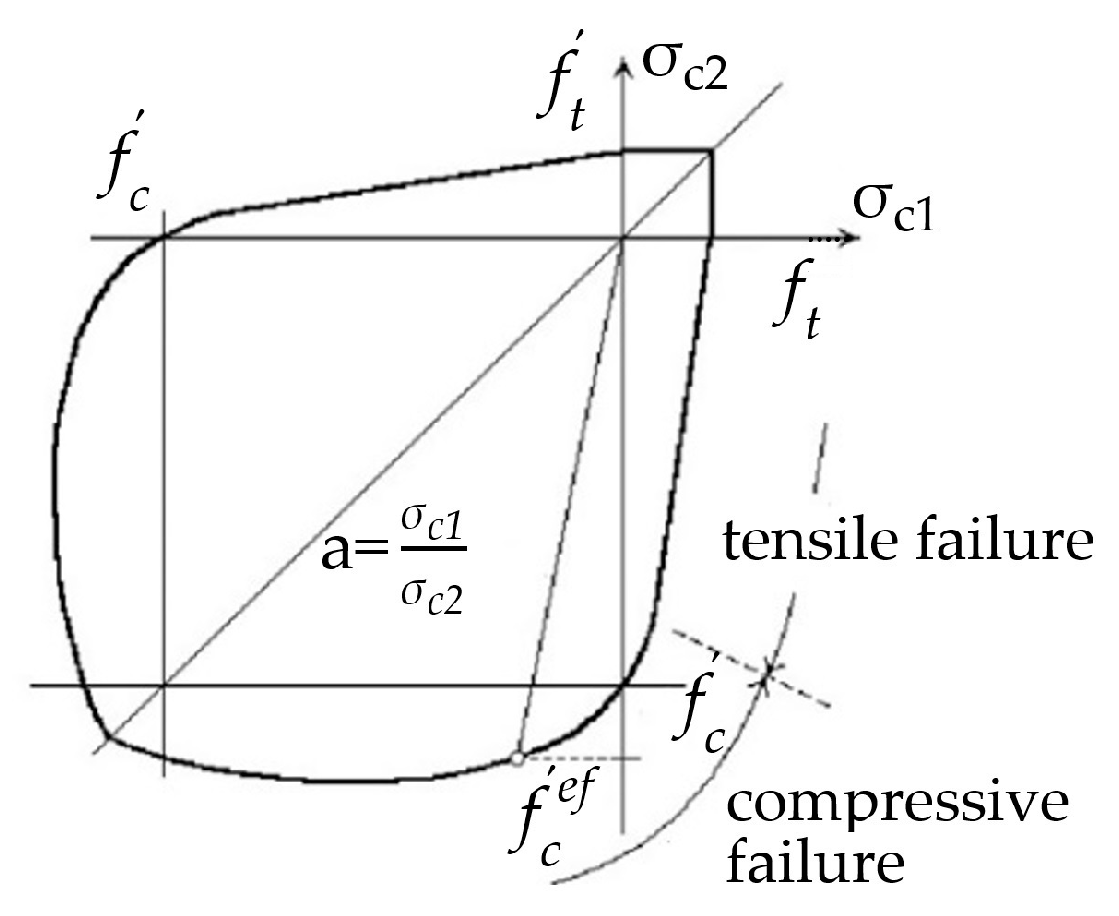
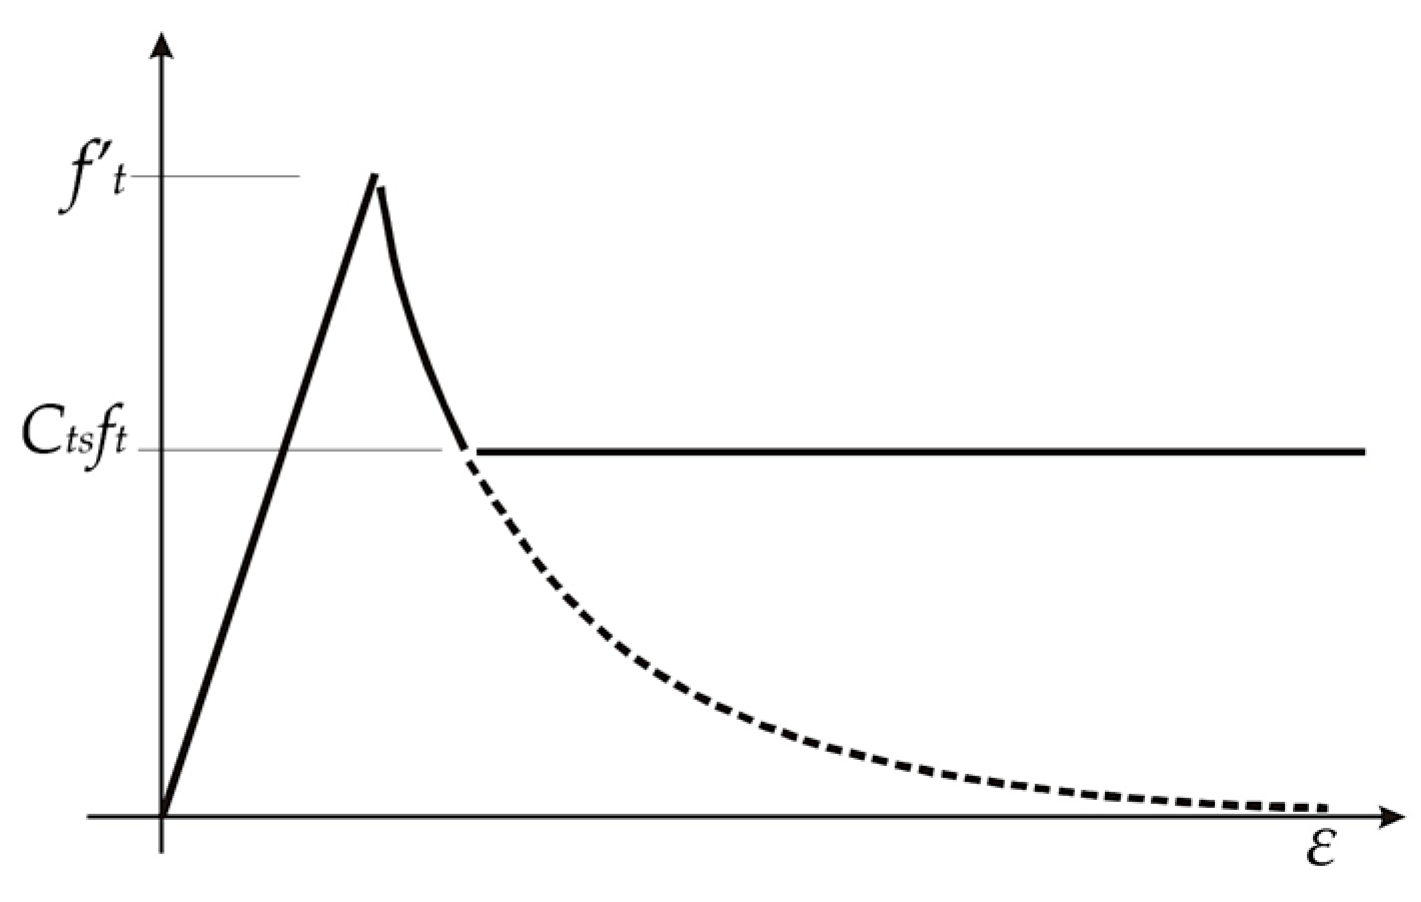
2.2. Concrete
2.3. Steel
3. Numerical Models
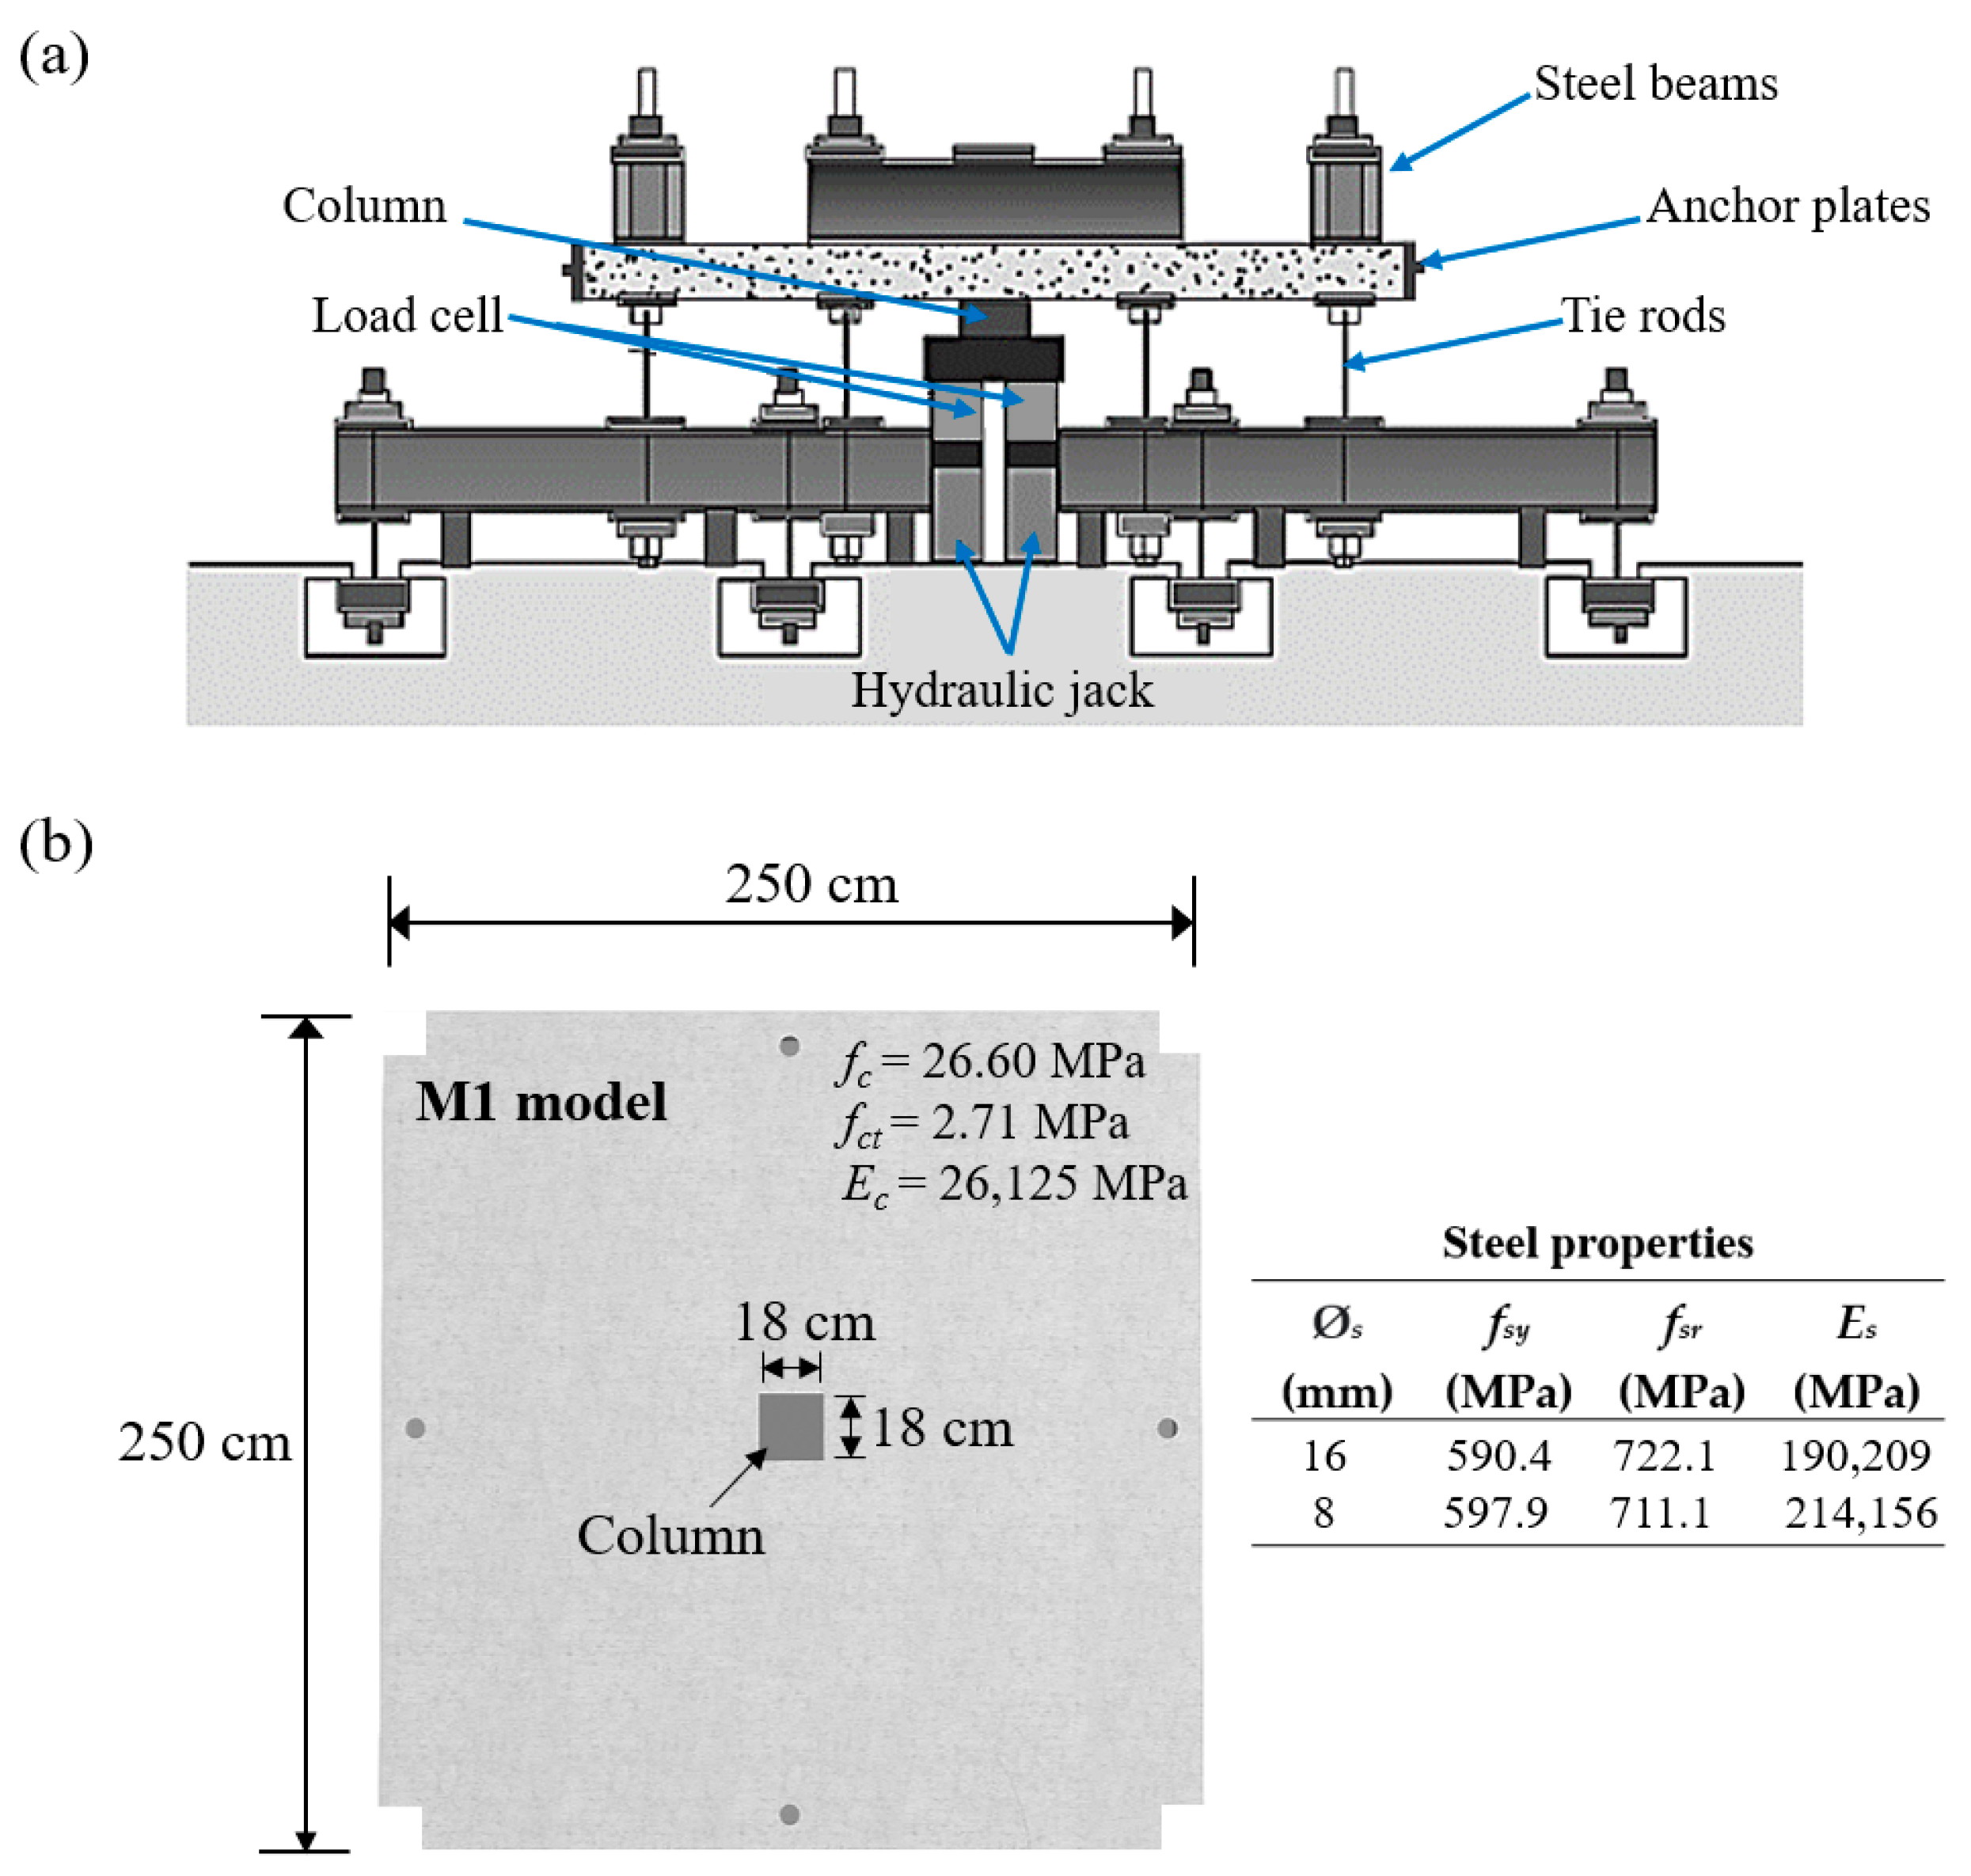
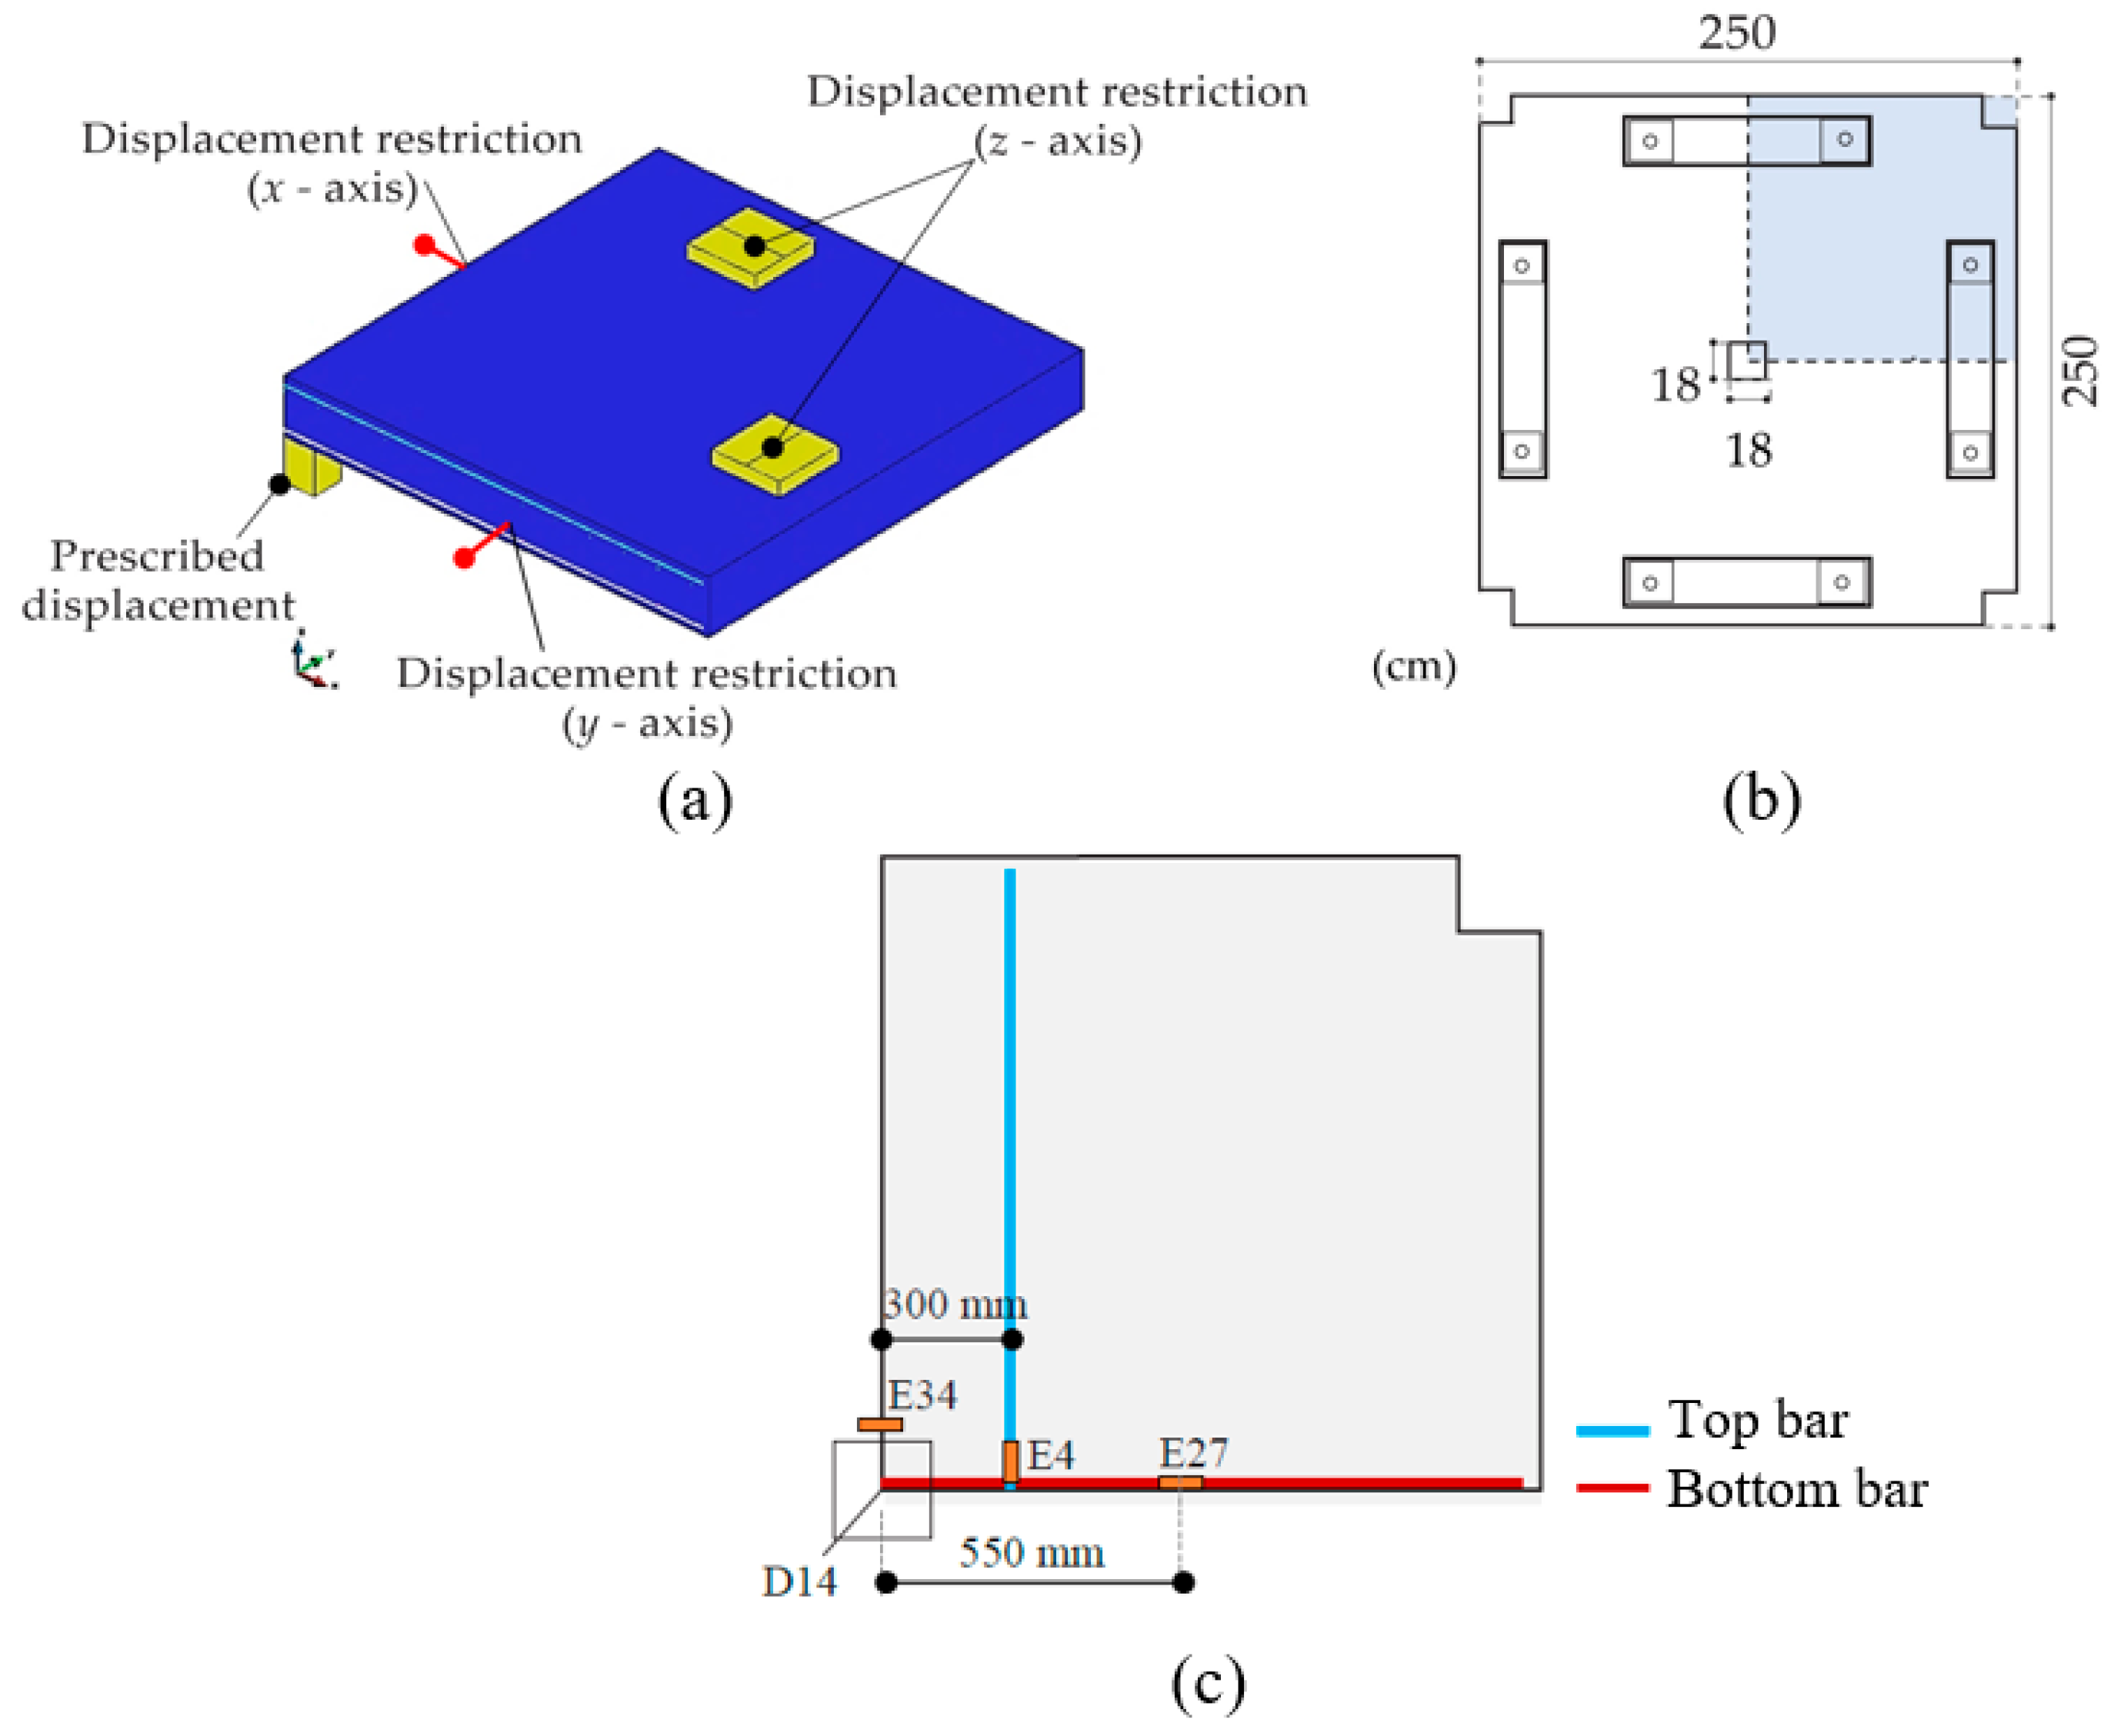
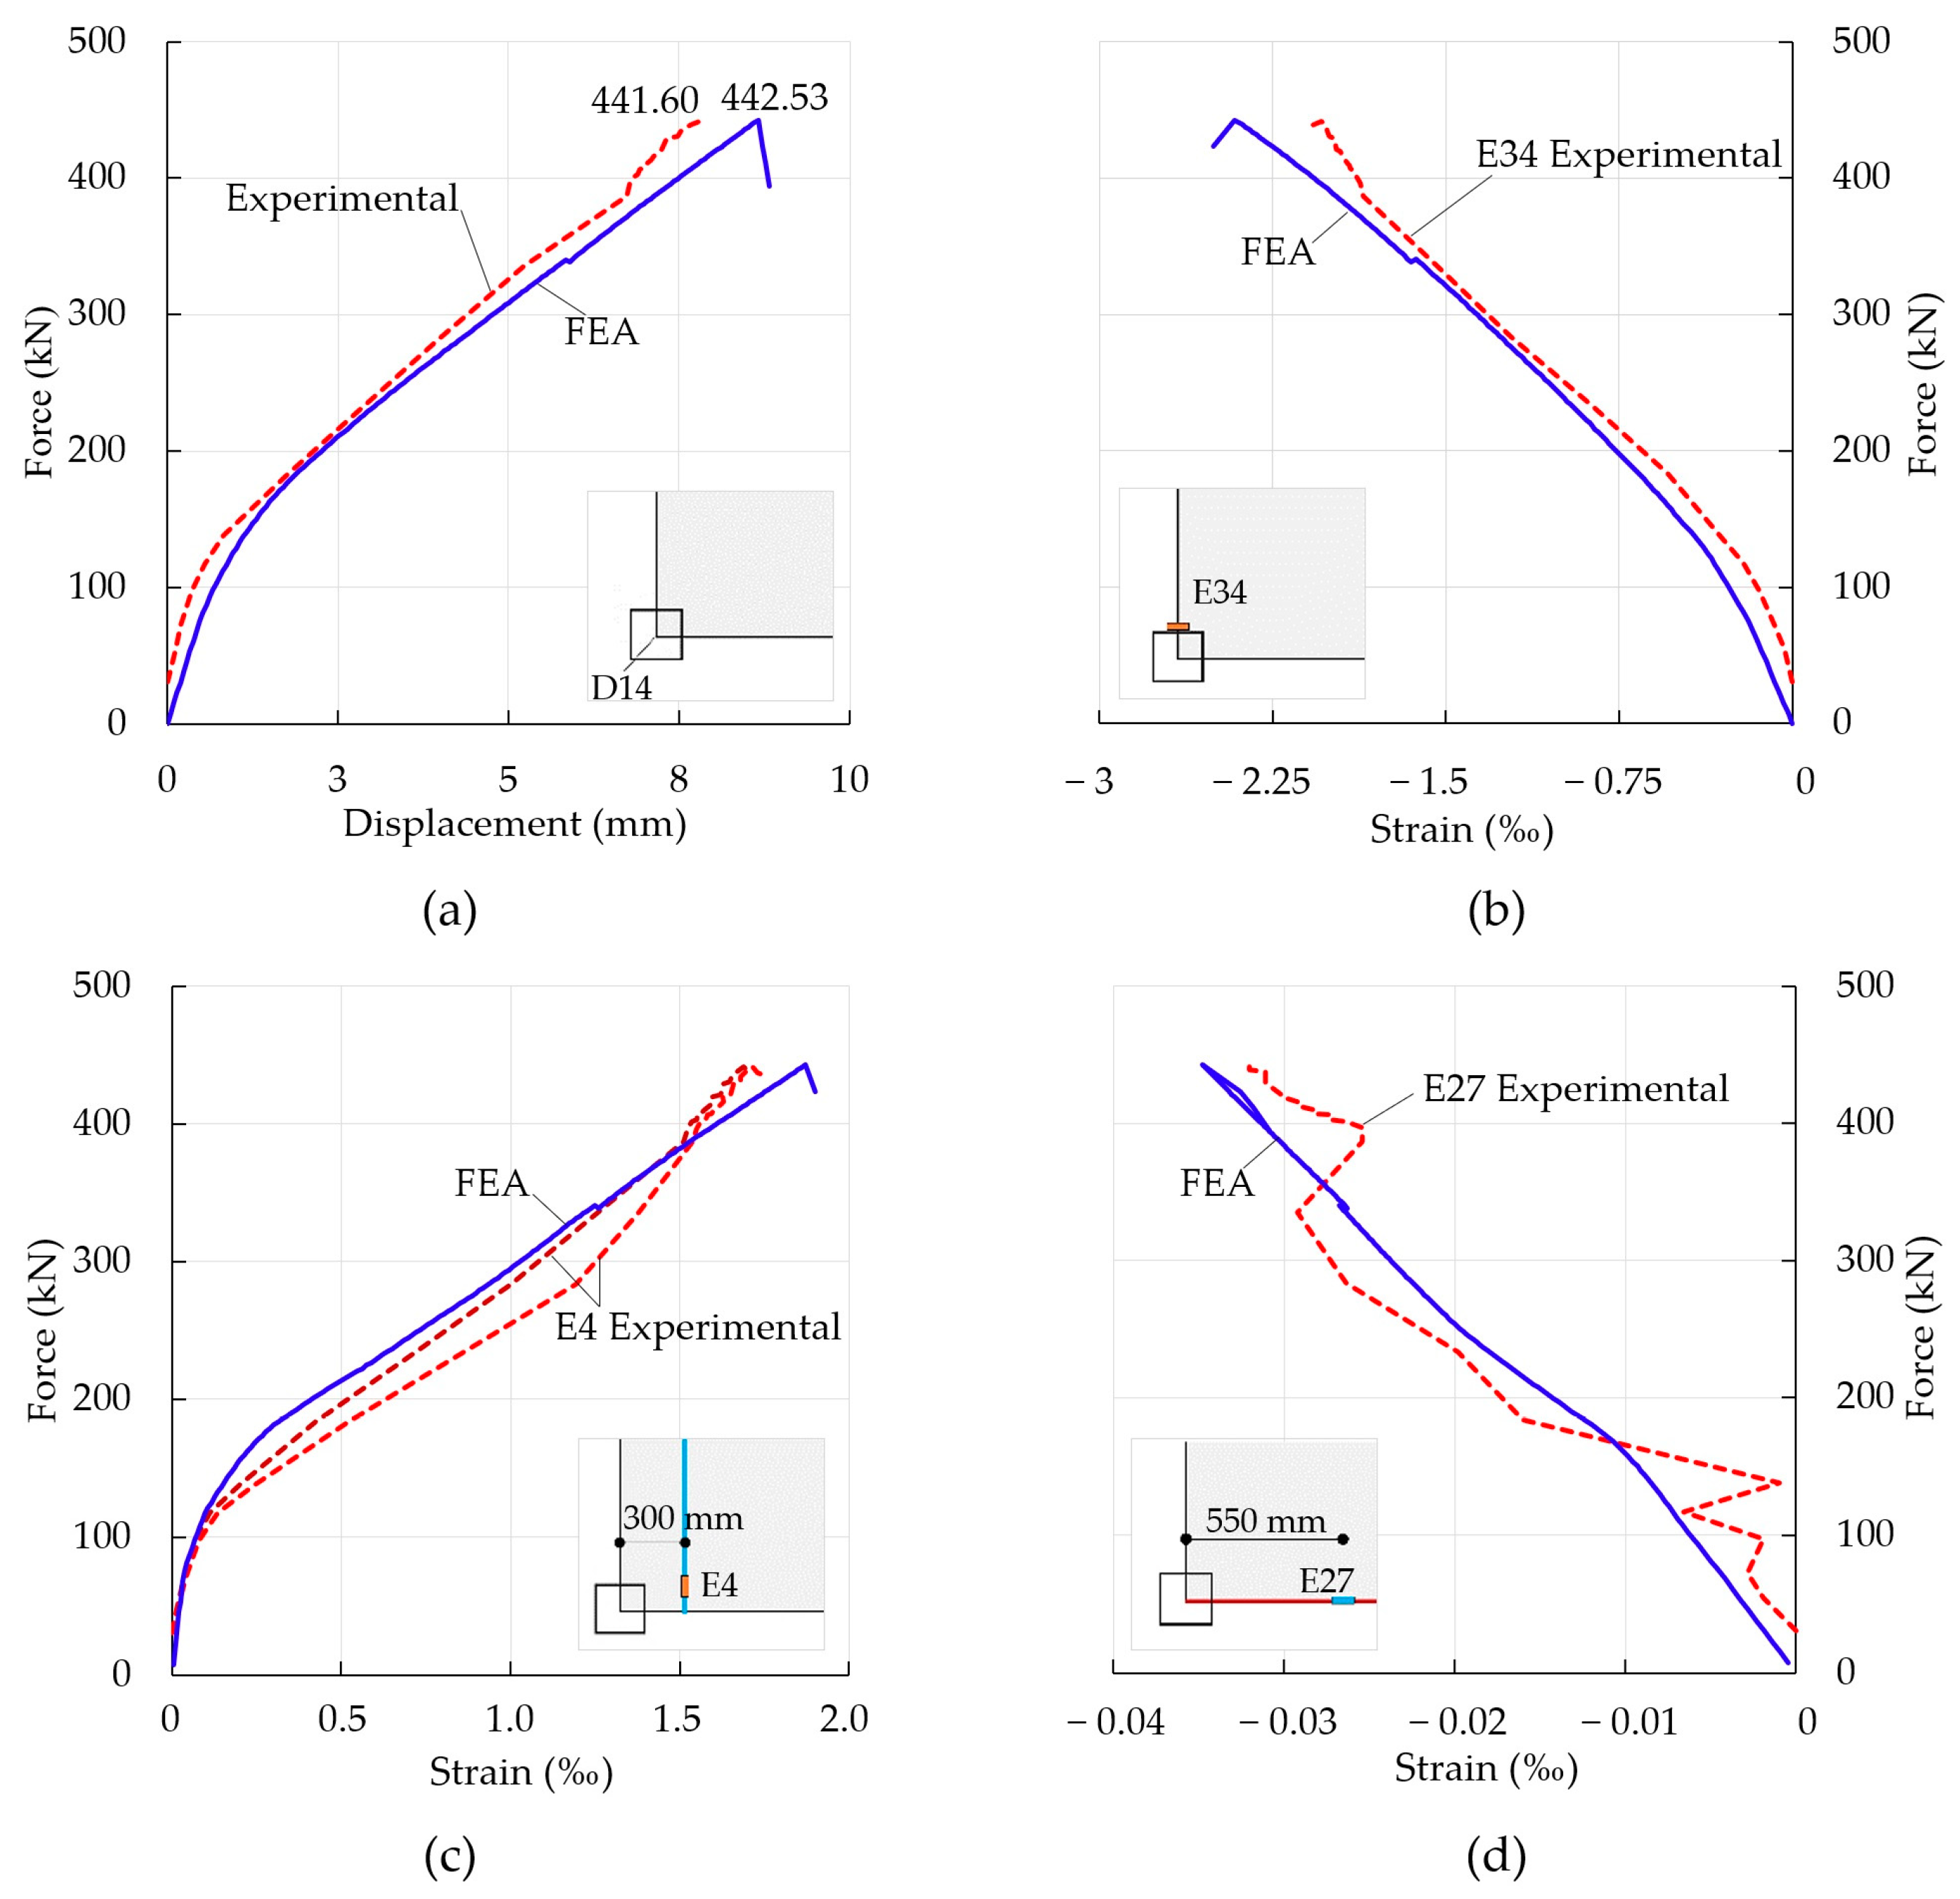
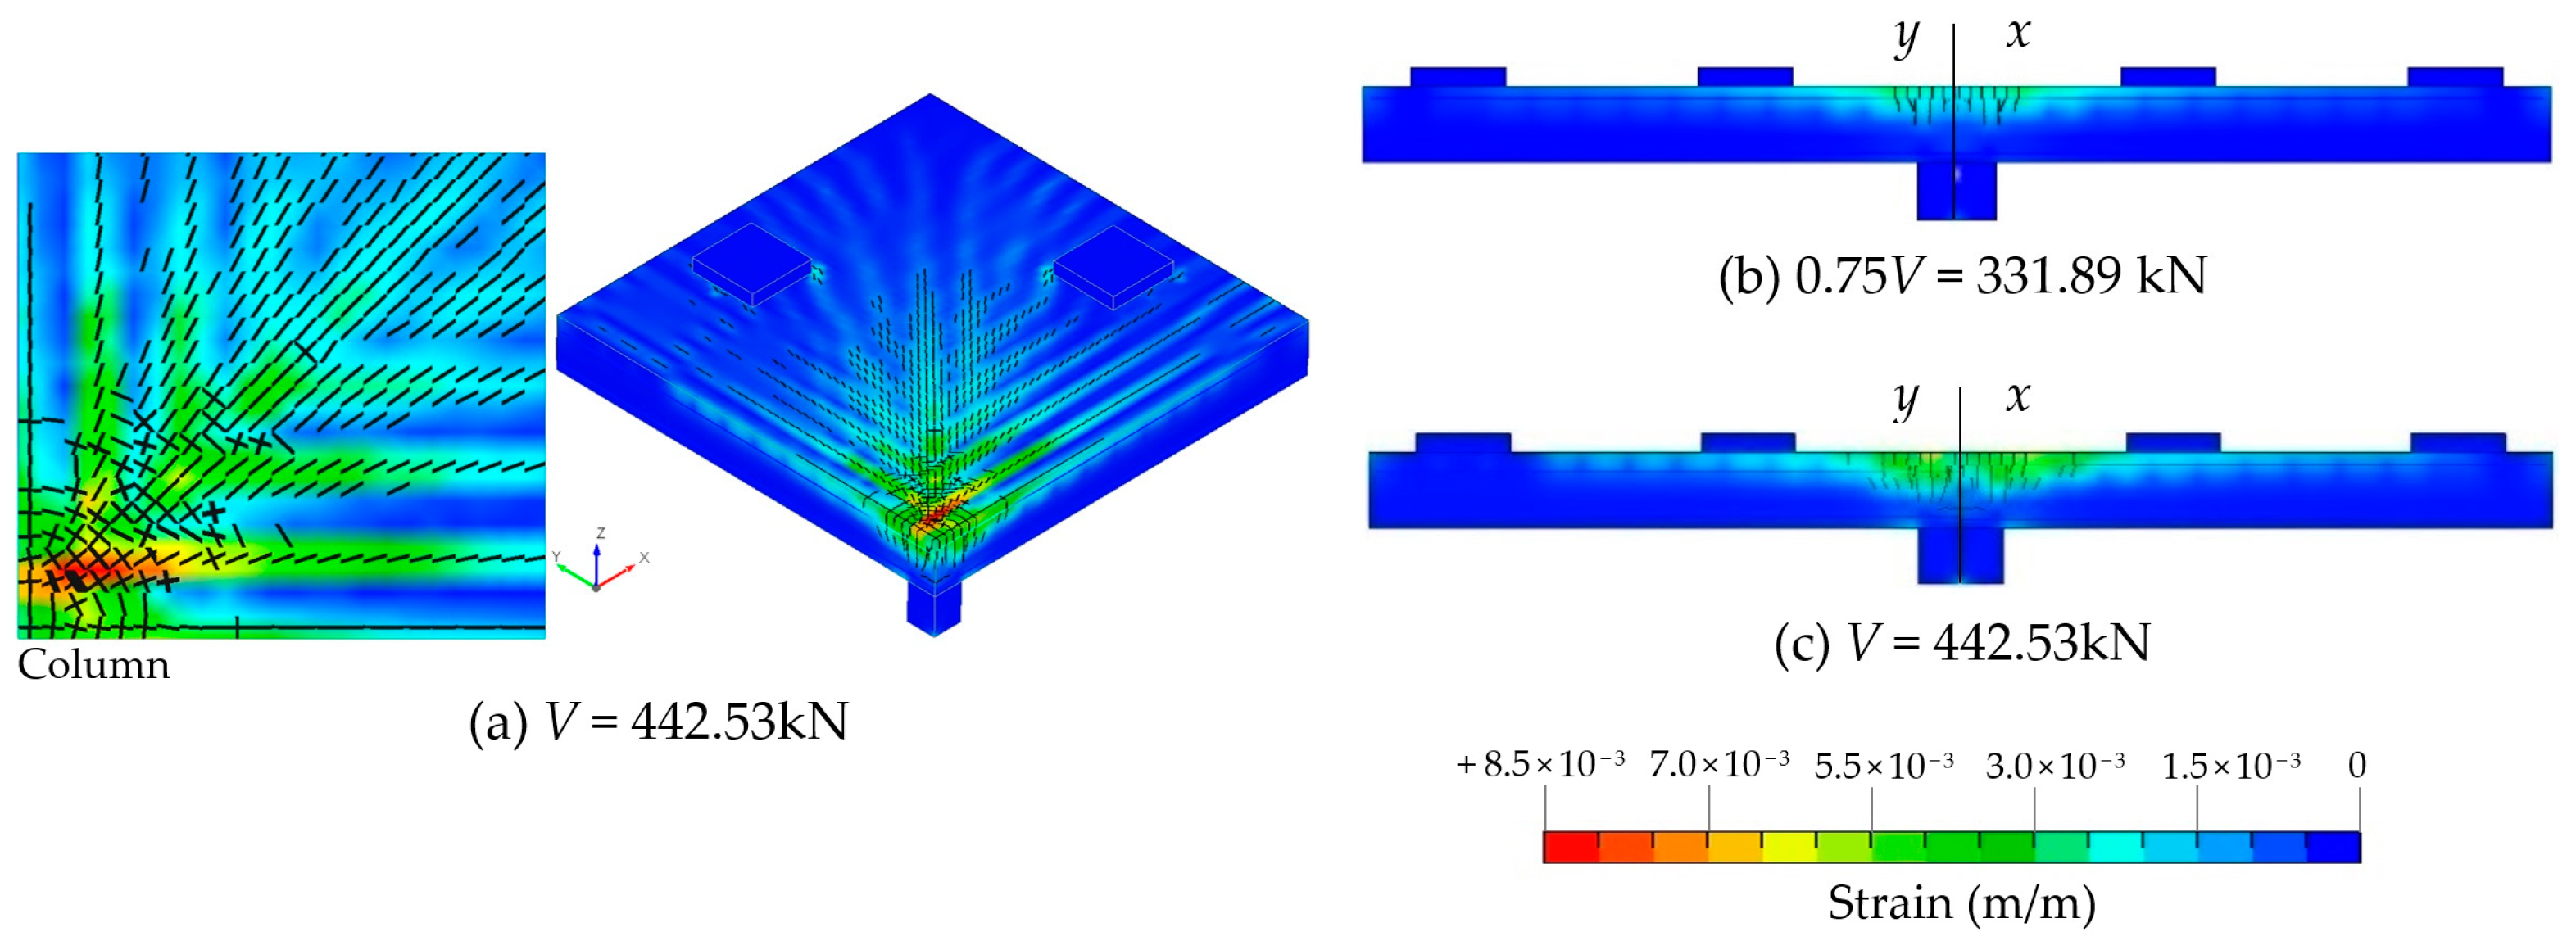
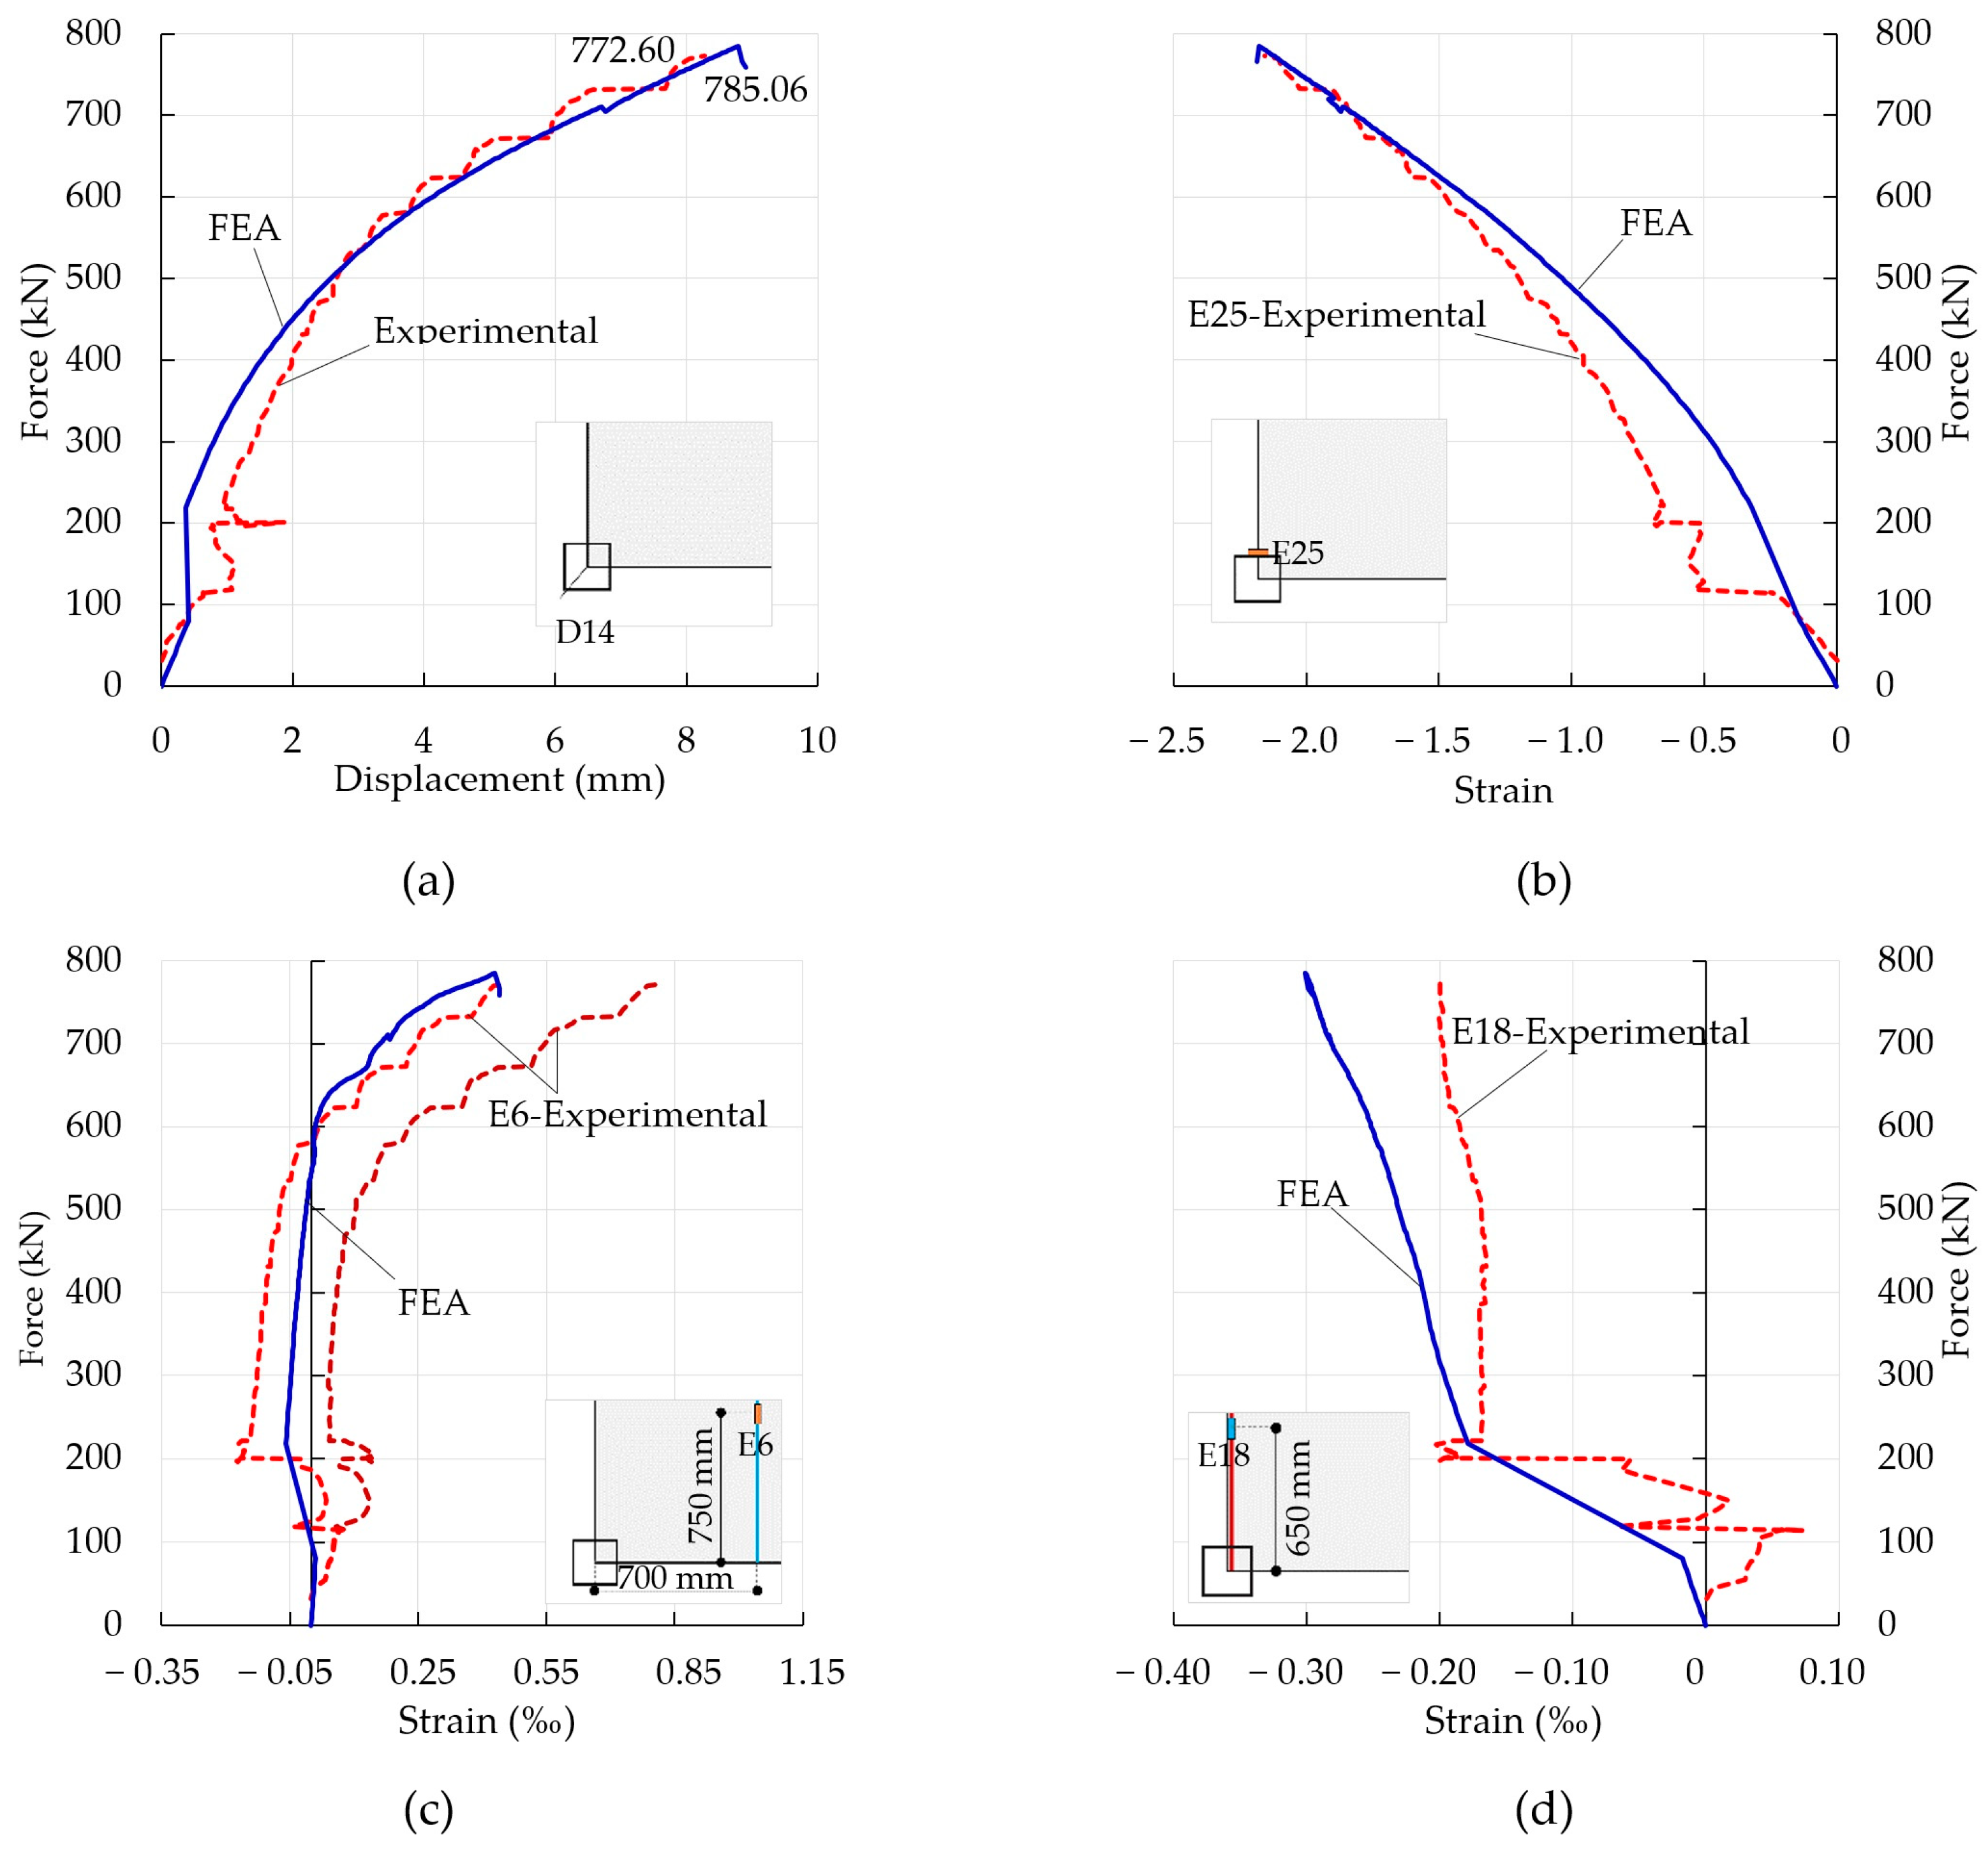
3.1. M1 Slab in Reinforced Concrete
3.2. M4 Slab in Prestressed Concrete
- Application of incremental displacement on the column until the slab reaches a reaction of 80 kN.
- Application of a standard force on each of the prestressing tendons by the command Prestressing for reinf line, under boundary conditions.
- At the end of prestressing, the master-slave node connections between the end of the tendon and the node closest to the anchor plate are activated. Finally, incremental displacement is applied to the column until the slab reaches failure.
4. Parametric Study
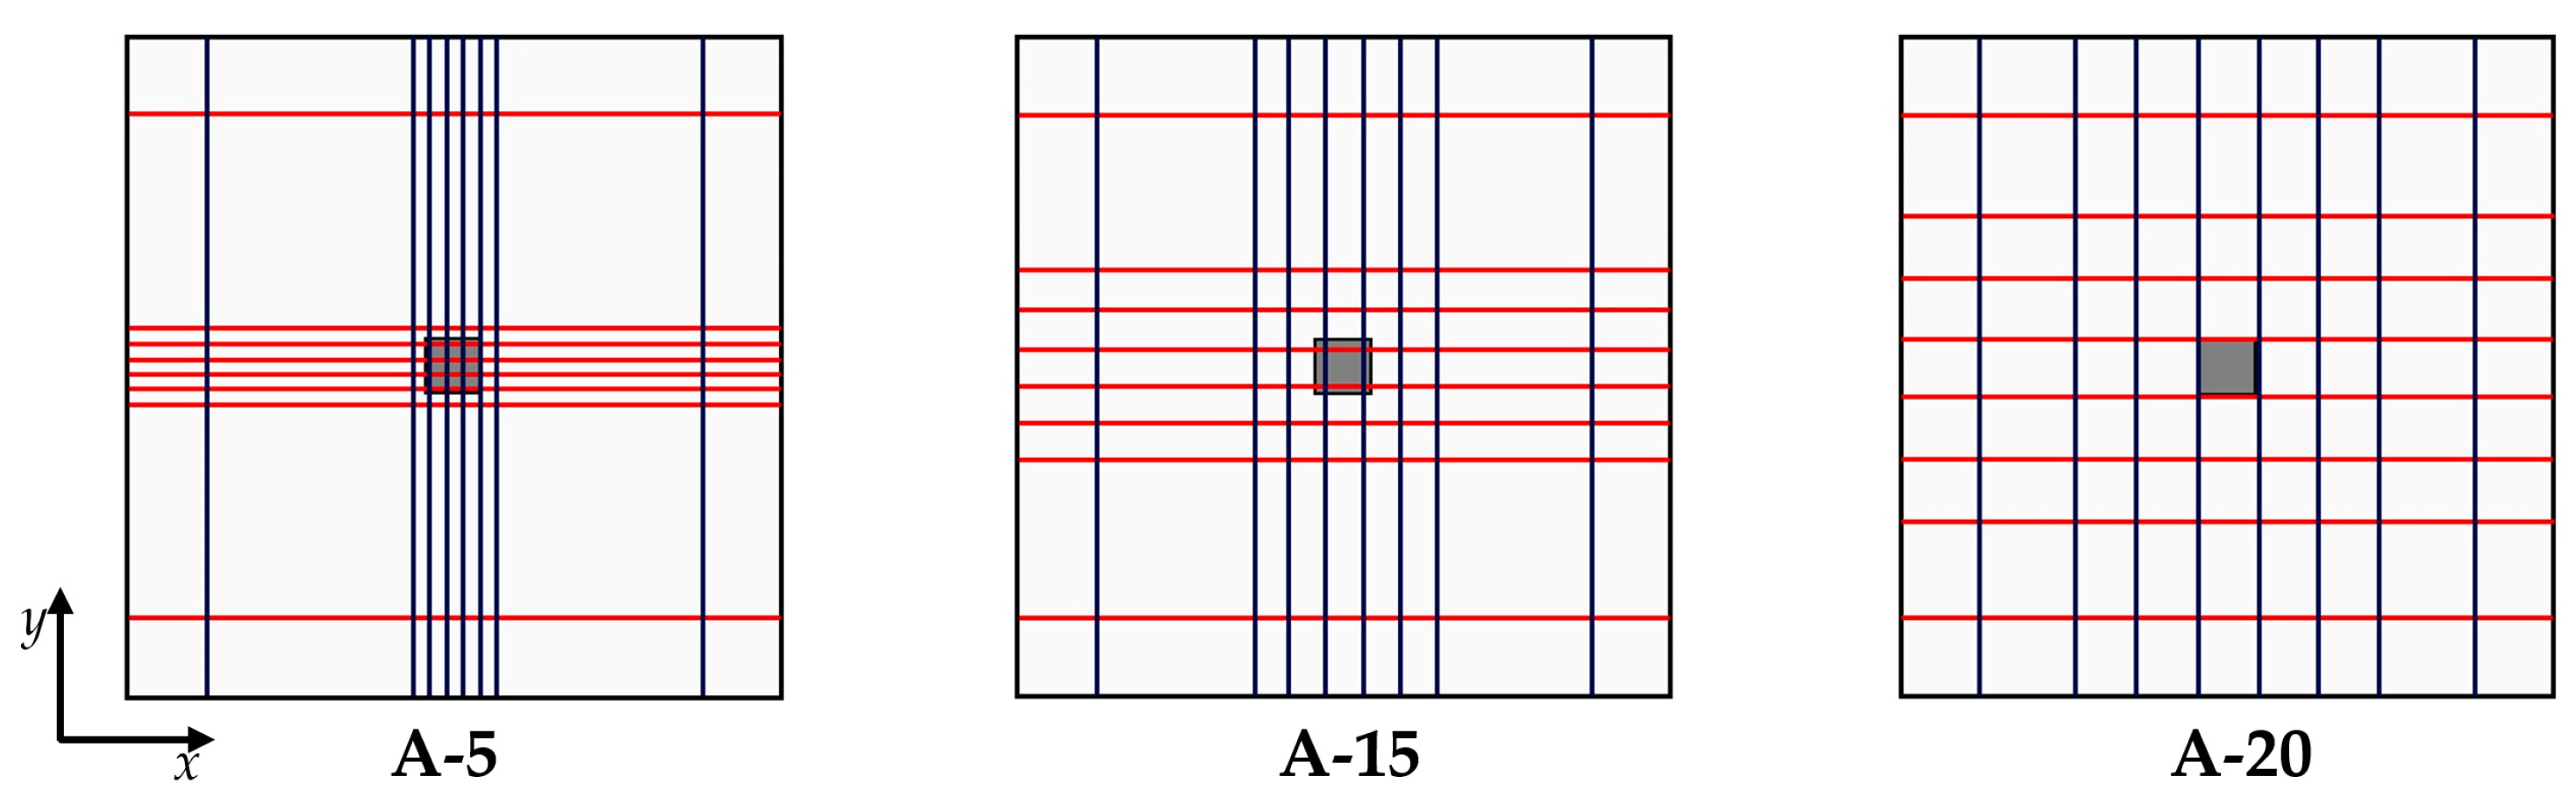
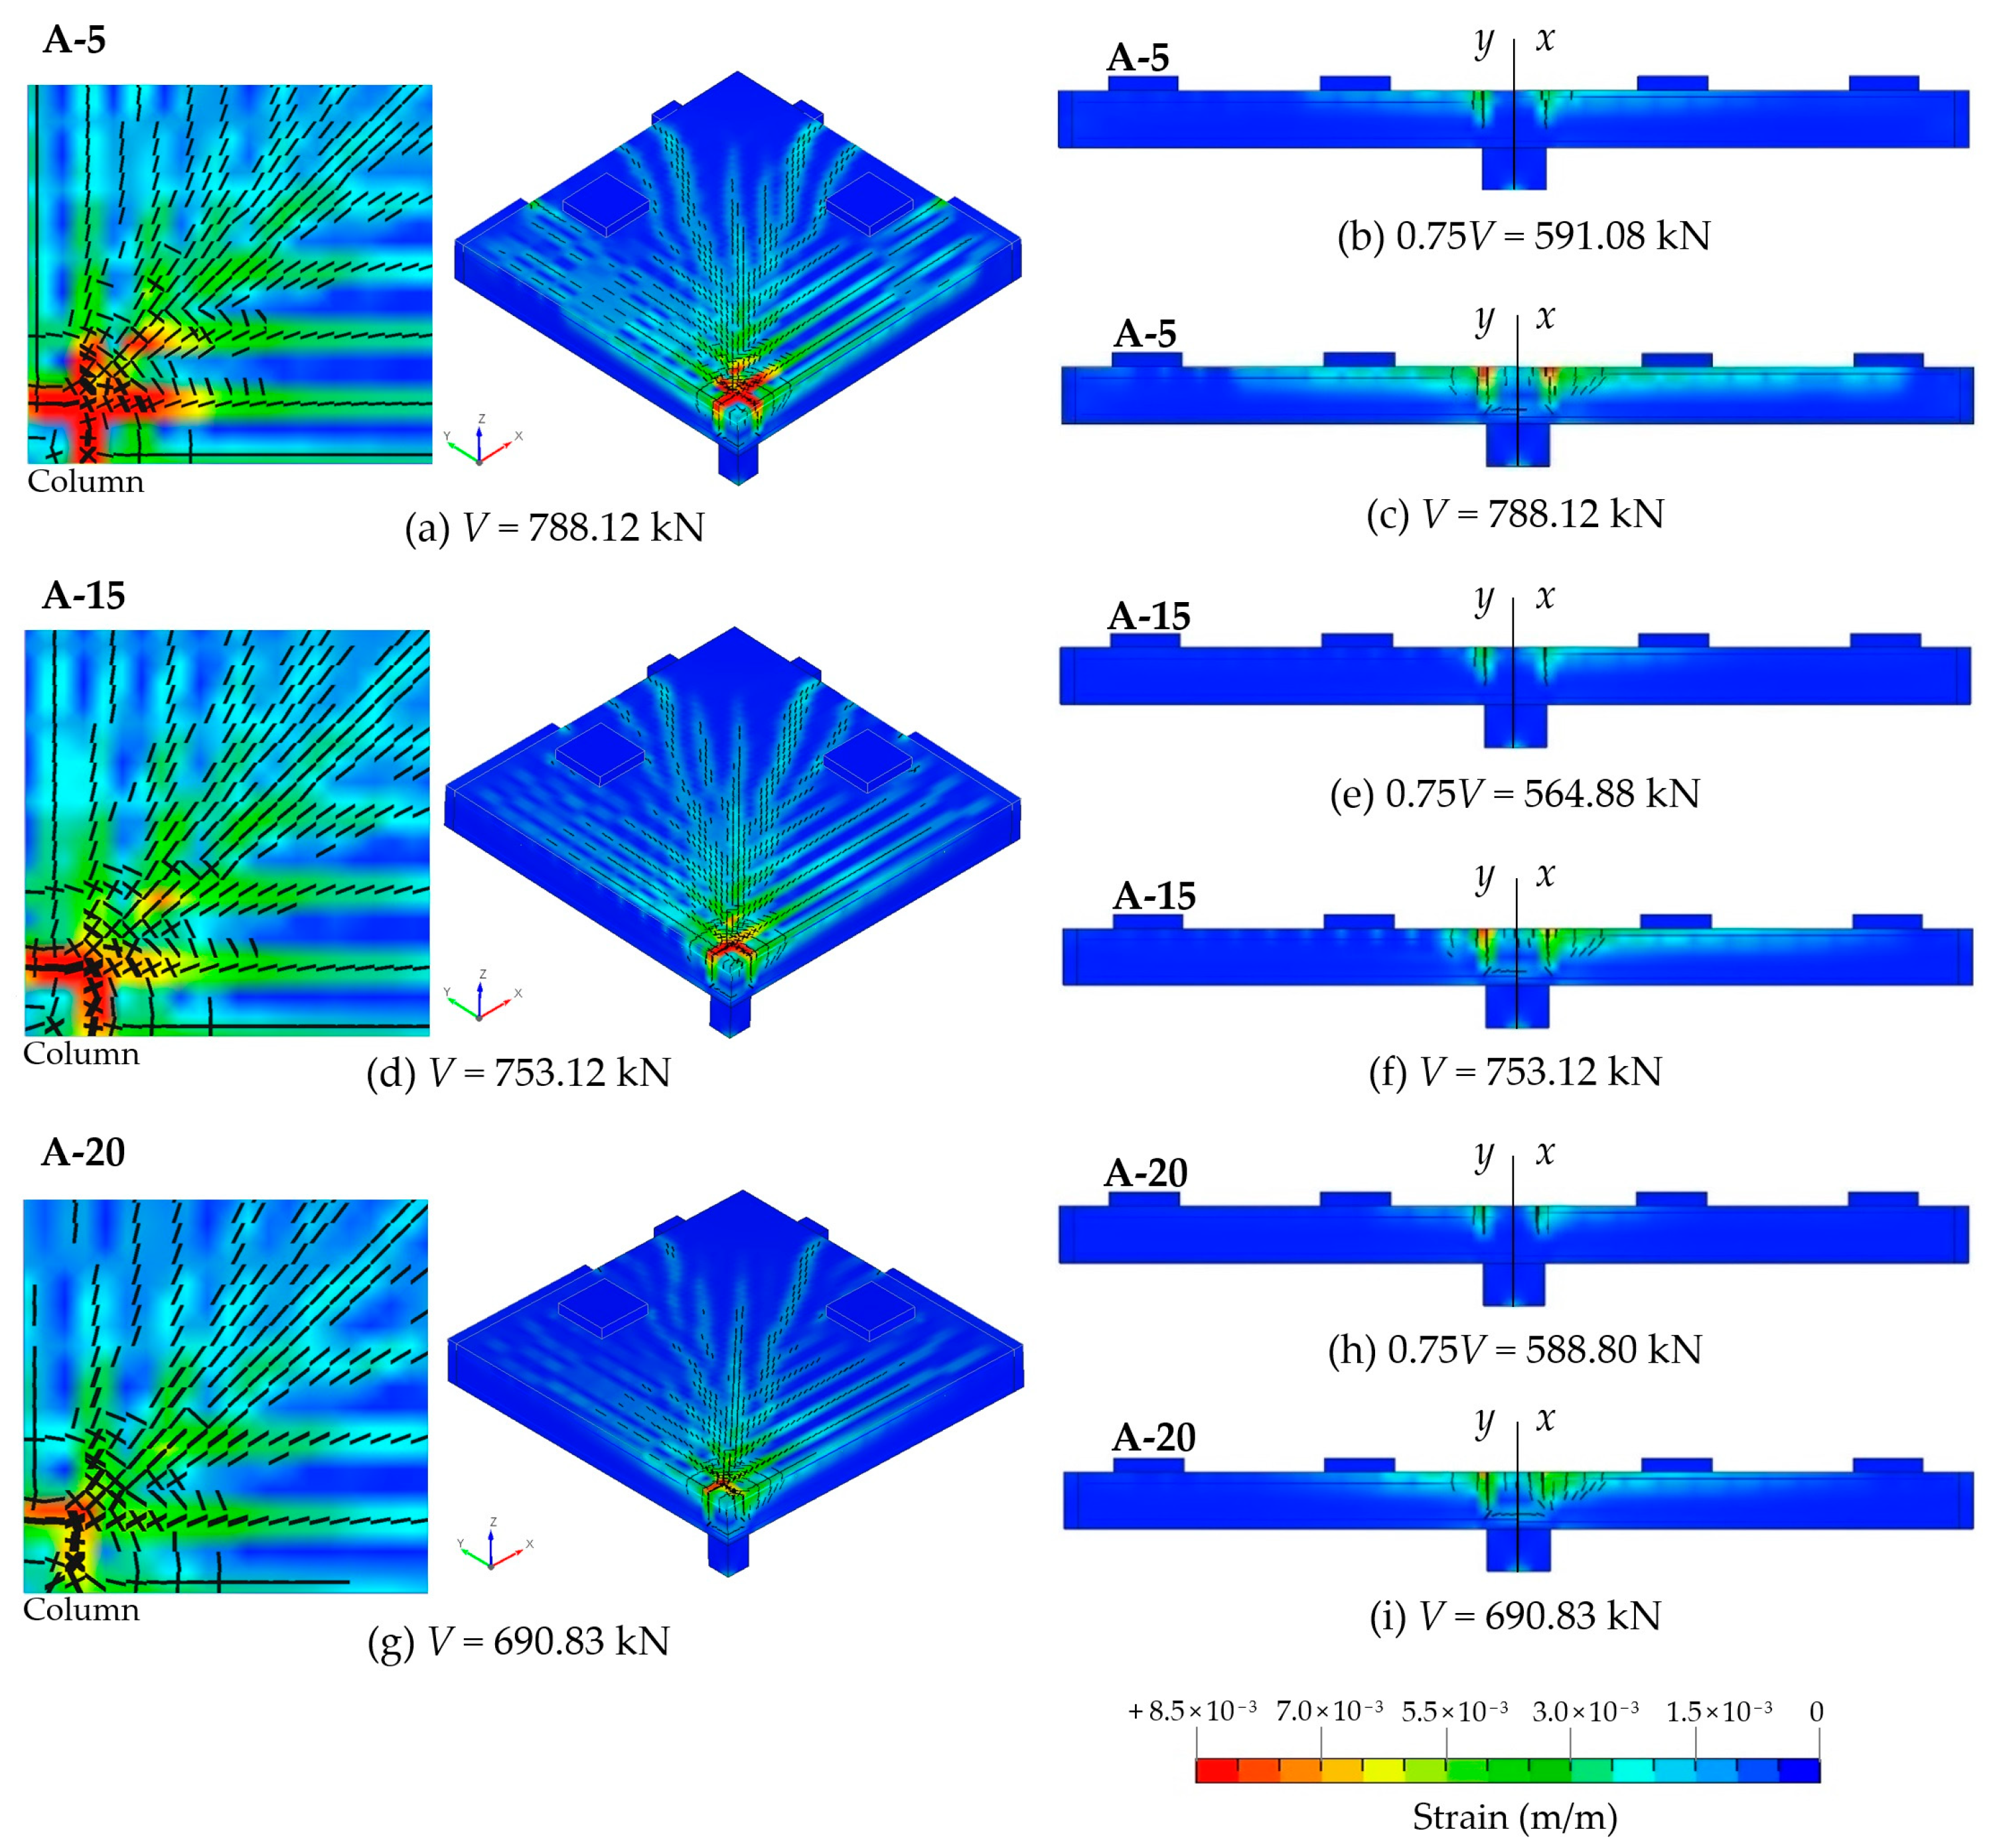
- Series A: three models varying the spacing between the central prestressing tendons;
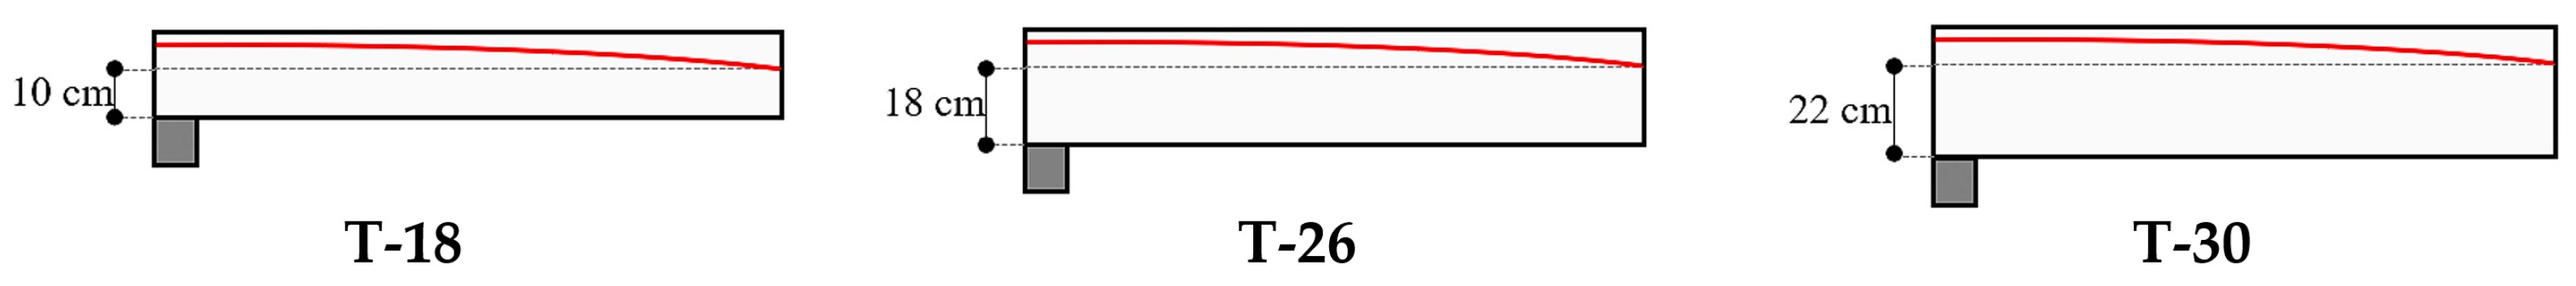
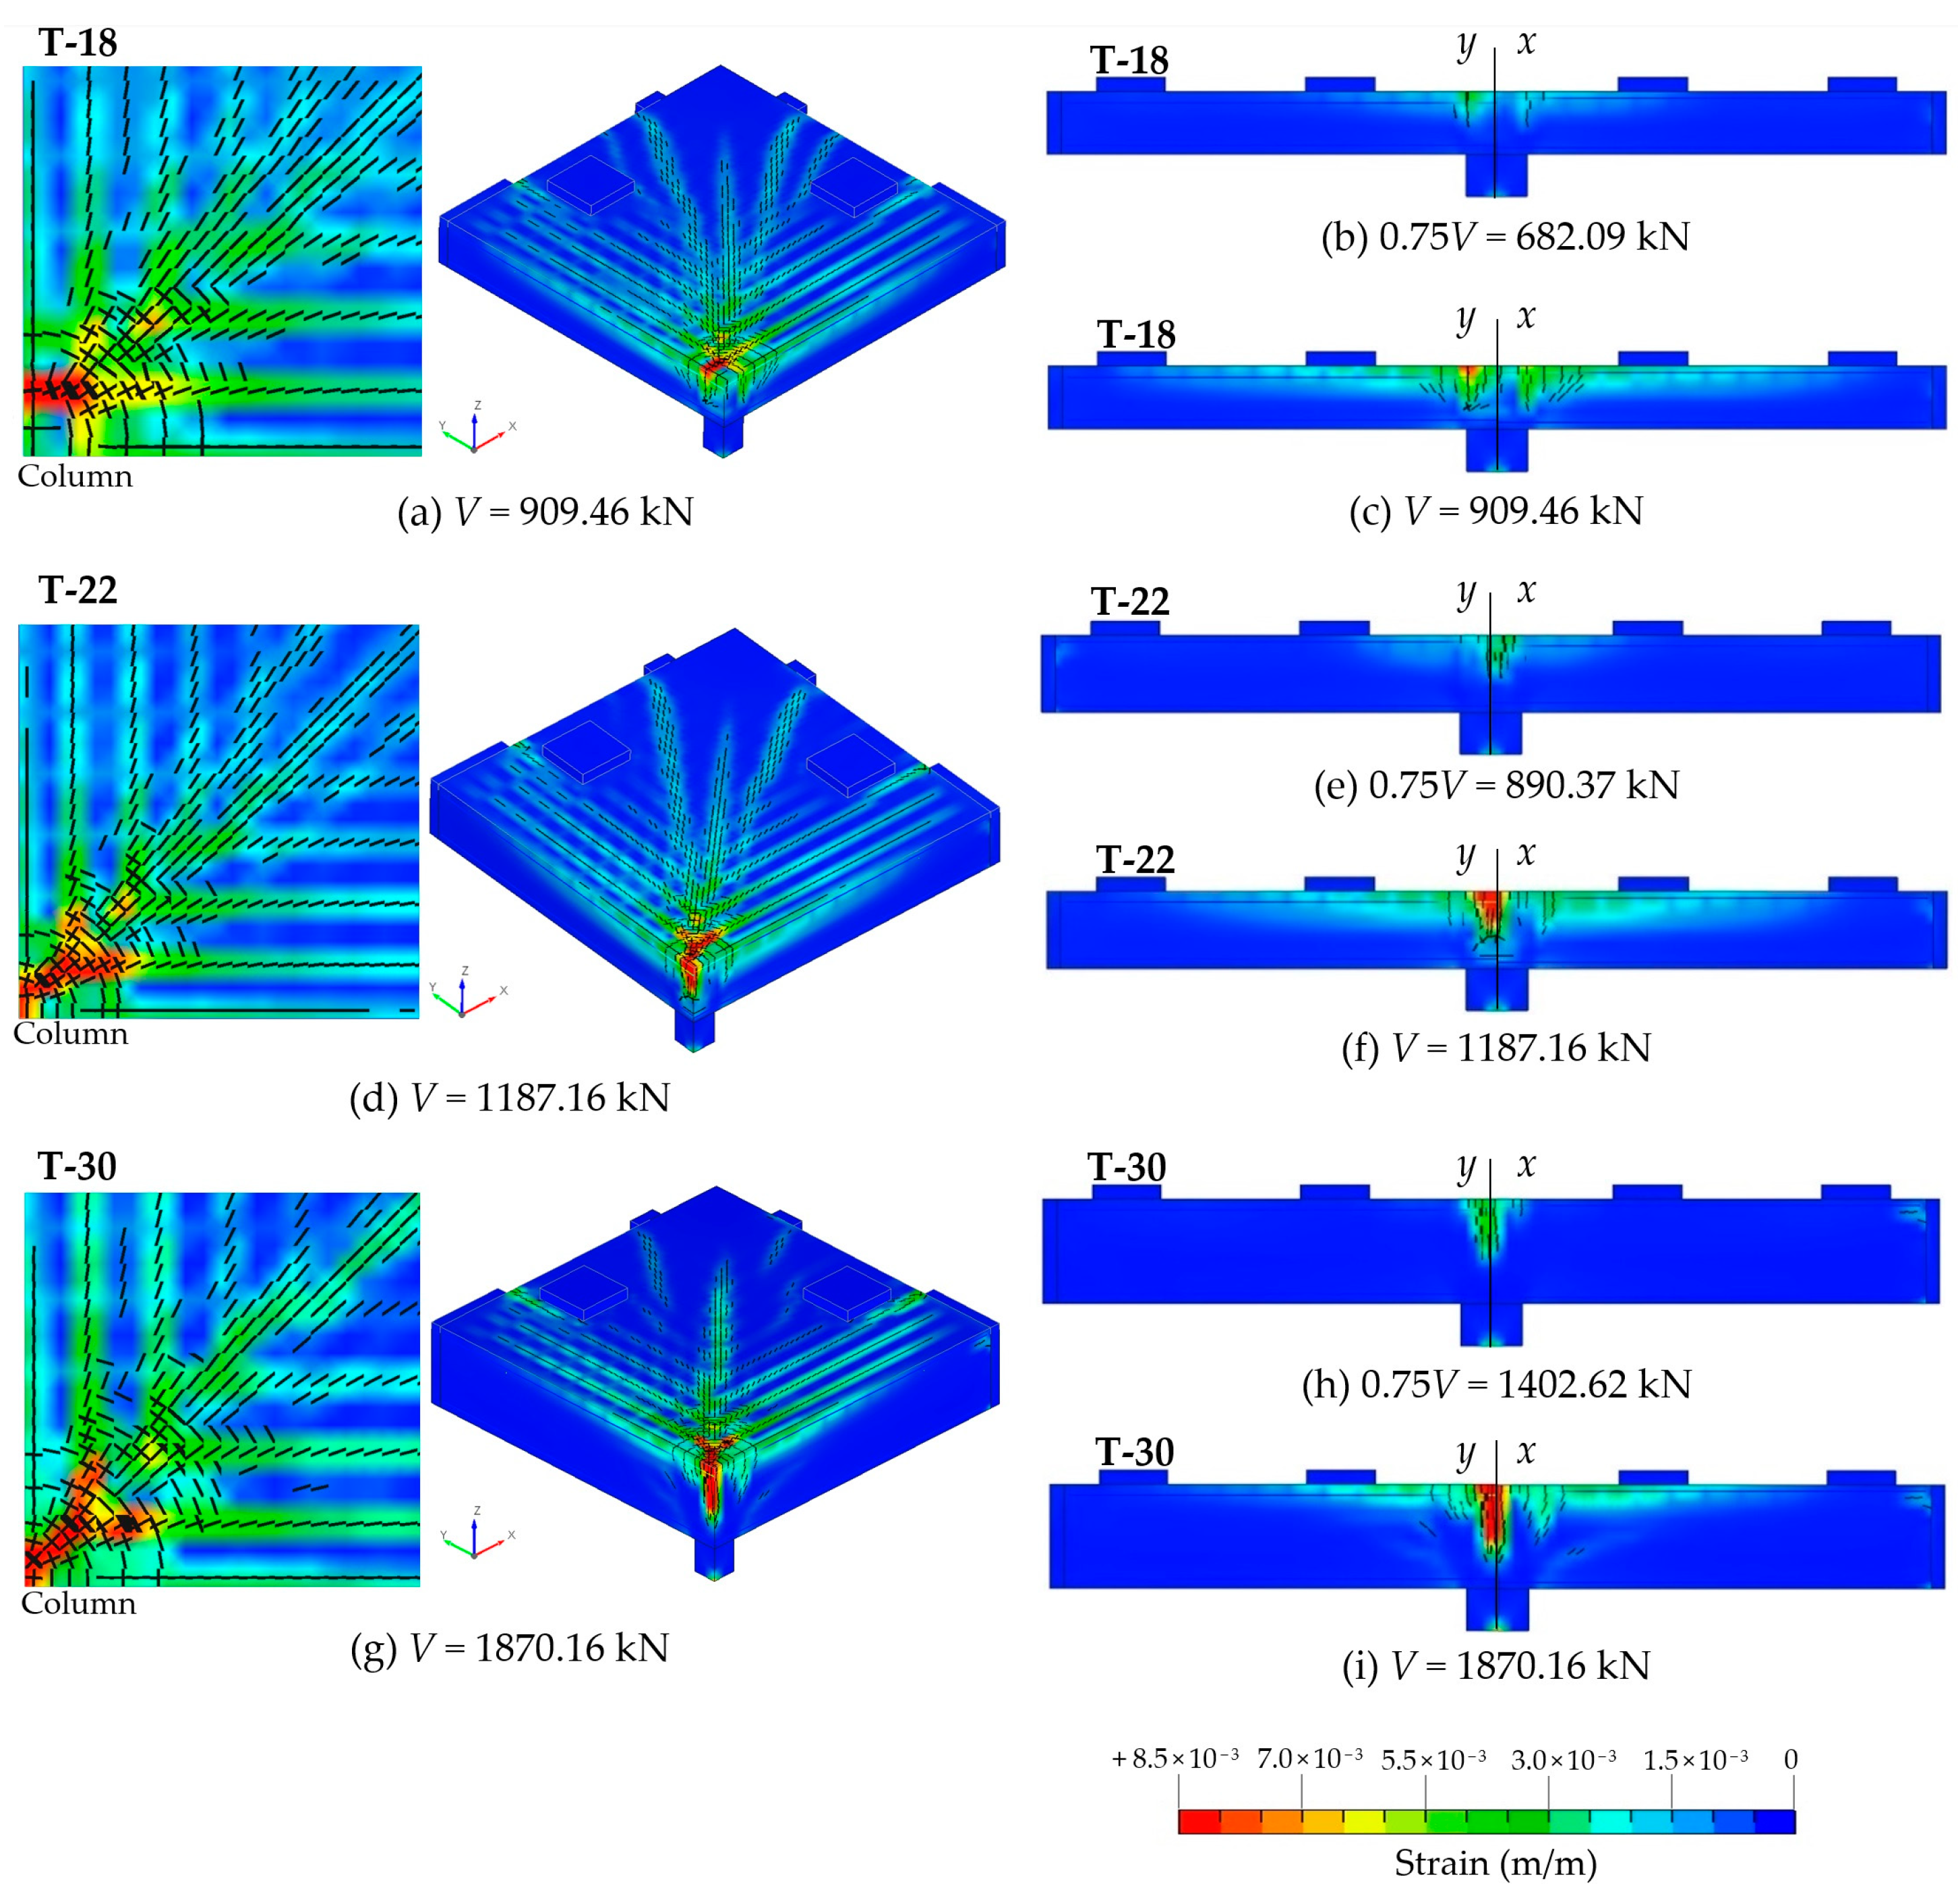
- Series T: seven models varying the thickness of the slab;
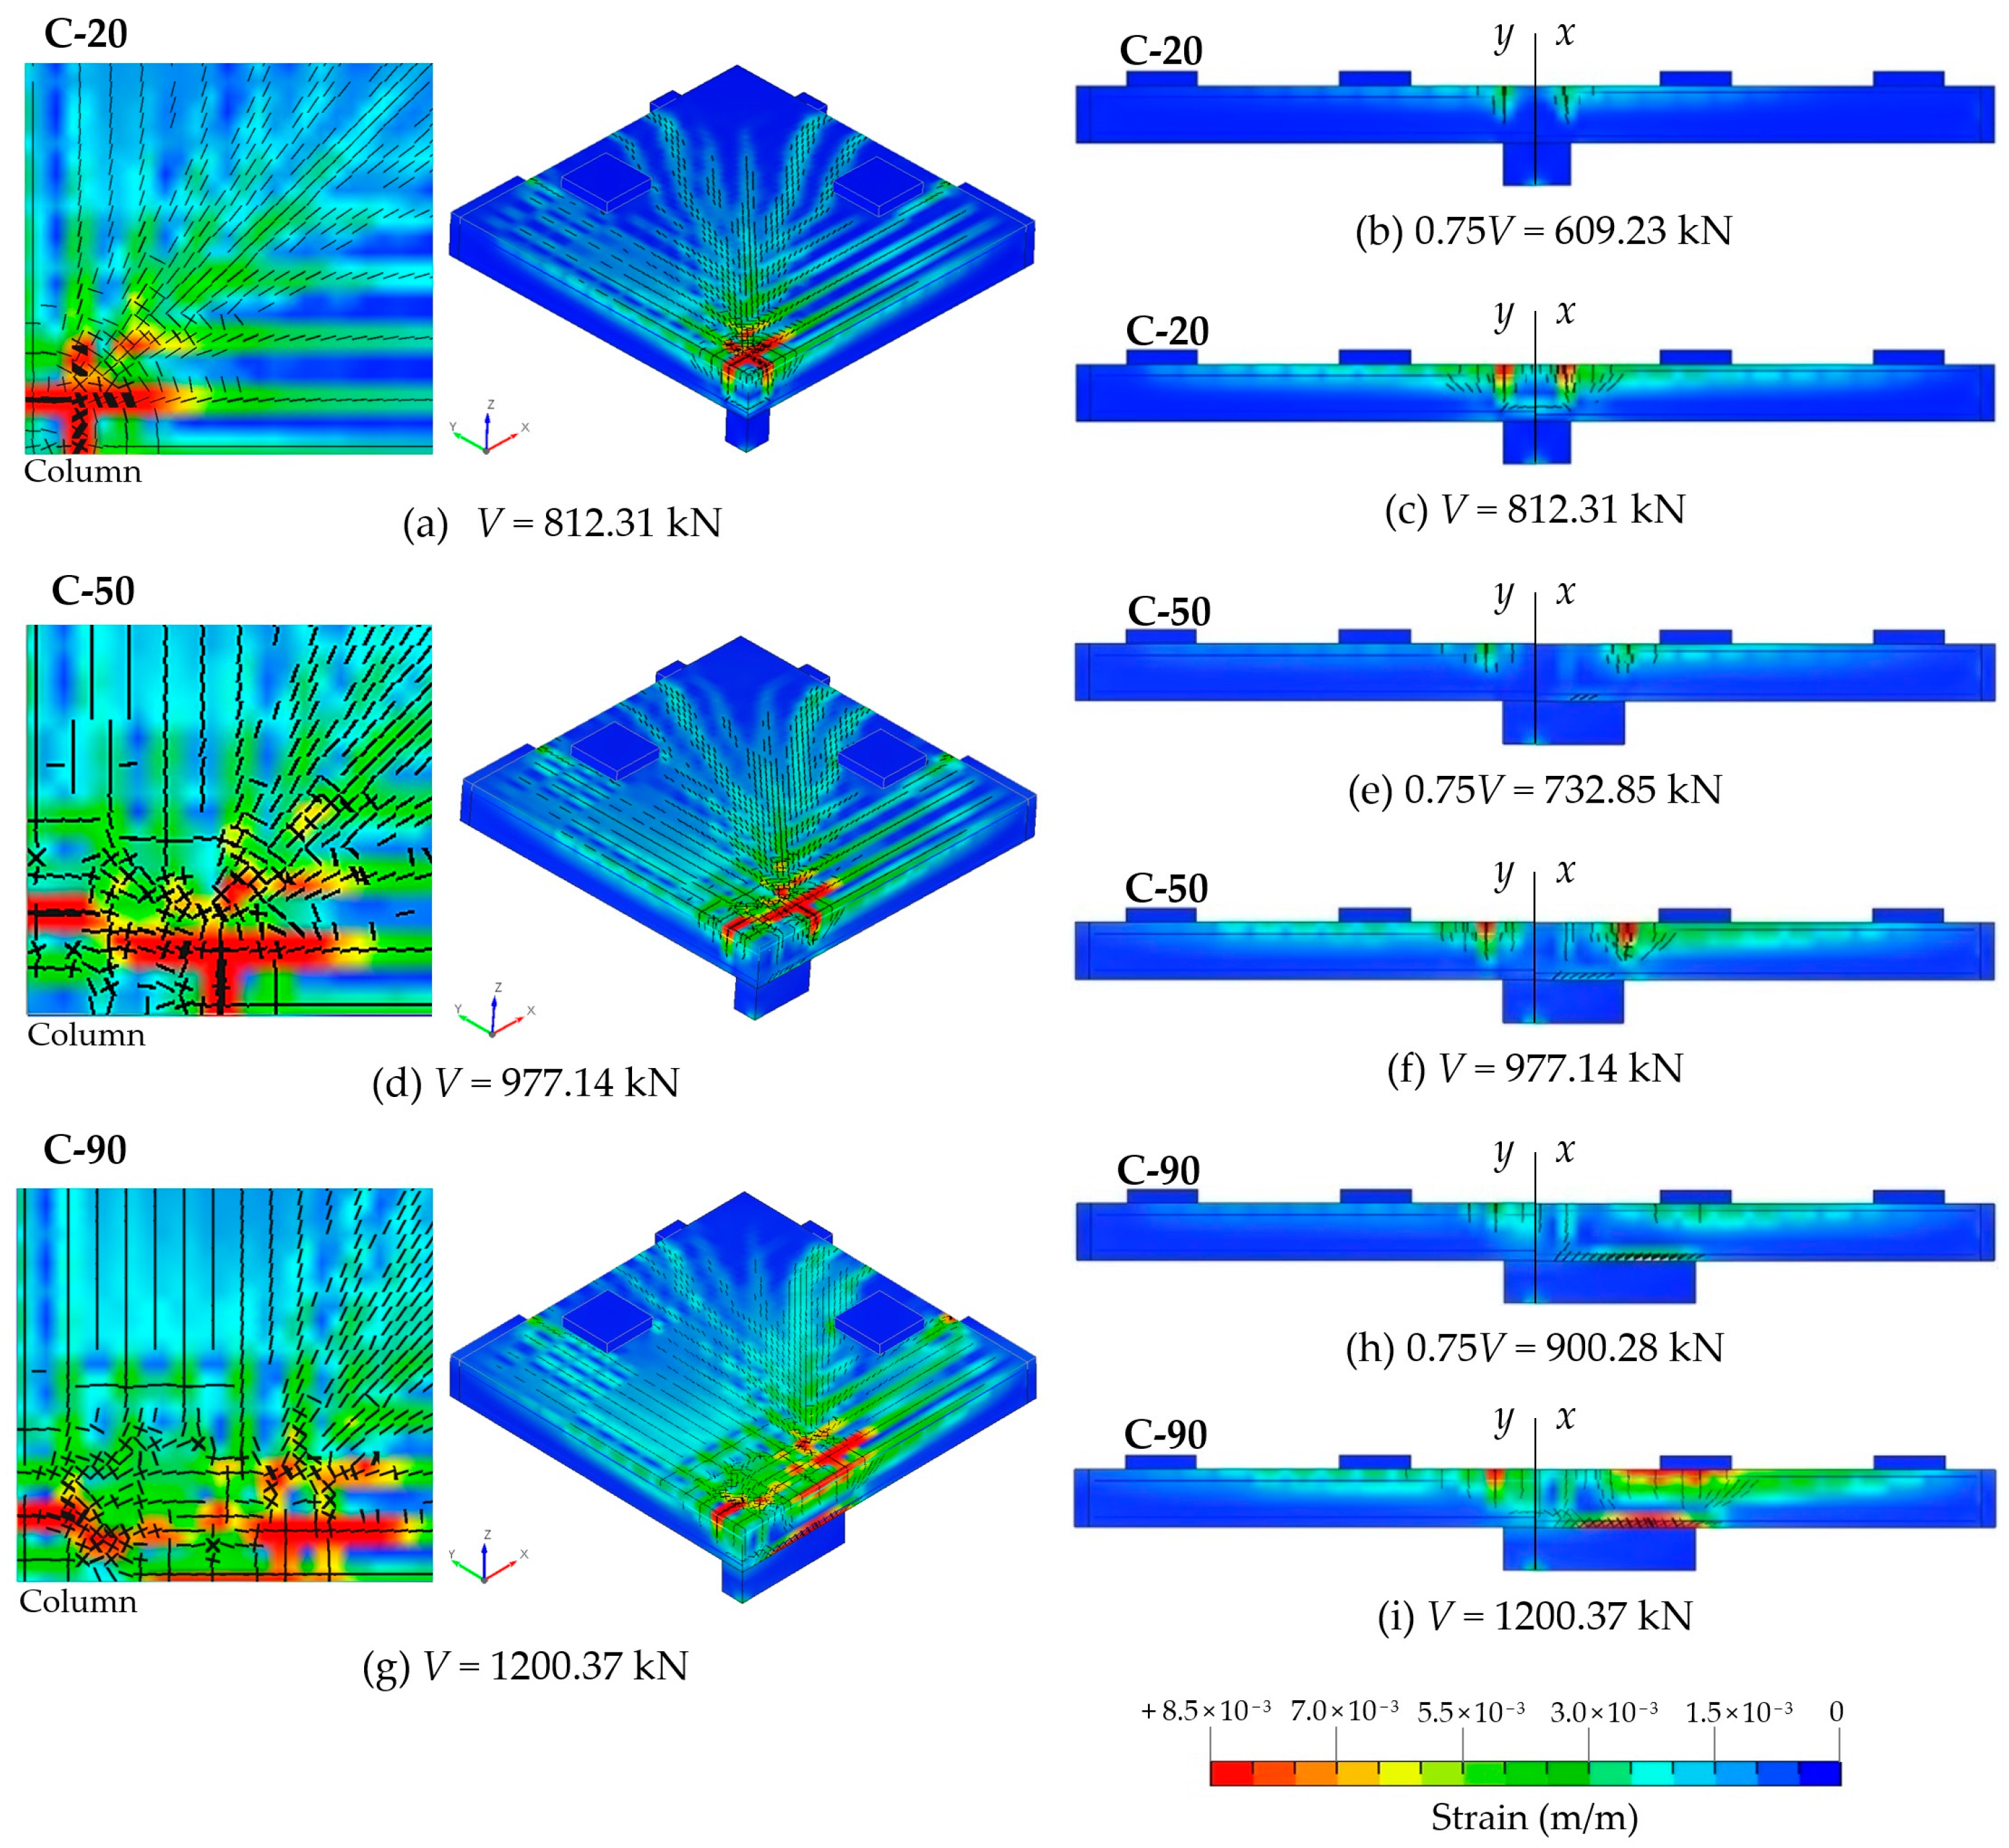
- Series C: fifteen models varying the column rectangularity.
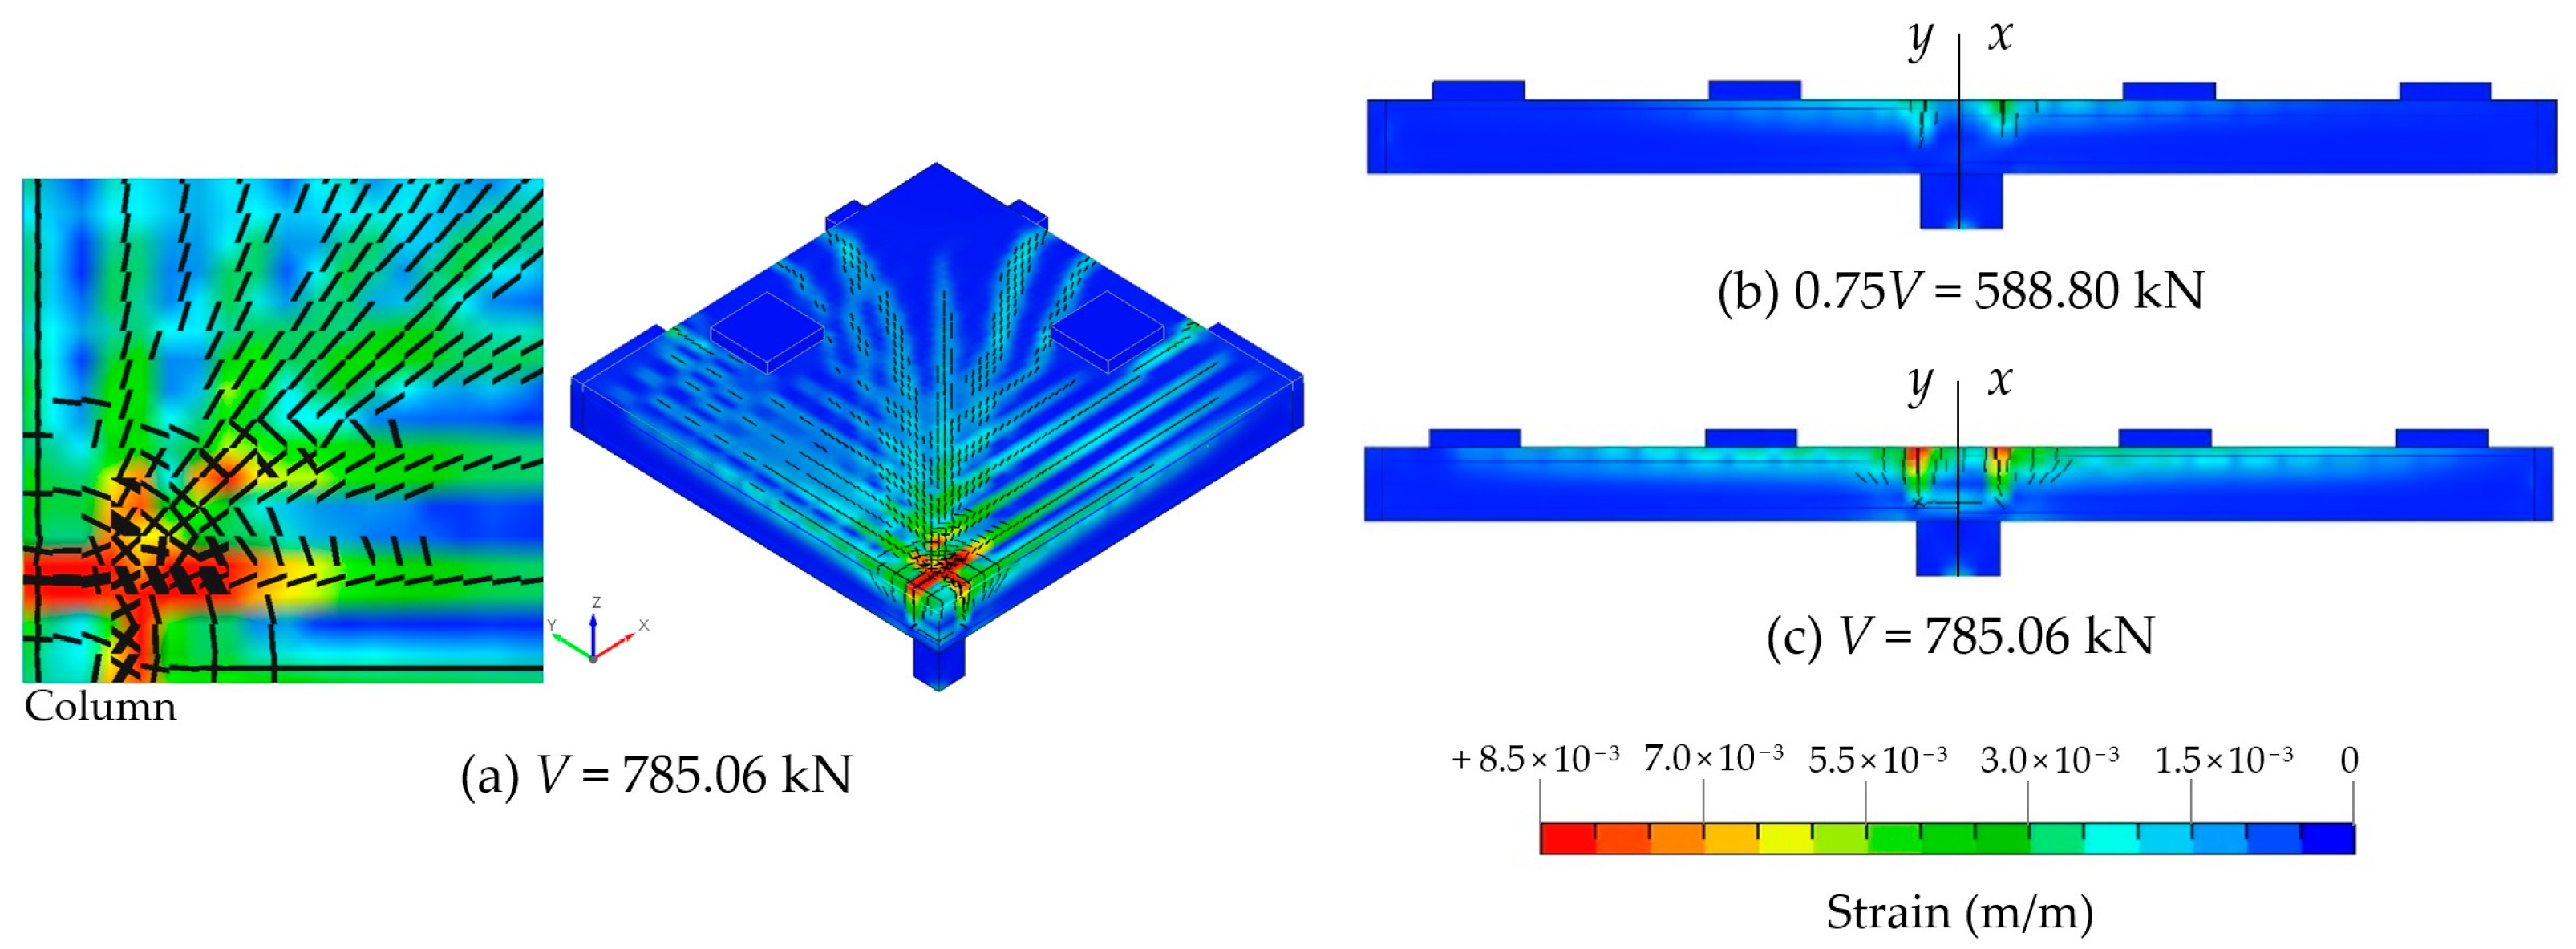
Comparison of Results
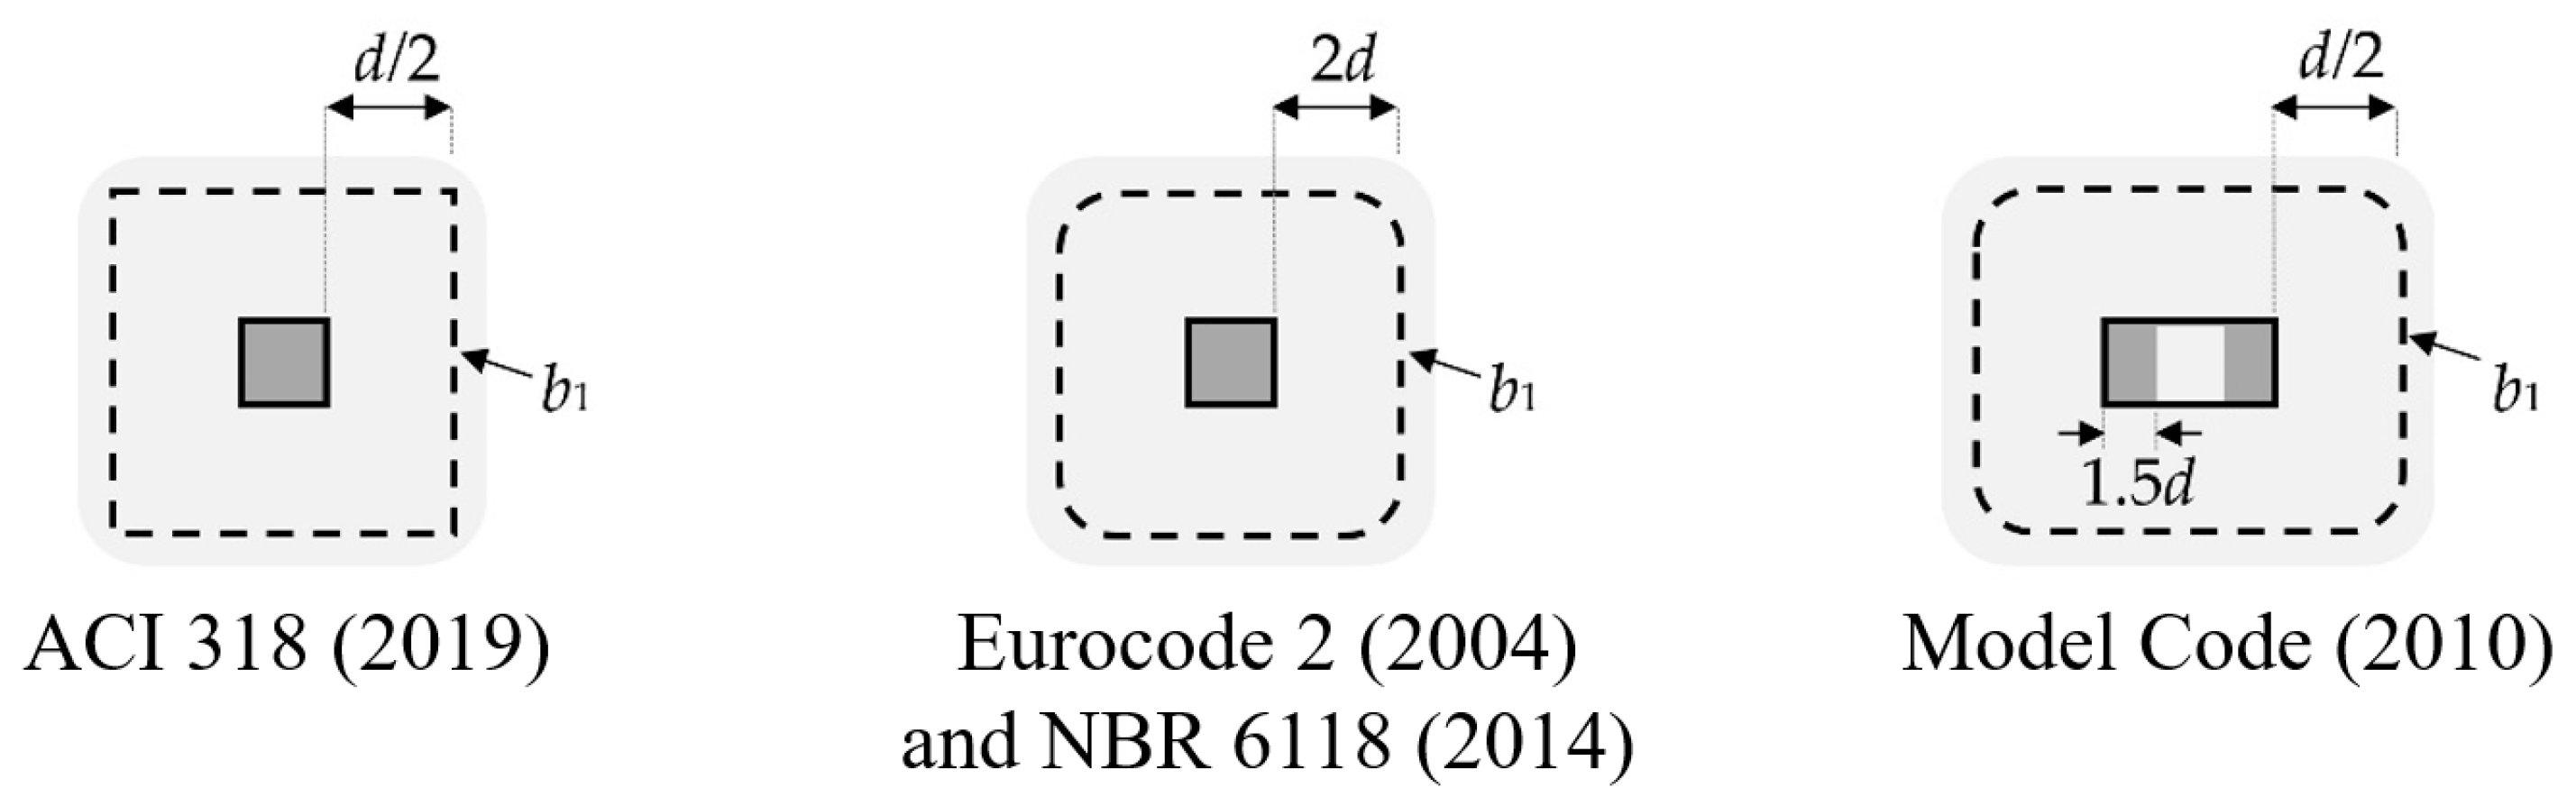
5. Normative Comparison
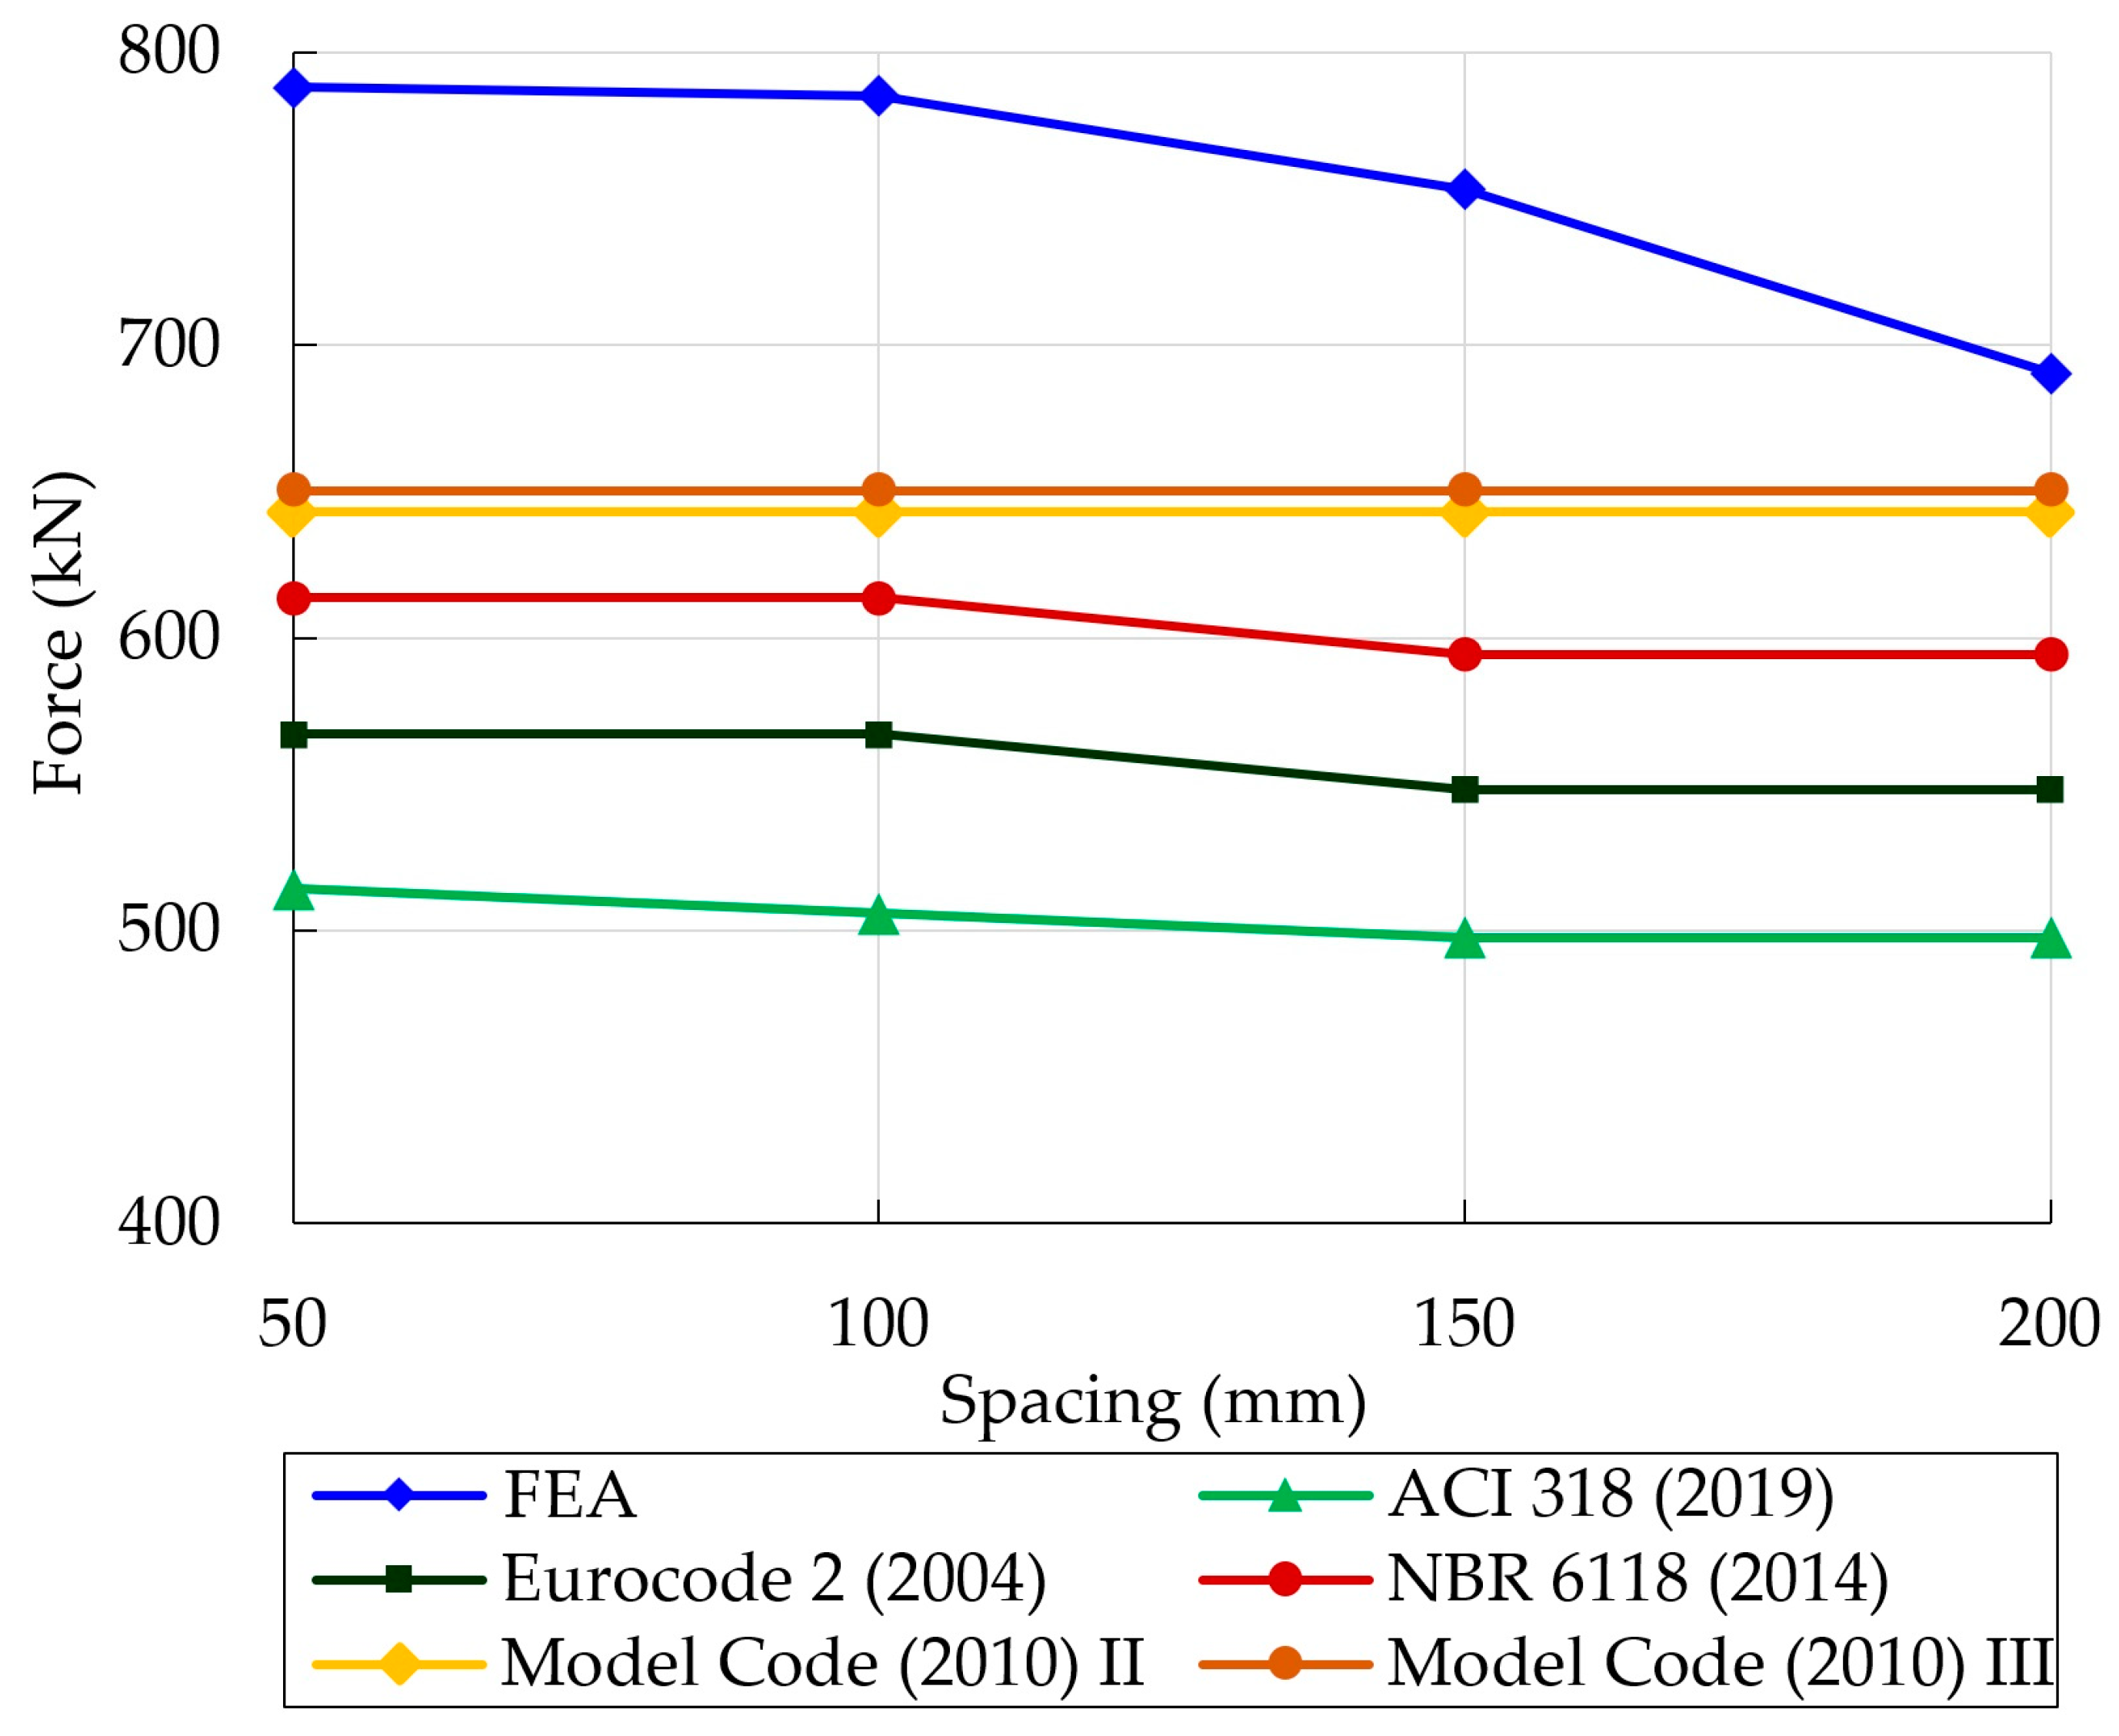
5.1. Comparison of Series A Results
5.2. Comparison of Series T Results
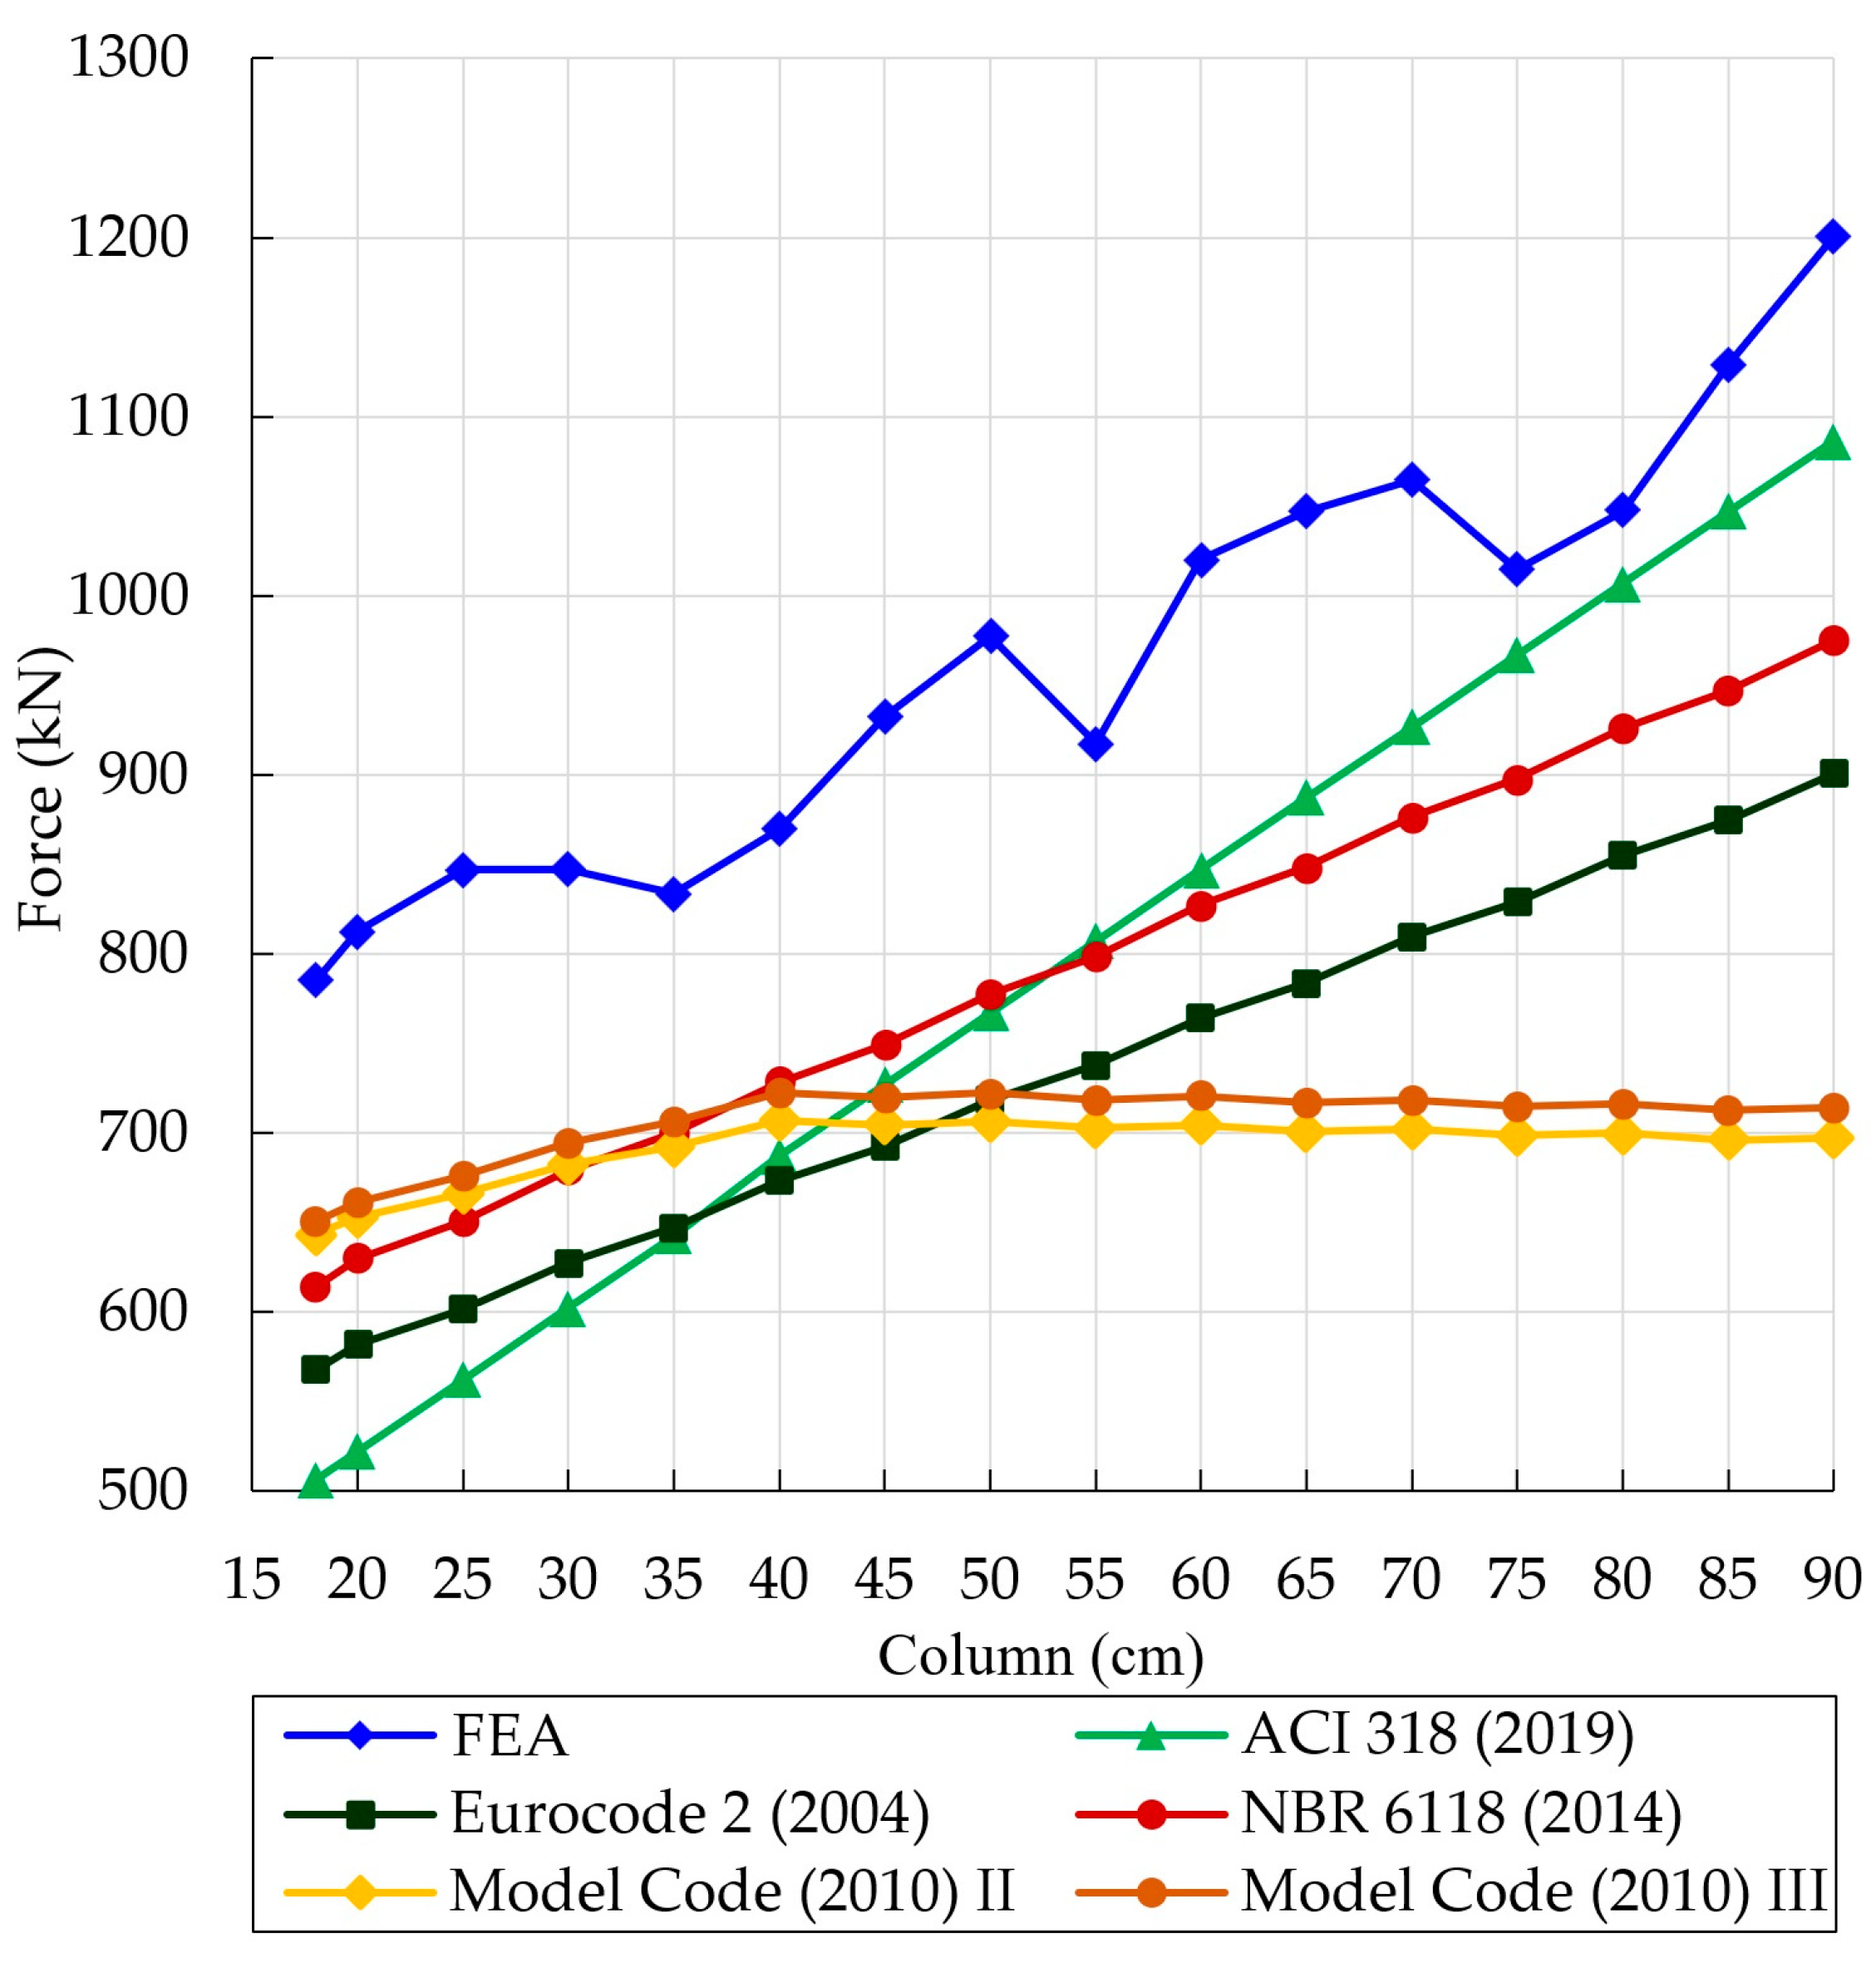
5.3. Comparison of Series C Results
6. Conclusions and Suggestions for Future Investigations
- Series A: the increase in spacing between tendons promoted a reduction in punching resistance and a decrease in concrete strain. The panorama of cracking of the slab with smaller spacing showed a greater concentration of cracks and strains, accompanied by an increase in resistance.
- Series T: the thickness of the slab causes great interference in the resistance and rigidity capacity of the models. The models revealed that strains in thicker slabs tend to concentrate, before failure, in a more central point and on the upper face of the slab.
- Series C: the rectangularity of the column has a great influence on the resistance capacity of prestressed flat slabs. Larger strains are achieved by slabs with a smaller column contact area. The larger support area for the prestressing tendons contributes to increased resistance.
- Series A: in general, the rules worked in favor of safety. Note that the design codes did not show a significant parameter capable of interfering with the results when changing the spacing between the tendons. It was identified that the fib model code [14] presents the best estimates even in the LoA III approximation, where the code considers that this level is not suitable for estimating cracked elements. ACI [11] was the most conservative in the estimates.
- Series T: it was observed that the fib model code [14] has the best trend of results as the thickness of the slab is increased; additionally, there is little difference in the results in its two levels of approximation. In general, the other standards tend to show the same behavior, except for ACI [11], which is characterized by more conservative behavior in estimates.
- Series C: the predictions of Eurocode 2 [12] and NBR [13] follow the same trend of behavior, differing due to the scale factor k. Considering the coefficient of variation and the average, the best results were due to NBR [13], followed by ACI [11]. In the case of the ACI [11], better predictions were noted with the increase in the rectangularity of the column. For the fib model code [14], it is observed that, in levels II and III, there is a stability of the results from the C-40 Series, which is justified due to the discontinuity of the critical perimeter, limited to 3d.
- It is proposed to use the constitutive model adopted in this work to simulate more experimental tests of slabs and beams, as well as other types of reinforced and prestressed concrete structures, such as columns, corbels, and shells.
- The simulation of isolated connections between columns and slabs is adequate for the localized punching analysis, but it does not cover the existing membrane forces in the global model (panels of slabs). With the facilities offered by computational tools, it would be interesting to model a slab supported by several pillars to study this phenomenon.
- Regarding prestressing, little information was found in the literature review and in the standards regarding the differences between the types of prestressing (bonded or unbonded). It is recommended to carry out a study to compare these two alternatives in behavior from flat slabs to punching. An experimental study of prestressed slabs is also suggested to confirm the numerical results achieved in this research.
- It is proposed to perform modeling of concrete slabs with shear reinforcement, varying the number of layers and radial spacing between elements.
- It is proposed to analyze punching situations for slabs with applied moments (eccentric punching).
Author Contributions
Funding
Data Availability Statement
Acknowledgments
Conflicts of Interest
Appendix A

References
- Melges, J.L.P. Experimental Punching Shear Analysis of Reinforced and Prestressed Concrete Slabs. Ph.D. Thesis, São Carlos School of Engineering, University of São Paulo, São Carlos, Brazil, 2001. Available online: http://www.teses.usp.br/teses/disponiveis/18/18134/tde-07062006-152744/ (accessed on 27 March 2023).
- Vecchio, F.J.; Gauvreau, P.; Liu, K. Modeling of unbonded post-tensioned concrete beams Critical in Shear. ACI Struct. J. 2006, 103, 57–64. [Google Scholar]
- El-Sisi, A.A.; Hassanin, A.I.; Shabaan, H.F.; Elsheikh, A.I. Effect of external post-tensioning on steel–concrete composite beams with partial connection. Eng. Struct. 2021, 247, 1–15. [Google Scholar] [CrossRef]
- Grow, J.; Vanderbilt, M. Shear strength of prestressed lightweight aggregate concrete flat plates. Precast./Prestress. Concr. Inst J. 1967, 5, 18–28. [Google Scholar] [CrossRef]
- Nylander, H.; Kinnunen, S.; Ingvarsson, H. Punching of A Prestressed and Normally Reinforced Concrete Bridge Slab Supported by A Column; Technical Report; KTH Royal Institute of Technology: Stockholm, Sweden, 1977. [Google Scholar]
- Pralong, J.; Brändli, W.; Thürlimann, B. Durchstanzversuche an Stahlbetonund Spannbetonplatten. 7305; Birkhäuser: Basel, Switzerland, 1979. [Google Scholar]
- Shehata, I. Punching of Prestressed and Non-Prestressed Reinforced Concrete Flat Slabs. Ph.D. Thesis, Polytechnic of Central London, London, UK, 1982. [Google Scholar]
- Corrêa, G. Puncionamento em Lajes Cogumelo Protendidas com Cabos não Aderentes. Master’ Thesis, University of Brasilia, Brasília, Brazil, 2001. Available online: https://repositorio.unb.br/handle/10482/37391 (accessed on 27 March 2023).
- Ramos, A.P.; Lúcio, V.J.; Regan, P.E. Punching of flat slabs with in-plane forces. Eng Struct. 2011, 33, 894–902. [Google Scholar] [CrossRef]
- Clément, T.; Ramos, A.P.; Ruiz, M.F.; Muttoni, A. Influence of prestressing on the punching strength of post-tensioned slabs. Eng. Struct. 2014, 72, 56–69. [Google Scholar] [CrossRef]
- ACI 318-19; Building Code Requirments for Structural Concrete and Commentary. American Concrete Institute: Farmington Hills, MI, USA, 2019.
- EN 1992-1-1; Eurocode 2, Design of Concrete Structures—Part 1-1: General Rules and Rules for Buildings. CEN: Belgium, Belgium, 2010.
- ABNT NBR 6118; Design of Concrete Structures—Procedures. Brazilian Association of Technical Standards: Rio de Janeiro, Brazil, 2014.
- fib (Fédération Internationale du Béton). fib Model Code for Concrete Structures 2010 (MC 2010); Ernst and Sohn: Berlin, Germany, 2013. [Google Scholar]
- Ellobody, E.; Bailey, C.G. Behaviour of Unbonded post-tensioned one-way concrete slabs. Adv. Struct. Eng. 2008, 11, 107–120. [Google Scholar] [CrossRef]
- Kang, T.H.K.; Huang, Y.; Shin, M.; Lee, J.D.; Cho, A.S. Experimental and numerical assessment of bonded and unbonded post-tensioned concrete members. ACI Struct. J. 2015, 112, 735–748. [Google Scholar] [CrossRef]
- Diaz, R.A.; Trautwein, L.M.; Bittencourt, T.N. Numerical investigation of the punching shear capacity of unbonded post-tensioned concrete flat slabs. Struct. Concr. 2020, 22, 1205–1222. [Google Scholar] [CrossRef]
- Červenka, V.; Jendele, L.; Červenka, J. ATENA Program Documentation Part 1 Theory; Červenka Consulting s.r.o.: Prague, Czech Republic, 2016; p. 282. [Google Scholar]
- Bažant, Z.P.; Oh, B.H. Crack band theory for fracture of concrete. Mat. Constr. 1983, 16, 155–177. [Google Scholar] [CrossRef]
- Menetrey, P.; Willam, K.J. Triaxial failure criterion for concrete and its generalization. Struct. J. 1995, 92, 311–318. [Google Scholar]
- Červenka, J.; Papanikolaou, V.K. Three-dimensional combined fracture–plastic material model for concrete. Int. J. Plast. 2008, 24, 2192–2220. [Google Scholar] [CrossRef]
- De Borst, R.; Crisfield, M.A.; Remmers, J.J.; Verhoosel, C.V. Solution Techniques in Quasi-static Analysis. In Nonlinear Finite Element Analysis of Solids and Structures; John Wiley & Sons: Hoboken NJ, USA, 2012; pp. 113–116. [Google Scholar] [CrossRef]
- Vecchio, F.J.; Collins, M.P. Modified Compression-Field Theory for reinforced concrete beams subjected to shear. ACI J. Proc. 1986, 83, 219–231. [Google Scholar]
- Comité Euro-International du Béton. CEB-FIP Model Code 1990; Thomas Telford: London, UK, 1993. [Google Scholar]
- Hordijk, D.A. Local Approach to Fatigue of Concrete. Ph.D. Thesis, Delft University of Technology, Delft, The Netherlands, 1991. [Google Scholar]
- Vos, E. Influence of Loading Rate and Radial Pressure on Bond in Reinforced Concrete. Dissertation, Delft University, Delft, The Netherlands. 1983, pp. 219–220. Available online: https://repository.tudelft.nl/islandora/object/uuid:29419e9e-9b56-41a5-94cb-d363b1c8c15e (accessed on 27 March 2023).
- Kupfer, H.; Hilsdorf, H.K.; Rüsch, H. Behavior of concrete under Biaxial Stress. J. ACI 1969, 66, 656–666. [Google Scholar]
- Bigaj, A.J. Structural Dependence of Rotations Capacity of Plastic Hinges in R.C. Beams and Slabs. Doctoral Thesis, Delft University of Technology, Delft, The Netherlands, 1999. Available online: http://resolver.tudelft.nl/uuid:f7b89645-75f5-463a-bec5-7da4afeb537b (accessed on 27 March 2023).


| Concrete Properties | Prestressing Tendon Properties | Steel Properties | ||||||||
|---|---|---|---|---|---|---|---|---|---|---|
| fc (MPa) | fct (MPa) | Ec (MPa) | Øp (mm) | Ap (mm2) | Vp (1%) (kN) | Ep (MPa) | Øs (mm) | fsy (MPa) | fsr (MPa) | Es (MPa) |
| 51.92 | 3.87 | 30.46 | 12.7 | 99.9 | 182 | 208,000 | 12.5 | 651.4 | 792.3 | 201,541 |
| 8.0 | 601.8 | 711.9 | 206,900 | |||||||
| Direction x | Direction y | |||||||
|---|---|---|---|---|---|---|---|---|
| Tendon | 5 | 6 | 7 | 8 | 5 | 6 | 7 | 8 |
| Prestressing | 97.09 | 94.38 | 121.10 | 95.24 | 93.53 | 97.59 | 85.80 | 98.24 |
| Re-stress | 128.77 | 129.61 | 133.21 | 130.61 | 128.65 | 132.29 | 127.48 | 131.94 |
| Rupture | 136.03 | 137.89 | 140.07 | 134.10 | 137.15 | 141.03 | 134.88 | 135.52 |
| Models | V (kN) | Displacement (mm) | εc,máx (‰) | |
|---|---|---|---|---|
| A-5 | 788.12 | 1.00 | 8.89 | −2.08 |
| A-10 | 785.06 | 1.00 | 8.79 | −2.18 |
| A-15 | 753.17 | 0.96 | 7.85 | −2.04 |
| A-20 | 690.83 | 0.88 | 6.31 | −1.77 |
| Models | V (kN) | Displacement (mm) | εc,máx (‰) | |
|---|---|---|---|---|
| T-16 | 785.06 | 1.00 | 8.79 | −2.08 |
| T-18 | 909.46 | 1.16 | 7.04 | −2.04 |
| T-20 | 1059.23 | 1.35 | 6.22 | −2.00 |
| T-22 | 1187.16 | 1.51 | 5.33 | −1.90 |
| T-24 | 1408.22 | 1.79 | 5.62 | −2.04 |
| T-26 | 1534.49 | 1.95 | 4.81 | −1.95 |
| T-28 | 1669.18 | 2.13 | 4.19 | −1.86 |
| T-30 | 1870.16 | 2.38 | 4.22 | −1.96 |
| Models | V (kN) | Displacement (mm) | εc,máx (‰) | |
|---|---|---|---|---|
| C-18 | 785.06 | 1.00 | 8.79 | −2.08 |
| C-20 | 812.31 | 1.04 | 9.54 | −2.28 |
| C-25 | 846.78 | 1.08 | 10.02 | −1.93 |
| C-30 | 847.04 | 1.08 | 9.61 | −1.55 |
| C-35 | 833.47 | 1.06 | 8.51 | −1.10 |
| C-40 | 869.48 | 1.11 | 9.09 | −0.98 |
| C-45 | 932.41 | 1.19 | 10.26 | −0.85 |
| C-50 | 977.14 | 1.24 | 10.89 | −0.76 |
| C-55 | 917.22 | 1.17 | 8.65 | −0.46 |
| C-60 | 1019.94 | 1.30 | 11.16 | −0.50 |
| C-65 | 1047.08 | 1.33 | 10.85 | −0.25 |
| C-70 | 1064.57 | 1.36 | 10.63 | −0.16 |
| C-75 | 1014.59 | 1.30 | 9.19 | −0.02 |
| C-80 | 1047.25 | 1.33 | 9.87 | 0.11 |
| C-85 | 1129.02 | 1.44 | 10.59 | 0.27 |
| C-90 | 1200.37 | 1.53 | 12.11 | 0.28 |
| Models | VFEA (kN) | |||||
|---|---|---|---|---|---|---|
| A-5 | 788.12 | 1.53 | 1.39 | 1.28 | 1.23 | 1.21 |
| A-10 | 785.06 | 1.55 | 1.38 | 1.28 | 1.22 | 1.21 |
| A-15 | 753.17 | 1.51 | 1.37 | 1.27 | 1.17 | 1.16 |
| A-20 | 690.83 | 1.39 | 1.26 | 1.16 | 1.07 | 1.06 |
| Mea. | 1.50 | 1.35 | 1.25 | 1.17 | 1.16 | |
| SD. | 0.06 | 0.05 | 0.05 | 0.06 | 0.06 | |
| C.V. (%) | 4.26 | 3.93 | 4.01 | 5.19 | 5.19 | |
| Models | VFEA (kN) | |||||
|---|---|---|---|---|---|---|
| C-18 | 785.06 | 1.55 | 1.38 | 1.28 | 1.22 | 1.21 |
| C-20 | 812.31 | 1.56 | 1.40 | 1.29 | 1.24 | 1.23 |
| C-25 | 846.78 | 1.51 | 1.41 | 1.30 | 1.27 | 1.25 |
| C-30 | 847.04 | 1.41 | 1.35 | 1.25 | 1.24 | 1.22 |
| C-35 | 833.47 | 1.30 | 1.29 | 1.19 | 1.20 | 1.18 |
| C-40 | 869.48 | 1.27 | 1.29 | 1.19 | 1.23 | 1.20 |
| C-45 | 932.41 | 1.28 | 1.35 | 1.24 | 1.32 | 1.30 |
| C-50 | 977.14 | 1.27 | 1.36 | 1.26 | 1.38 | 1.35 |
| C-55 | 917.22 | 1.14 | 1.24 | 1.15 | 1.31 | 1.28 |
| C-60 | 1019.94 | 1.20 | 1.34 | 1.23 | 1.45 | 1.42 |
| C-65 | 1047.08 | 1.18 | 1.34 | 1.23 | 1.49 | 1.46 |
| C-70 | 1064.57 | 1.15 | 1.32 | 1.21 | 1.52 | 1.48 |
| C-75 | 1014.59 | 1.05 | 1.22 | 1.13 | 1.45 | 1.42 |
| C-80 | 1047.25 | 1.04 | 1.22 | 1.13 | 1.50 | 1.46 |
| C-85 | 1129.02 | 1.08 | 1.29 | 1.19 | 1.62 | 1.58 |
| C-90 | 1200.37 | 1.11 | 1.33 | 1.23 | 1.72 | 1.68 |
| Mea. | 1.26 | 1.32 | 1.22 | 1.39 | 1.36 | |
| SD. | 0.17 | 0.06 | 0.05 | 0.15 | 0.14 | |
| C.V. (%) | 13.26 | 4.17 | 4.18 | 10.94 | 10.66 | |
Disclaimer/Publisher’s Note: The statements, opinions and data contained in all publications are solely those of the individual author(s) and contributor(s) and not of MDPI and/or the editor(s). MDPI and/or the editor(s) disclaim responsibility for any injury to people or property resulting from any ideas, methods, instructions or products referred to in the content. |
© 2023 by the authors. Licensee MDPI, Basel, Switzerland. This article is an open access article distributed under the terms and conditions of the Creative Commons Attribution (CC BY) license (https://creativecommons.org/licenses/by/4.0/).
Share and Cite
Brigo, H.; Ashihara, L.J.; Marques, M.G.; Liberati, E.A.P. Non-Linear Analysis of Flat Slabs Prestressed with Unbonded Tendons Submitted to Punching Shear. Buildings 2023, 13, 923. https://doi.org/10.3390/buildings13040923
Brigo H, Ashihara LJ, Marques MG, Liberati EAP. Non-Linear Analysis of Flat Slabs Prestressed with Unbonded Tendons Submitted to Punching Shear. Buildings. 2023; 13(4):923. https://doi.org/10.3390/buildings13040923
Chicago/Turabian StyleBrigo, Heraldo, Luana J. Ashihara, Marília G. Marques, and Elyson A. P. Liberati. 2023. "Non-Linear Analysis of Flat Slabs Prestressed with Unbonded Tendons Submitted to Punching Shear" Buildings 13, no. 4: 923. https://doi.org/10.3390/buildings13040923