Article

Evolutionary Game Analysis for Key Participants’ Behavior in Digital Transformation of the Chinese Construction Industry

1
School of Civil Engineering and Architecture, Jiaxing Nanhu University, Jiaxing 314000, China
2
Business School, Hohai University, Nanjing 211100, China
*
Author to whom correspondence should be addressed.
Buildings 2023, 13(4), 922; https://doi.org/10.3390/buildings13040922
Submission received: 20 February 2023 / Revised: 27 March 2023 / Accepted: 28 March 2023 / Published: 31 March 2023
(This article belongs to the Special Issue Advances in Project Management in Construction)

Abstract

:
The transformation and upgrading of the construction industry has made obvious progress in China. However, the low degree of digitalization is still prominent. The digital transformation decision-making behavior of key participants in the construction industry is easily affected by economic interests, meaning that the implementation of digital transformation is a dynamic evolution process of repeated adjustment and continuous learning. Therefore, this study constructed a tripartite evolutionary game model of the government, service providers, and construction enterprises, and analyzed the strategy selection of each game player and the stability of the system equilibrium point. Moreover, the validity of the model and the influence of various factors on the system were verified and analyzed by numerical simulation. The results showed the following: (1) The government’s tax refund ratio and subsidy coefficient can significantly increase the motivation of construction enterprises and digital construction service providers within a certain threshold. (2) Whether enterprises carry out a comprehensive digital transformation depends on the revenue of the system solution strategy; the greater the revenue, the more positive the enterprises. (3) The adoption of high rewards and high penalties by the superior government can effectively encourage the local government to actively promote digital transformation. The contribution of this study lies in providing a theoretical basis and decision support for promoting the digital transformation of construction enterprises.

1. Introduction

1.1. Research Background

In the era of the digital economy, digital technologies such as cloud computing, BIM, big data, artificial intelligence, robotics, and blockchain are gradually disrupting and changing global business practices and procedures [1,2]. Faced with the impact of the digital wave, the UK has issued a digital charter, Japan has promoted the super-intelligent society, and Singapore has proposed the smart nation plan. It is a general trend worldwide to promote the development of cities and industries through digital transformation [3,4]. As a national pillar industry, the construction engineering industry is characterized by fragmentation and complexity, as well as high energy consumption, high pollution, and sloppy development. Especially under the impact of the COVID-19 pandemic, the traditional construction industry model has been unable to meet the need for high-quality sustainable development in the construction industry [5,6,7]. Construction digitalization provides an opportunity for development and is becoming an important force driving the transformation and upgrading of the construction industry [8,9].
In 2020, the scale of the digital economy reached CNY 39.2 trillion, accounting for 38.6% of the GDP. The digital economy has become a key driving force to stabilize economic growth [10,11,12]. Industrial digitization is the main front of the development of the digital economy, providing a broad space for the development of the digital economy. The integration of the digital economy and traditional industry has become an inevitable trend in historical development. However, the construction industry, as the world’s largest ecosystem, is seriously behind in terms of capacity. The standardization of construction projects is low, business collaboration and industrial chain collaborative management are more extensive, and resource allocation efficiency is not high, meaning that the digitalization level of the construction industry lags behind that of other industries. However, most people recognize that digital technologies are transforming, or will eventually transform, the construction industry [13]. Over the past decade, the global construction industry has been actively promoting digital transformation, but some countries are still lagging behind in this regard. Among them, the digitization degree of the Chinese construction industry ranks last among all industries, far below the digitization level of foreign construction industries.
Construction enterprises have a serious polarization in terms of digital transformation. Small and medium-sized construction enterprises face the dilemma of not knowing how to transform, not having money to transform and not daring to transform due to insufficient funds, high costs and the weak foundation of digital transformation [14]. Large construction enterprises face confusion regarding what to transform, how to transform, and how to choose the transformation system due to the many business lines, wide project distribution, and the wide scale of organization. In addition, there are not many professional enterprises in the market that can provide specialized services and solutions for the digital transformation of construction enterprises, and mature programs are lacking [15,16]. All these problems have hindered the rapid development of the digital economy in the construction industry. Therefore, it is of great practical significance to explore how to resolve the digital transformation problems in the construction industry and effectively promote the development of the digital economy in industry.

1.2. Research Progress

In recent years, the government, industry practitioners and scholars have paid great attention to the digital transformation of the economy. This can be summarized into three aspects: First, the recognition of the digital transformation of the construction industry. In this regard, much research has been carried out by domestic digital construction service provider organization scholars, governments, and industry practitioners, focusing on the thinking, development status analysis, implementation strategy, and path discussions regarding the strategic direction of digital transformation, improving everyone’s understanding of the digital transformation strategy for the construction industry. The introduction of digital technology to the construction industry can produce synergy and the formation and development of the digital transformation concept of the construction industry is a necessary element for the full implementation of the nationwide digital economy. The second aspect is the application of various digital technologies in the construction industry. These technologies include, but are not limited to, radio frequency identification [17,18], robotics [19,20], blockchain technology [21,22], BIM [23,24], internet of things [25,26], and artificial intelligence [27]. This mainly explores the potential of these stand-alone technologies and their impact on productivity in the construction industry. In particular, BIM technology has been fully popularized and applied in the industry, but the most important and difficult challenge in practical cases considers the rigid institutional environment of the organization [28] and makes the further digitalization and effectiveness of digital technology possible. It is necessary to digitally transform construction projects and construction companies [29]. The third aspect is the technical methods, organizational changes, and research on the digital transformation of the construction industry, for example, the analysis of participants and policy tools of transformation, the construction 4.0 scheme drawing on Industry 4.0, the management change method of digital construction, the change means of business process digitalization, and the investigation of and research on the digital transformation of the construction industry in countries such as Nigeria [30] and Russia [31].

1.3. Applicability of Evolutionary Game Model Analysis Digital Transformation in the Construction Industry

Smith [32,33,34] first proposed the concepts of evolutionary game and evolutionary stability strategy. The basic logical idea is that in a game group of a certain scale, the game parties carry out repeated game activities. Due to the finite rationality of man, the probability that the game side can find the optimal equilibrium point in the first game is extremely small. The best strategy for the game parties, then, is to form the most advantageous strategy by imitating others or improving their own strategies. Through long-term imitation and improvement, all game parties tend toward a stable strategy; this stable strategy is called the “Evolutionary Stability Strategy” (ESS). Because the evolutionary game can be reflected by the premise of limited rationality, the game parties slowly learn by copying the dynamic mechanism and finally reach the dynamic equilibrium process [35]. Therefore, an increasing number of scholars are beginning to apply evolutionary game tools to analyze and predict group behavior [36], for example, industry–university–research co-operations [37], safety supervision [38,39], technology innovation behavior [40,41], and industrial digital transformation [42,43]. The domestic and foreign literature on the application of evolutionary game theory to analyses of the digital transformation of the construction industry are lacking. However, related studies have applied evolutionary game theory to analyses of the digital transformation of other industries. Xu et al. [44] considered the role of government subsidies, constructed an evolution game model of manufacturing industry, and found that the intensity of government subsidies has a significant impact on the strategic evolution results of the digital transformation of the manufacturing industry. Similarly, Fan et al. [45] used the evolutionary game model to demonstrate that government subsidies can effectively motivate manufacturing enterprises to carry out digital transformations, but can only play a role after reaching a certain threshold. Li et al. [46] applied evolution game theory to analyze the evolution law regarding co-operation behavior during the process of digital transformation, as well as the input behavior of the transformation service provider. The adaptation cost of military enterprises co-operating with the service party will have a significant impact on the strategies of both sides. Yang et al. [47] analyzed the digital transformation of small and medium-sized enterprises using evolutionary game theory, which proved that the government implemented the scientific reward and punishment mechanism by appropriately increasing subsidies for service providers and improving the social responsibility evaluation system of service providers, which is conducive to the digital transformation of small and medium-sized enterprises. Chen et al. [48] analyzed the synergy of digital transformation among construction enterprises and found that the improvement in the digital synergy coefficient and the enhancement of digital ability in the production process promote the digital transformation of construction enterprises. With the incentive of government subsidies, the tendency of both enterprises to implement digital transformation will be significantly enhanced. From the perspective of game theory, the digital transformation of the construction industry is also a process in which the parties play games multiple times. These games will share characteristics with the related industry; therefore, evolutionary game can be applied to analyze the game strategy of each participant in the digital transformation of the construction industry. Previous studies mainly focused on technology implementation and application studies of digital transformation, and rarely explored the internal organization driving force and role behavior factors of digital transformation. They also did not pay attention to the interaction between the main participants in digital transformation in the construction industry. However, according to the evolutionary game model, group behavior often determines the final choice of the organization. Therefore, to bridge these research gaps, based on the evolutionary game research method, this study constructed a tripartite evolutionary game model including construction enterprises, digital construction service providers, and the government, considering the role of digital technology service providers and the influence of financial institutions on the financial support available for the digital transformation of construction enterprises. The numerical simulation method was also used to verify the mechanism of different variable parameters when changing their own digital transition strategies, which provides a theoretical basis and suggestions for digital transition route selection and the policy formulation of the Chinese construction industry.
The remainder of the study is organized as follows. In Section 2, the problem is described and basic assumptions are elaborated. Section 3 constructs and solves the evolutionary game model for key participants’ behavior. Section 4 focuses on the tripartite game equilibrium analysis, including the unilateral stability strategy and the mixed stability strategy of the game players. In Section 5, the simulation analysis and discussion of the evolutionary model are presented. Finally, Section 6 presents conclusions and suggestions.

2. Model Assumptions

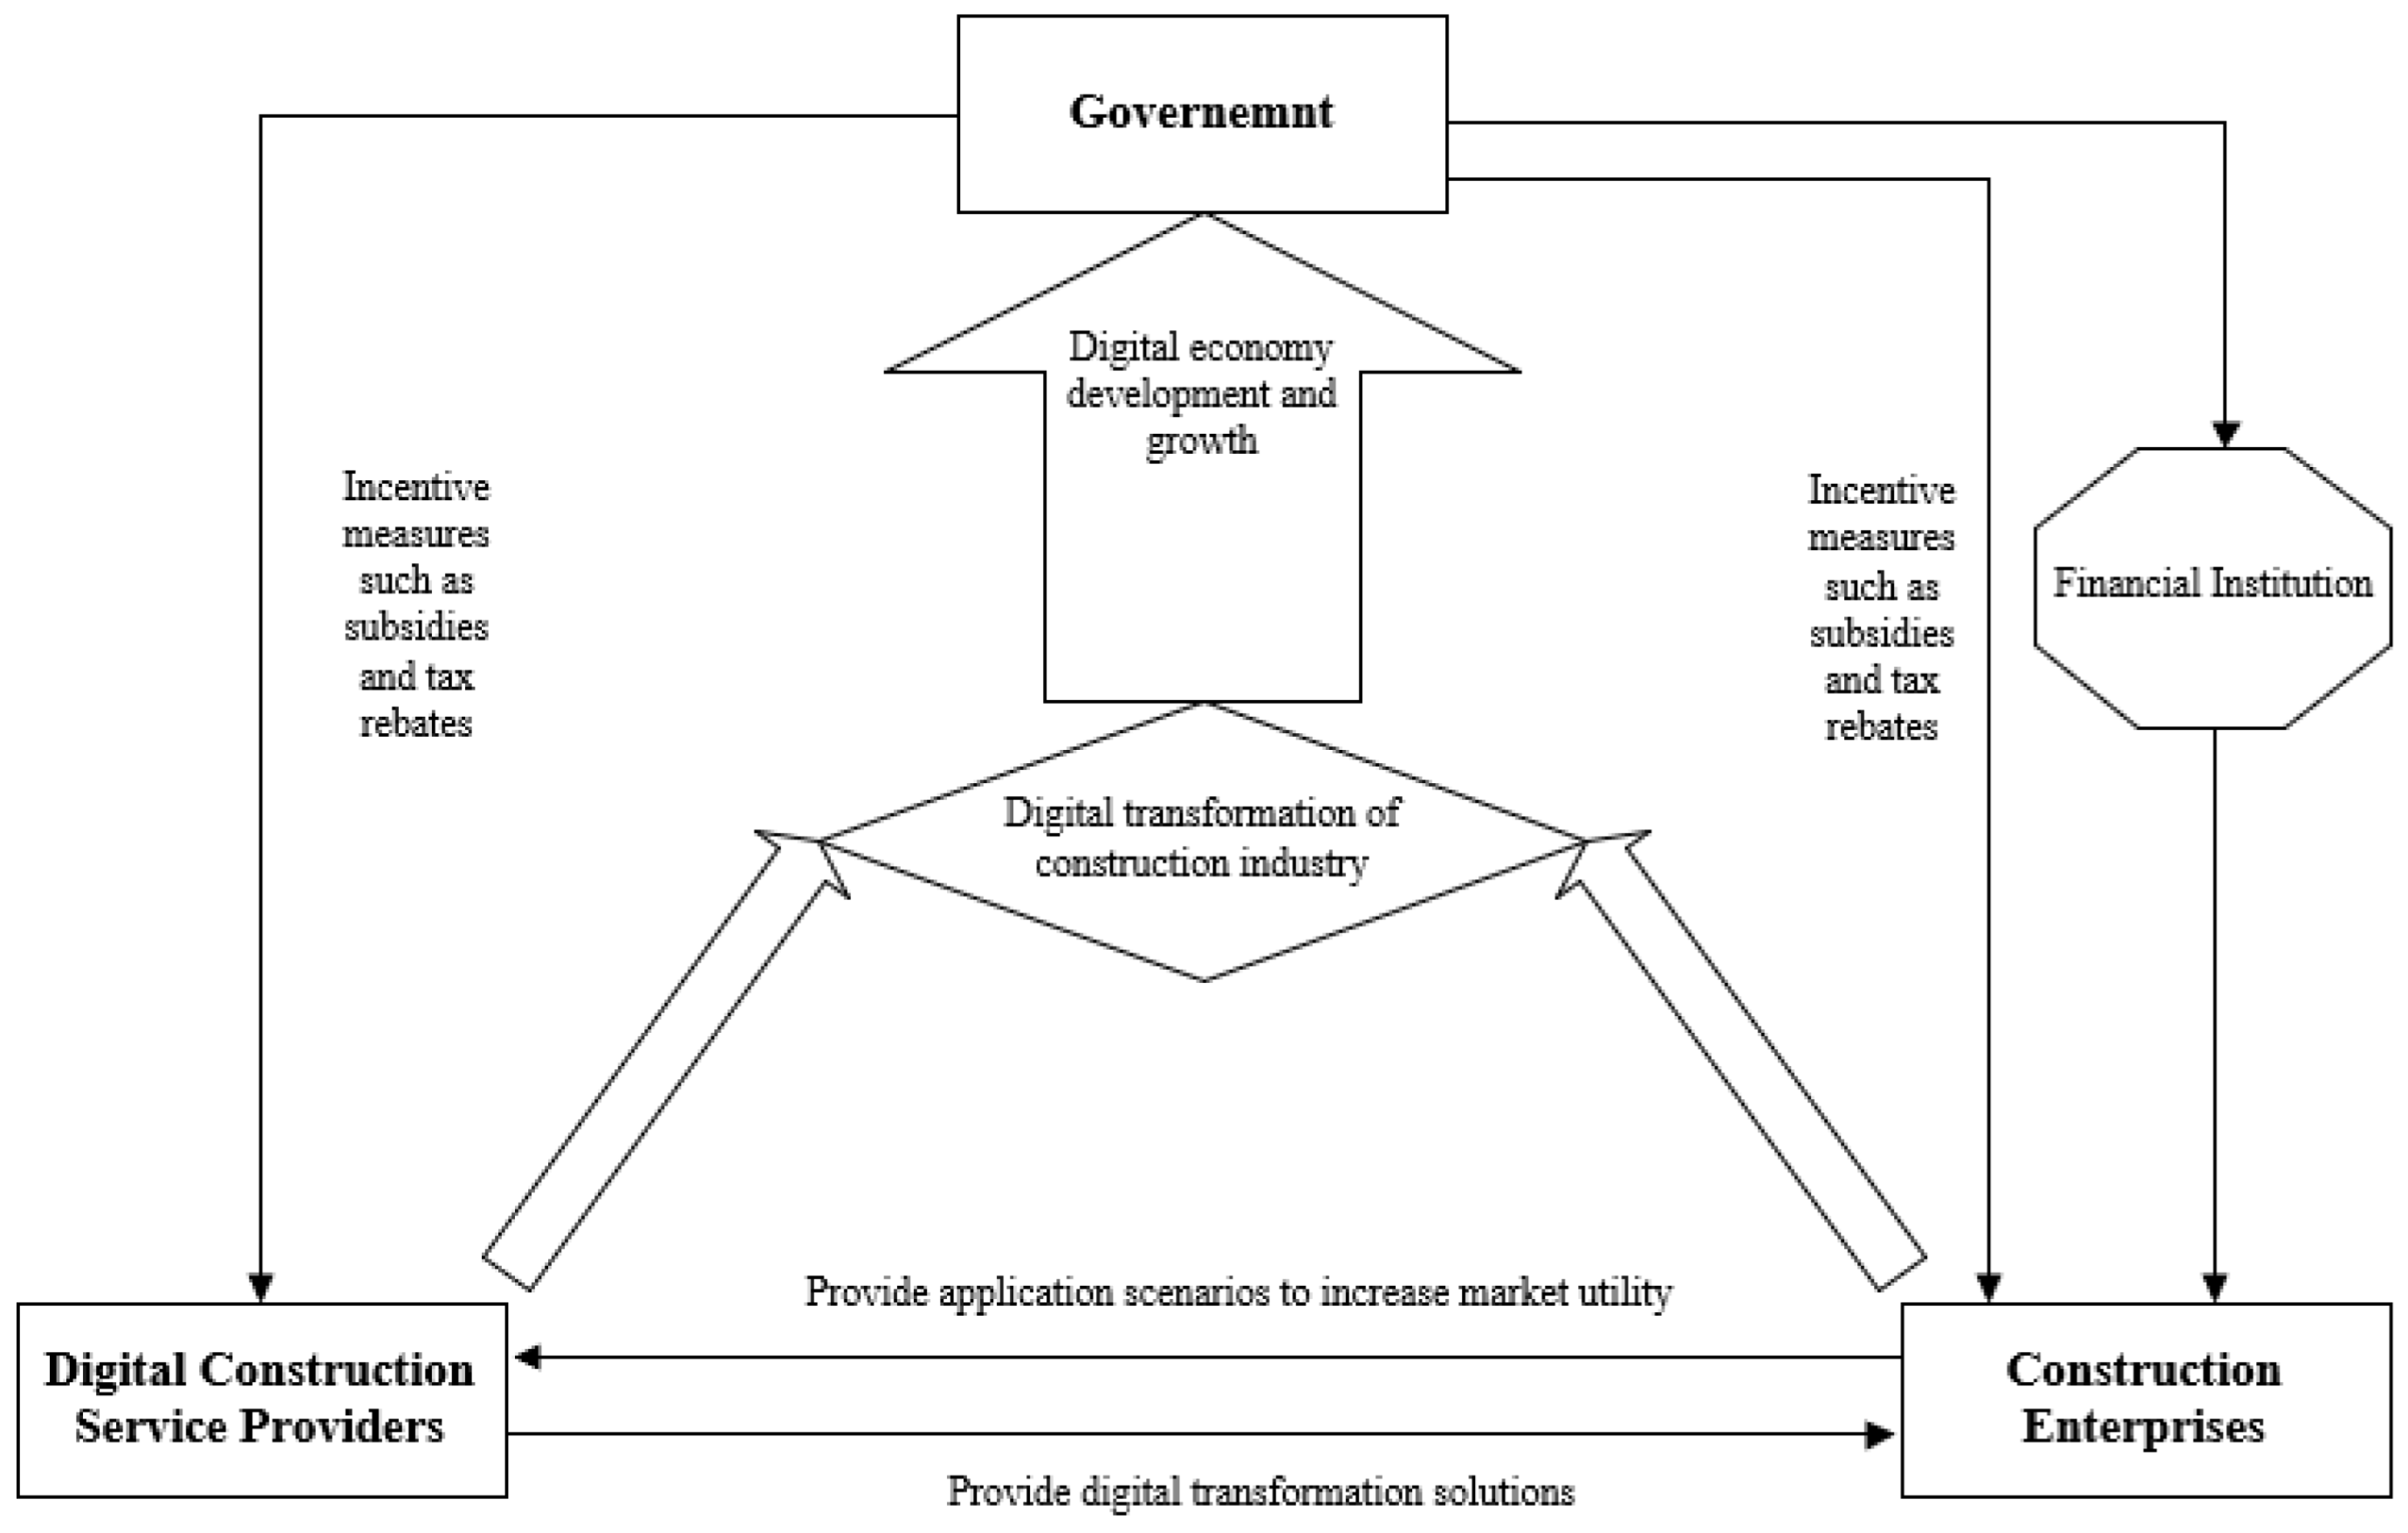
2.1. Problem Description

Different from other industries, the construction industry has unique characteristics such as labor intensive, fragmented, uncertain, and order-made production, etc. Therefore, the management of construction enterprises is generally divided into three levels: construction work layer, project management layer, and company management layer. From the purposes of digital transformation, the construction industry is trying to use all kinds of digital technology, such as replace people with machines to reduce the labor intensity of the construction work layer, use artificial intelligence/machine learning (AI/ML) techniques to reduce the uncertainty of the project management layer to realize a more accurate order production process, and use an intelligent decision support system (IDSS) to realize the intensive and high-efficient management of the enterprise management layer. The construction worker is not the main decision maker and guide in the digital transformation of the construction industry and one of the goals of the digital transformation of the construction industry is to reduce the large number of construction workers. However, construction workers are not a corporate organizational entity in the digital transformation of the construction industry and are a more scattered combination of groups. Therefore, from the perspective of the game subject, the digital transformation of construction enterprises focuses on two aspects: project-level digitization and company-level digitization. Specifically, the former is used to choose the project application plan for enterprise digital infrastructure construction or digital technology (hereinafter referred to as the basic solution), such as the use of BIM, a smart construction site, and intelligent construction equipment. The latter is used to select the digital solution of the system (hereinafter referred to as the system solution), such as the establishment of an ERP system, a project management system, and a centralized procurement system. All elements of the enterprise are incorporated into the entire system to carry out a comprehensive digital transformation of the enterprise. Service providers can provide corresponding services for different enterprise operations and, regardless of whether the enterprise is undergoing digital transformation, service providers will actively strive to promote the market.
The digital transformation of the Chinese construction industry is still in its infancy so the government has provided certain financial subsidies and preferential tax policies to digital-transformed enterprises and related service providers to further promote the digital transformation of the construction industry. The government also supports financial institutions to actively participate in the digital transformation of the construction industry and encourages financial institutions to provide inclusive finance for digital transformation enterprises, such as the use of low-interest loans to solve capital problems. Based on this, this study constructed a tripartite game model of the government, service provider, and enterprise from the perspective of the dual path of construction enterprises’ digital transformation. The synergy of government guidance was also considered regarding financial institutions’ provision of inclusive finance. The relationships of each game player are shown in Figure 1. Specifically, with the increasing number of enterprises undergoing digital transformation, the synergistic benefits between enterprises increase and the market scale of service providers expands. Service providers gain market benefits, which, in turn, promote the digital transformation of more enterprises. This promotes the digital transformation of the industry, accelerates the development of the local digital economy, and ultimately achieves an ecological win–win situation.

2.2. Basic Assumptions

Assumption 1. 
In the evolution game model for the key participants’ behavior in the digital transformation of the construction industry, the key participants include three parties: enterprises, service providers, and the government. Given the incomplete and asymmetric information, it is assumed that every participant in the game is a limited rationality group with the ability to learn. The participants’ strategy selection gradually evolves to the optimal strategy over time. Moreover, the enterprise is participant 1, the service provider is participant 2, and the government is participant 3.
Assumption 2. 
It is assumed that the enterprise, service provider, and government have two kinds of strategy choice. The strategy set for the enterprise is (digital transformation, non-digital transformation), and the probability is  x ( x [ 0 , 1 ] )  and  1 x , respectively. The strategy set of the service provider is (system solution, basic solution), and the probability is  y ( y [ 0 , 1 ] ) and 1 y , respectively. The strategy set of the enterprise is (active promotion, negative promotion), and the probability is  z ( z [ 0 , 1 ] )  and  1 z , respectively.
Assumption 3. 
It is assumed that the enterprise will obtain the income of  R D  when the enterprise chooses the basic solution strategy; when the enterprise chooses the system solution strategy, it will obtain the income of  R S . Moreover, when the enterprise carries out the digital transformation, it will obtain the new technology subsidies supported by the government and the tax refund amount is  α T ( α  is the tax refund proportion,  T  is the tax amount). No matter what kind of scheme is used, the cost that the enterprise needs to invest in the digital transformation is  C E . If the system solution is selected, the service provider must pay an additional system update and maintenance fee of  ω R S , ( ω  is the cost benefit coefficient; that is, the proportion of the fees charged in the increased income). In order to promote the digital transformation of enterprises, the government guides financial institutions to provide low-interest loans  θ L  to enterprises with a certain probability after a comprehensive evaluation of their qualifications and projects ( θ  is the probability coefficient of loans and  L  is the amount of loans).
Assumption 4. 
As long as enterprises carry out digital transformation, no matter what kind of solution is provided, the service provider can obtain the direct benefits of  R P . Moreover, the cost for the service provider to provide the basic solution is  C P D  and the cost of providing the system solution is  C P S . When the government actively promotes this, it provides subsidies to encourage service providers:  β M i , i = D , S ( β  is the government’s subsidy coefficient for service providers;  M i , i = D , S  is the tax payment of enterprises when different solutions are provided). After the digital transformation of enterprises, due to the diffusion of innovation, the market influence of service providers is expanded and market utility  U i , i = D , S  is generated.
Assumption 5. 
Under the policy of active promotion, the supervision, publicity, promotion, and guidance costs paid by the local government are  C z ; the cost of the tax rebate subsidies for enterprises and support for service providers is  α M , β M i . After the comprehensive digital transformation of enterprises, the additional social benefits (tax, employment, investment) brought on by the development of the local construction industry digital economy are  R Z , while the benefit of receiving praise from the superior is  F . Under the negative promotion strategy, the local government is punished,  W , by superior authorities because the enterprise did not carry out digital transformation.
These symbols are all shown in Table 1 to make them more reader friendly and easier to understand.

3. Evolutionary Game Model for Key Participants’ Behavior

3.1. Model Construction

According to the above assumptions, an evolutionary game model for the three participants of the enterprise, service provider, and government was constructed. The first line function represents the income of the enterprise, the second line function represents the income of the service provider, and the third line function represents the income of the government. The payment matrix for different decision-making behaviors combinations of the three participants is shown in Table 2.

3.2. Model Solution

According to the basic assumptions and the perceived payoff matrix of the game model of enterprises, service providers, and the government, the probability of the enterprise selecting the digital transformation strategy is x and the probability of choosing a non-digital transformation strategy is 1 x . The expected values of the two enterprise strategies are denoted by E 11 and E 12 , respectively, and the average value is symbolized as E 1 .
E 11 = y z ( R S ω R S C E + α T + θ L ) + y ( 1 z ) ( R S ω R S C E + θ L ) + z ( 1 y ) ( R D C E + α T + θ L ) + ( 1 y ) ( 1 z ) ( R D C E + θ L )
E 12 = 0
E 1 = x E 11 + ( 1 x ) E 12
According to the perceived payoff matrix, the expected values of the two service provider strategies are denoted by E 21 and E 22 , respectively, and the average value is symbolized as E 2 . Then, the E 21 , E 22 , and E 2 can be obtained.
E 21 = x z ( ω R S C P S + R P + U S + β M S ) + x ( 1 z ) ( ω R S + R P C P S + U S ) + z ( 1 x ) ( β M S C P S ) ( 1 x ) ( 1 z ) C P S
E 22 = x z ( R P C P D + β M D + U D ) + x ( 1 z ) ( R P C P D + U D ) + z ( 1 x ) ( C P D + β M D ) ( 1 x ) ( 1 z ) C P D
E 2 = y E 21 + ( 1 y ) E 22
Similarly, the expected benefit of the government selecting an active promotion strategy is E 31 and the expected benefit of the passive promotion strategy is E 32 . The average expected payoff is denoted by E 3 . Then, the E 31 , E 32 , and E 3 are calculated as follows:
E 31 = x y ( F + R Z C Z α T β M S ) + x ( 1 y ) ( F C Z α T β M D ) + y ( 1 x ) ( C Z β M S ) + ( 1 x ) ( 1 y ) ( C Z β M D )
E 32 = x y R Z y W ( 1 x ) W ( 1 x ) ( 1 y )
E 3 = z E 31 + ( 1 z ) E 32

4. Tripartite Game Equilibrium Analysis

4.1. The Unilateral Stability Strategy of the Game Players

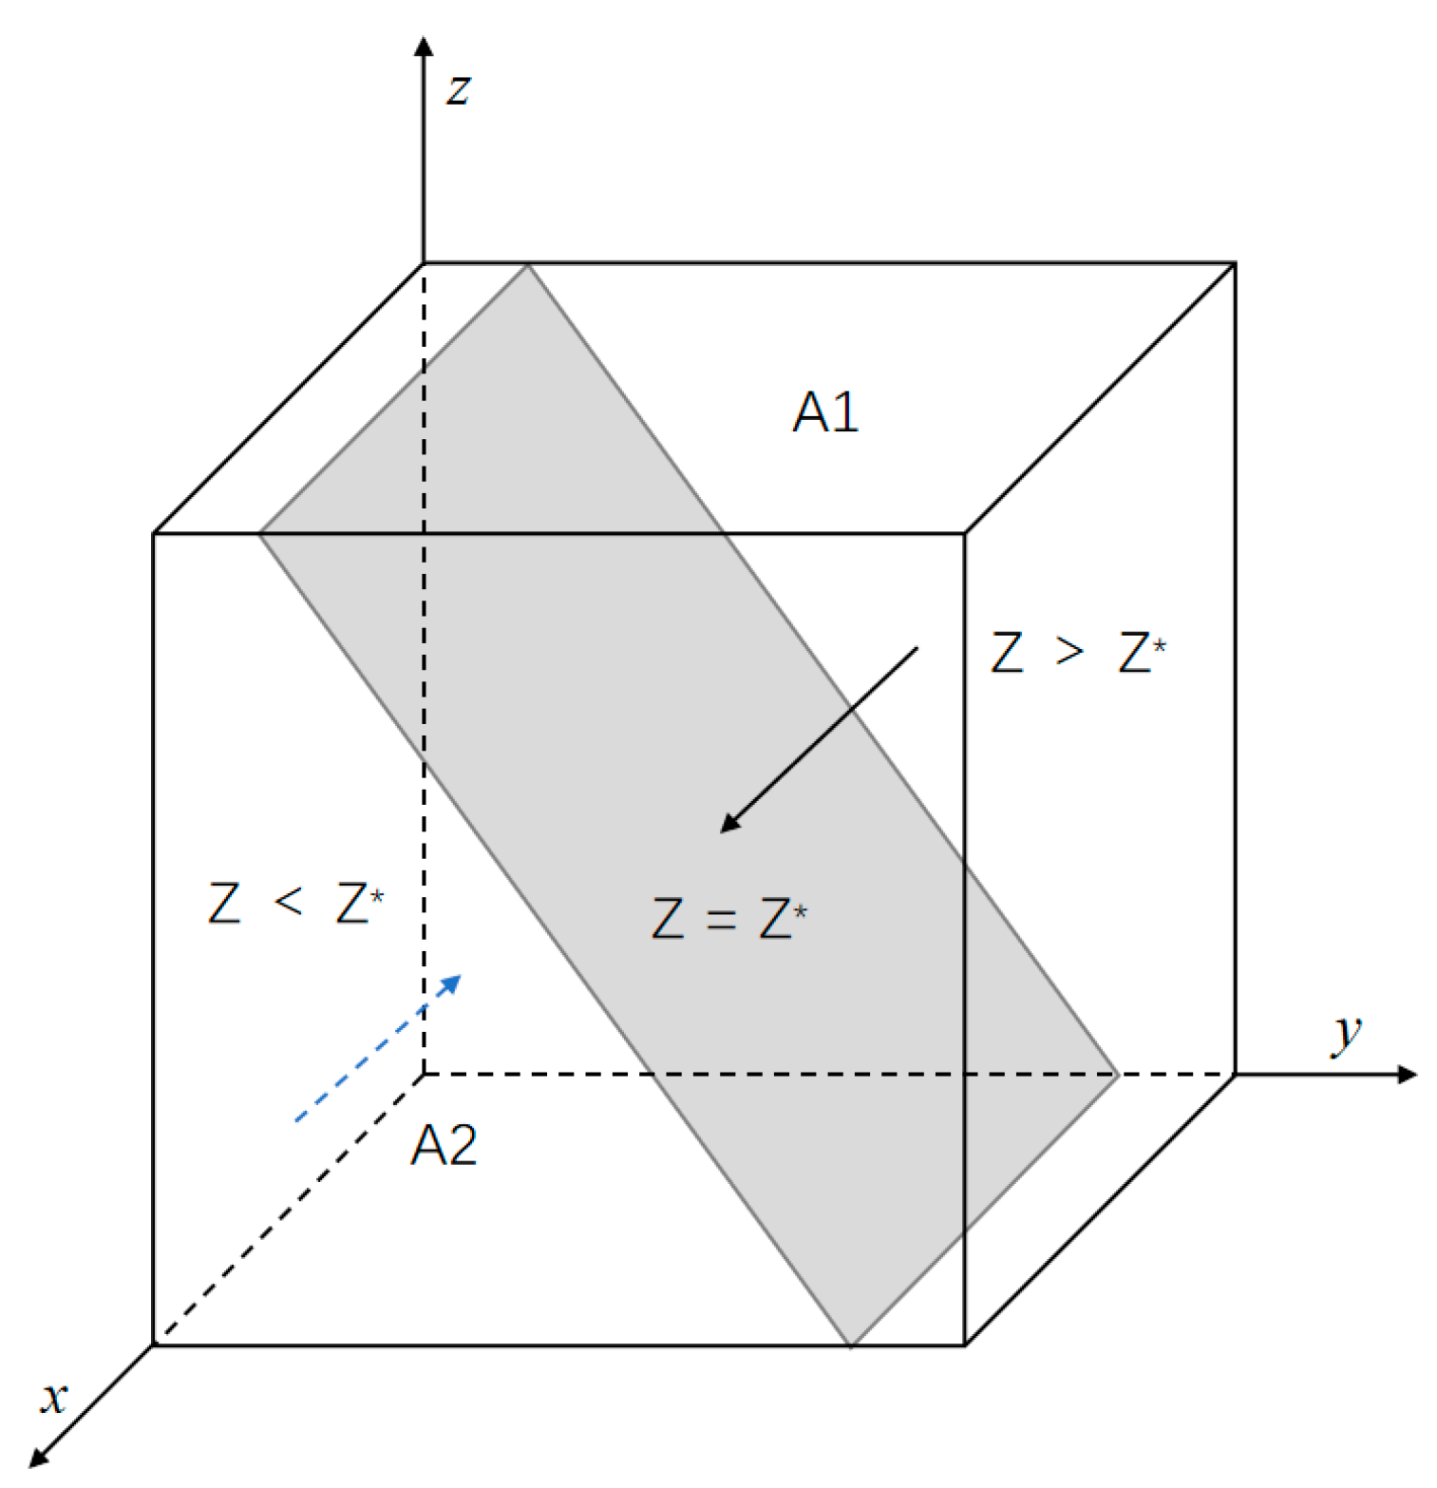
4.1.1. The Evolutionary Stability Strategies of Enterprise

According to the model construction and solution for key participants’ behavior in the digital transformation of the construction industry, the expected value of the digital transformation strategy and non-digital transformation strategy of the enterprise can be obtained as follows:
{ E 11 = y ( R S ω R S R D ) + R D C E + θ L + z α T E 12 = 0
According to Equation (10), the dynamic replication equation F ( x ) of the enterprise can be obtained as follows:
F ( x ) = d x d t = x ( E 11 E 1 ) = x ( 1 x ) ( E 11 E 12 ) = x ( 1 x ) [ y ( R S ω R S R D ) + R D C E + θ L + z α T ]
The influence of x on the evolutionary stable equilibrium strategy of the enterprise is calculated as:
d F ( x ) d x = ( 1 2 x ) [ y ( R S ω R S R D ) + R D C E + θ L + z α T ]
U ( z ) = z α T + y ( R S ω R S R D ) + R D C E + θ L
According to the stability theorem of differential equations, the probability of an enterprise choosing the digital transformation strategy in a stable state must satisfy these conditions: F ( z ) = 0 and d ( F ( z ) ) / d z < 0 . U ( z ) / z = α T > 0 , U ( z ) is increasing with respect to z . Therefore, when z = C E R D θ L y ( R S ω R S R D ) α T = z * , U ( z ) = 0 . In this case, d ( F ( z ) ) d z 0 can be obtained. Any value of z can be taken, and the enterprise cannot determine the stability strategy. When z > z * , U ( z ) > 0 . In this case, d ( F ( z ) ) / d z | z = 1 < 0 can be obtained. Hence, z = 1 is the equilibrium stable strategy of the enterprise, i.e., the digital transformation strategy. Conversely, when z < z * , U ( z ) < 0 . In this case, d ( F ( z ) ) / d z | z = 1 > 0 can be obtained. z = 0 is the equilibrium stable strategy of the enterprise, i.e., the non-digital transformation strategy. The phase diagram of the evolution of the enterprise’s strategy is shown in Figure 2.
Figure 2 shows that the probability of the enterprise choosing the digital transformation strategy is volume V A 1 and the probability of choosing the non-digital transformation strategy is volume V A 2 . Therefore, the V A 1 and V A 2 values are calculated as follows:
{ V A 2 = 0 1 0 1 C E R D θ L y ( R S ω R S R D ) α T d y d x = 2 C E 2 θ L ( 1 ω ) R S R D 2 α T VA1=1VA2=12CE2θL(1ω)RSRD2αT
Proposition 1. 
The probability of digital transformation of the enterprise positively correlated with the benefits that are obtained and low-interest loans, and is negatively correlated with the cost of input and tax payment.
Proof. 
According to the expression of probability V A 1 , the first partial derivative of each variable in Equation (14) is solved and V A 1 / R S > 0 ,   V A 1 / R D > 0 ,   V A 1 / ( α T ) > 0 ,   V A 1 / C E < 0 is obtained. Therefore, with the decrease in C E and the increase in R S ,   R D ,   L ,   α T , the probability of the enterprise’s digital transformation will increase. □
Proposition 1 indicates that the increase in profits, low-interest loans, tax rebates, and cost reduction can promote the transformation of more enterprises. The government can increase the financial support of enterprises undergoing this transformation, increase tax rebates, and increase support for service providers to encourage service providers to reduce product or system prices. In addition, the government can also reduce the procurement cost of digital products for enterprises, increase the guidance for enterprises, and enable enterprises to master their application of digital technology to improve profits.

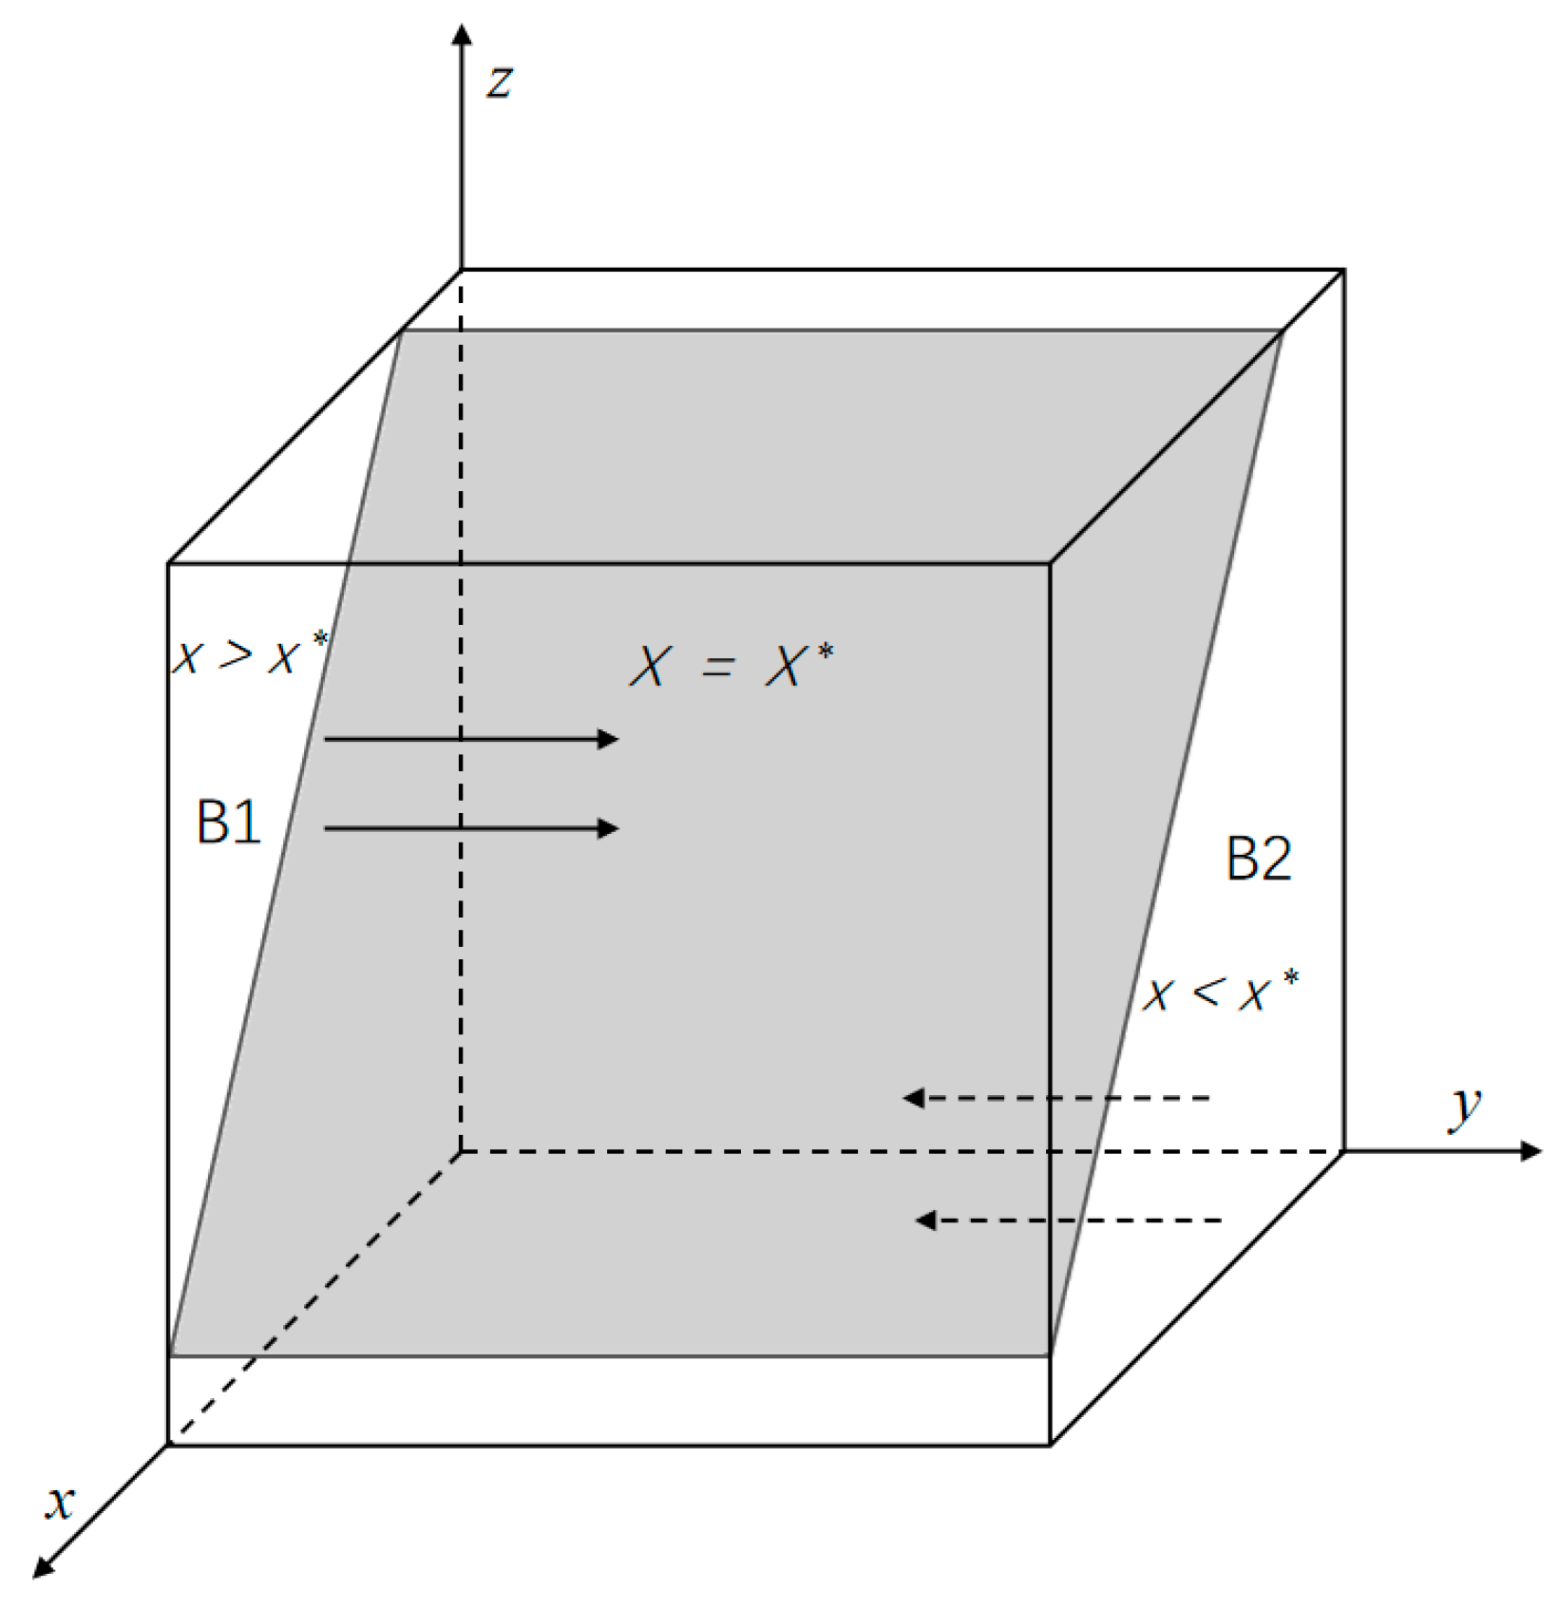
4.1.2. The Evolutionary Stability Strategies of Service Provider

According to the model construction and solution regarding key participants’ behavior in the digital transformation of the construction industry, the expected value of the system solution strategy and basic solution strategy of the service provider can be obtained as follows:
{ E 21 = x ( ω R S + R P + U S ) + z β M S C P S E 22 = x ( R P + U D ) + z β M D C P D
According to Equation (10), the dynamic replication equation F ( y ) of the enterprise can be obtained as follows:
F ( y ) = d y d t = y ( E 21 E 1 ) = y ( 1 y ) ( E 21 E 22 ) = y ( 1 y ) [ x ( ω R S + U S U D ) + C P D C P S + z β ( M S M D ) ]
The influence of y on the evolutionary stable equilibrium strategy of the enterprise is calculated as:
d F ( y ) d y = ( 1 2 y ) [ x ( ω R S + U S U D ) + C P D C P S + z β ( M S M D ) ]
G ( x ) = x ( ω R S + U S U D ) + C P D C P S + z β ( M S M D )
According to the stability theorem of differential equations, the probability of the service provider choosing the system solution strategy in a stable state must be satisfied using these conditions: F ( y ) = 0 and d ( F ( y ) ) / d y < 0 . G ( x ) / x = ω R S + U S U D > 0 , G ( x ) increases with respect to x . Therefore, when x = C P S C P D z β ( M S M D ) ω R S + U S U D = x * , G ( x ) = 0 . In this case, d ( F ( y ) ) d y 0 can be obtained. Any value y can be taken and the service provider cannot determine the stability strategy. When x > x * , G ( x ) > 0 . In this case, d ( F ( y ) ) / d y | y = 1 < 0 can be obtained. Hence, y = 1 is the equilibrium stable strategy of the enterprise, i.e., the digital transformation strategy. Conversely, when x < x * , G ( x ) < 0 . In this case, d ( F ( y ) ) / d y | y = 1 > 0 can be obtained. y = 0 is the equilibrium stable strategy of the enterprise, i.e., non-digital transformation strategy. The phase diagram of the evolution of the service provider’s strategy is shown in Figure 3.
Figure 3 shows that the probability of the service provider choosing the basic solution strategy is volume V B 2 and the probability of choosing a system solution strategy is volume V B 1 . Therefore, the V B 1 and V B 2 values can be obtained as follows:
{ V B 2 = 0 1 0 1 C P S C P D z β ( M S M D ) ω R S + U S U D d z d y = 2 C P S 2 C P D β ( M S M D ) 2 ( ω R S + U S U D ) VB1=1VB2=12(CPSCPD)β(MSMD)2(ωRS+USUD)
Proposition 2. 
The probability of service providers providing system solution strategy is positively correlated with obtaining system maintenance and update costs, market utility differences, and government subsidies differences, and is negatively correlated with cost differences.
Proof. 
According to the expression of probability V B 1 , the first partial derivative of each variable in Equation (19) is solved and V B 1 / ( ω R S ) > 0 ,   V B 1 / ( U S U D ) > 0 ,   V B 1 / [ β ( M S M D ] > 0 ,   V B 1 / ( C P S C P D ) < 0 can be obtained. Therefore, with the increase in ω R S ,   U S U D ,   β ( M S M D ) and the decrease in C P S C P D , the probability of the service provider providing a system solution strategy will increase. □
Proposition 2 shows that the increase in the comprehensive income of service providers can effectively promote the comprehensive digital reform of the industry. The government can increase subsidies for system solution, promote and publicize system solution, and increase market utilization. However, enterprises have their own preferences, and project-level digitalization and enterprise-level digitalization complement each other. Therefore, while improving the benefits of the service provider’s system solution, the difference between this and the basic solution benefits are appropriately controlled, which promotes the improvement in the digital level of the project layer. However, the increase in digitization at the project level narrows this gap, leading to a reduction in comprehensive benefits. This situation will drive service providers to make more efforts to improve the individual benefits of digitization at the enterprise level, thus widening the gap and improving the overall benefits. The enterprise-level and project-level digitization promote each other, thus promoting the improvement in the enterprise digitization level.

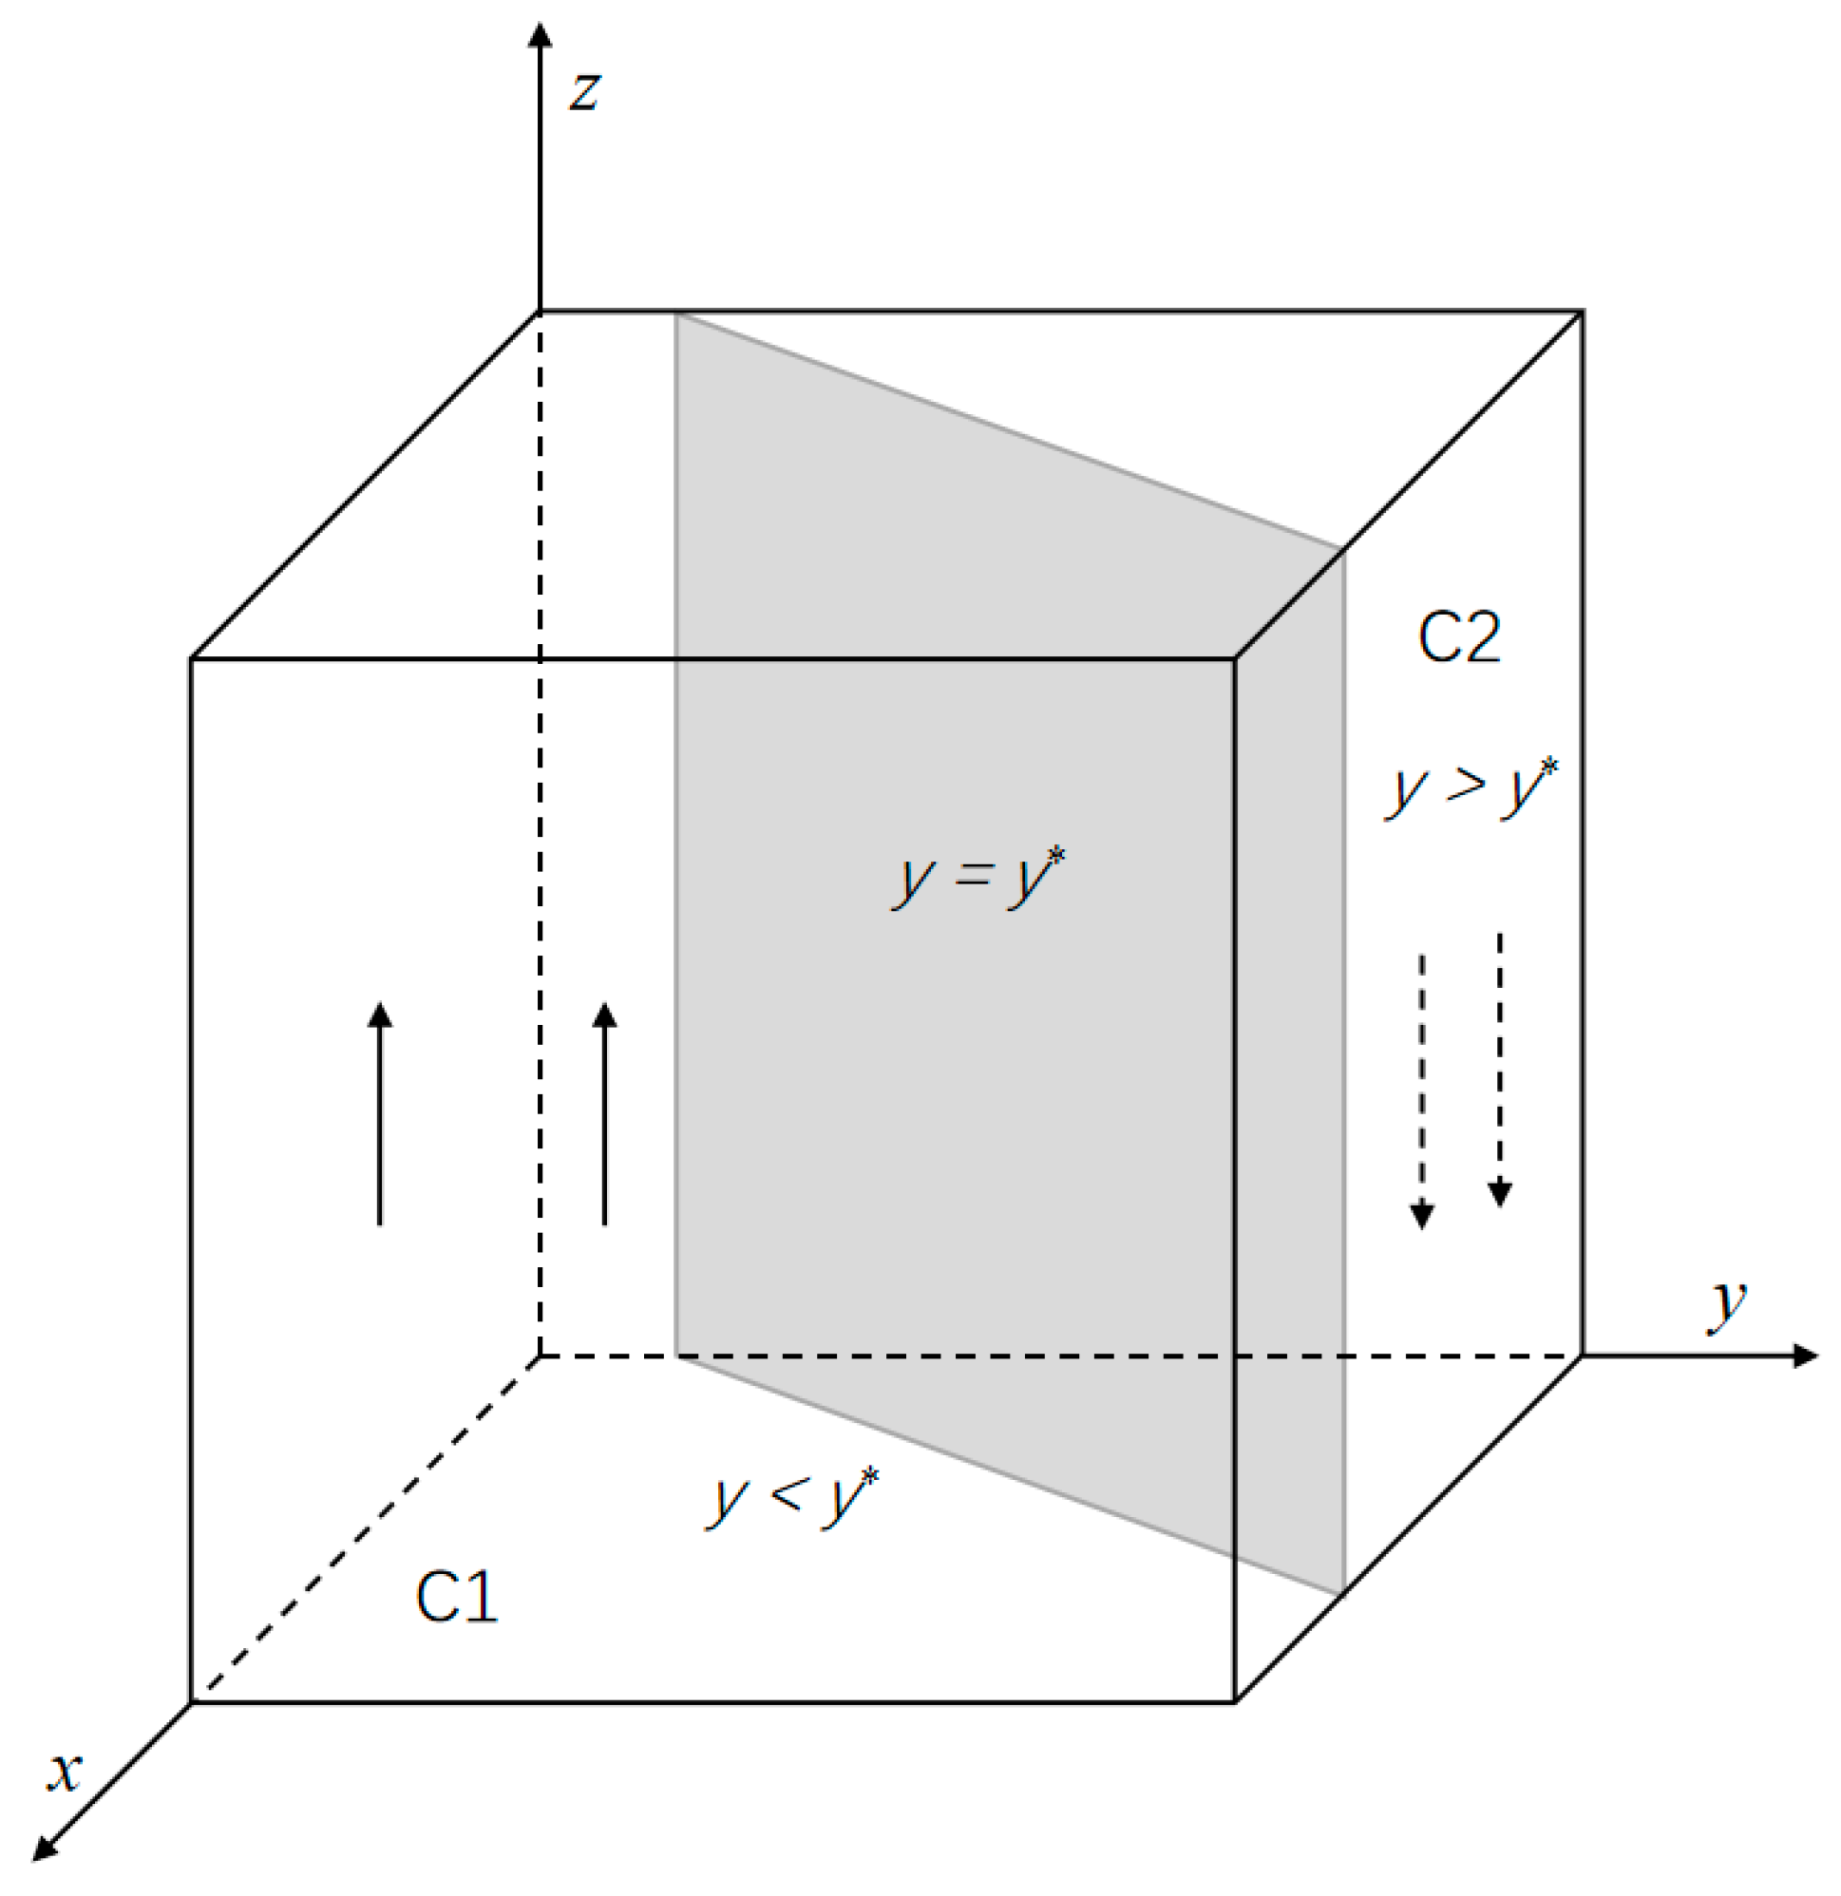
4.1.3. The Evolutionary Stability Strategies of the Government

According to the model construction and solution for key participants’ behavior in the digital transformation of the construction industry, the expected value of the active promotion strategy and passive promotion strategy of the government can be obtained as follows:
{ E 31 = x ( y R Z + F α T ) + y β ( M D M S ) ( C Z + β M D ) E32=xyRZW(1x)
According to Equation (10), the dynamic replication equation F ( z ) of the government can be obtained as follows:
F ( z ) = d z d t = z ( E 31 E 1 ) = z ( 1 z ) ( E 31 E 32 ) = z ( 1 z ) [ β y ( M S M D ) + x ( F α T W ) β M D C z + W ]
The influence of z on the evolutionary stable equilibrium strategy of the government is calculated as:
d F ( z ) d z = ( 1 2 z ) [ β y ( M S M D ) + x ( F α T W ) β M D C z + W ]
H ( y ) = β y ( M S M D ) + x ( F α T W ) β M D C z + W
According to the stability theorem of differential equations, the probability of the government choosing active promotion strategy in a stable state must satisfy these conditions, F ( z ) = 0 and d ( F ( z ) ) / d z < 0 . Since H ( y ) / y = β ( M S M D ) < 0 , H ( y ) increases with respect to y . Therefore, when y = x ( F α T W ) β M D C z + W β ( M S M D ) = y * , H ( y ) = 0 . In this case, d ( F ( z ) ) d z 0 can be obtained. Any value z can be taken and the government cannot determine the stability strategy. When y < y * , H ( y ) > 0 . In this case, d ( F ( z ) ) / d z | z = 1 < 0 can be obtained. Hence, z = 1 is the equilibrium stable strategy of the government, i.e., the digital transformation strategy. Conversely, when y > y * , H ( y ) < 0 . In this case, d ( F ( z ) ) / d z | z = 1 > 0 can be obtained. z = 0 is the equilibrium stable strategy of the government, i.e., the non-digital transformation strategy. The phase diagram of the evolution of the government’s strategy is shown in Figure 4.
Figure 4 shows that the probability of the government choosing the active promotion strategy is volume V C 1 and the probability of choosing the passive promotion strategy is volume V C 2 . Therefore, the V C 1 and V C 2 values can be obtained as follows:
{ V C 1 = 0 1 0 1 x ( F α T W ) β M D C z + W β ( M S M D ) d x d z = ( F α T + W ) β M D C z 2 β ( M S M D ) V C 2 = 1 V C 1 = 1 ( F α T + W ) β M D C z 2 β ( M S M D )
Proposition 3. 
The probability that the government chooses to actively promote is positively correlated with higher government incentives and fines, and is negatively correlated with subsidies, promotion costs, and tax refunds to enterprises.
Proof. 
According to the expression of probability V C 1 , the first partial derivative of each variable in Equation (24) is solved, and V C 1 / F > 0 , V C 1 / W > 0 , V C 1 / [ β ( M S M D ] < 0 , and V C 1 / C Z < 0 , V C 1 / ( α T ) < 0 is obtained. Therefore, an increase in F ,   W and a decrease in β ( M S M D ) ,   C Z ,   α T can increase the probability of the government’s active promotion. □
Proposition 3 shows that the larger the amount of subsidies and tax refunds set by the government, the higher the cost of promotion, which will reduce the active promotion rate of the government. However, the increase in the number of rewards and penalties imposed by higher-level governments will prompt local governments to fulfill their responsibilities of active promotion. In addition, the digital transformation of the construction industry is difficult: the level of digitalization has been low and the government should actively promote digitization to boost market confidence and development prospects. At this time, the stronger the service providers’ market promotion, the more determined and motivated the enterprises are regarding digital transformation.

4.2. The Mixed Stability Strategy of the Tripartite Game Players

To further test the uniqueness of the evolutionary stable equilibrium, this study also carried out the Jacobian test. Firstly, set the dynamic replication equations F ( x , y , z ) = 0 . Then, eight partial equilibrium points of the evolutionary game system can be obtained, namely, E 1 ( 0 , 0 , 0 ) , E 2 ( 1 , 0 , 0 ) , E 3 ( 0 , 1 , 0 ) , E 4 ( 0 , 0 , 1 ) , E 5 ( 1 , 1 , 0 ) , E 6 ( 1 , 0 , 1 ) , E 7 ( 0 , 1 , 1 ) , and E 8 ( 1 , 1 , 1 ) . It is worth noting that the equilibrium point is not the full evolutionary stable strategy since the evolutionary stable strategy must also possess the ability to resist the errors or deviations caused by bounded rationality [49]. Therefore, to explore the tripartite evolutionary stable strategy, the partial asymptotic stability method can be used for the Jacobian matrix to ascertain whether the equilibrium point of the evolutionary system is stable [50]. According to the replication dynamic Equations (11), (16), and (21), the Jacobian matrix J of the tripartite evolutionary game system can be obtained as follows:
J = [ J 1 J 4 J 7 J 2 J 5 J 8 J 3 J 5 J 9 ] = [ F ( x ) / x F ( y ) / x F ( z ) / x F ( x ) / y F ( y ) / y F ( z ) / y F ( x ) / z F ( y ) / z F ( z ) / z ] = [ ( 1 2 x ) [ y ( R S ω R S R D ) + R D C E + θ L + z α T ] x ( 1 x ) ( R S ω R S R D ) x ( 1 x ) α T y ( 1 y ) ( ω R S + U S U D ) ( 1 2 y ) [ x ( ω R S + U S U D ) + C P D C P S + z β ( M S M D ) ] y ( 1 y ) β ( M S M D ) z ( 1 z ) ( F α T W ) z ( 1 z ) [ β ( M S M D ) ] ( 1 2 z ) [ β y ( M S M D ) + x ( F α T W ) β M D C Z + W ] ]
The stability of each equilibrium point is analyzed according to the eigenvalues of the above Jacobian matrix. In this study, the Lyapuov determination method was adopted, as follows: (1) If all eigenvalues have a negative real part, it is an evolutionary stability point (ESS). (2) When at least one of the eigenvalues has a positive real part or the real part sign cannot be determined, it is an unstable point. (3) If some eigenvalues are zero but the rest of the eigenvalues have negative real parts and are in a critical state, they are saddle points. The characteristics of each equilibrium point are shown in Table 3.
Since all the parameters are greater than 0 and the values of each parameter under the system solution are greater than those under the basic solution, the equilibrium solutions E 3 ( 0 , 1 , 0 ) and E 6 ( 1 , 0 , 1 ) have positive real parts in the eigenvalues, which do not satisfy the evolutionary stability condition and can be directly excluded. To reach practical significance, this study only analyzed three situations. The first is the initial state E 1 ( 0 , 0 , 0 ) , which does not have research significance, but can be used as a benchmark reference for other states and has a realistic analysis value. Market state E 5 ( 1 , 1 , 0 ) is the main role played by the market, with the government abdicating. In the synergy state E 8 ( 1 , 1 , 1 ) , the government, service provider, and enterprise work together to promote the digital transformation of the construction industry.
Proposition 4. 
When conditions  W < C Z + β M D F < C Z + β M D + α T , R D < C E + θ L  are satisfied, the system has only one stable point  E 1 ( 0 , 0 , 0 )  according to the determination method.
Proposition 4 shows that, in the initial state, all three parties in the game choose to maintain the original state due to the high cost and uncertainty regarding the future, meaning that the expected costs outweigh the benefits. Specifically, the government is fined less than the cost of promotion and the subsidies offered to the service provider for the basic solution, or the reward from the higher-level government is less than the sum of the promotion cost, the subsidy offered to the service provider for the basic solution, and the tax refund for the enterprise. Moreover, the benefits of the enterprise choosing the basic solution are less than the sum of the transition cost and the low-interest loan. The above situation will result in a stable strategy combination (non-digital transformation, negative promotion, basic solution). That is, the construction industry will not undergo a comprehensive digital transformation. This also shows that, to promote digital transformations in the construction industry, the first goal should be to solve the problem of building a digital infrastructure for enterprises and obtain the benefits of applying this digital technology to new projects.
Proposition 5. 
When conditions  C E + ω R S < θ L + R S , C P S < C P D + ( U S U D ) + ω R S  are satisfied,  E 5 ( 1 , 1 , 0 )  is only one stable point left in the system, which is the state of the market.
Proposition 5 shows that, in the market state, when the cost paid by enterprises and service providers when providing system solutions is less than the benefits, and the reward of the higher-level government to the local government is less than the cost, the situation of government abdication and the active promotion of market operators will occur. That is, a stable strategic combination (digital transformation, negative promotion, system solution) will be reached. The government can improve the social digital infrastructure through the following measures: scientific and technological research and development through production, education and research, strengthening talent training through schools, giving full play to policy tools to guide industrial capital or inclusive finance, expanding financing channels, reducing the cost of financing, research and development, talents and other costs of market operators, and improving their expected market returns. Thus, more service providers and enterprises are encouraged to participate, forming industrial synergies.
Proposition 6. 
When conditions  C E + ω R S < R S + θ L + α T , C P S C P D < ( U S U D ) + β ( M S M D ) + ω R S , C Z + β M S + α T < F  are satisfied, the system has only one stable point  E 7 ( 1 , 1 , 1 ) ; that is, the synergy state.
Proposition 6 shows that, in a synergistic state, the combined benefits of all three parties must be greater than the costs required for a stable strategy combination to occur. That is, the cost of the enterprise choosing the system solution should be less than the sum of the income and low-interest loans, the cost difference between different solutions of the service provider should be less than the comprehensive income value, and the comprehensive cost paid by the government should be less than the reward of the superior. Only then can a stable strategic combination be achieved (digital transformation, active promotion, basic solution). The smaller the difference in cost between the system solution and the basic solution, the larger the difference in utility and tax; the greater the benefit of the enterprise system solution, the more it can promote the stable strategy. Therefore, after solving the basic solution, the government should focus on strengthening the promotion of the system solution. At the same time, the higher-level government should increase the number of incentives, as this would allow for the further promotion of the digital transformation of the construction industry. Moreover, the emergence of the stability strategy has little relationship with fines.

5. Simulation Analysis and Discussion

To verify the validity of the evolutionary stability analysis in this study, as well as the actual tax and enterprise loan policies, we set the parameters under the conditions that meet the ideal state in Proposition 6: R S = 13 , R D = 8 , C E = 12 , C P S = 36 , C P D = 29 , C Z = 5 , U S = 7 , U D = 3 , M S = 40 , M D = 30 , T = 6 , L = 2 , F = 25 , W = 16 , α = 0.65 , β = 0.35 , ω = 0.3 , and θ = 0.6 . In this study, the numerical simulation was carried out by Matlab2016a. Emphasis was placed on the analysis of the influence that government tax refund ratio α , subsidy coefficient β for service providers, system maintenance and upgrade fee ratio ω , loan probability of financial institutions θ , and the number of higher-level government incentives F , and fines W have on the digital transformation of the industry on each game player of industry digital transformation. It was assumed that the probability of the enterprise, government, and service provider choosing their respective strategies was 0.5 in the initial state. The simulation results of system evolution in the initial state are shown in Figure 5, which serves as a baseline for comparative analysis.

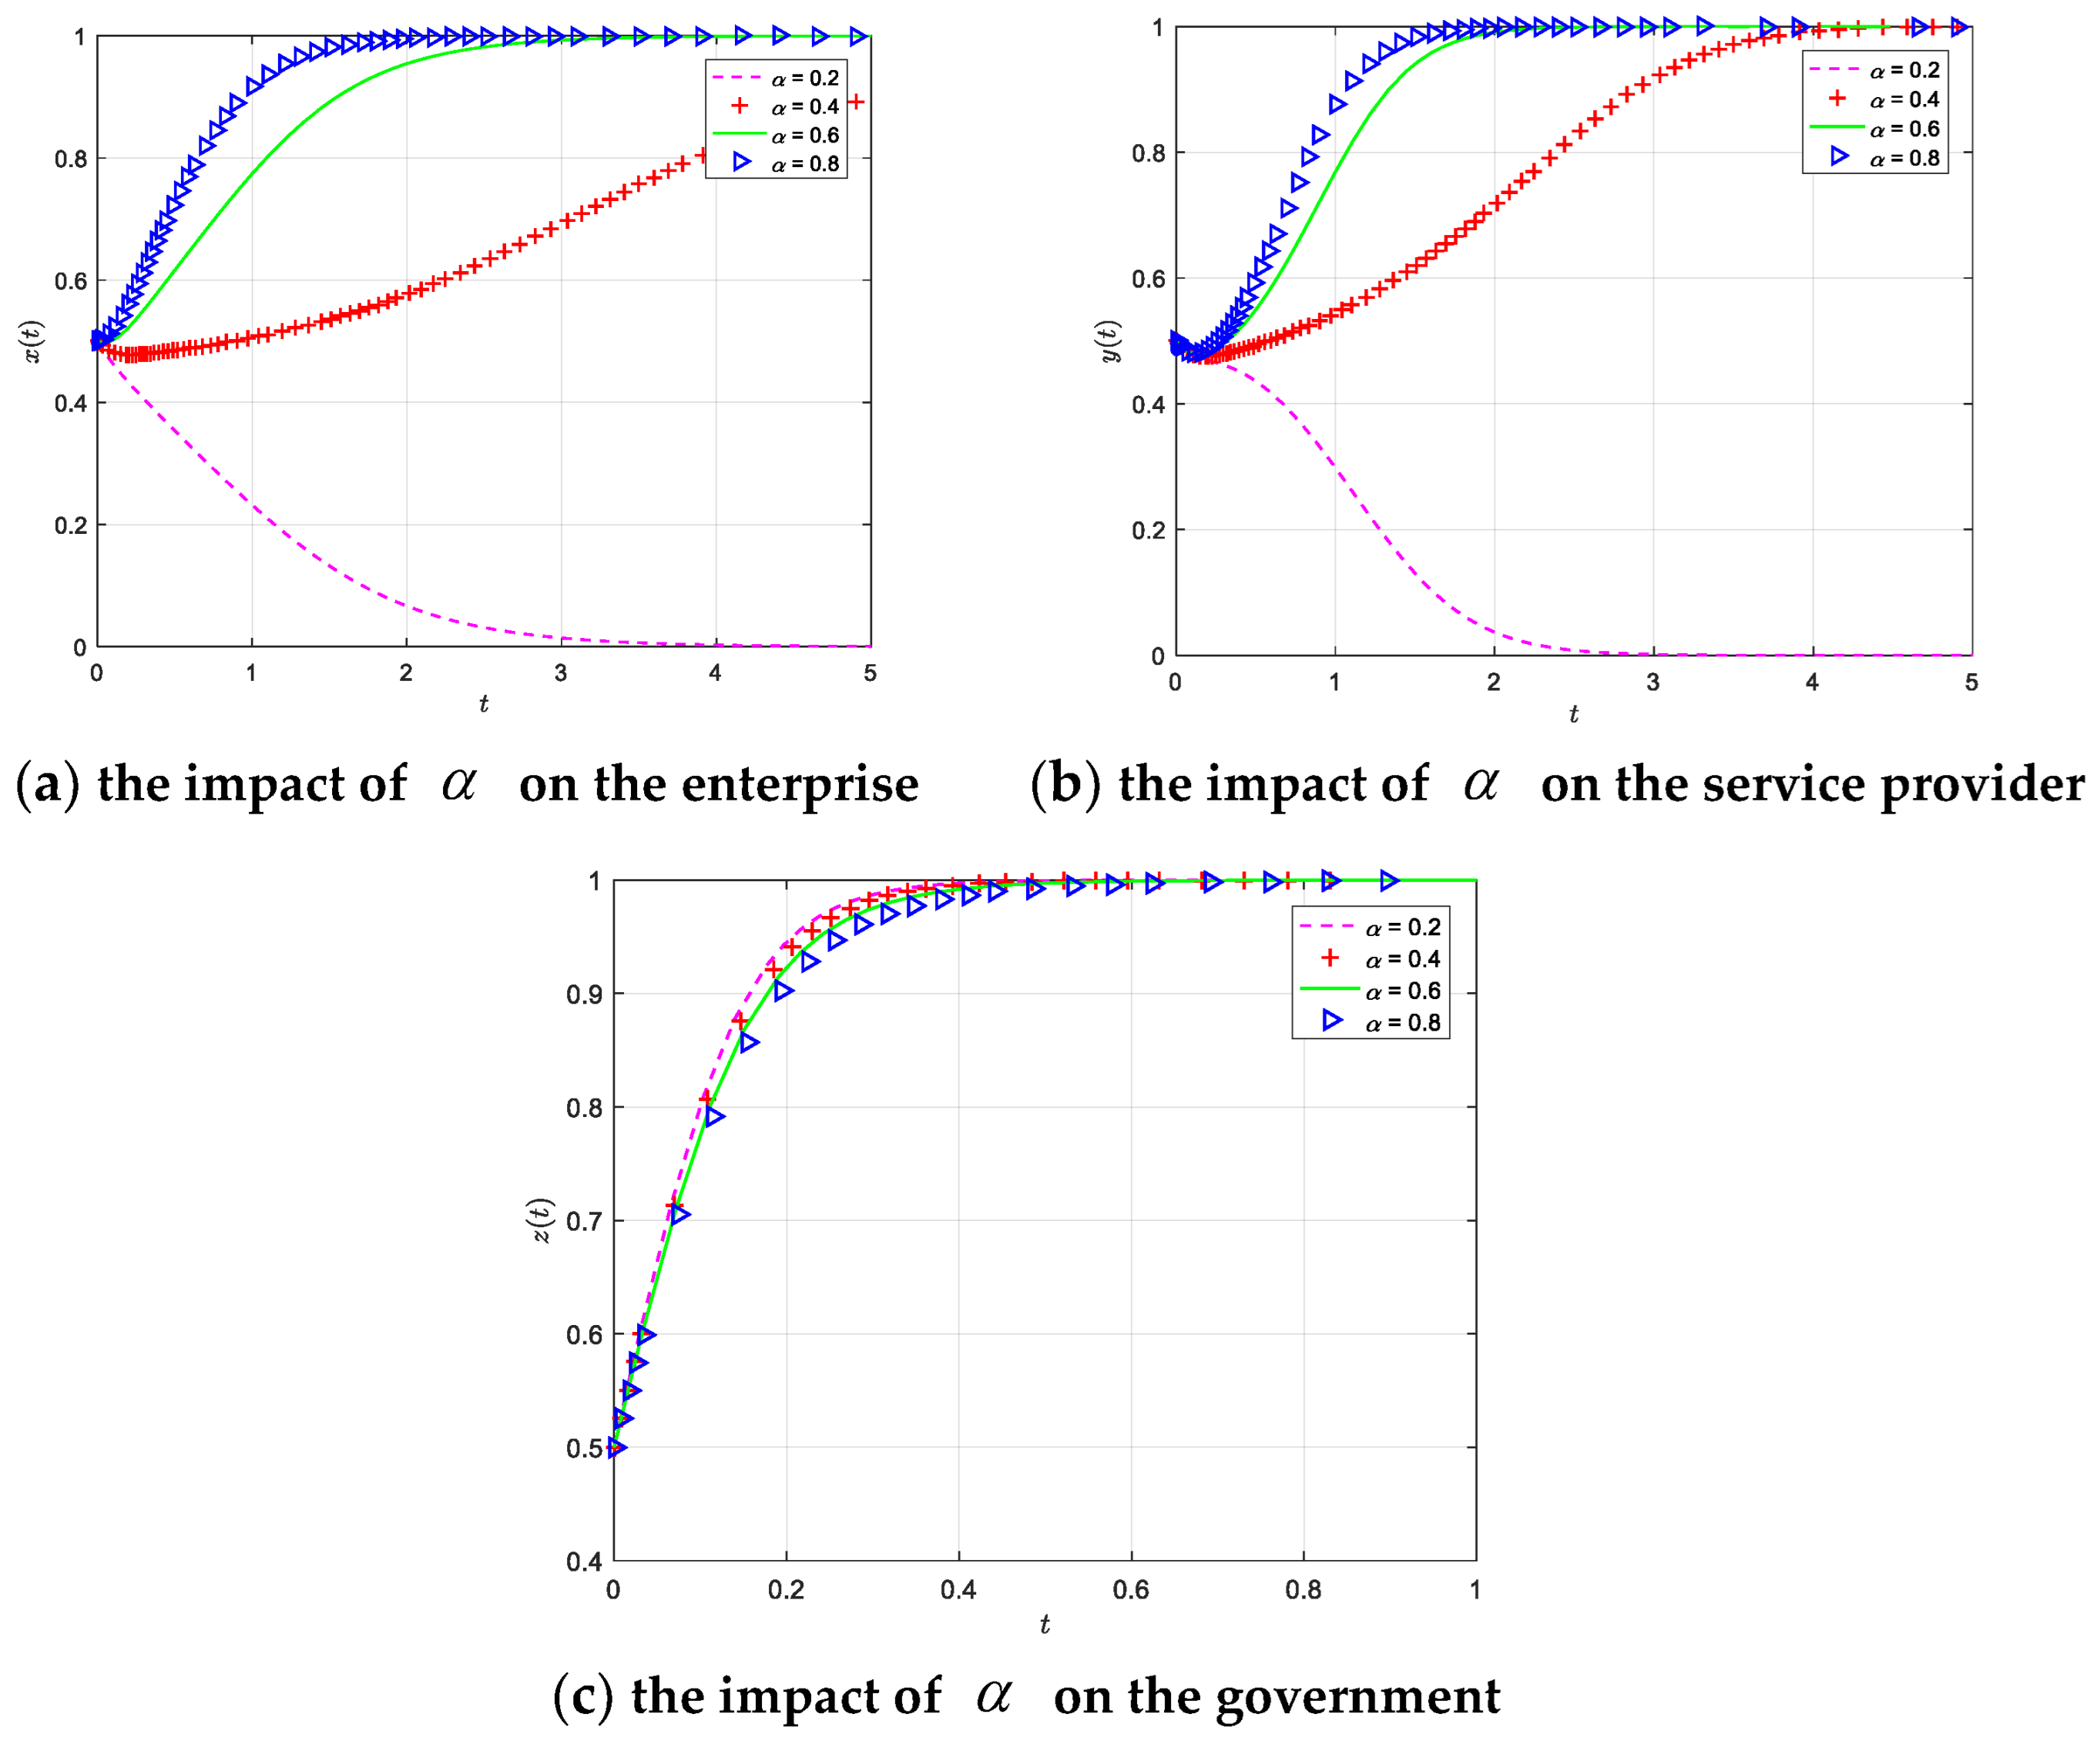
5.1. The Impact of the Tax Refund Ratio on Each Game Participant

In order to study the influence of the government tax refund ratio α on the evolution of the system, the values of α were set as 0.2, 0.4, 0.6, and 0.8, respectively, under the condition that other values remained unchanged, and the trajectory of the tripartite evolutionary game under different α values was explored. As shown in Figure 6a, within a certain range of values, with the increase in the government tax refund ratio, enterprises chose the digital transformation strategy and service providers were committed to promoting system services. When the tax refund subsidy strength was less than 0.4, enterprises tended to implement a non-digital transformation strategy. According to the above model analysis, the cost of digital transformation was too high at this time and the risk between benefits and costs needed to be borne by enterprises, which also has a direct impact on service providers (see Figure 6b). However, with the increase in the tax refund ratio, part of the enterprise risk is shared by the government and the enthusiasm for enterprise digital transformation significantly increased. Moreover, the rate of the transformation strategy selection significantly increased and was positively correlated with the tax refund subsidy. The evolution of enterprises’ digital transformation quickly reached a stable state. Therefore, the tax refund ratio was shown to have a significant impact on the digital transformation of enterprises. Figure 6b is compared with Figure 6c; it is obvious that service providers are more sensitive to changes in strategy than enterprises, which is also consistent with reality. Service providers pay more attention to the intensity of government subsidies to enterprises. When the subsidy intensity exceeds 0.6, the enterprise will obtain more benefits and be more active in digital transformation, and the service providers will have a greater probability of providing system services. Enterprises and service providers move toward stable states (digital transformation, system solution) at roughly the same rate. Figure 6c shows that the tax refund ratio does not have a great impact on the government’s active promotion strategy. The increase in the tax refund ratio has a certain effect on its evolution rate; that is, the larger the tax refund ratio, the slower the evolution rate. This also shows that the form of realization that is actively promoted by the government is reflected by the support for enterprises to a certain extent and the tax rebates provide one form of active promotion for enterprises.

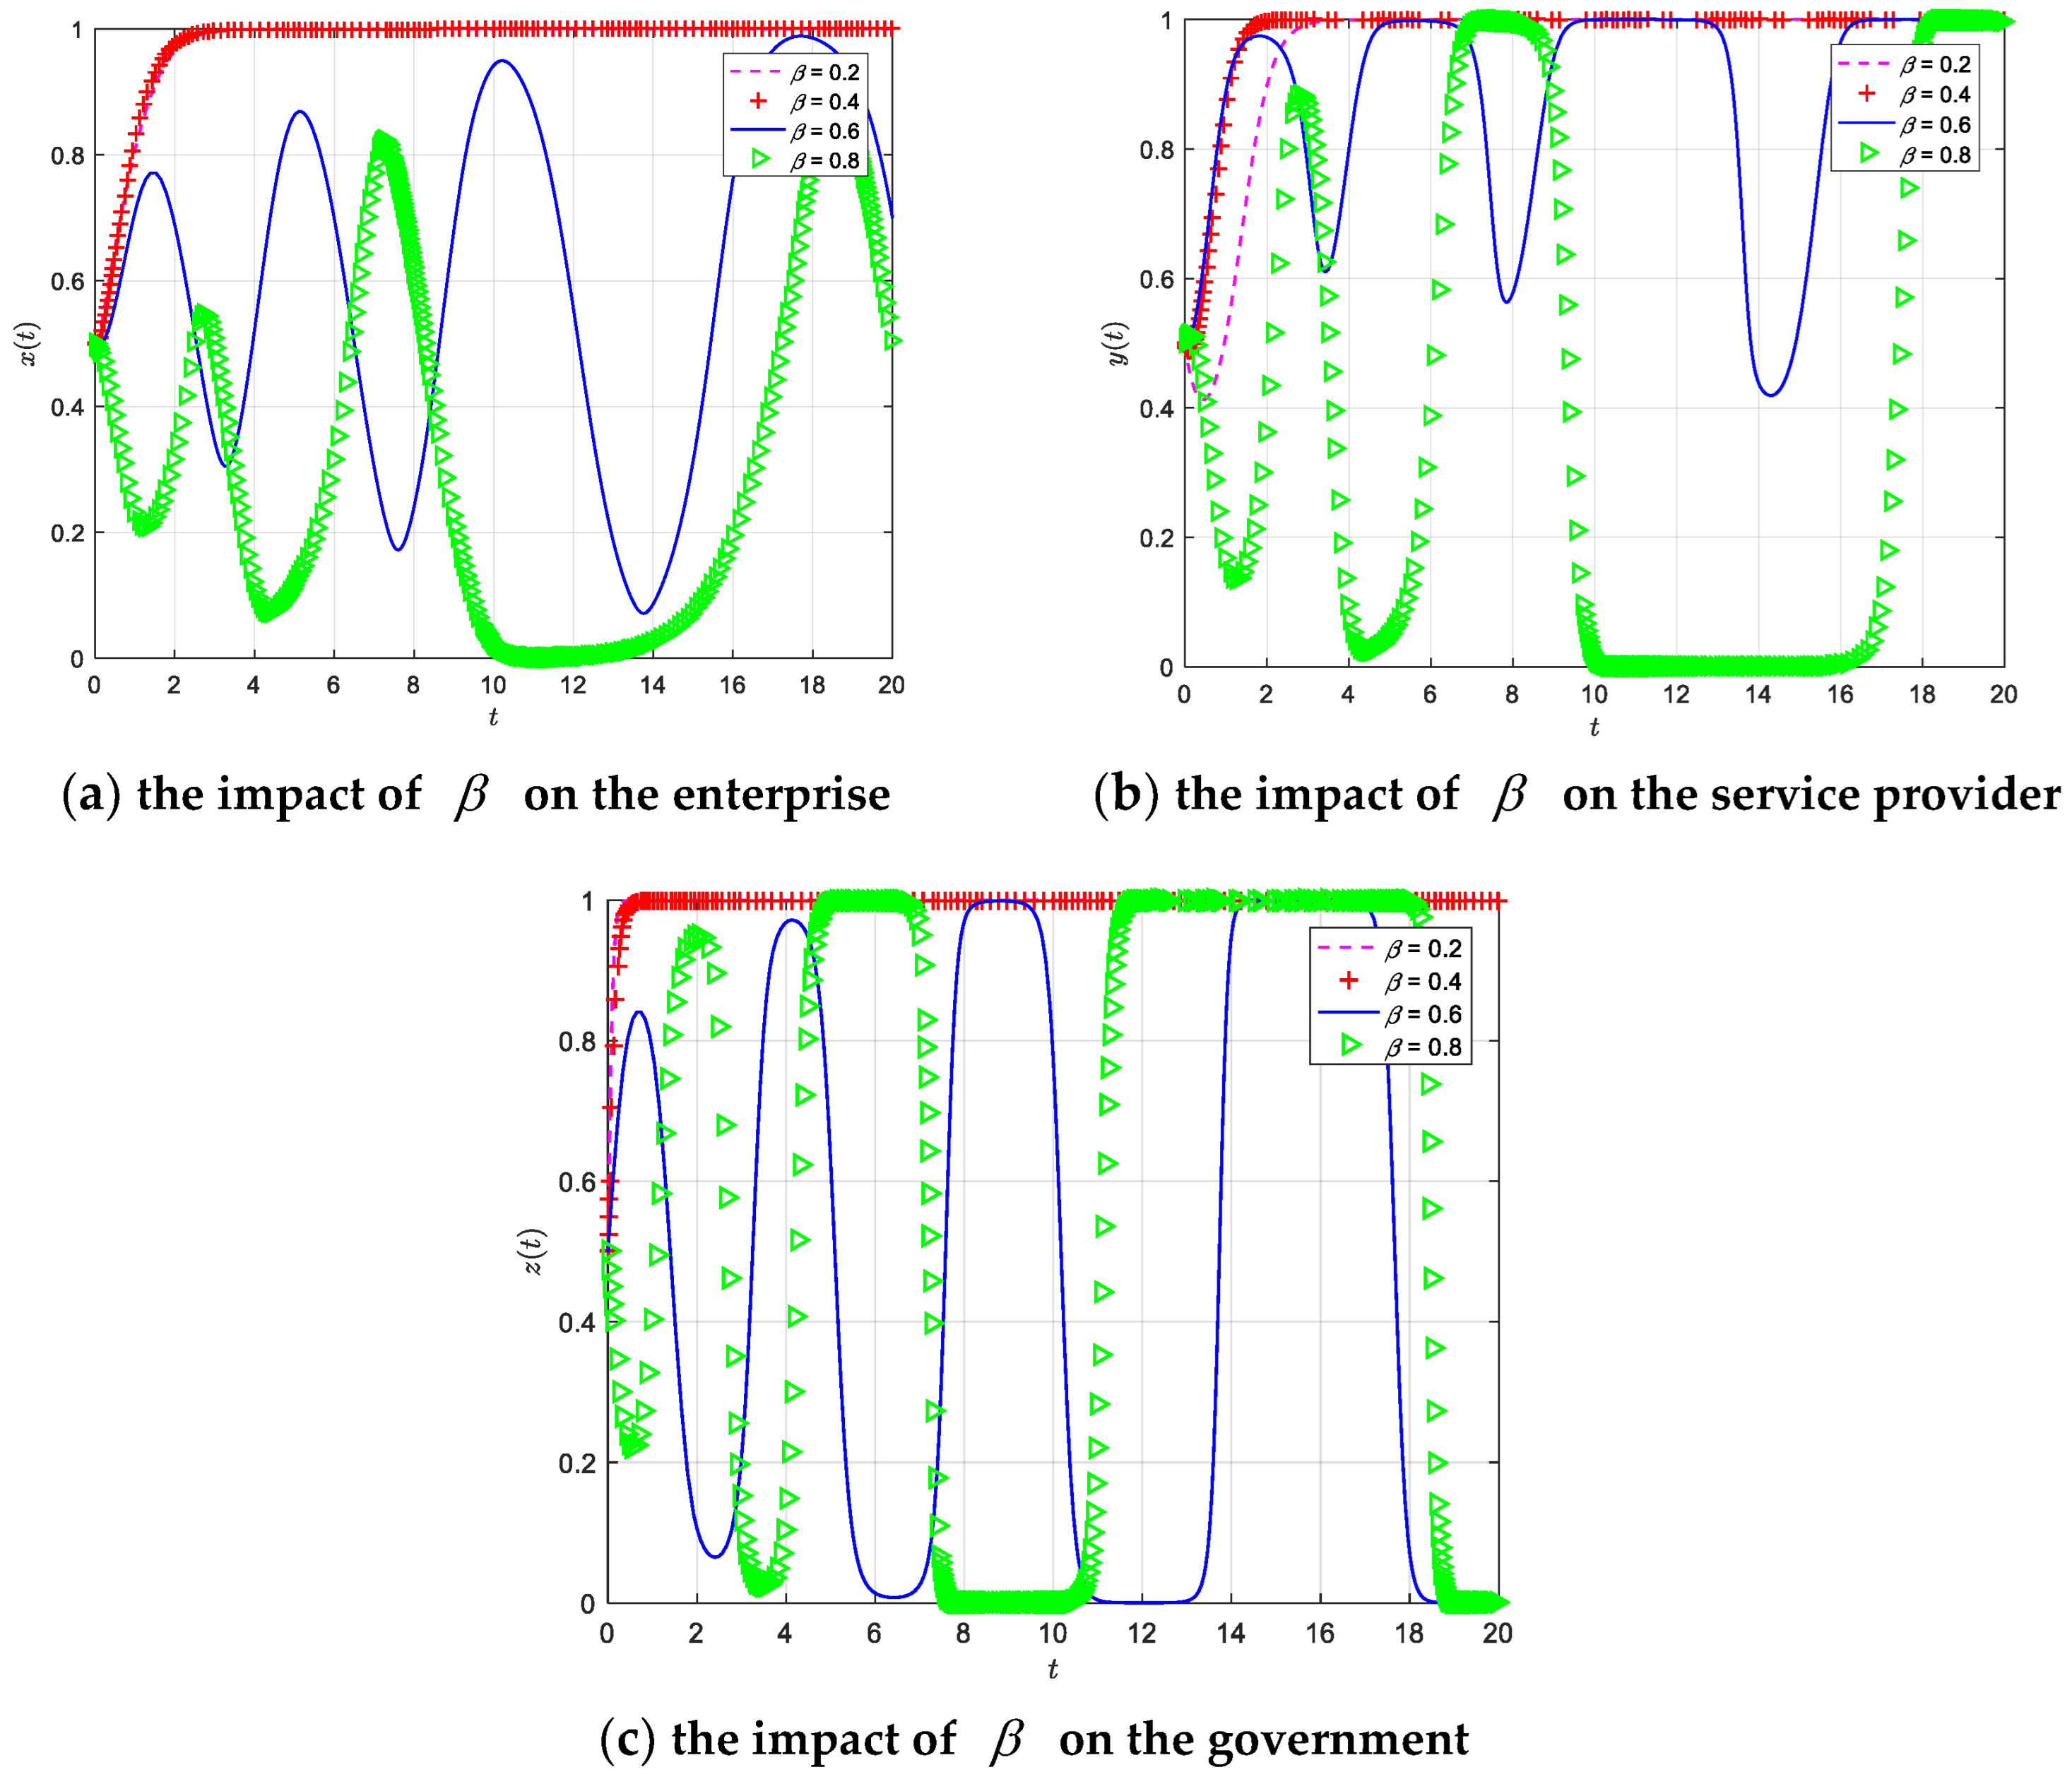
5.2. The Impact of the Subsidy on Each Game Participant

To study the impact of subsidies β on service providers regarding system evolution, the β values were set as 0.2, 0.4, 0.6, and 0.8, respectively, under the condition that other values remained unchanged, and the trajectory of the tripartite evolutionary game under different amplitudes was explored. As shown in Figure 7, within a certain numerical range, with the increase in the government’s tax refund range, service providers are committed to choosing the system solution strategy. After the strategy is implemented, the government shifts between different passive/positive conversions. When β is greater than 0.6, after a period of government subsidy, the service provider receives the subsidy cost and does not actively provide the system solution, which is suspected of cheating the subsidy. In this case, the government will choose the negative promotion strategy. Within a short period of time, service providers are encouraged by the government subsidies and their strategy evolves into the system solution strategy. When the government does not subsidize, service providers gradually move toward the basic solution and enterprises also do not tend to carry out digital transformations. To encourage the digital transformation of the construction industry in this region, the local government found that enterprises and service providers chose passive strategies; so, after service providers could be subsidized for a period of time, service providers and enterprises all moved in the direction of digitalization transformation, but the impact of high-intensity government subsidies on service providers and enterprises was found to lag. The subsidy was less than the threshold and the evolution of service providers tended to promote the system solution service strategy. To some extent, this indicates that service providers conduct relevant risk assessments before digitalization of the construction industry. Their purpose is not to obtain government subsidies. If the government subsidies are too high, some enterprises will cheat on these subsidies. This may lead to the phenomenon of bad money driving out good money, which is not conducive to the digital transformation of the industry.

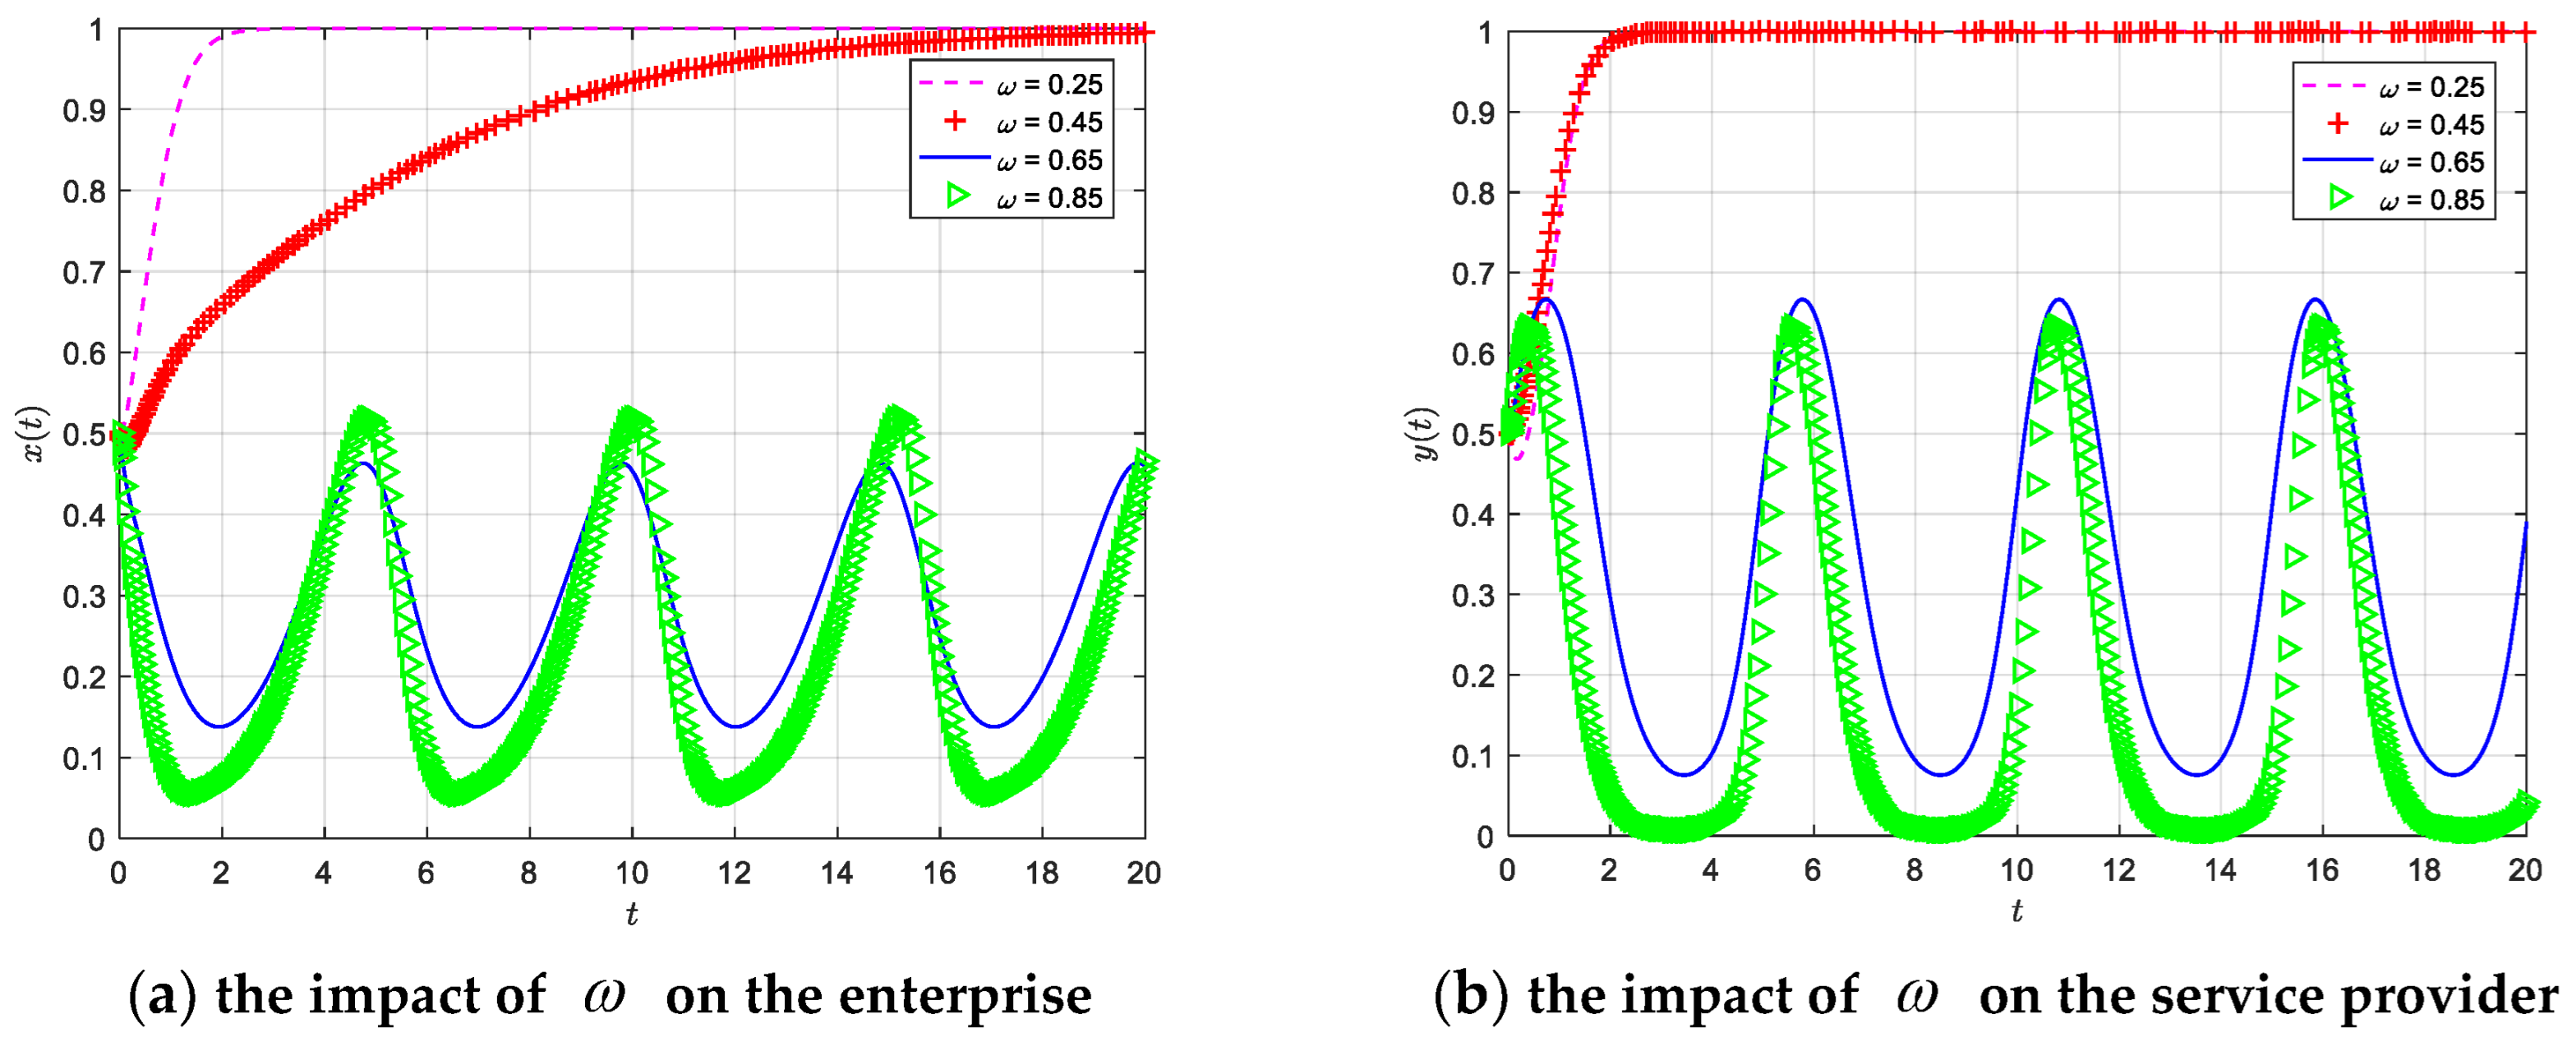
5.3. The Impact of the System Maintenance and Update Cost Ratio on Each Game Participant

Under the condition that other values remain unchanged, the values of ω are 0.25, 0.45, 0.65, and 0.85, respectively. The evolutionary game direction of the system is shown in Figure 8 under different charging ratio conditions. When the proportion of service fees charged by service providers is small, enterprises will choose system solution services; the rate of evolution and stability is inversely proportional to the proportion of value-added service fees that are charged. The government chooses to actively promote this and the system reaches a stable evolution state, i.e., the synergy state. When the proportion of system maintenance and update costs is slightly higher, the evolution process of enterprises and service providers is not stable and the system cannot reach a stable state. As shown in Figure 8, when the proportion of value-added service fees charged by service providers is small, enterprises will choose the system solution for comprehensive digital transformation. Moreover, the smaller the proportion factor of system maintenance and update costs, the faster the evolution rate of the enterprise’s choice of system solution. When the system maintenance upgrade fee collection ratio reaches 0.45, the impact on enterprise choice and enterprise evolution cannot reach a stable point in the short term. After a period of time, the benefits of digital transformation and upgrading will be obtained. Enterprises will gradually move closer to the comprehensive digital transformation strategy and reach a balanced and stable state. When the proportion of service fees charged is too high, enterprises will rapidly evolve toward the non-digital transformation strategy in the short term, but the enterprise strategy cannot reach a stable state. As can be seen from Figure 8, the digital transformation strategy of enterprises reaches a peak at around 0.5 and a low point below 0.1, indicating that the proportion of system maintenance and update expenses is too high and the choice of enterprise transformation strategy is not stable.
The evolution trajectory of the service provider is shown in Figure 8b; the threshold of ω is between 0.45 and 0.65. When the service provider charges a service fee ratio that is lower than the threshold, the service provider’s evolution stability strategy tends to provide system services and reach a stable state, and the charging ratio coefficient is proportional to the value-added service strategy selection. As shown in Figure 8a,b, when ω > 0.65 , the service provider still tends to provide a system solution within a short period of time. However, when they find that enterprises do not choose, they will change their strategies and tend to provide a basic solution. After a period of time, it was found that after the enterprise begins to choose the system solution again, service providers will also begin to actively provide a system solution. There is a certain lag in the choice of service provider and the choice of strategy is directly affected by the enterprises, which cannot reach a stable equilibrium state. The proportion of system maintenance and upgrade fees that are charged has little impact on the government.

5.4. The Impact of the Loan Probability of Financial Institutions on Each Game Participant

In order to study the influence of financial institutions on loan probability θ , the values of θ were set as 0.2, 0.4, 0.6, and 0.8 under the condition that other values remain unchanged. As shown in Figure 9, with the increase in loan probability, the evolution speed of the digital transformation of enterprise choice accelerates and reaches a stable state, and the service provider strategy selection is affected by the change in enterprise strategy selection. When the loan probability increases, the evolution rate of the service provider’s choice of system solution strategy is also improved and the government also uses an active promotion strategy, so the system reaches a stable equilibrium state. Figure 9 shows that as the probability of financial institutions offering a successful loan increases, the evolution rate of service providers and governments, which tends to be in a co-ordinated state, accelerates. Moreover, compared with enterprises, the changes in service providers are more sensitive and reach a stable state earlier, while the evolutionary stability rate of government slows down with the increase in loan success probability. These indicate that inclusive finance can effectively promote the digital transformation of enterprises and alleviate the capital pressure caused by the high cost of government subsidies. The government should actively guide industrial capital, inclusive finance, and other financing means to support the digital transformation of enterprises. Low-cost financing plays a positive role for each of the three participants in the game and has great practical significance for the digital transformation of the construction industry.

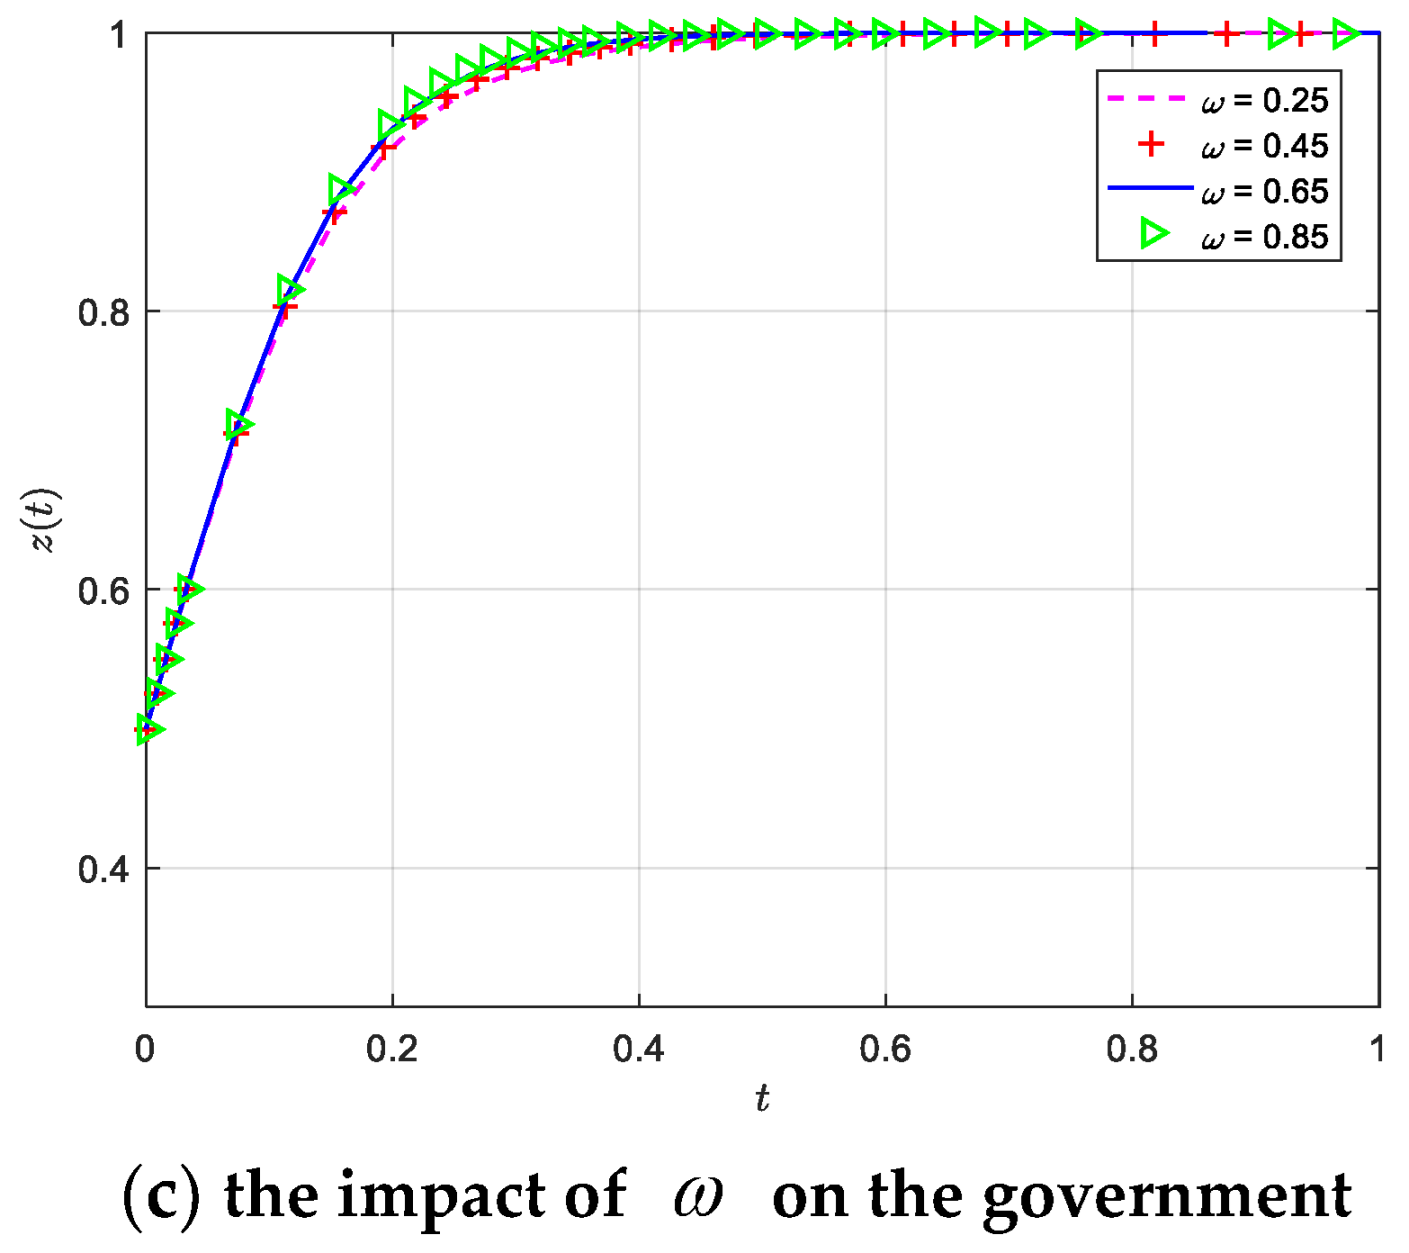
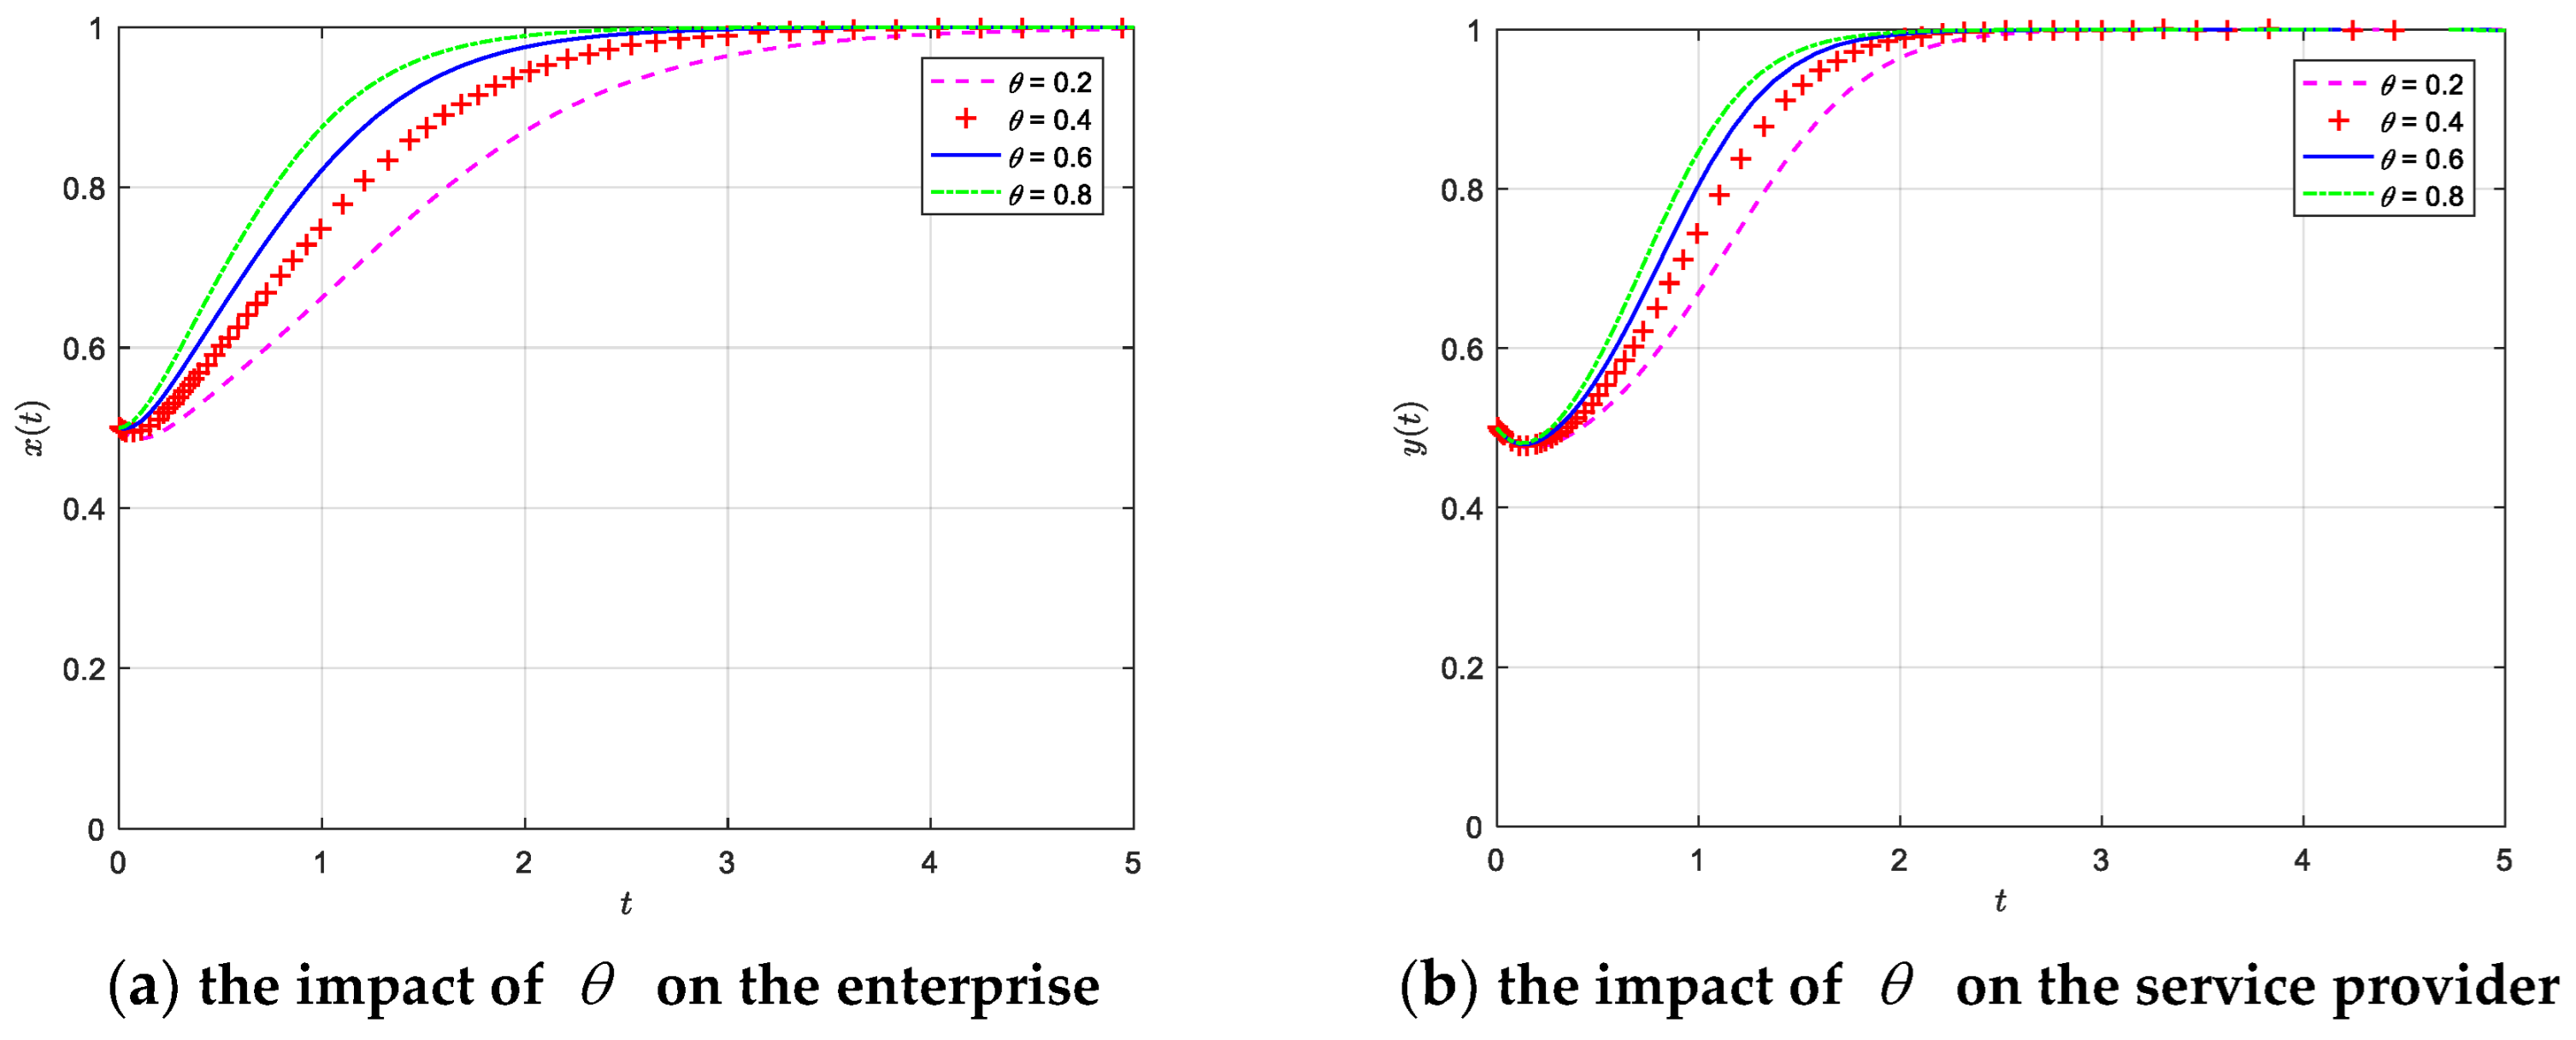
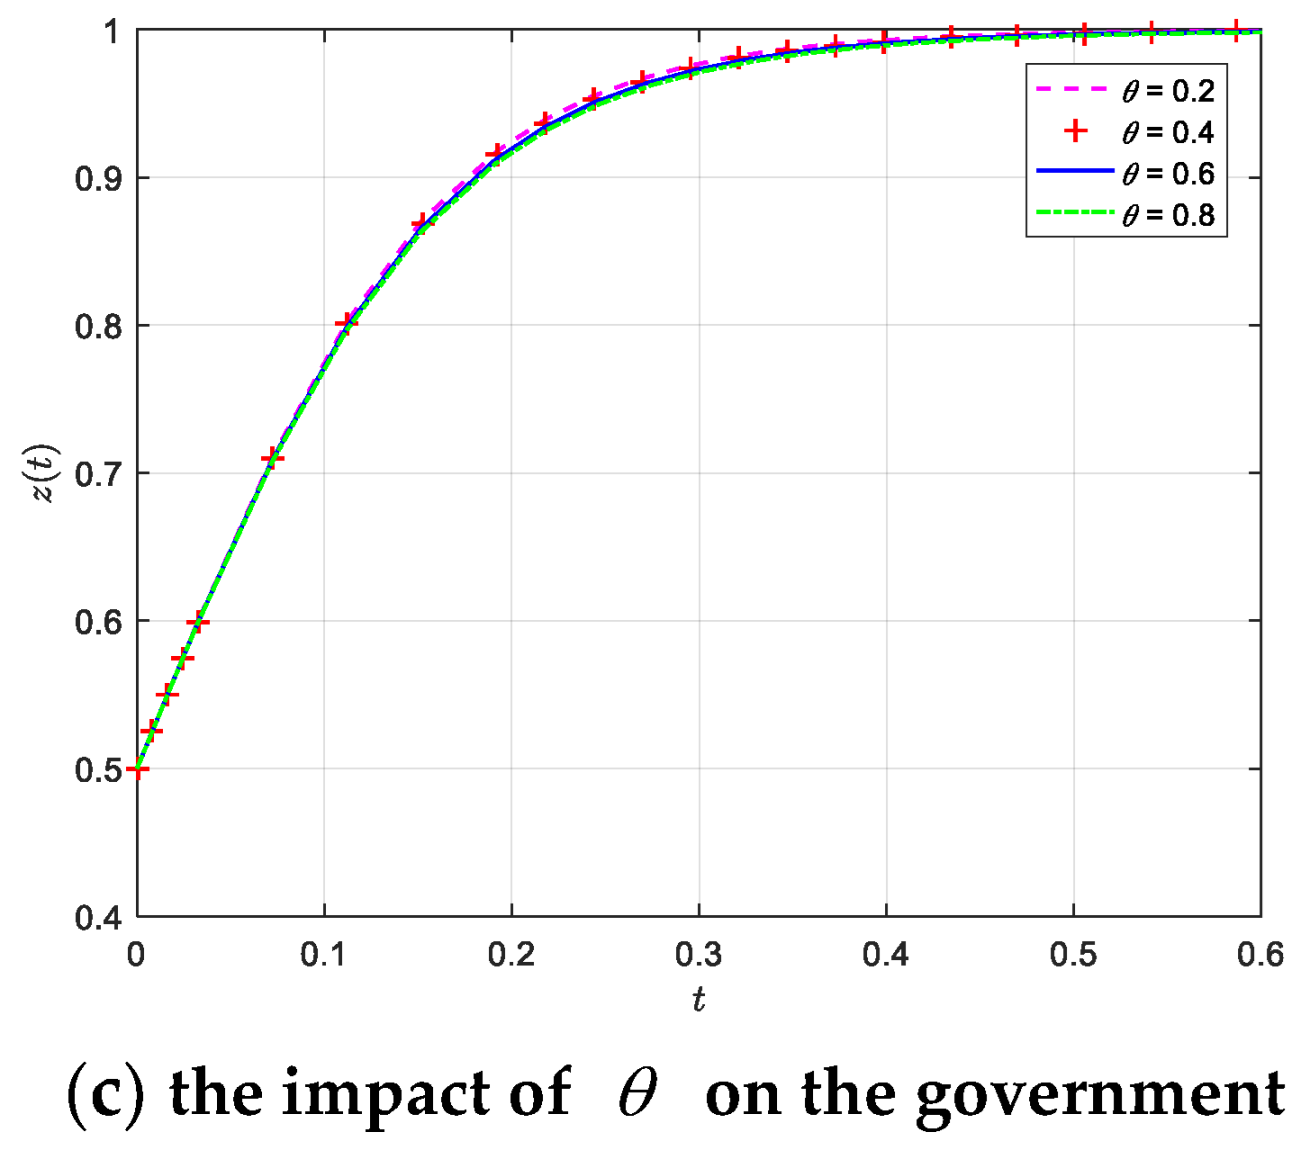
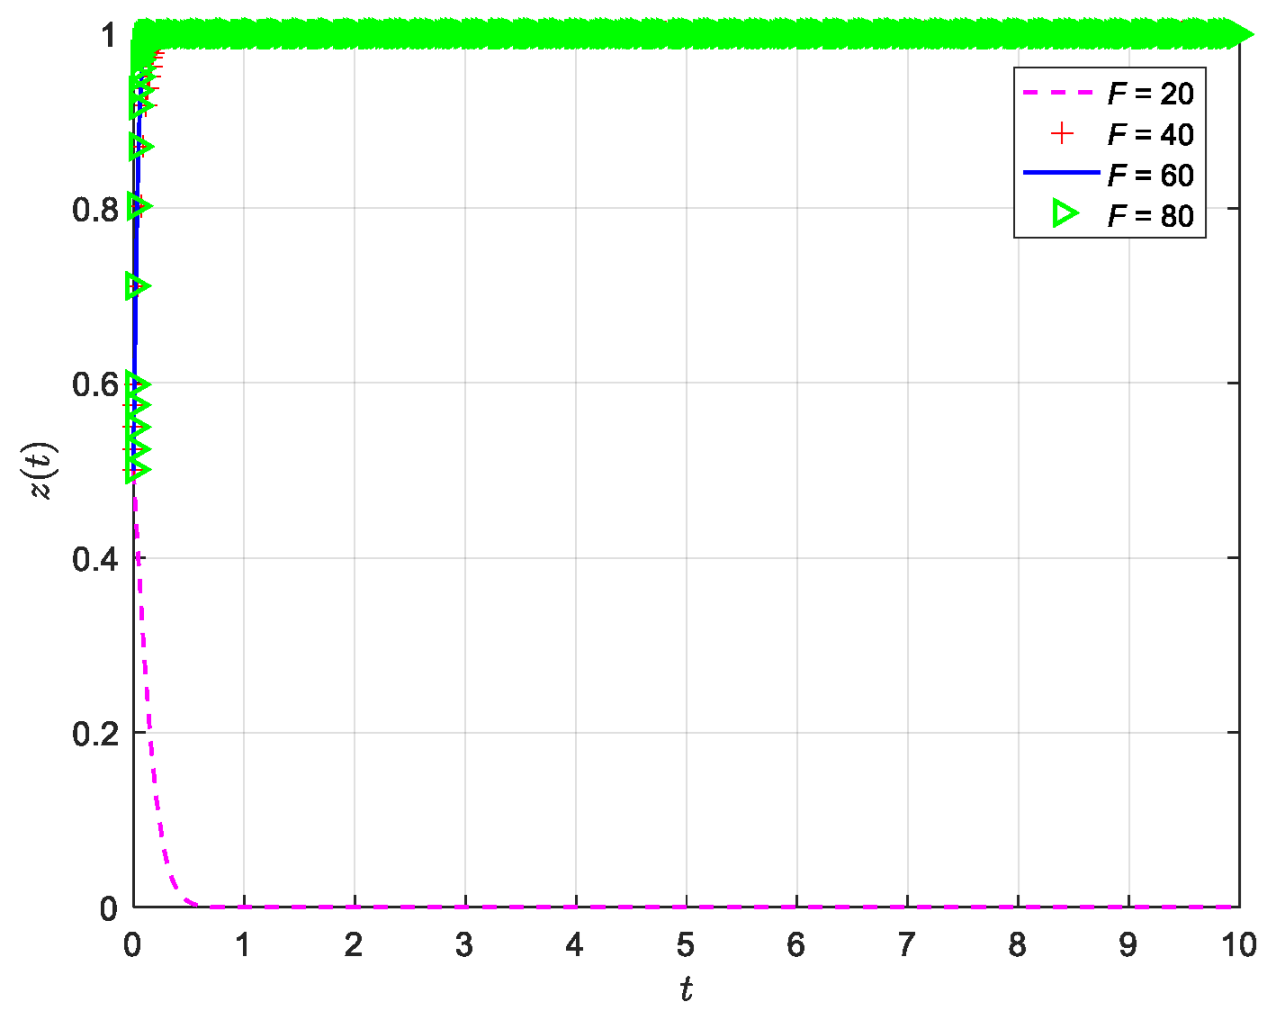
5.5. The Impact of Different Awards and Higher-Level Penalties on the Government’s Strategy

It can be seen from Figure 10 that when the government reward is under a certain value, the government tends to select a negative promotion strategy. It can be seen from Figure 11 that when the government’s punishment is below a certain threshold, the local policy and strategy choices are repeated. However, after the number of rewards and punishments has increased, the government tends to select an active promotion strategy, which is basically consistent with the analysis of Proposition 6. The mechanism of high rewards and punishments adopted by the superior government can effectively encourage the local government to actively promote the digital transformation of the construction industry.

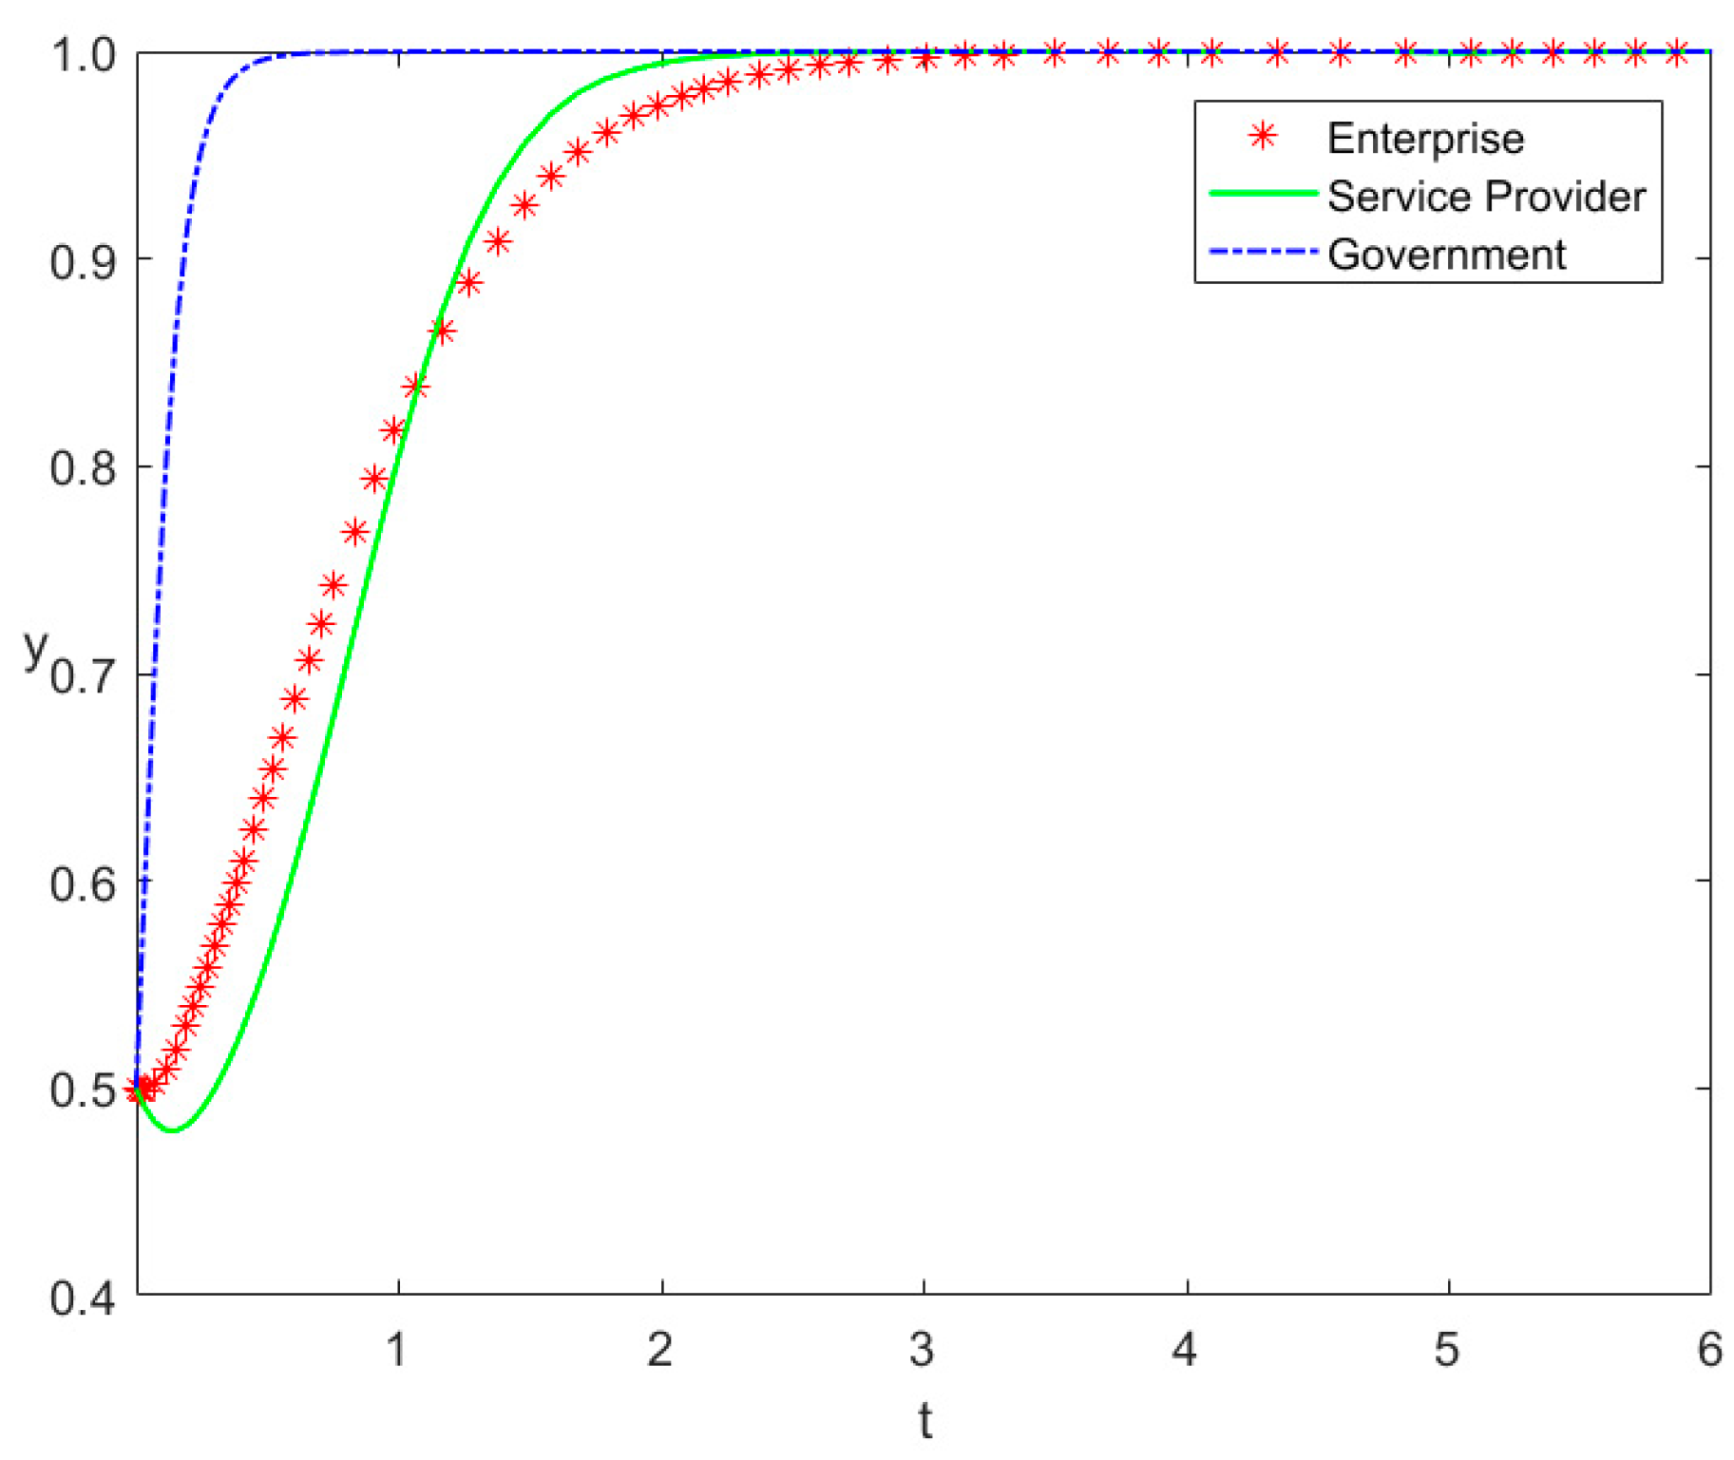
5.6. The Verification of System Model

In order to test the evolutionary stability and validity of the system, Array 1 was assigned to satisfy the initial state, Array 2 to satisfy the market state, and Array 3 to satisfy synergy state.
Array 1: As shown in Figure 12a, R S = 13 , R D = 8 , C E = 12 , C P S = 36 , C P D = 19 , C Z = 5 , U S = 7 , U D = 3 , M S = 40 , M D = 30 , T = 6 , L = 2 , F = 15 , W = 9 , α = 0.65 , β = 0.35 , ω = 0.3 , and θ = 0.6 .
Array 2: As shown in Figure 12b, R S = 13 , R D = 8 , C E = 7 , C P S = 14 , C P D = 19 , C Z = 5 , U S = 7 , U D = 3 , M S = 40 , M D = 30 , T = 6 , L = 2 , F = 17 , W = 38 , α = 0.65 , β = 0.35 , ω = 0.3 , and θ = 0.6 .
Array 3: As shown in Figure 12c, R S = 13 , R D = 8 , C E = 12 , C P S = 26 , C P D = 19 , C Z = 5 , U S = 7 , U D = 3 , M S = 40 , M D = 30 , T = 6 , L = 2 , F = 25 , W = 38 , α = 0.65 , β = 0.35 , ω = 0.3 , and θ = 0.6 .
Array 1, Array 2, and Array 3 were substituted into the model for simulation and the results are shown in Figure 12.
Figure 12 shows that the simulation results are consistent with Propositions 4, 5, and 6. Under the conditions of Propositions 4, the system evolves to a traditional state and no efforts are made to digitally transform. Under the conditions of Proposition 5, the system evolves to the market state (1.1.0). The government abdicates and the market plays a decisive role. The market enterprises and service providers encourage each other to digitally transform the industry. Under the conditions of Proposition 6, the system eventually evolves to a co-ordinated state (1,1,1) (digital transformation, system solution, active promotion). Therefore, with the continuous implementation of the digital transformation policy, the government will gain enough benefits from the digital economy through active promotion. When the benefits to enterprises are greater than the costs after receiving various subsidies and the comprehensive benefits obtained by digital transformation service providers are greater than the costs, the digital transformation of the construction industry will become a reality. The simulation results of the system are consistent with the previous model analysis, which shows that the simulation analysis results have consistent conclusions and practical effectiveness according to the stability analysis of the tripartite evolution strategy. This has practical guiding significance for promoting the digital transformation of the construction industry.

6. Conclusions and Suggestions

The digital transformation of the construction industry is the most important part of the development of China’s digital economy and one of the most difficult industries to transform. Under the limited rationality of group decision-making participants, this study constructed an evolutionary model of the key participants in the promotion of the digital transformation of the construction industry: enterprise, service provider, and government. Then, this study introduced parameters such as tax refund ratios, subsidies to service providers, system maintenance and renewal cost coefficients, financial loan probabilities, and rewards and punishments from higher-level governments, and analyzed the impact mechanism of the evolution strategy on the digital transformation of the construction industry. Finally, a MATLAB simulation was used to analyze the influence of each parameter on the strategy selection of each subject and verify the effectiveness of the digital transformation evolutionary game model of each participant.
The following conclusions were obtained. ① Whether the enterprise is transformed depends on whether the income payment of the basic solution is positive. However, whether a company undergoes a comprehensive digital transformation depends on the benefits of the system solution; the greater the benefit, the more active the enterprise. ② Regardless of the strategic choice of the government, enterprises, and service providers, they all meet the bounded rationality; that is, when the total benefit is greater than the total cost, they tend to actively implement the comprehensive digital transformation of the construction industry. ③ As long as the tax refund ratio for enterprises exceeds the threshold, this can greatly mobilize enterprises’ enthusiasm for digital transformation. Then, all three participants tend to actively implement this transformation, but as the tax refund ratio increases, the evolution of the government’s active promotion strategy will slow down. ④ The subsidy coefficient for service providers should be controlled within a reasonable range, which has a good incentive effect on service providers and enterprises. ⑤ The system maintenance and upgrade fee charged by the service provider should not be too high and when it exceeds 50% of the revenue of the system solution, the enterprise will change synchronously with the service provider’s strategy. ⑥ The increase in the probability of loans from financial institutions to enterprises has a promotional effect on all three parties, which can effectively promote the digital transformation of the industry. ⑦ The use of high rewards and penalties by higher-level governments against local governments can effectively encourage local governments to choose active promotion strategies.
Based on the conclusions obtained from the tripartite evolution game, the following suggestions are put forward for the digital transformation of the Chinese construction industry:
(1)
The current level of science and technology of other enterprises in China is low and extensive management modes are prevalent. The government should increase market publicity and promotion in intelligent construction, digital technology innovation, digital technology application, system platform construction, etc., and increase tax refund subsidies so that enterprises can reduce the cost of digital transformation, increase their confidence in future prospects, and overcome the painful wait-and-see period.
(2)
The government must first establish a digital infrastructure for the construction industry, through digital construction talent training, industry–university–research cooperations, science and technology development, marketing, innovation and entrepreneurship, construction industry platforms, project-level BIM, and the building of intelligent machinery and equipment, etc., so that enterprises can obtain the benefits of project-level digital transformation. Then, enterprises will actively choose system solutions; that is, digital transformation will be carried out at the enterprise management level, such as ERP system, centralized procurement systems, and project management systems.
(3)
At present, the digital level of China’s construction industry is low, offering a rare opportunity and challenge for service providers. The purpose of service providers is not to obtain government subsidies, but to pursue market expansion. Therefore, it is not that “the more subsidies, the better”; the government should co-ordinate more with service providers, support more enterprises in digital transformation, expand the digital application market of the construction industry, and achieve economies of scale, reducing the digital transformation costs of enterprises and expanding the market utility of service providers. Finally, the government should withdraw from the dominant market.
(4)
Financial support policies should be innovated and social capital, industrial capital, inclusive finance, venture capital, and other financial capital tools should be guided to participate in the digital reform of the construction industry. With the blessing of financial capital, the digital transformation of the industry will be greatly accelerated.
(5)
The higher-level government should establish and improve the digital-level evaluation system of the construction industry and encourage the local government to actively promote the digital transformation of the construction industry through means such as model enterprises of digital transformation and the regional digital transformation of advanced demonstration areas. The local government should be encouraged to actively promote the digital transformation of the construction industry through means such as transformation completion and transformation maturity championship rankings.
Despite the contributions of this study, several limitations should be acknowledged. Firstly, due to different national conditions, the digitalization development level of the construction industry differs, so the suggestions are only a reference for the digitalization transformation of the construction industry in other countries. Secondly, in practice, in addition to the transformation participants and influencing factors mentioned in the study, there are other participants, such as universities and scientific research institutions. Moreover, other influencing factors may have an important impact on the digital transformation of the construction industry, such as the maturity of digital technology in the industry, the level of digital technology innovation, the digital foundation level of enterprises, the digital service capability level of service providers, and the success rate of the digital transformation of enterprises. All these need to be further studied and explored. An empirical investigation and verification of the variables and parameters set in this study will also be a direction of future research.

Author Contributions

Conceptualization, C.Z. and L.L.; methodology, L.L.; validation, Z.W. and C.Z.; formal analysis, C.Z. and L.L.; investigation, C.Z.; resources, C.Z.; writing-original draft preparation, C.Z.; writing-review and editing, L.L. and Z.W.; funding acquisi-tion, C.Z. All authors have read and agreed to the published version of the manuscript.

Funding

The research is supported by Jiaxing Nanhu University high-level talent introduction scientific research project (70500000/036), the Fundamental Research Funds for the Central Universities (B230205050), and the Postgraduate Research & Practice Innovation Program of Jiangsu Province (KYCX22_0683).

Data Availability Statement

Data are unavailable due to privacy.

Conflicts of Interest

The authors declare no conflict of interest.

References

  1. Saka, A.B.; Chan, D.W.M.; Mahamadu, A.-M. Rethinking the Digital Divide of BIM Adoption in the AEC Industry. J. Manag. Eng. 2022, 38, 04021092. [Google Scholar] [CrossRef]
  2. Wu, Y.; Zhu, Y.; Zhao, J. The Propulsion Path of Synergy and Linkage Based on Artificial Intelligence and Digital Economy. Front. Psychol. 2022, 13, 854542. [Google Scholar] [CrossRef] [PubMed]
  3. Crișan, E.L.; Stanca, L. The digital transformation of management consulting companies: A qualitative comparative analysis of Romanian industry. Inf. Syst. e-Bus. Manag. 2021, 19, 1143–1173. [Google Scholar] [CrossRef]
  4. Van Veldhoven, Z.; Vanthienen, J. Digital transformation as an interaction-driven perspective between business, society, and technology. Electron. Mark. 2021, 32, 629–644. [Google Scholar] [CrossRef] [PubMed]
  5. Criado-Perez, C.; Shinkle, G.A.; Höllerer, M.A.; Sharma, A.; Collins, C.; Gardner, N.; Haeusler, M.H.; Pan, S. Digital Transformation in the Australian AEC Industry: Prevailing Issues and Prospective Leadership Thinking. J. Constr. Eng. Manag. 2022, 148, 05021012. [Google Scholar] [CrossRef]
  6. Musarat, M.A.; Sadiq, A.; Alaloul, W.S.; Wahab, M.M.A. A Systematic Review on Enhancement in Quality of Life through Digitalization in the Construction Industry. Sustainability 2023, 15, 202. [Google Scholar] [CrossRef]
  7. Rupeika-Apoga, R.; Petrovska, K.; Bule, L. The Effect of Digital Orientation and Digital Capability on Digital Transformation of SMEs during the COVID-19 Pandemic. J. Theor. Appl. Electron. Commer. Res. 2022, 17, 669–685. [Google Scholar] [CrossRef]
  8. Li, H.; Han, Z.; Zhang, J.; Philbin, S.P.; Liu, D.; Ke, Y. Systematic Identification of the Influencing Factors for the Digital Transformation of the Construction Industry Based on LDA-DEMATEL-ANP. Buildings 2022, 12, 1409. [Google Scholar] [CrossRef]
  9. You, Z. Intelligent construction: Unlocking opportunities for the digital transformation of China’s construction industry. Eng. Constr. Arch. Manag. 2022; ahead-of-print. [Google Scholar] [CrossRef]
  10. Jiao, S.; Sun, Q. Digital Economic Development and Its Impact on Econimic Growth in China: Research Based on the Prespective of Sustainability. Sustainability 2021, 13, 10245. [Google Scholar] [CrossRef]
  11. Karpunina, E.K.; Yurina, E.A.; Kuznetsov, I.A.; Dubovitski, A.A. Growth potential and economic security threats in terms of digital economy ecosystem. In Proceedings of the 33rd International Business Information Management Association (IBIMA) Conference, Granada, Spain, 10–11 April 2019. [Google Scholar]
  12. Pang, J.; Jiao, F.; Zhang, Y. An Analysis of the Impact of the Digital Economy on High-Quality Economic Development in China—A Study Based on the Effects of Supply and Demand. Sustainability 2022, 14, 16991. [Google Scholar] [CrossRef]
  13. Khahro, S.H.; Hassan, S.; Zainun, N.Y.B.; Javed, Y. Digital Transformation and E-Commerce in Construction Industry A Prospective Assessment. Acad. Strat. Manag. J. 2021, 20, 1–8. [Google Scholar]
  14. Rupeika-Apoga, R.; Petrovska, K. Barriers to Sustainable Digital Transformation in Micro-, Small-, and Medium-Sized Enterprises. Sustainability 2022, 14, 13558. [Google Scholar] [CrossRef]
  15. Kutnjak, A. COVID-19 Accelerates Digital Transformation in Industries: Challenges, Issues, Barriers and Problems in Transformation. IEEE Access 2021, 9, 79373–79388. [Google Scholar] [CrossRef]
  16. Kutnjak, A.; Pihir, I. Challenges, issues, barriers and problems in digital transformation—Systematic literature review. In Proceedings of the 30th Central European Conference on Information and Intelligent Systems (CECIIS), Varazdin, Croatia, 2–4 October 2019. [Google Scholar]
  17. Huang, R.Y.; Tsai, T.Y.; Wang, H.H. Developing an RFID-based tracking system to improve the control of construction surplus soil disposal in Taiwan. J. Chin. Inst. Eng. 2019, 42, 175–188. [Google Scholar] [CrossRef]
  18. Kim, H.; Han, S. Accuracy Improvement of Real-Time Location Tracking for Construction Workers. Sustainability 2018, 10, 1488. [Google Scholar] [CrossRef] [Green Version]
  19. da Silva, N.P.; Eloy, S.; Resende, R. Robotic construction analysis: Simulation with virtual reality. Heliyon 2022, 8, e11039. [Google Scholar] [CrossRef]
  20. Wang, L.; Naito, T.; Leng, Y.; Fukuda, H.; Zhang, T. Research on Construction Performance Evaluation of Robot in Wooden Structure Building Method. Buildings 2022, 12, 1437. [Google Scholar] [CrossRef]
  21. Kim, K.; Lee, G.; Kim, S. A Study on the Application of Block chain Technology in the Construction Industry. KSCE J. Civ. Eng. 2020, 24, 2561–2571. [Google Scholar] [CrossRef]
  22. Yang, R.; Wakefield, R.; Lyu, S.; Jayasuriya, S.; Han, F.; Yi, X.; Chen, S. Public and private block chain in construction business process and information integration. Autom. Constr. 2020, 118, 103276. [Google Scholar] [CrossRef]
  23. Lee, S.; Chung, S.; Kwon, S.; Cho, C.-S.; Lee, K. Assessment of BIM Competencies and Correlation Analysis between Competencies and Career Characteristics of FAB Construction Project Participants. Appl. Sci. 2021, 11, 8468. [Google Scholar] [CrossRef]
  24. Li, S.; Zhang, Z.; Mei, G.; Lin, D.; Yu, J.; Qiu, R.; Su, X.; Lin, X.; Lou, C. Utilization of bim in the Construction of a Submarine Tunnel: A Case Study in Xiamen City, China. J. Civ. Eng. Manag. 2021, 27, 14–26. [Google Scholar] [CrossRef]
  25. Xu, S.; Hou, Y.; Mao, L. Application Analysis of the Ecological Economics Model of Parallel Accumulation Sorting and Dynamic Internet of Things in the Construction of Ecological Smart City. Wirel. Commun. Mob. Comput. 2022, 2022, 8770859. [Google Scholar] [CrossRef]
  26. Zhao, M. Technology of Internet of Things Technology in the Construction of Smart Mine. In Proceedings of the 3rd International Conference on Artificial Intelligence and Big Data (ICAIBD), Chengdu, China, 28–31 May 2020. [Google Scholar]
  27. Guang, C. Development of migrant workers in construction based on machine learning and artificial intelligence technology. J. Intell. Fuzzy Syst. 2021, 40, 6629–6640. [Google Scholar] [CrossRef]
  28. MäkinenT.Strategizing for Digital Transformation: A Case Study of Digital Transformation Process in the Construction Industry; Aalto University: Espoo, Finland, 2017.
  29. Prebanić, K.R.; Vukomanović, M. Realizing the Need for Digital Transformation of Stakeholder Management: A Systematic Review in the Construction Industry. Sustainability 2021, 13, 12690. [Google Scholar] [CrossRef]
  30. Ezeokoli, F.O.; Okolie, K.C.; Okoye, P.U.; Belonwu, C.C. Digital Transformation in the Nigeria Construction Industry: The Professionals’ View. World J. Comput. Appl. Technol. 2016, 4, 23–30. [Google Scholar] [CrossRef]
  31. Turkova, V.N.; Archipova, A.N.; Fedorovna, Z.G. Digital transformation of the Russian construction industry. IOP Conf. Series Mater. Sci. Eng. 2020, 880. [Google Scholar] [CrossRef]
  32. Smith, J.M.; Price, G.R. The Logic of Animal Conflict. Nature 1973, 246, 15–18. [Google Scholar] [CrossRef]
  33. Smith, J.M. The theory of Games and the Evolution of Animal Conflicts. J. Theor. Biol. 1974, 47, 209–221. [Google Scholar] [CrossRef] [Green Version]
  34. Smith, J.M. Evolution and the Theory of Games; Cambridge University Press: Cambridge, UK, 1982. [Google Scholar]
  35. Xie, S.Y. Economic Game Theory; Fudan University Press: Shanghai, China, 2012. [Google Scholar]
  36. Yu, C.X.; Guo, D.Q. Evolutionary game analysis of external knowledge transfer in the process of enterprise transformation. Sci. Tech. Prog. Polic. 2012, 19, 125–129. [Google Scholar]
  37. Wang, X.Y.; Zhang, L.; Du, X.R. Industry Technology Innovation Alliance Based on Cooperation by Using Evolutionary Game Theory. Sci. Tech. Manag. Res. 2017, 9, 118–124. [Google Scholar]
  38. Zhu, L.L.; Rong, J.M.; Zhang, S.Y. Three-party Evolutionary Game and Simulation Analysis of Drug Quality Supervision under the Government Reward and Punishment Mechanism. Chin. J. Manag. Sci. 2021, 29, 55–67. [Google Scholar]
  39. Jiao, P.; Zhang, S.; Zhao, X.M. Evolutionary game of safety supervision between government and road transport enterprises based on third-party. J. Chang’an Univ. (Nat. Sci. Ed.) 2021, 41, 106–115. [Google Scholar]
  40. Zhu, Y.M.; Guo, J.X. Competition and Cooperation Strategies of Industrial Technology Innovation Strategic Alliance Enterprises: From Perspective of Asymmetric Learning Ability. Sci. Tech. Manag. 2020, 20, 133–141. [Google Scholar]
  41. Ding, Y.Y. Evolutionary Game Analysis of Industrial Technological Innovation Alliance Innovation Cooperation--From the Perspective of Big Data Assisted Supervision. J. Indust. Tech. Econ. 2022, 7, 35–41. [Google Scholar]
  42. Huang, R.; Xu, Q.; Li, X.W. Evolutionary Game Study on Digital Transformation of Cultural Industry. Theor. Pract. Fina. Econ. 2021, 2, 125–133. [Google Scholar]
  43. Meng, F.S.; Zhao, G.; Xu, Y. Research on Intelligent Transformation and Upgrading Evolution Game of High-end Equipment Manufacturing Enterprises Based on Digitalization. Sci. Manag. 2019, 5, 89–97. [Google Scholar]
  44. Xu, H.D.; Wang, J.H. The Digital Transformation Evolution Game of Manufacturing Considering Government Subsidies. J. Fina. Econ. 2023, 1, 51–60. [Google Scholar]
  45. Fan, Z.F.; Tao, Y.P.; Gong, Y. Can Government Subsidies Promote the Digital Transformation of Manufacturing Companies? Analysis of Digital Transformation Behavior of Manufacturing Enterprises Based on Evolutionary Game. J. Tech. Econ. 2022, 22, 128–139. [Google Scholar]
  46. Li, Y.; Hao, C.F. Evolutionary Game Analysis of Military Manufacturing Enterprises and Transformation Service Providers Under the Background of Digital Transformation. Math. Pract. Theor. 2022, 52, 24–35. [Google Scholar]
  47. Yang, L.; Pan, G.H.; Hou, G.S. Behavior Evolution of Key Participants in Digital Transformation of SMEs. Sci. Tech. Manag. 2022, 42, 112–123. [Google Scholar]
  48. Chen, Q.; Li, J.X.; Chen, Z. Evolutionary game study on digital cooperation of construction enterprises. J. Fujian Univer. Tech. 2021, 19, 574–580. [Google Scholar]
  49. Lv, L.; Li, H.L.; Wang, Z.; Zhang, C.; Qiao, R. Evolutionary game analysis for rent-seeking behavior supervision of major infrastructure projects based on prospect theory. J. Civ. Eng. Manag. 2021, 28, 6–24. [Google Scholar] [CrossRef]
  50. Friedman, D. On economic application of evolutionary game theory. J. Evol. Econ. 1998, 8, 15–43. [Google Scholar] [CrossRef] [Green Version]
Figure 1. Game model of construction enterprises, service providers, and government.
Buildings 13 00922 g001
Figure 2. Phase diagram for strategy evolution of the construction enterprise.
Buildings 13 00922 g002
Figure 3. Phase diagram for strategy evolution of the construction service provider.
Buildings 13 00922 g003
Figure 4. Phase diagram for the strategy evolution of the government.
Buildings 13 00922 g004
Figure 5. System evolution path diagram under the initial strategy.
Buildings 13 00922 g005
Figure 6. The impact of different tax refund ratios α on the enterprise, service provider, and government.
Buildings 13 00922 g006
Figure 7. The impact of different subsidy intensities β on the enterprise, service provider, and government.
Buildings 13 00922 g007
Figure 8. The impact of different system maintenance cost coefficients ω on the enterprise, service provider, and government.
Buildings 13 00922 g008aBuildings 13 00922 g008b
Figure 9. The impact of different loan probability coefficients θ on the enterprise, service provider, and government.
Buildings 13 00922 g009aBuildings 13 00922 g009b
Figure 10. The impact of different reward F on the government.
Buildings 13 00922 g010
Figure 11. The impact of different fines W on the government.
Buildings 13 00922 g011
Figure 12. The result of 100 evolutions of arrays 1, 2, and 3.
Buildings 13 00922 g012
Table 1. The meaning of the variables and parameters in the perceived payoff matrix.
SymbolsDescription
x The probability of digital transformation.
y The probability of the service provider’s system solution strategy.
z The probability of an active promotion strategy for the construction enterprise.
R D The enterprise will obtain an income when the enterprise chooses the base solution strategy.
R S The enterprise chooses the system solution strategy; the enterprise obtains an income.
α The tax refund proportion.
T The amount of tax.
C E The amount that the enterprise needs to invest in the digital transformation.
ω The cost–benefit coefficient.
θ The probability coefficient of loans.
L The total loans.
R P The service provider can obtain direct benefits regardless of the solution that is provided.
C P D The amount the service provider must pay to provide the basic solution.
C P S The cost of providing the system solution.
β The government’s subsidy coefficient for service providers.
M i Enterprises’ tax payments when different solutions are provided.
U i The market influence of service providers.
C Z The cost of supervision, publicity, promotion, and guidance, as paid by the local government.
R Z The additional social benefits obtained by the local construction industry’s digital economy.
F Prize from the superior government.
W Local government punished by superior authorities.
Table 2. The payment matrix for the game model including enterprise, service provider, and government.
EnterpriseService ProvidersGovernment
Active Promotion z Negative   Promotion   1 z
Digital transformation
x
system solution
y
R S ω R S C E + α T + θ L R S ( 1 ω ) R S + θ L C E
ω R S + R P C P S + β M S + U S ω R S + R P C P S + U S
F + R Z C Z α T β M S R Z
basic solution
1 y
R D C E + α T + θ L R D C E + θ L
R P C P D + β M D + U D R P C D + U D
F C Z α T β M D 0
Non-digital transformation
1 x
system solution
y
0 0
β M S C P S C P S
C Z β M S W
basic solution
1 y
0 0
β M D C P D C P D
C Z β N D W
Table 3. The eigenvalues of each equilibrium point.
Equilibrium Point λ 1 , λ 2 , λ 3
E 1 ( 0 , 0 , 0 ) R D C E + θ L , ( C P S C P D ) ,   W C Z β M D
E 2 ( 1 , 0 , 0 ) C E R D θ L , ( C P S C P D ) + U S U D + ω R S ,   F C Z β M D α T
E 3 ( 0 , 1 , 0 ) ( 1 ω ) R S C E + θ L ,   C P S C P D ,   W C Z β M S
E 4 ( 0 , 0 , 1 ) R D C E + θ L + α T , ( C P S C P D ) + β ( M S M D ) ,   C Z + β M D W
E 5 ( 1 , 1 , 0 ) C E θ L ( 1 ω ) R S ,   C P S C P D ( U S U D ) ω R S ,   F C Z β M S α T
E 6 ( 1 , 0 , 1 ) C E R D θ L α T ,   C P S C P D + U S U D + β ( M S M D ) + ω R S ,   C Z + β M D + α T F
E 7 ( 0 , 1 , 1 ) R S C E + θ L + α T ω R S ,   C P S C P D β ( M S M D ) ,   C Z + β M S W
E 8 ( 1 , 1 , 1 ) C E θ L α T ( 1 ω ) R S ,   C P S C P D ( U S U D ) β ( M S M D ) ω R S ,   C Z + β M S + α T F
Disclaimer/Publisher’s Note: The statements, opinions and data contained in all publications are solely those of the individual author(s) and contributor(s) and not of MDPI and/or the editor(s). MDPI and/or the editor(s) disclaim responsibility for any injury to people or property resulting from any ideas, methods, instructions or products referred to in the content.

