
Optimization of the Temperature and Thermo-Stressed State of a Concrete Dam Constructed from Particularly Lean Roller-Compacted Concrete

Abstract
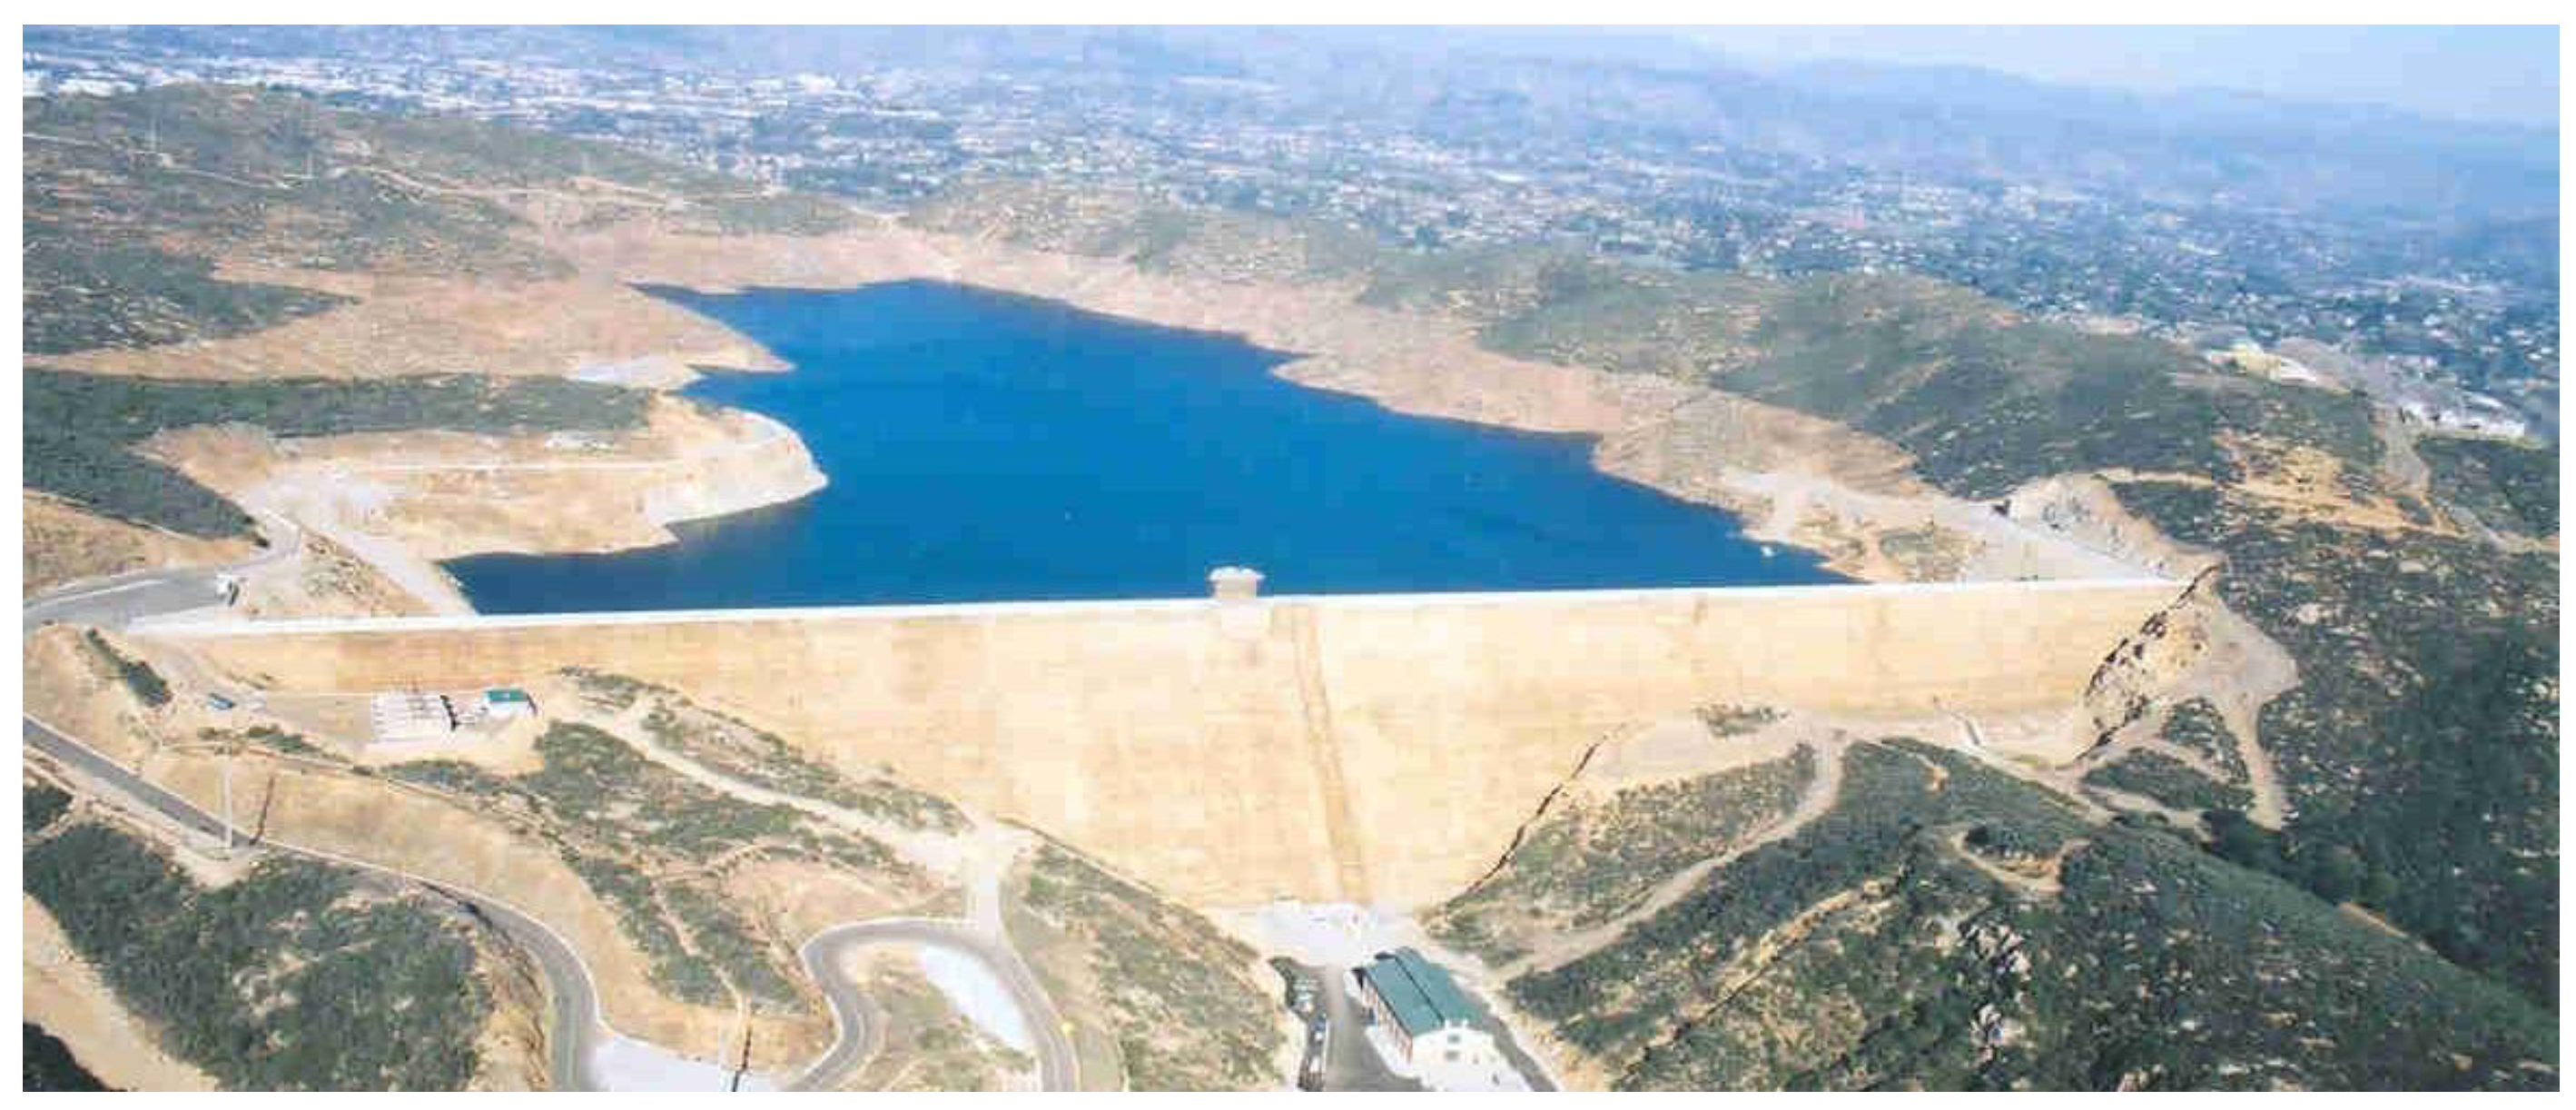
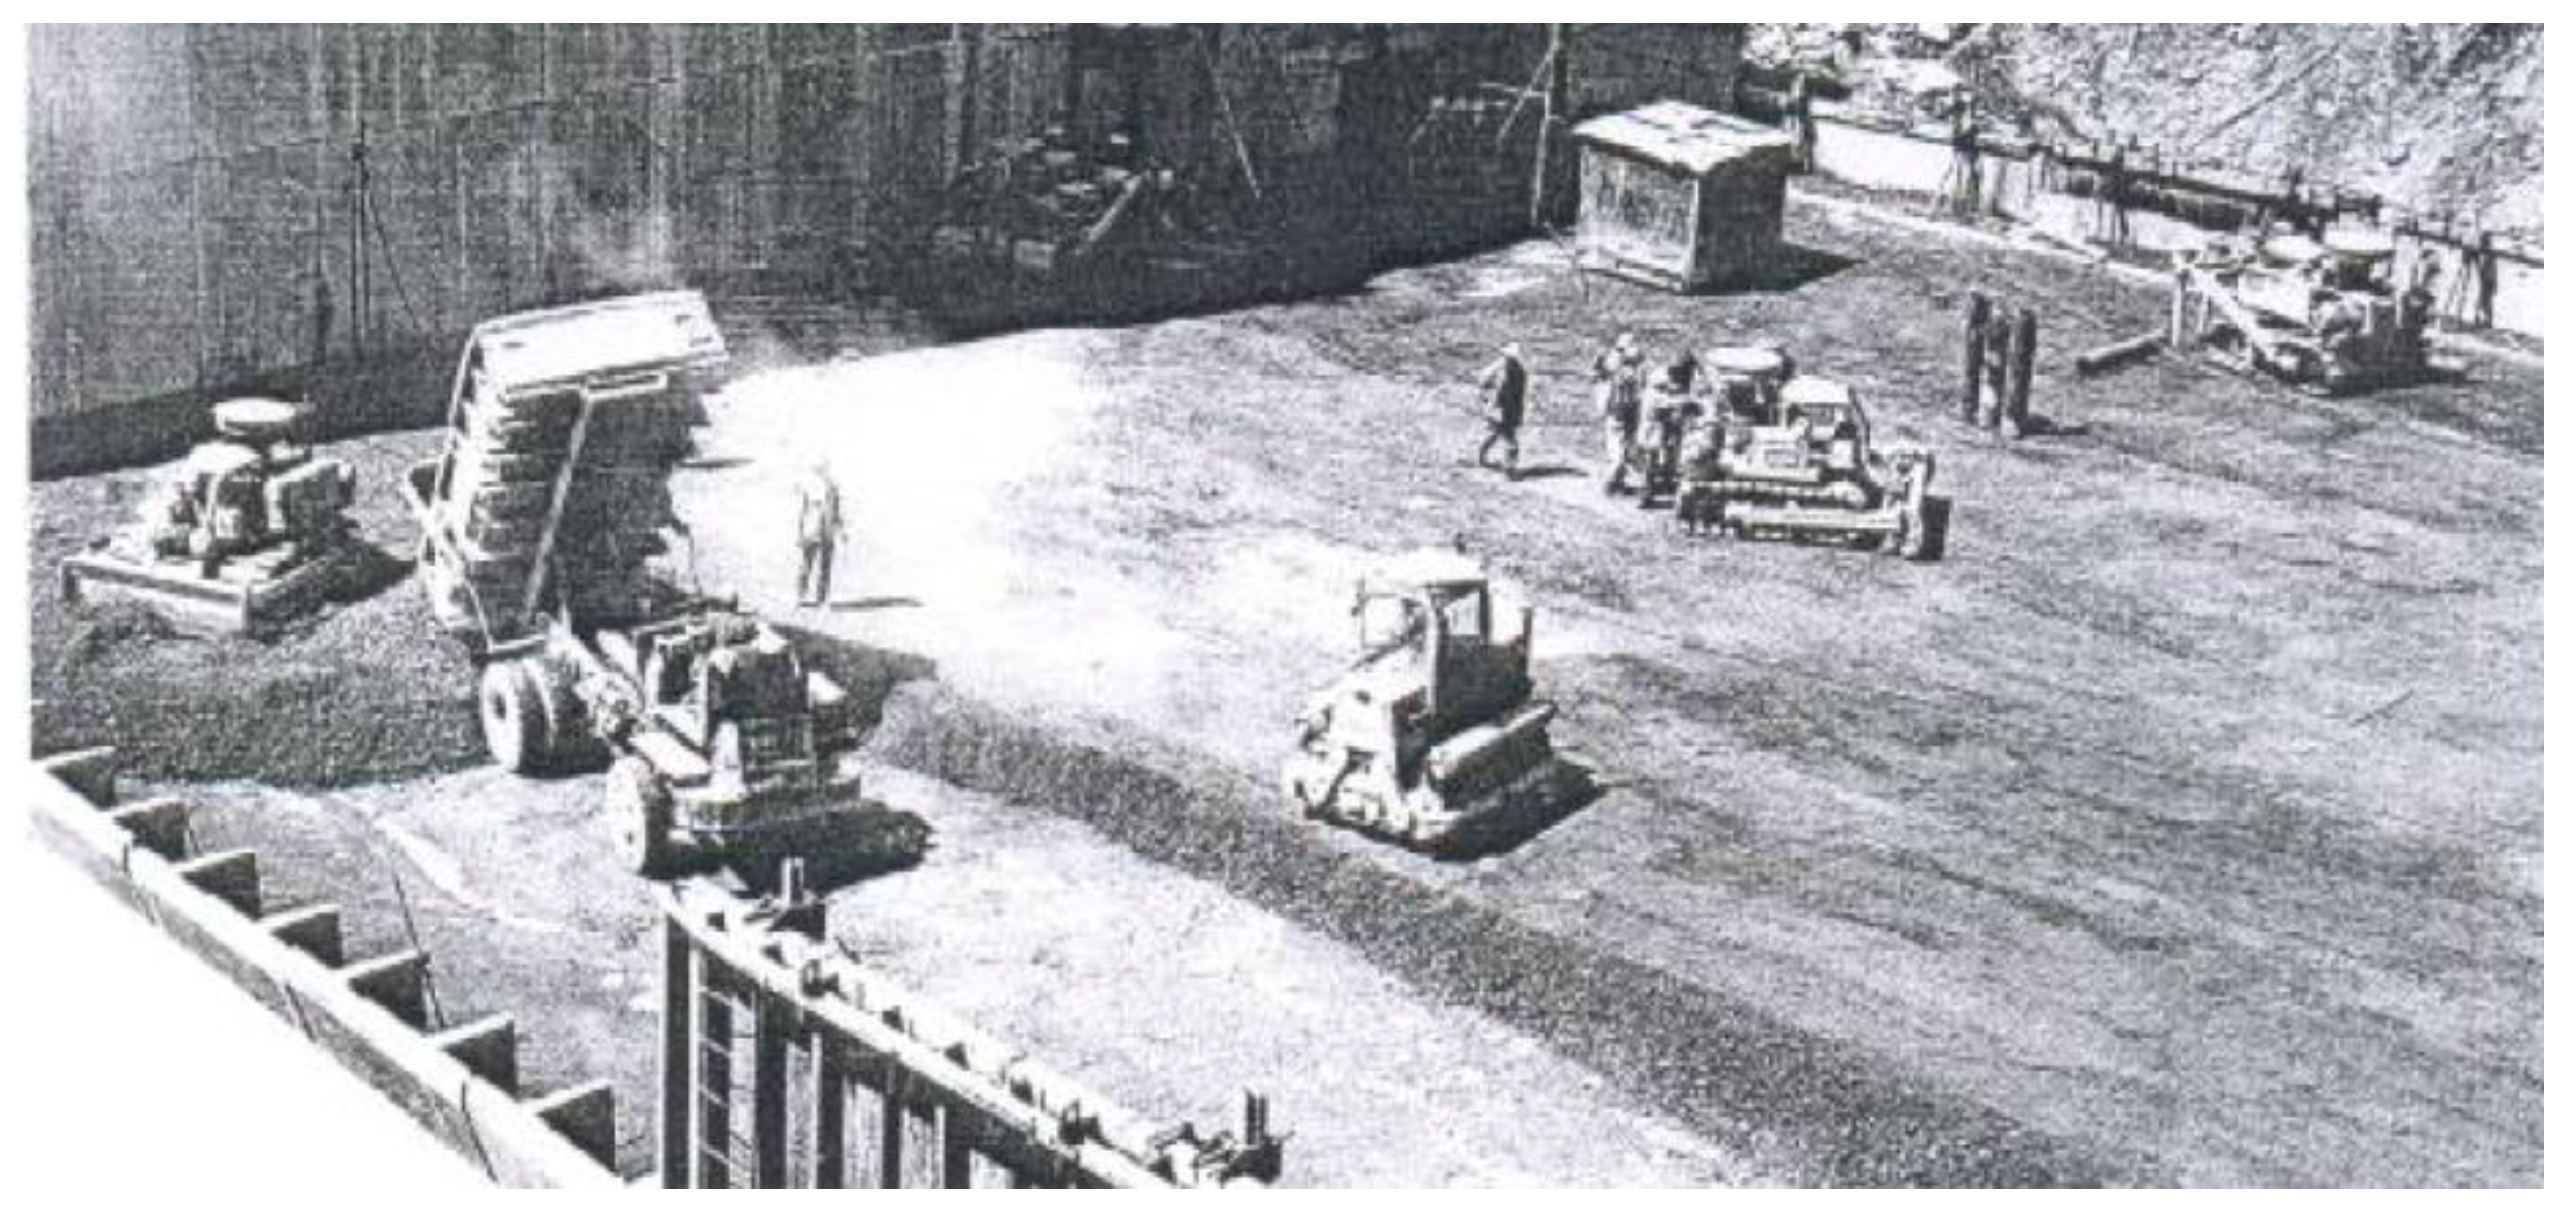
:1. Introduction
2. Materials and Techniques
2.1. Methodology for Determining the Temperature Regime
2.2. Methodology for Determining the Thermo-Stressed State
3. The Setting and Results of the Research
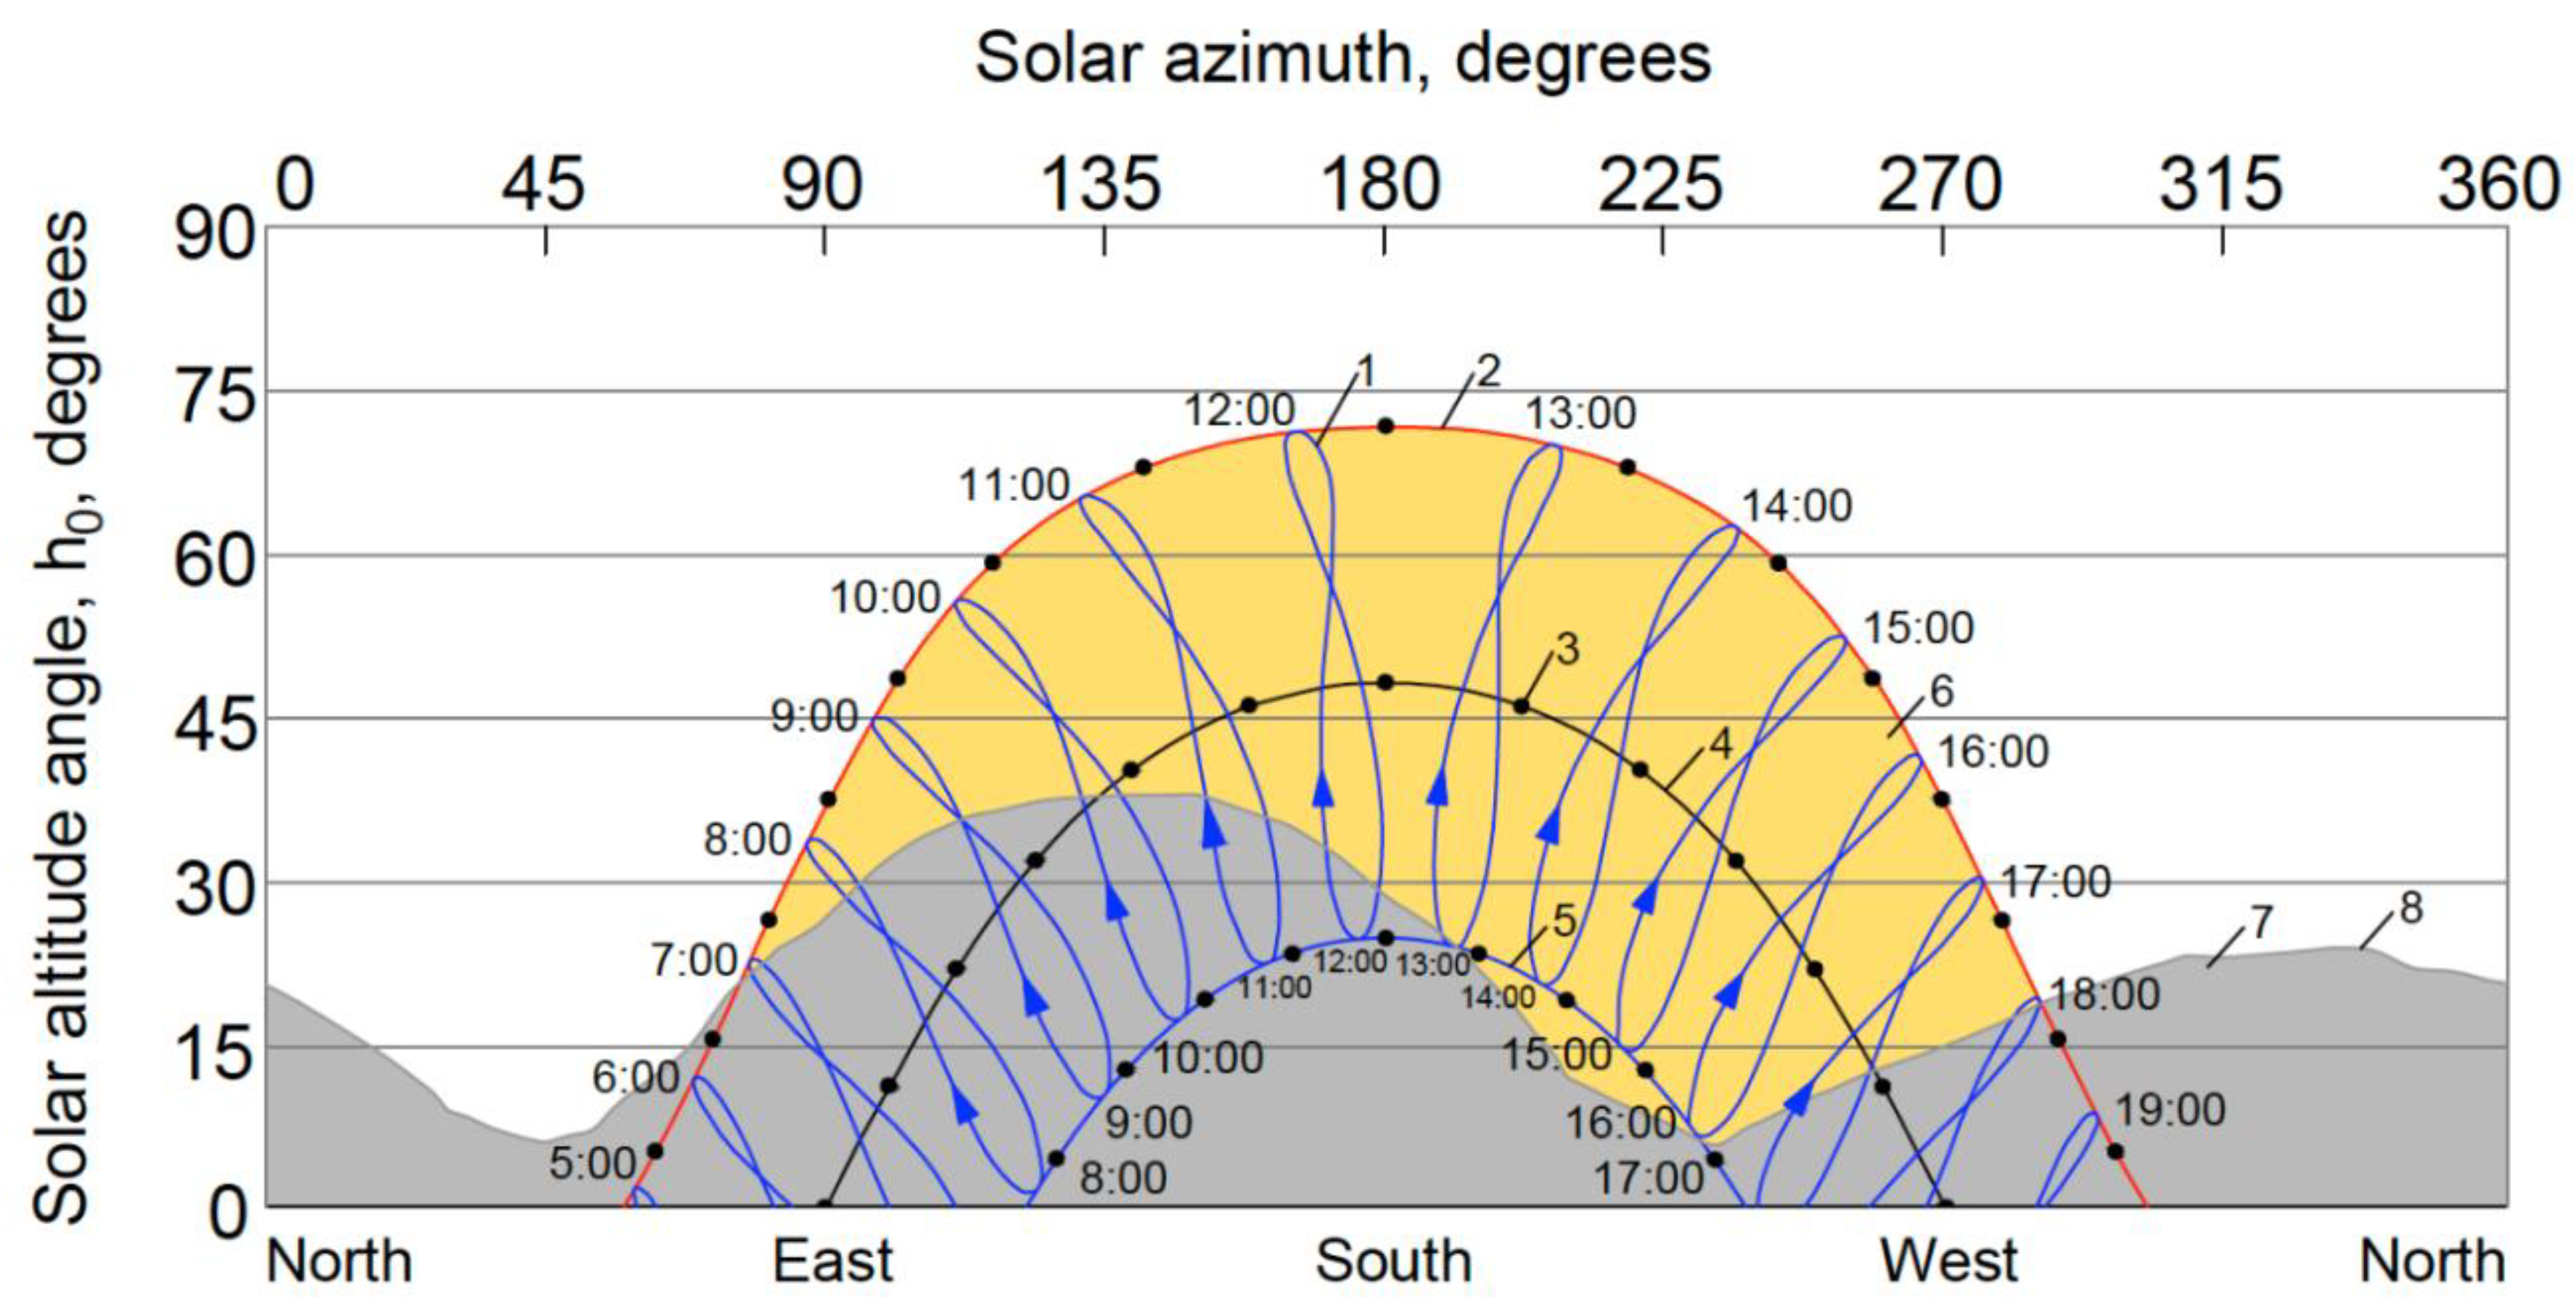
3.1. Consideration of Solar Radiation Effects
3.2. Analysis of the Impact of Existing Factors Using the Methodology of a Factor Experiment
- —consumption of cement in the mixture (varies from 70 kg/m3 to 150 kg/m3).
- —thickness of the low-cement concrete layer to be placed (0.5 m to 1.5 m).
- —heat release of cement (from 339 kJ/kg (moderate) to 387.7 kJ/kg (elevated).
- —laying temperature of low-cement concrete (+10 °C to +30 °C).
- (1)
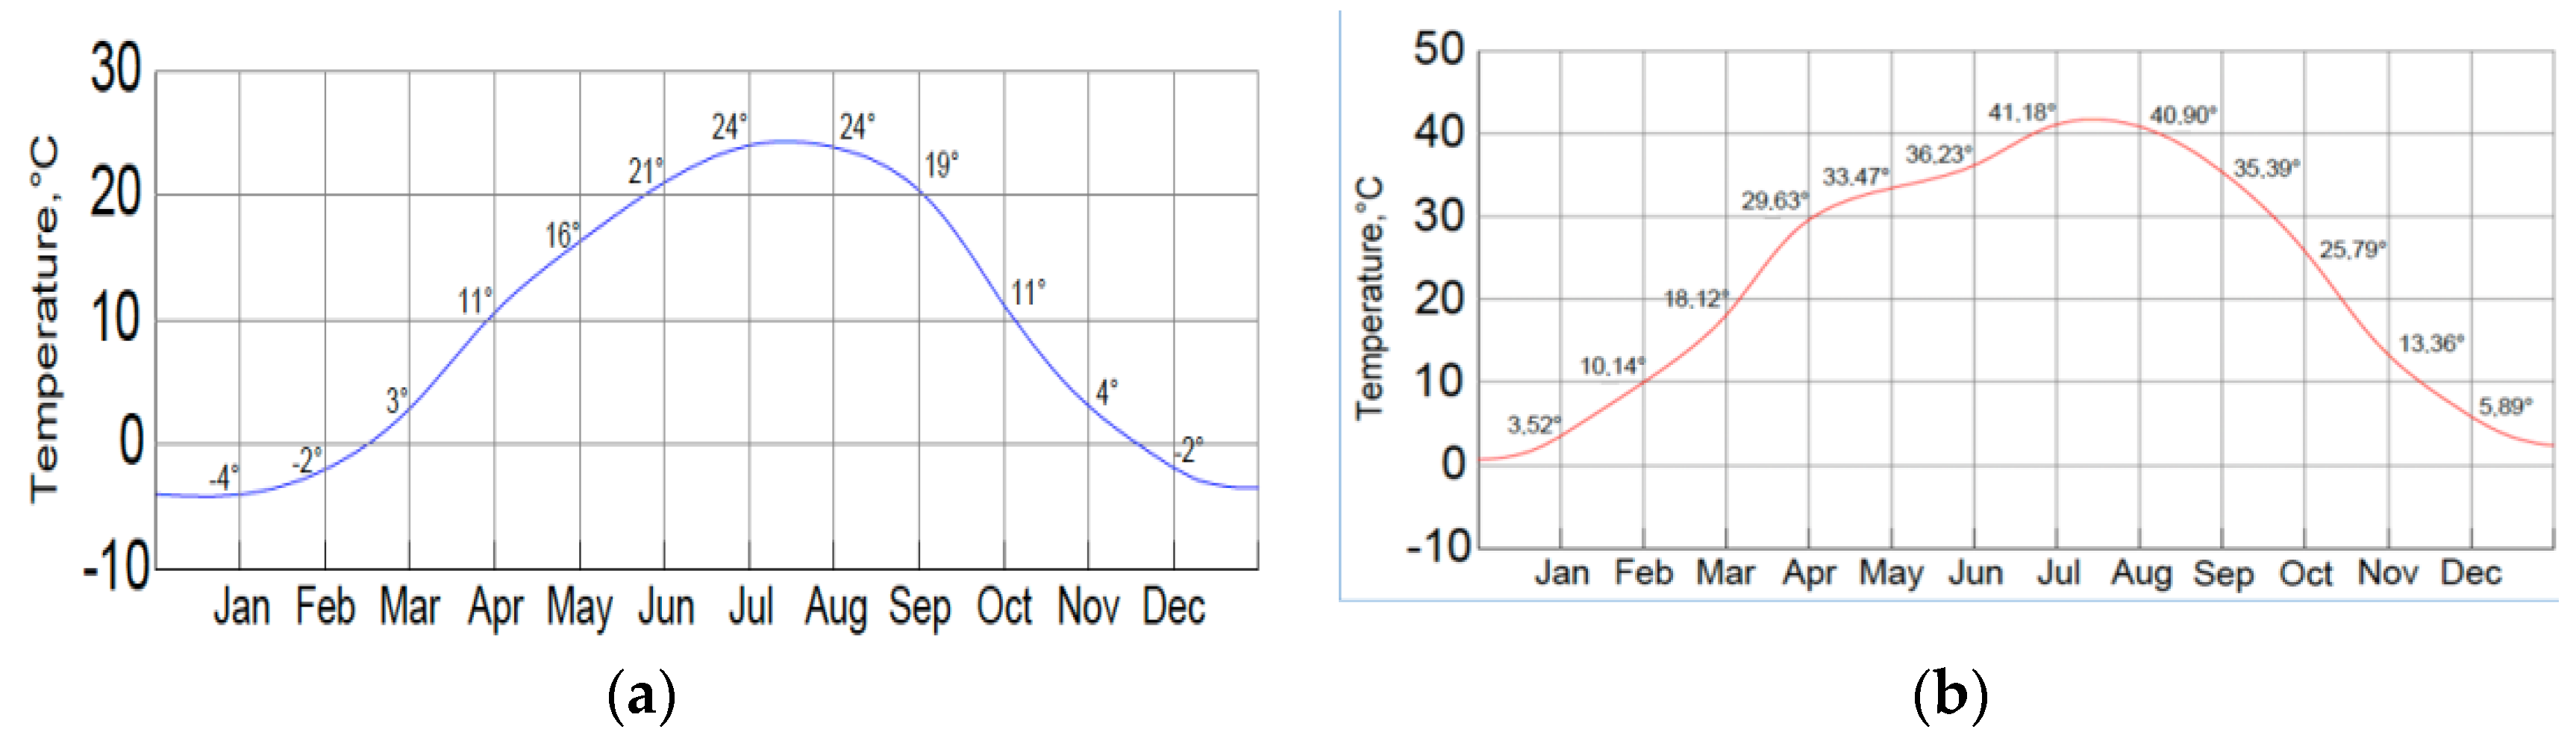
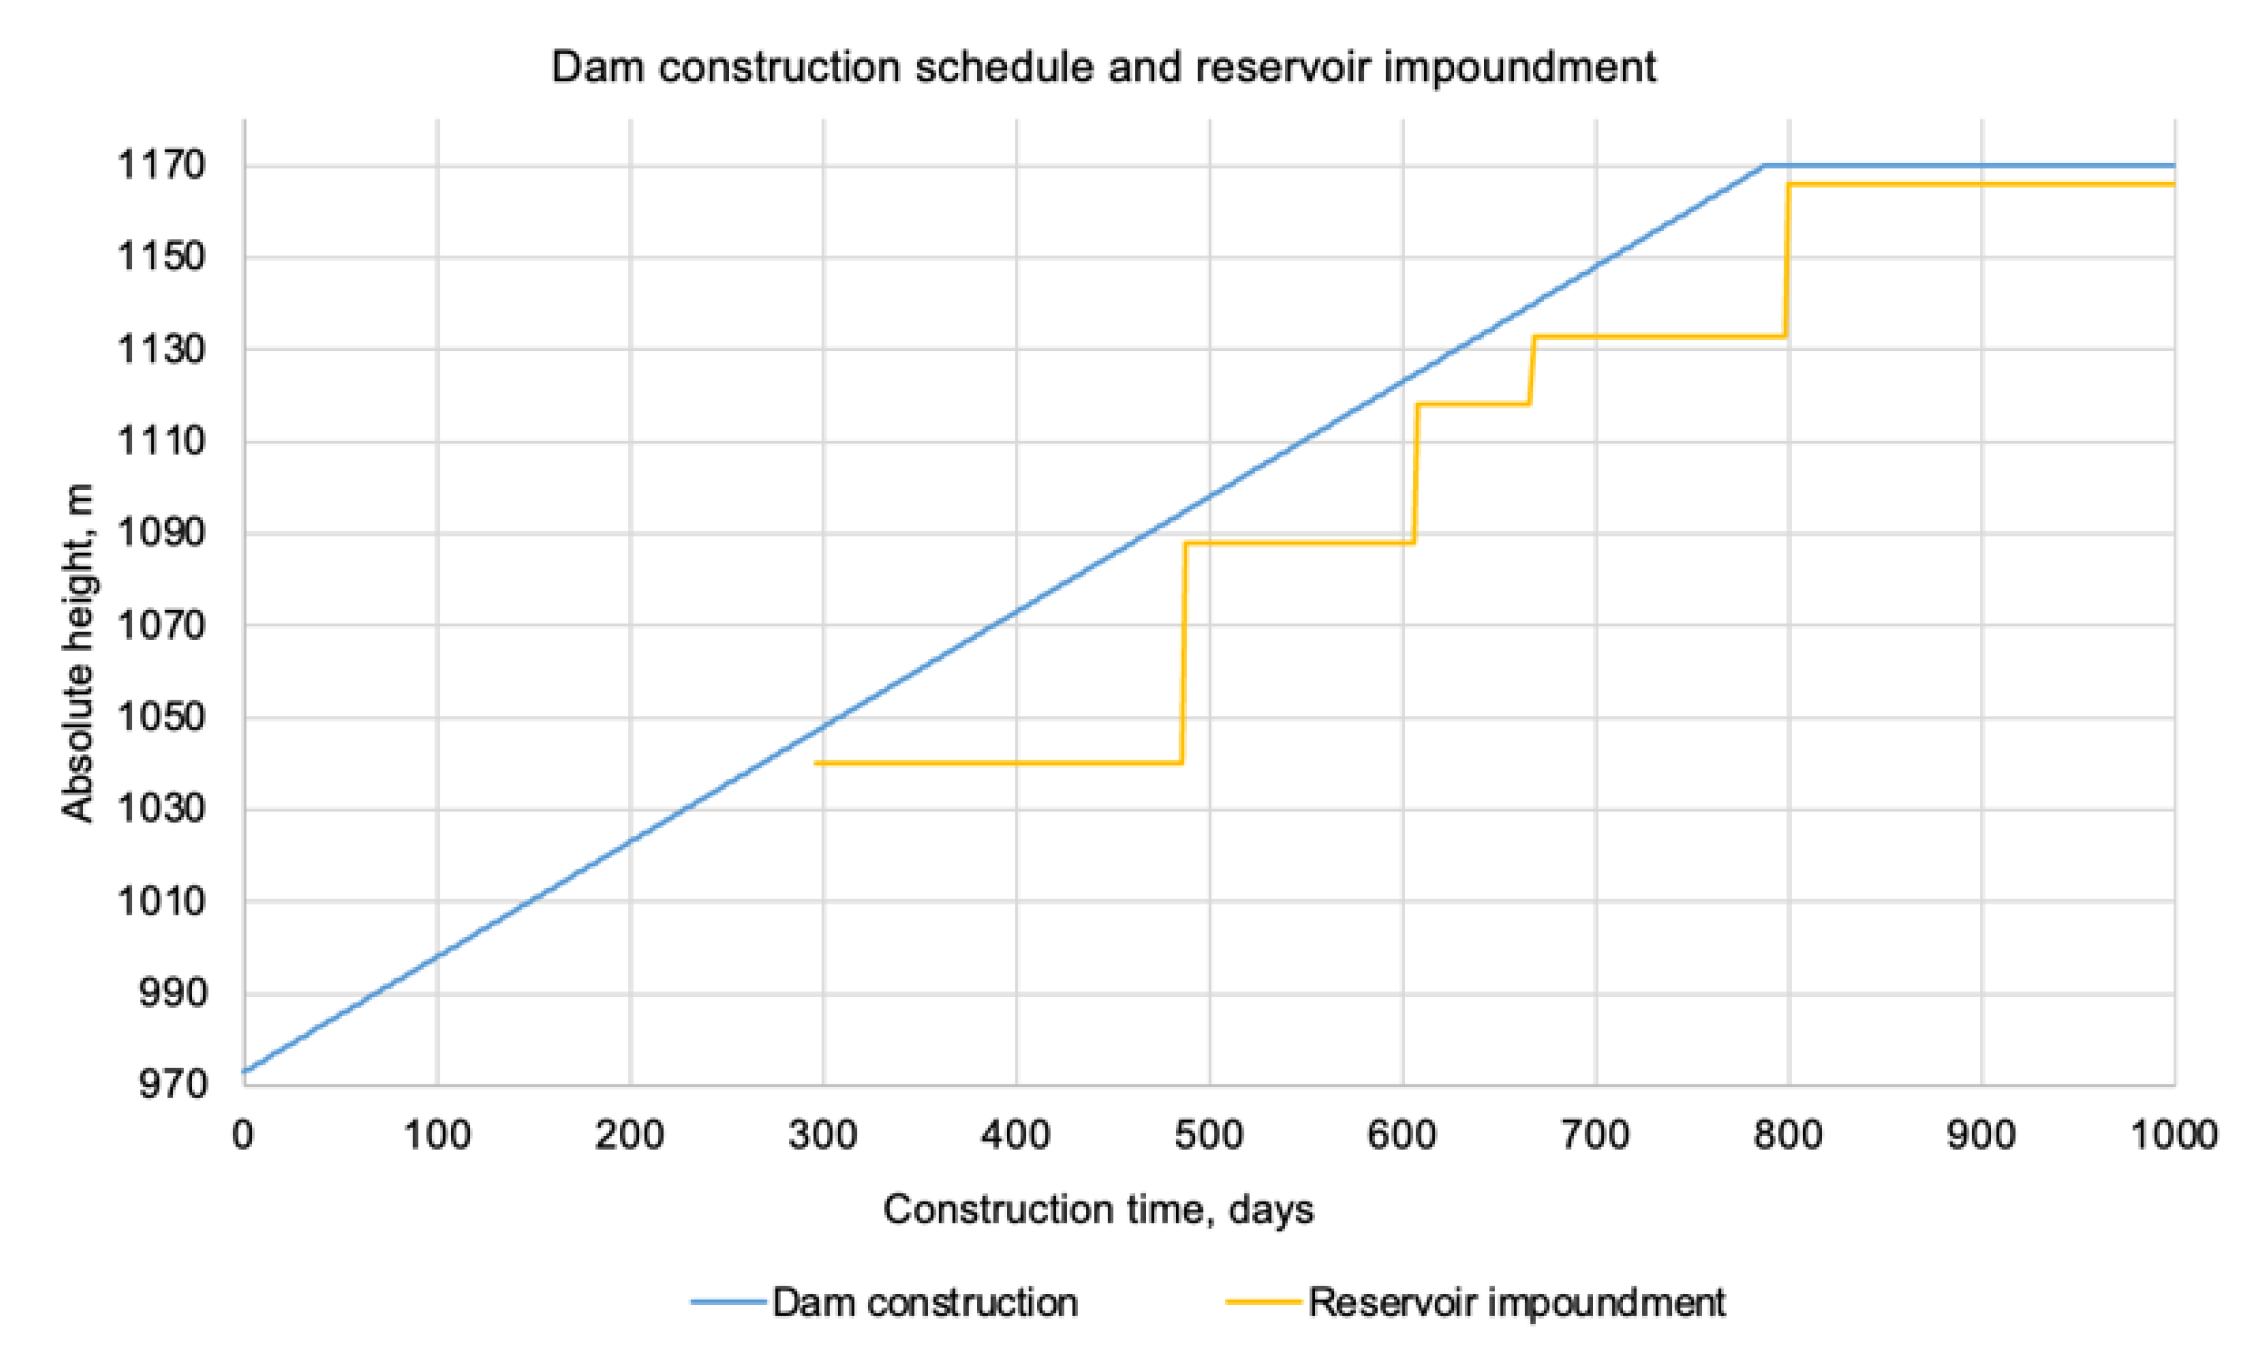
- Depending on the month when the construction work started: May or October with the corresponding ambient temperatures (according to the schedule, Figure 6).
- (2)
- (3)
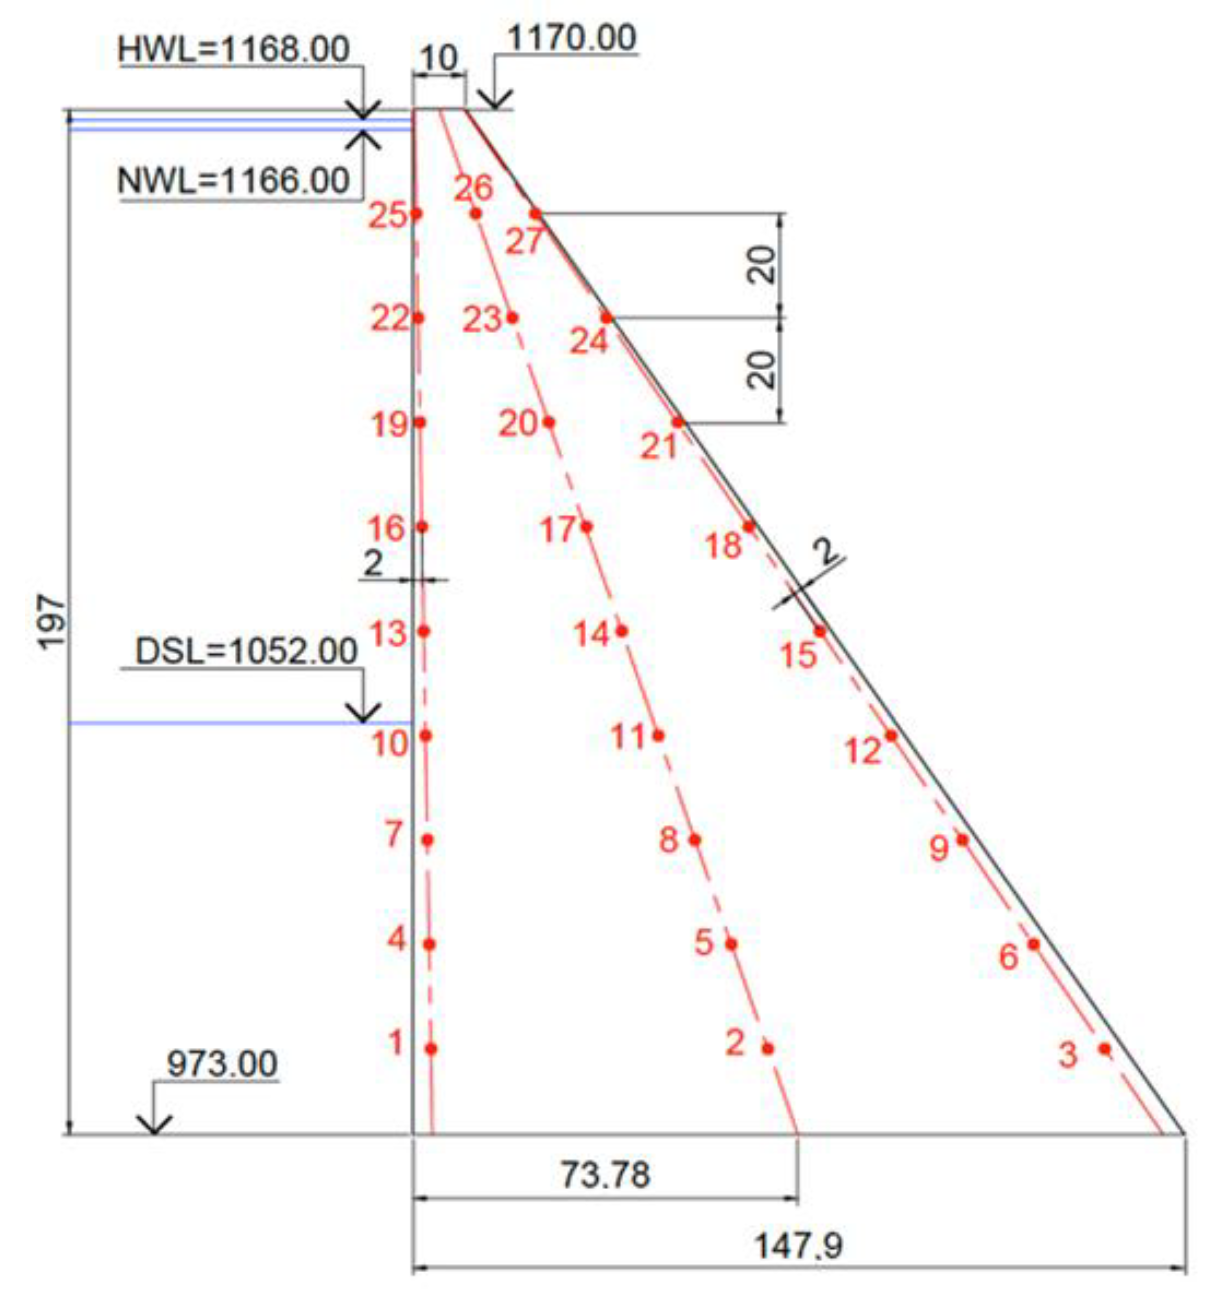
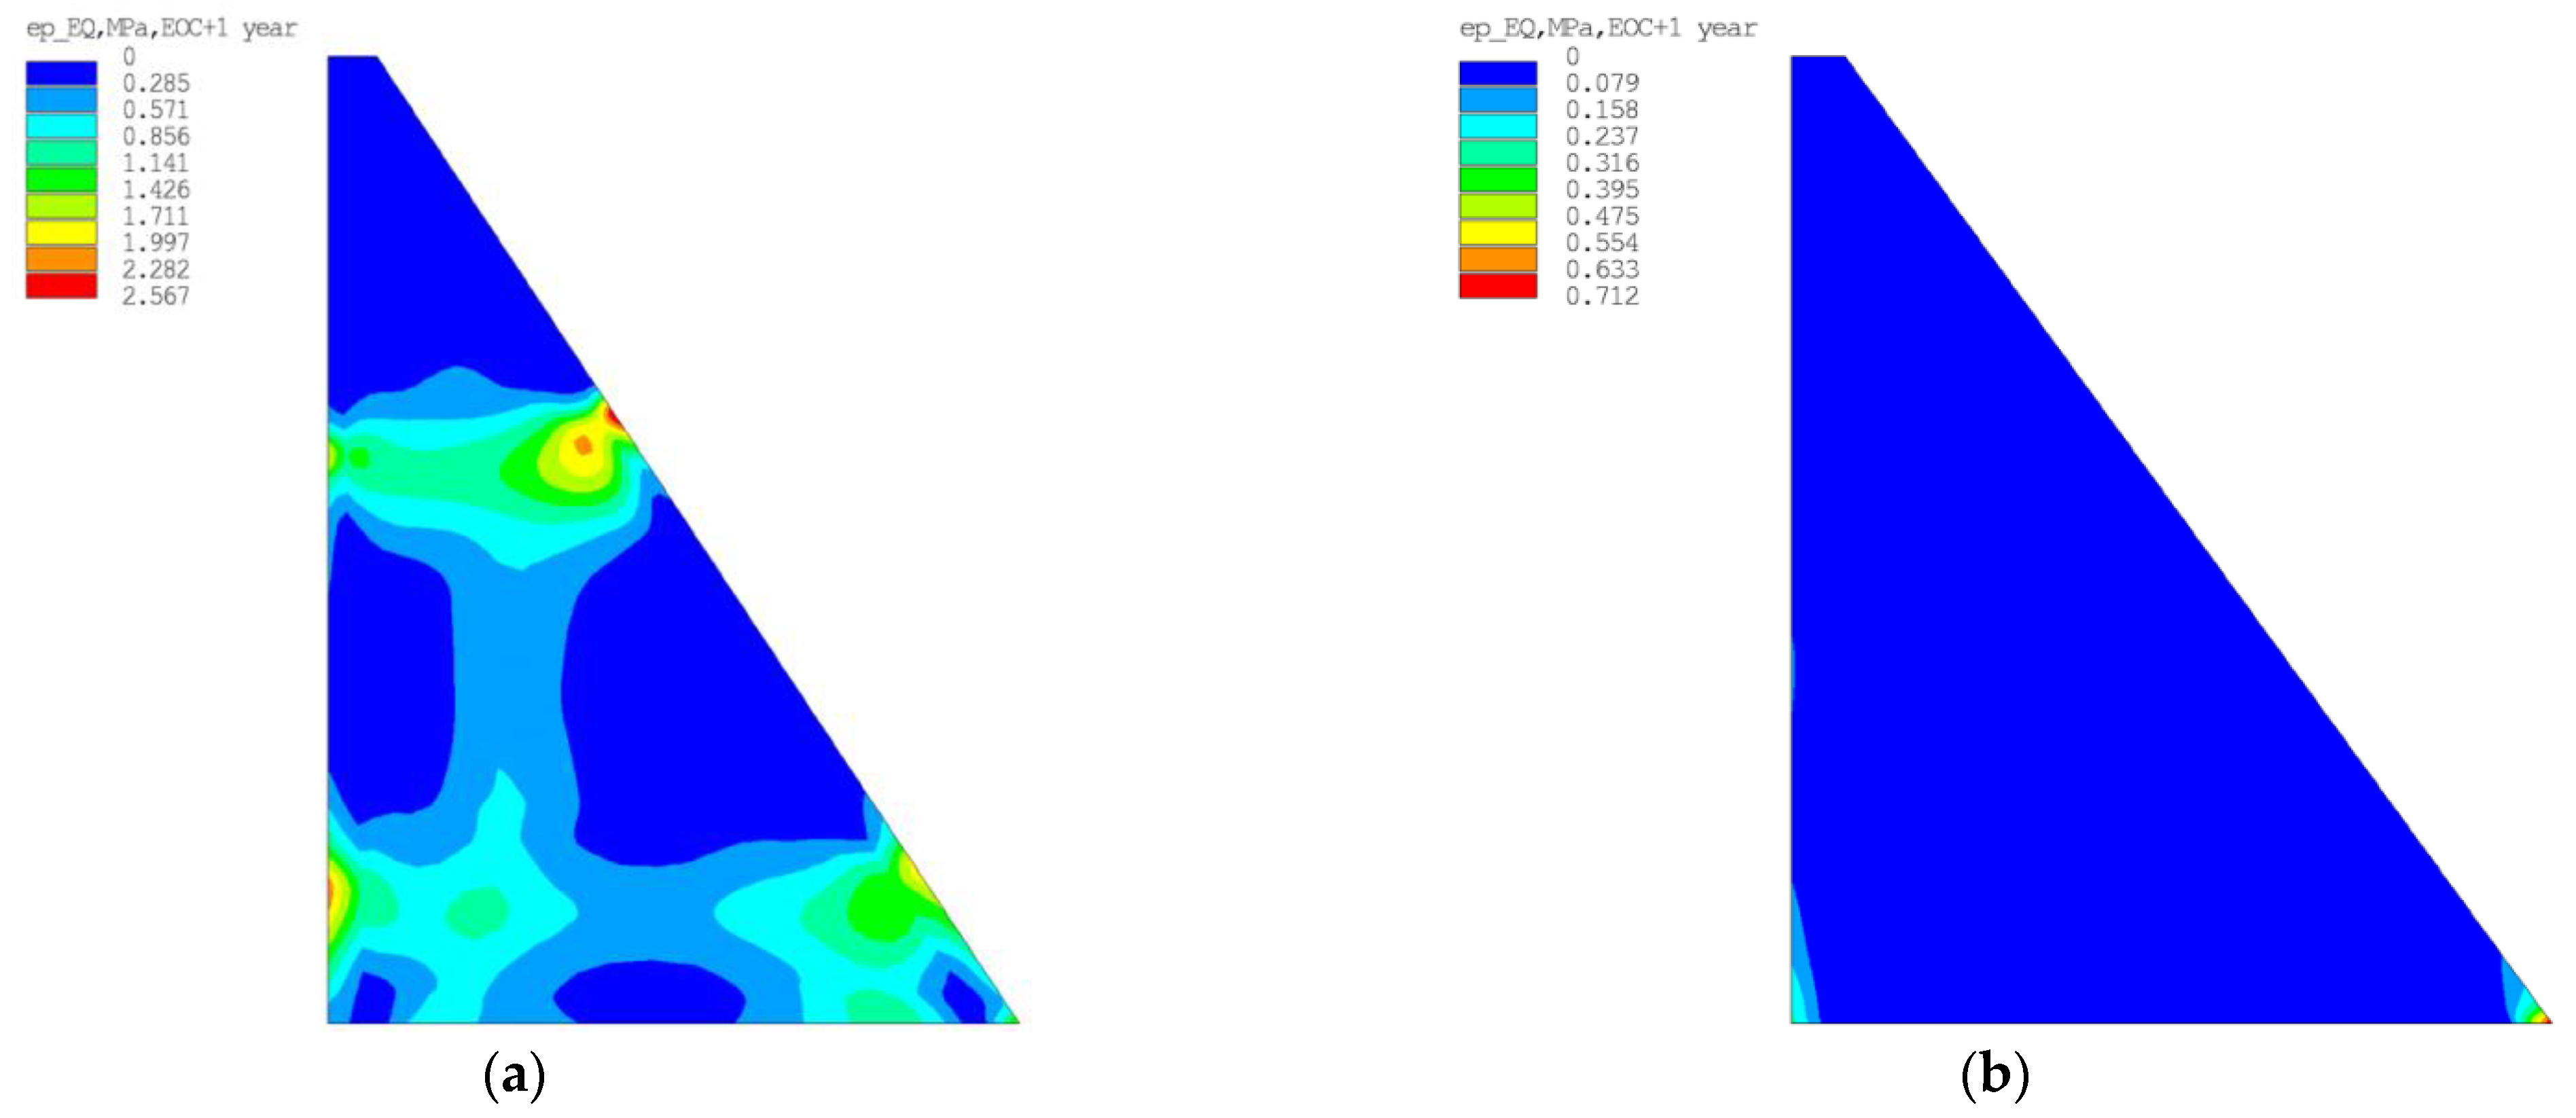
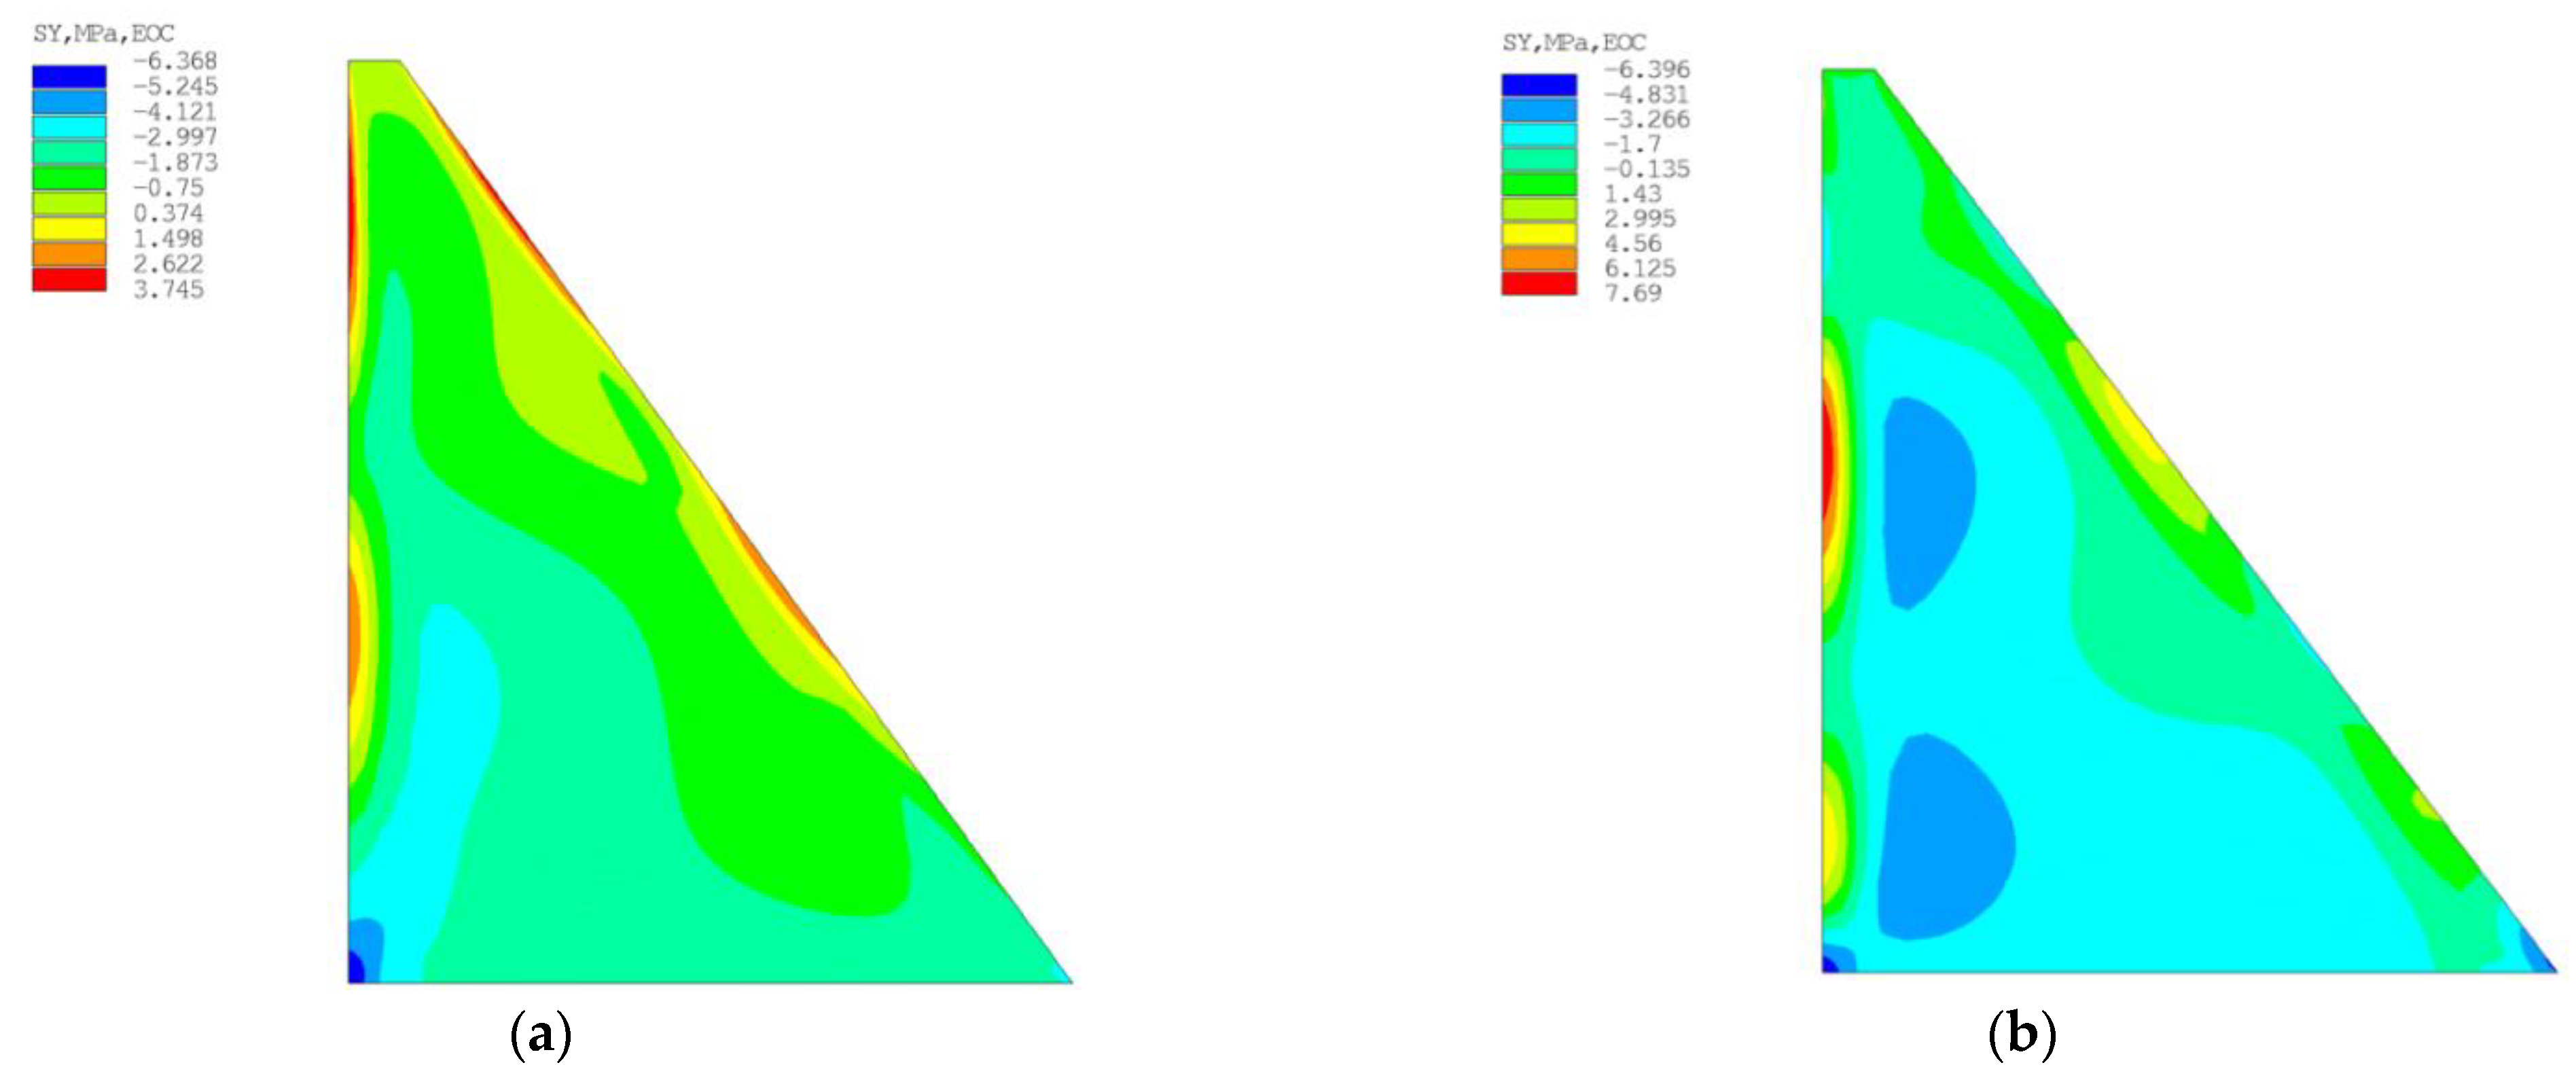
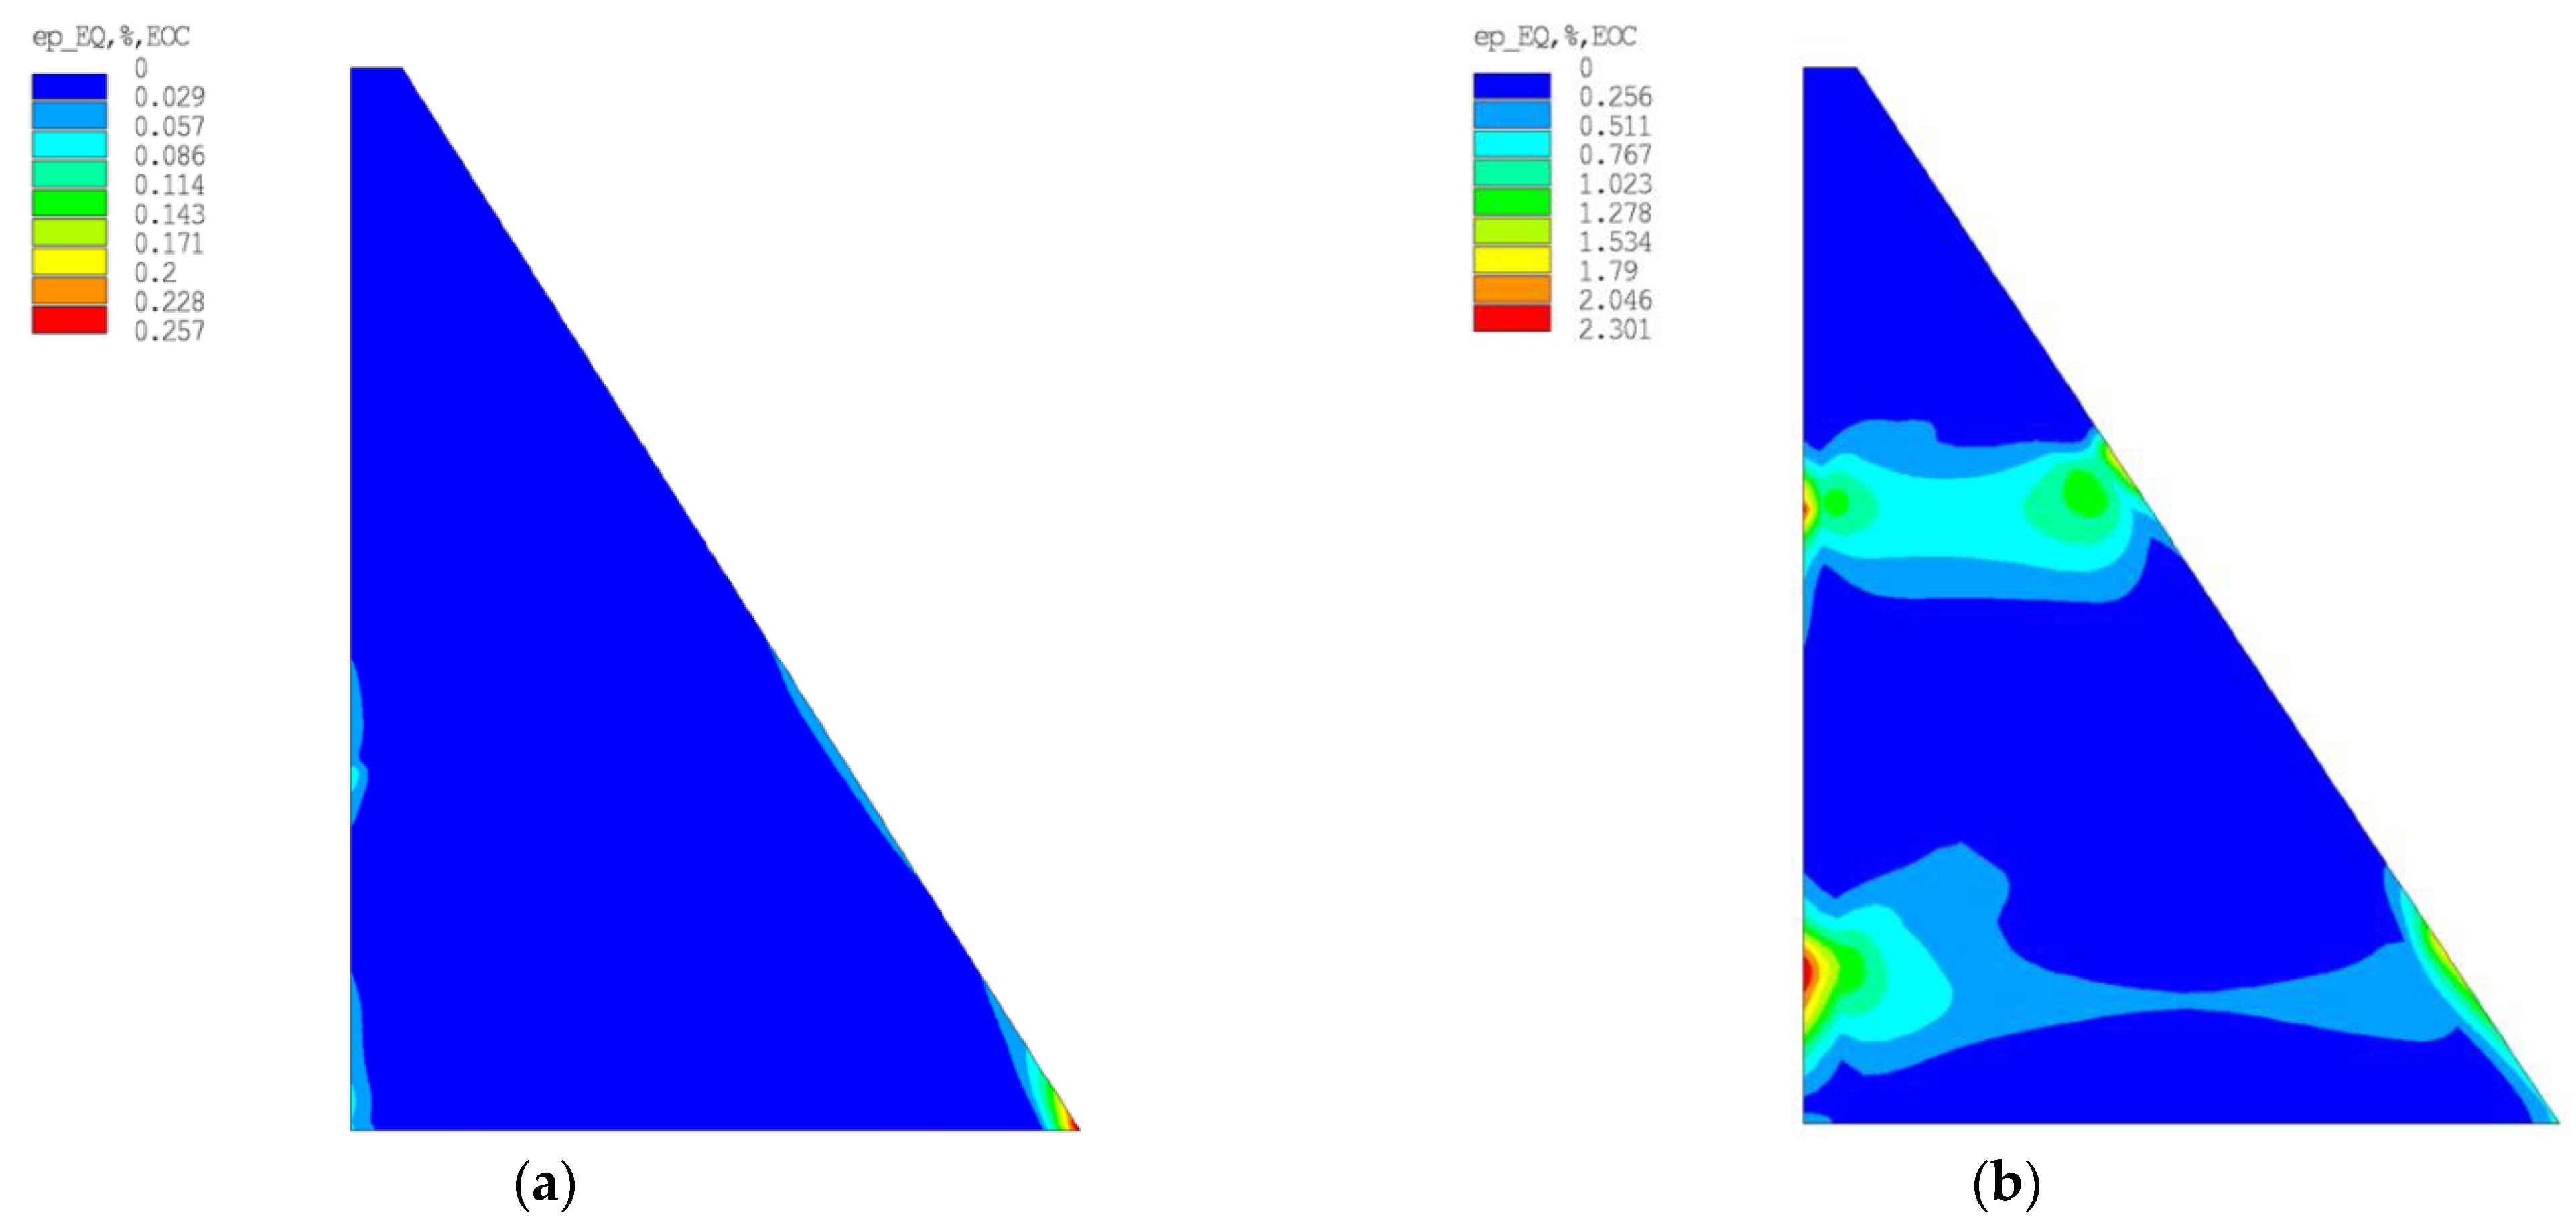
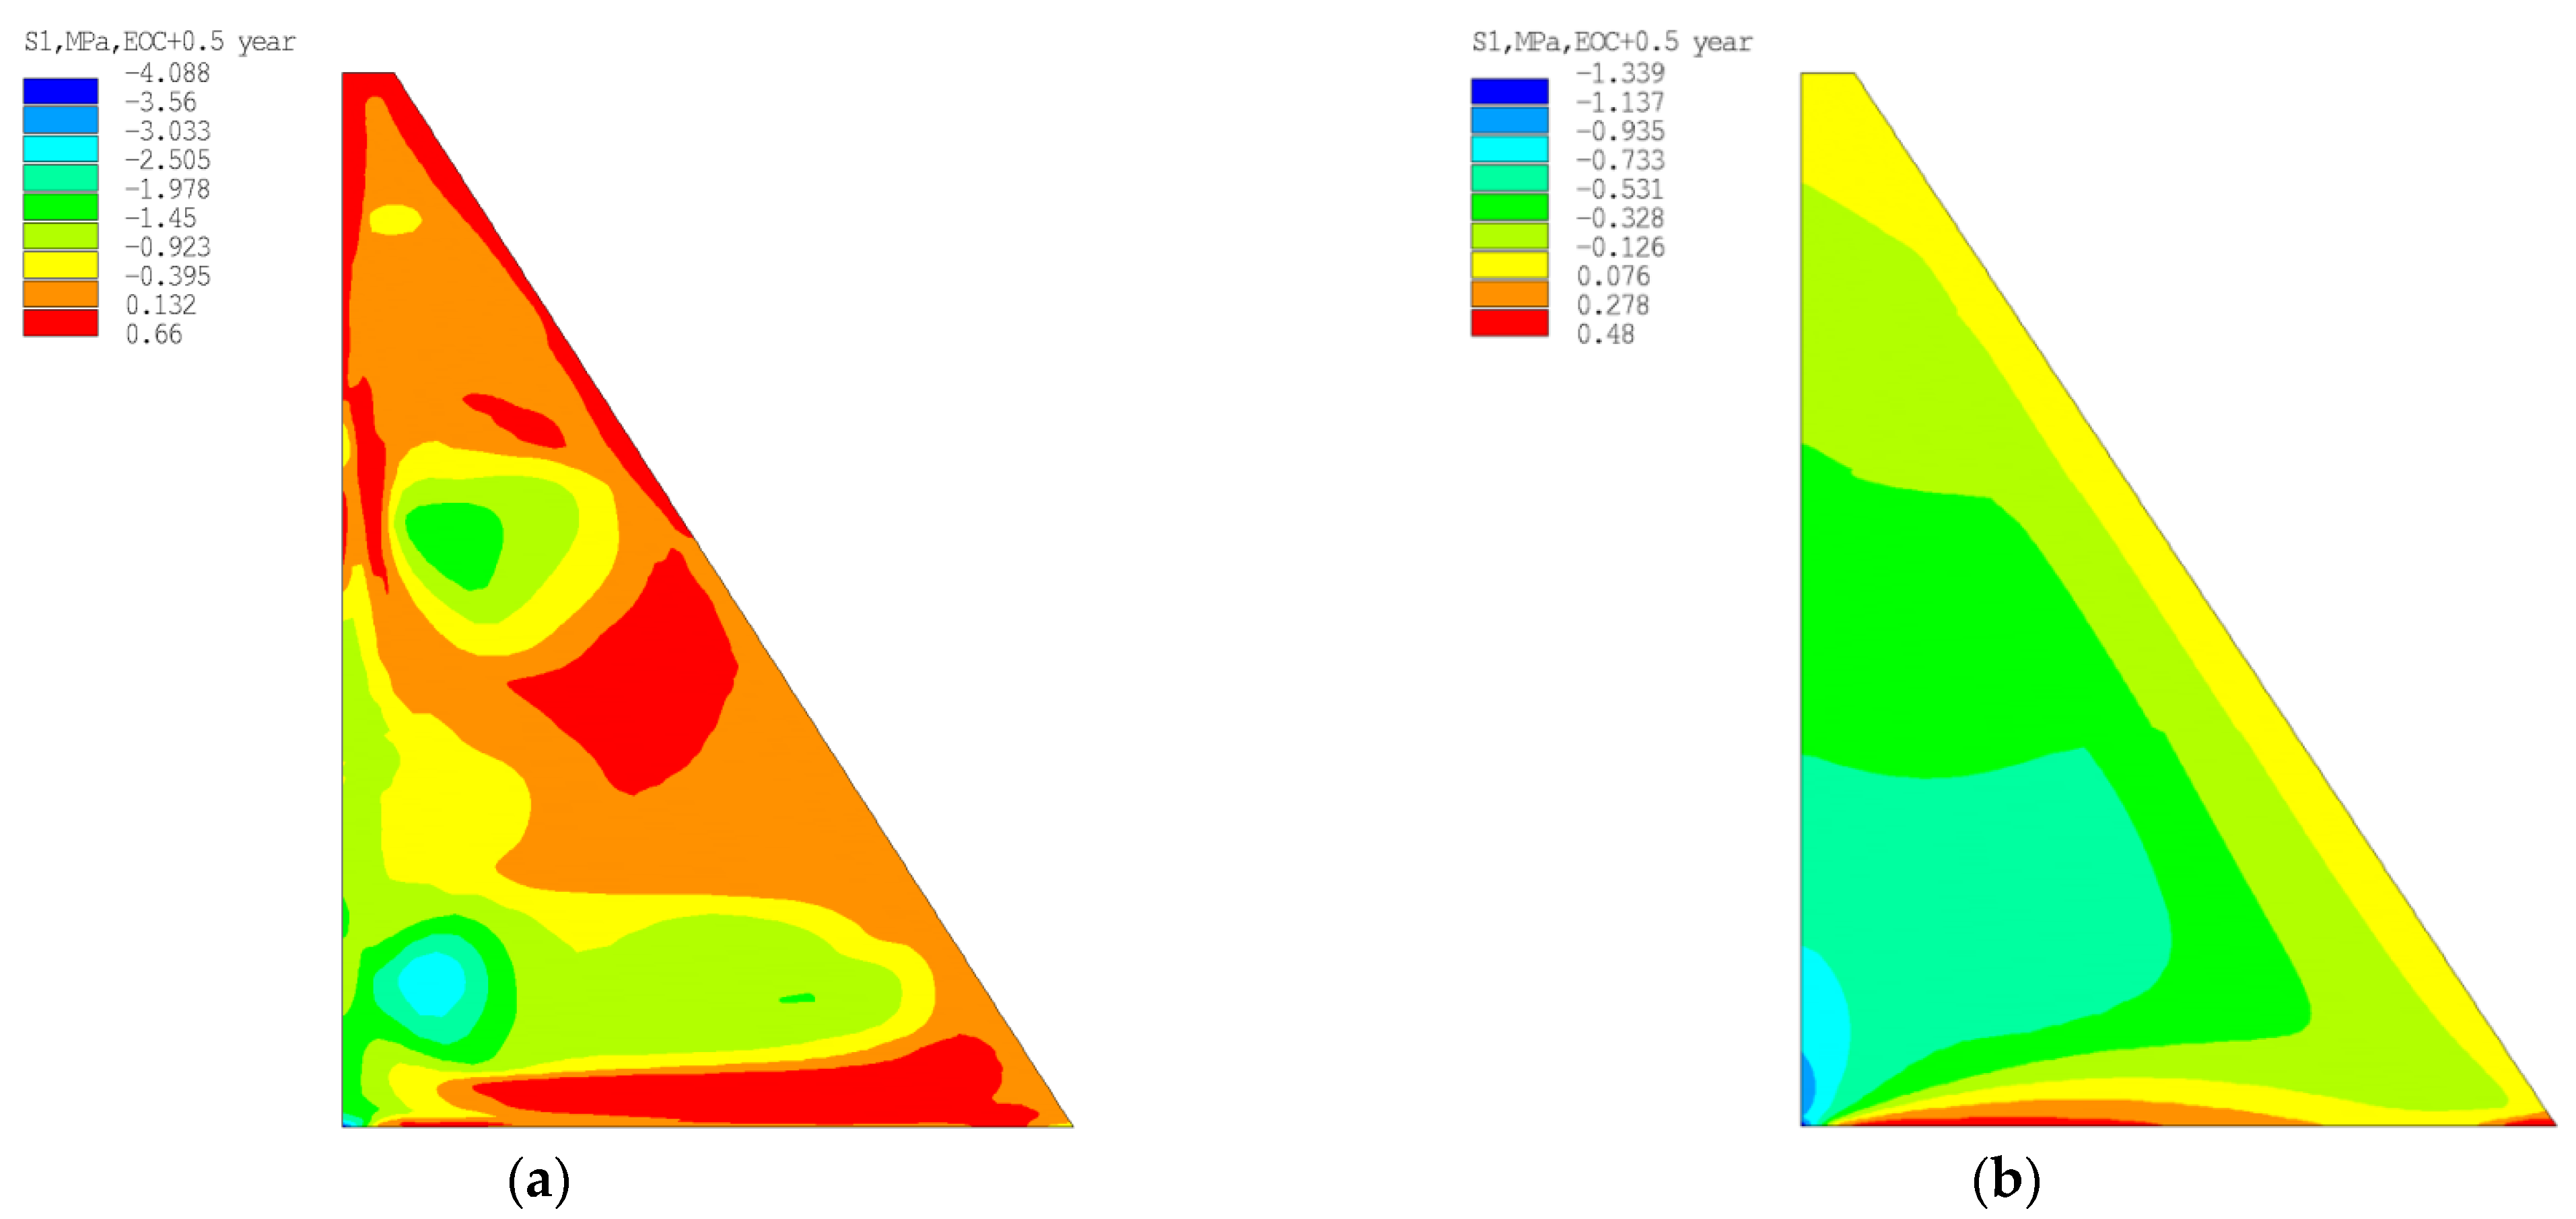
- The responses chosen were: the absolute maximum temperature in the concrete mass (°C), maximum temperatures at characteristic points 2, 8, 14, 20, 26 in the center of the mass (°C), the maximum temperature gradient between the point in the center of the mass and the point on the pressure face (°C/m), the maximum value of the main tensile stress at characteristic points 2, 8, 14, 20, 26 in the center of the massif (MPa), the maximum value of equivalent plastic deformations at characteristic points 2, 8, 14, 20, 26 in the center of the massif (%). A diagram of the point locations is shown in Figure 7. All temperature calculations for all variants were carried out using the Ansys software package.
- Option 1. Beginning of concreting in May excluding solar radiation.
- Option 2. Beginning of concreting in October excluding solar radiation.
- Option 3. Beginning of concreting in May taking into account solar radiation.
- Option 4. Beginning of concreting in October taking into account solar radiation.
- All of the selected factors had a sufficiently strong influence on the values of the maximum temperature at the selected points. The cement consumption (factor ), the thickness of the concrete layer to be placed (), and the temperature of the concrete mix () had the greatest impact. Increasing cement consumption from 70 kg/m3 to 150 kg/m3 led to a significant (on average by 9.31 °C per fixing point) temperature increase in all points of the massif, reaching maximum values in the case of the concreting that started in May at point 2 (the temperature at the point with 70 kg/m3 cement content was 45.18 °C, with 150 kg/m3—54.42 °C).
- The degree and operator of the influence of the factor (the thickness of the concrete layer to be paved) depended on the placement area, the seasonality of the paving operation, and the solar radiation. When solar radiation was not taken into account and concreting started in May in massive areas of the dam, the temperature of the concrete mass decreased as the thickness of the layer of concrete that began to be placed increased (the regression equation coefficients with the clause are negative). However, for this option, the picture changed in the area at the crest of the dam, where the opposite was obtained: as the layer thickness increased the temperature rose as well. When concreting started in October, the picture was reversed: in the lower massive part of the dam, an increase in layer thickness led to a rise in temperature, while in the area near the crest, the opposite was true.
- For options with solar radiation in most areas of the dam, with an increasing layer thickness, there was a decrease in the mass temperature due to lower solar heating in thicker layers. The exception is the area near the base (point 2) for the option with the start of construction in low air temperatures during the autumn-winter period of the year. Paving in thin layers involved the intensive cooling of the concrete with cold air.
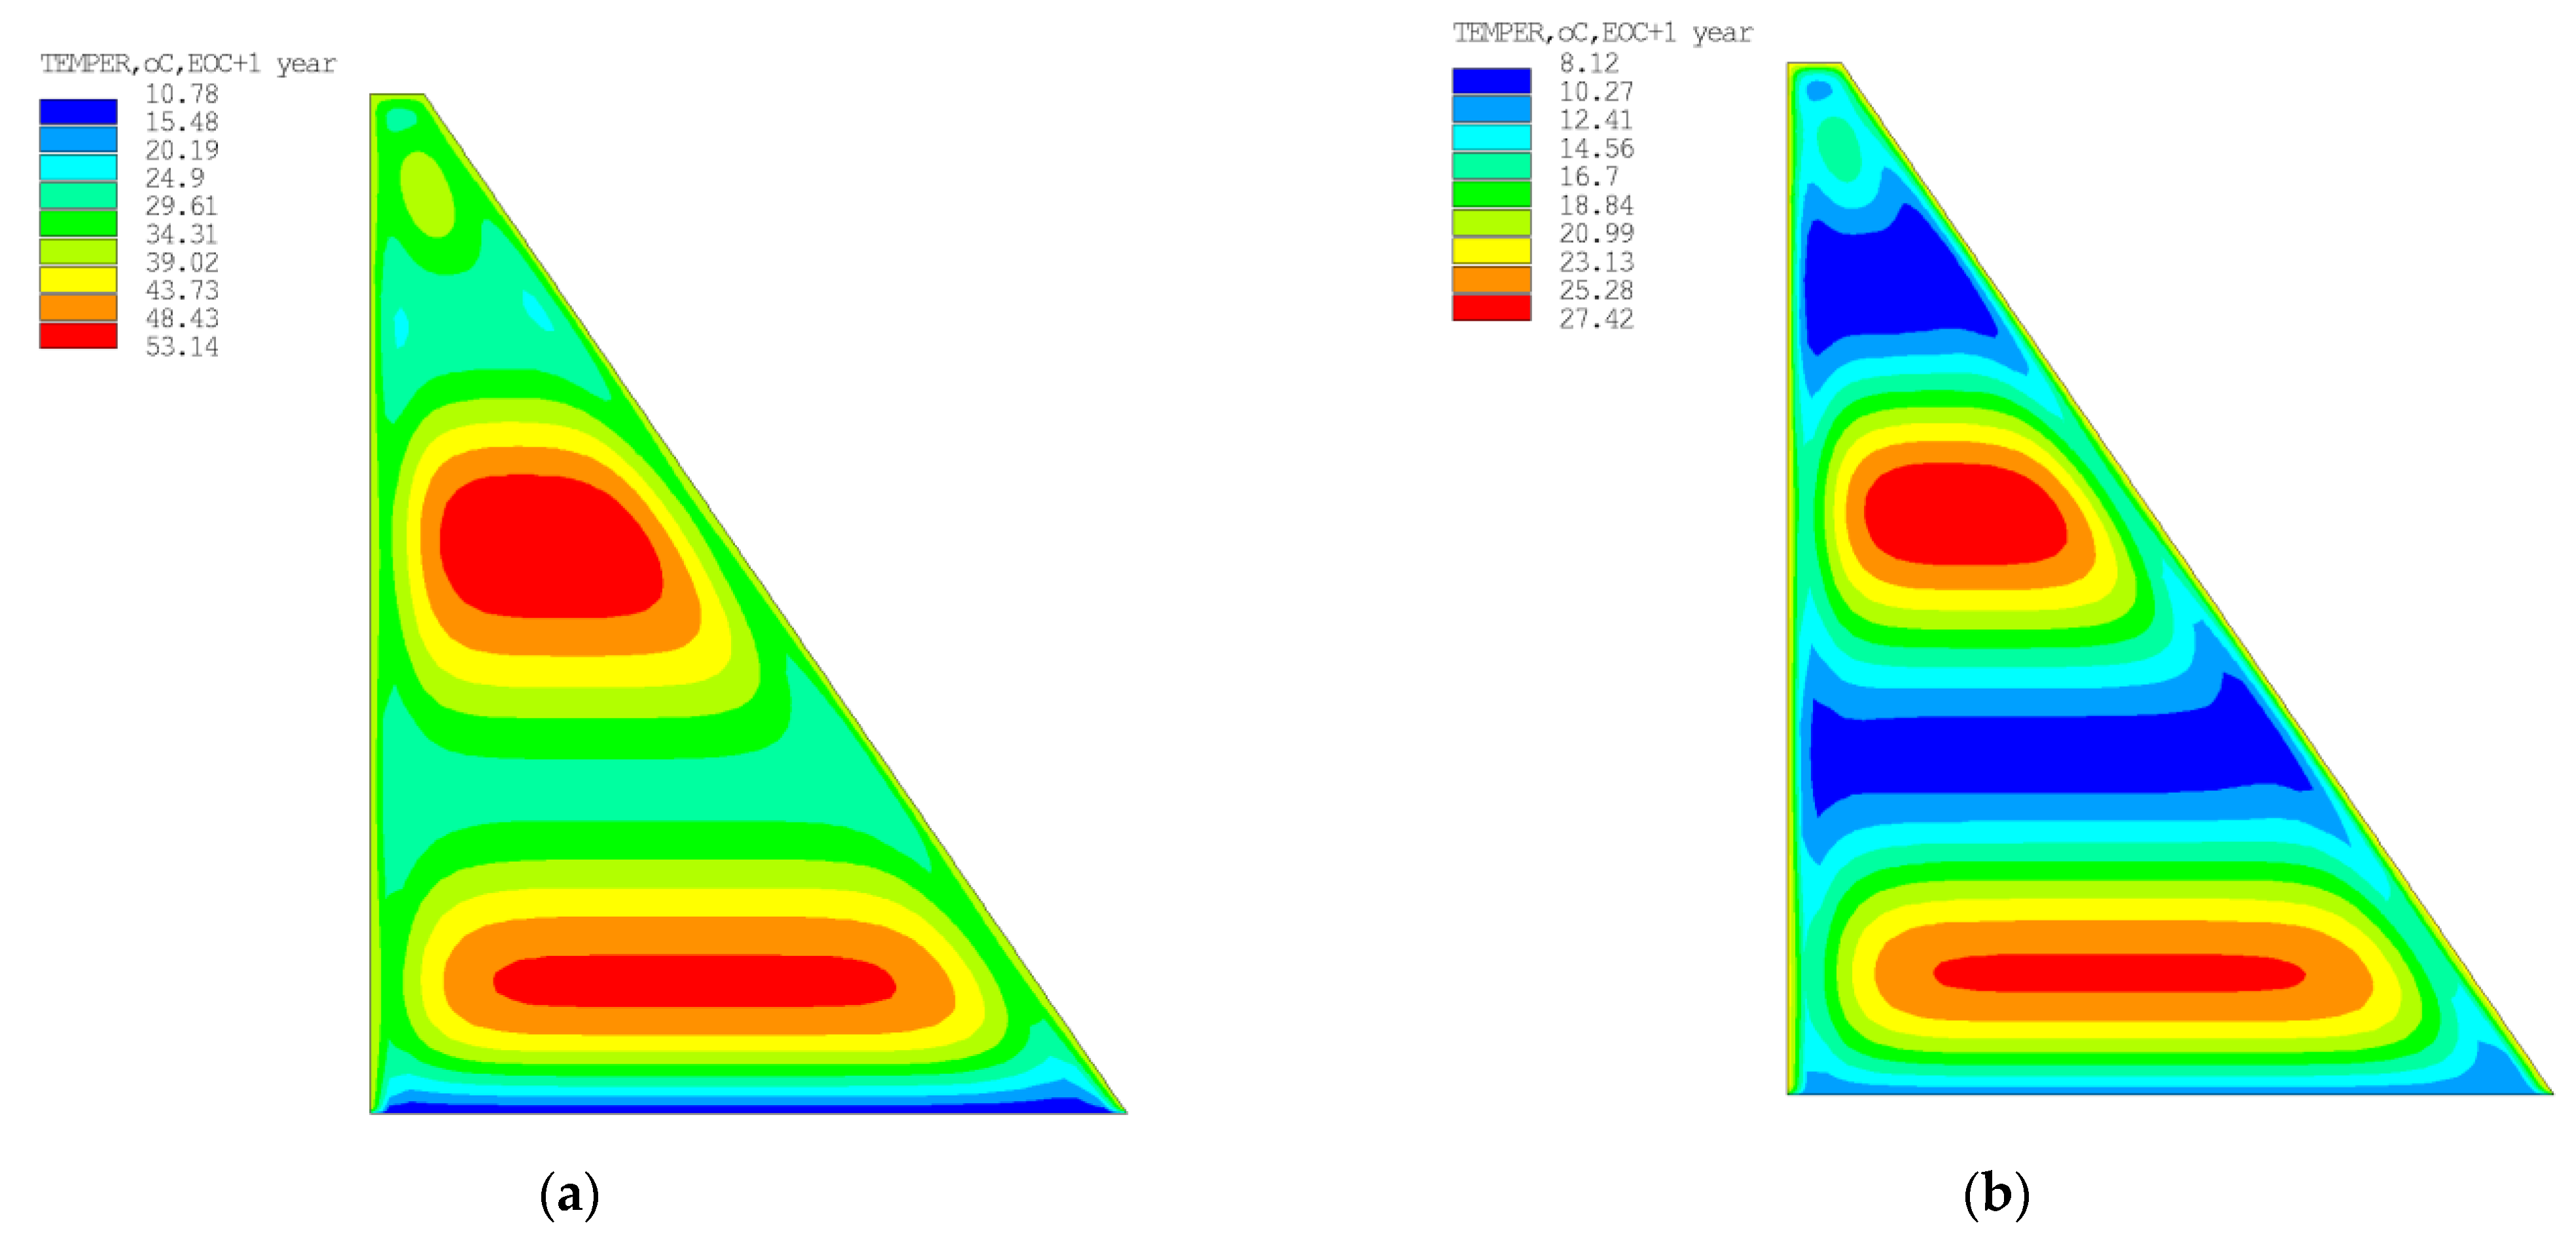
- For the climatic conditions considered, a consideration of solar radiation made a significant contribution to the increase in temperature warming of the structure during its construction (the temperature inside the concrete mass increases by 8.46 °C to 16.14 °C (Figure 8), depending on the fixing point.
4. Findings
- The conducted research indicates the necessity of considering the influence of solar radiation on warming up the massive gravity dam made of low-cement concrete in the climate conditions of Pskem HPP in the Republic of Uzbekistan and similar ones. The methodology for accounting for the influence of solar radiation with respect to cloud cover makes it possible to predict the temperature and radiation regime of a massive gravity dam, taking into account field and satellite observations and determining the amount of absorbed solar energy and the associated heating of the concrete mass with respect to seasonality and the topography surrounding the construction site.
- The optimization of the temperature regime of the structure, carried out on the basis of the experimental planning theory with a numerical solution in the ANSYS software package, allowed the contribution of each to be evaluated in the internal and external environmental factors to the thermal stress state of the dam in the climate conditions of the construction area in the Republic of Uzbekistan.
- The created prediction model of the thermo-stressed state made it possible to estimate the values of absolute maximum temperature in the concrete mass; the maximum temperature at characteristic points; the maximum temperature gradient between a point in the mass center; and a point on the pressure face; values of the maximum main tensile stresses and plastic deformations. This enabled a comprehensive analysis to be carried out and the best design option to be selected.
- Regression equations have been derived from the results of the calculations to determine the values of the required indicators at any of the points under consideration. The equations can be applied to any solid, low-cement concrete dam with a minimum footprint of 40 m in all climate conditions.
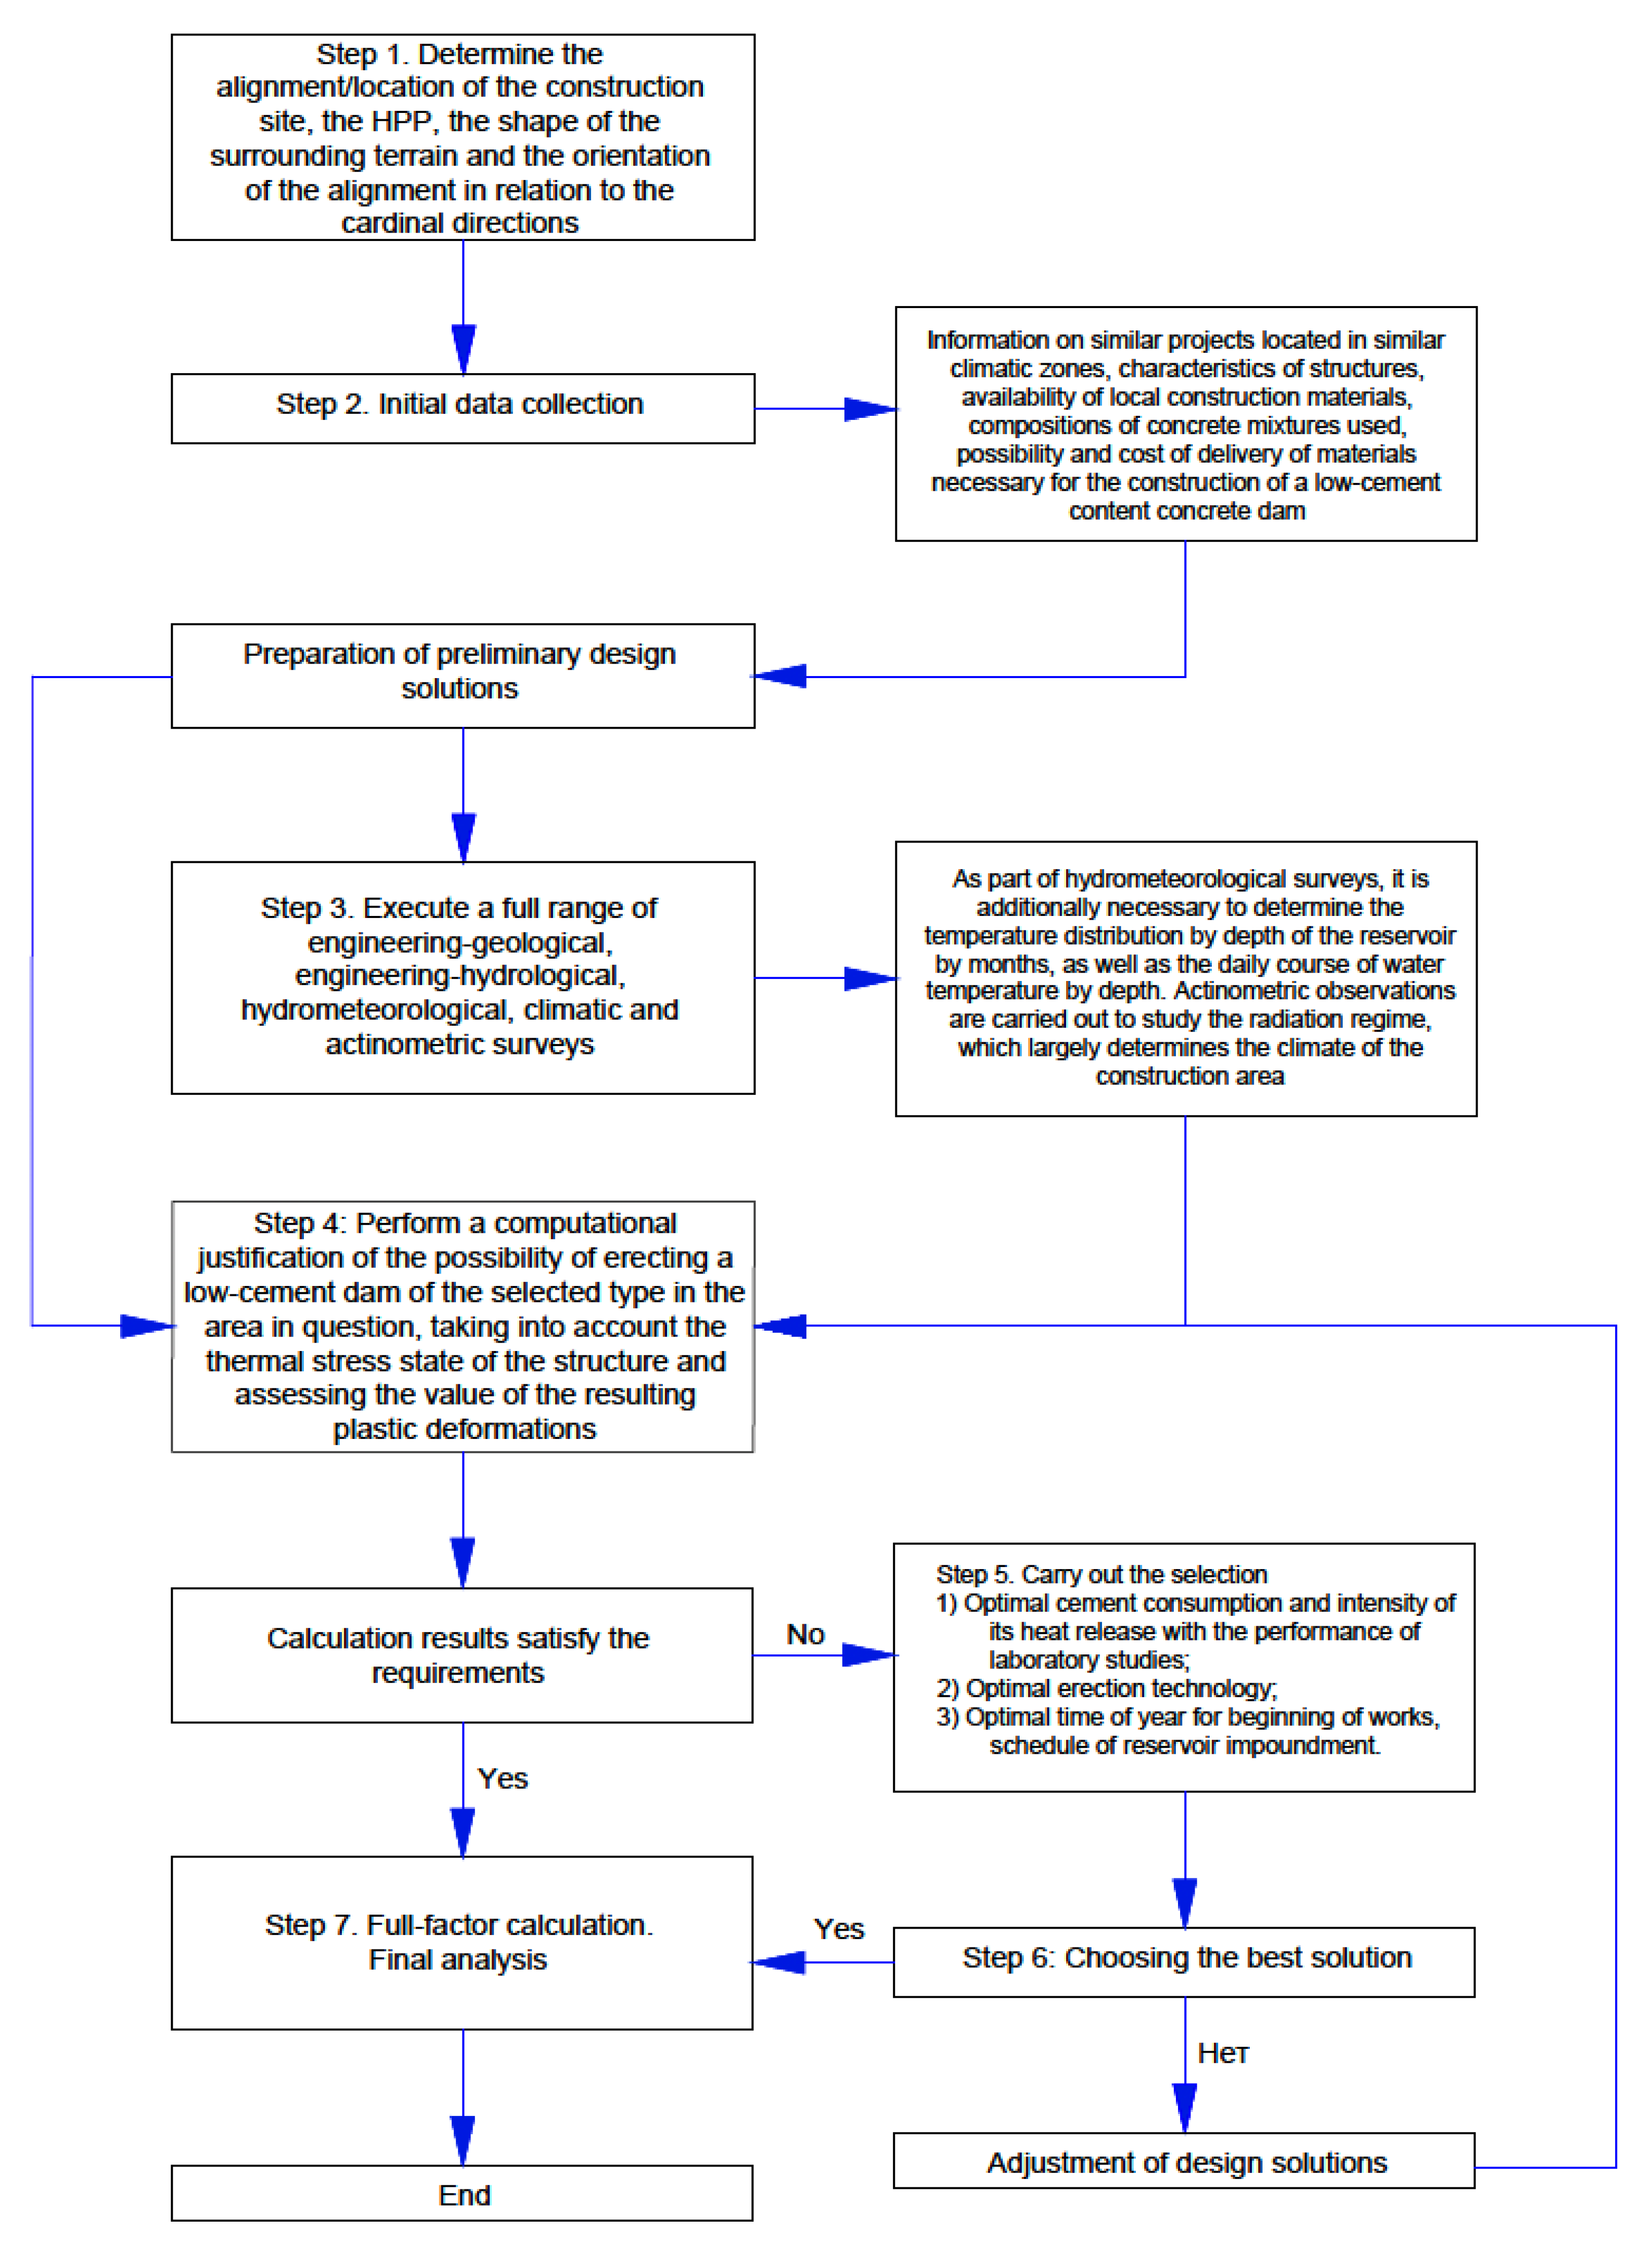
- Based on the results of this work, a construction optimization algorithm was proposed for use in the engineering and justification of design solutions for low-cement concrete gravity dams.
- Recommendations and prospects for further development of the topic. Laboratory research on the determination of the optimum composition of the concrete mixture, a more detailed consideration of the influence of concrete strength growth in time and its influence on the state of the structure, a more detailed study of the thermal properties of different types of foundations and the general improvement of calculation models and methods are advisable. In addition, a promising direction is the study of cracking processes in massive structures made of low-cement concrete and the search for the new refinement of existing criteria for its assessment.
Author Contributions
Funding
Data Availability Statement
Conflicts of Interest
References
- Bofang, Z. Thermal Stresses and Temperature Control of Mass Concrete; Butterworth-Heinemann: Oxford, UK, 2013; pp. 1–500. [Google Scholar]
- Gaspar, A.; Lopez, F. Methodology for a probabilistic analysis of an RCC gravity dam construction. Modelling of temperature, hydration degree and ageing degree fields. Eng. Struct. 2014, 65, 99–110. [Google Scholar] [CrossRef]
- GRI Guide GS12. Lifetime Prediction of Geosynthetics Using Time-Temperature Superposition (TTS) and Arrhenius Modeling; Geosynthetic Institute: Folsom, PA, USA, 2012. [Google Scholar]
- Hirose, T. Research and practice concerning RCD method. C.18. In Proceedings of the XIVth ICOLD Congress, Rio de Janeiro, Brazil, 3–7 May 1982; Volume 3. [Google Scholar]
- ICOLD Bulletin 165. Selection of Materials for Concrete Dams, ICOLD, Antalya. 1999. Available online: https://www.icold-cigb.org/GB/publications/bulletins.asp (accessed on 1 March 2023).
- Kuzmanovic, V.; Savic, L.; Mladenovic, N. Computation of Thermal-Stresses and Contraction Joint Distance of RCC Dams. J. Therm. Stress. 2013, 36, 112–134. [Google Scholar] [CrossRef]
- Midas GTS NX. User’s Guide; MIDAS Information Technology Co., Ltd.: Seongnam, Republic of Korea, 1989. [Google Scholar]
- Moutafis, N.I.; Thanopoulos, Y. The geomembrane faced hardfill dam. In Proceedings of the Hydro 2015, Bordeaux, France, 26–28 October 2015. [Google Scholar]
- Raphael, J.M. Tensile strength of concrete. J. Proc. 1984, 81, 158–165. [Google Scholar]
- Reeves, G.N.; Yates, L.B. Simplified Design and Construction Control for Roller-Compacted Concrete; Roller-Compacted Concrete: New York, NY, USA, 1985; pp. 48–61. [Google Scholar]
- Schrader, E.; Mckinnon, R. Construction and Operation of Willow Creek Dam. Concr. Int. 1984, 6, 38–45. [Google Scholar]
- Shaw, Q.H.W. The Early Behavior of RCC in Large Dams. Int. J. Hydropower Dams 2010, 17, 83–90. [Google Scholar]
- ICOLD Bulletin 117. The Gravity Dam—A Dam for the Future, ICOLD. 2000. Available online: https://www.icold-cigb.org/GB/publications/bulletins.asp (accessed on 1 March 2023).
- Ginzburg, S.M.; Rukavishnikova, T.N.; Sheinker, N.Y. Simulation models for estimation of temperature regime of concrete dam by example of Bureyskaya HPP. Vedeneev 2002, 241, 173–178. [Google Scholar]
- Ginzburg, S.M. Assessment of the Temperature Regime of Concrete Massifs during Their Construction, Taking into Account Random Factors; JSC “VNIIG named after B.E. Vedeneev”: St. Petersburg, Russia, 2002; Volume 241, pp. 188–192. [Google Scholar]
- Aniskin, N.A.; Hoang, N. Forecast of Cracking of Concrete Massive Dams during Construction in Severe Climatic Conditions; Bulletin of the Moscow State University of Civil Engineering: Moscow, Russia, 2014; pp. 165–178. [Google Scholar]
- Aniskin, N.A.; Truk Chong, N.; Bryansky, I.A.; Hung Huu, D. Determination of the temperature field and thermal stress state of the paving concrete mass by finite element. Vestnik MGSU 2010, 13, 1407–1418. [Google Scholar]
- ETL 1110-2-542; Thermal studies of mass concrete structures. US Army Corps of Engineers: Washington, DC, USA, 1997.
- Kehlbeck, F. Effect of Solar Radiation on Bridge Structures; Liu, X.F., Translator; China Railway Publishing House: Beijing, China, 1981. [Google Scholar]
- Nagayama, I.; Jikan, S. 30 years’ history of Roller-Compacted Concrete dams in Japan. In Roller Compacted Concrete Dams; Routledge: Milton Park, UK, 2018; pp. 27–38. [Google Scholar]
- Soroushian, P.; Choi, K.B.; Alhamad, A. Dynamic constitutive behavior of concrete. J. Proc. 1986, 83, 251–259. [Google Scholar]
- Grishin, M.M. Concrete Dams (On Rock Foundations); Grishin, M., Rozanov, N., Belyi, L., Vasilyev, P., Gordienko, P., Ivanishev, V., Orekhov, V., Eds.; Stroyizdat: Moscow, Russia, 1975. [Google Scholar]
- Semenov, K.; Konstantinov, I.; Savchenko, A.; Kokoreva, K.; Nesterov, A. The effect of temperature effects in calculating the thermal stress state of discretely built-up concrete bodies. Constr. Unique Build. Struct. 2015, 32, 18–28. [Google Scholar]
- Summary Report on the Study of Layer-by-Layer Method of Concreting in the Construction of the Toktogul HPP; JSC “Institute Hydroproject”: St. Petersburg, Russia, 1971.
- Sivkov, S.I. Methods for Calculating the Characteristics of Solar Radiation; Gidrometeoizdat: Moscow, Russia, 1968; 234p. [Google Scholar]
- Shakirov, V.A. Method of estimating the arrival of total solar radiation on inclined surfaces using multi-year archives of meteorological data. Syst. Methods Technol. 2017, 4, 115–121. [Google Scholar]
- Nikitin, A.M. Reservoirs of Central Asia; Gidrometeoizdat: Moscow, Russia, 1991. [Google Scholar]
- Aniskin, N.A.; Shaitanov, A.M.; Shaitanov, M.V.; Khokhotva, S.N. Influence of solar radiation on heating of massif of gravity dam erected from low-cement concrete. Hydraul. Eng. Constr. 2021, 11, 11–18. [Google Scholar]
- Aniskin, N.; Truk, N.T.; Anh, L.D. Influence of base elasticity modulus on thermal stress state of concrete block. Hydraul. Eng. Constr. 2019, 11, 4–9. [Google Scholar]
- Adler, Y.P. Planning the Experiment in the Search for Optimal Conditions; Stroyizdat: Moscow, Russia, 1976; 588p. [Google Scholar]
- Aniskin, N.; Shaytanov, A.; Shaytanov, M.; Khokhotva, S. Low-cement content gravity dam as an alternative for Pskem HPP. In Proceedings of the E3S Web of Conferences, St. Petersbourg, Russia, 17–19 November 2021; Volume 263, p. 02028. [Google Scholar]
- Lowe, J., III. Discussion to Utilization of soil cement as slope protection for earth dams. In Proceedings of the First ASCE Water Resources Engineering Conference, Omaha, NE, USA, 14–18 May 1962. [Google Scholar]
- SR 41.13330.2012; Concrete and reinforced concrete structures of hydraulic structures. Ministry of Regional Development of Russia: Moscow, Russia, 2012.
- Engineer Manual No. 1110-2-2006; Engineering and Design, Roller-Compacted Concrete. U.S. Army Corps of Engineers: Washington, DC, USA, February 1992.
- ACI Committee 207. Roller-Compacted Mass Concrete; ACI 207.5R-99; American Concrete Institute: Farmington Hills, MI, USA, 1999. [Google Scholar]


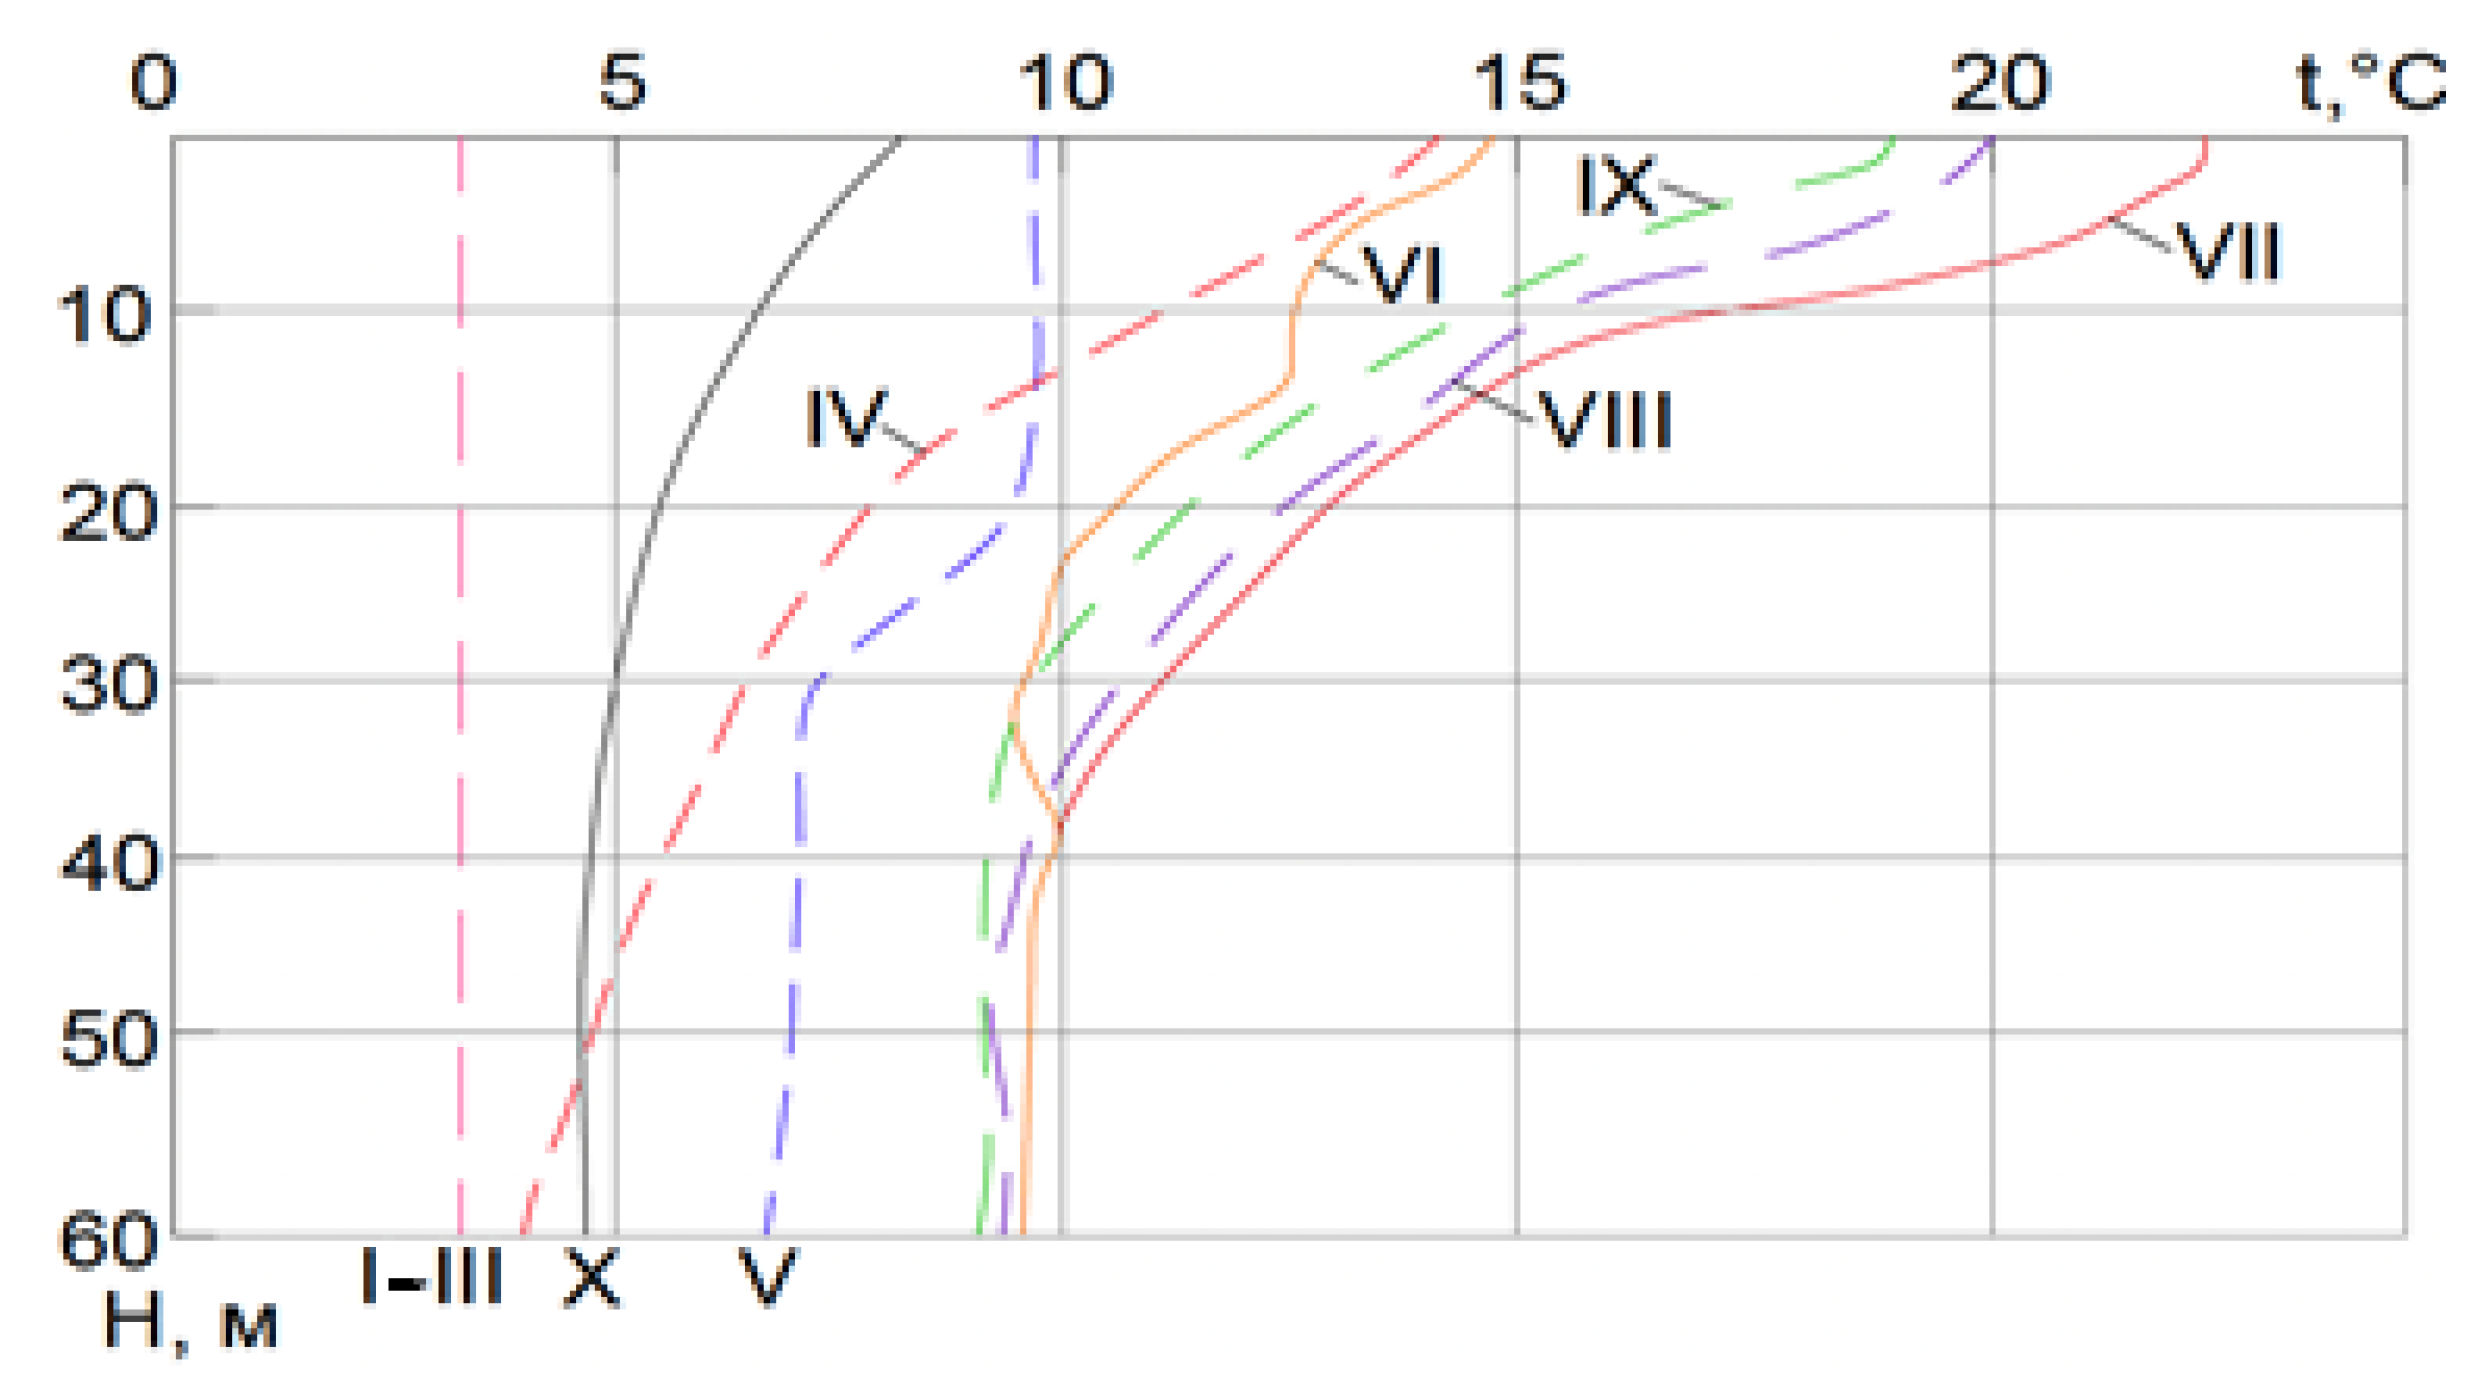
| Features | I | II | III | IV | V | VI | VII | VIII | IX | X | XI | XII | Av. an. |
|---|---|---|---|---|---|---|---|---|---|---|---|---|---|
| Monthly average air temp., °C | −4.0 | −2.0 | 3.0 | 11.0 | 16.0 | 21.0 | 24.0 | 24.0 | 19.0 | 11.0 | 4.0 | −1.1 | 9.5 |
| №. of the Calculation Case | Natural Values of Variation Factors and Construction Conditions | |||||
|---|---|---|---|---|---|---|
| Cement Consumption, , kg/m3 | Thickness of a Layer, , m | Heat Dissipation | Laying Temperature, , °C | Month of the Work Start | Consideration of Solar Radiation | |
| 6 | 70 | 1.5 | 339 | 10 | October | Yes |
| 25 | 150 | 0.5 | 387.7 | 10 | May | Yes |
| Indicator Name | Option with an Earth Dam with a Loamy Core | Option with Low-Cement Concrete Dam with a Liner on the Upstream Face |
|---|---|---|
| Volume of dam body material, m3 | 36,945,000 | 6,925,170 |
| Present value of 1 m3 of dam body material including all possible costs over the whole construction period, US dollars | 27.25 | 85.00 |
| Total cost of erecting the dam, US dollars | 1,006,765,470 | 588,639,450 |
| Construction time, years | 12 | 7 |
Disclaimer/Publisher’s Note: The statements, opinions and data contained in all publications are solely those of the individual author(s) and contributor(s) and not of MDPI and/or the editor(s). MDPI and/or the editor(s) disclaim responsibility for any injury to people or property resulting from any ideas, methods, instructions or products referred to in the content. |
© 2023 by the authors. Licensee MDPI, Basel, Switzerland. This article is an open access article distributed under the terms and conditions of the Creative Commons Attribution (CC BY) license (https://creativecommons.org/licenses/by/4.0/).
Share and Cite
Aniskin, N.A.; Shaytanov, A.M. Optimization of the Temperature and Thermo-Stressed State of a Concrete Dam Constructed from Particularly Lean Roller-Compacted Concrete. Buildings 2023, 13, 914. https://doi.org/10.3390/buildings13040914
Aniskin NA, Shaytanov AM. Optimization of the Temperature and Thermo-Stressed State of a Concrete Dam Constructed from Particularly Lean Roller-Compacted Concrete. Buildings. 2023; 13(4):914. https://doi.org/10.3390/buildings13040914
Chicago/Turabian StyleAniskin, Nikolai Alekseevich, and Alexey Mikhailovich Shaytanov. 2023. "Optimization of the Temperature and Thermo-Stressed State of a Concrete Dam Constructed from Particularly Lean Roller-Compacted Concrete" Buildings 13, no. 4: 914. https://doi.org/10.3390/buildings13040914