
Experimental and Numerical Investigations of RC Frame Stability Failure under a Corner Column Removal Scenario

Abstract
:1. Introduction
1.1. Literature Review
1.2. Purpose, Objective, and Summary of the Study
2. Materials and Methods
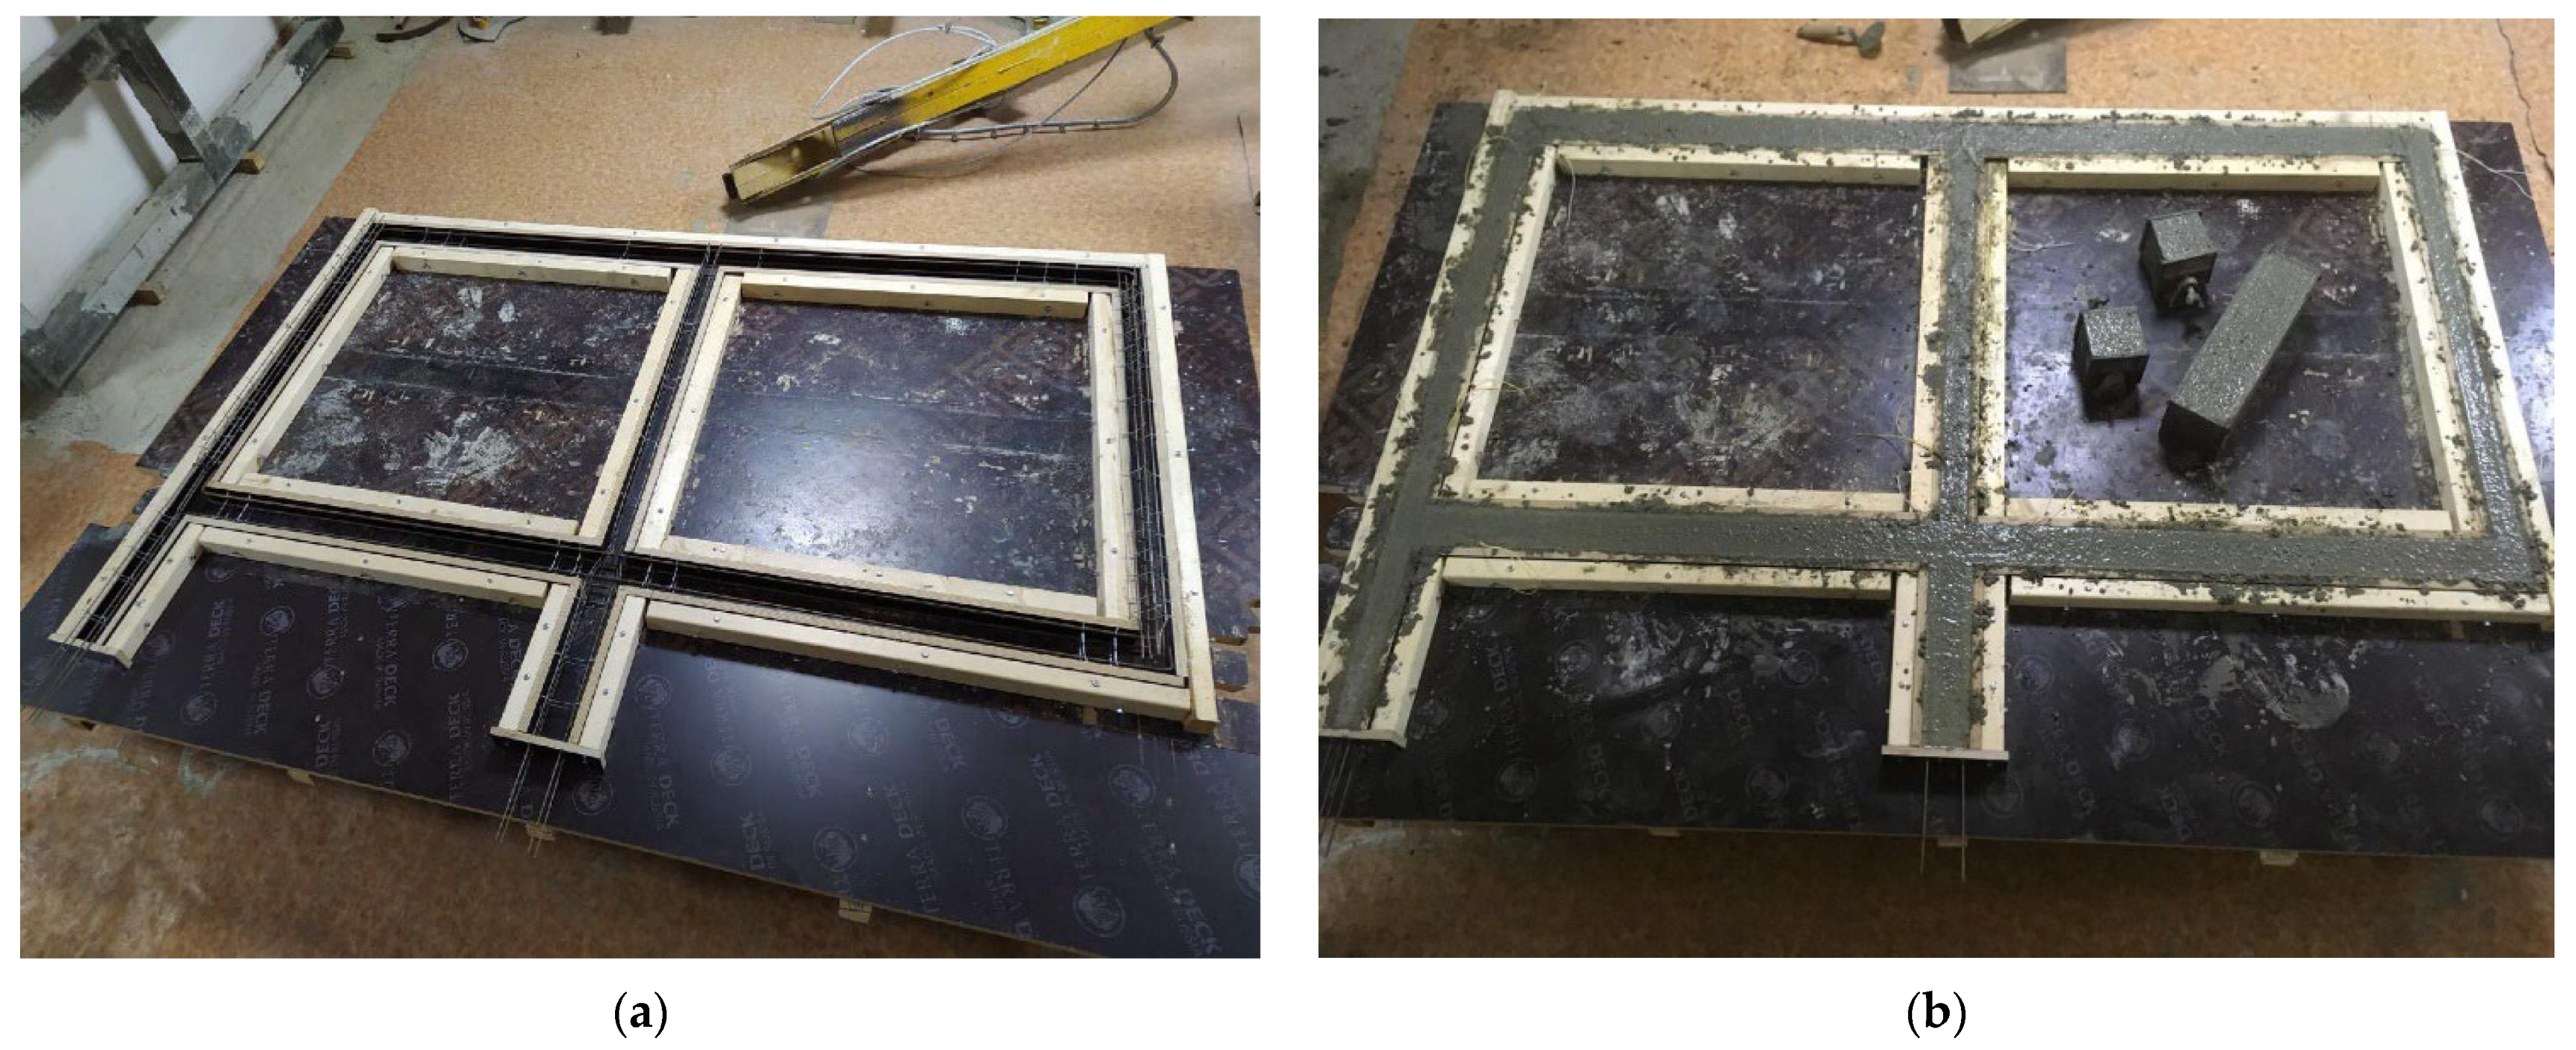
2.1. Method for Physical Modeling
- Physical phenomena have the same nature in terms of physical and numerical simulation;
- The physical model and the real building frame have a similar design model;
- The number of determining similarity criteria is the same for the model and the full-scale structure, although their numerical values may differ;
- Physical and mechanical properties of materials are the same for the model and the real facility;
- The loading pattern of the physical model may differ slightly from that of the real structure; however, the nature of the stress–strain state of elements of the model and the real facility should be similar.
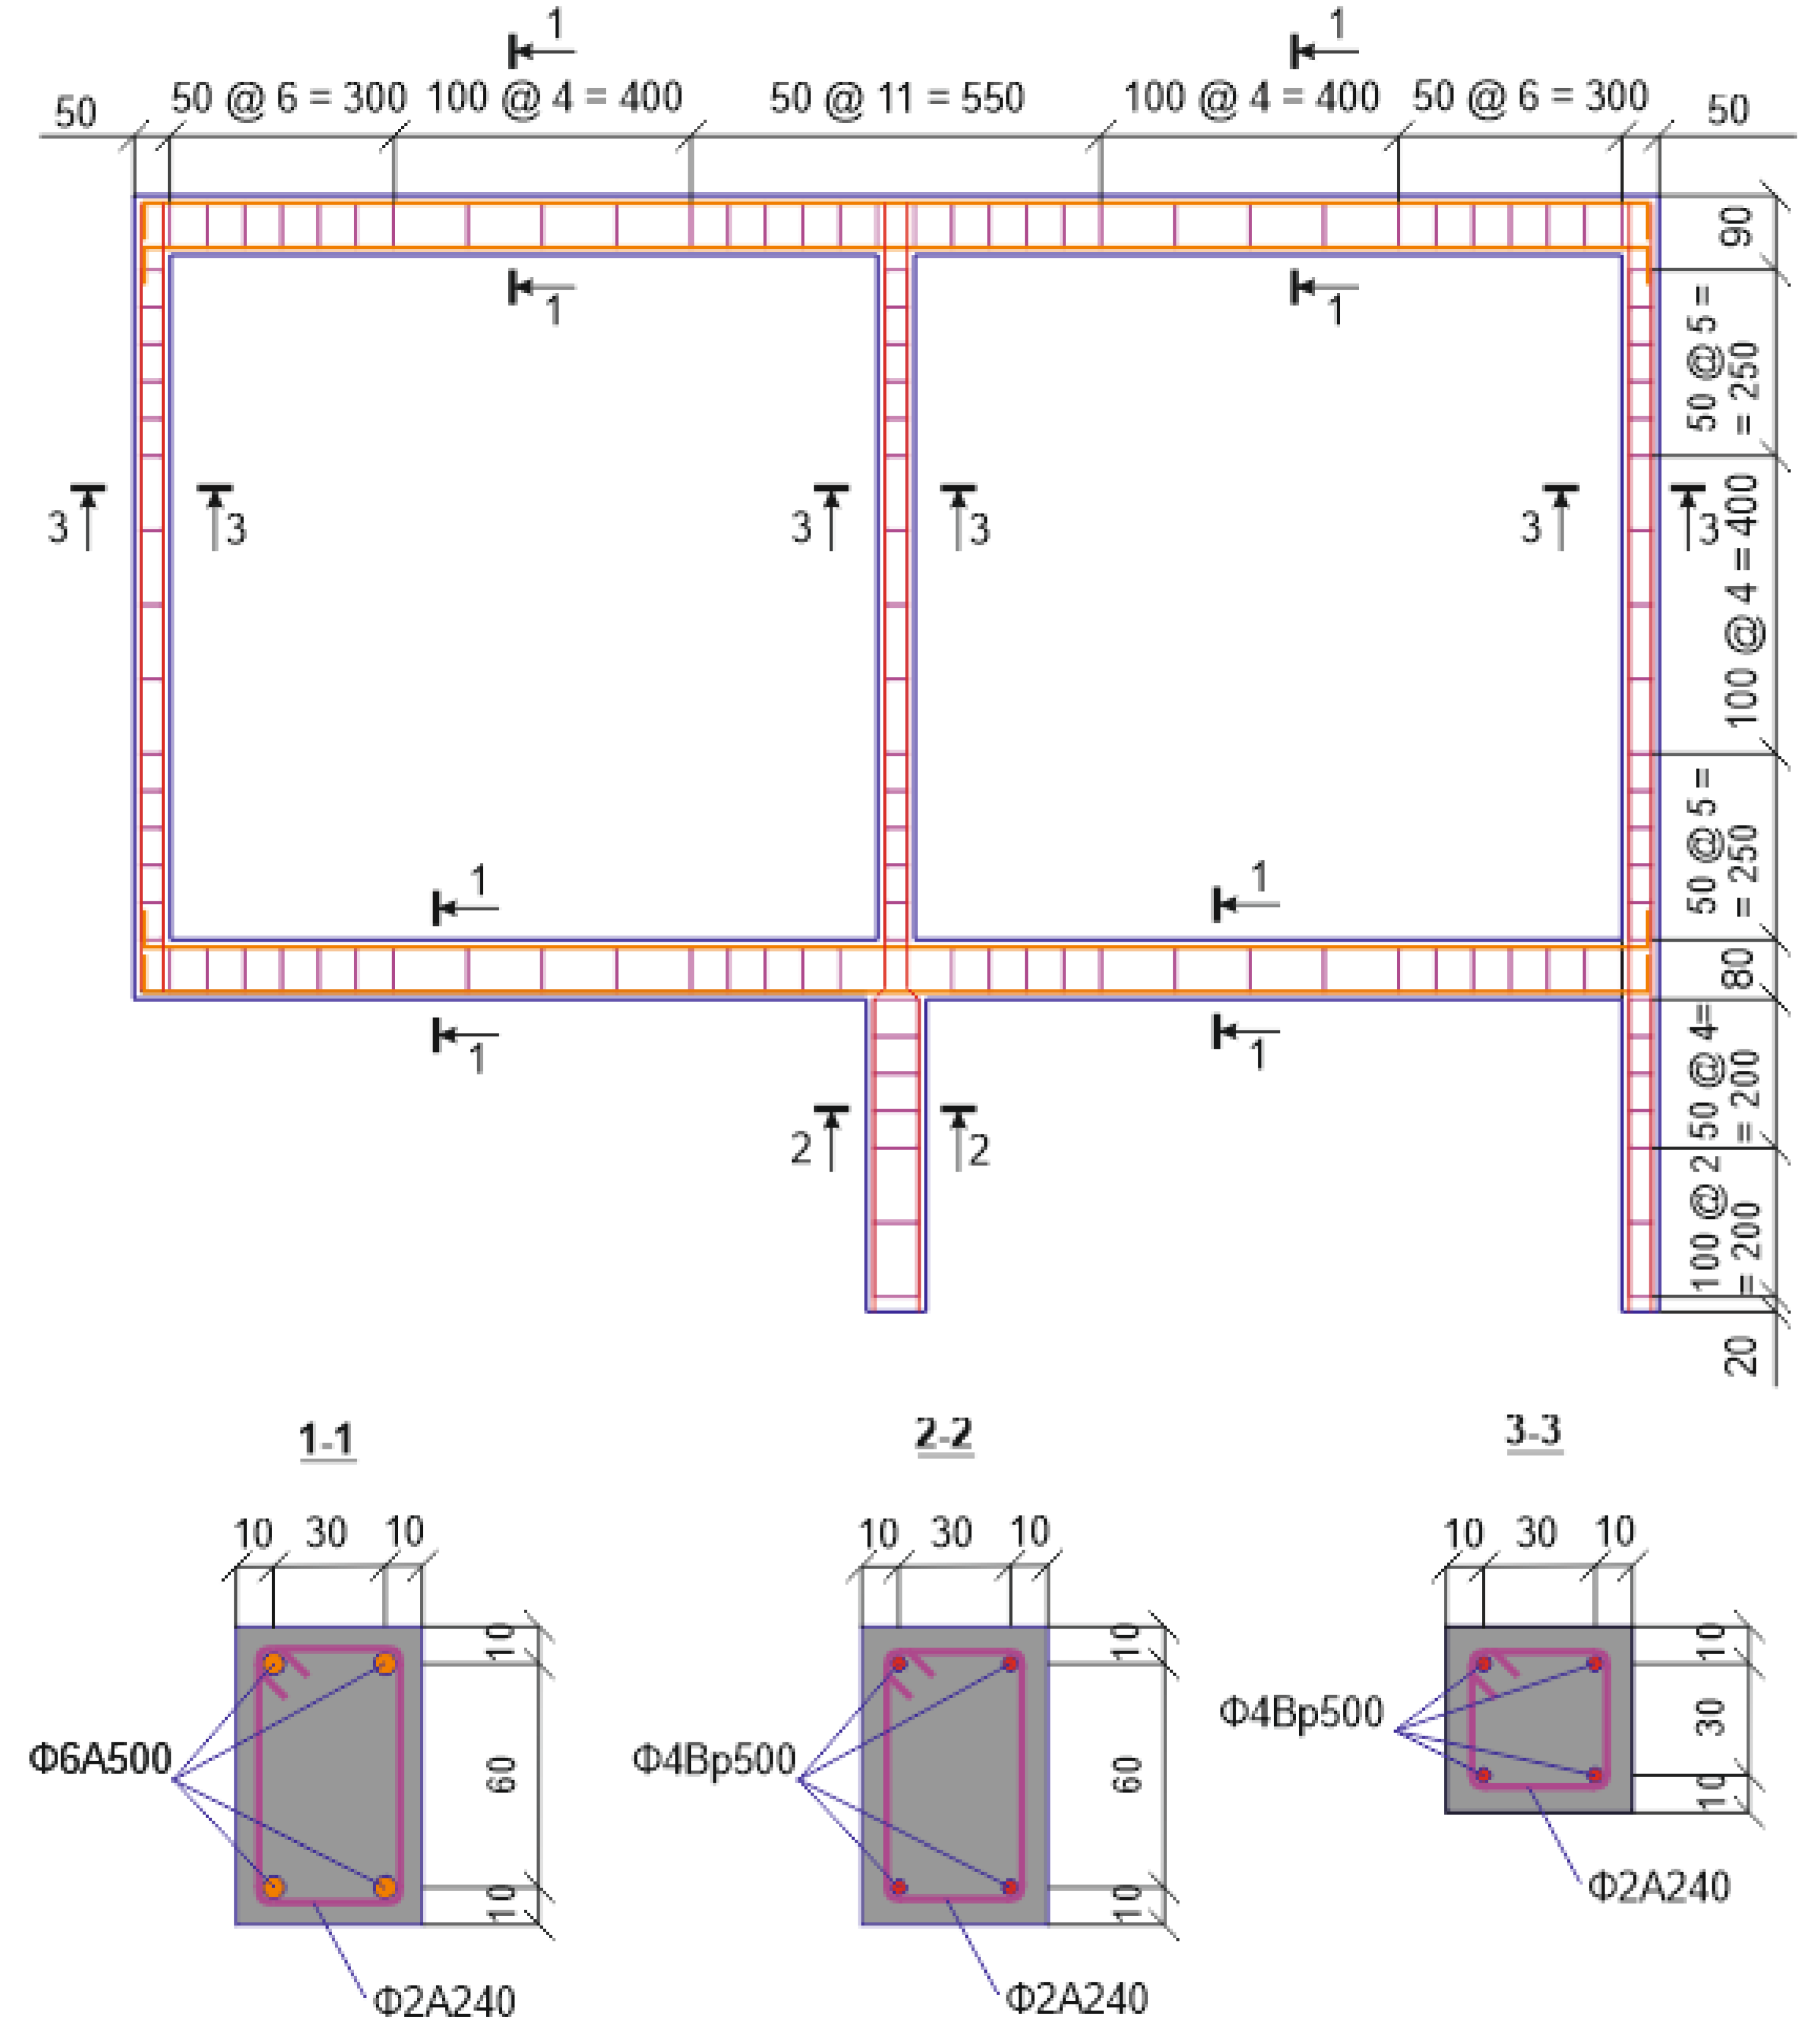
2.2. Design of the Test RC Frame and Mechanical Properties of Materials
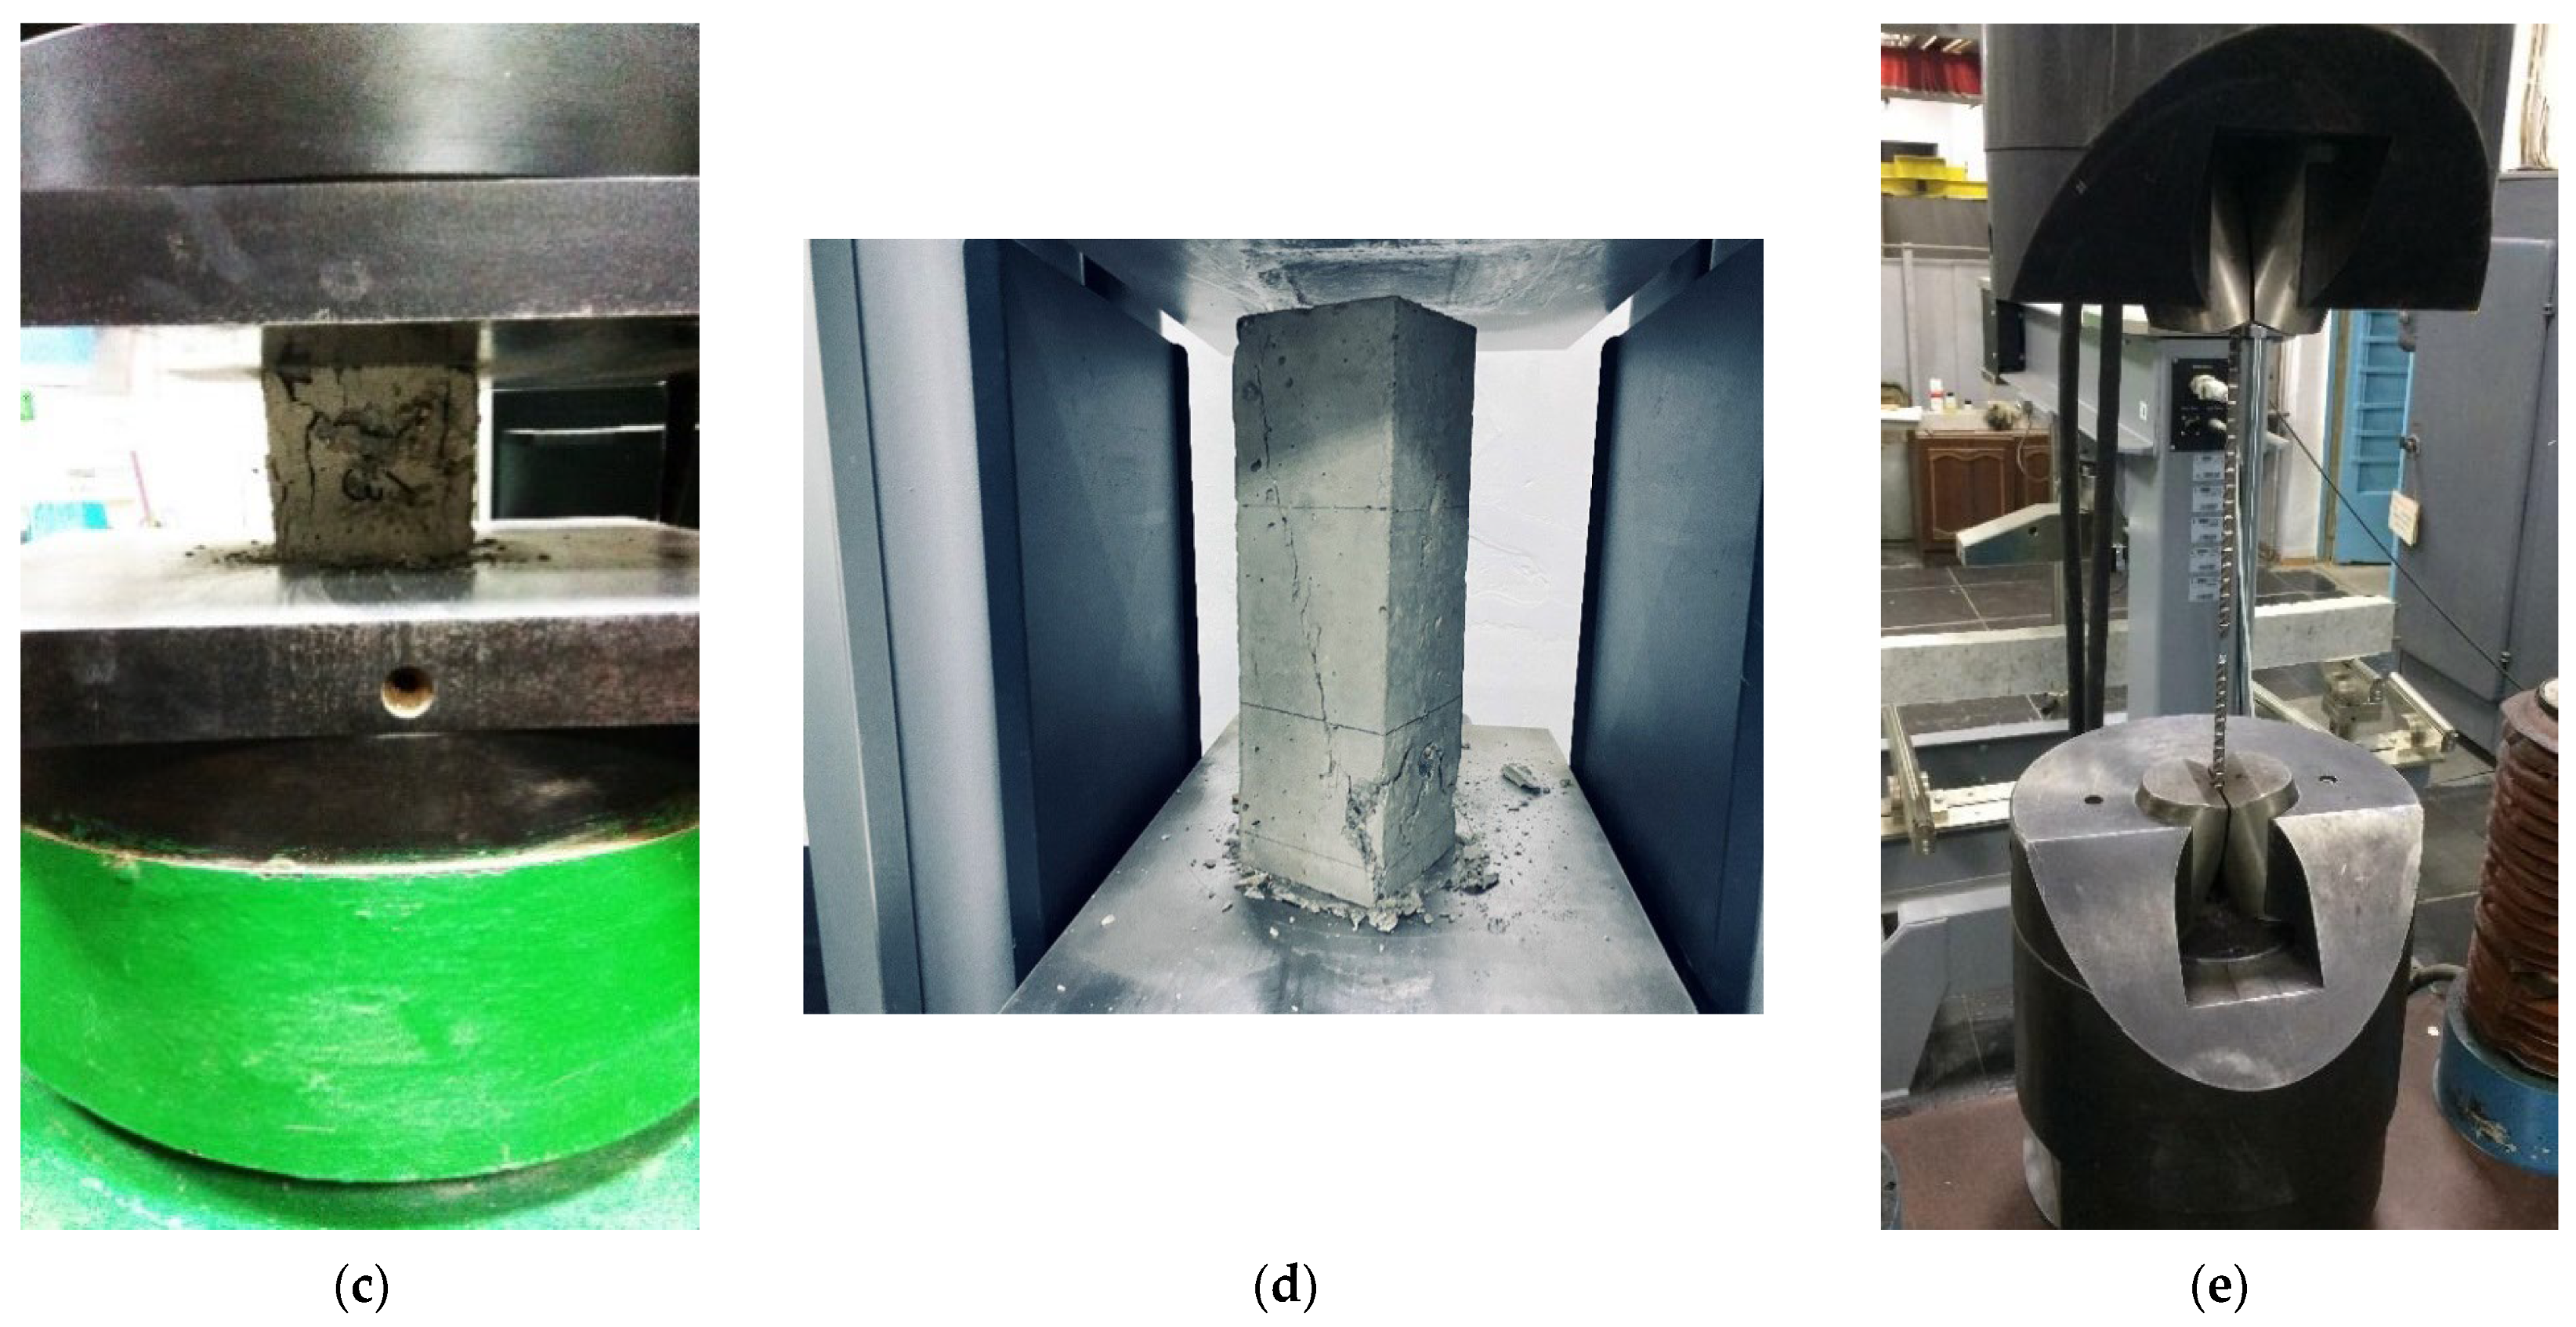
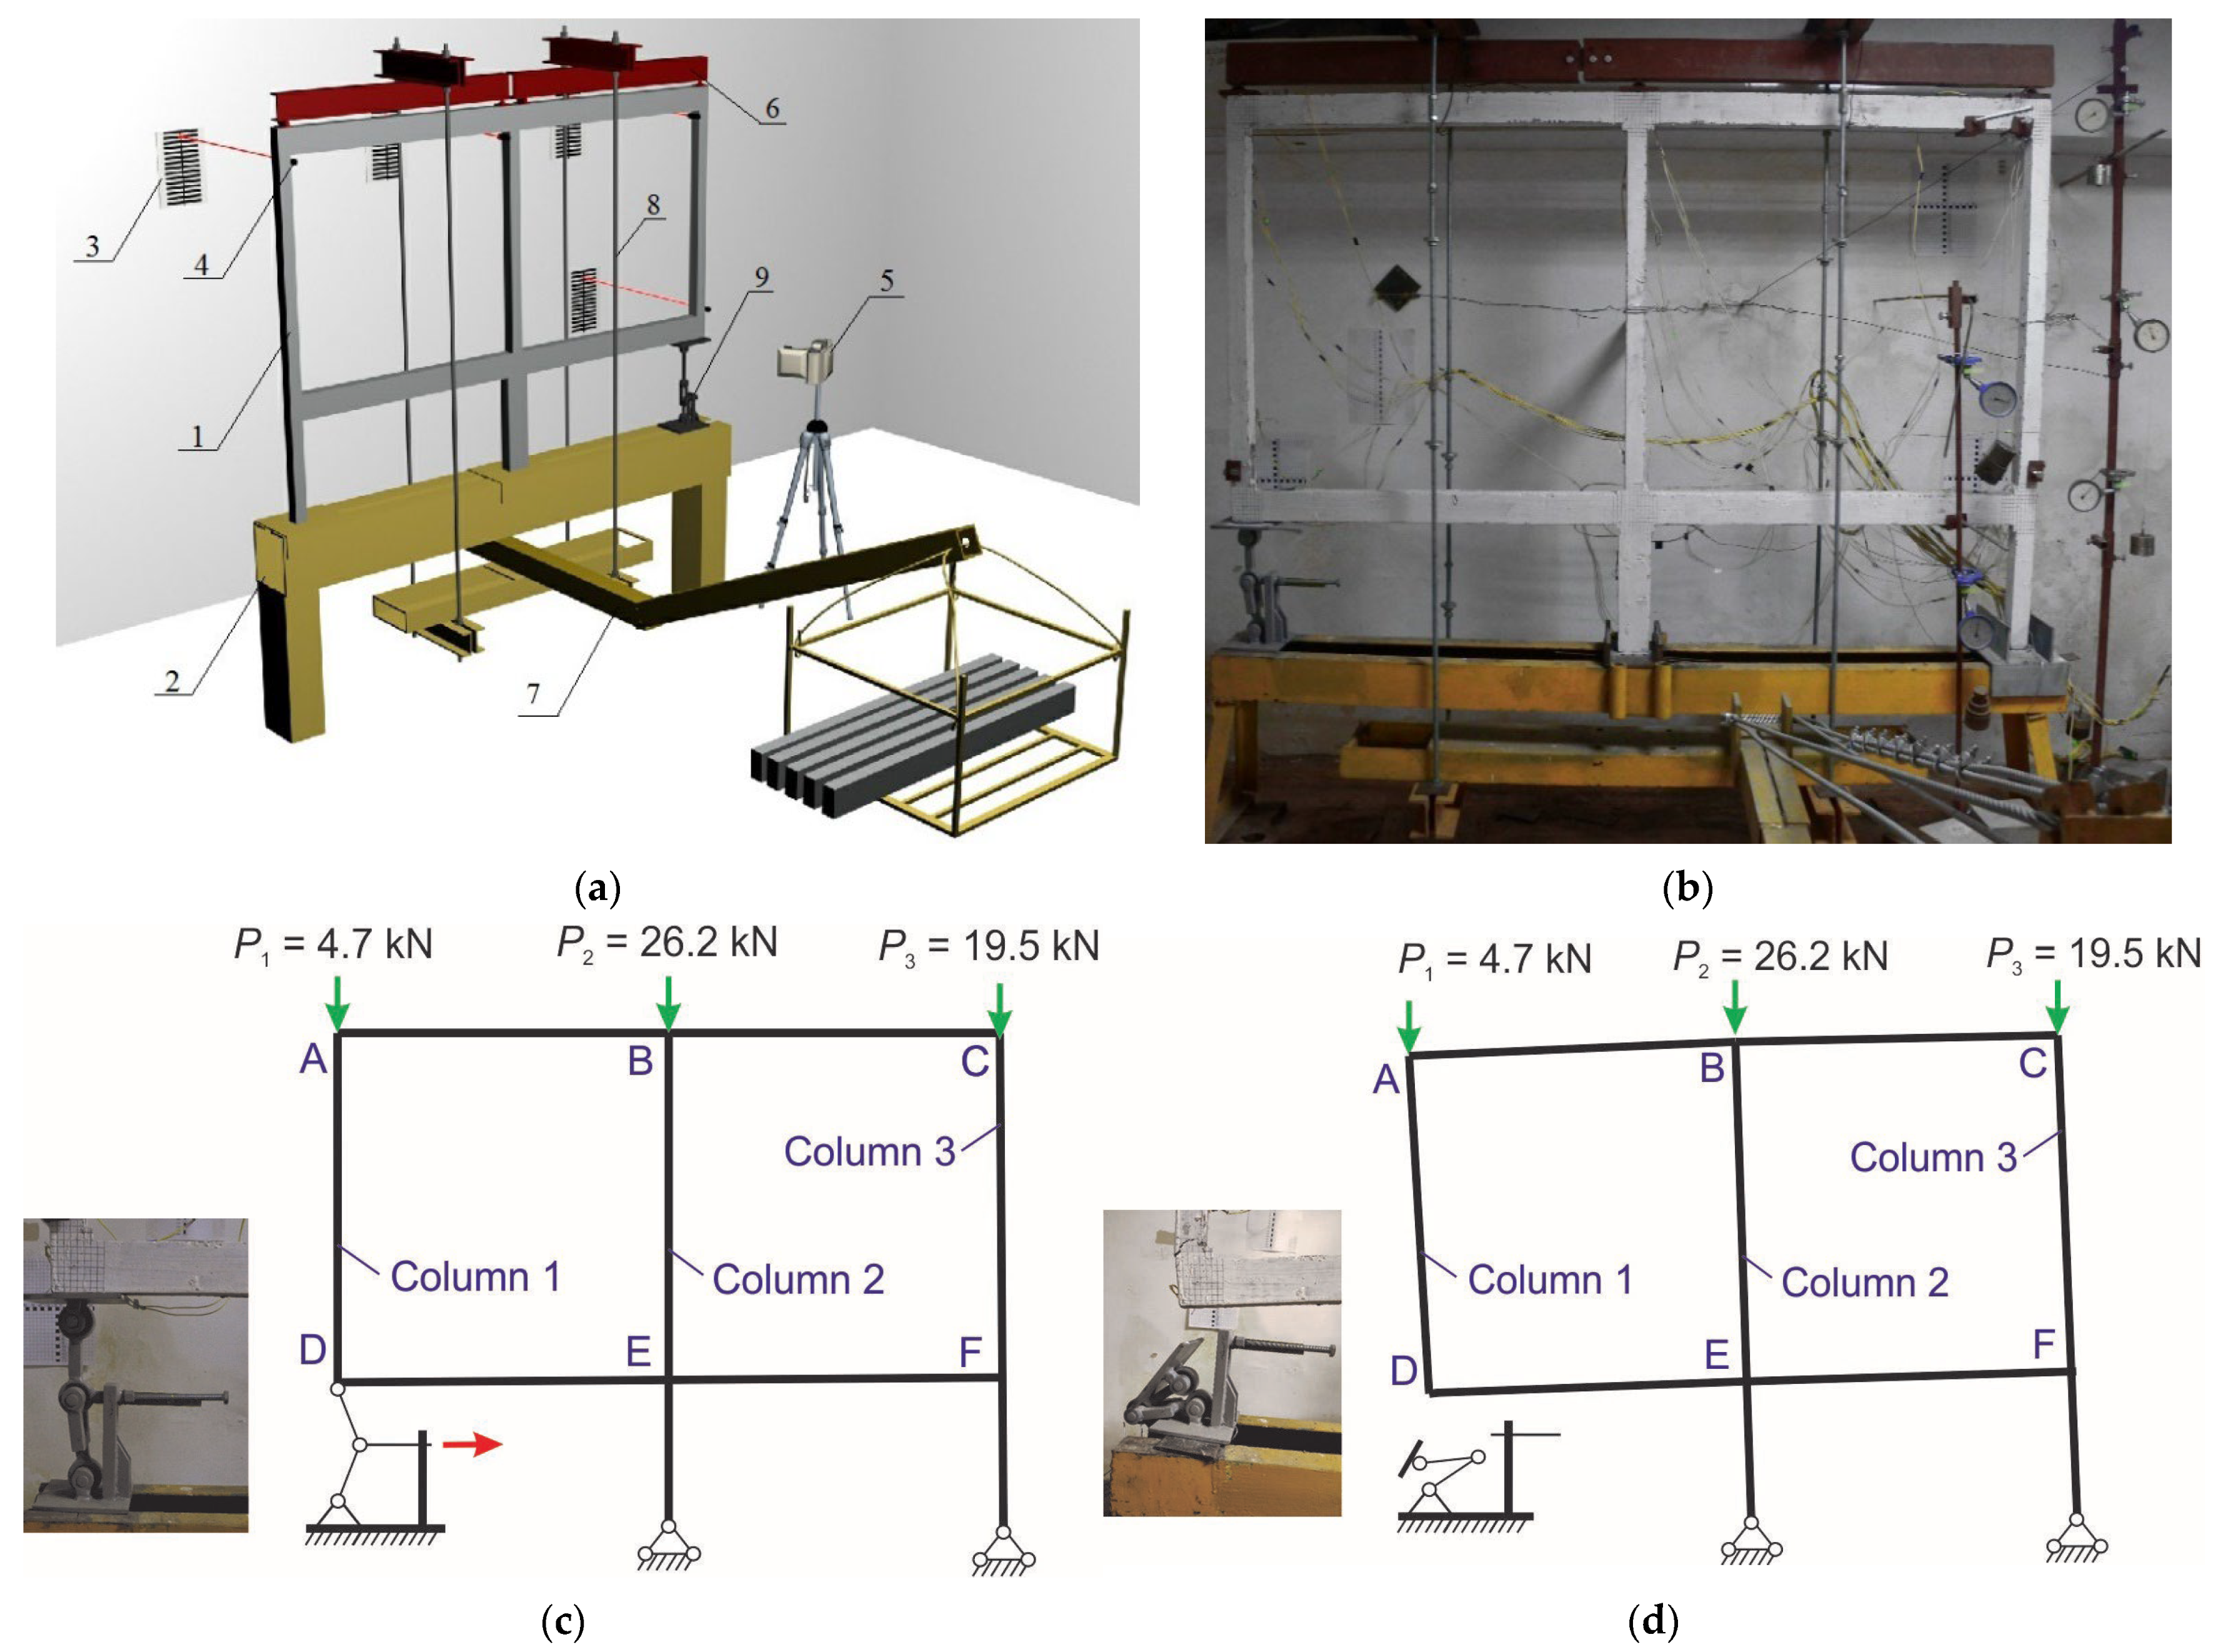
2.3. Test Method
3. Results
3.1. Experimental Results
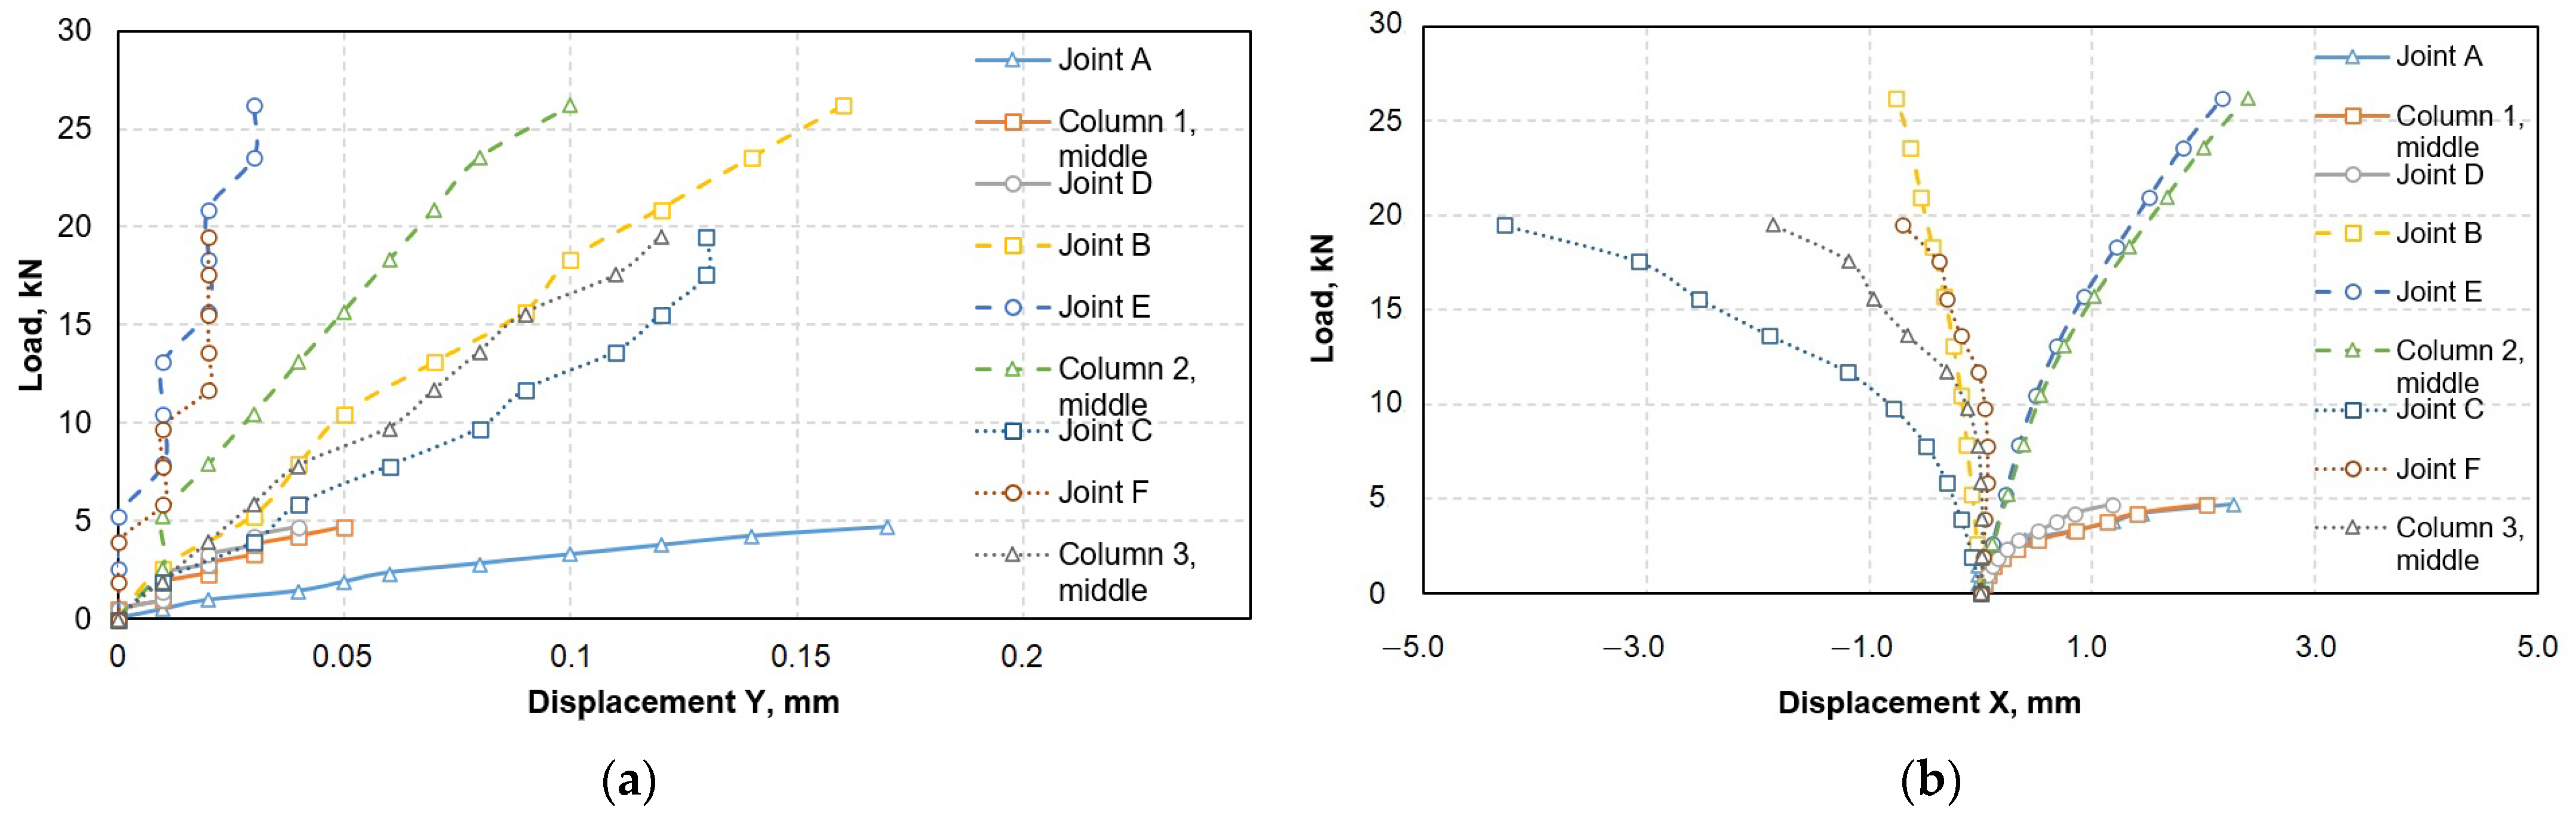
3.1.1. Load–Displacement Curves in the First Stage of Physical Modeling
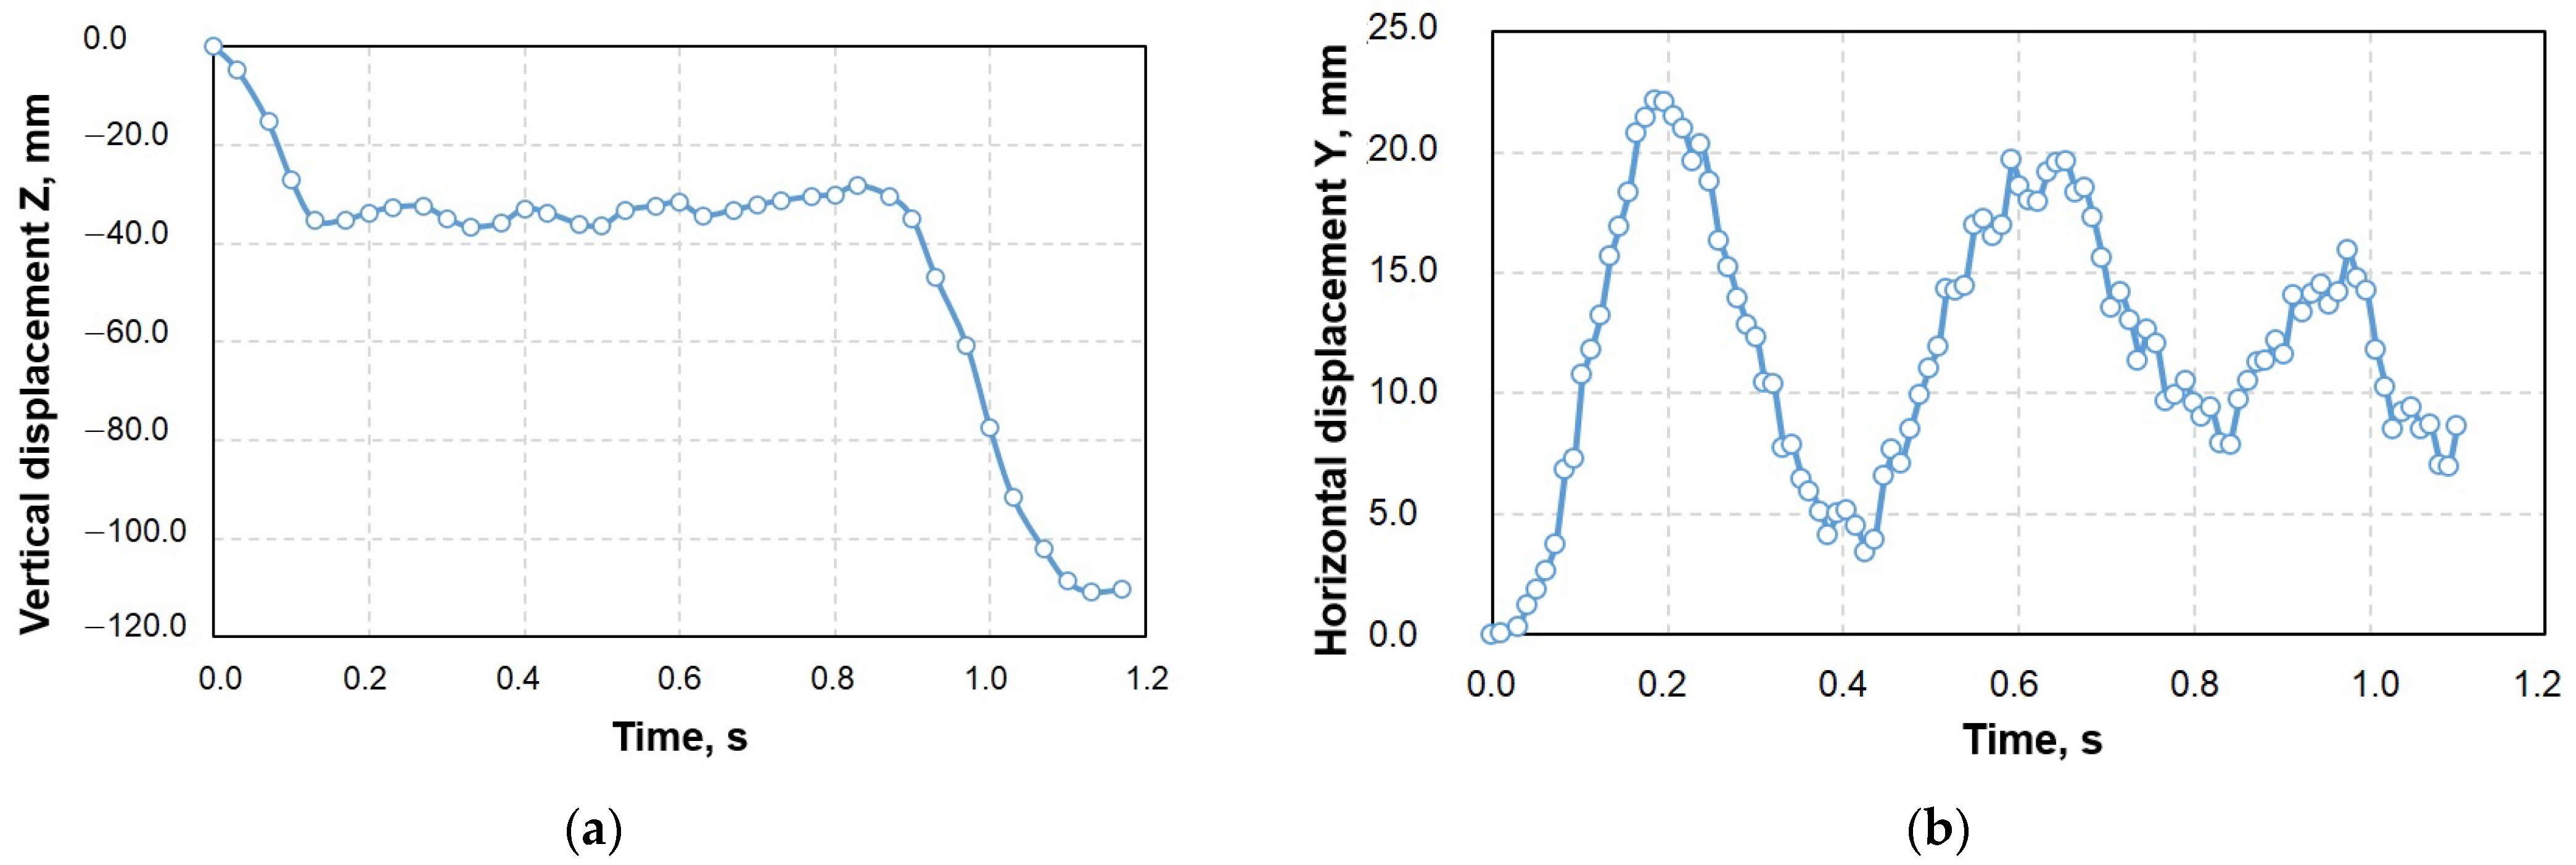
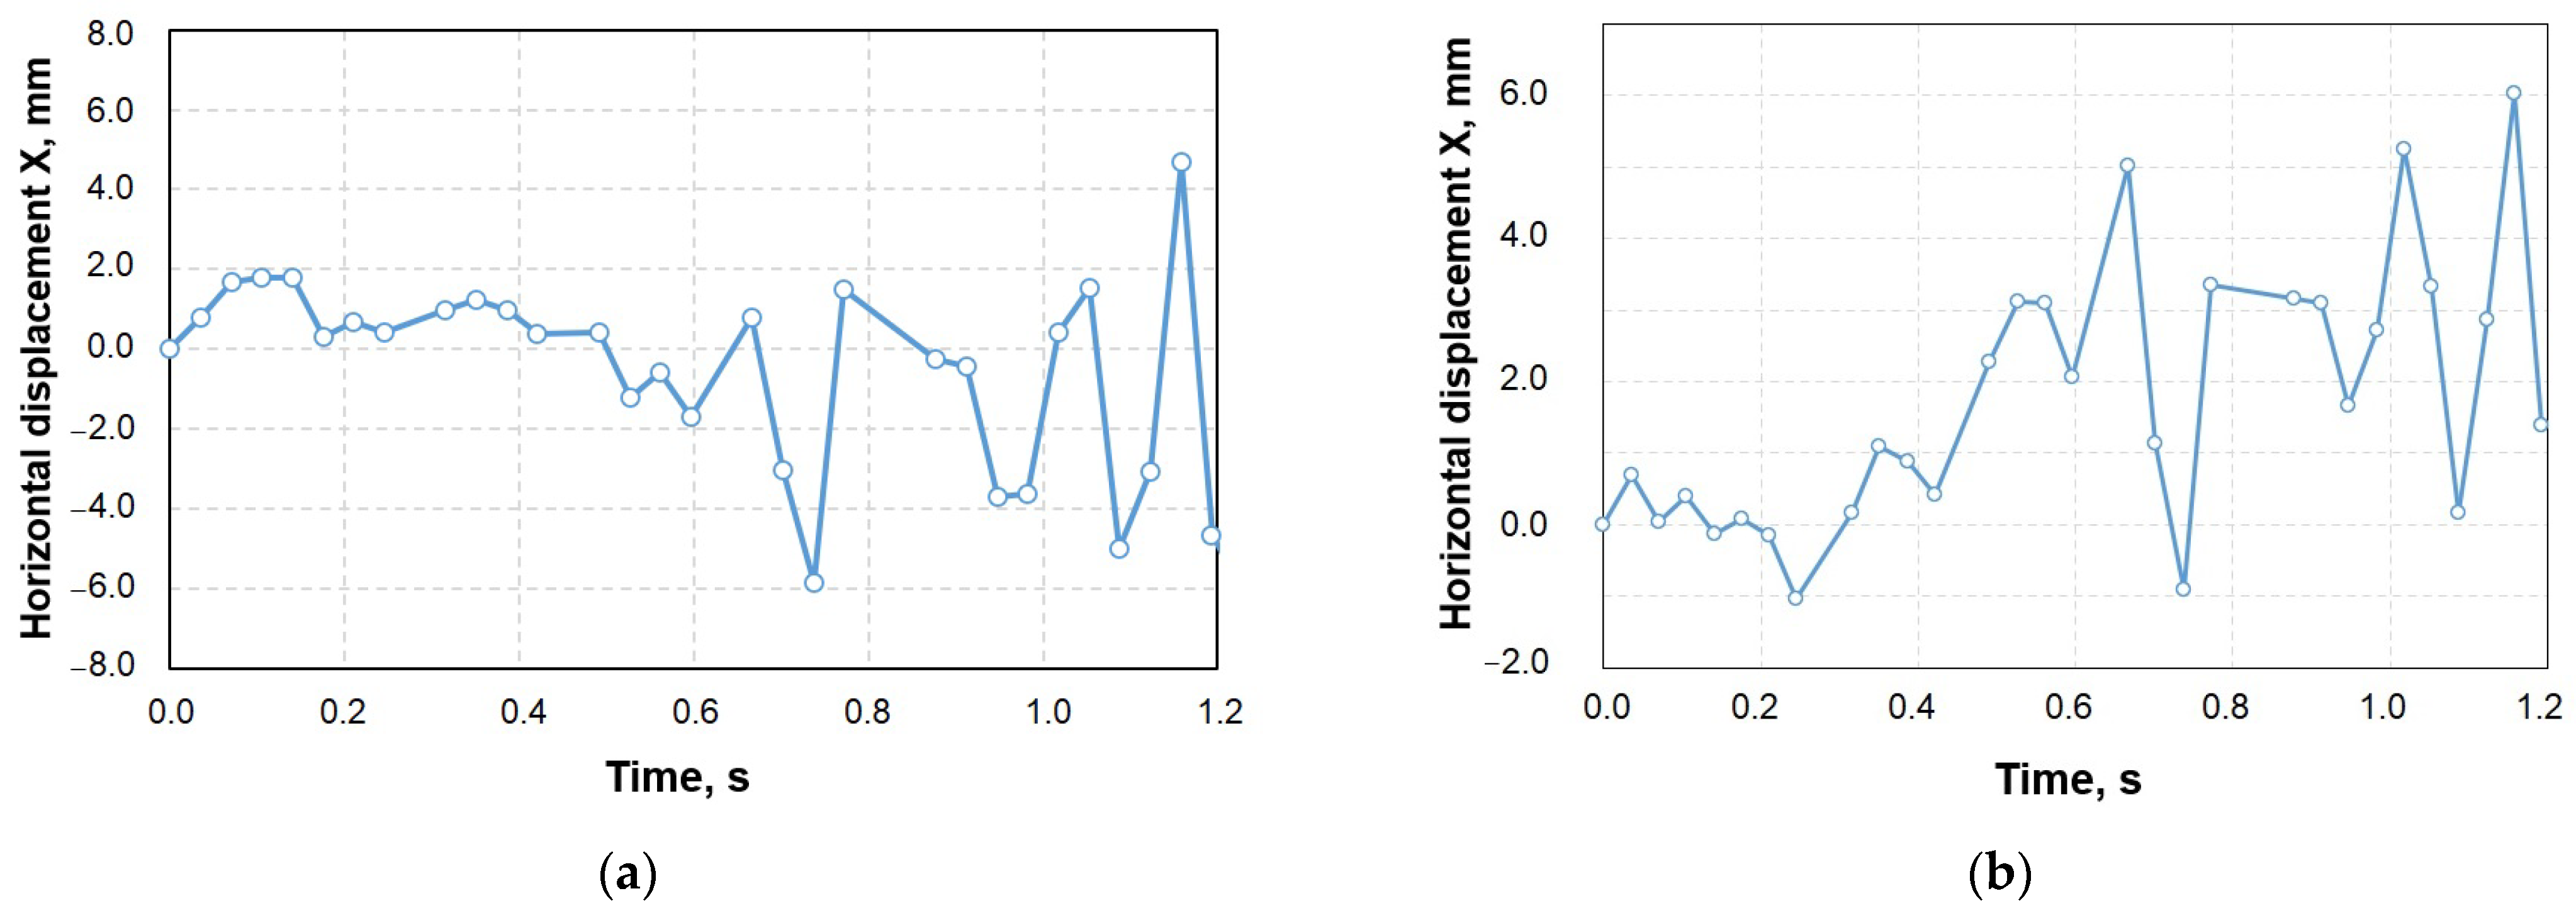
3.1.2. Dynamic Response of the Frame
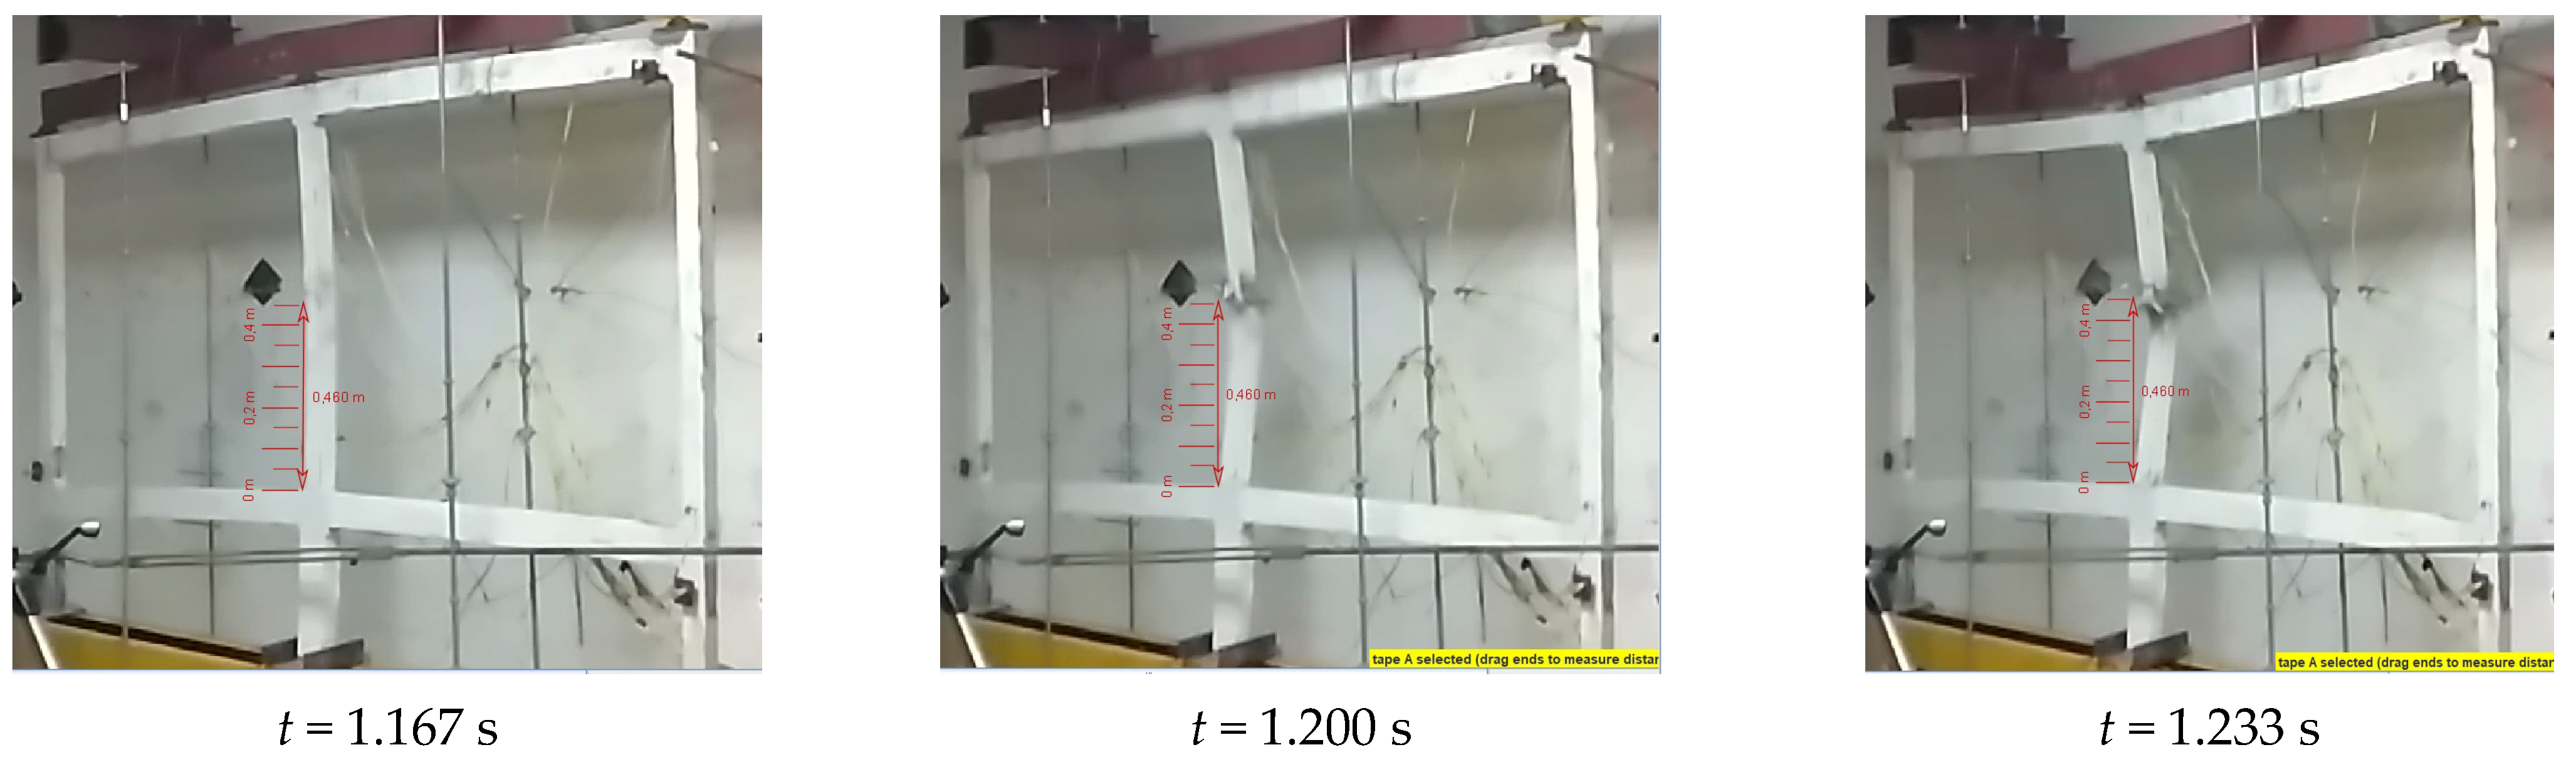
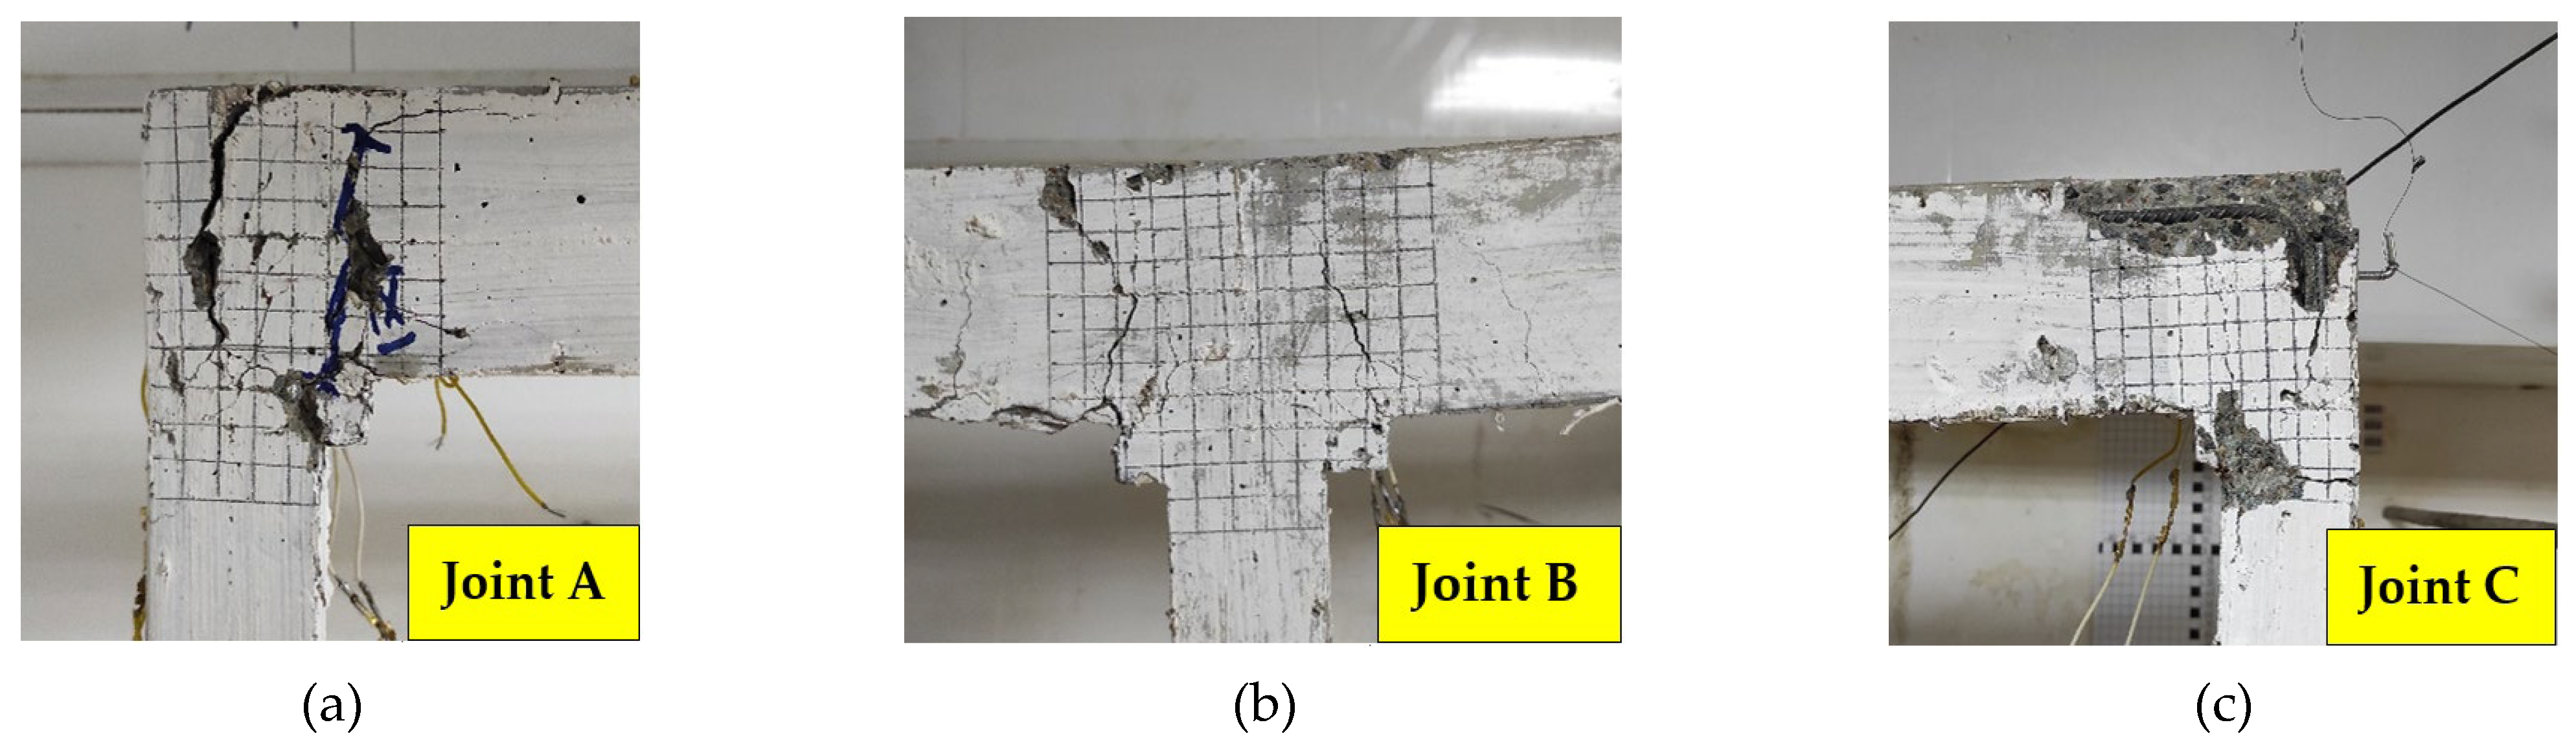
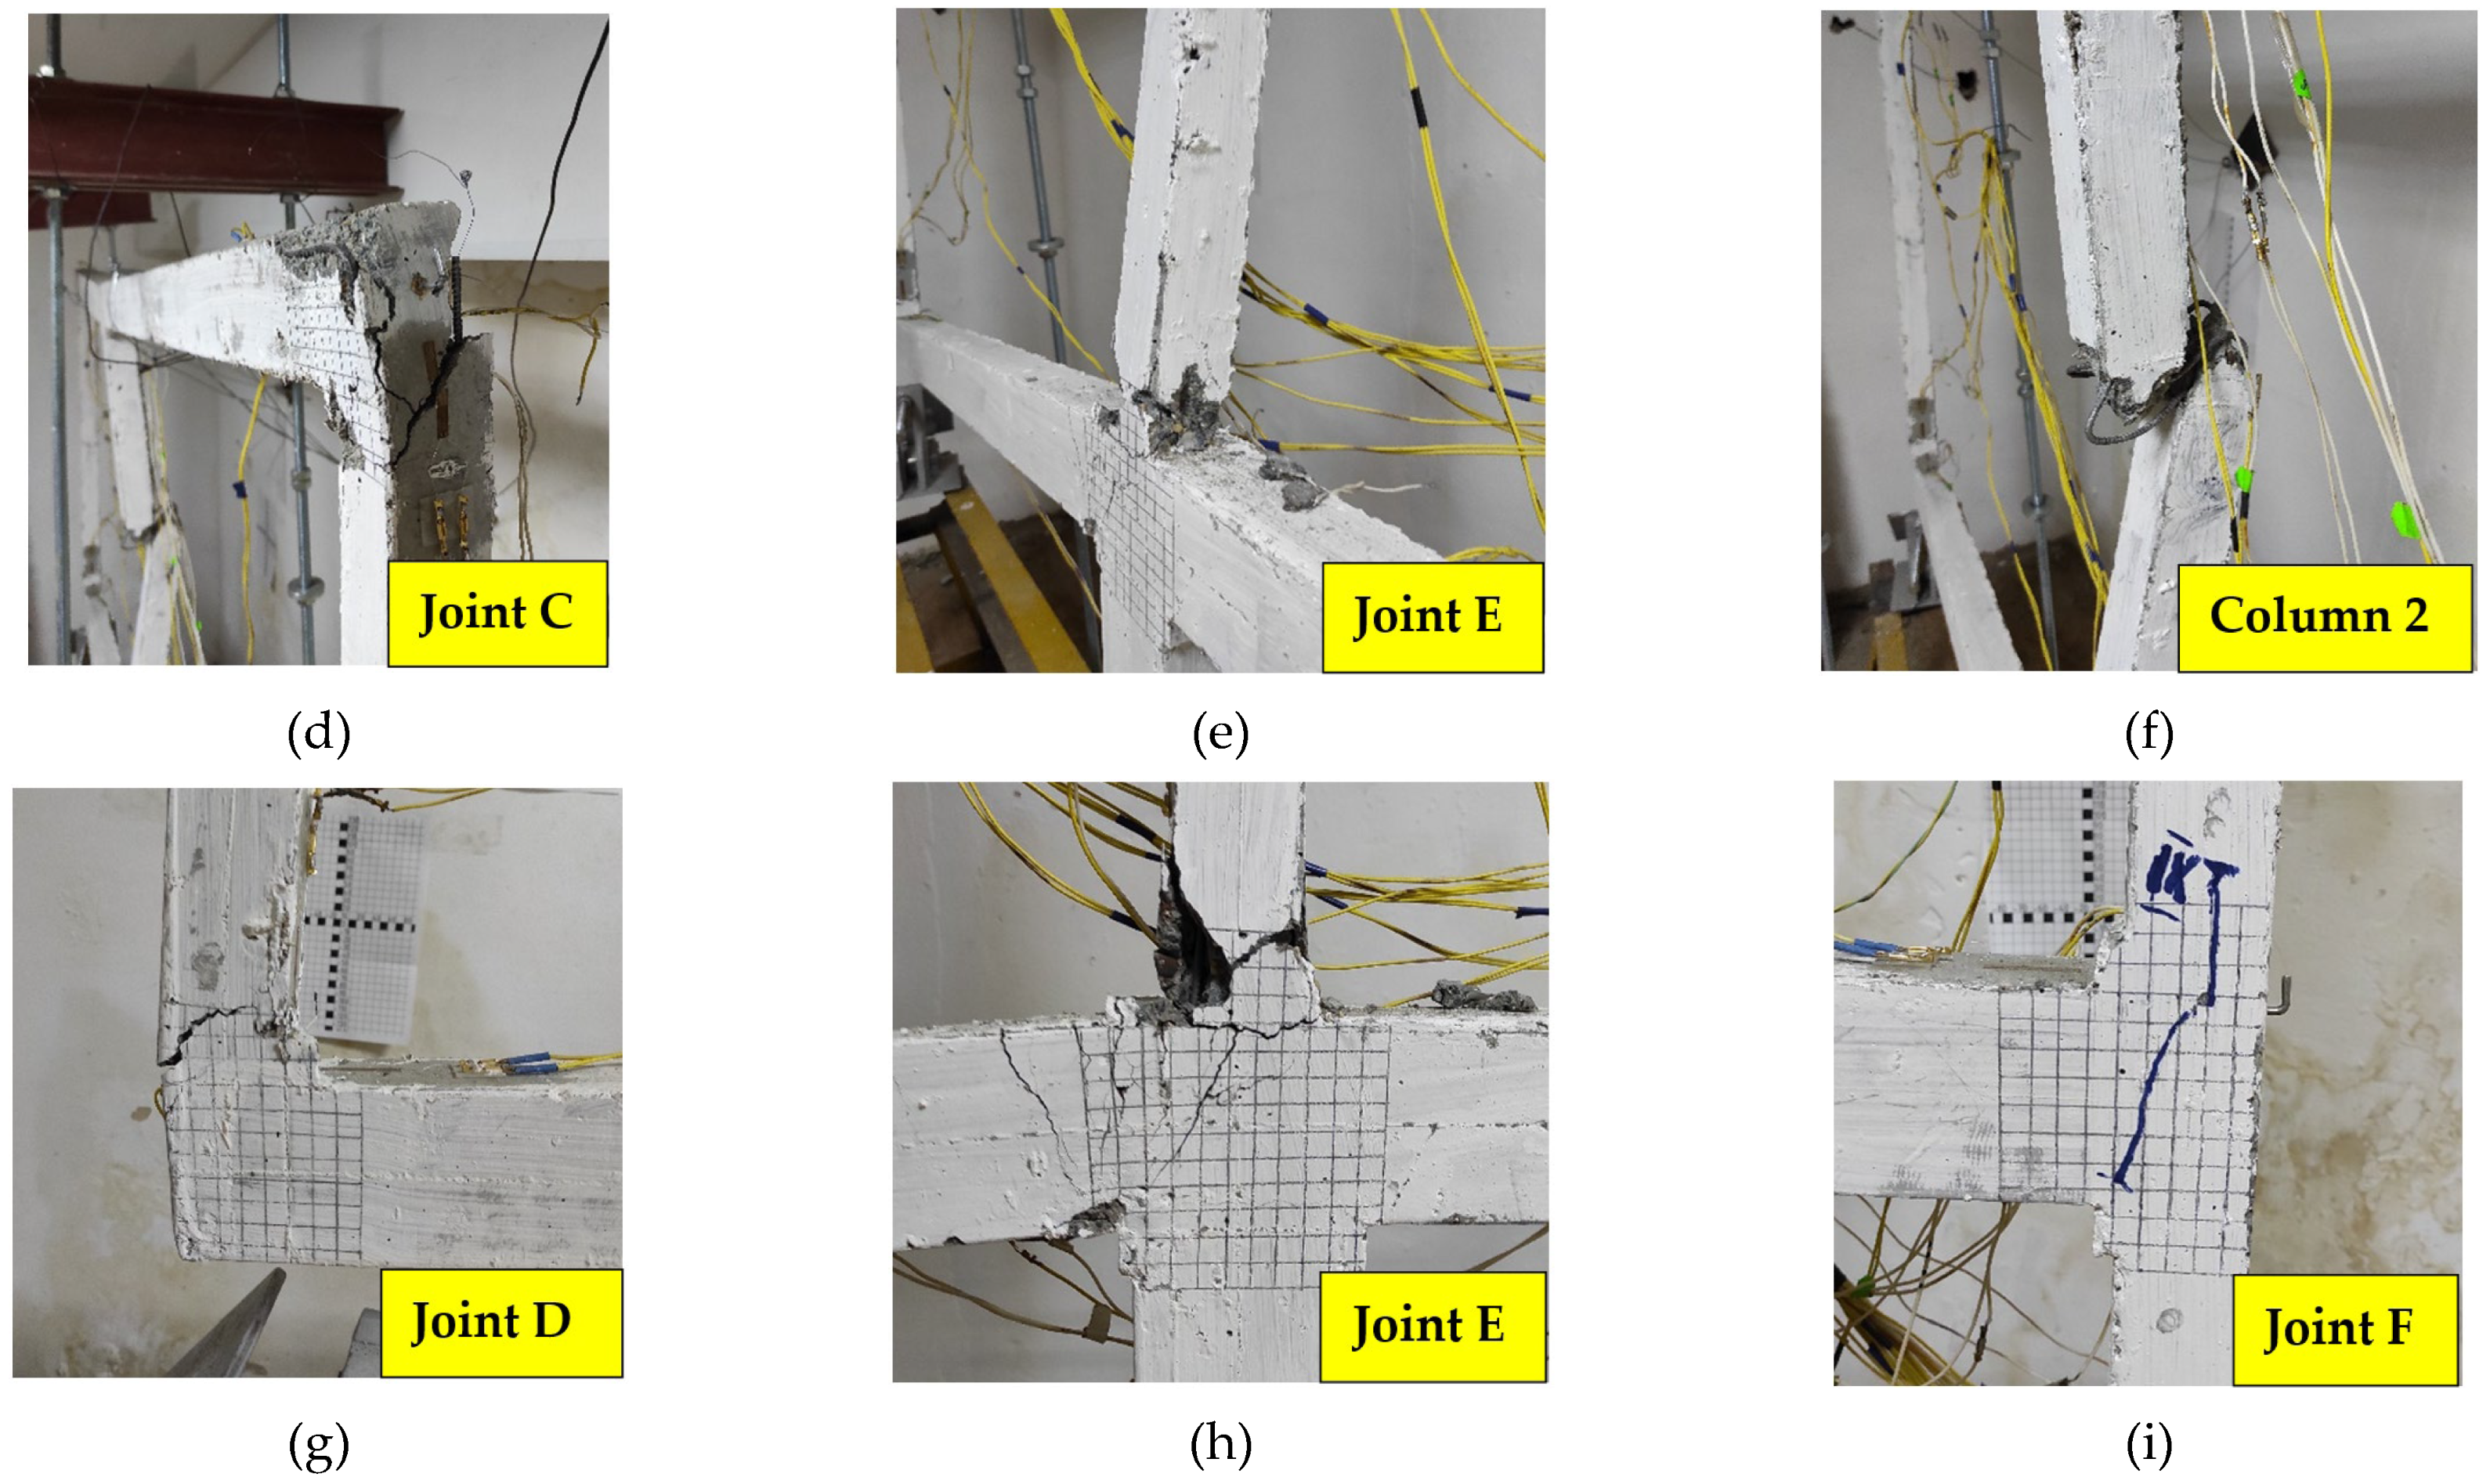
3.1.3. Deformation and Failure of the Test Frame under a Corner Column Removal Scenario
3.2. Numerical Simulation Results
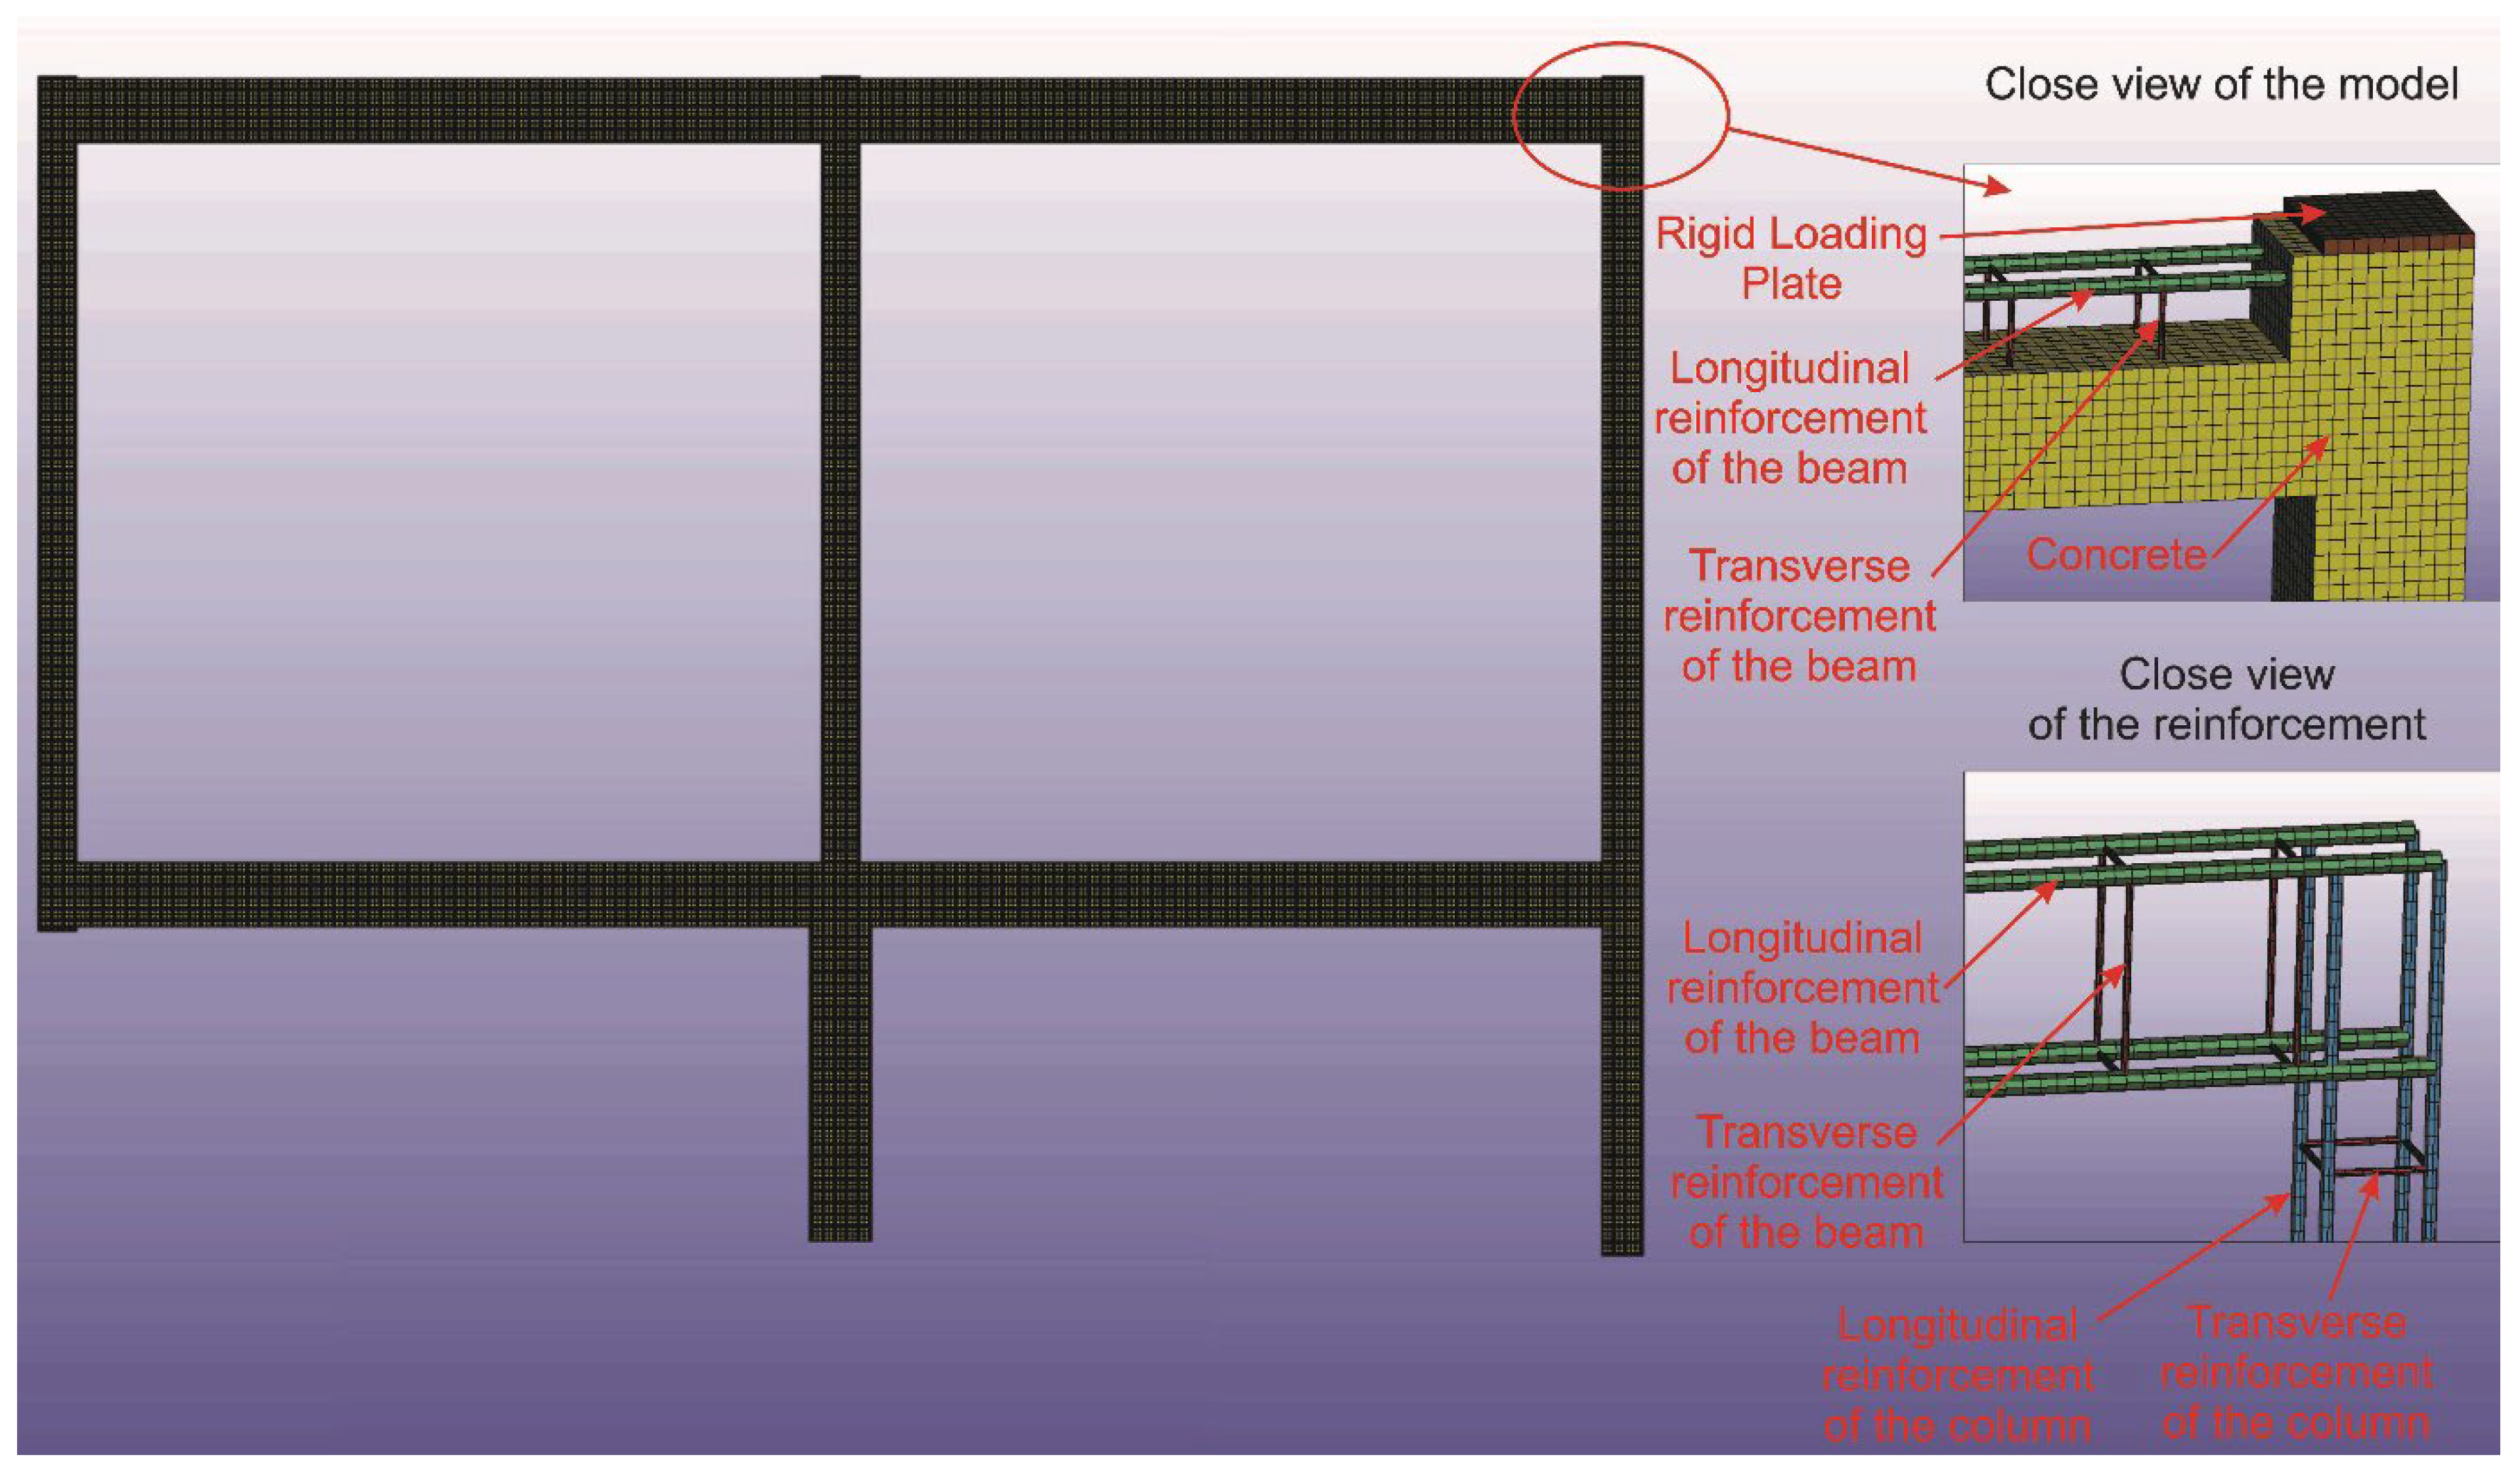
3.2.1. Finite Element Modeling and Criteria Used to Evaluate the Ultimate State of the Test Frame
3.2.2. Finite Element Types
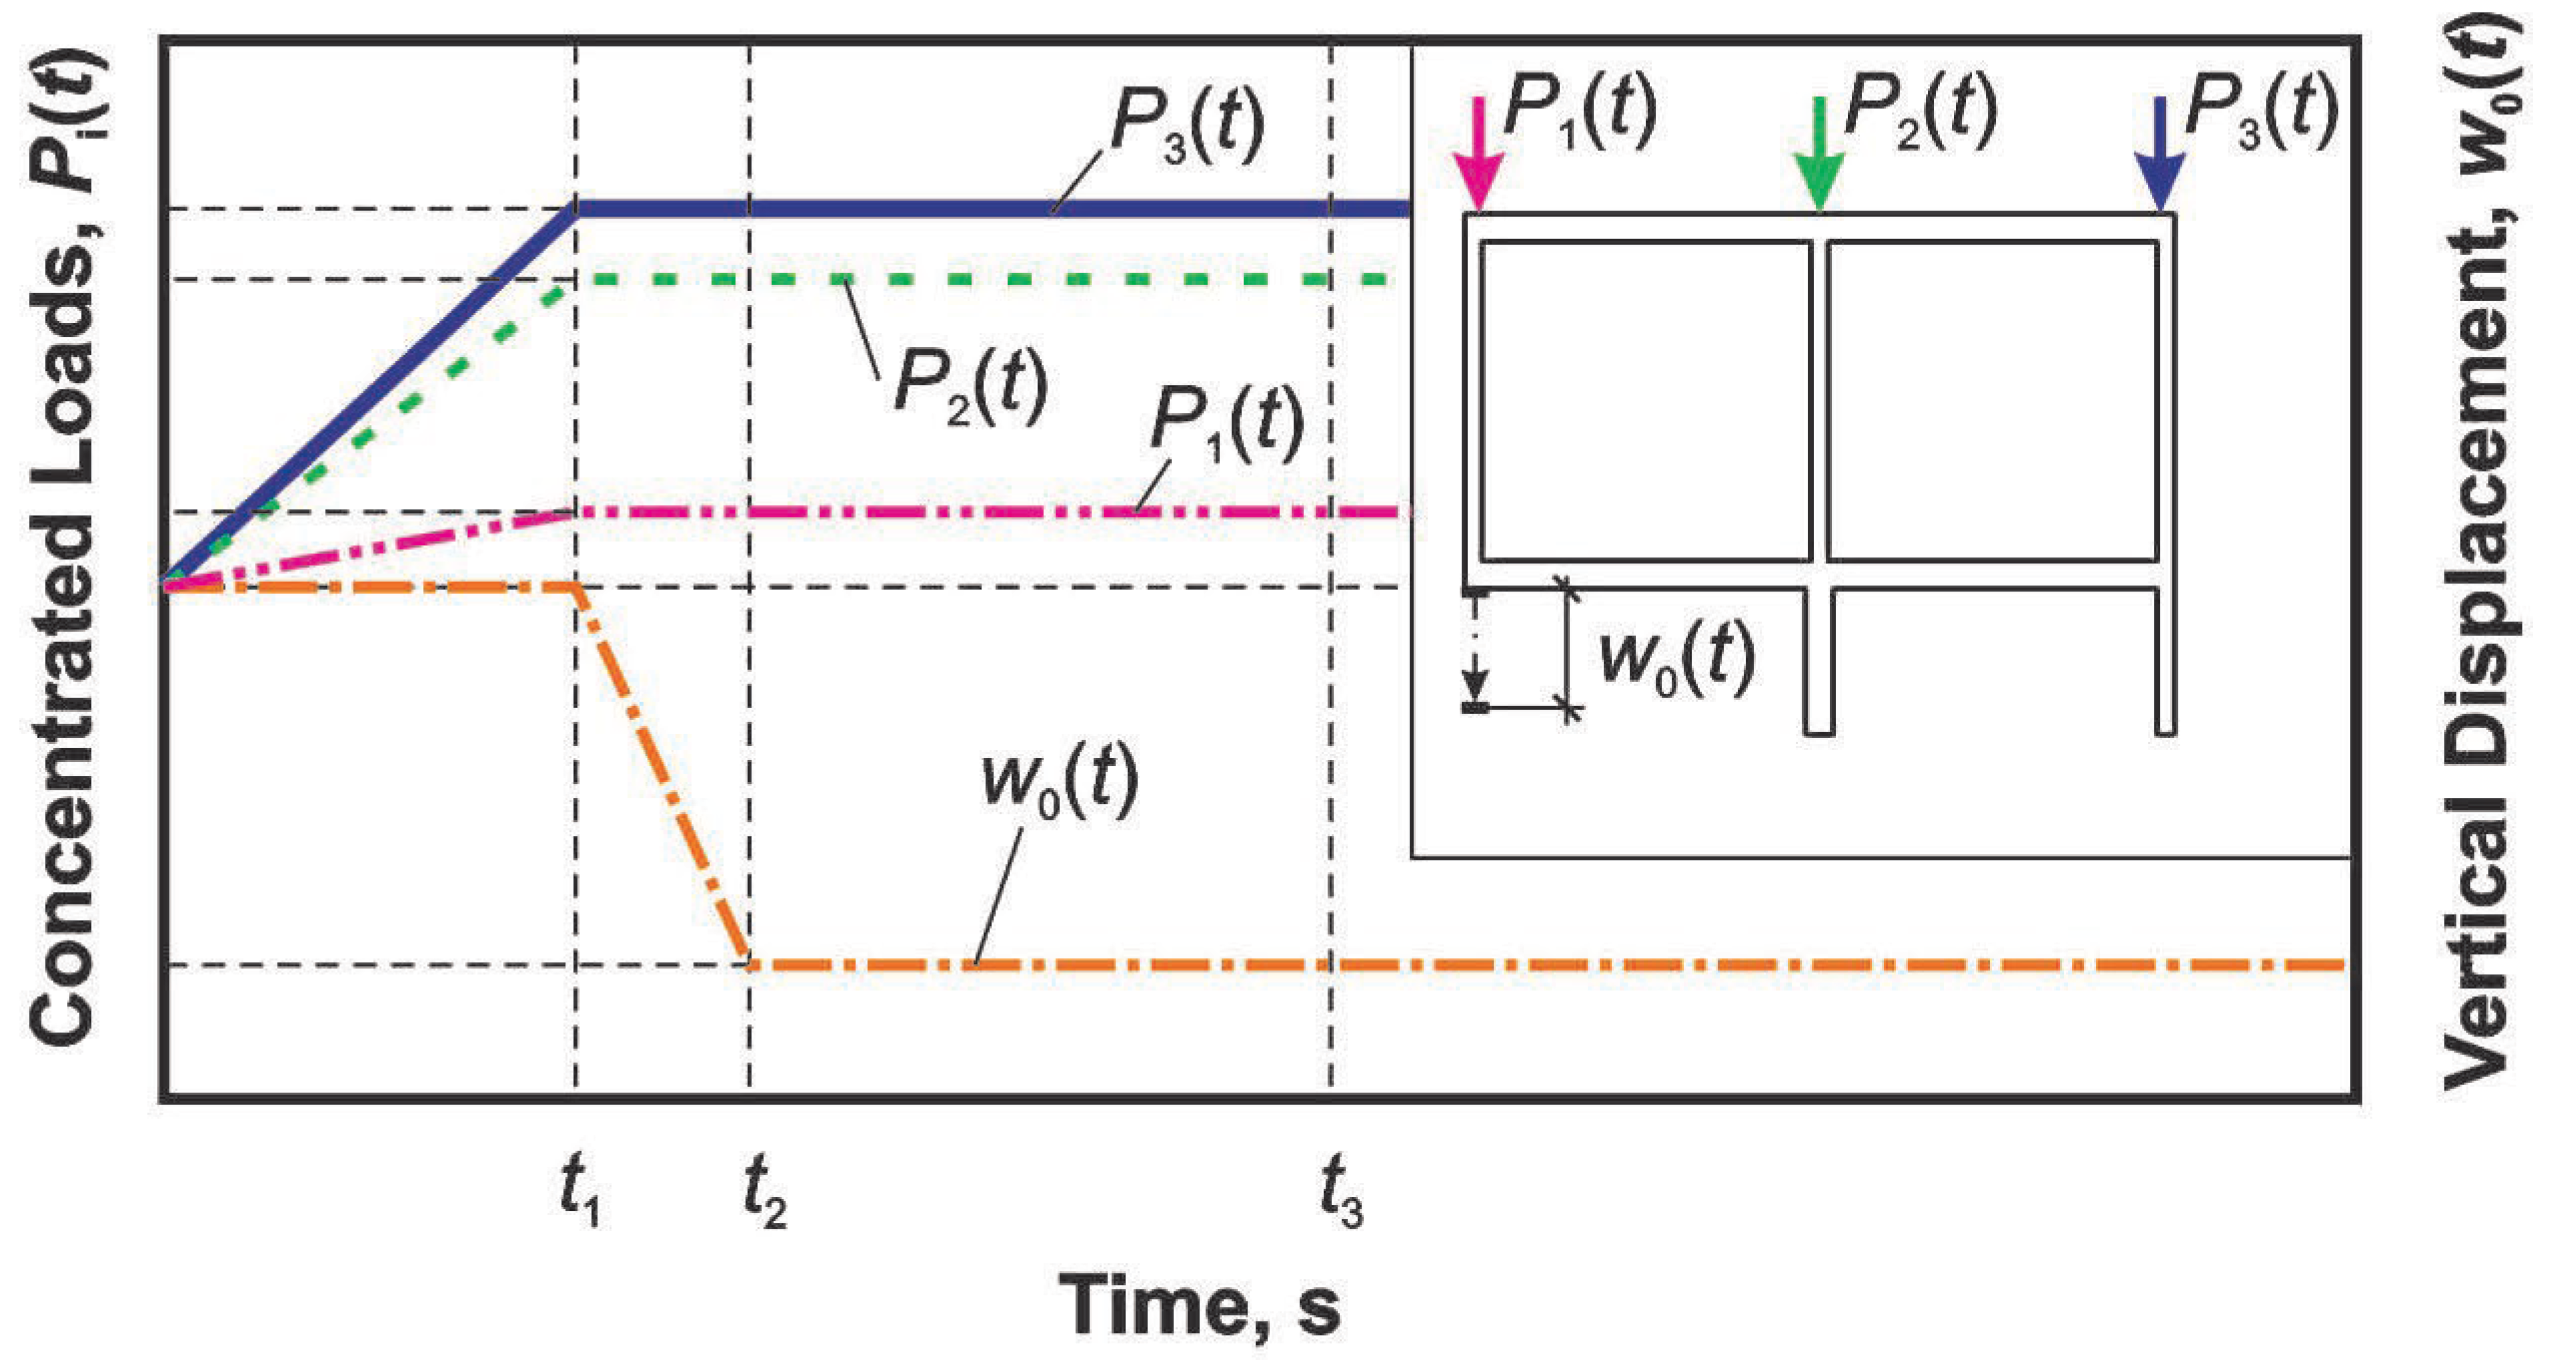
3.2.3. Loads and Boundary Conditions
3.2.4. Material Modeling
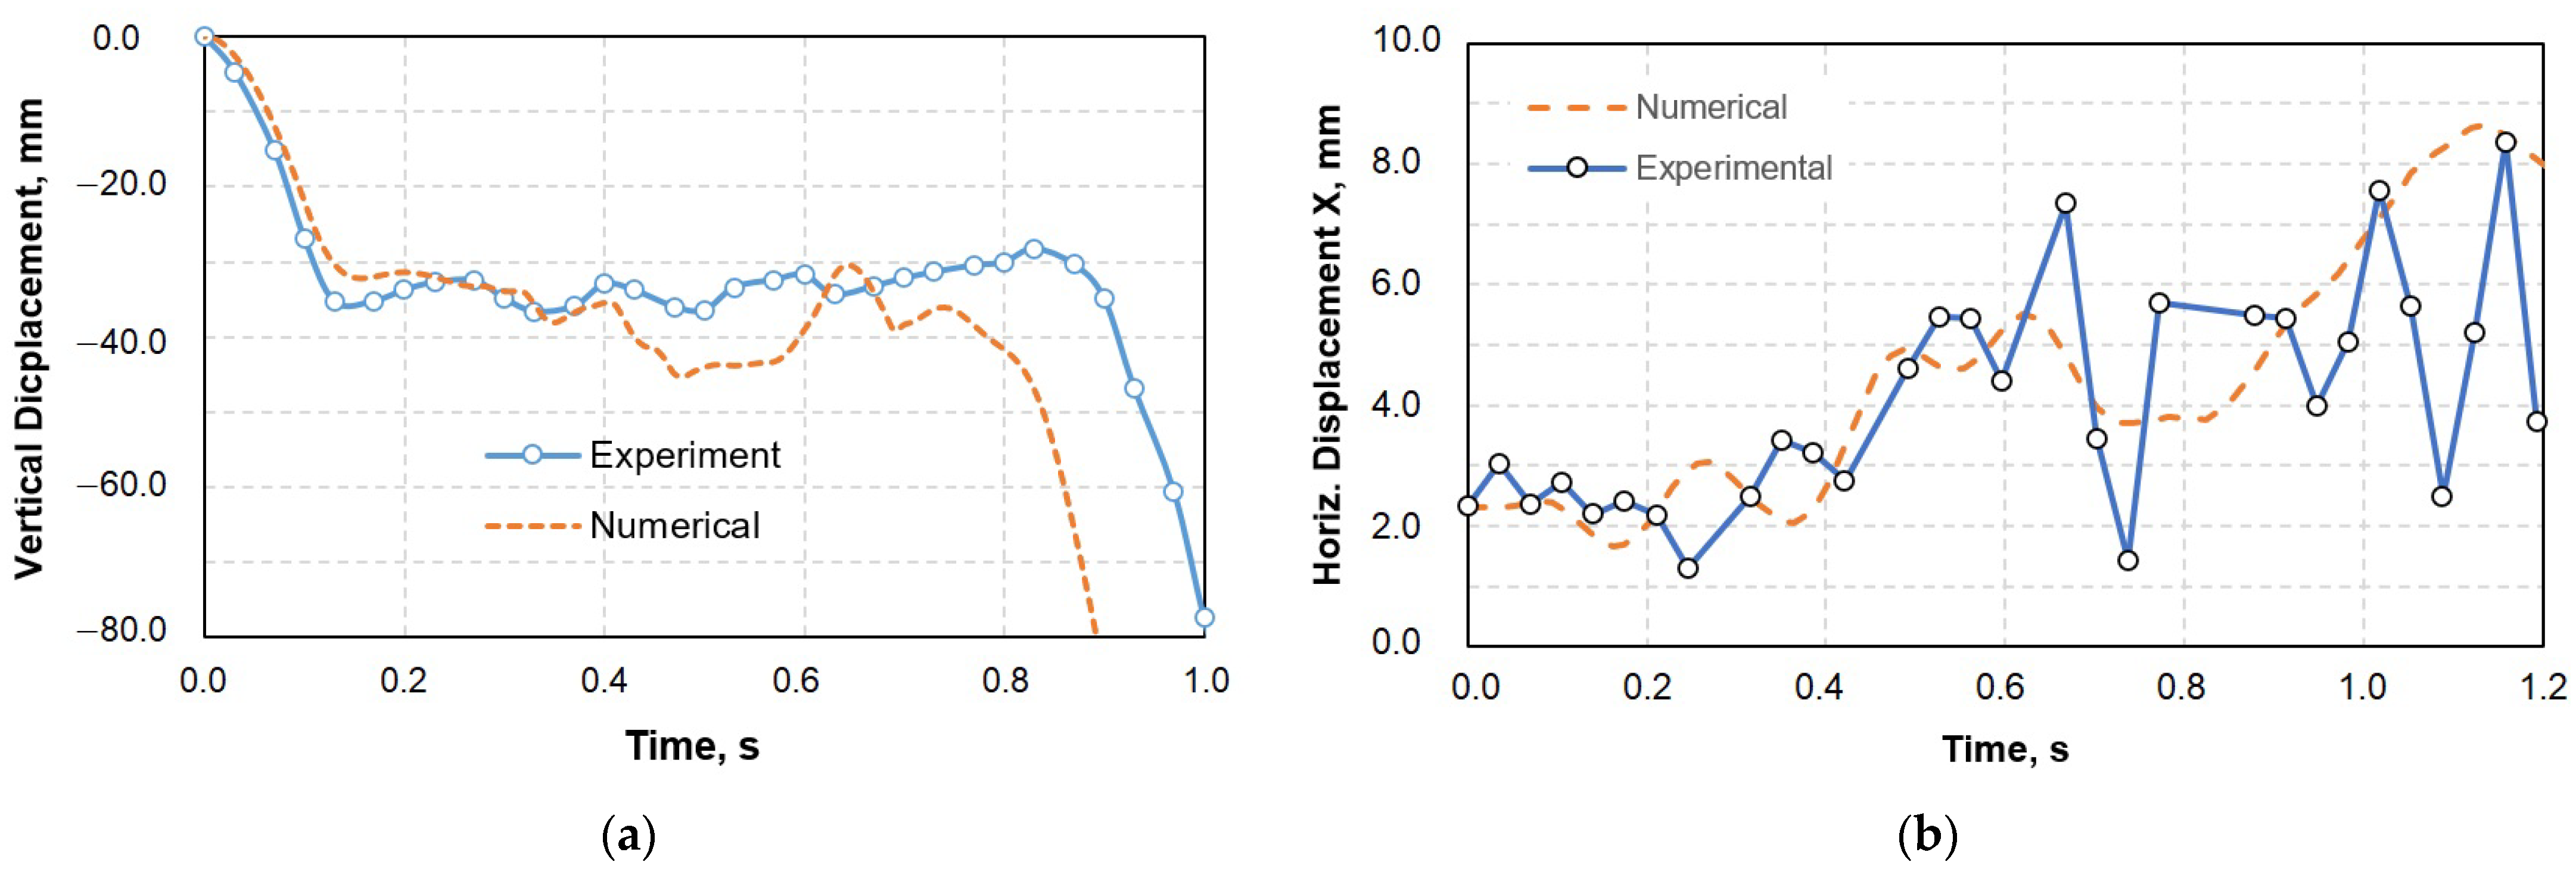
3.2.5. Comparison between the Experimental Results and Numerical Simulation
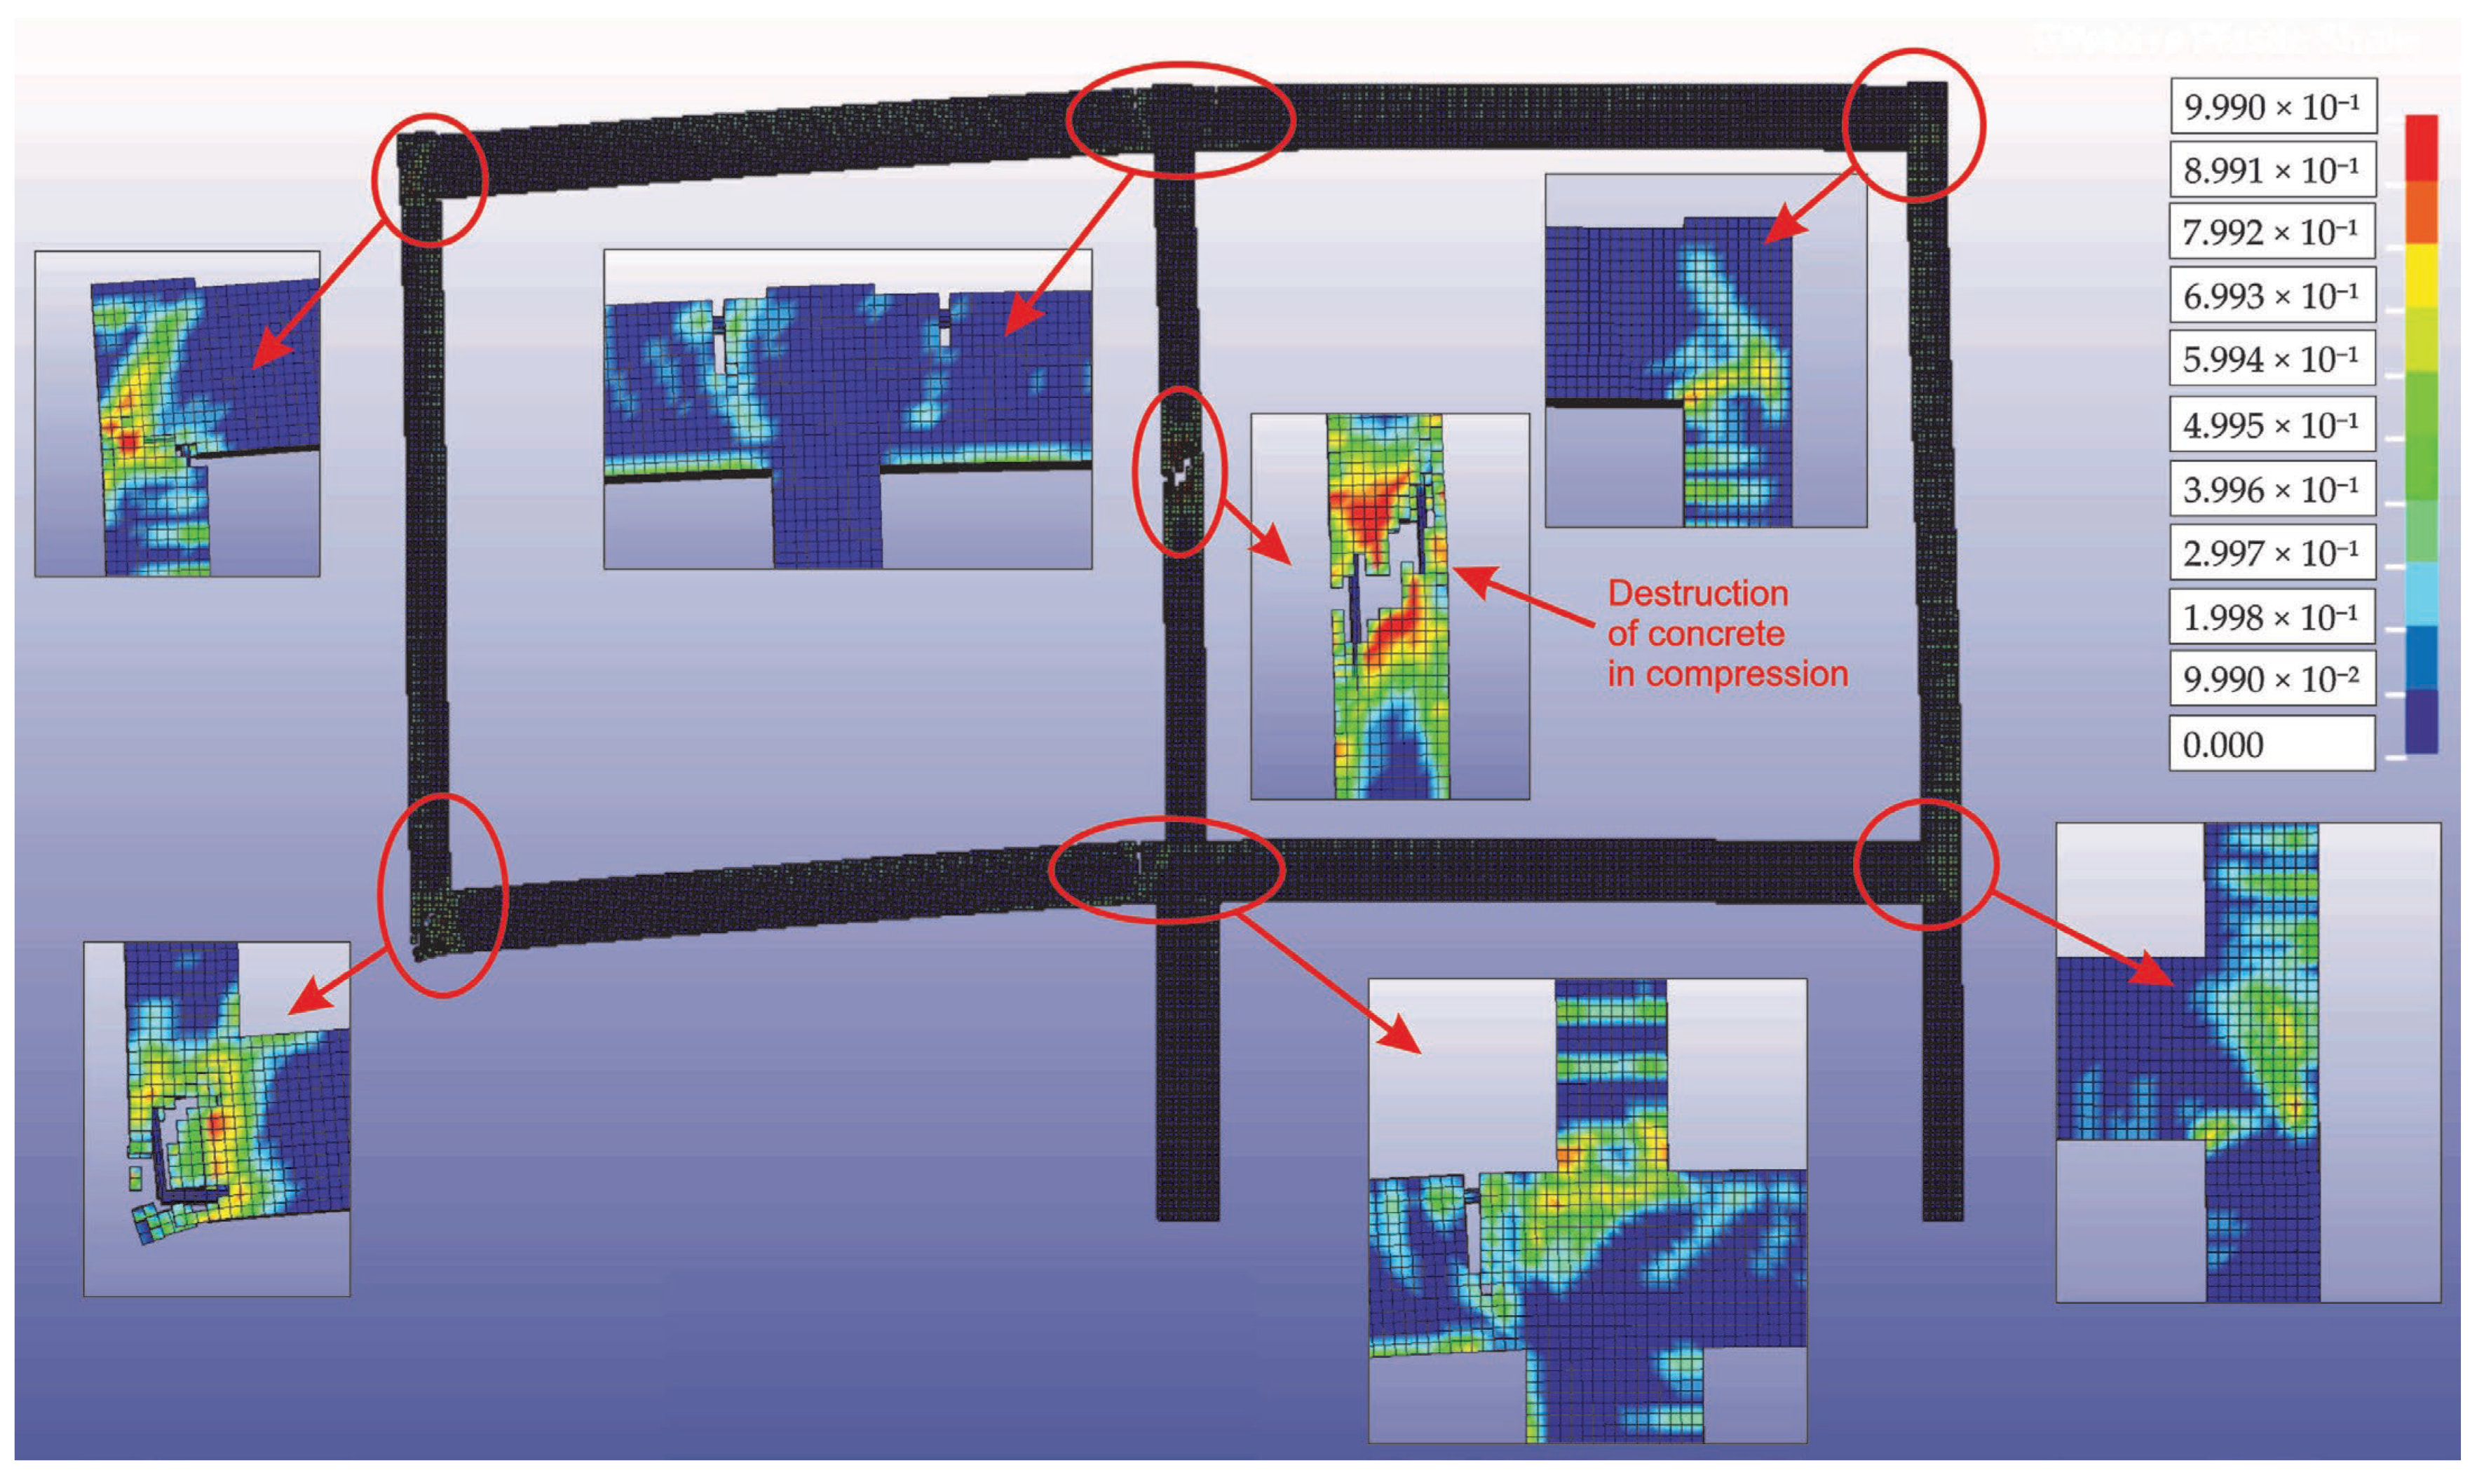
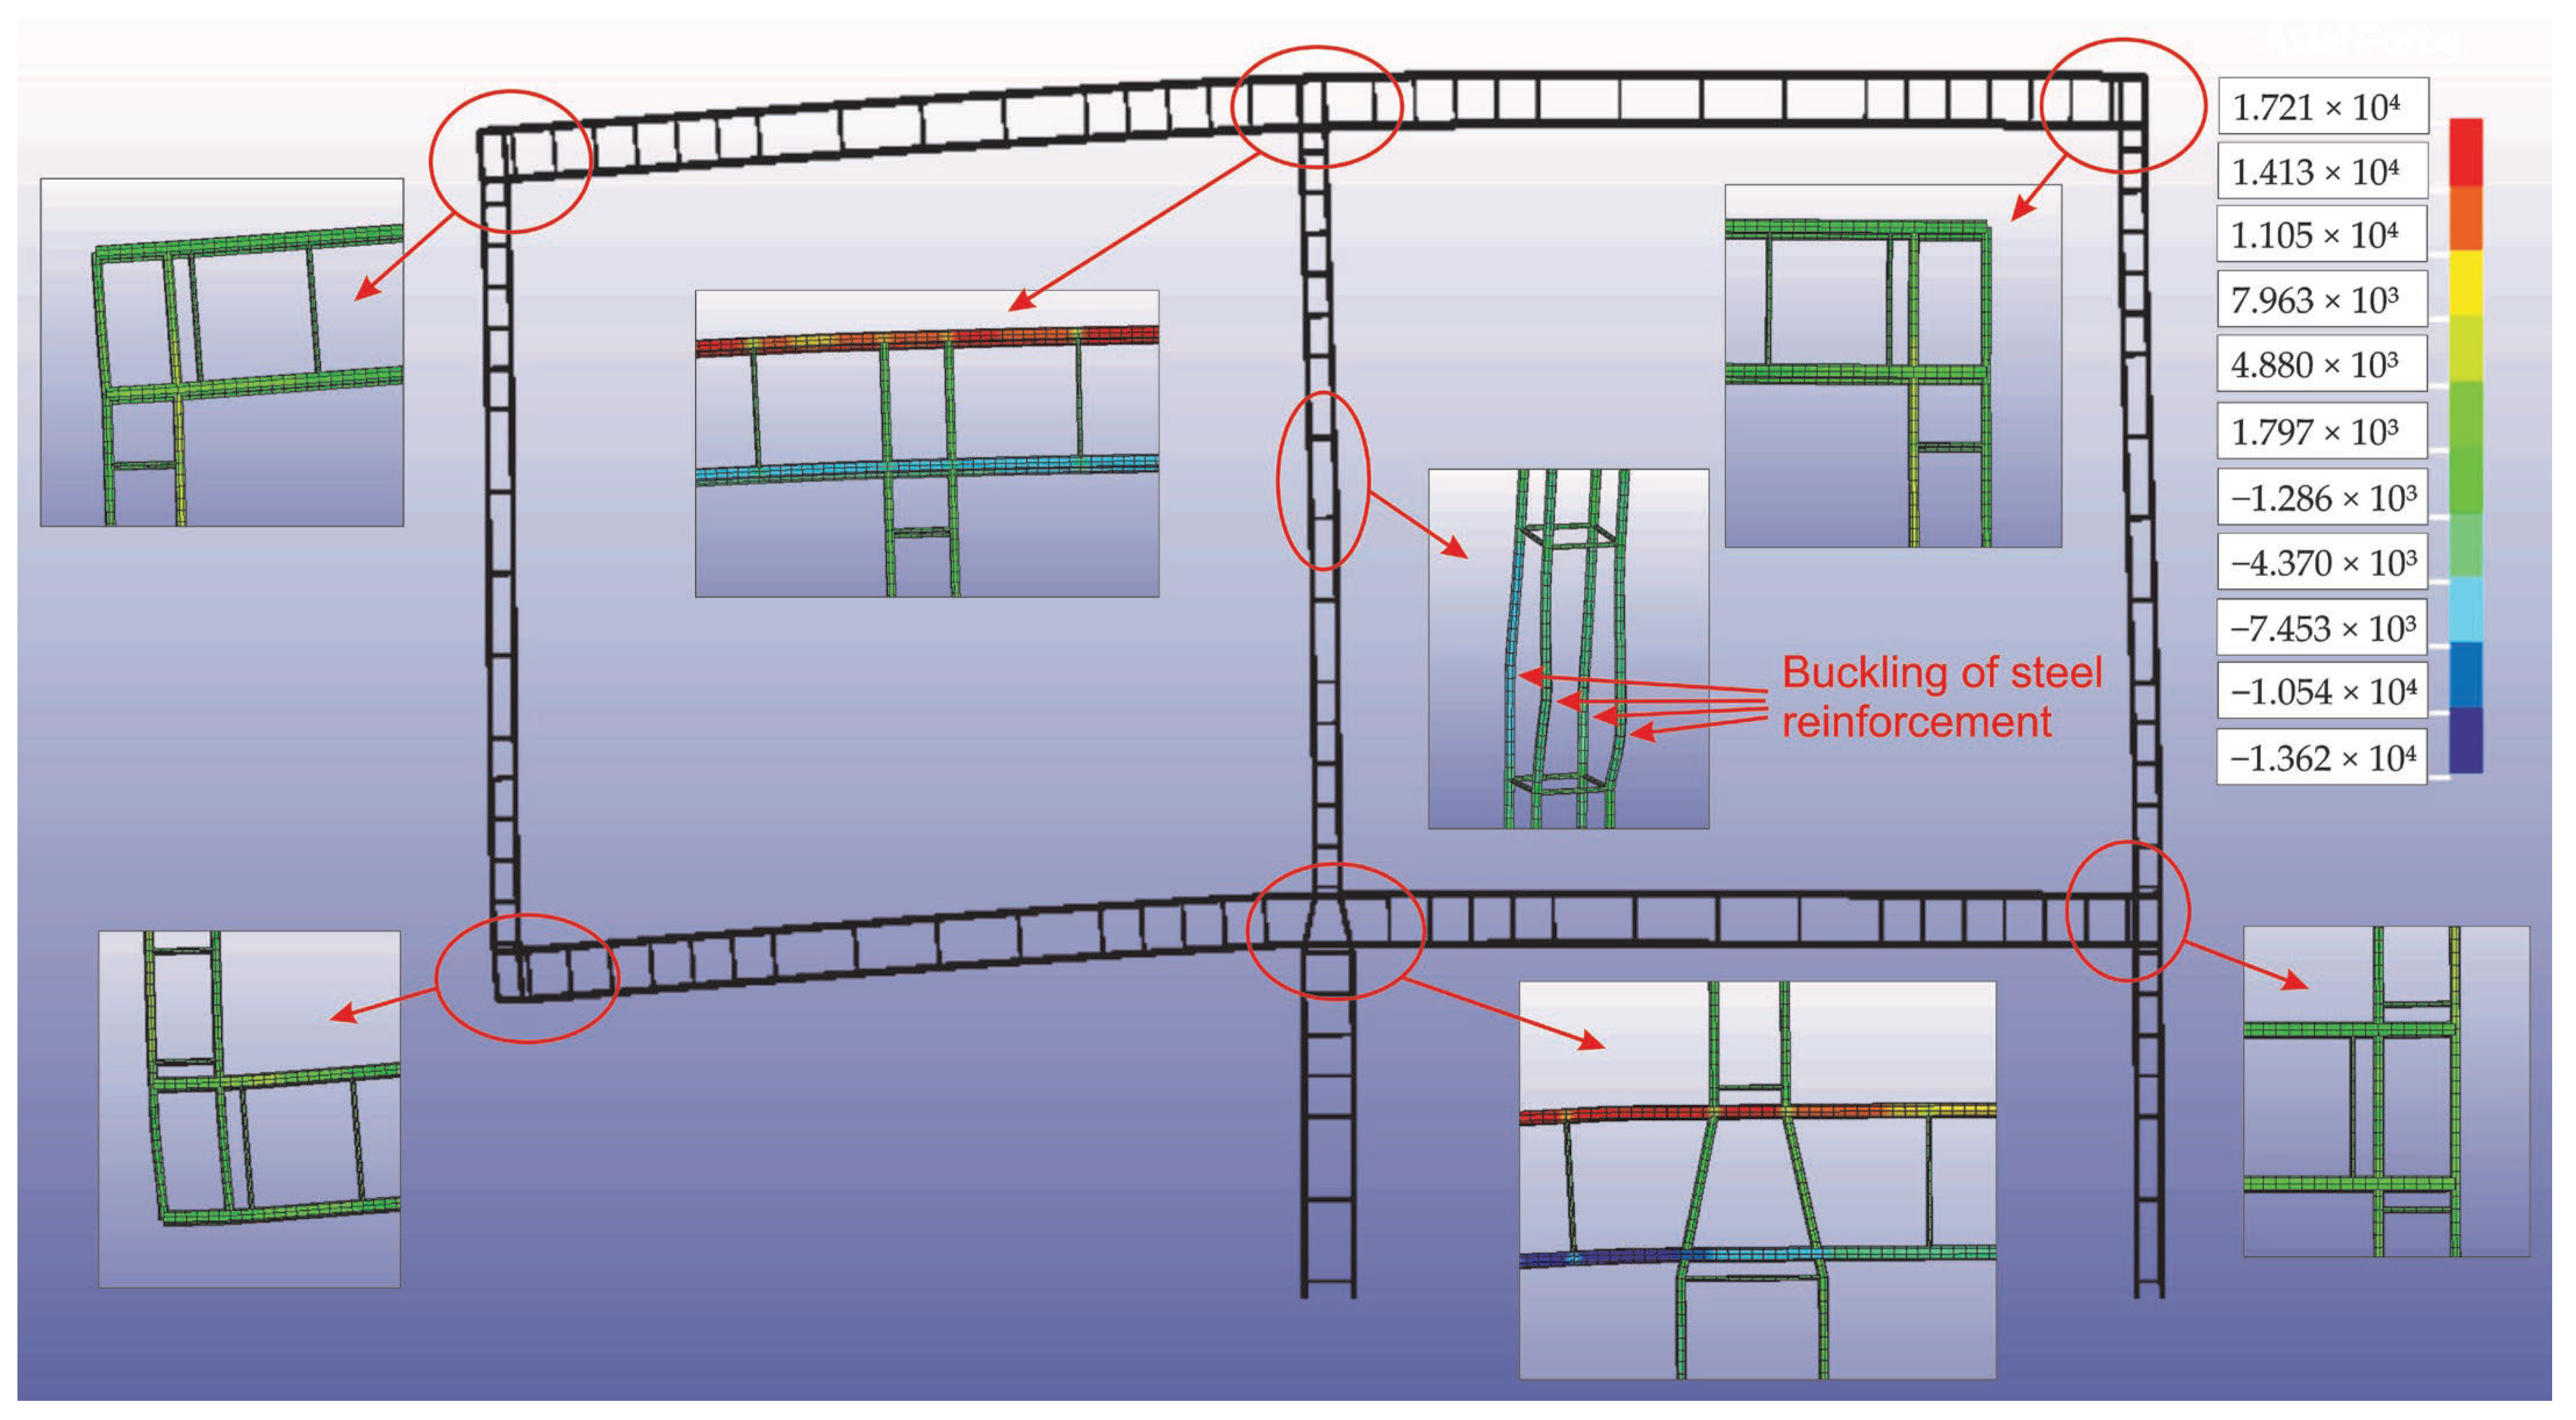
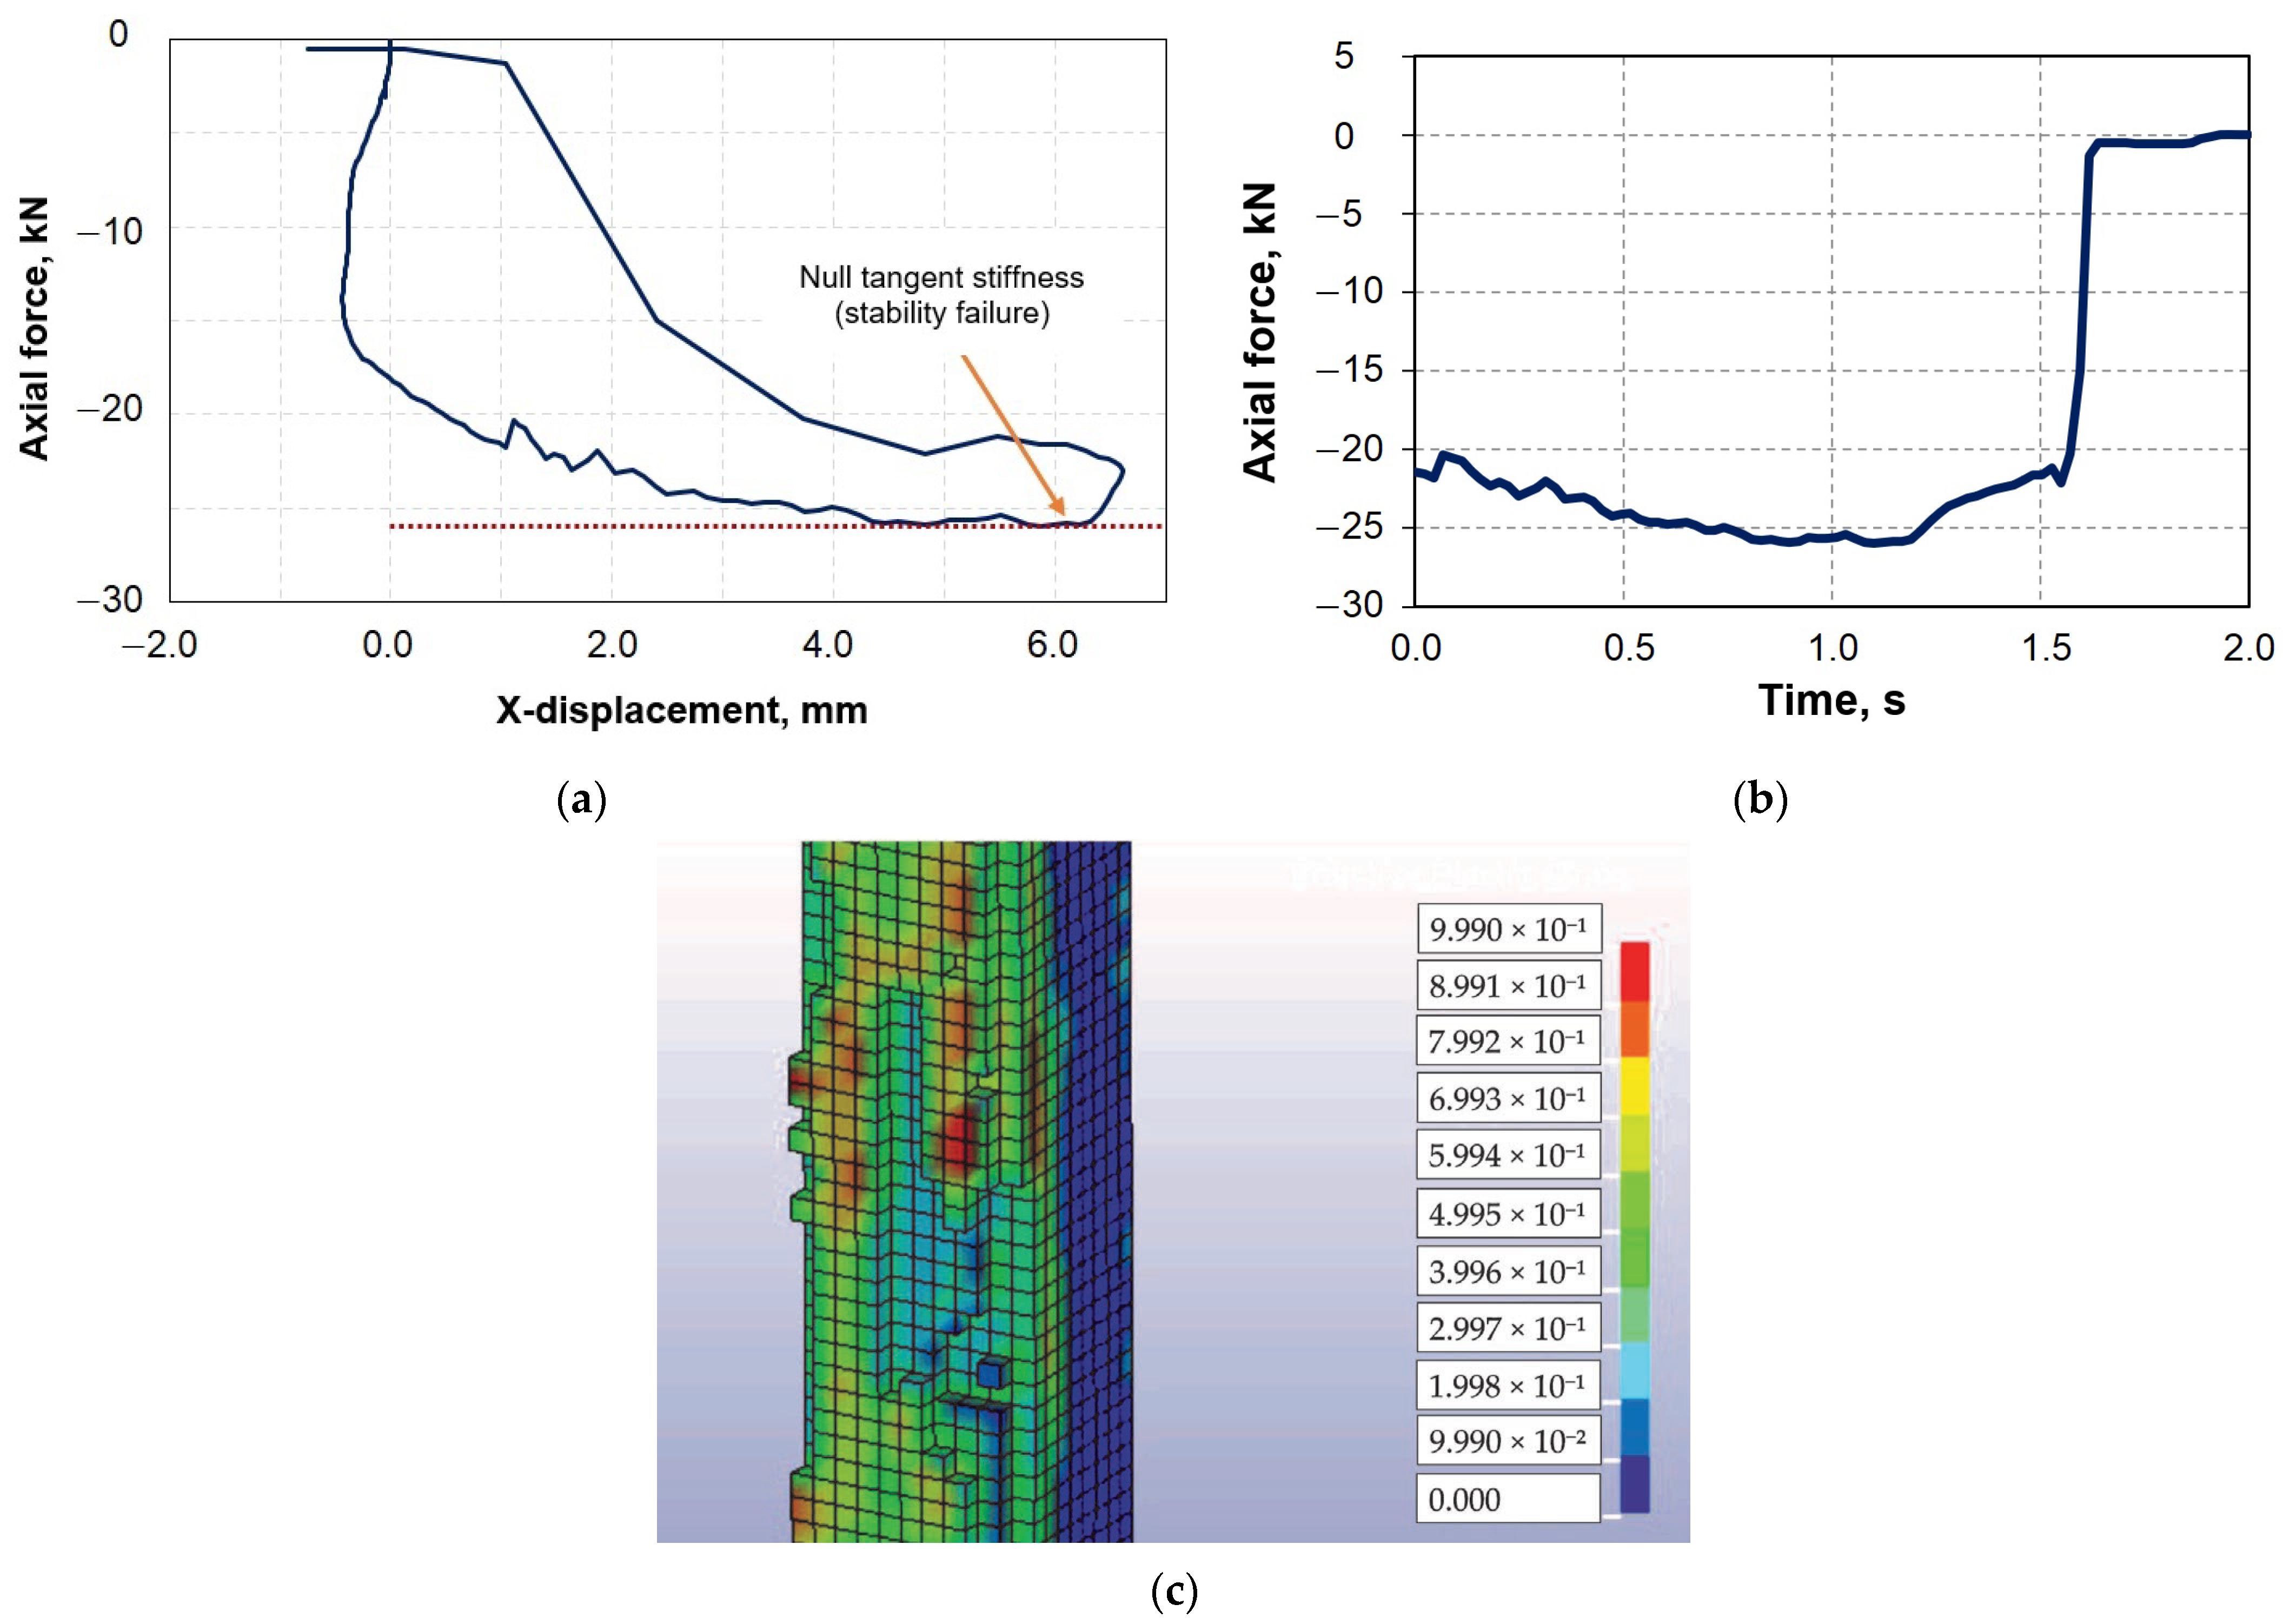
3.2.6. Analysis of the Failure Mechanism and the Criterion of Tangent Stiffness
4. Conclusions
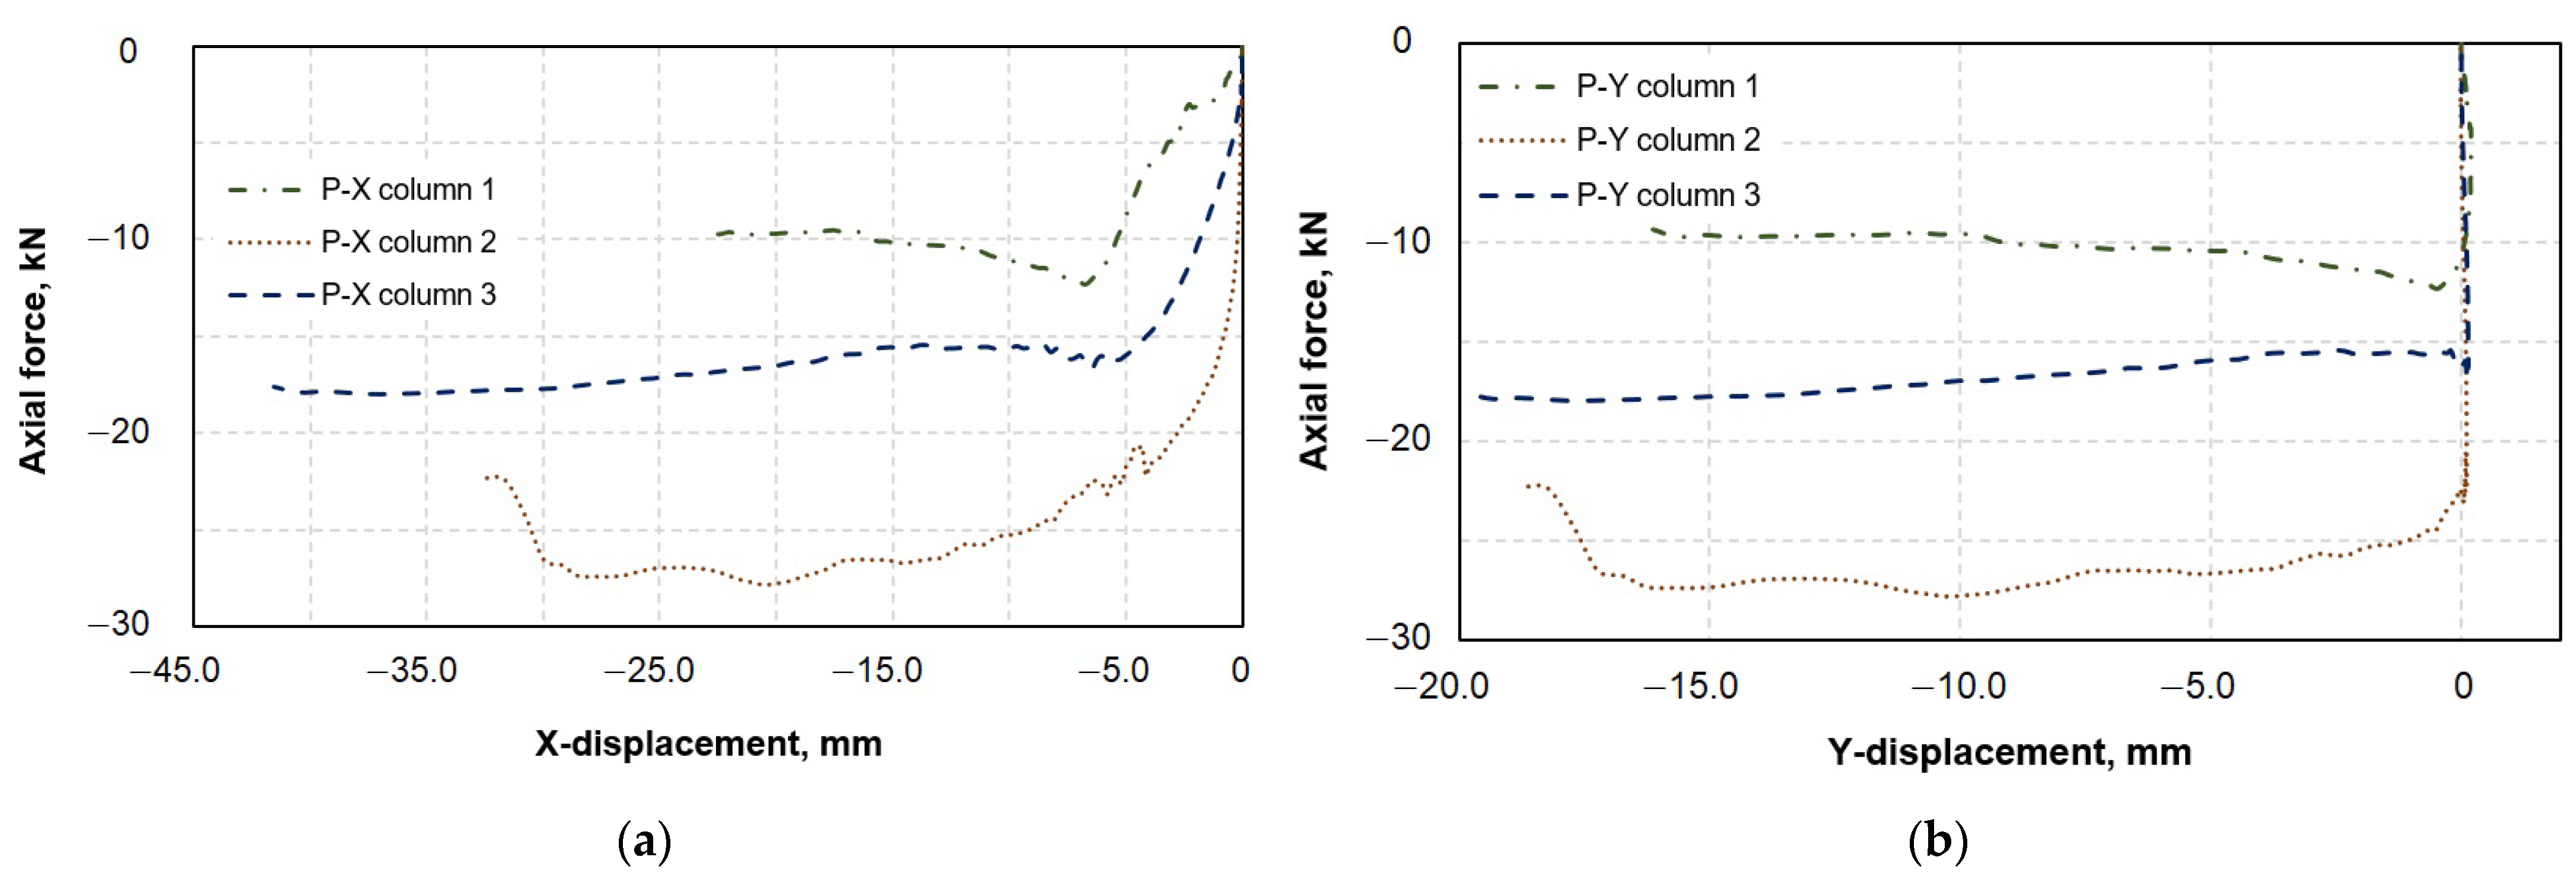
- Experimental and numerical studies of the behavior of a reinforced concrete frame under quasistatic loading with concentrated unequal loads revealed the load transfer between columns through the beams. Although these effects were minor in the frame under consideration due to the short loading period, their effect can be more significant under long-term loading. Therefore, they should be considered when the resistance of a building to accidental actions, such as a sudden collapse of a structural element, is analyzed.
- The failure mechanism of the reinforced concrete frame under consideration was triggered by the loss of stability of the column. The failure was fragile. No more than 0.033 s passed from the moment when the first signs of damage were detected to the complete destruction of compressed concrete in the middle part of the column. Some features of destruction of the experimental frame, such as the deformed state and patterns of damages, were, to a large extent, caused by a combination of actual boundary conditions and the loading pattern. However, stability failure can potentially be implemented in the frames of buildings with slender columns in the case of an extraordinary situation in which an accidental impact on a structure leads to a substantial increase in an axial force and a bending moment.
- The moment of the stability failure of the column of the experimental frame corresponded to the extremum on the force–displacement curve, indicating null tangent stiffness. Thus, the criterion of tangent stiffness can be proposed to evaluate the ultimate state of a structure subjected to an accidental impact.
Author Contributions
Funding
Institutional Review Board Statement
Informed Consent Statement
Data Availability Statement
Conflicts of Interest
References
- Wang, H.; Zhang, A.; Li, Y.; Yan, W. A Review on Progressive Collapse of Building Structures. Open Civ. Eng. J. 2014, 8, 183–192. [Google Scholar] [CrossRef] [Green Version]
- Abdelwahed, B. A Review on Building Progressive Collapse, Survey and Discussion. Case Stud. Constr. Mater. 2019, 11, e00264. [Google Scholar] [CrossRef]
- Fedorova, N.V.; Savin, S.Y. Progressive Collapse Resistance of Facilities Experienced to Localized Structural Damage—An Analytical Review. Build. Reconstr. 2021, 95, 76–108. [Google Scholar] [CrossRef]
- Ellingwood, B.R.; Smilowitz, R.; Dusenberry, D.O.; Duthinh, D.; Lew, H.S.; Carino, N.J. Best Practices for Reducing the Potential for Progressive Collapse in Buildings; U.S. National Institute of Standards and Technology (NIST): Gaithersburg, MD, USA, 2007. Available online: https://www.nist.gov/publications/best-practices-reducing-potential-progressive-collapse-buildings (accessed on 21 November 2022).
- Tamrazyan, A.G.; Alekseytsev, A.V. Optimization of Reinforced Concrete Beams under Local Mechanical and Corrosive Damage. In Engineering Optimization; Taylor & Francis: Oxford, UK, 2022. [Google Scholar]
- Alekseytsev, A.V. Mechanical Safety of Reinforced Concrete Frames under Complex Emergency Actions. Mag. Civ. Eng. 2021, 103, 10306. [Google Scholar]
- Pearson, C.; Delatte, N. Ronan Point Apartment Tower Collapse and its Effect on Building Codes. J. Perform. Constr. Facil. 2005, 19, 172–177. [Google Scholar] [CrossRef] [Green Version]
- Kong, X.; Smyl, D. Investigation of the Condominium Building Collapse in Surfside, Florida: A Video Feature Tracking Approach. Structures 2022, 43, 533–545. [Google Scholar] [CrossRef]
- Tagel-Din, H.; Rahman, N.A. Simulation of the Alfred P. Murrah Federal Building Collapse due to Blast Loads. In Proceedings of the AEI 2006: Building Integration Solutions, Proceedings of the 2006 Architectural Engineering National Conference, Omaha, NE, USA, 29 March–1 April 2006. [Google Scholar]
- Belostotsky, A.M.; Pavlov, A.S. Long Span Buildings Analysis under Physical, Geometric and Structural Nonlinearities Consideration. Int. J. Comput. Civ. Struct. Eng. 2010, 6, 80–86. [Google Scholar]
- Kiakojouri, F.; Biagi, V.D.; Chiai, B.; Sheidaii, M.R. Progressive collapse of framed building structures: Current knowledge and future prospects. Eng. Struct. 2020, 206, 110061. [Google Scholar] [CrossRef]
- UFC 4-023-03; Design of Buildings to Resist Progressive Collapse. Unified Facilities Criteria; Department of Defense (DoD): Washington, DC, USA, 2016. Available online: https://wbdg.org/FFC/DOD/UFC/ufc_4_023_03_2009_c3.pdf (accessed on 21 November 2022).
- General Services Administration (GSA). Alternative Path Analysis and Design Guidelines for Progressive Collapse Resistance; Office of Chief Architects: Washington, DC, USA, 2013. Available online: https://www.gsa.gov/cdnstatic/Progressive_Collapse_2016.pdf (accessed on 21 November 2022).
- ASCE/SEI 7-16; Minimum Design Loads and Associated Criteria for Buildings and Other Structures. Structural Engineering Institute of the ASCE; American Society of Civil Engineers (ASCE): Reston, VA, USA, 2016. Available online: https://law.resource.org/pub/us/cfr/ibr/003/asce.7.2002.pdf (accessed on 21 December 2022).
- EN 1991-1-7; Eurocode 1—Actions on Structures–Part 1–7: General Actions–Accidental Actions. CEN Comité Européen de Normalisation CEN: Brussels, Belgium, 2006. Available online: https://www.phd.eng.br/wp-content/uploads/2015/12/en.1991.1.7.2006.pdf (accessed on 21 November 2022).
- GOST 27751-2014; Reliability for Constructions and Foundations. General Principles. National Standard of Russian Federation; JSC Research Center “Construction”: Moscow, Russia, 2019. Available online: https://docs.cntd.ru/document/1200115736 (accessed on 21 November 2022).
- SP 385.1325800.2018; Protection of Buildings and Structures against Progressive Collapse. Design Code. Basic Statements; National Building Code of Russian Federation; Ministry of Construction, Housing and Utilities: Moscow, Russia, 2018. Available online: https://docs.cntd.ru/document/551394640 (accessed on 21 November 2022).
- Bažant, Z.P.; Verdure, M. Mechanics of Progressive Collapse: Learning from World Trade Center and Building Demolitions. J. Eng. Mech. 2007, 133, 308–319. [Google Scholar] [CrossRef]
- Kwasniewski, L. Nonlinear Dynamic Simulations of Progressive Collapse for a Multistory Building. Eng. Struct. 2010, 32, 1223–1235. [Google Scholar] [CrossRef]
- Yousef, A.M.; El-Mandouh, M.A. Dynamic Analysis of High-Strength Concrete Frame Buildings for Progressive Collapse. Case Stud. Constr. Mater. 2020, 13, e00470. [Google Scholar] [CrossRef]
- Almazov, V.O.; Plotnikov, A.I.; Rastorguev, B.S. Problems of Buildings Resistance to Progressive Collapse. Vestn. MGSU 2011, 2–1, 16–20. [Google Scholar]
- Kabantsev, O.; Mitrovic, B. Deformation and Power Characteristics Monolithic Reinforced Concrete Bearing Systems in the Mode of Progressive Collapse. MATEC Web Conf. 2018, 251, 02047. [Google Scholar] [CrossRef]
- Mohamed, O.A.; Keshawarz, M.S. Modeling for Progressive Collapse Mitigation Using Nonlinear Static Analysis Procedures. In Proceedings of the CST 2008, the Ninth International Conference on Computational Structures Technology, Athens, Greece, 2–5 September 2008. [Google Scholar]
- Kodysh, E.N.; Trekin, N.N.; Chesnokov, D.A. Protection of Multistory Buildings from progressing collapse. PromyshlennoeIGrazhdanskoe Stroit. 2016, 6, 8–13. Available online: http://www.pgs1923.ru/ru/index.php?m=4&y=2016&v=06&p=00&r=02 (accessed on 21 November 2022).
- Adam, J.M.; Parisi, F.; Sagaseta, J.; Lu, X. Research and Practice on Progressive Collapse and Robustness of Building Structures in the 21st Century. Eng. Struct. 2018, 173, 122–149. [Google Scholar] [CrossRef]
- Nazarov, Y.V.; Zhuk, Y.N.; Simbirkin, V.N.; Egorov, M.I. Basmanny Market: Analysis of Design Solutions and Possible Mechanisms of Building Destruction. Struct. Mech. Anal. Constr. 2007, 211, 49–55. [Google Scholar]
- Almusallam, T.; Al-Salloum, Y.; Elsanadedy, H.M.; Ngo, T.D.; Mendis, P.; Abbas, H. Development Limitations of Compressive Arch and Catenary Actions in Reinforced Concrete Special Moment Resisting Frames under Column-Loss Scenarios. Struct. Infrastruct. Eng. 2020, 16, 1616–1634. [Google Scholar] [CrossRef]
- Shi, F.; Wang, L.; Dong, S. Progressive Collapse Assessment of the Steel Moment-frame with Composite Floor Slabs Based on Membrane Action and Energy Equilibrium. Open Constr. Build. Technol. J. 2017, 11, 200–215. [Google Scholar] [CrossRef] [Green Version]
- Shan, L.; Petrone, F.; Kunnath, S. Robustness of RC Buildings to Progressive Collapse: Influence of Building Height. Eng. Struct. 2019, 183, 690–701. [Google Scholar] [CrossRef]
- Sasani, M.; Sagiroglu, S. Progressive Collapse Resistance of Hotel San Diego. J. Struct. Eng. 2008, 134, 478–488. [Google Scholar] [CrossRef]
- Kolcunov, V.I.; Tuyen, V.N.; Korenkov, P.A. Deformation and Failure of a Monolithic Reinforced Concrete Frame under Accidental Actions. IOP Conf. Ser. Mater. Sci. Eng. 2020, 753, 032037. [Google Scholar]
- Zheng, Y.; Xiong, J.; Wu, Z.; He, Y. Experimental Study on Progressive Collapse Resistance of Reinforced Concrete Frame Structures. Appl. Mech. Mater. 2011, 71–78, 871–875. [Google Scholar] [CrossRef]
- Shan, S.; Li, S. Experimental Study on the Progressive Collapse Performance of RC Frames with Infill Walls. Eng. Struct. 2016, 250, 113451. [Google Scholar] [CrossRef]
- Yang, T.; Chen, W.; Han, Z. Experimental Investigation of Progressive Collapse of Prestressed Concrete Frames after the Loss of Middle Column. Adv. Civ. Eng. 2020, 2020, 8219712. [Google Scholar] [CrossRef] [Green Version]
- Fedorova, N.V.; Ngoc, V.T. Deformation criteria for reinforced concrete frames under accidental actions. Mag. Civ. Eng. 2022, 109, 10902. [Google Scholar]
- Adam, J.M.; Buitrago, M.; Bertolesi, E.; Sagaseta, J.; Moragues, J.J. Dynamic Performance of a Real-Scale Reinforced Concrete Building Test under a Corner-Column Failure Scenario. Eng. Struct. 2020, 210, 110414. [Google Scholar] [CrossRef]
- Tamrazyan, A.G.; Avetisyan, L.A. Experimental and Theoretical Study of Reinforced Concrete Elements under Different Characteristics of Loading at High Temperatures. Procedia Eng. 2016, 153, 721–725. [Google Scholar] [CrossRef] [Green Version]
- Popov, D.S. Experimental Studies of Dynamic Properties of Corrosion-Damaged Compressed Reinforced Concrete Elements. Build. Reconstr. 2022, 100, 55–64. [Google Scholar] [CrossRef]
- Savin, S.; Kolchunov, V.; Fedorova, N. Dynamic Response of a Reinforced Concrete Column under Axial Shock Impact. Mech. Mach. Sci. 2023, 125, 43–52. [Google Scholar]
- Sanzharovsky, R.S. Stability of Elements of Building Structures during Creep; Publishing of Leningrad University: Leningrad, Russia, 1984; 217p. [Google Scholar]
- Golyshev, A.B.; Kolchunov, V.l.I. The Resistance of Reinforced Concrete; Osnova: Kiev, Ukraine, 2009. [Google Scholar]
- Gemmerling, A.V. Bar Structural Systems Analysis; Stroyizdat: Moscow, Russia, 1974; 207p. [Google Scholar]
- Fedorova, N.V.; Savin, S.Y.; Kolchunov, V.I. Affecting of the Long-Term Deformation to the Stability of RC Frame-Bracing Structural Systems under Special Accidental Impacts. IOP Conf. Ser. Mater. Sci. Eng. 2020, 753, 032005. [Google Scholar] [CrossRef]
- Savin, S.Y.; Kolchunov, V.I.; Korenkov, P.A. Experimental Research Methodology for the Deformation of RC Frame under Instantaneous Loss of Column. IOP Conf. Ser. Mater. Sci. Eng. 2020, 962, 022054. [Google Scholar] [CrossRef]
- Geniyev, G.A. On Dynamic Effects in Rod Systems Made of Physical Non-Linear Brittle Materials. PromyshlennoeIGrazhdanskoe Stroit. 1999, 9, 23–24. [Google Scholar]
- Kirpichev, M.V. Theory of Similarity; Publishing of Academy of Science of USSR: Moscow, Russia, 1953; 93p. [Google Scholar]
- Sedov, L.I. Similarity Methods and Dimensions in Mechanics, 8th ed.; Nauka: Moscow, Russia, 1972; 440p. [Google Scholar]
- Chemodurov, V.T.; Korenkov, P.A.; Leonenko, Y.S.; Korenkova, O.O. Physical Modeling of Reinforced Concrete Structures Exposed to Emergency Loads. J. Phys. Conf. Ser. 2020, 1425, 012061. [Google Scholar] [CrossRef] [Green Version]
- Bazant, Z.P.; Kwon, Y.W. Failure of slender and stocky reinforced concrete columns: Tests of size effect. Mater. Struct. 1994, 27, 79–90. [Google Scholar] [CrossRef]
- ACI 318-19; Building Code Requirements for Structural Concrete and Commentary. American Concrete Institute: Indianapolis, IN, USA, 2019; An ACI Standard. Available online: https://www.concrete.org/publications/internationalconcreteabstractsportal.aspx?m=details&ID=51716937 (accessed on 21 March 2023).
- SP 63.13330.2018; Concrete and Reinforced Concrete Structures. General Provisions. National Building Code of Russian Federation; Ministry of Construction, Housing and Utilities: Moscow, Russia, 2022. Available online: https://docs.cntd.ru/document/554403082 (accessed on 21 March 2023).
- Bezgodov, I.M. Relations of Strength and Deformation Characteristics of Concrete under Compression, Tension and Tension in Bending. BetonIZhelezobeton 2012, 2, 2–5. [Google Scholar]
- GOST 10180-2012; Concretes. Methods for Strength Determination Using Reference Specimens. National Standard of the Russian Federation; JSC Research Center “Construction”: Moscow, Russia, 2012. Available online: https://docs.cntd.ru/document/1200100908 (accessed on 21 November 2022).
- GOST 18105-2018; Concretes. Rules for Control and Assessment of Strength. National Standard of the Russian Federation; JSC Research Center “Construction”: Moscow, Russia, 2018. Available online: https://www.mos.ru/upload/documents/files/2071/GOST18105-2018.pdf (accessed on 21 November 2022).
- Klyueva, N.V.; Korenkov, P.A. Device for Experimental Determination of Dynamic Addition Loading in Frame-Rod Structural Systems. Patent RU 2642542, 25 January 2018. Russian Federation p. 1. Available online: https://patents.s3.yandex.net/RU2642542C1_20180125.pdf (accessed on 21 November 2022).
- Tracker. Video Analysis and Modeling Tool for Physics Education. Available online: https://physlets.org/tracker/change_log.html (accessed on 11 September 2021).
- Users Manual for LS-DYNA Concrete Material Model 159. Available online: https://www.fhwa.dot.gov/publications/research/infrastructure/pavements/05062/05062.pdf (accessed on 8 December 2022).


| Portland Cement M400, kg/m3 | Crushed Diorite Stone from the Lozovsky Quarry; Grain Size 5–10 mm, kg/m3 | Washed Sea Sand; Grain Size 2–2.5 mm, kg/m3 | Plasticizer Master Glenium 3045 | Water (W/C = 0.4), kg/m3 |
|---|---|---|---|---|
| 450 | 1155 | 655 | 1% | 180 |
| Reinforcement Steel Bars | Diameter, mm | Modulus of Elasticity, GPa | Yield Stress, MPa | Ultimate Stress, MPa |
|---|---|---|---|---|
| A500 | 6 | 200 | 606,4 | 680 |
| Bp500 | 4 | 200 | 526,5 | 584 |
| A240 | 2 | 200 | 317,1 | 440 |
| Specimen Index | Cross-Sectional Area, cm2 | Density, kg/m3 | Ultimate Load, kN | Scale Factor (α) | Strength (R), MPa | Strength Class for Concrete |
|---|---|---|---|---|---|---|
| C3-1 | 101.0 | 2338 | 364.2 | 0.95 | 34.3 | B25 |
| C3-2 | 102.9 | 2311 | 369.1 | 34.1 | ||
| C3-3 | 100.5 | 2324 | 354.6 | 33.5 | ||
| Average compressive strength (Rm), MPa | 34.0 | |||||
| Coefficient of variation, % | 2.1 | |||||
| Actual compressive strength class for concrete | 27.2 | |||||
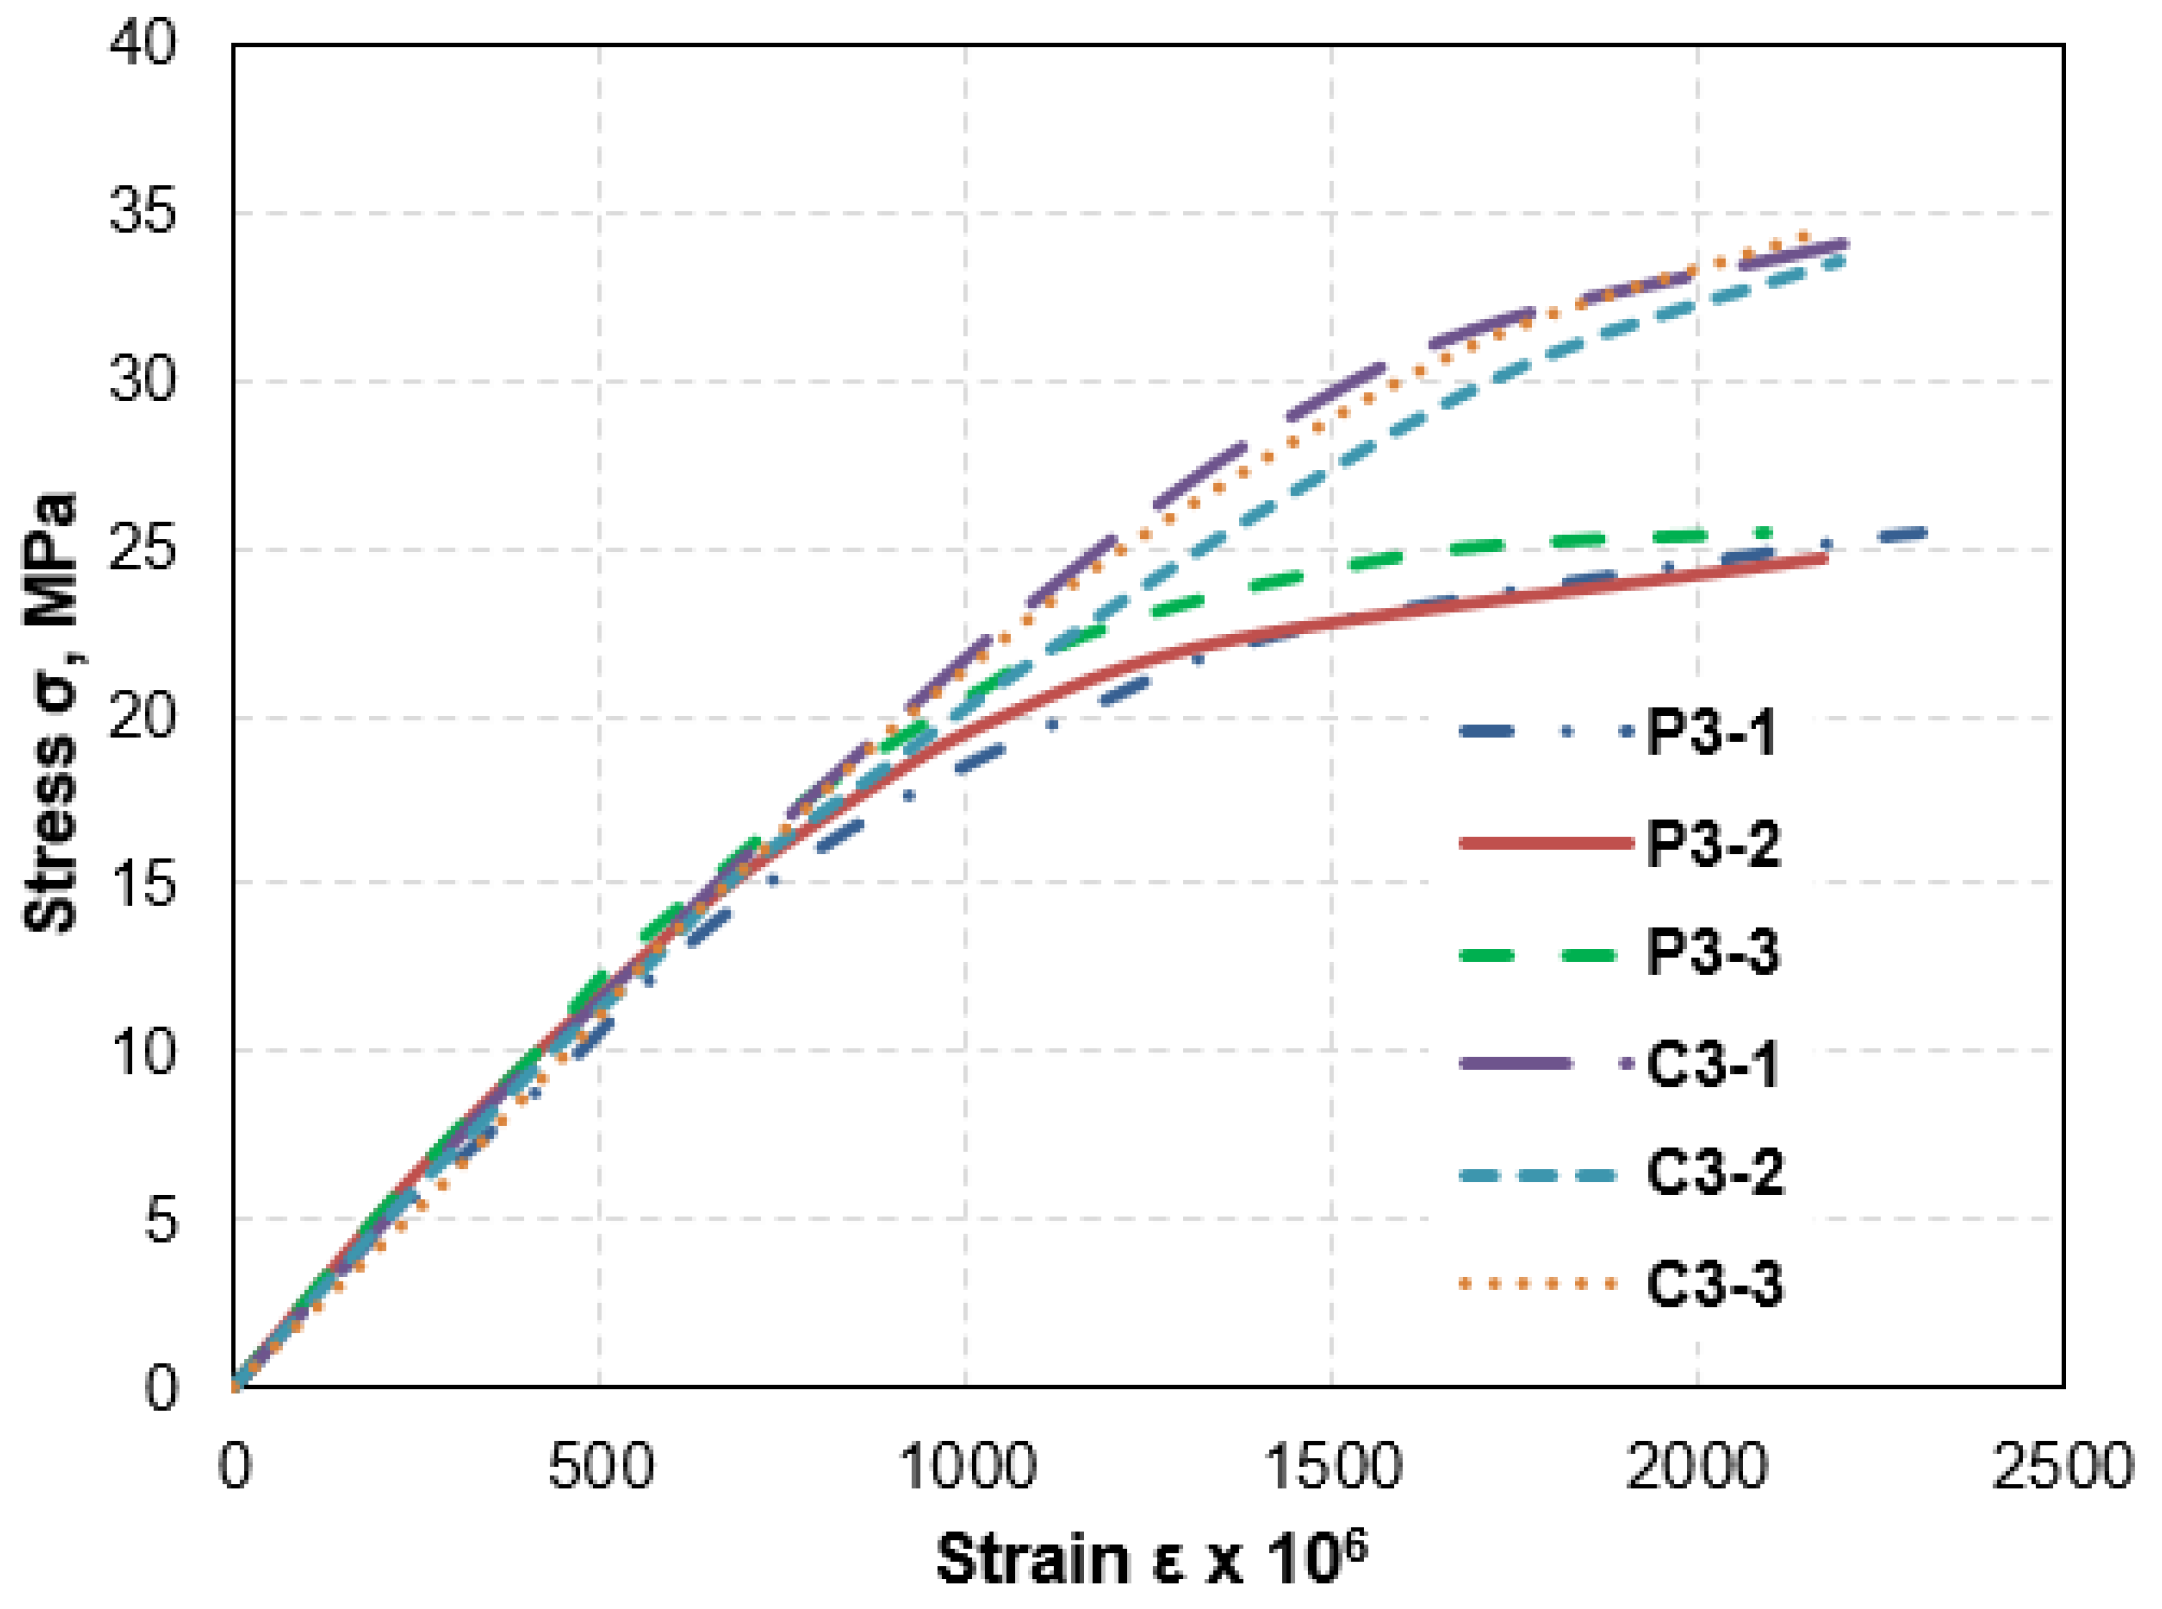
| Specimen Index | Compressive Strength of Prisms, MPa | Initial Modulus of Elasticity of Concrete (E0), MPa | Compressive Strain in the Concrete at Peak Stresses, εc0·106 |
|---|---|---|---|
| P3-1 | 25.5 | 23,330 | 2310 |
| P3-2 | 24.7 | 25,760 | 2170 |
| P3-3 | 25.4 | 25,770 | 2090 |
| Average value | 25.2 | 24,950 | 2190 |
Disclaimer/Publisher’s Note: The statements, opinions and data contained in all publications are solely those of the individual author(s) and contributor(s) and not of MDPI and/or the editor(s). MDPI and/or the editor(s) disclaim responsibility for any injury to people or property resulting from any ideas, methods, instructions or products referred to in the content. |
© 2023 by the authors. Licensee MDPI, Basel, Switzerland. This article is an open access article distributed under the terms and conditions of the Creative Commons Attribution (CC BY) license (https://creativecommons.org/licenses/by/4.0/).
Share and Cite
Savin, S.; Kolchunov, V.; Fedorova, N.; Tuyen Vu, N. Experimental and Numerical Investigations of RC Frame Stability Failure under a Corner Column Removal Scenario. Buildings 2023, 13, 908. https://doi.org/10.3390/buildings13040908
Savin S, Kolchunov V, Fedorova N, Tuyen Vu N. Experimental and Numerical Investigations of RC Frame Stability Failure under a Corner Column Removal Scenario. Buildings. 2023; 13(4):908. https://doi.org/10.3390/buildings13040908
Chicago/Turabian StyleSavin, Sergey, Vitaly Kolchunov, Natalia Fedorova, and Ngoc Tuyen Vu. 2023. "Experimental and Numerical Investigations of RC Frame Stability Failure under a Corner Column Removal Scenario" Buildings 13, no. 4: 908. https://doi.org/10.3390/buildings13040908