

Wind-Induced Vibration and Vibration Suppression of High-Mast Light Poles with Spiral Helical Strakes

Abstract
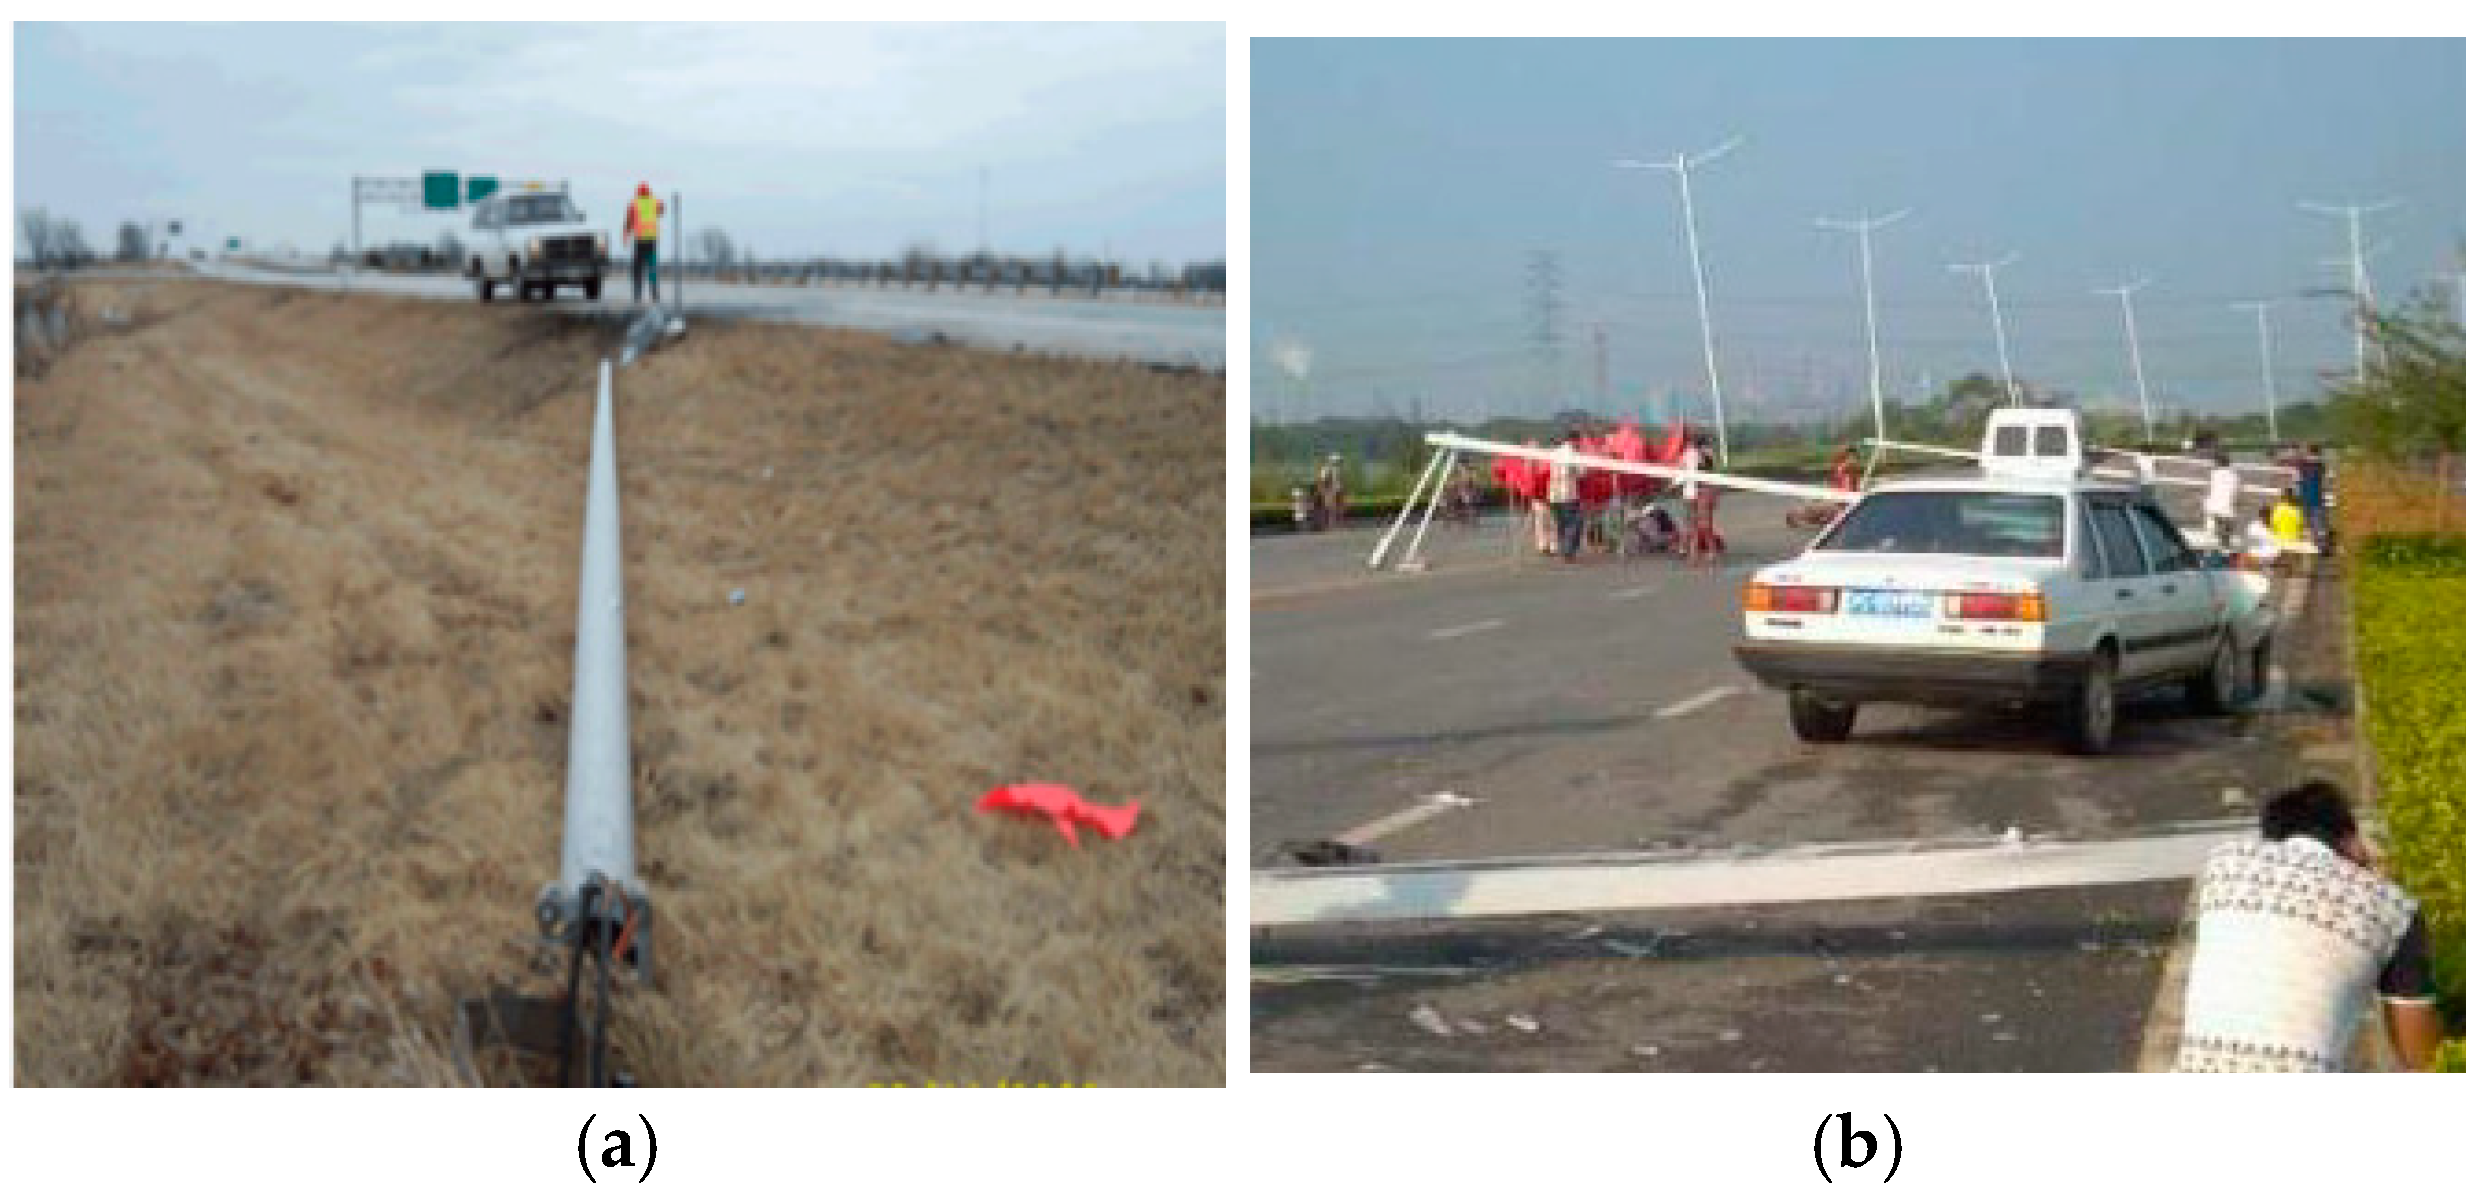
:1. Introduction
2. Numerical Simulation Calculation Method for High-Mast Light Poles
2.1. Control Equation for Numerical Simulation
2.1.1. Control Equation of Fluid Dynamics
2.1.2. Control Equation of Solid Mechanics
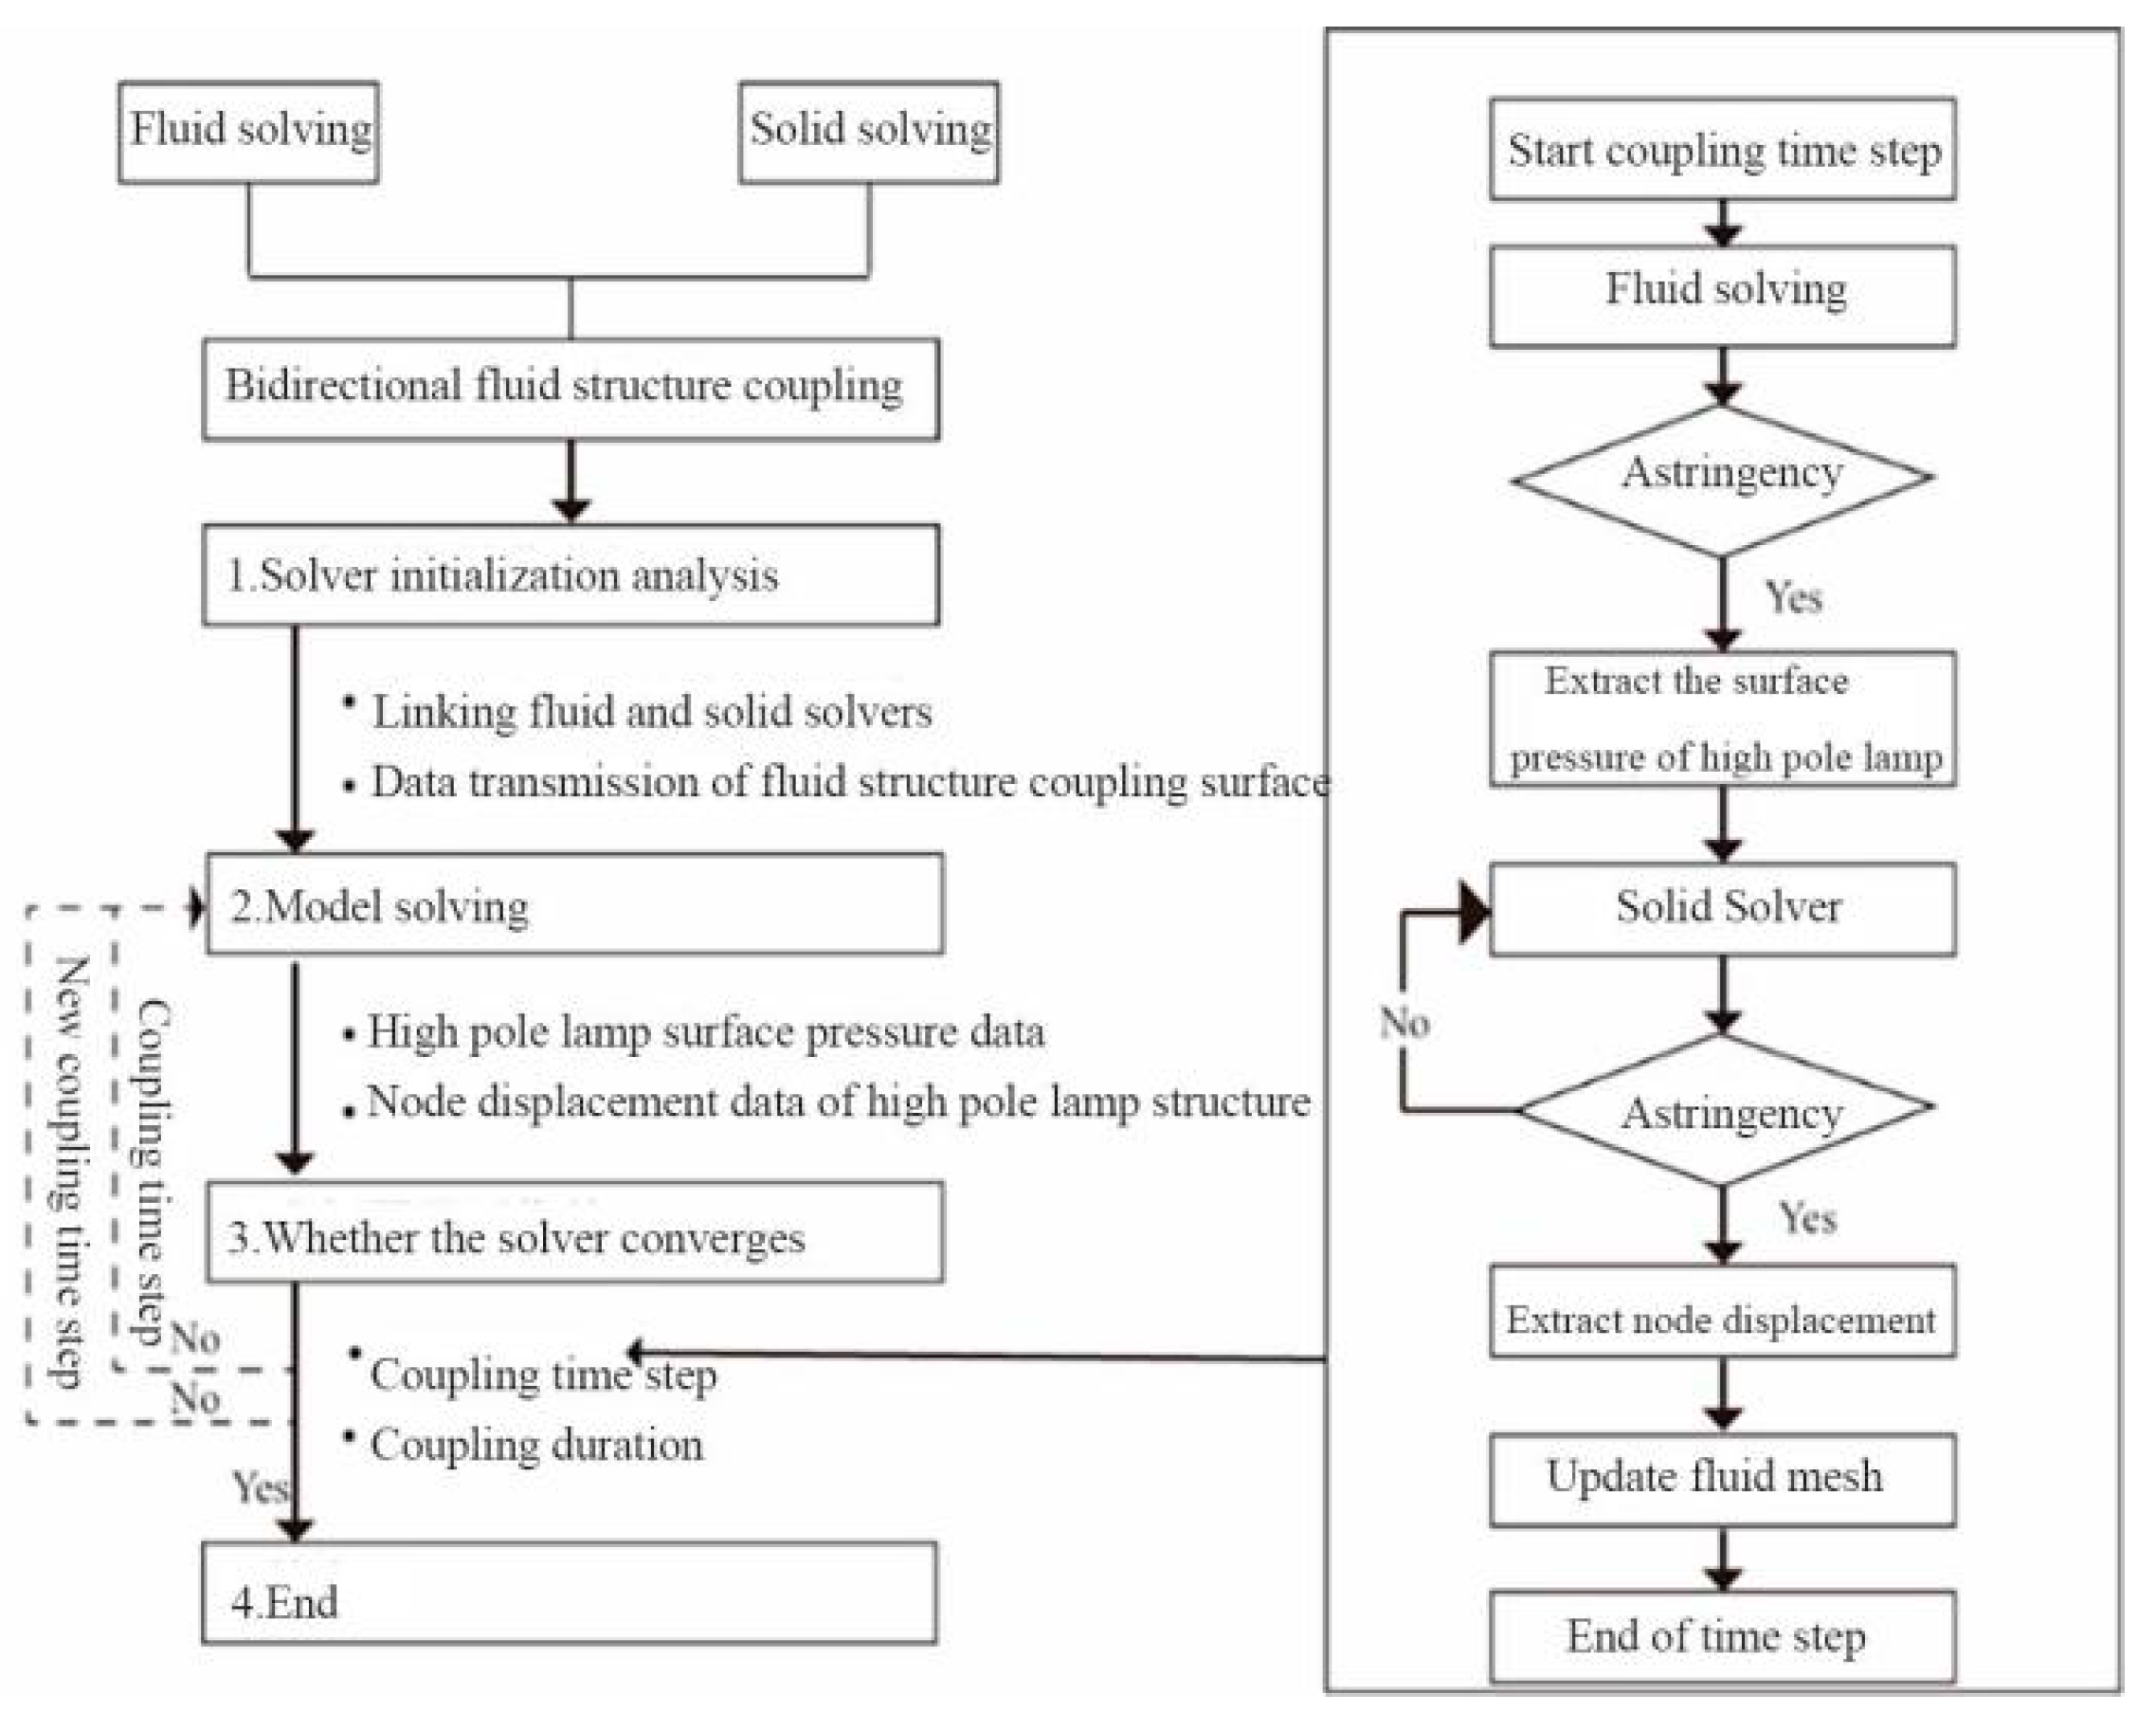
2.1.3. Fluid–Solid Coupling Control Equation
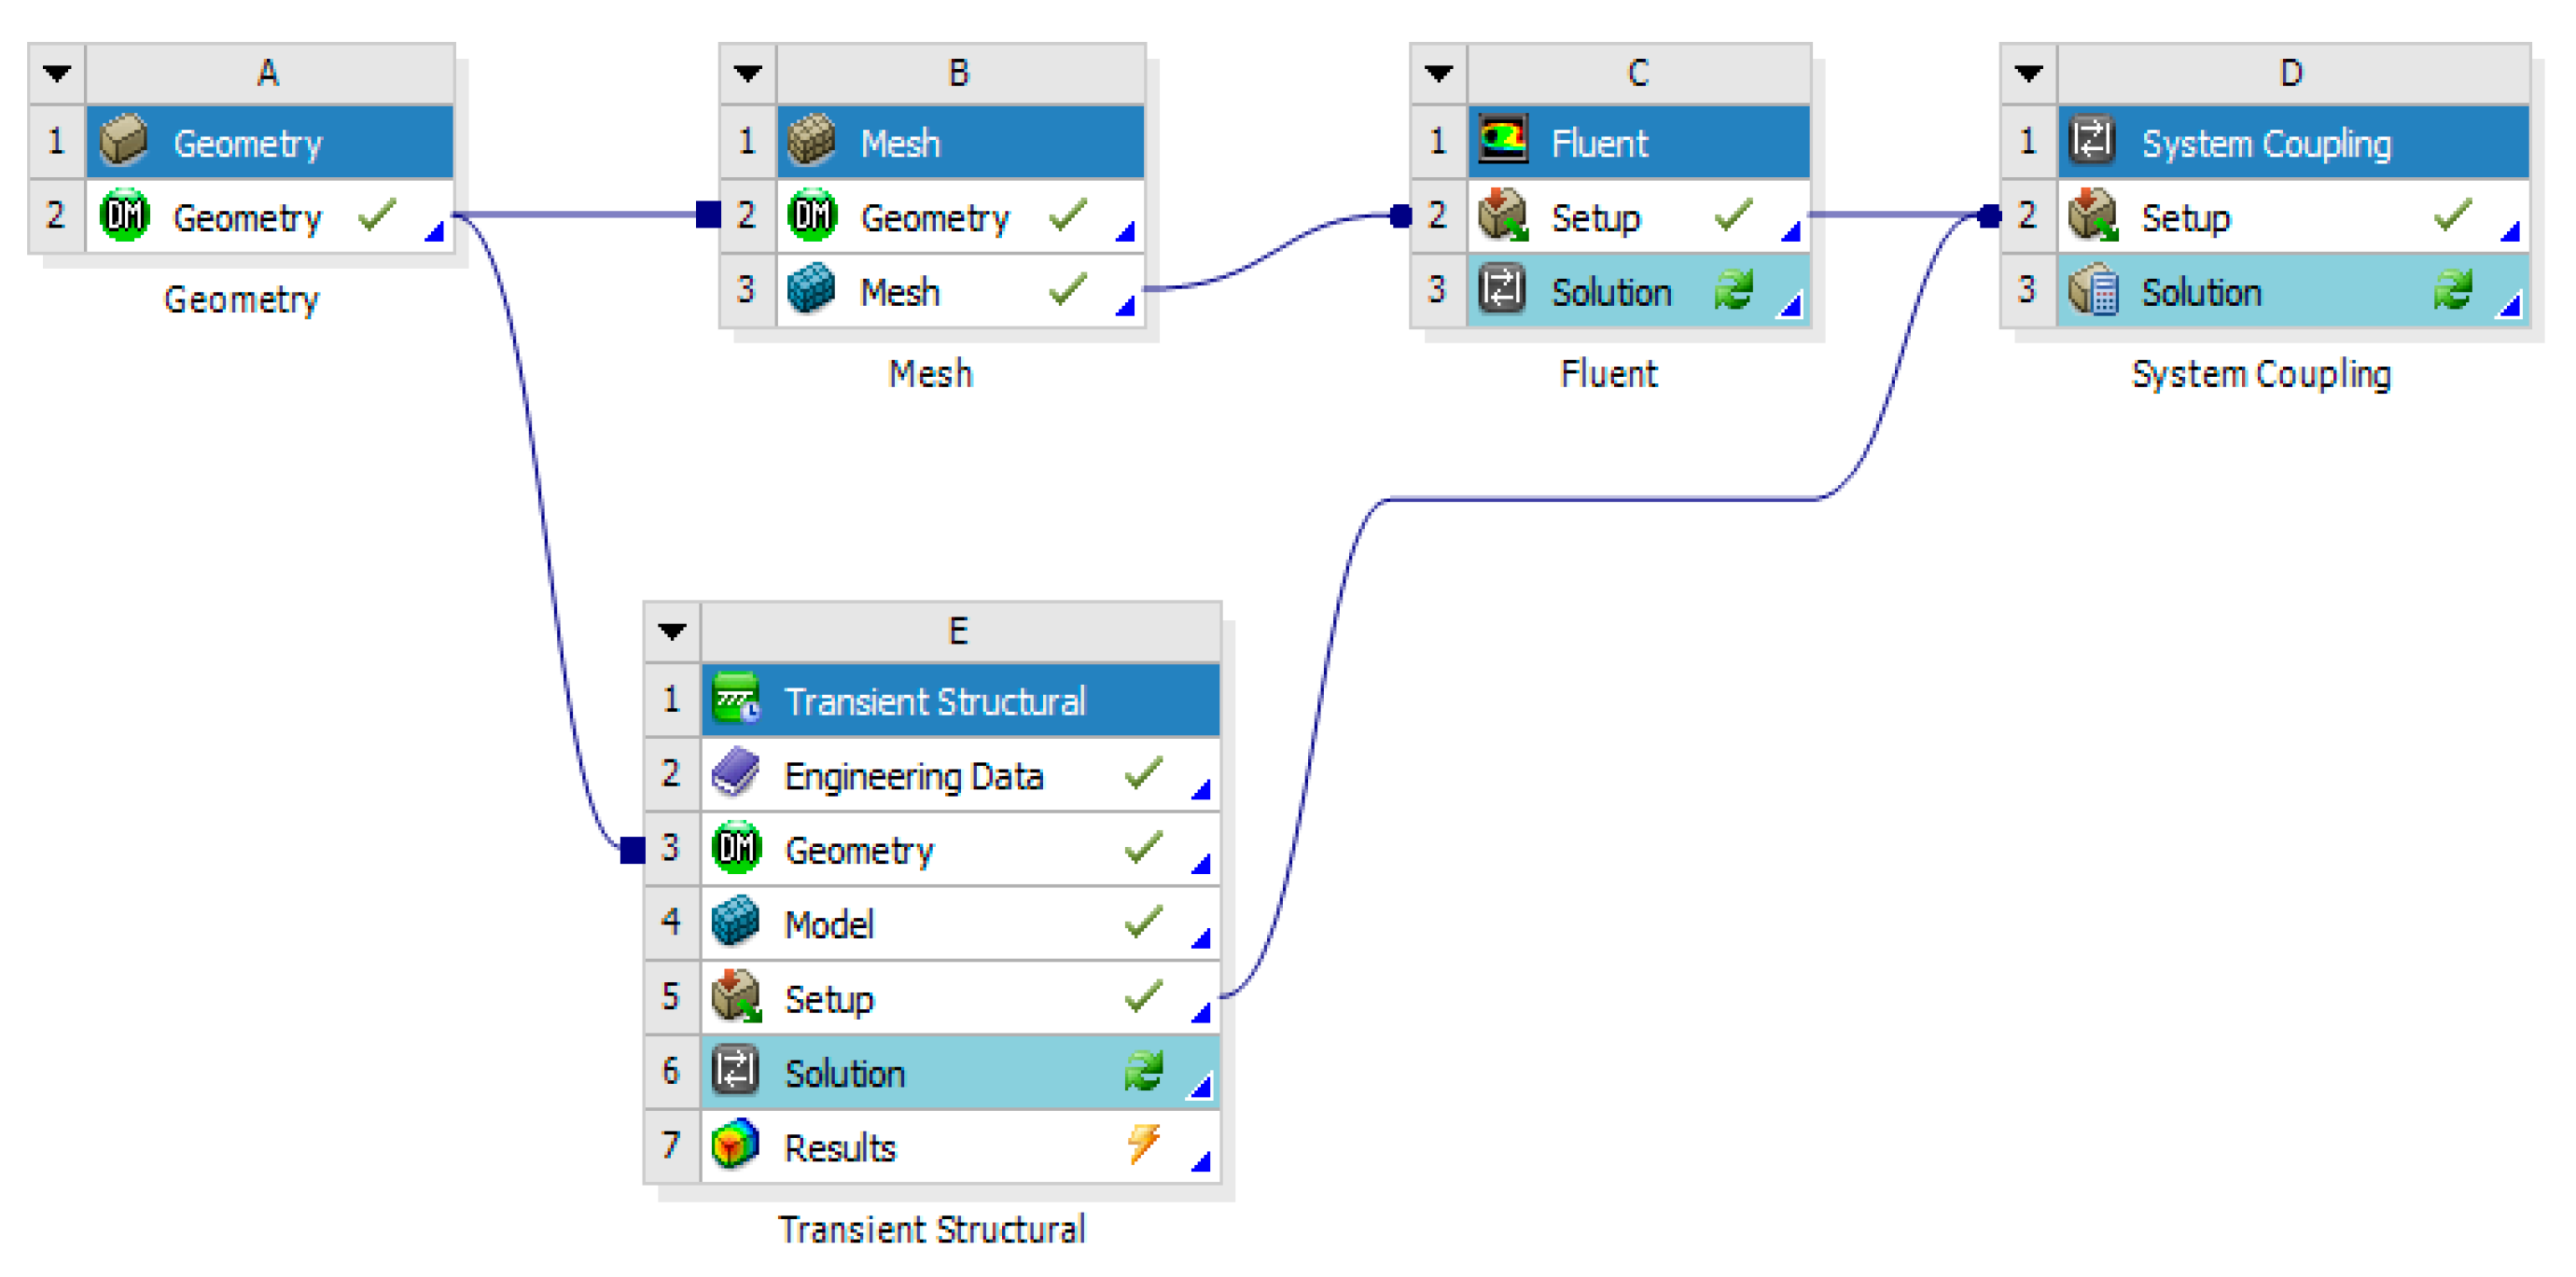
2.2. Calculation Method
3. Numerical Model for High-Mast Light Pole and Wind-Induced Vibration Analysis
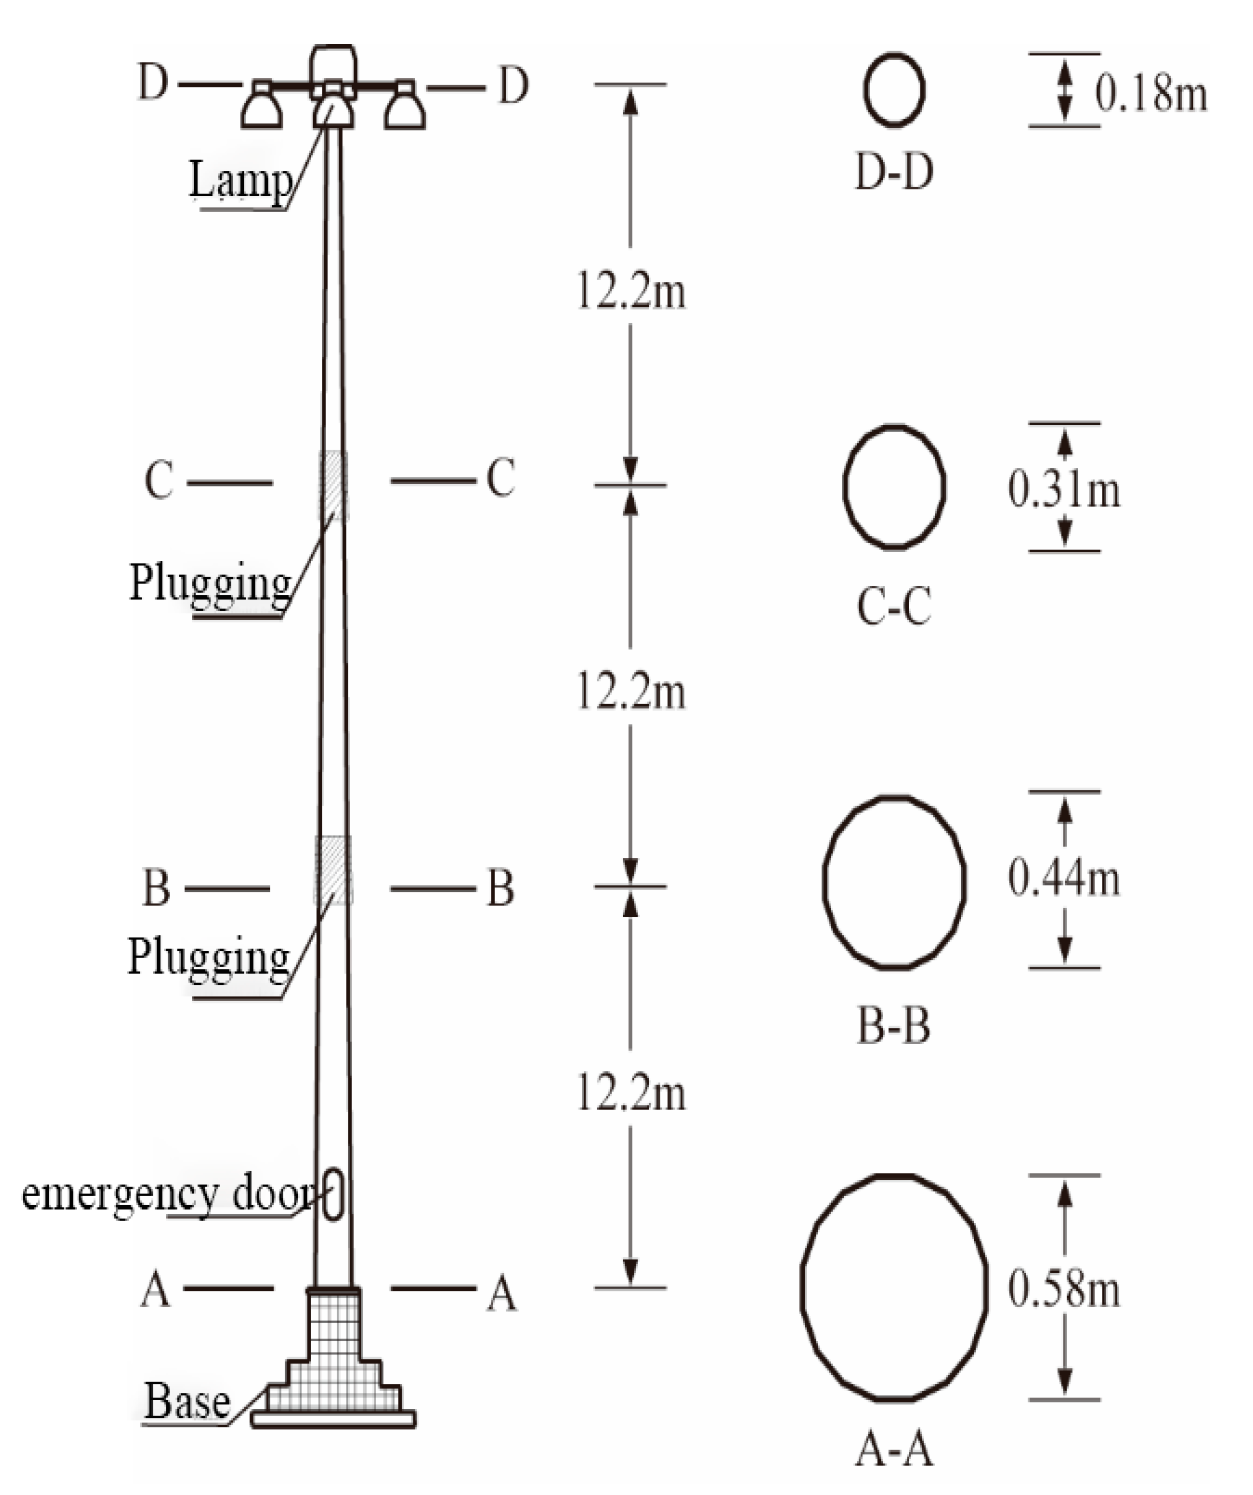
3.1. Establishment of the Finite Element Model for a High-Mast Light Pole
3.2. Fluid Numerical Model
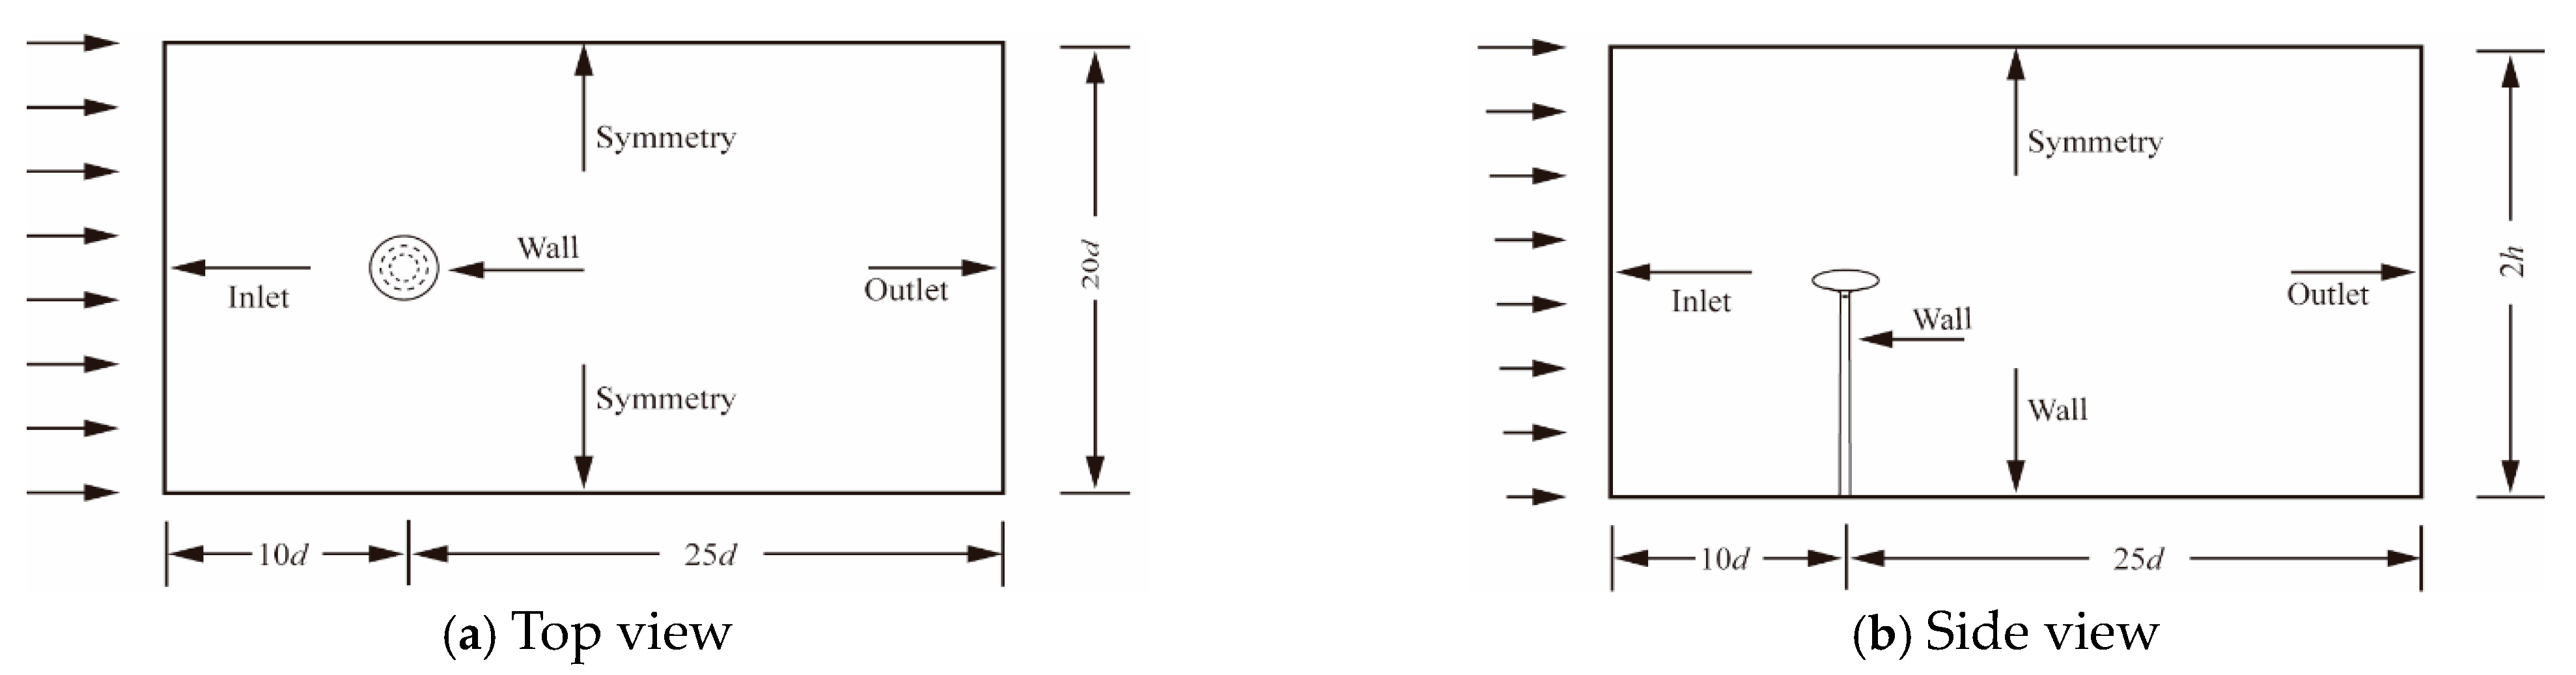
3.2.1. Boundary Conditions of CFD Simulation
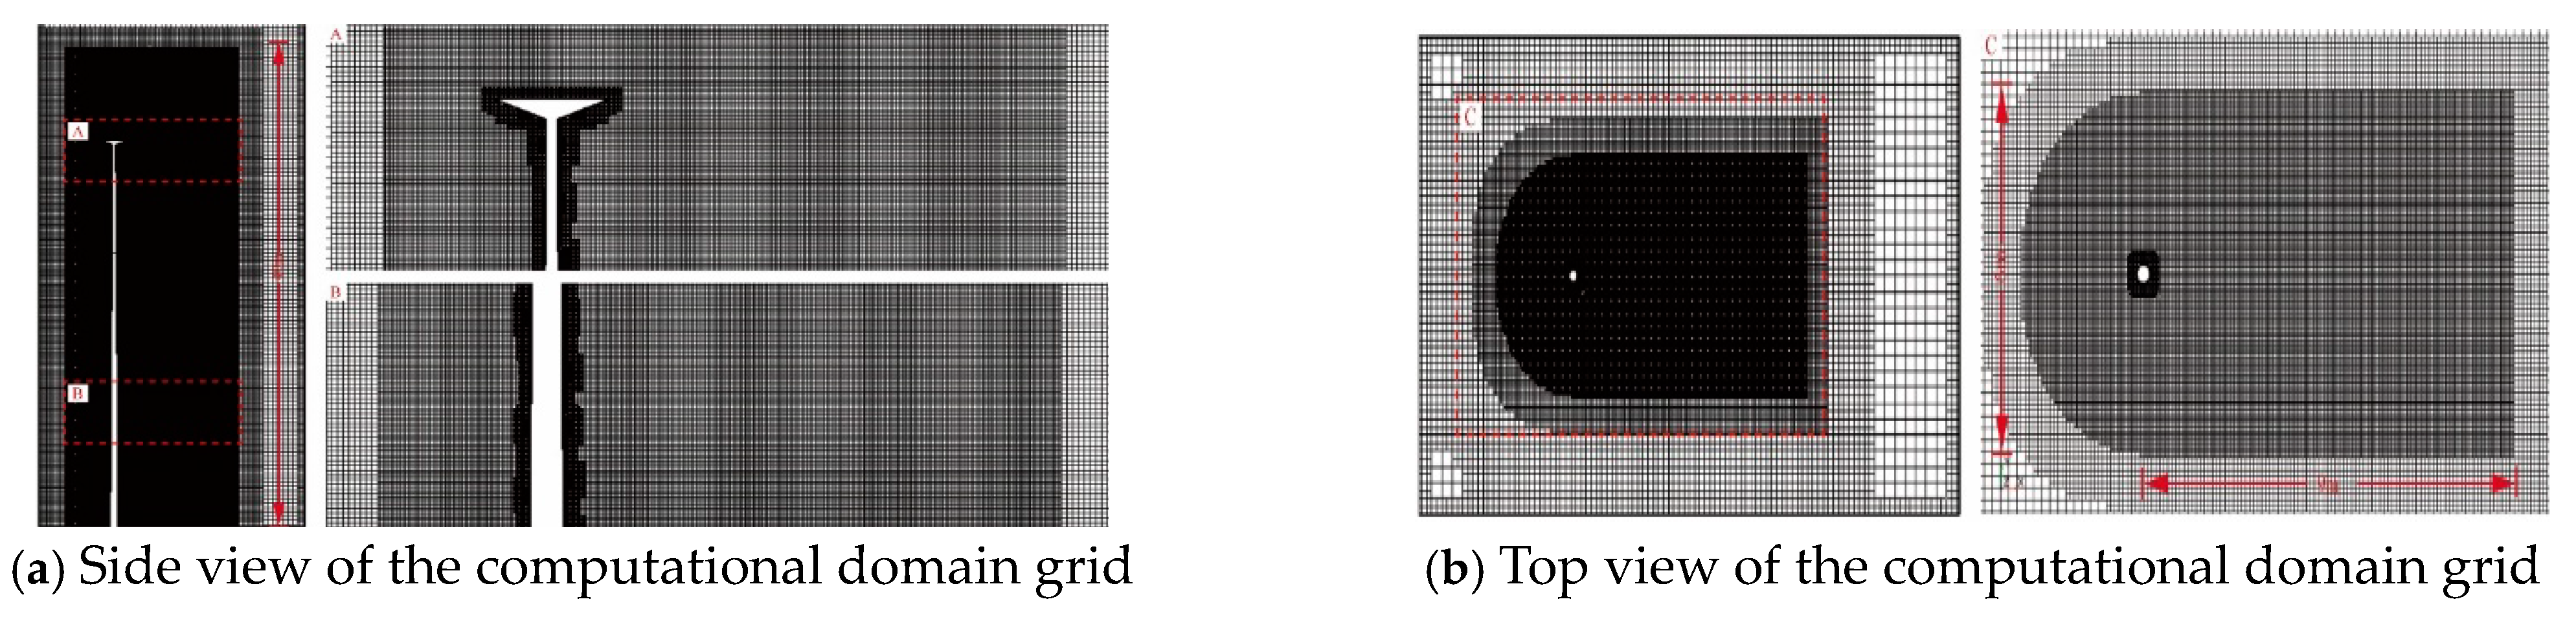
3.2.2. Flow Field Model Meshing
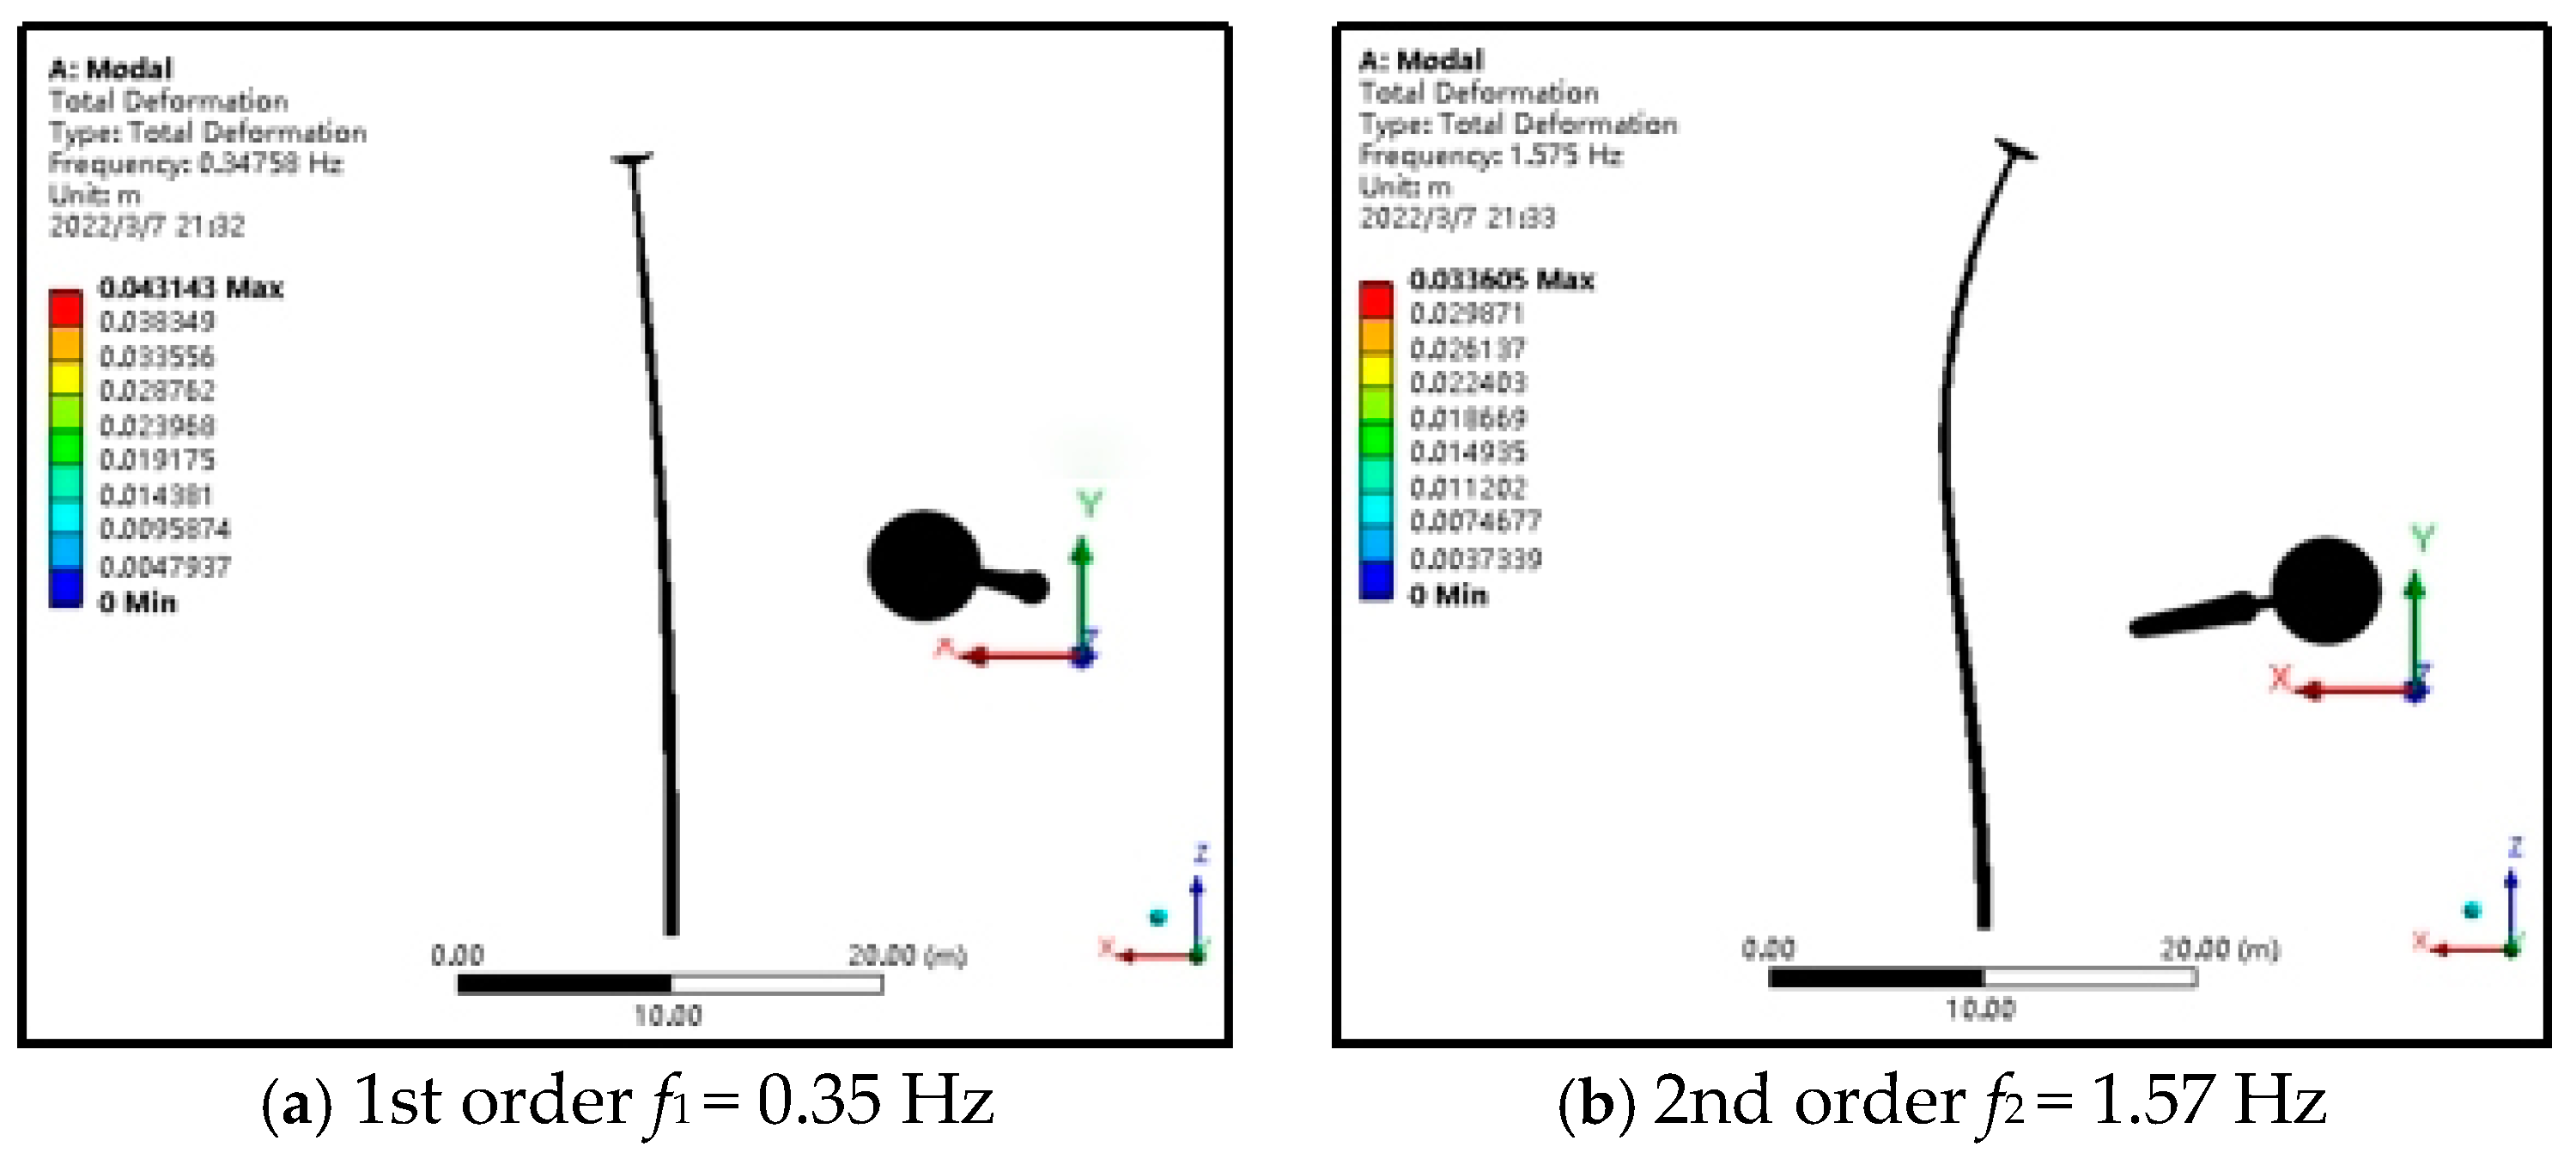
3.3. Modal Analysis
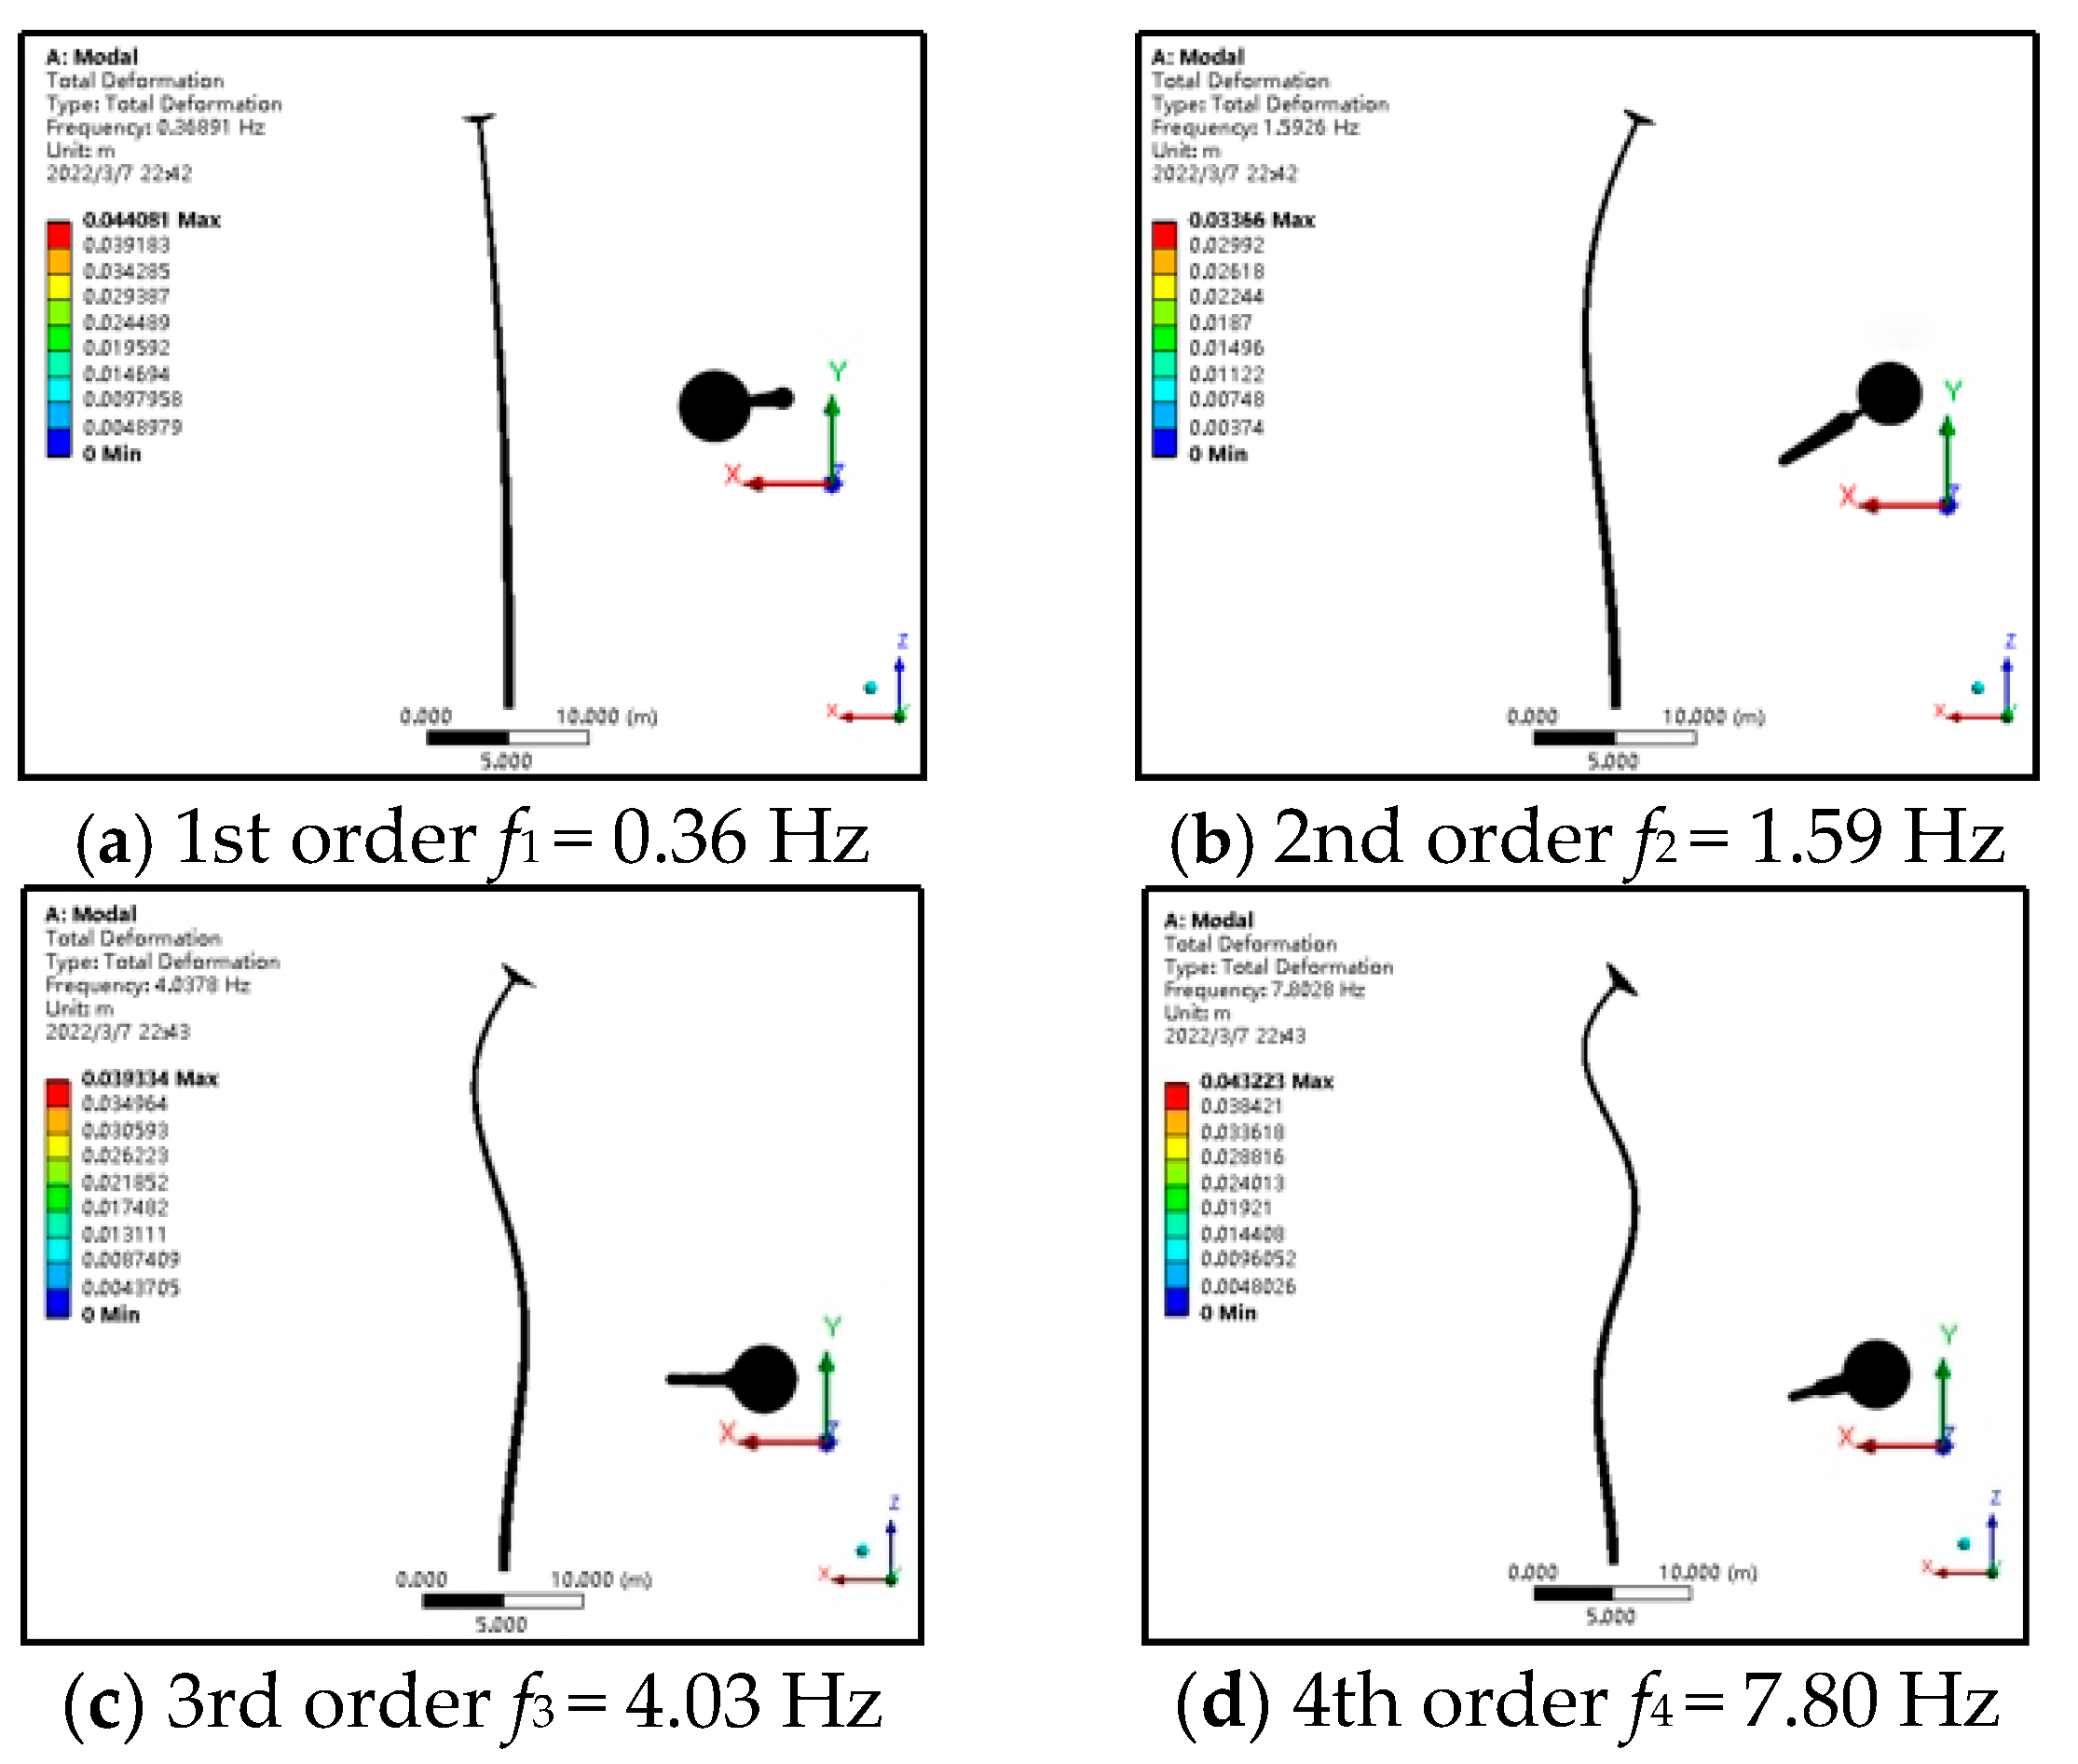
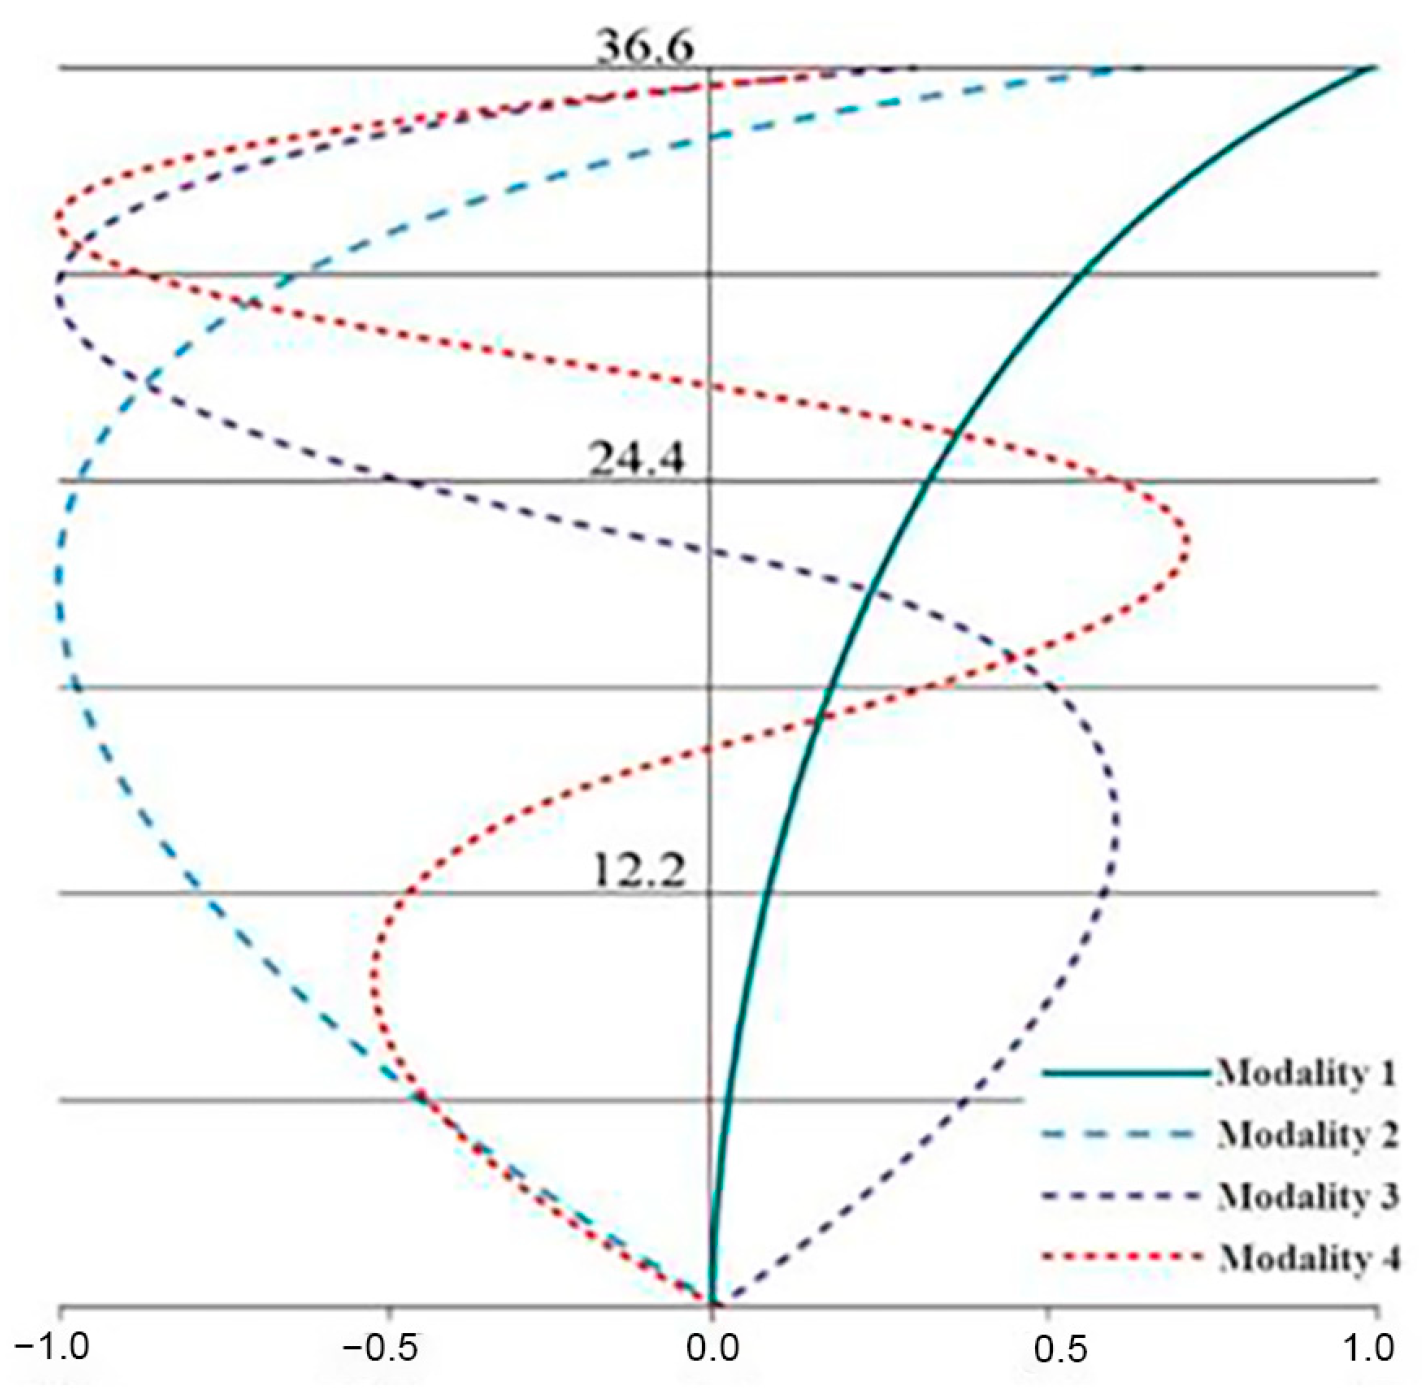
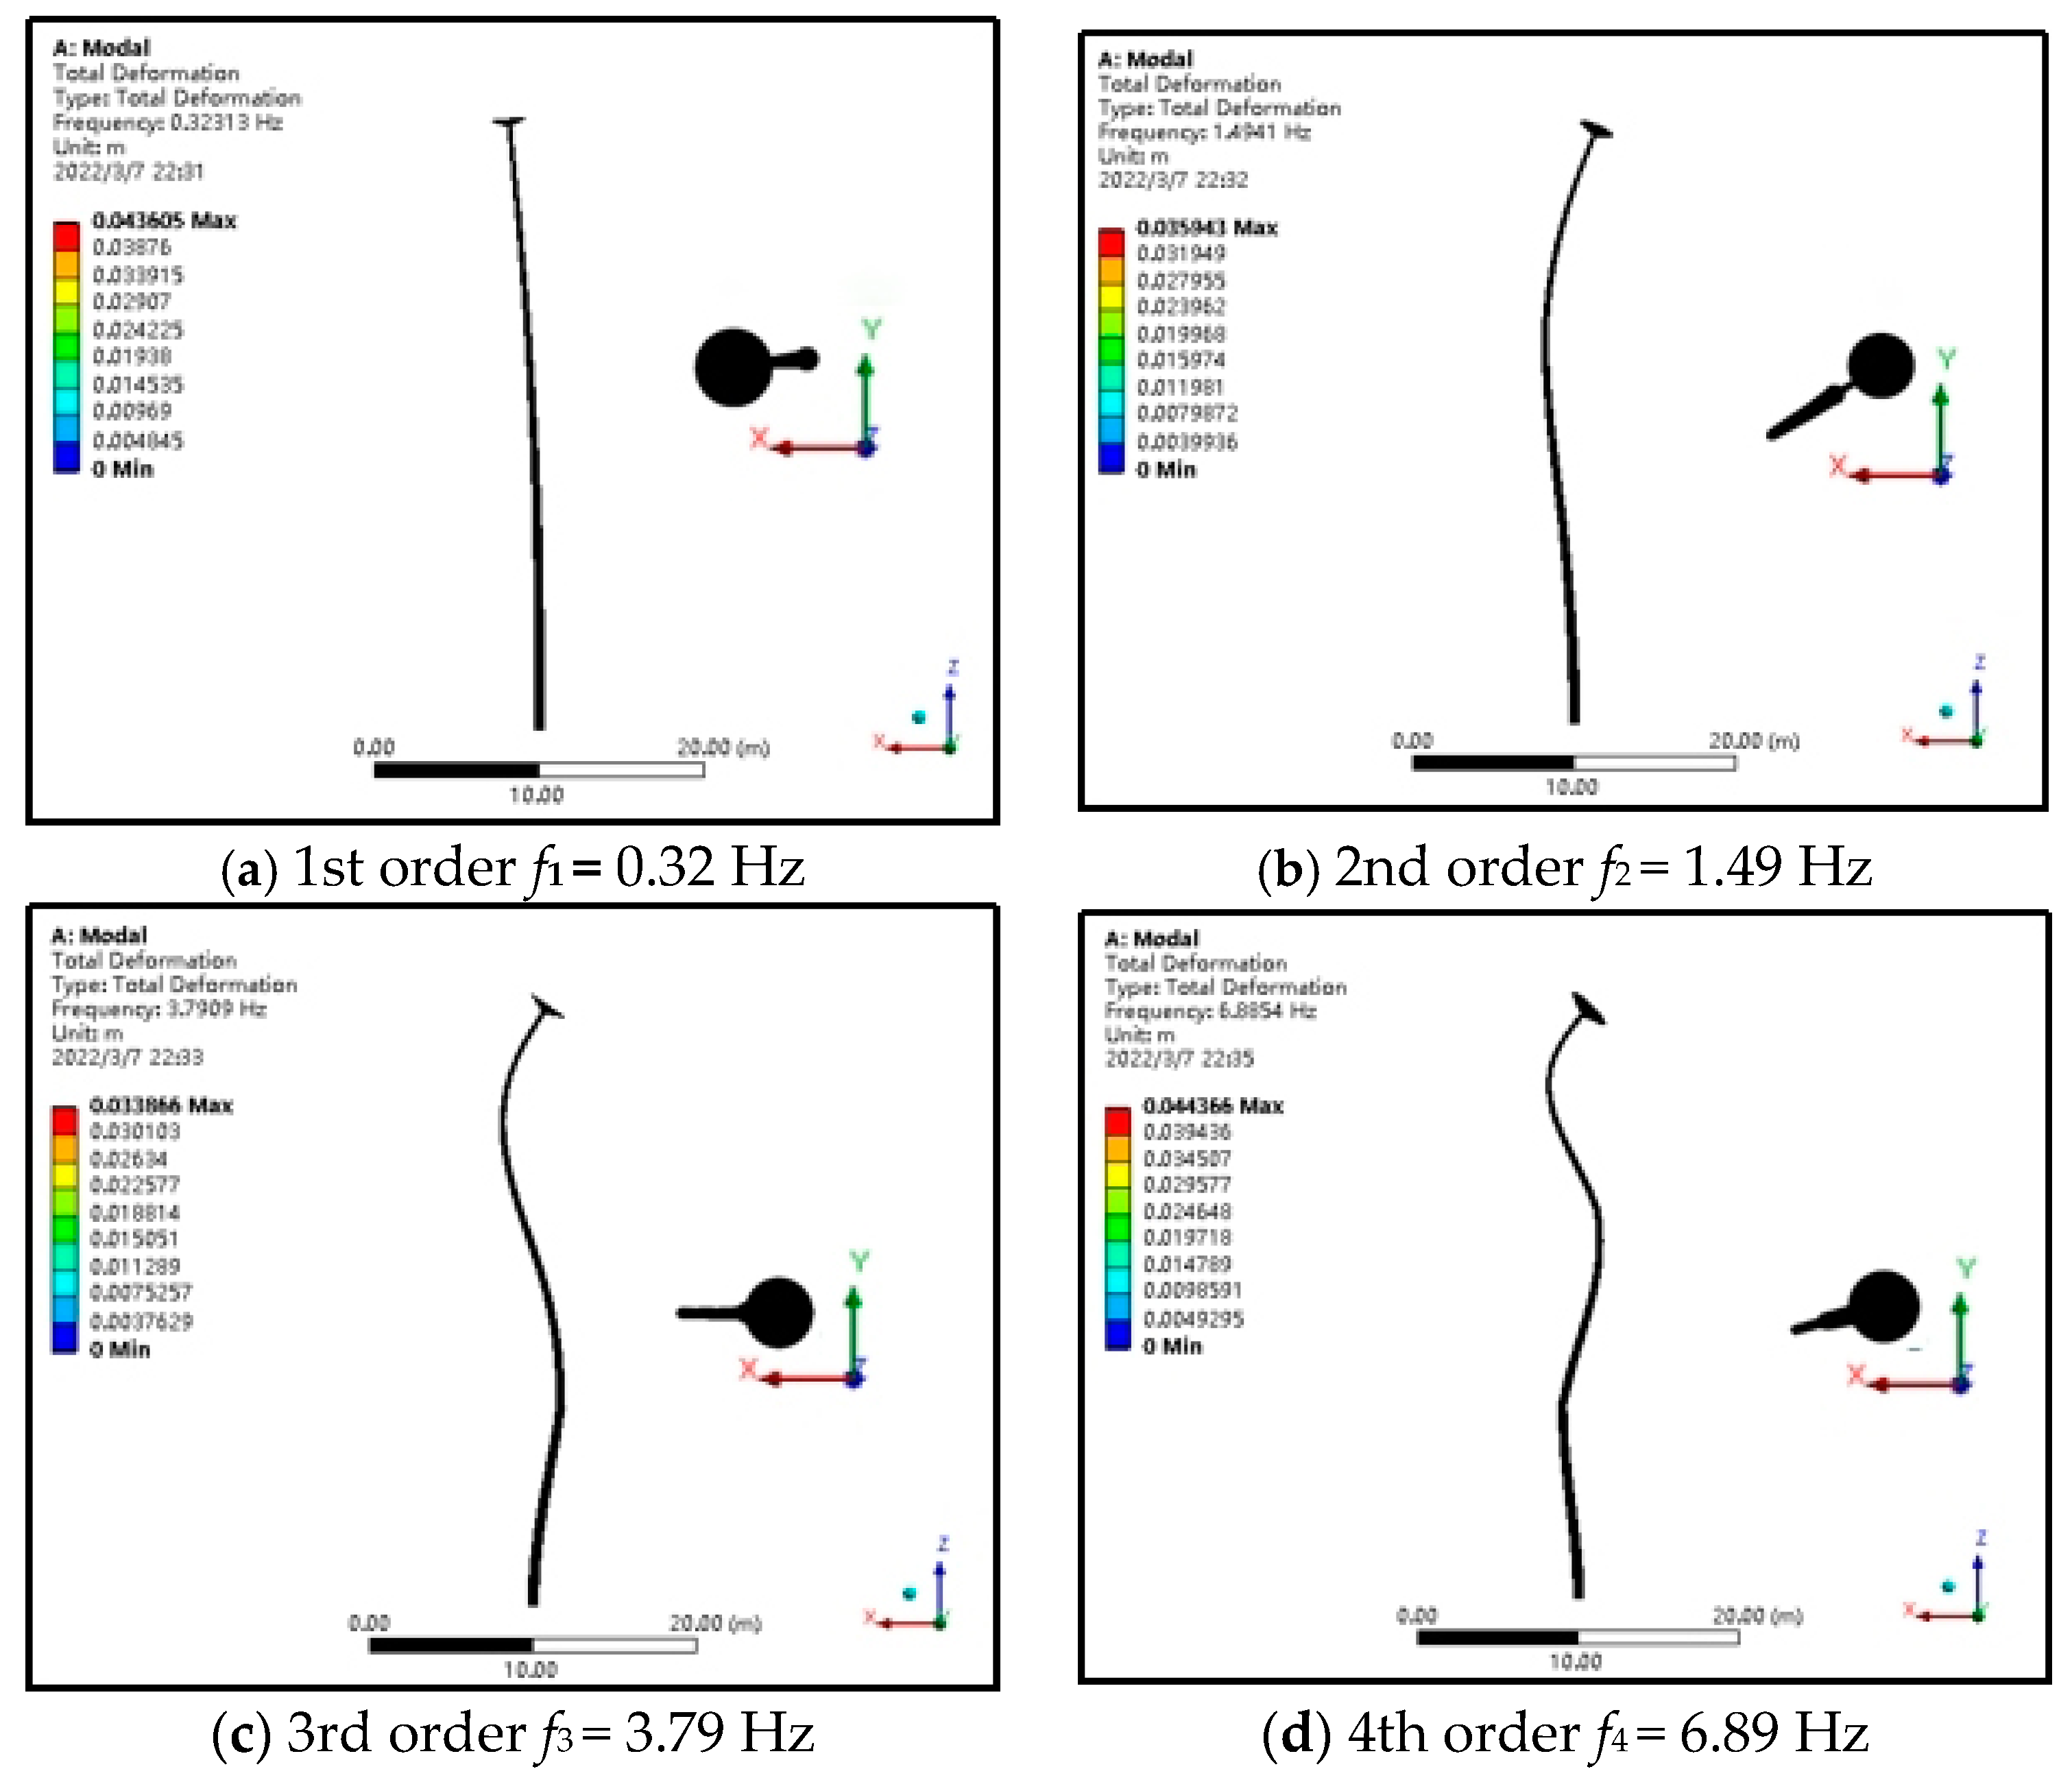
3.3.1. Vibration Mode Analysis
3.3.2. Critical Windspeed
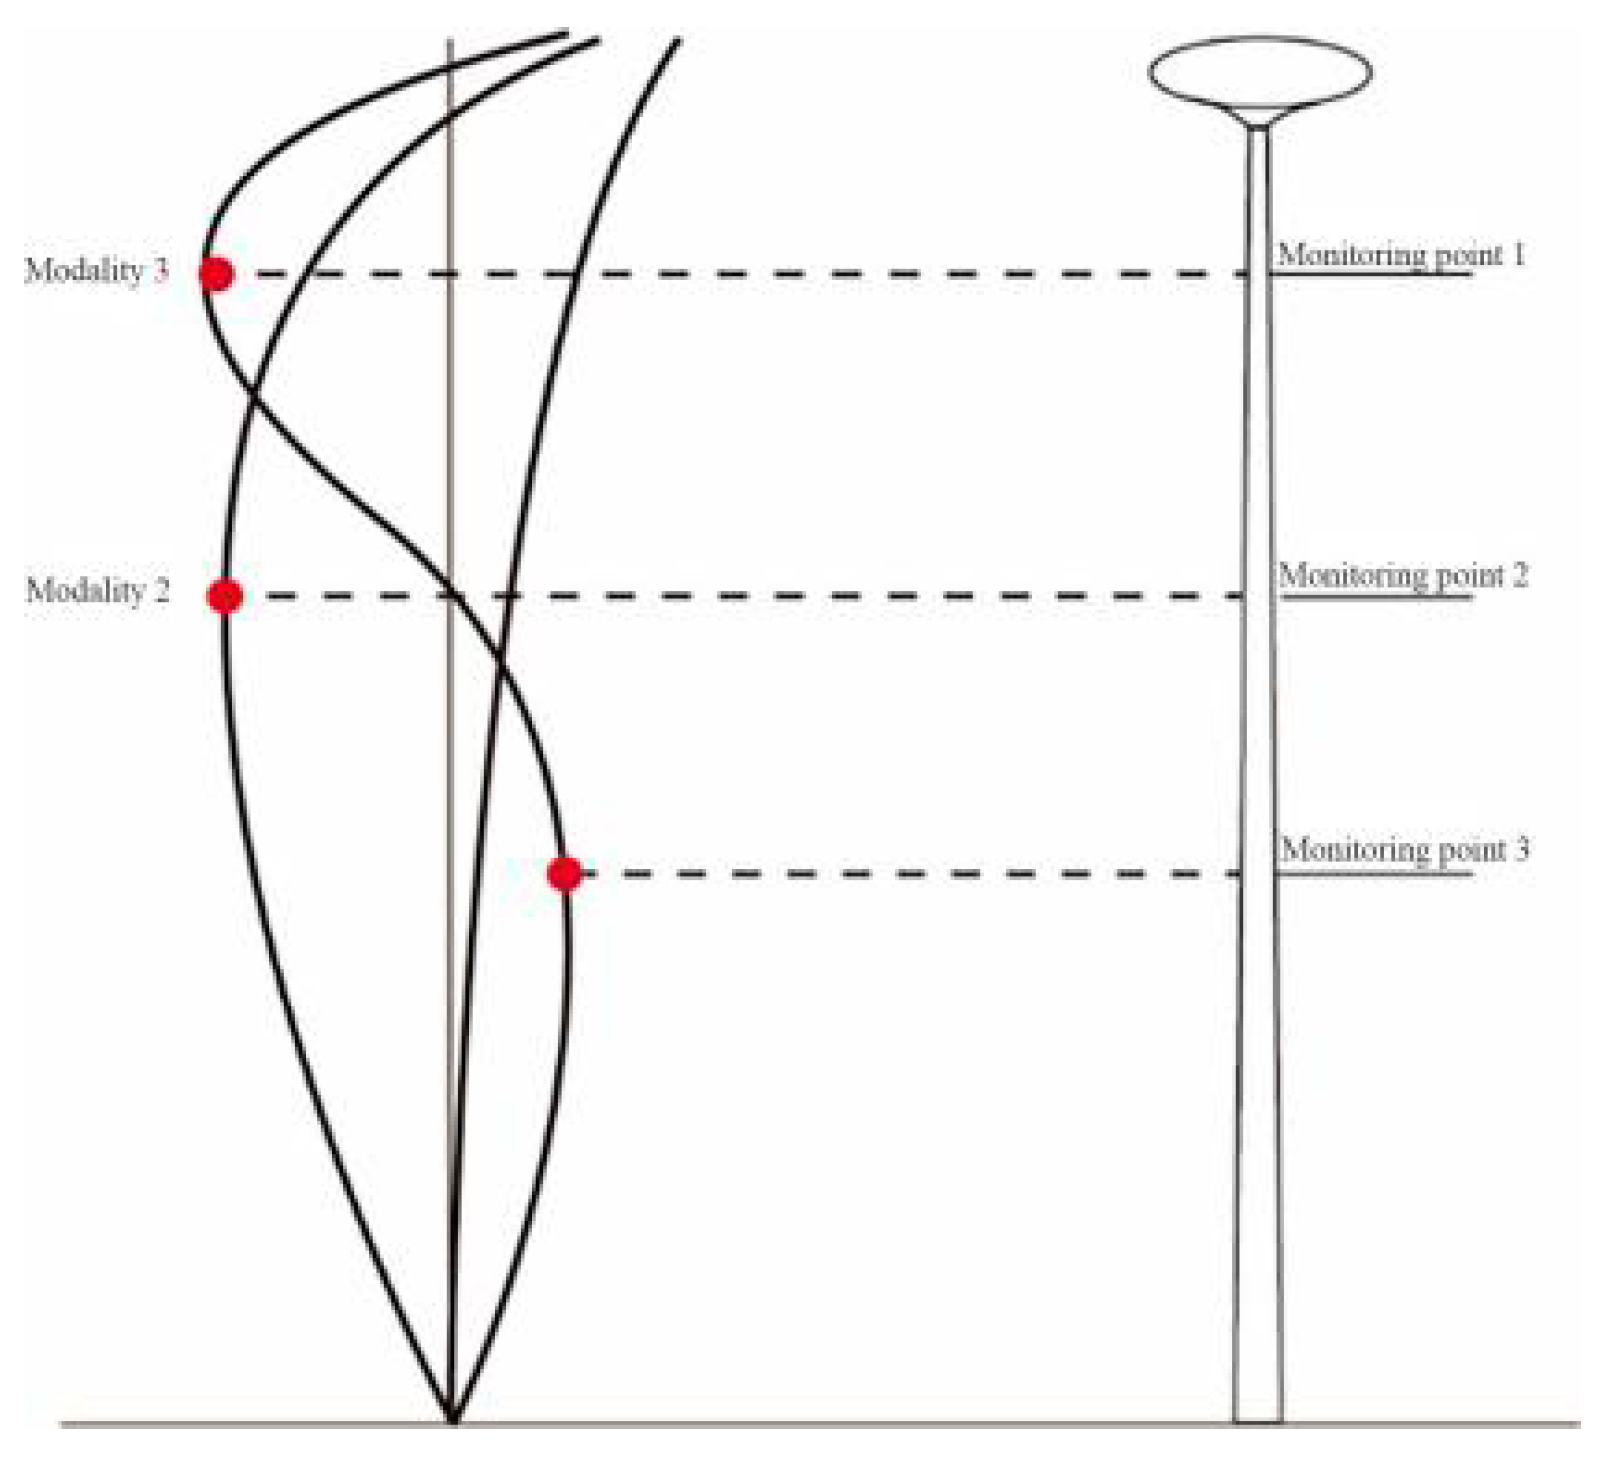
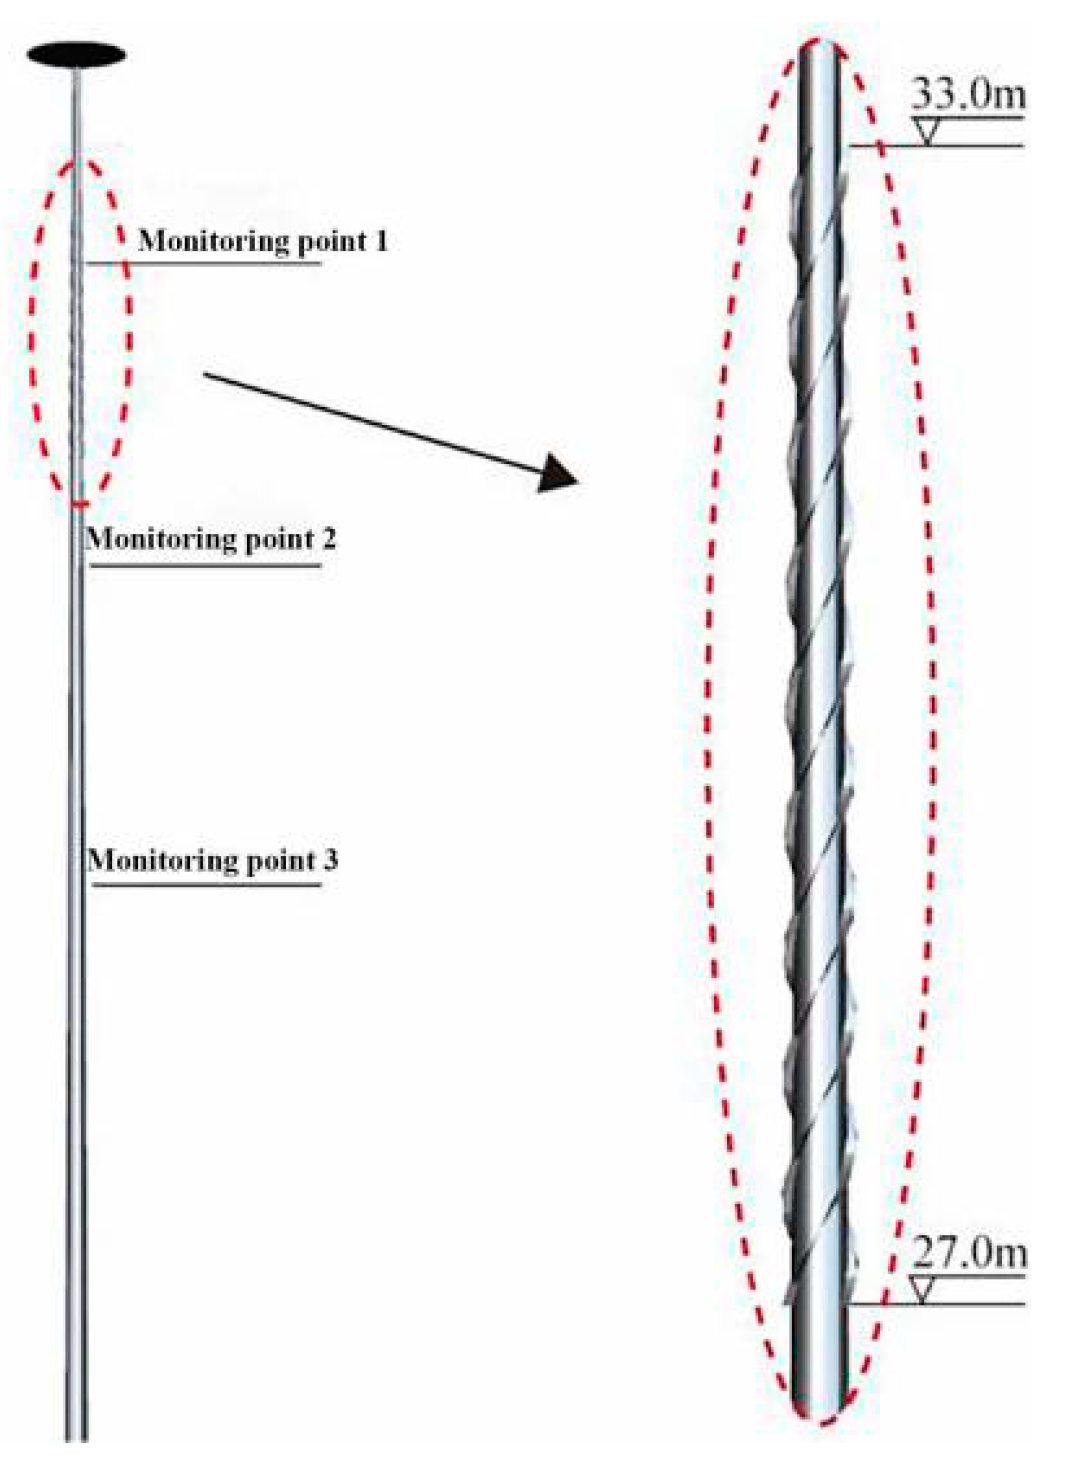
3.3.3. Monitoring Points
3.4. Grid Sensitivity Analysis
3.5. Wind Vibration Response Analysis of Smooth High Light Pole Structure
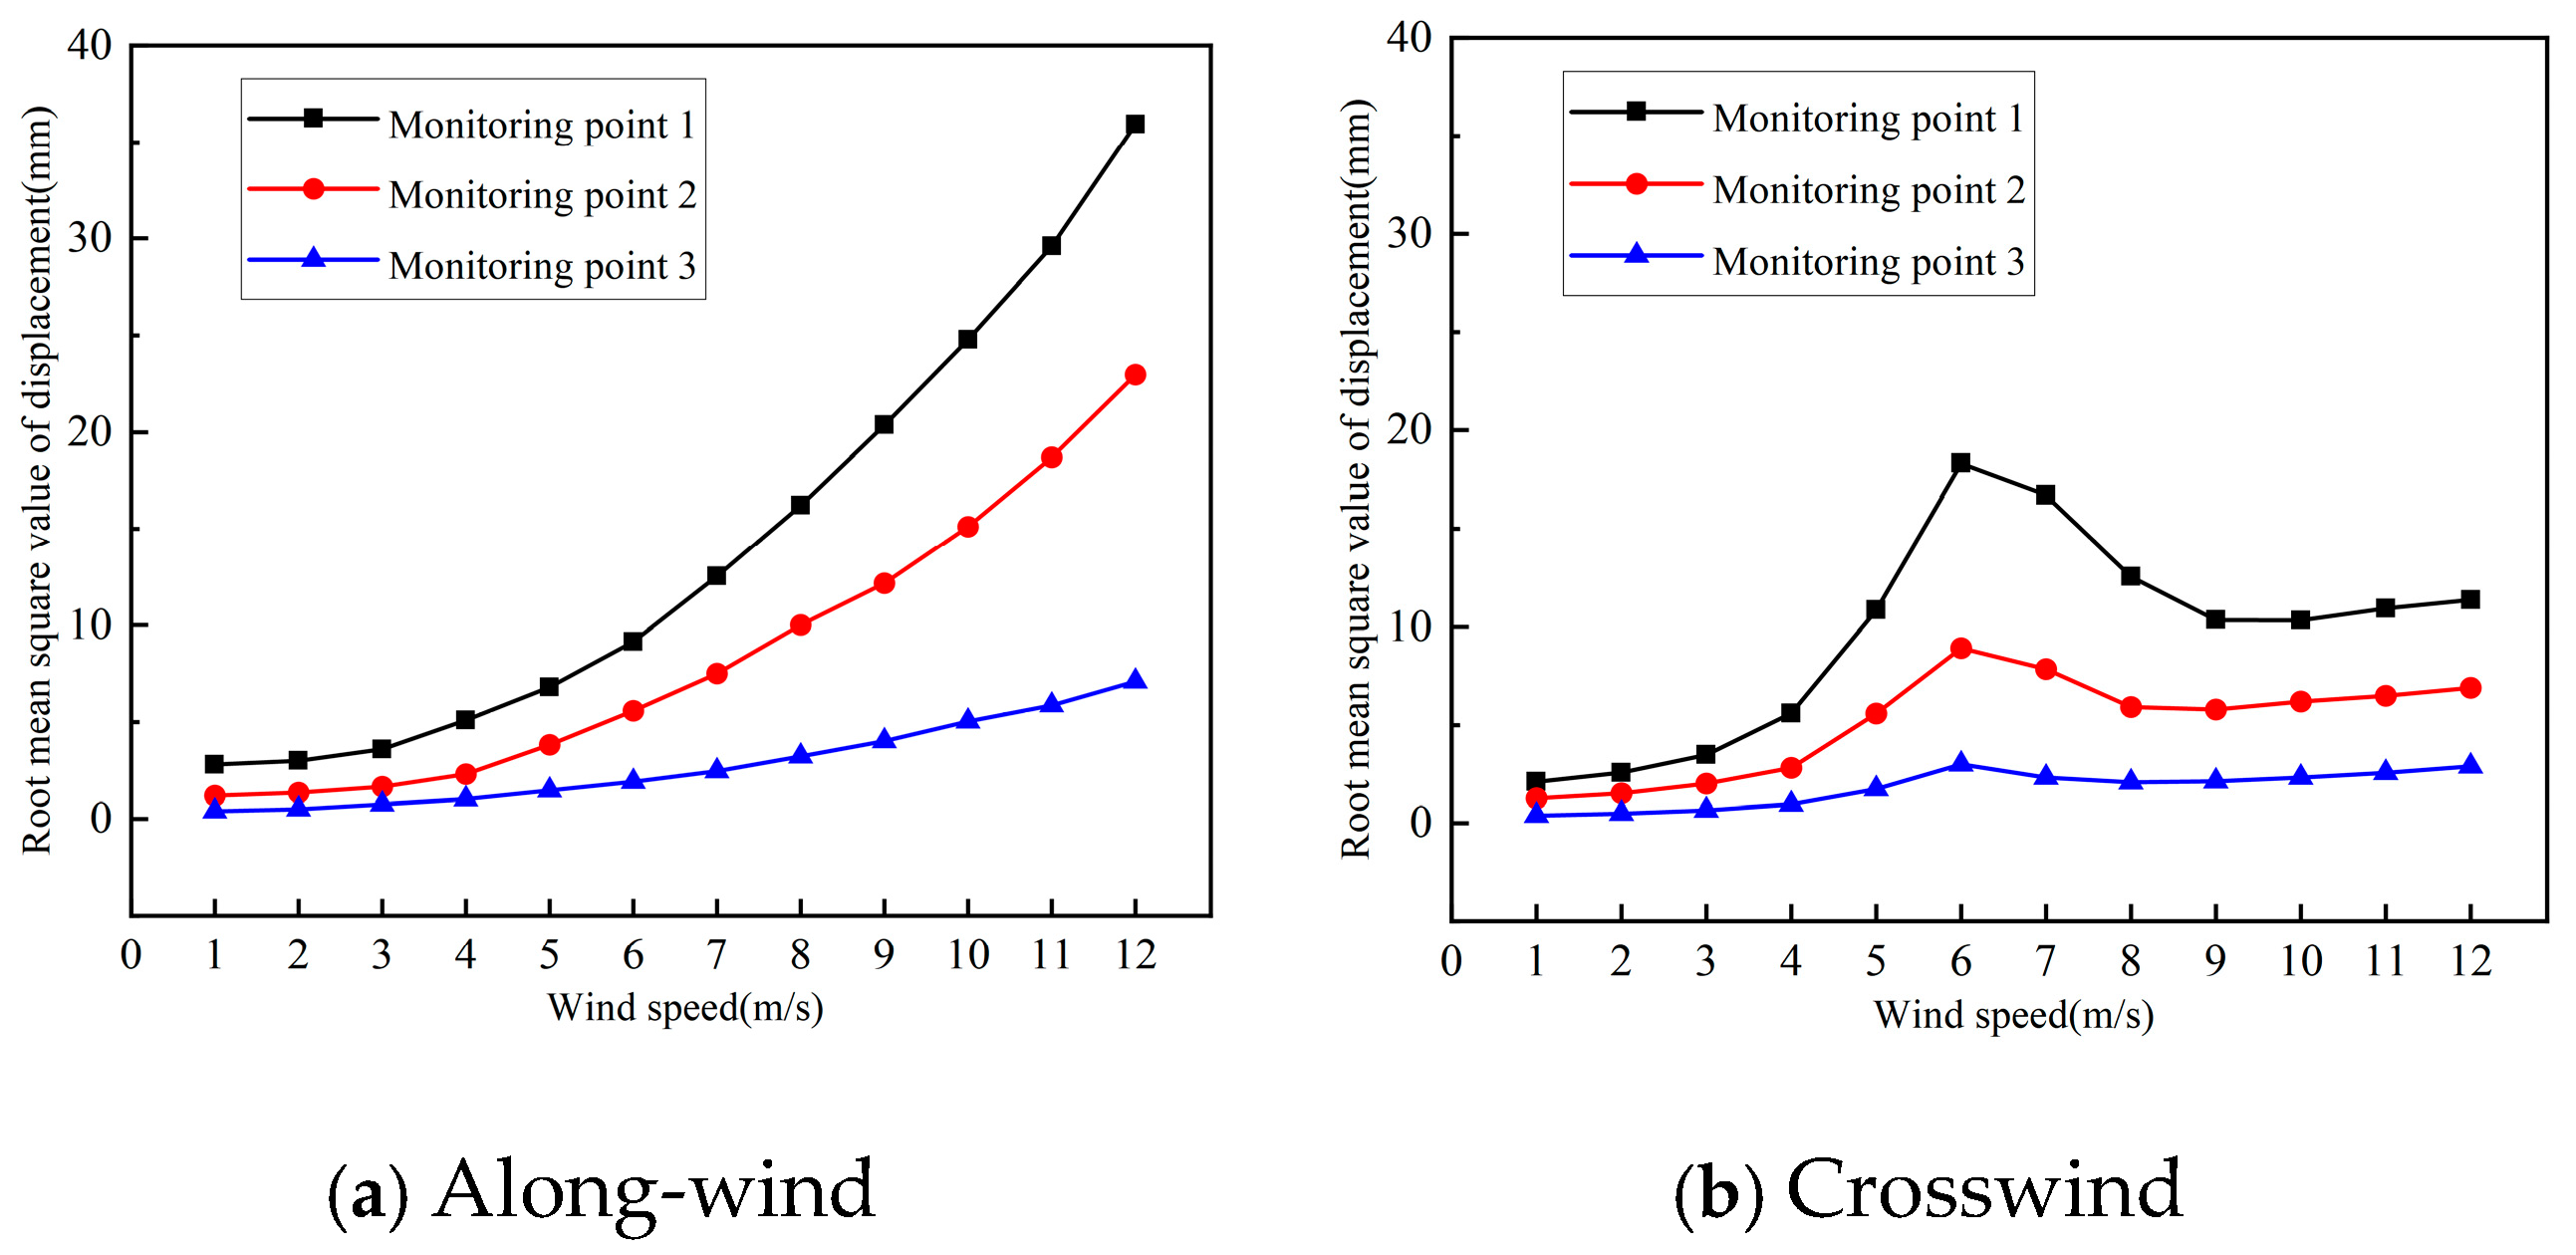
3.5.1. Displacement Response Analysis
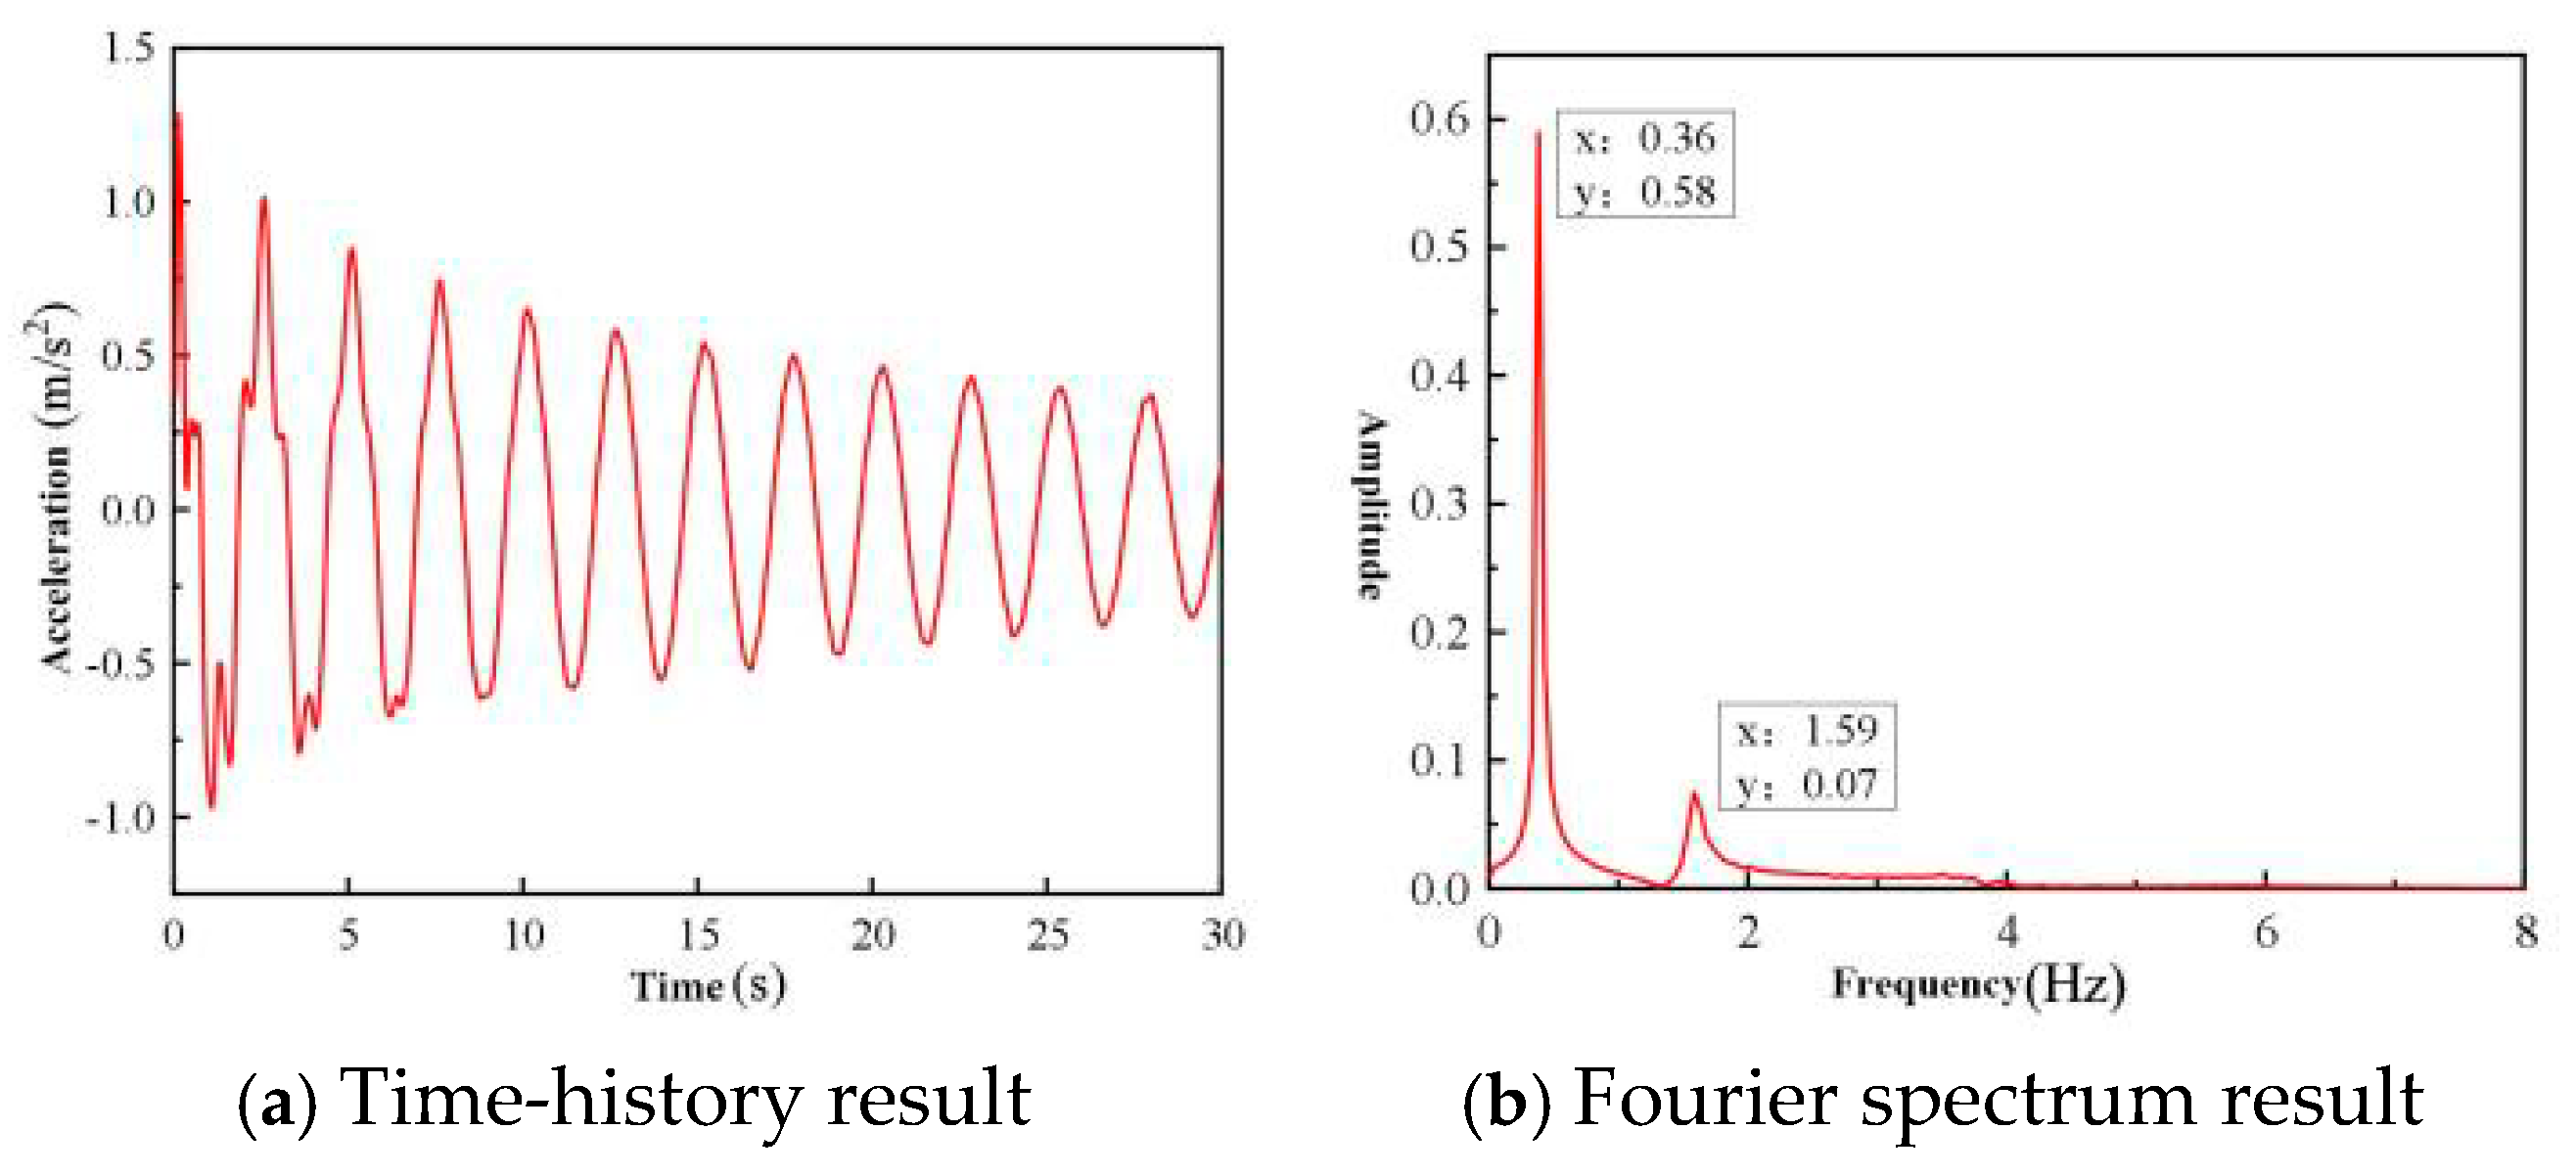
3.5.2. Analysis of Wake Shedding Frequency
4. Wind-Induced Vibration Analysis of High-mast Light Poles with Spiral Helical Strakes
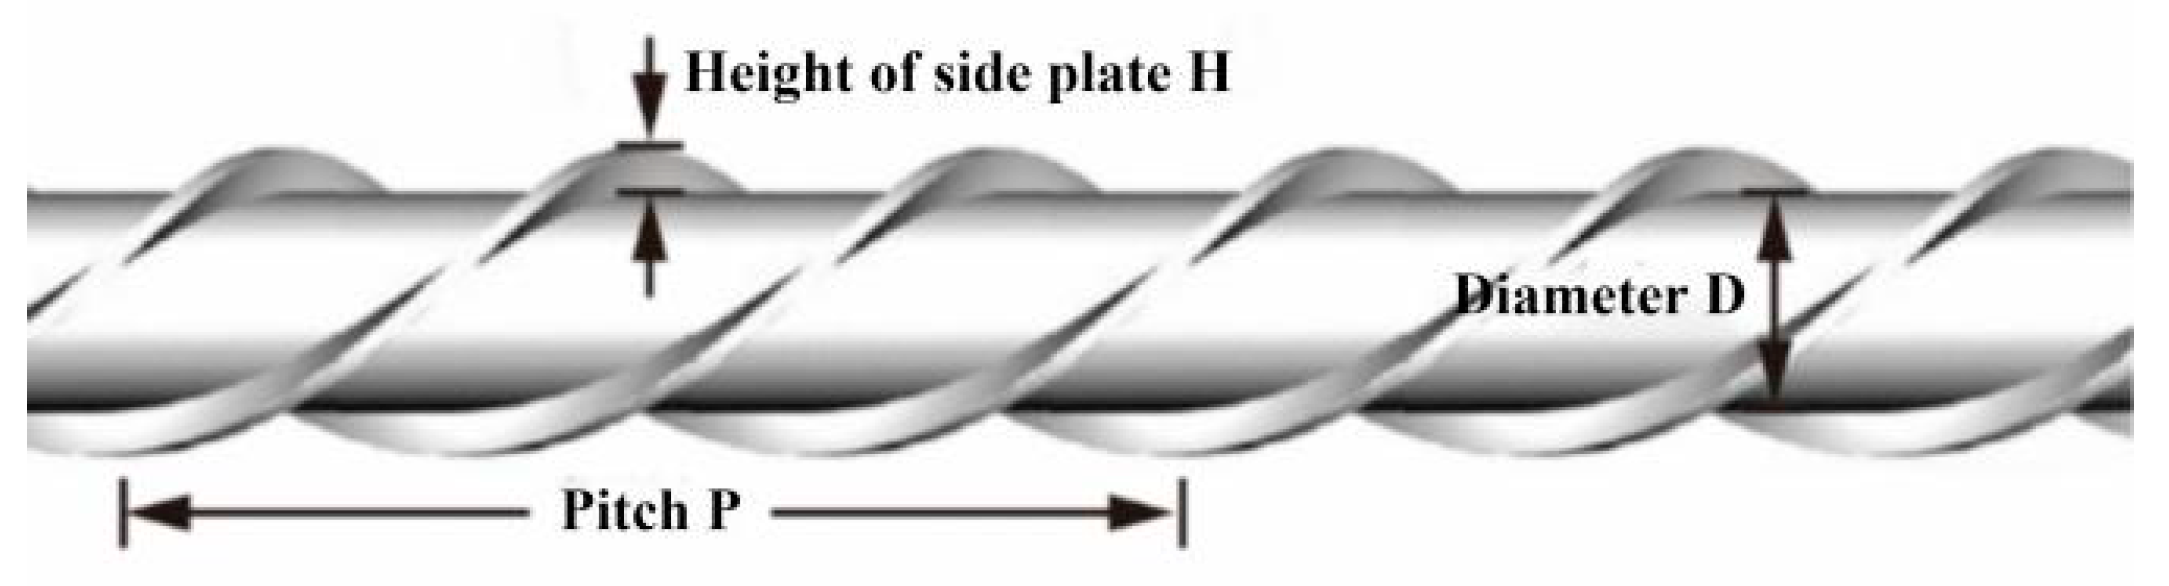
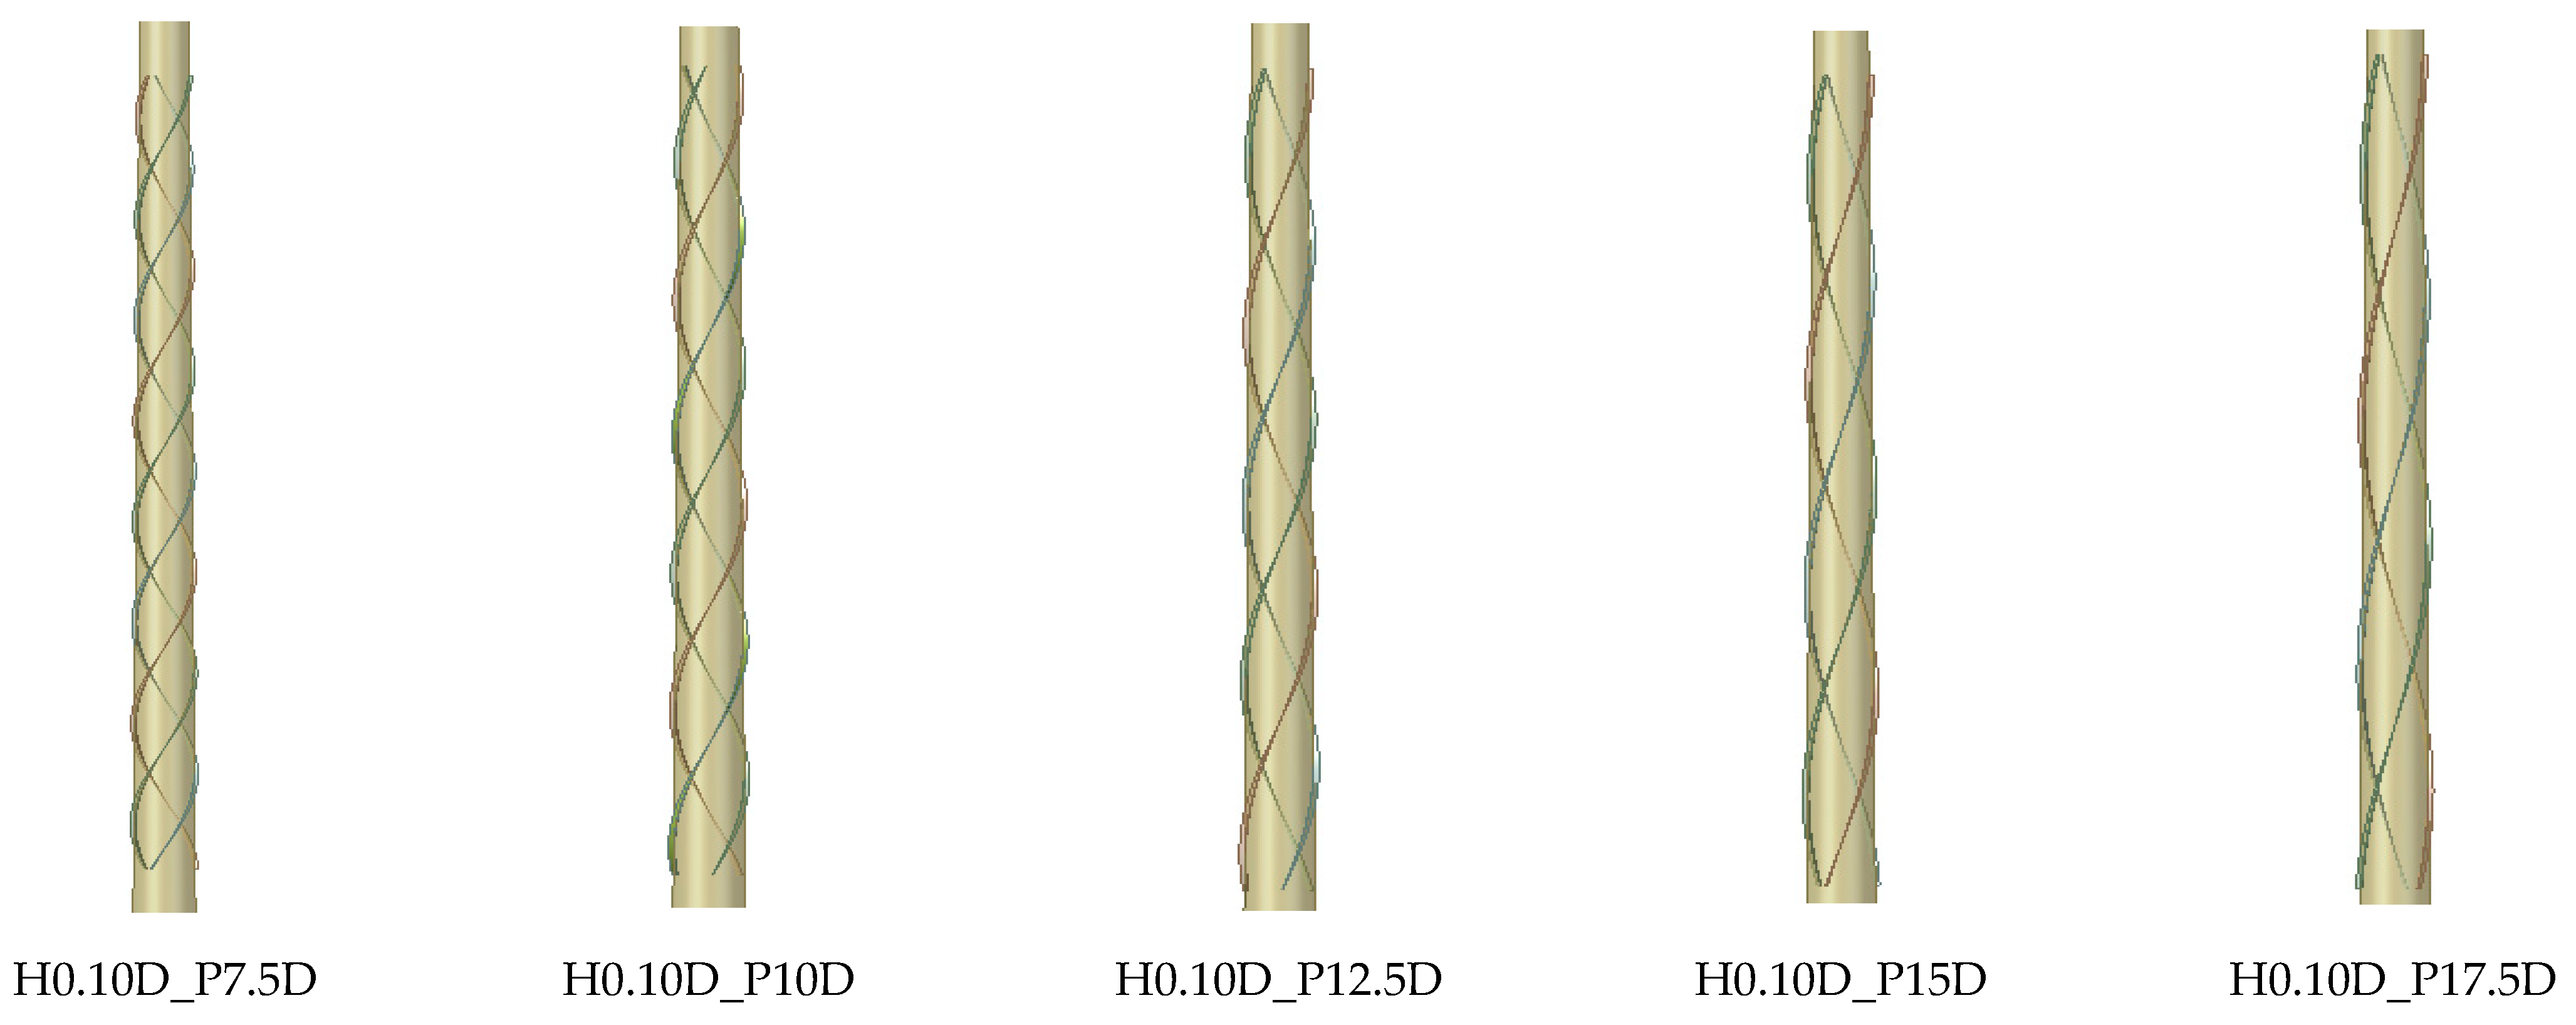
4.1. Basic Parameters and Layout of Spiral Helical Strakes
4.2. Influence of Different Pitch on Wind-Induced Vibration Response of the High-Mast Light Pole
4.2.1. Simulated Conditions
4.2.2. Modal Analysis
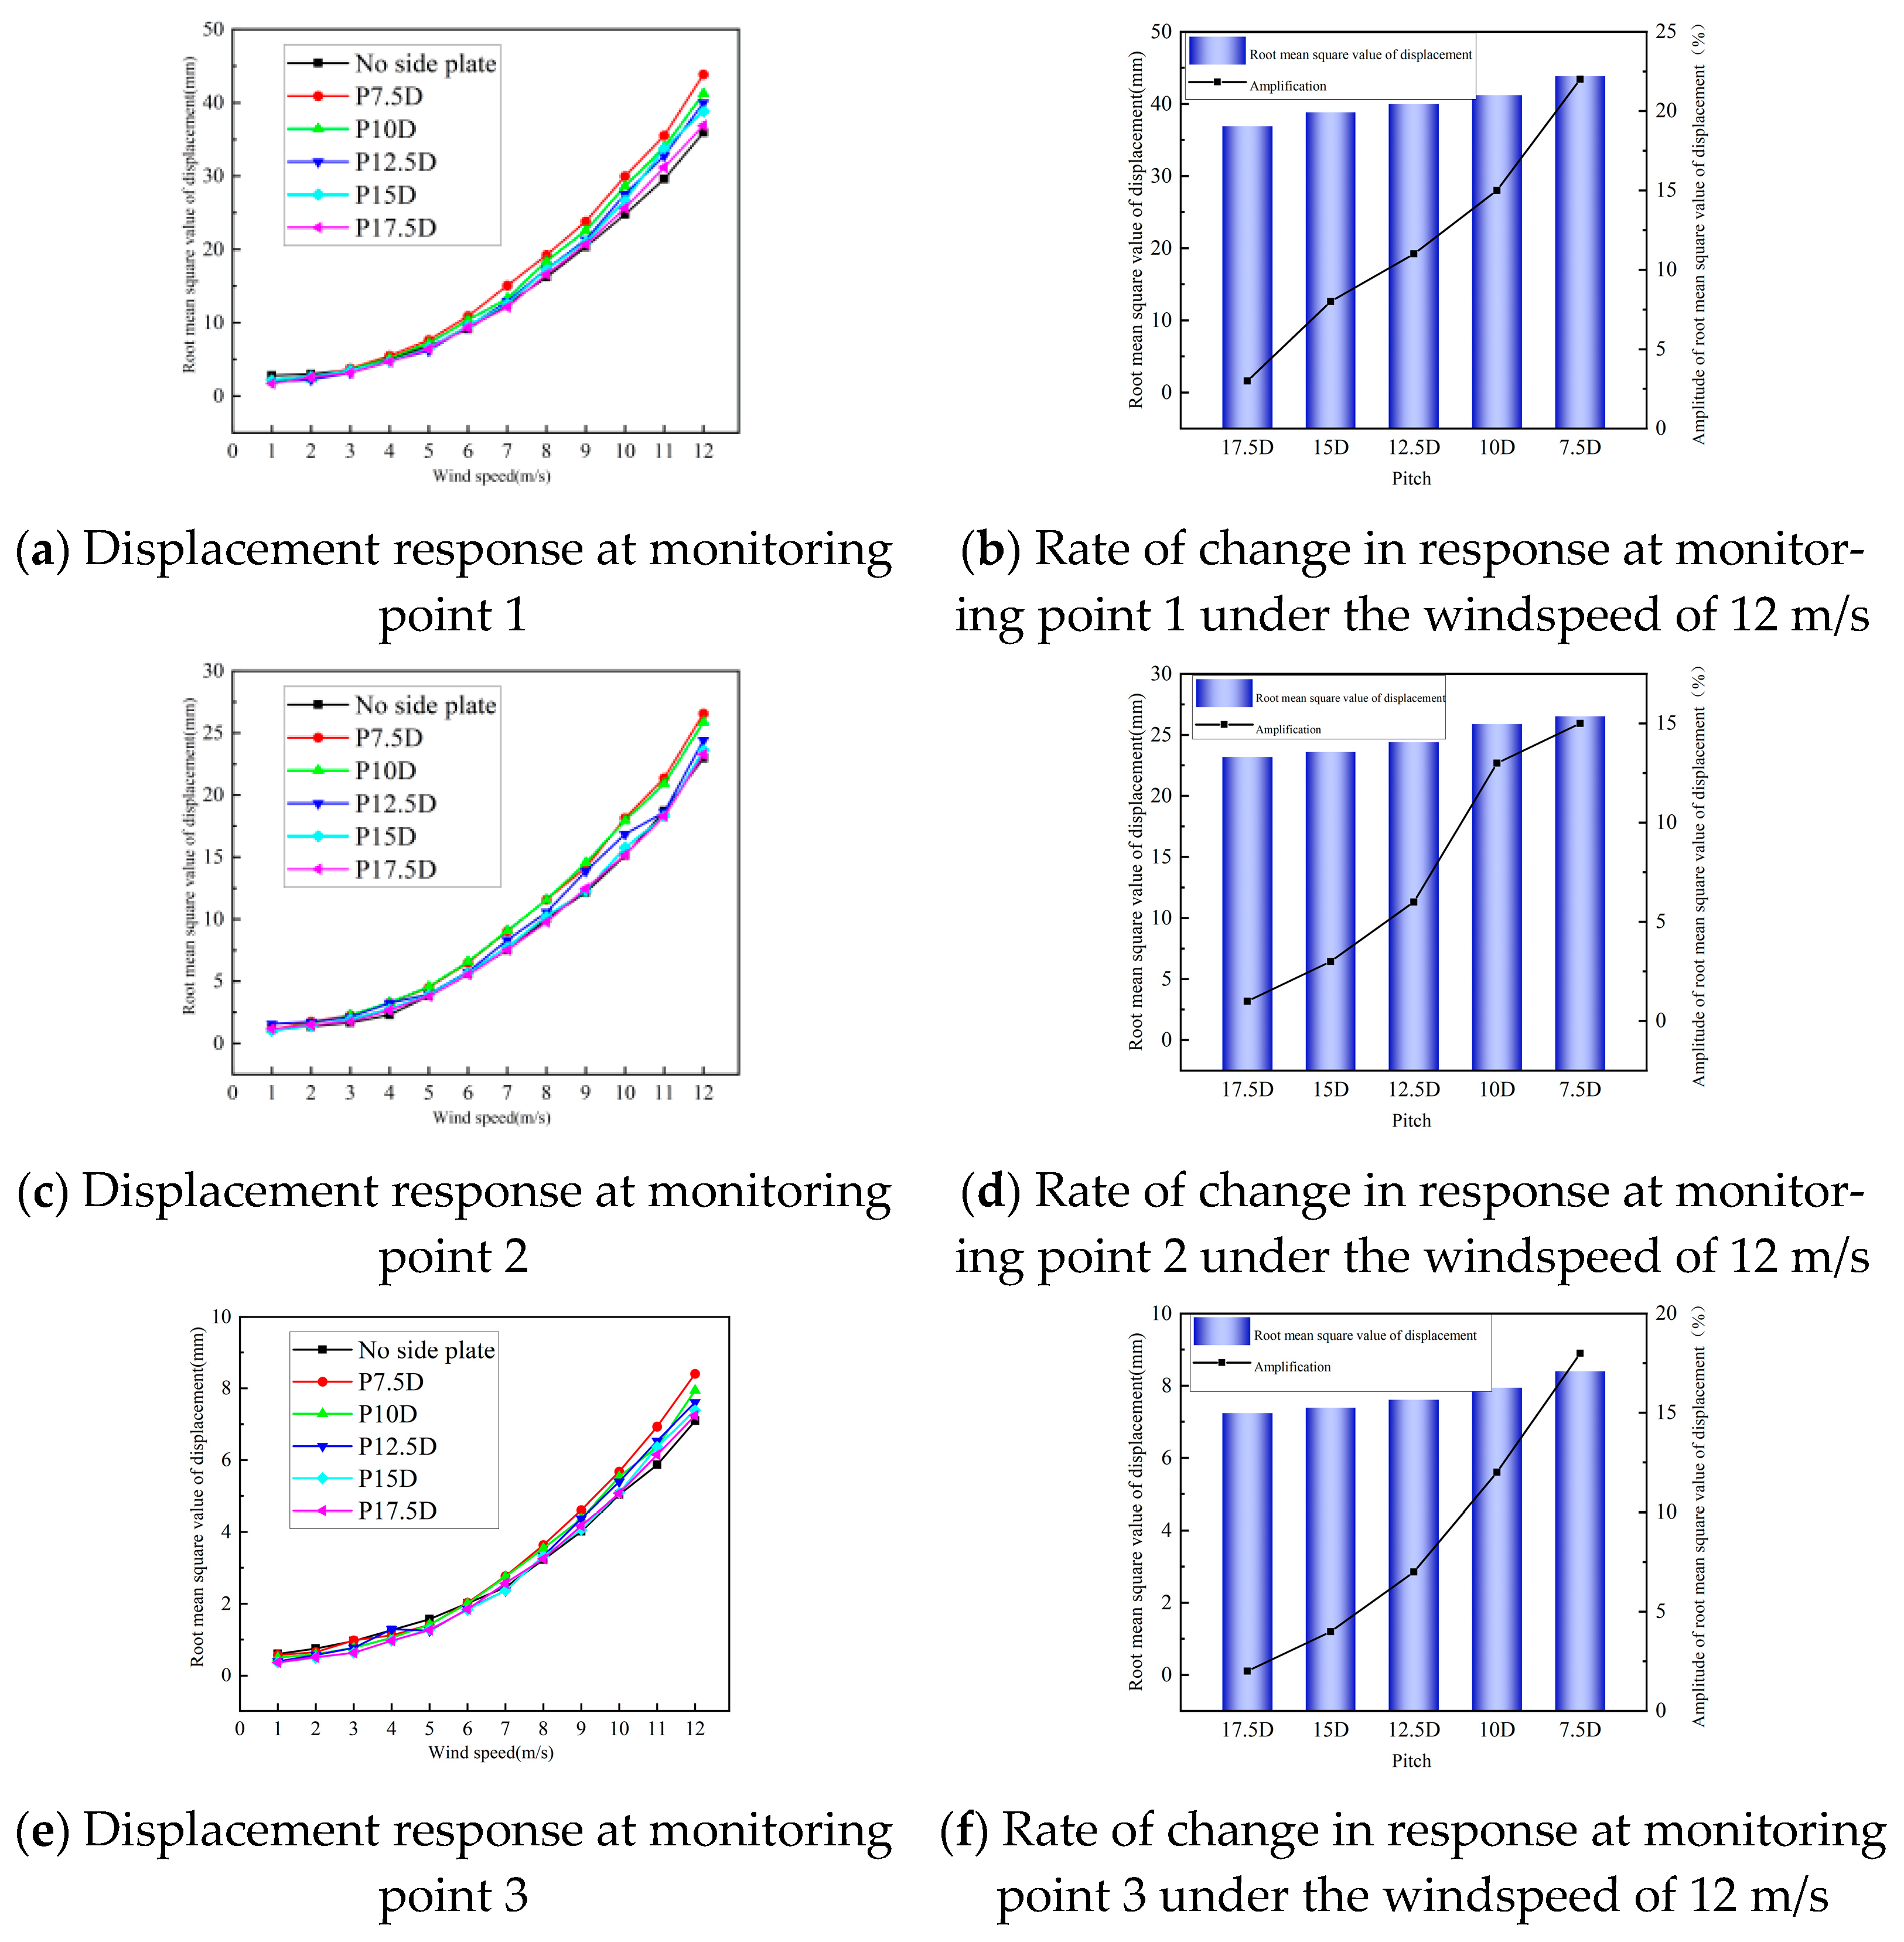
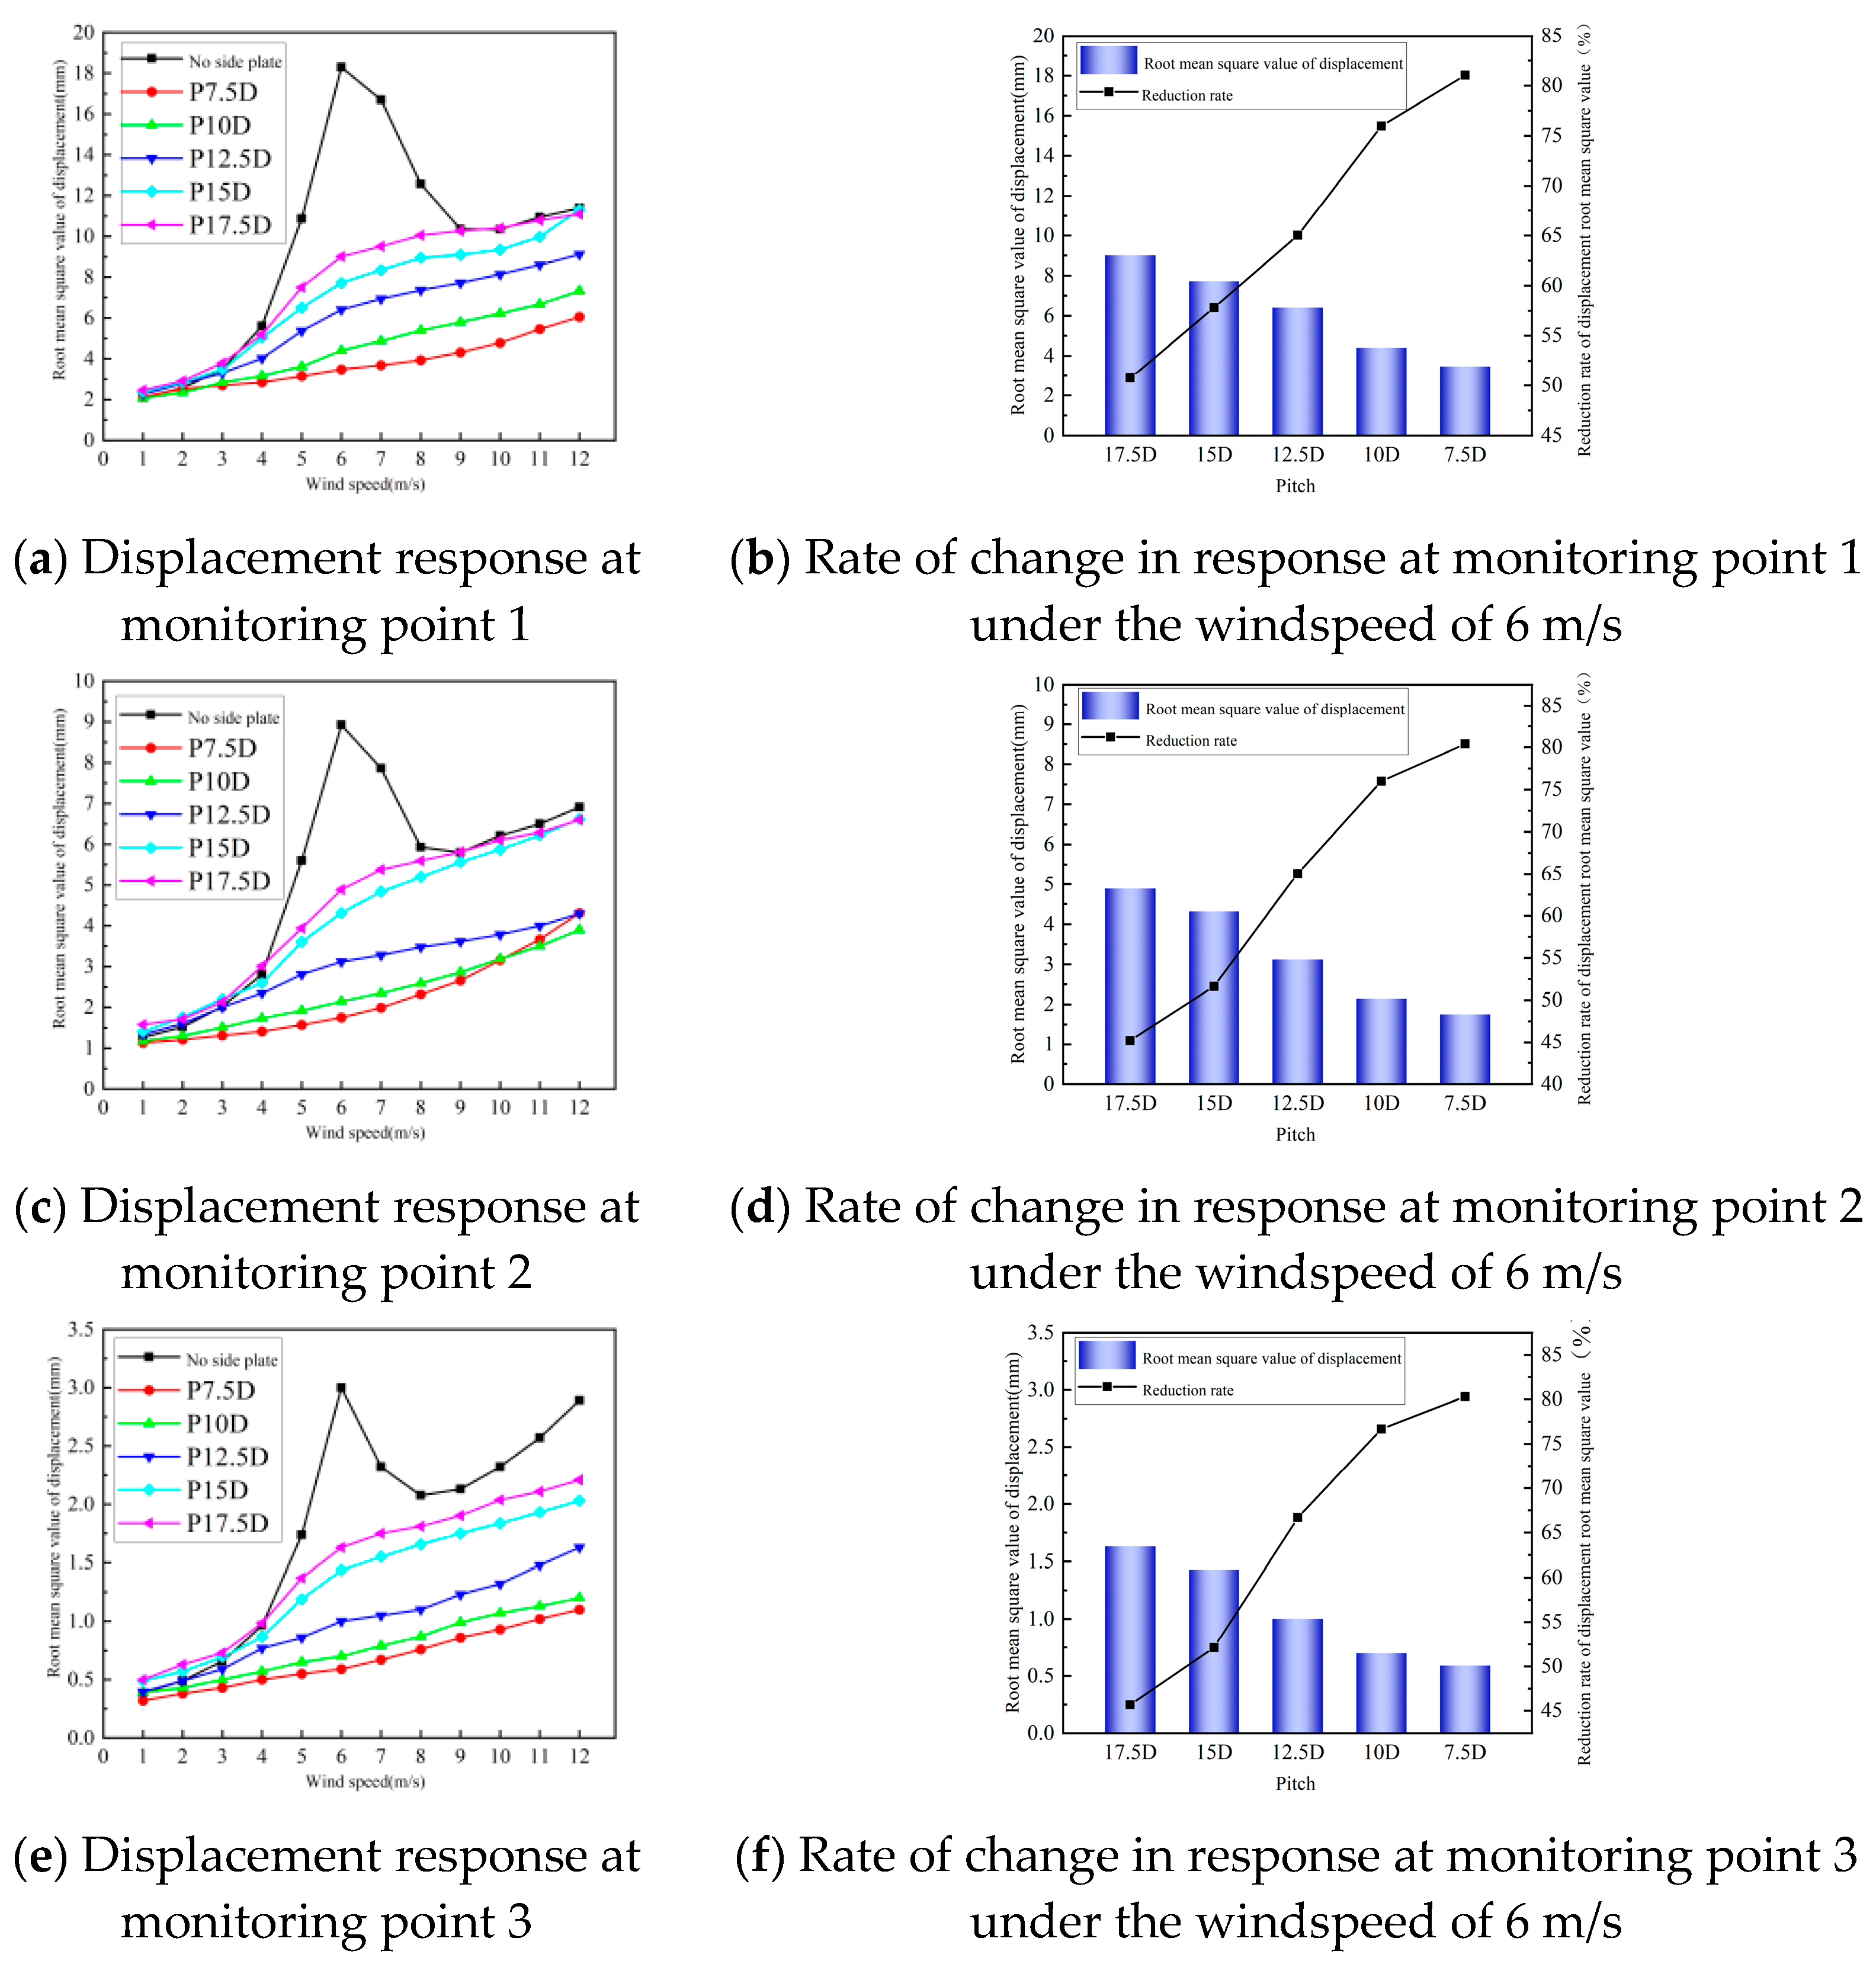
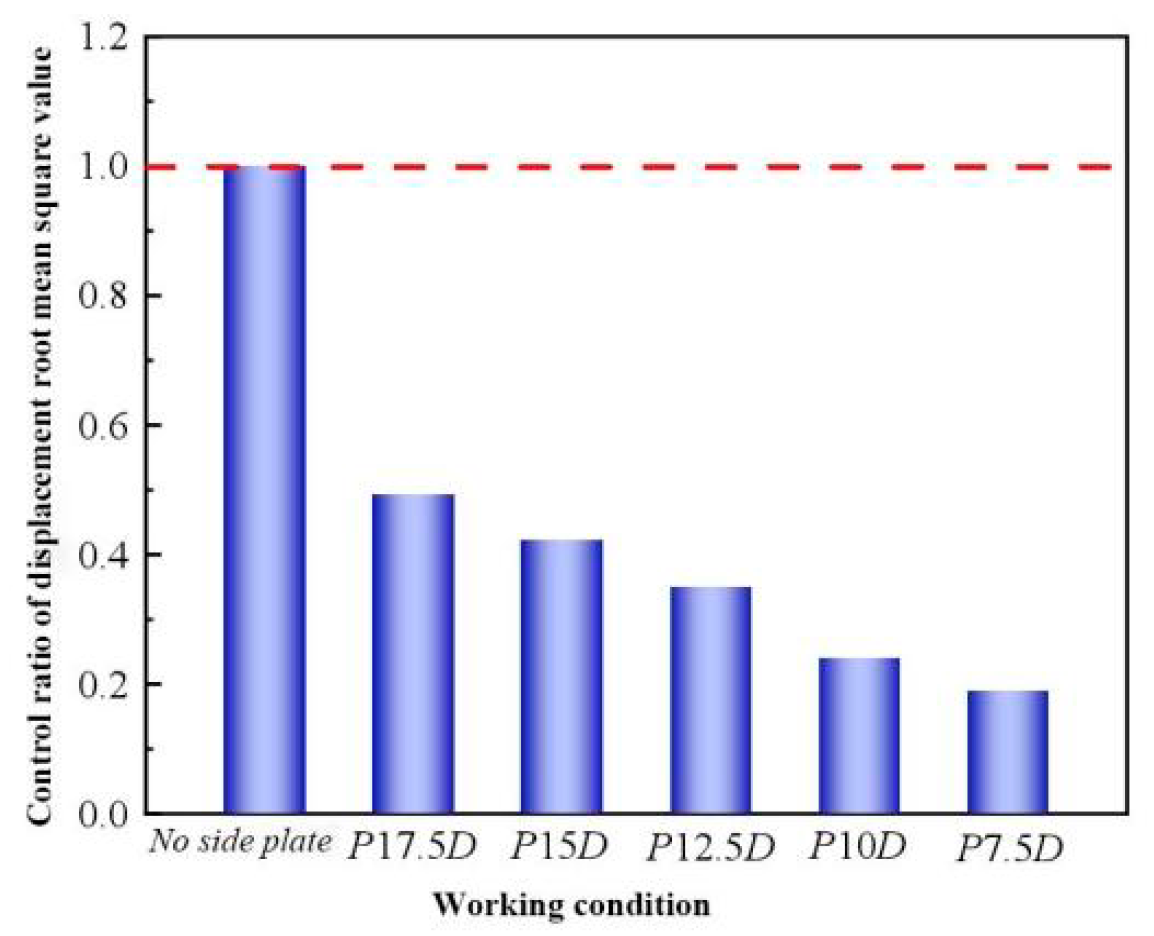
4.3. Displacement Response Analysis
4.3.1. Along-wind Response
4.3.2. Crosswind Response
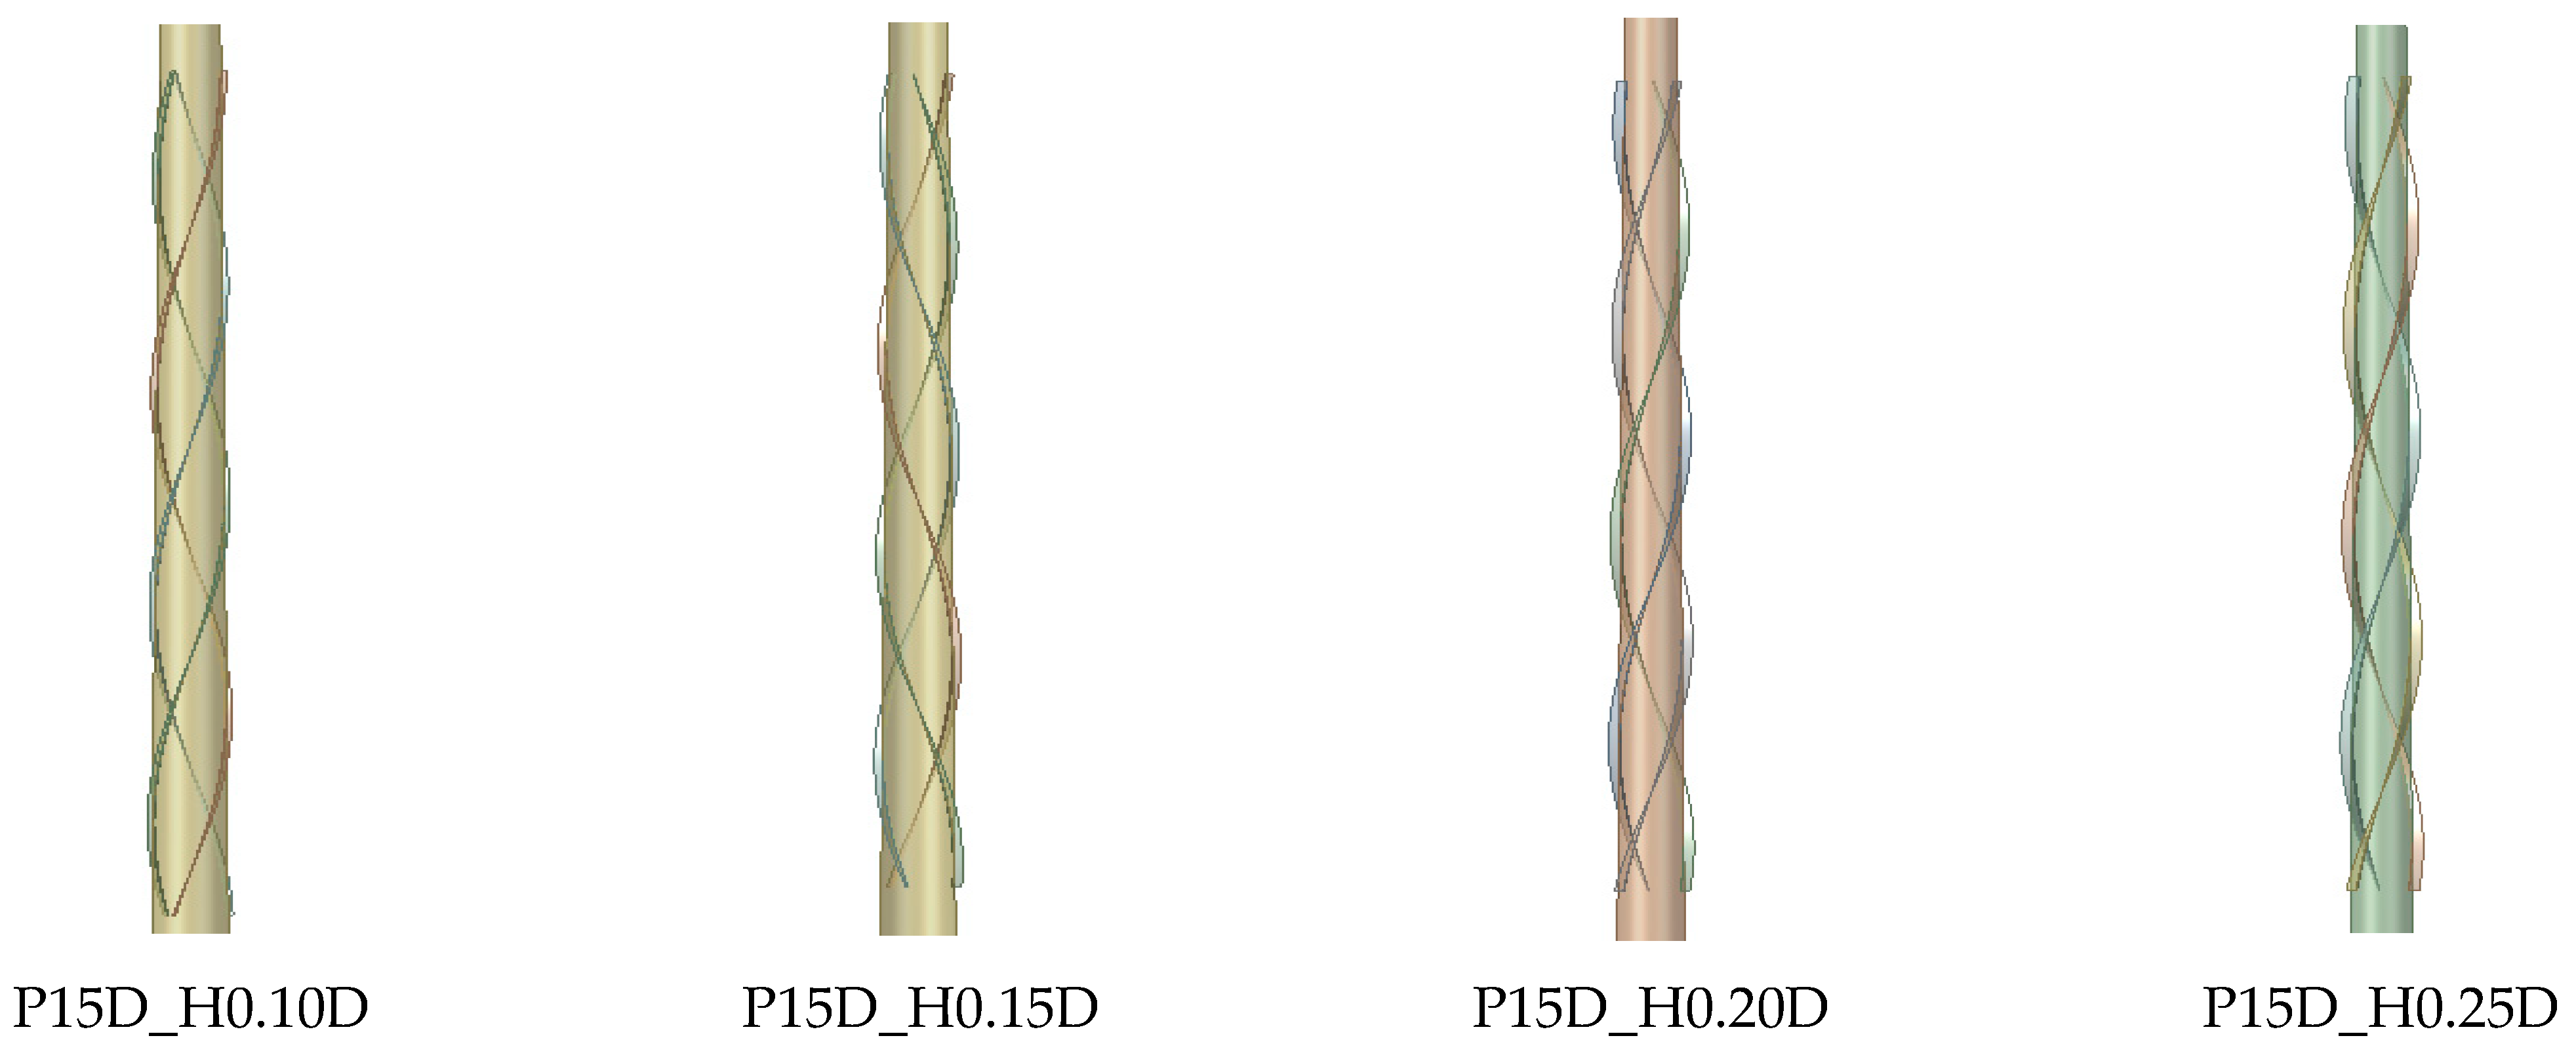
4.4. Influence of Different Side Plate Heights on the Wind-Induced Vibration Response of the High-Mast Light Pole
4.4.1. Simulated Conditions
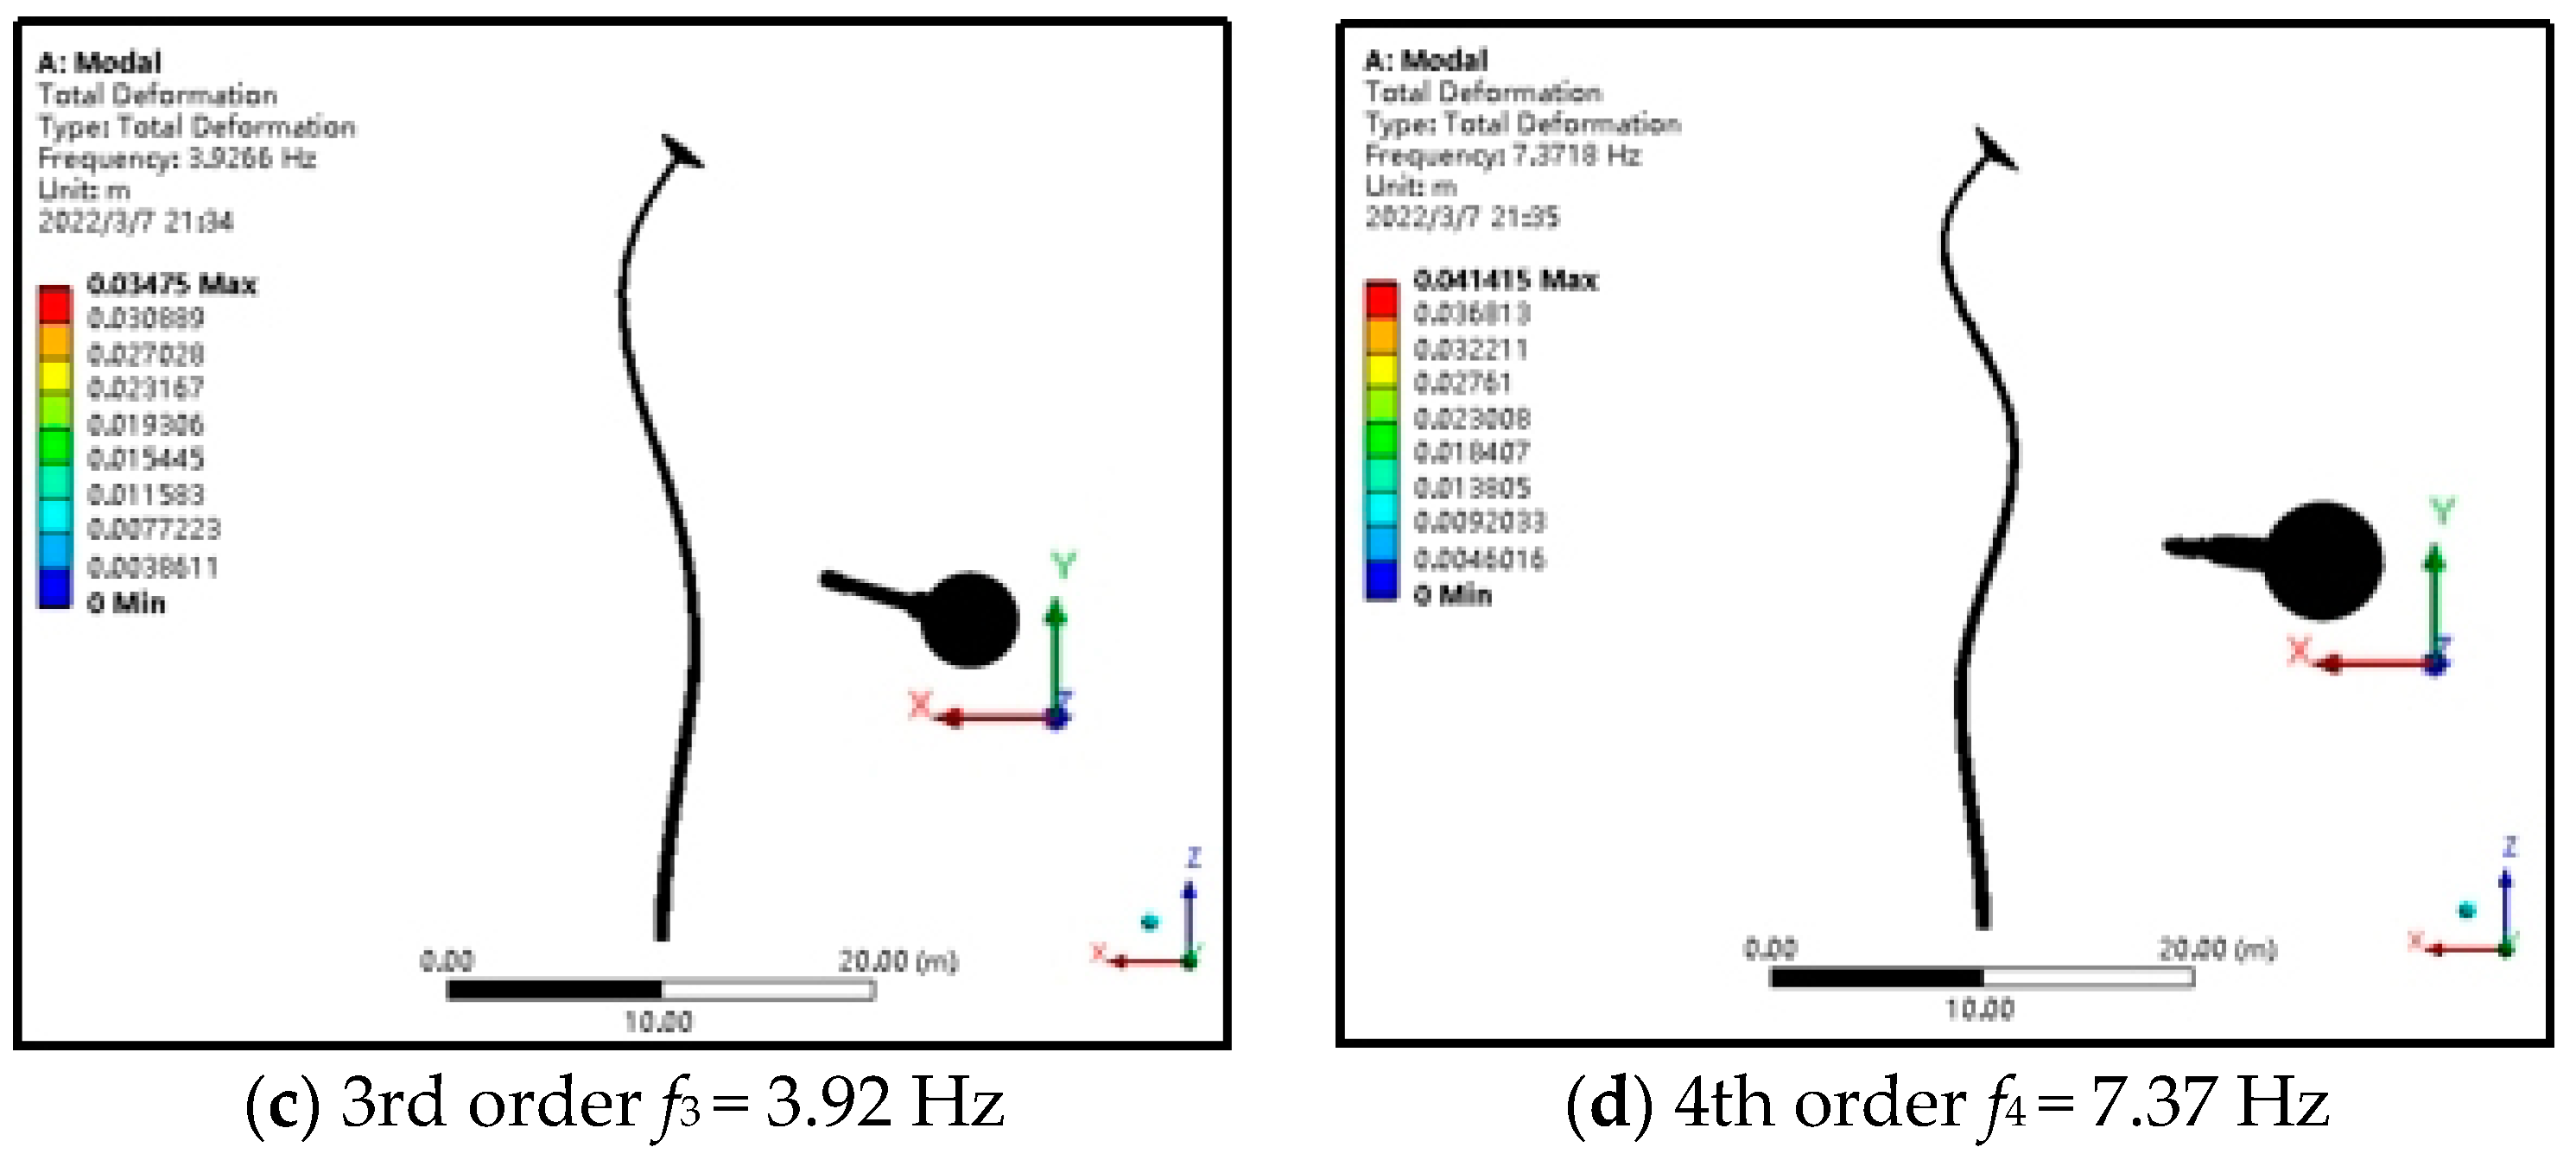
4.4.2. Modal Analysis
4.5. Displacement Response Analysis
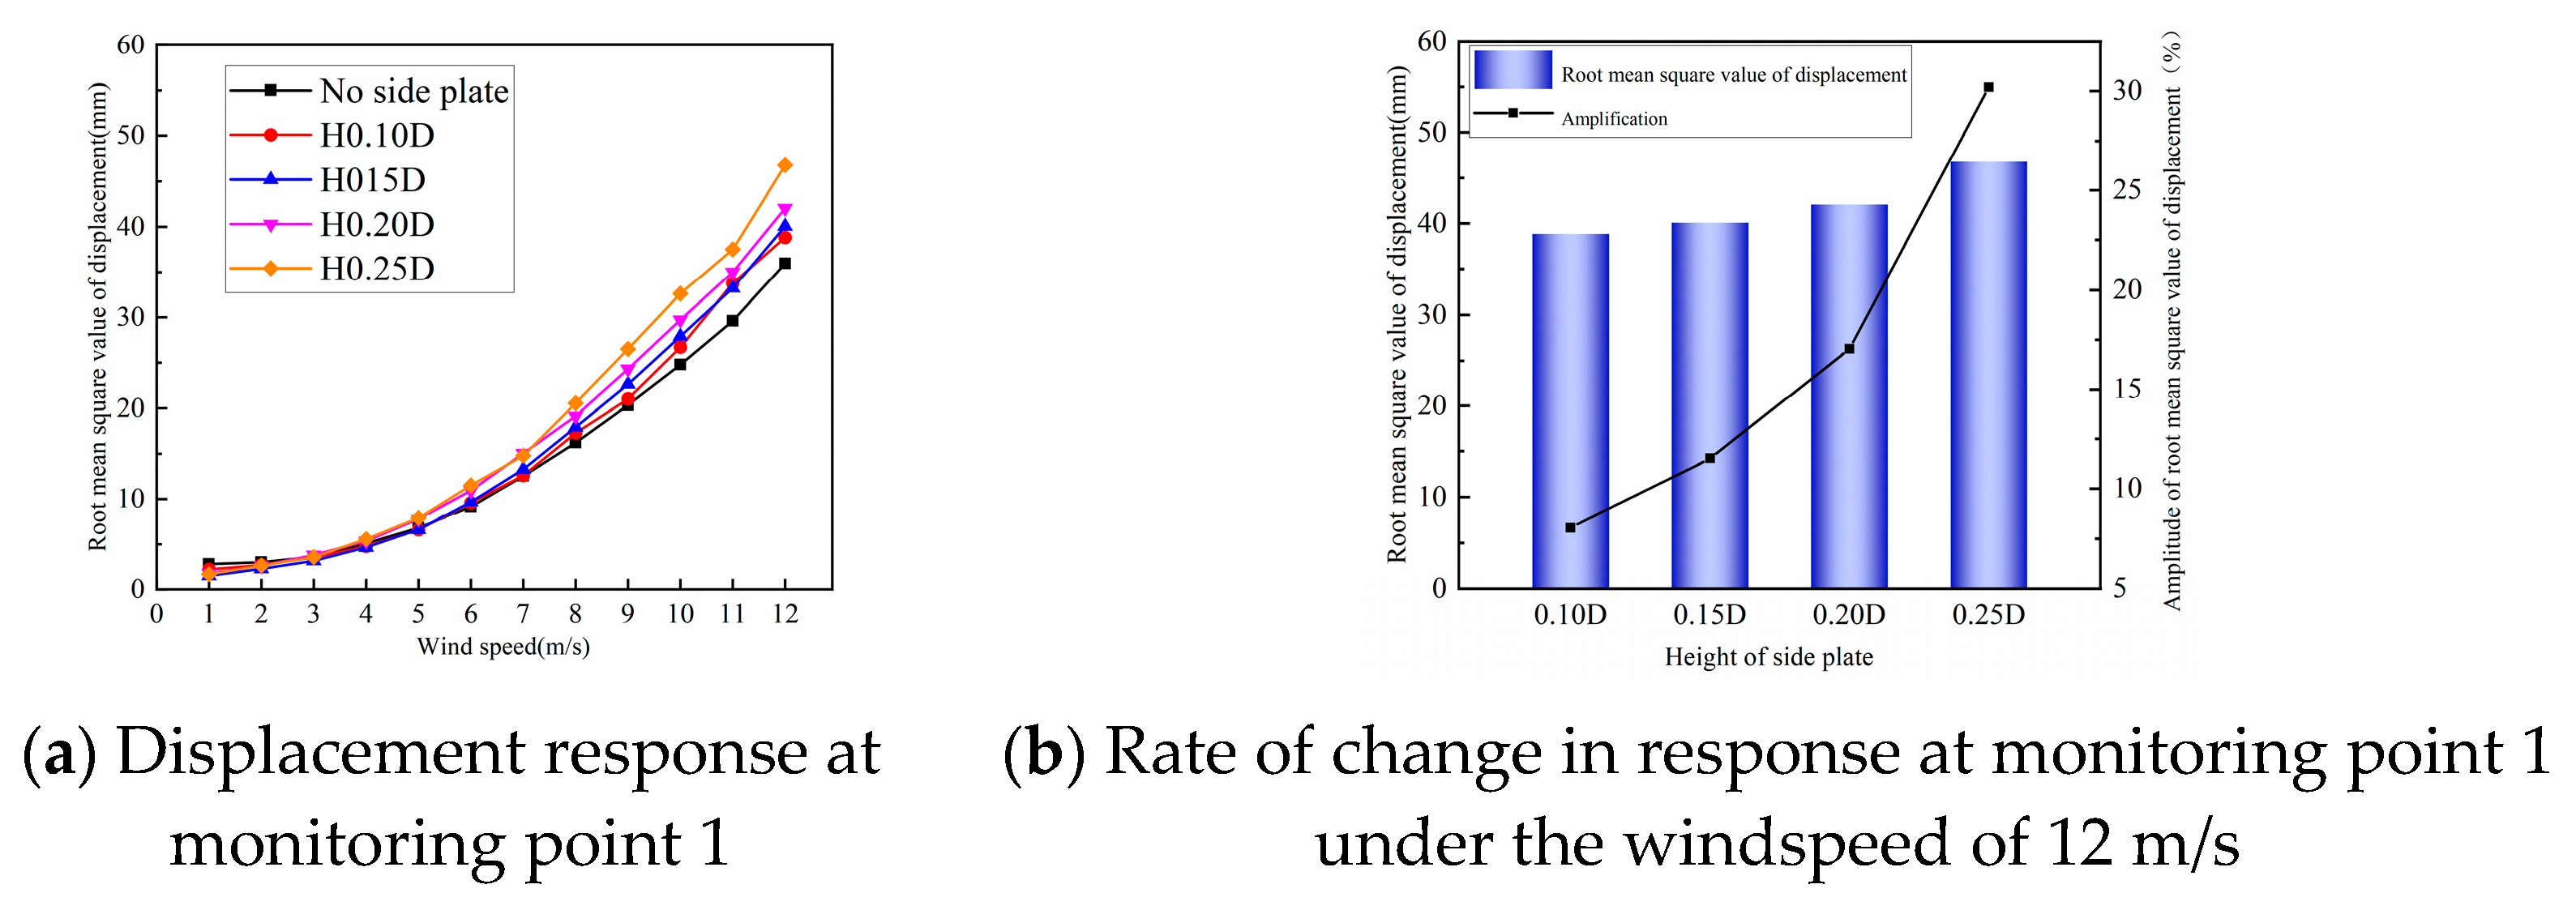
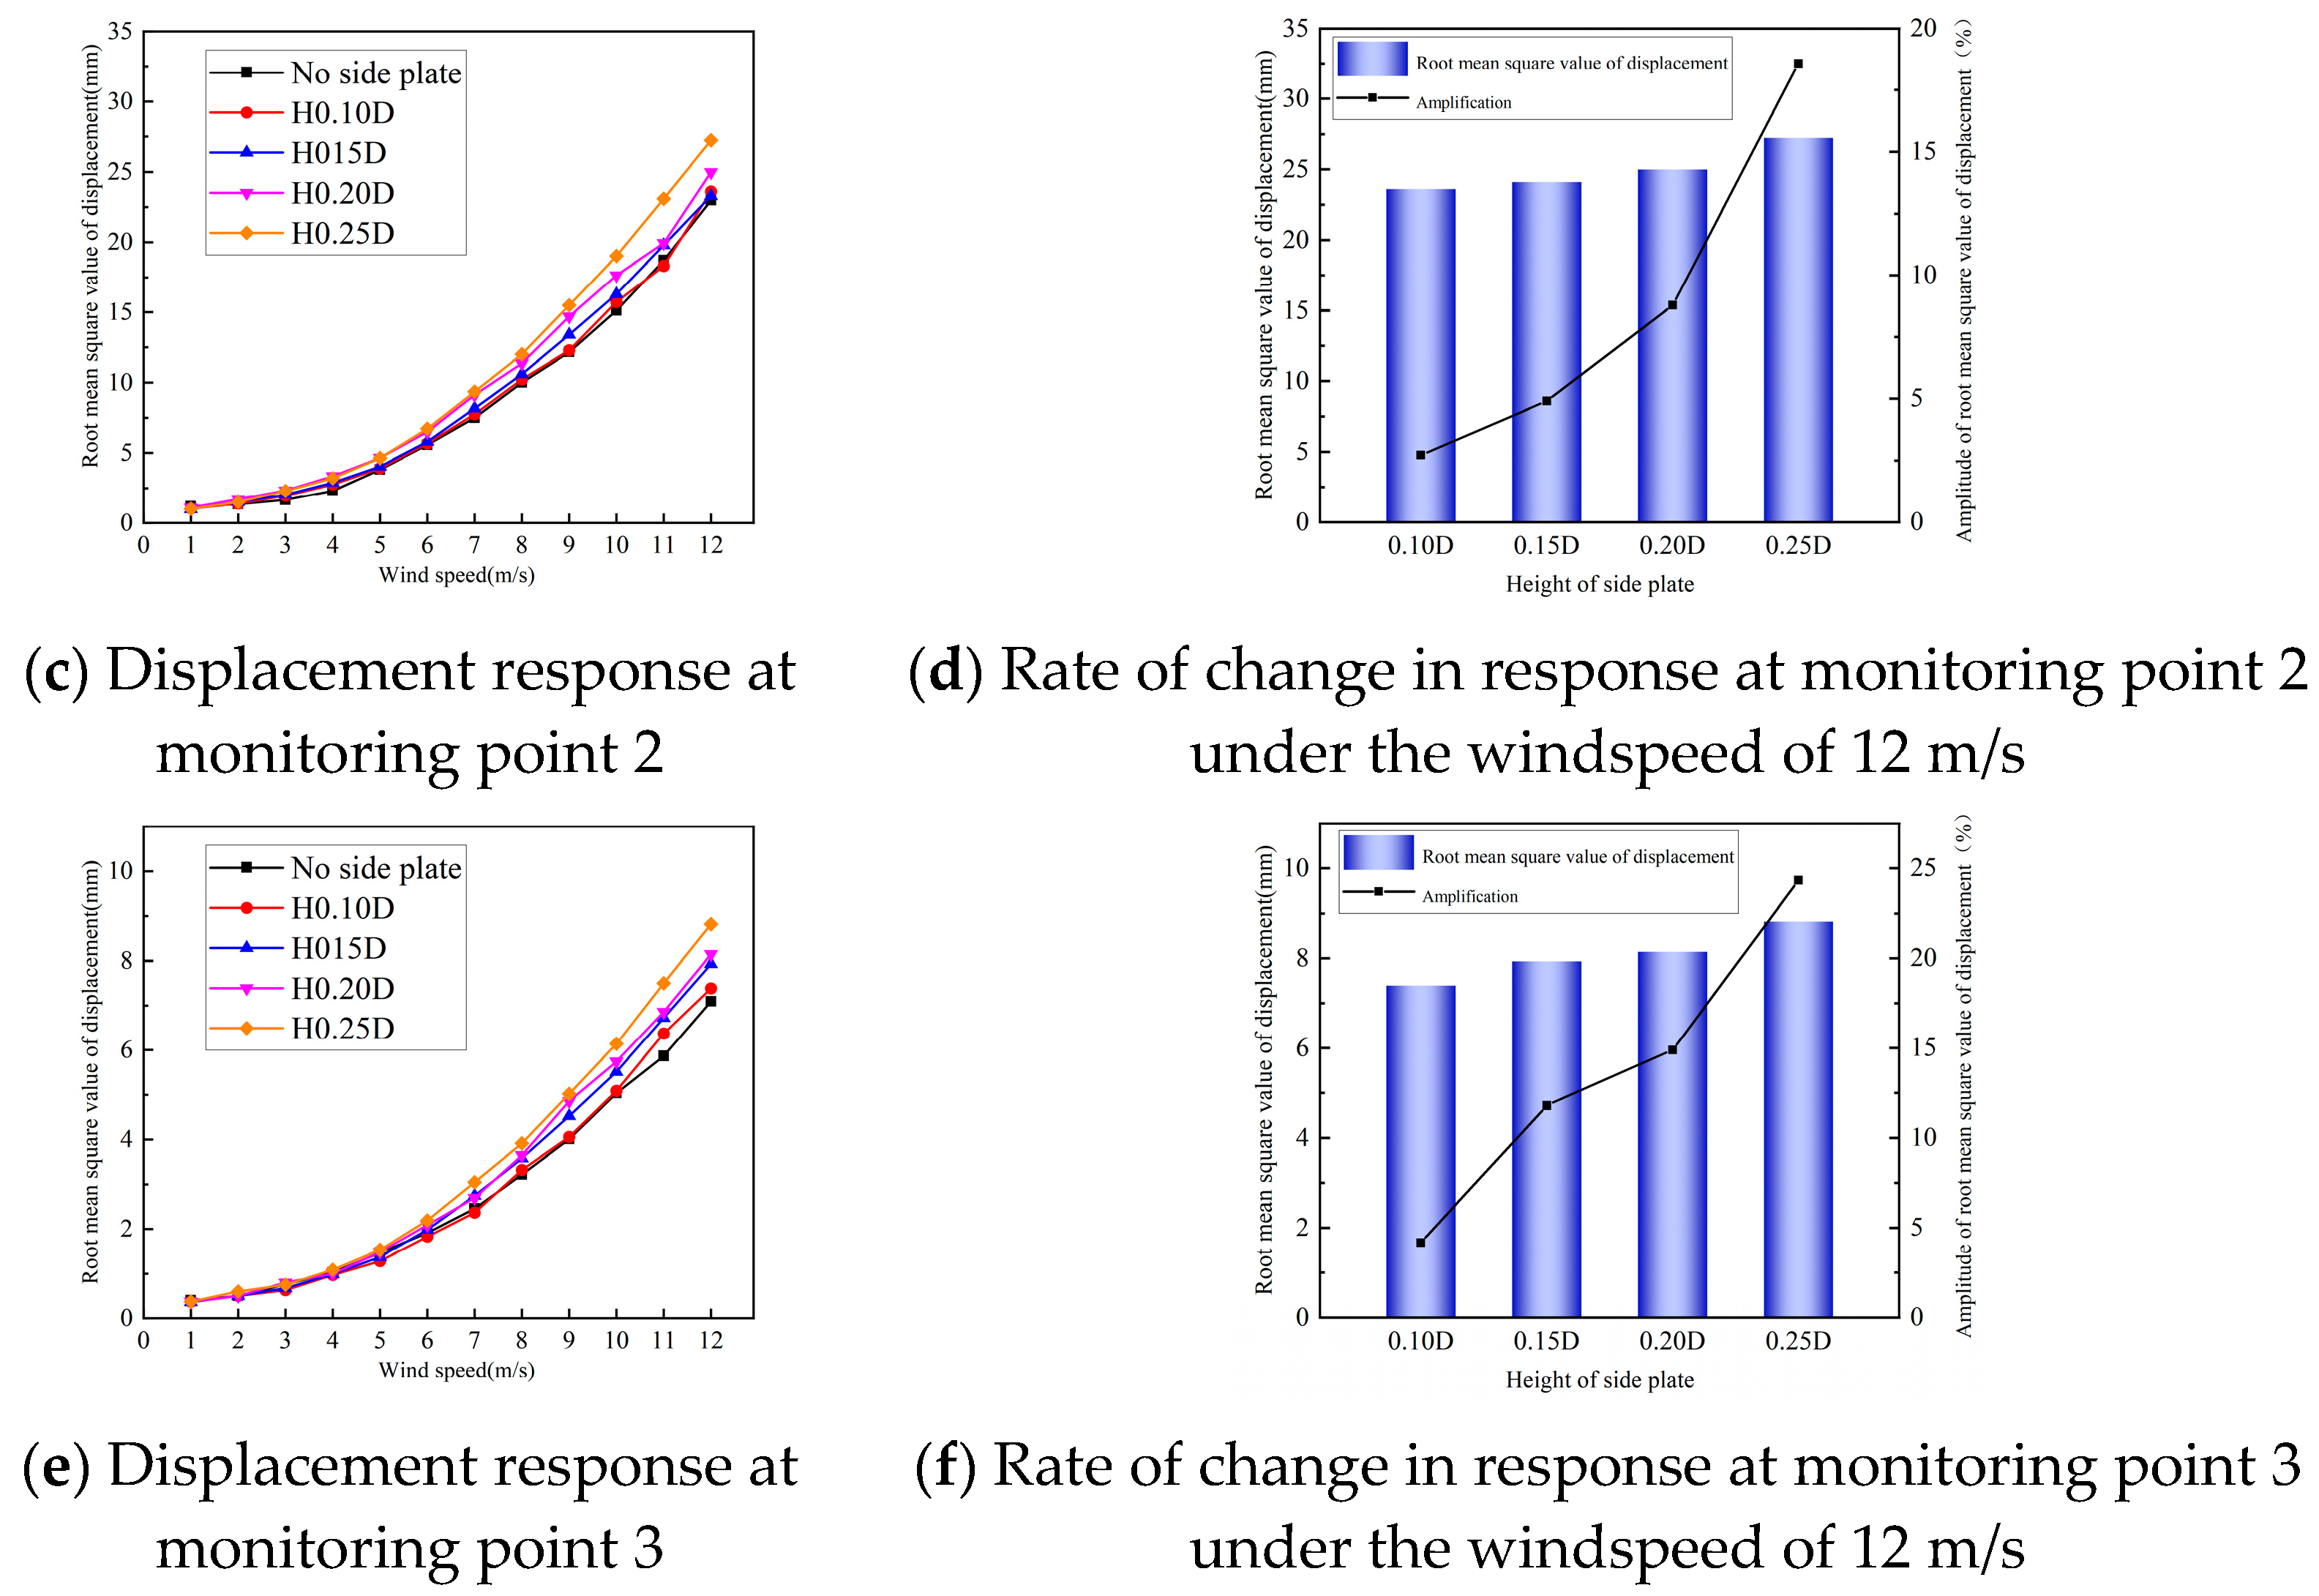
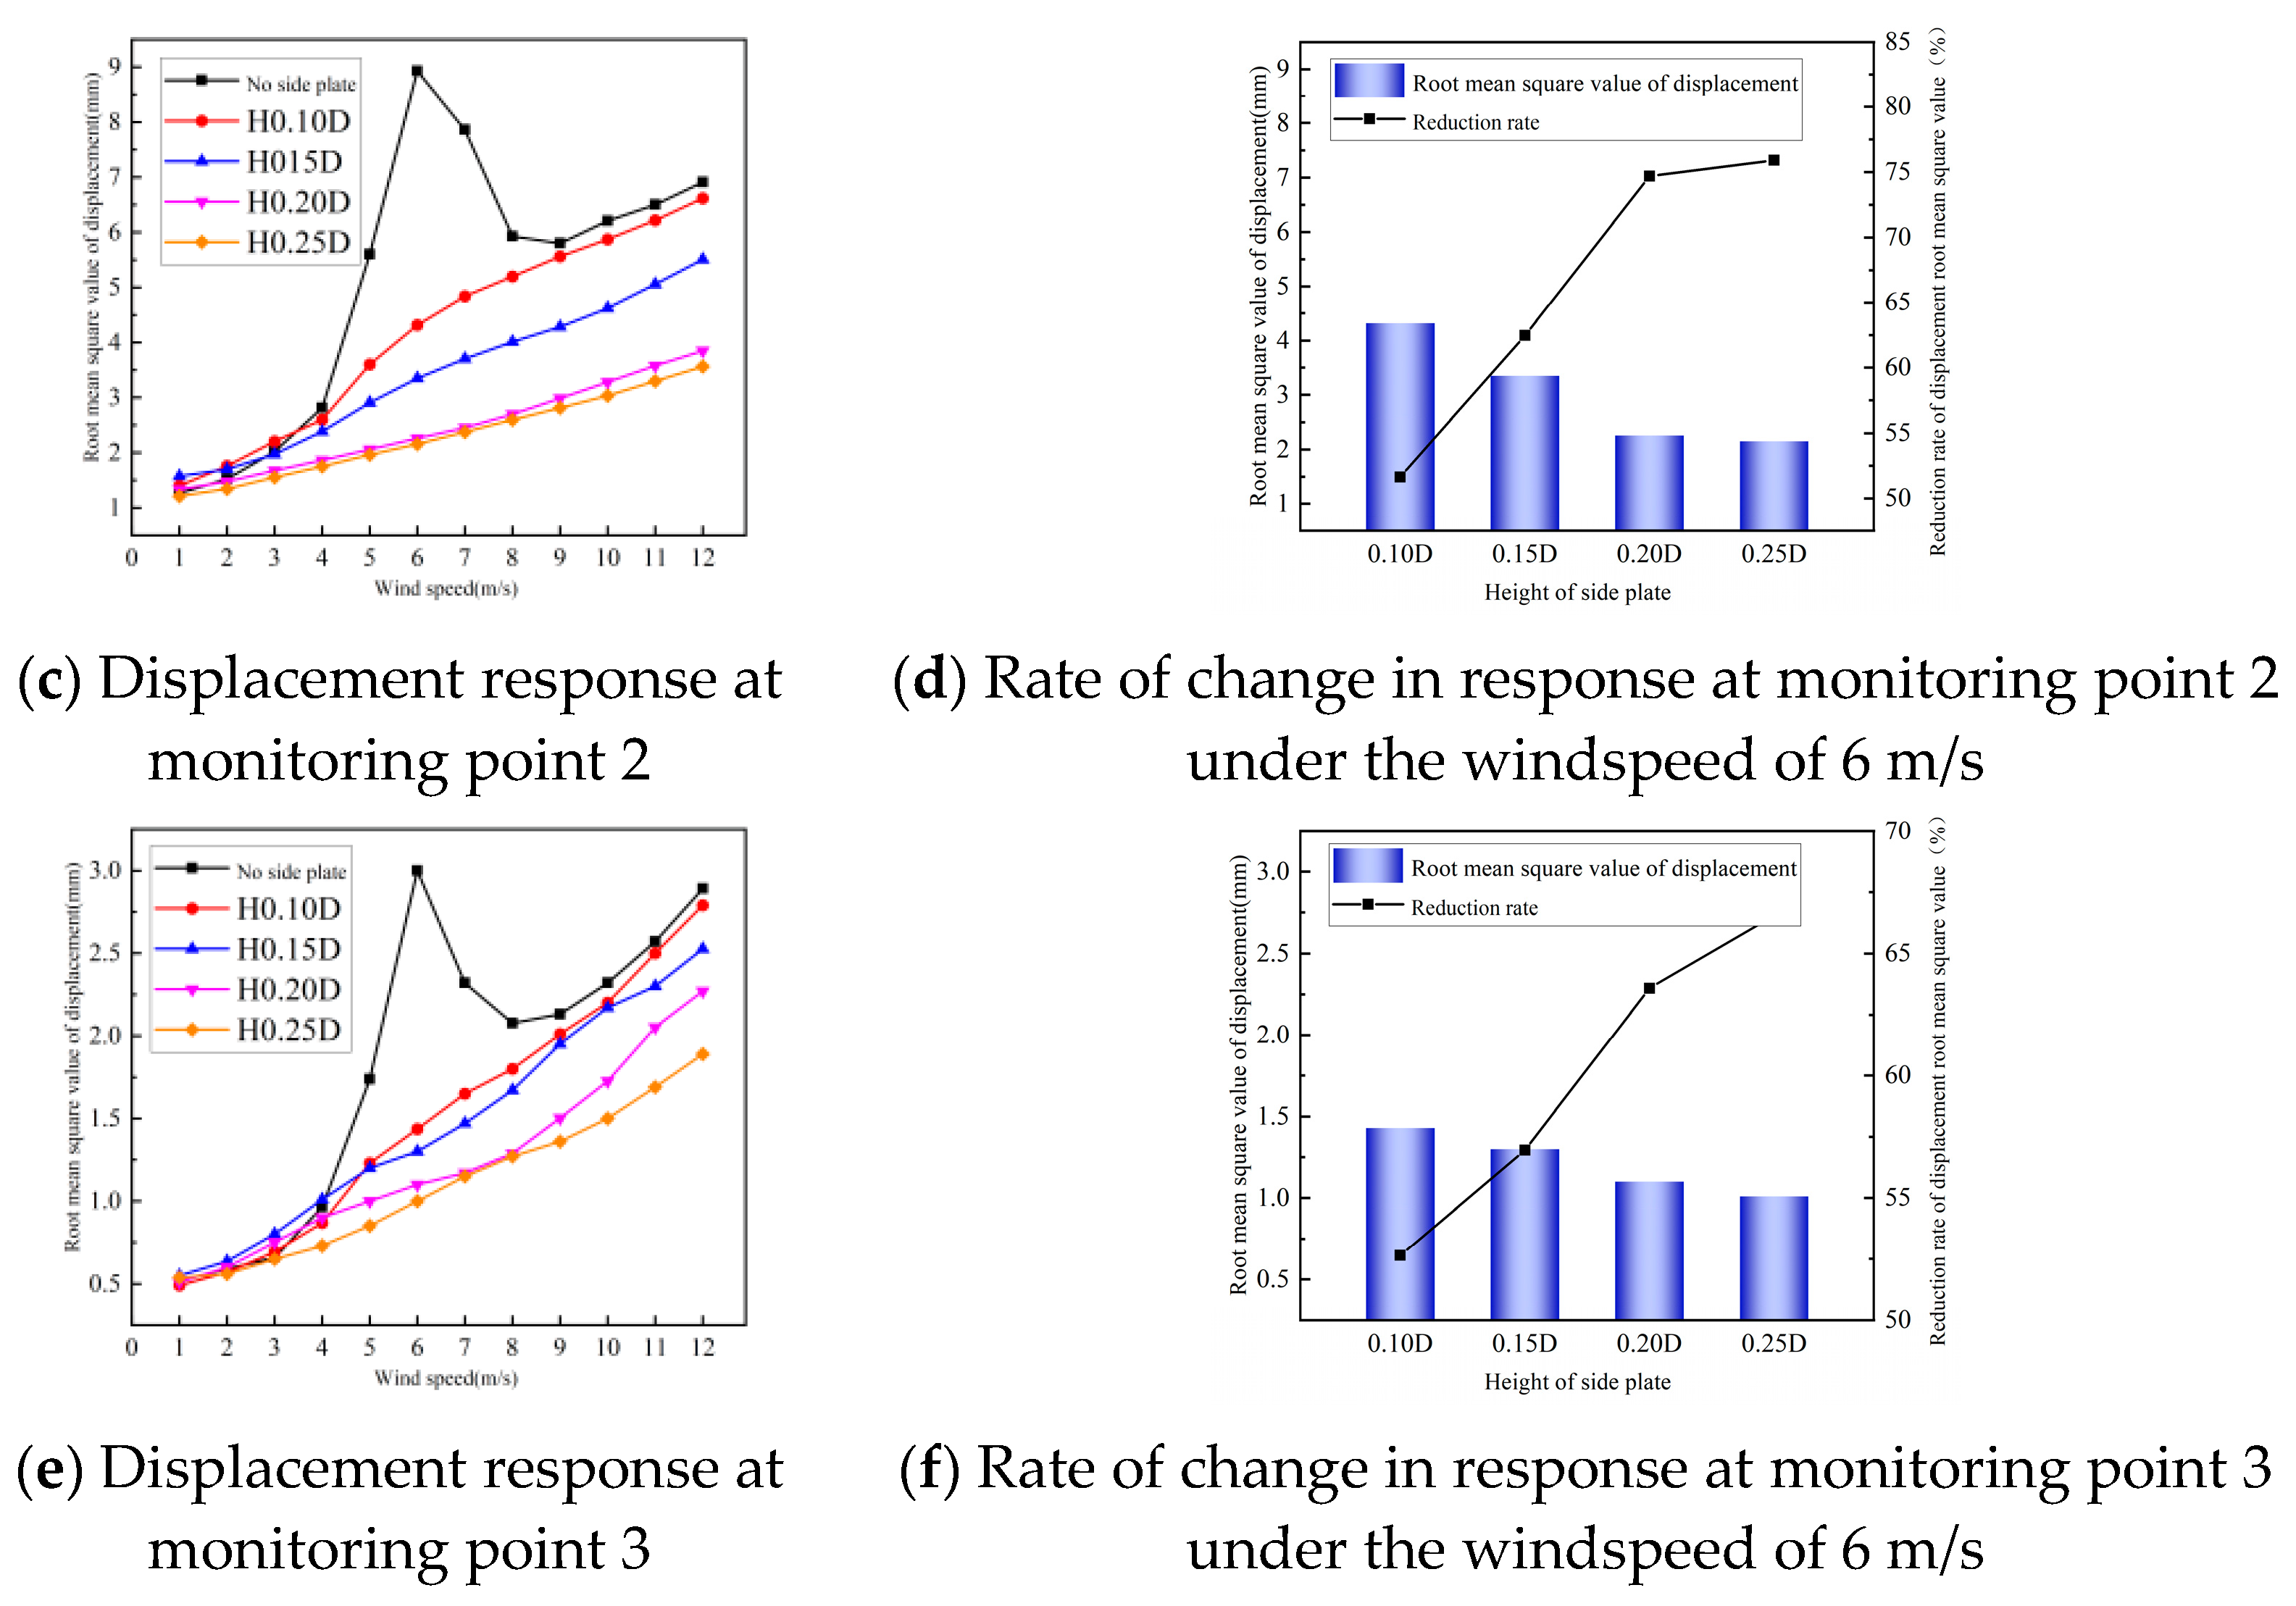
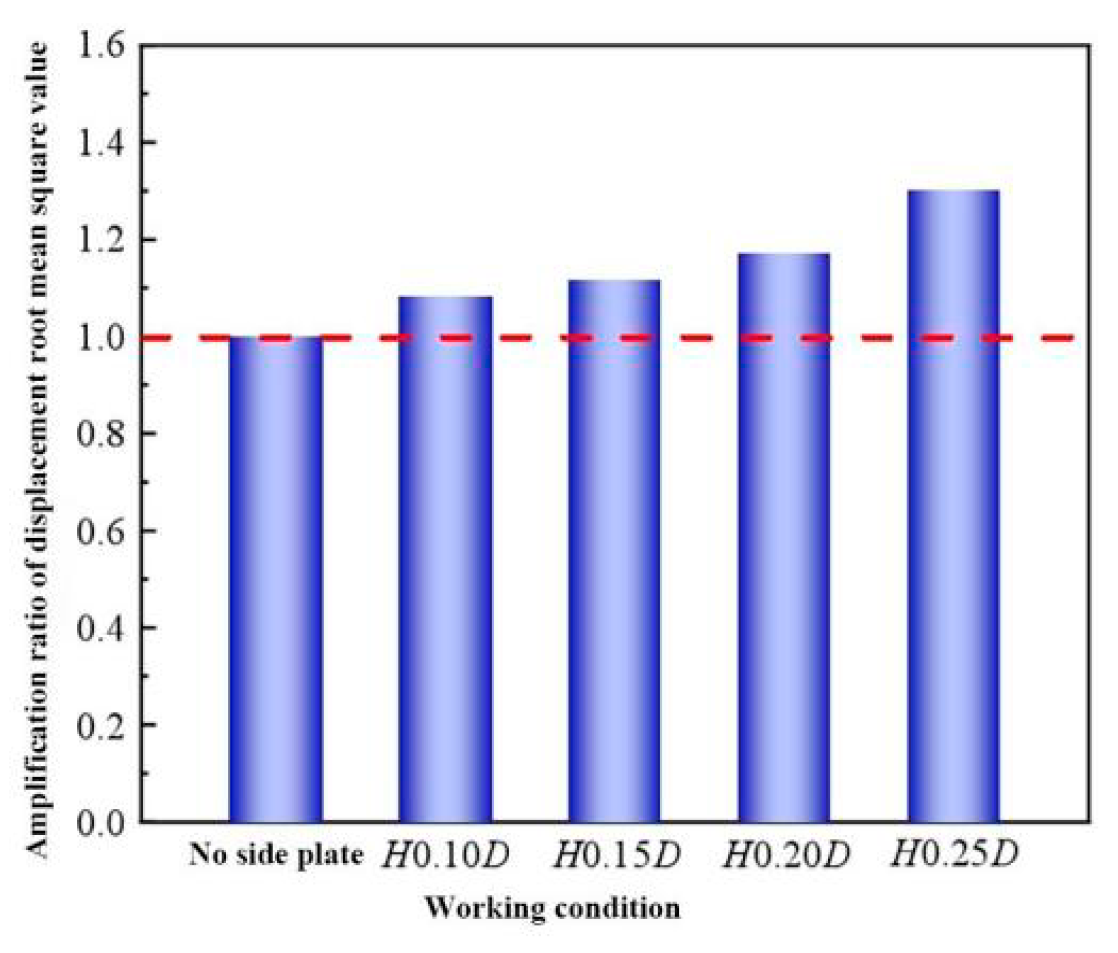
4.5.1. Along-Wind Response
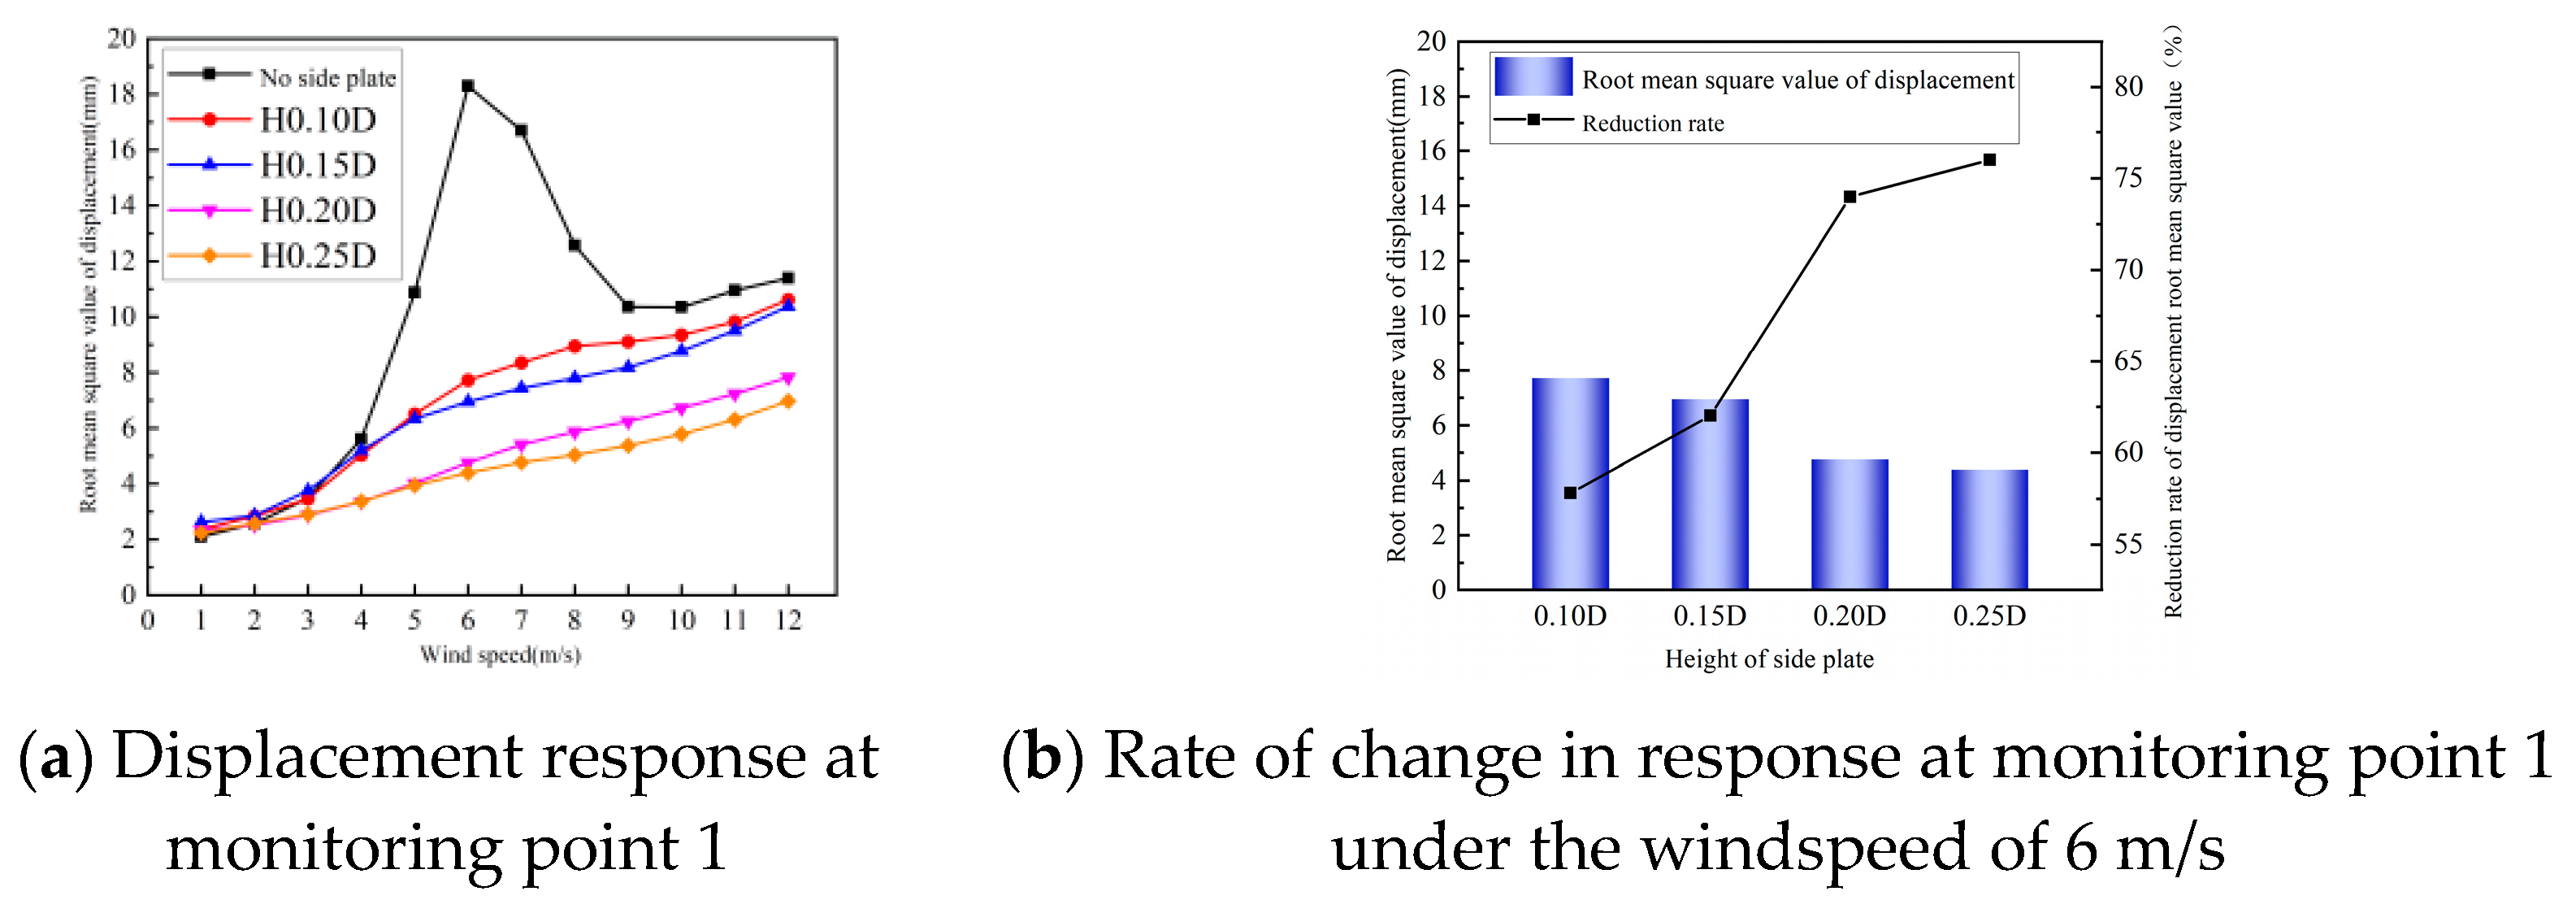
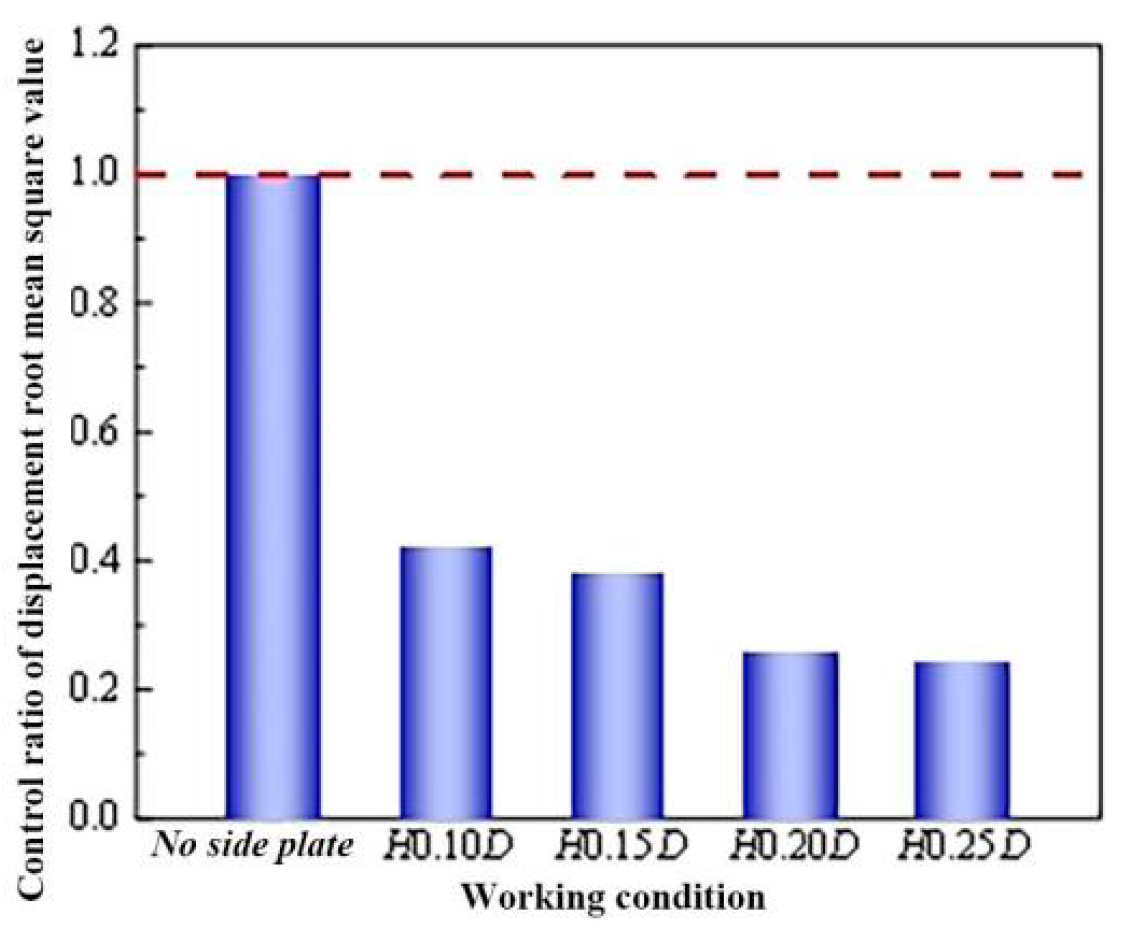
4.5.2. Crosswind Response
5. Conclusions
- For high-mast light poles without spiral helical strakes, both the along-wind and crosswind vibration responses increase gradually with increasing windspeed in a wind environment. The along-wind acceleration response of the structure is dominated by the first-order vibration mode of the structure, whereas the crosswind acceleration response is mainly contributed by its high-order vibration mode. For the high-mast light poles presented in this paper, evident vortex-induced vibrations occur in the windspeed range of 5~8 m/s, especially when the incoming windspeed is 6 m/s;
- For high-mast light poles with spiral helical strakes, as the pitch of the side plate decreases and the height of the side plate increases, the along-wind displacement response of the light pole gradually increases, whereas the crosswind displacement response greatly decreases;
- In practical engineering, when spiral helical strakes are used for the design of high-mast light poles, the recommended values of the pitch P and the height of the side plate H are P = 7.5 D and H = 0.20 D, respectively.
Author Contributions
Funding
Institutional Review Board Statement
Informed Consent Statement
Data Availability Statement
Conflicts of Interest
References
- Salahshoor, S.; Afzal, S. Subsurface technologies for hydrogen production from fossil fuel resources: A review and techno-economicanalysis. Int. J. Hydrog. Energy 2022, in press. [CrossRef]
- Ahrens, J.; Geveci, B.; Law, C. Paraview: An end-user tool for large data visualization. Vis. Handb. 2005, 717, 50038-1. [Google Scholar]
- Kasseh, Y.; Touzani, A.; El Majaty, S. What public lighting governance model should be deployed in Moroccan cities for sustainable and efficient energy management? Mater. Today Proc. 2022, 72, 3244–3252. [Google Scholar] [CrossRef]
- Chao, G. Design and Experimental Research on Electromechanical System of BAGG01 High Pole Light. Master’s Thesis, Southeast University, Nanjing, China, 2017. [Google Scholar]
- Dexter, R.J.; Ricker, M.J. NCHRP Report: Fatigue-Resistant Design of Cantilevered Signal, Sign, and Light Supports; Transportation Research Board: Washington, DC, USA; National Research Council: Washington, DC, USA, 2002. [Google Scholar]
- Sherman, R.J.; Hebdon, M.H.; Connor, R.J. Fatigue testing and retrofit details of high-mast lighting towers. Eng. J. 2016, 53, 61–72. [Google Scholar]
- Chang, B.; Phares, B.; Sarkar, P.; Wipf, T. Development of a procedure for fatigue design of slender support structures subjected to wind-induced vibration. Transp. Res. Rec. J. Transp. Res. Board 2009, 2131, 23–33. [Google Scholar] [CrossRef]
- Shen, S.; Yu, H.; Liu, J. Wind-induced vibration control of high pole lamp by rolling type modulation mass damping device. J. Guangxi Univ. 2018, 43, 1320–1328. [Google Scholar]
- Caracoglia, L.; Jones, N.P. Numerical and experimental study of vibration mitigation for highway light poles. Eng. Struct. 2007, 29, 821–831. [Google Scholar] [CrossRef]
- Bhoyar, D.C.; Vanalkar, A.V. Methodology for Design and Analysis of High Mast Solar Light Pole—A Review. Int. J. Sci. Res. Dev. 2015, 27–29. [Google Scholar]
- Zhuge, H.; Li, D. Study on the measurement of wind-induced vibration of 30 m high pole lamp. Eng. Mech. 1998, 15, 109–117. [Google Scholar]
- Taplin, G.; Sanders, G.; Maklary, Z. Fatigue Failures of Light Poles. In Proceedings of the Austroads 6th Bridge Conference: Bridging the Gap, Perth, Australia, 12–15 September 2006. [Google Scholar]
- Goode, J.S.; van de Lindt, J.W. Development of a semiprescriptive selection procedure for reliability-based fatigue design of high-mast lighting structural supports. J. Perform. Constr. Facil. 2007, 21, 193–206. [Google Scholar] [CrossRef]
- Chien, C.W.; Jang, J.J. Case study of wind-resistant design and analysis of high mast structures based on different wind codes. J. Mar. Sci. Technol. 2008, 16, 6. [Google Scholar] [CrossRef]
- Chang, B. Aerodynamic Parameters on a Multisided Cylinder for Fatigue Design. In Wind Tunnels and Experimental Fluid Dynamics Research; IntechOpen: Rijeka, Croatia, 2011. [Google Scholar]
- Dawood, M.; Goyal, R.; Dhonde, H. Fatigue Life Assessment of Cracked High-Mast Illumination Poles. J. Perform. Constr. Facil. 2014, 28, 311–320. [Google Scholar] [CrossRef]
- Peng, H.; Guo, J.; Chen, Z. Operation reliability analysis of high pole lamp under extreme weather conditions. Sci. Technol. Econ. Guide 2016, 1, 109–111. [Google Scholar]
- Azzam, D.M. Fatigue Behavior of Highway Welded Aluminum Light Pole Support Structures. Ph.D. Thesis, University of Akron, Akron, OH, USA, 2006. [Google Scholar]
- Sherman, R.J.; Connor, R.J. Development of a fatigue design load for high-mast lighting towers. J. Struct. Eng. 2018, 145, 04018228.1–04018228.8. [Google Scholar] [CrossRef]
- Zhou, X.; Han, Y.; Yan, H. Research on vortex induced vibration and influencing factors of variable cross-section round lamp post based on wind tunnel test. J. China Highw. Eng. 2021, 34, 48–56. [Google Scholar]
- Connor, R.J. Fatigue Loading and Design Methodology for High-Mast Lighting Towers; Transportation Research Board: Washington, DC, USA, 2012. [Google Scholar]
- Thompson, R.W. Evaluation of High-Level Lighting Poles Subjected to Fatigue Loading. Master’s Thesis, Lehigh University, Bethlehem, PA, USA, 2012. [Google Scholar]
- Counsell, S.; Taplin, G.; Thomas, M. Fatigue Analysis and Repair of a High Mast Light Pole. In Proceedings of the Austroads 7th Bridge Conference, Auckland, New Zealand, 26–29 May 2009. [Google Scholar]
- Zhou, G.; Ye, Z.; Li, C.; Yang, J.; Wang, D. Research on dynamic characteristics of floating wind turbines with spiral side plates. J. Sol. Energy 2017, 38, 2565–2573. [Google Scholar]
- Zhang, N. Numerical study on forced oscillation of helical side plates with different cross section shapes. Therm. Power Eng. 2018, 33, 67–74. [Google Scholar]
- Zhou, T.; Razali, S.; Hao, Z.; Cheng, L. On the study of vortex-induced vibration of a cylinder with helical strakes. J. Fluids Struct. 2011, 27, 903–917. [Google Scholar] [CrossRef]
- Zhou, Y. Experimental study on two-way vortex-induced vibration of riser with spiral side plates. Vib. Shock. 2018, 37, 249–255. [Google Scholar]
- Ranjith, E.R.; Sunil, A.S.; Pauly, L. Analysis of flow over a circular cylinder fitted with helical strakes. Procedia Technol. 2016, 24, 452–460. [Google Scholar] [CrossRef] [Green Version]
- Quen, L.K.; Abu, A.; Kato, N.; Muhamad, P.; Abdullah, H. Investigation on the effectiveness of helical strakes in suppressing VIV of flexible riser. Appl. Ocean. Res. 2014, 44, 82–91. [Google Scholar] [CrossRef]
- Chen, D.; Abbas, L.K.; Wang, G.P.; Rui, X.T.; Lu, W.J. Suppression of vortex-induced vibrations of a flexible riser by adding helical strakes. J. Hydrodyn. 2019, 31, 622–631. [Google Scholar] [CrossRef]
- Aheran, E.B.; Puckett, J. Reduction of Wind-Induced Vibrations in High-Mast Light Poles; University of Wyoming: Laramie, WY, USA, 2010. [Google Scholar]
- American Association of State Highway and Transportation Officials. AASHTO Guide for Design of Pavement Structures; The Association: Washington, DC, USA, 1993. [Google Scholar]
- Braza, M.; Chassaing, P.; Minh, H.H. Numerical study and physical analysis of the pressure and velocity fields in the near wake of a circular cylinder. J. Fluid Mech. 1986, 165, 79–130. [Google Scholar] [CrossRef]
- Kumar, R.A.; Sohn, C.H.; Gowda, B.H.L. Passive control of vortex-induced vibrations: An overview. Recent Pat. Mech. Eng. 2008, 1, 1–11. [Google Scholar] [CrossRef]


| Mode Order | Simulated Frequency in the Present Study (Hz) f0 | Frequency Results Given by Reference (Aheran et al.) (Hz) f | Relative Deviation (%) |(f0 − f)/f0| |
|---|---|---|---|
| 1 | 0.36 | 0.35 | 2.86 |
| 2 | 1.59 | 1.50 | 6.00 |
| 3 | 4.03 | 3.80 | 6.05 |
| 4 | 7.80 | 7.50 | 4.00 |
| Position | Height (m) | Critical Diameter (m) | Critical Windspeed (m/s) | |||
|---|---|---|---|---|---|---|
| Mode 1 | Mode 2 | Mode 3 | Mode 4 | |||
| 4-1 | 9.75 | 0.48 | 20.80 | |||
| 3-1 | 14.00 | 0.43 | 9.63 | |||
| 4-2 | 22.00 | 0.34 | 14.73 | |||
| 2-1 | 23.00 | 0.33 | 2.92 | |||
| 3-2 | 30.00 | 0.26 | 5.82 | |||
| 4-3 | 31.70 | 0.23 | 9.97 | |||
| 1-1 | 36.60 | 0.18 | 0.36 | |||
| Grid Scheme | Boundary Layer Grid Thickness (mm) | Global Grid Size (mm) | Light Pole Surface Grid Size (mm) | Encrypted Area Grid Size (mm) | Maximum Displacement at Monitoring Point 1 (mm) | Relatively Dense Grid Deviation (%) |
|---|---|---|---|---|---|---|
| Coarse grid | 8 | 40 | 8 | 8 | 44.27 | 5.33 |
| Medium grid | 4 | 25 | 5 | 5 | 46.63 | 1.37 |
| Dense grid | 2 | 10 | 2 | 2 | 46.99 | / |
| Mode Order | Frequency of Light Pole without Spiral Helical Strakes (Hz) f0 | Frequency of Light Pole with Spiral Helical Strakes (Hz) f | Maximum Relative Deviation (%) |(f − f0)/f0| | ||||
|---|---|---|---|---|---|---|---|
| H0.10D_P7.5D | H0.10D_P10D | H0.10D_P12.5 | H0.10D_P15D | H0.10D_P17.5D | |||
| 1 | 0.36 | 0.32 | 0.36 | 0.35 | 0.35 | 0.35 | 8.33 |
| 2 | 1.59 | 1.49 | 1.56 | 1.57 | 1.49 | 1.53 | 6.29 |
| 3 | 4.03 | 3.79 | 3.98 | 3.93 | 3.97 | 3.99 | 5.96 |
| 4 | 7.80 | 6.89 | 7.44 | 7.46 | 7.26 | 7.42 | 11.66 |
| Mode Order | Frequency of Light Pole without Spiral Helical Strakes (Hz) f0 | Frequency of Light Pole with Spiral Helical Strakes (Hz) f | Maximum Relative Deviation (%) |(f0 − f)/f0| | |||
|---|---|---|---|---|---|---|
| P15D_H0.10D | P15D_H0.15D | P15D_H0.20D | P15D_H0.25D | |||
| 1 | 0.36 | 0.35 | 0.34 | 0.35 | 0.35 | 5.56 |
| 2 | 1.59 | 1.49 | 1.44 | 1.57 | 1.57 | 9.43 |
| 3 | 4.03 | 3.97 | 3.97 | 3.90 | 3.92 | 3.23 |
| 4 | 7.80 | 7.26 | 7.07 | 7.08 | 7.37 | 9.36 |
Disclaimer/Publisher’s Note: The statements, opinions and data contained in all publications are solely those of the individual author(s) and contributor(s) and not of MDPI and/or the editor(s). MDPI and/or the editor(s) disclaim responsibility for any injury to people or property resulting from any ideas, methods, instructions or products referred to in the content. |
© 2023 by the authors. Licensee MDPI, Basel, Switzerland. This article is an open access article distributed under the terms and conditions of the Creative Commons Attribution (CC BY) license (https://creativecommons.org/licenses/by/4.0/).
Share and Cite
Zhang, M.; Li, T.; Wang, Y.; Chen, Y.; Zhao, G. Wind-Induced Vibration and Vibration Suppression of High-Mast Light Poles with Spiral Helical Strakes. Buildings 2023, 13, 907. https://doi.org/10.3390/buildings13040907
Zhang M, Li T, Wang Y, Chen Y, Zhao G. Wind-Induced Vibration and Vibration Suppression of High-Mast Light Poles with Spiral Helical Strakes. Buildings. 2023; 13(4):907. https://doi.org/10.3390/buildings13040907
Chicago/Turabian StyleZhang, Meng, Tianxiang Li, Yang Wang, Yizhuo Chen, and Guifeng Zhao. 2023. "Wind-Induced Vibration and Vibration Suppression of High-Mast Light Poles with Spiral Helical Strakes" Buildings 13, no. 4: 907. https://doi.org/10.3390/buildings13040907