
Electric Vehicle Charging Facility Configuration Method for Office Buildings

Abstract
:1. Introduction
- The determination of the number of EV charging piles in office building parking lots is generally based on an area-based empirical estimation method. However, this design approach fails to satisfy the rapidly increasing demand for charging facilities that has arisen due to the significant growth in the number of EVs;
- Prior studies have extensively examined the location and capacity of charging stations at the macro level of the entire city or urban area and the distribution network system; a systematic investigation of the configuration of charging facilities from the micro perspective of individual buildings is currently lacking in the literature;
- Based on the optimal configuration of EV charging facilities, EV charging scheduling under the building demand response process is rarely further analyzed.
- An optimal configuration method for charging piles from the micro perspective of individual buildings is proposed to meet the rapidly growing charging demand in office building parking lots;
- The evaluation indicators of the utilization rate of charging facilities and the satisfaction rate of charging demand are established simultaneously;
- This approach takes into account both the investment cost and the long-term charging demand of EVs to maximize the overall benefits of the system;
- The proposed approach manages the integration of EVs in the building energy system, with the potential to improve the overall energy efficiency of the building.
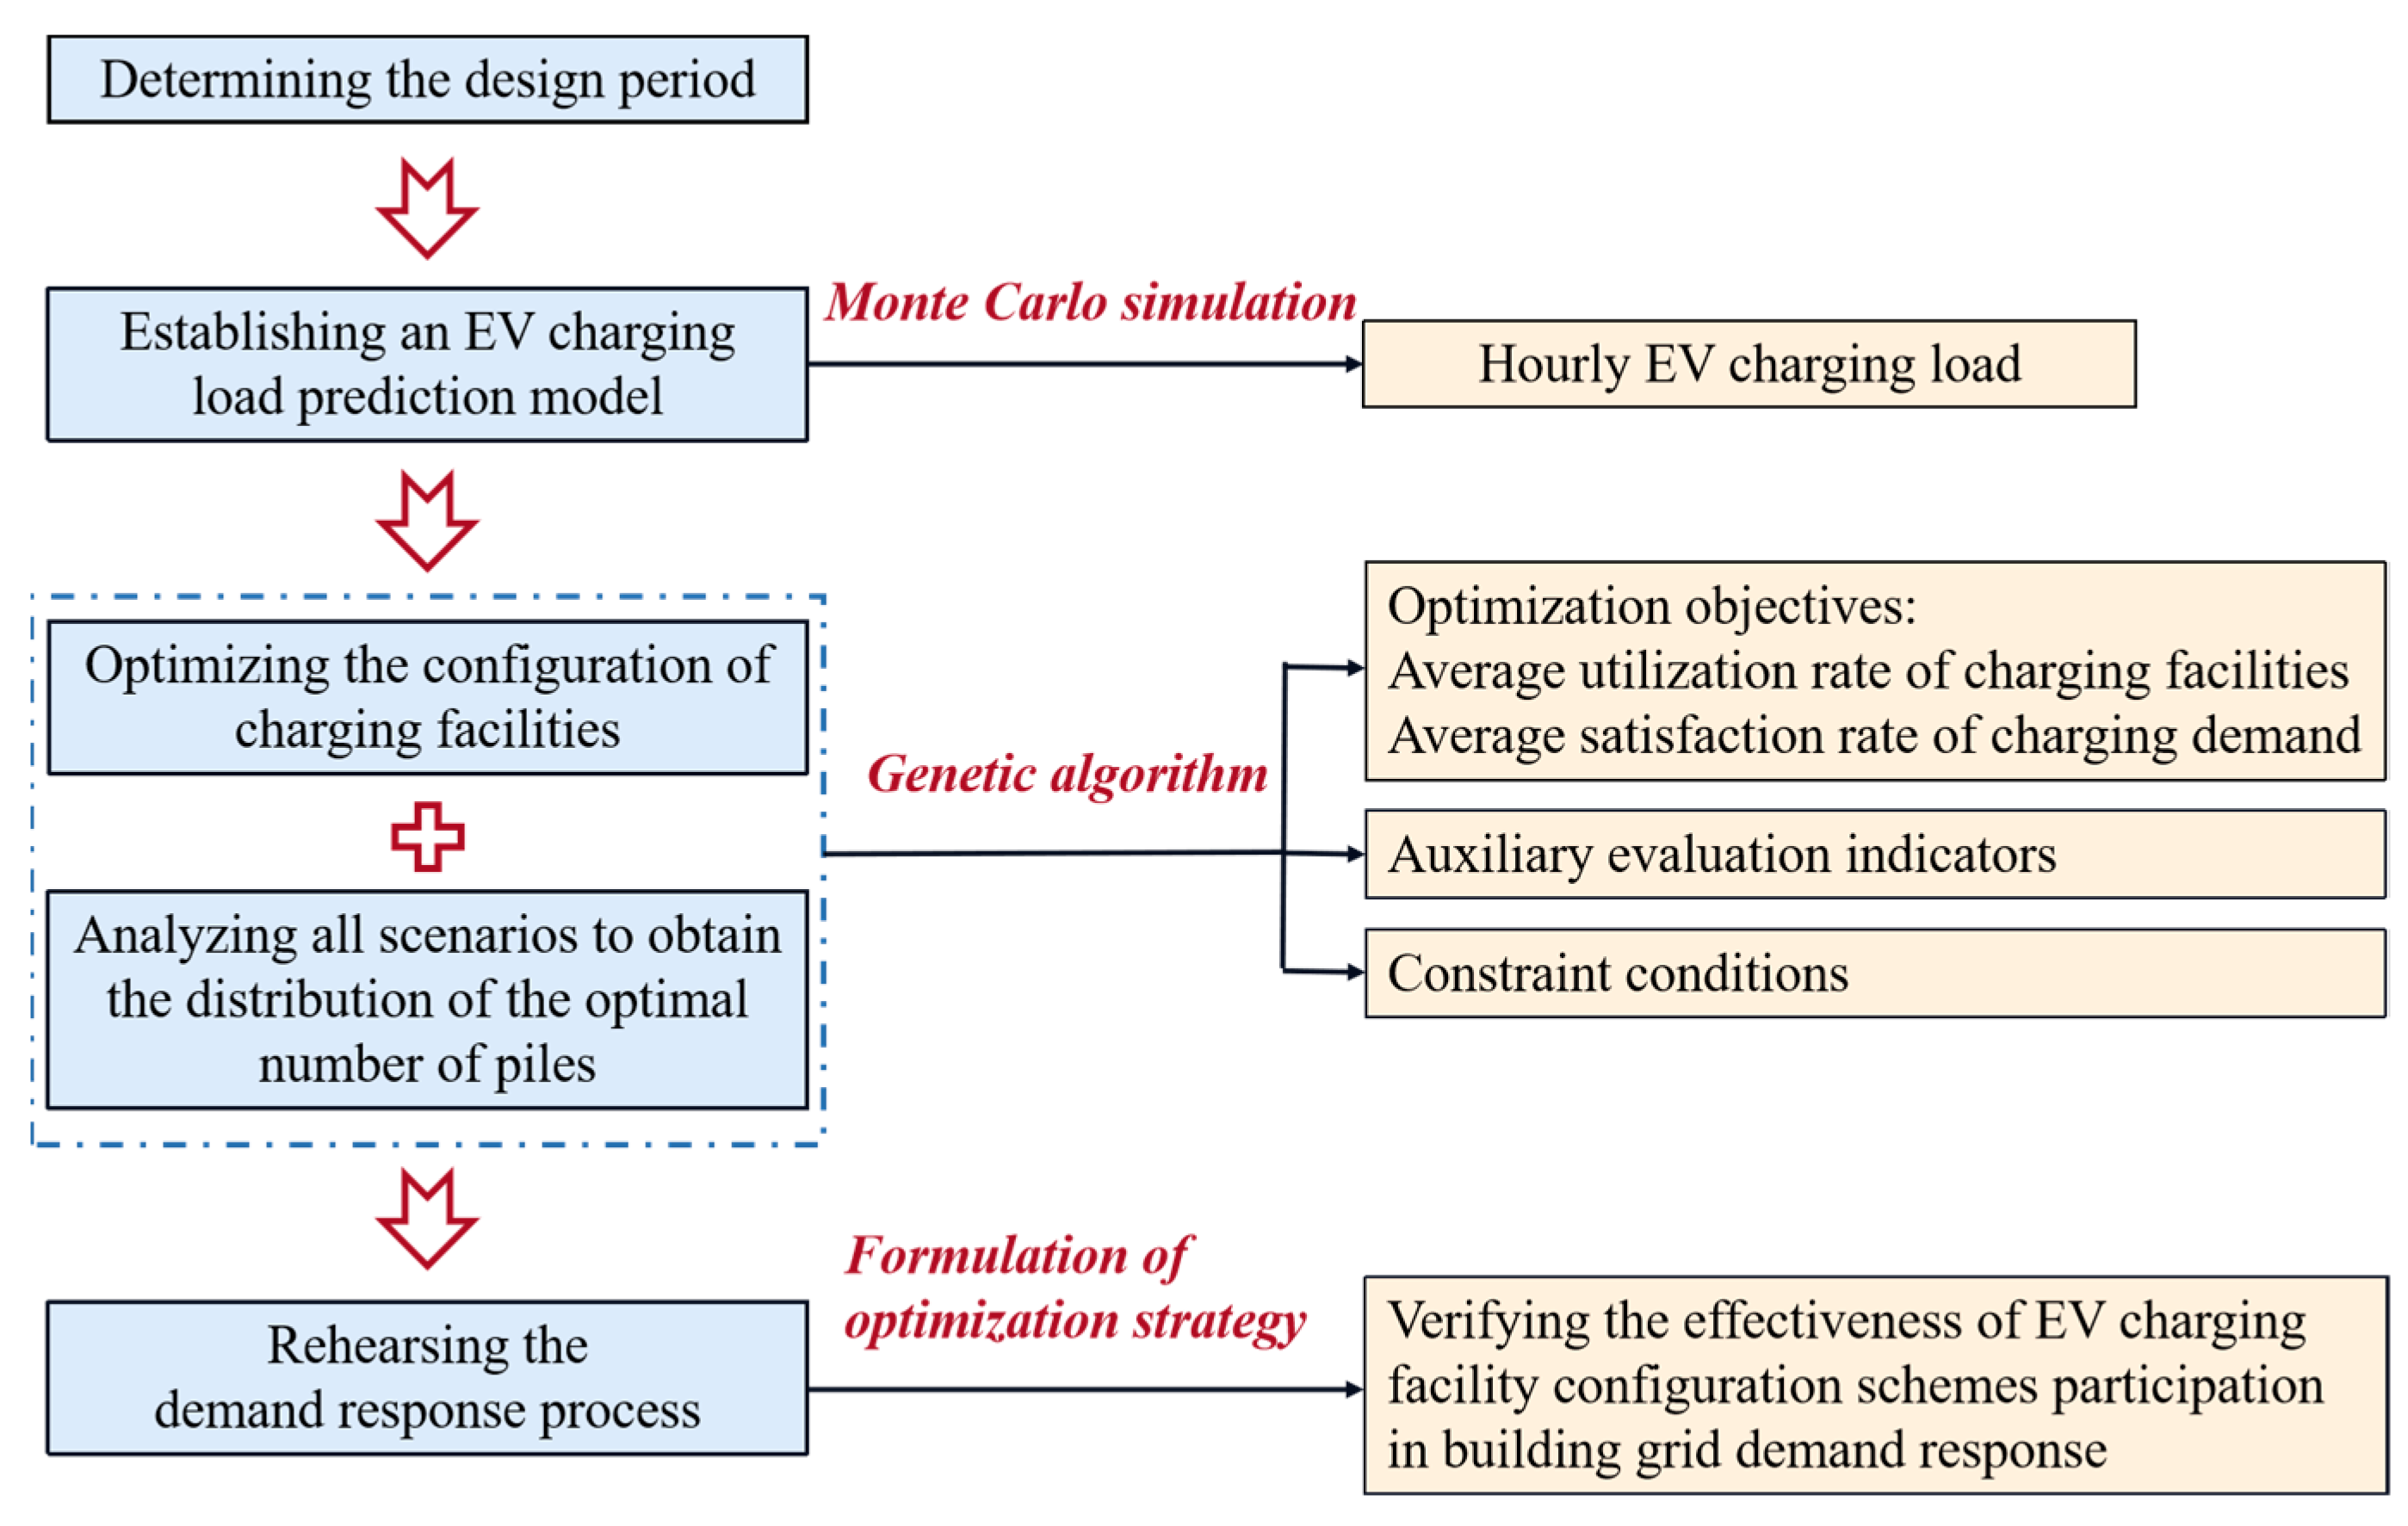
2. Methodology
2.1. EV Charging Load Modeling Based on Monte Carlo Simulation
2.2. Optimal Configuration Method of Charging Piles in Parking Lots
2.2.1. Optimization Objectives
- Indicator 2: Average satisfaction rate of charging demand.
2.2.2. Auxiliary Evaluation Indicators
2.2.3. Constraint Conditions
2.3. Demand Response Rehearsal
3. Discussion
3.1. Building Description
3.2. Optimal Configuration
3.3. Indicator Comparison
3.4. Demand Response Rehearsal
4. Conclusions
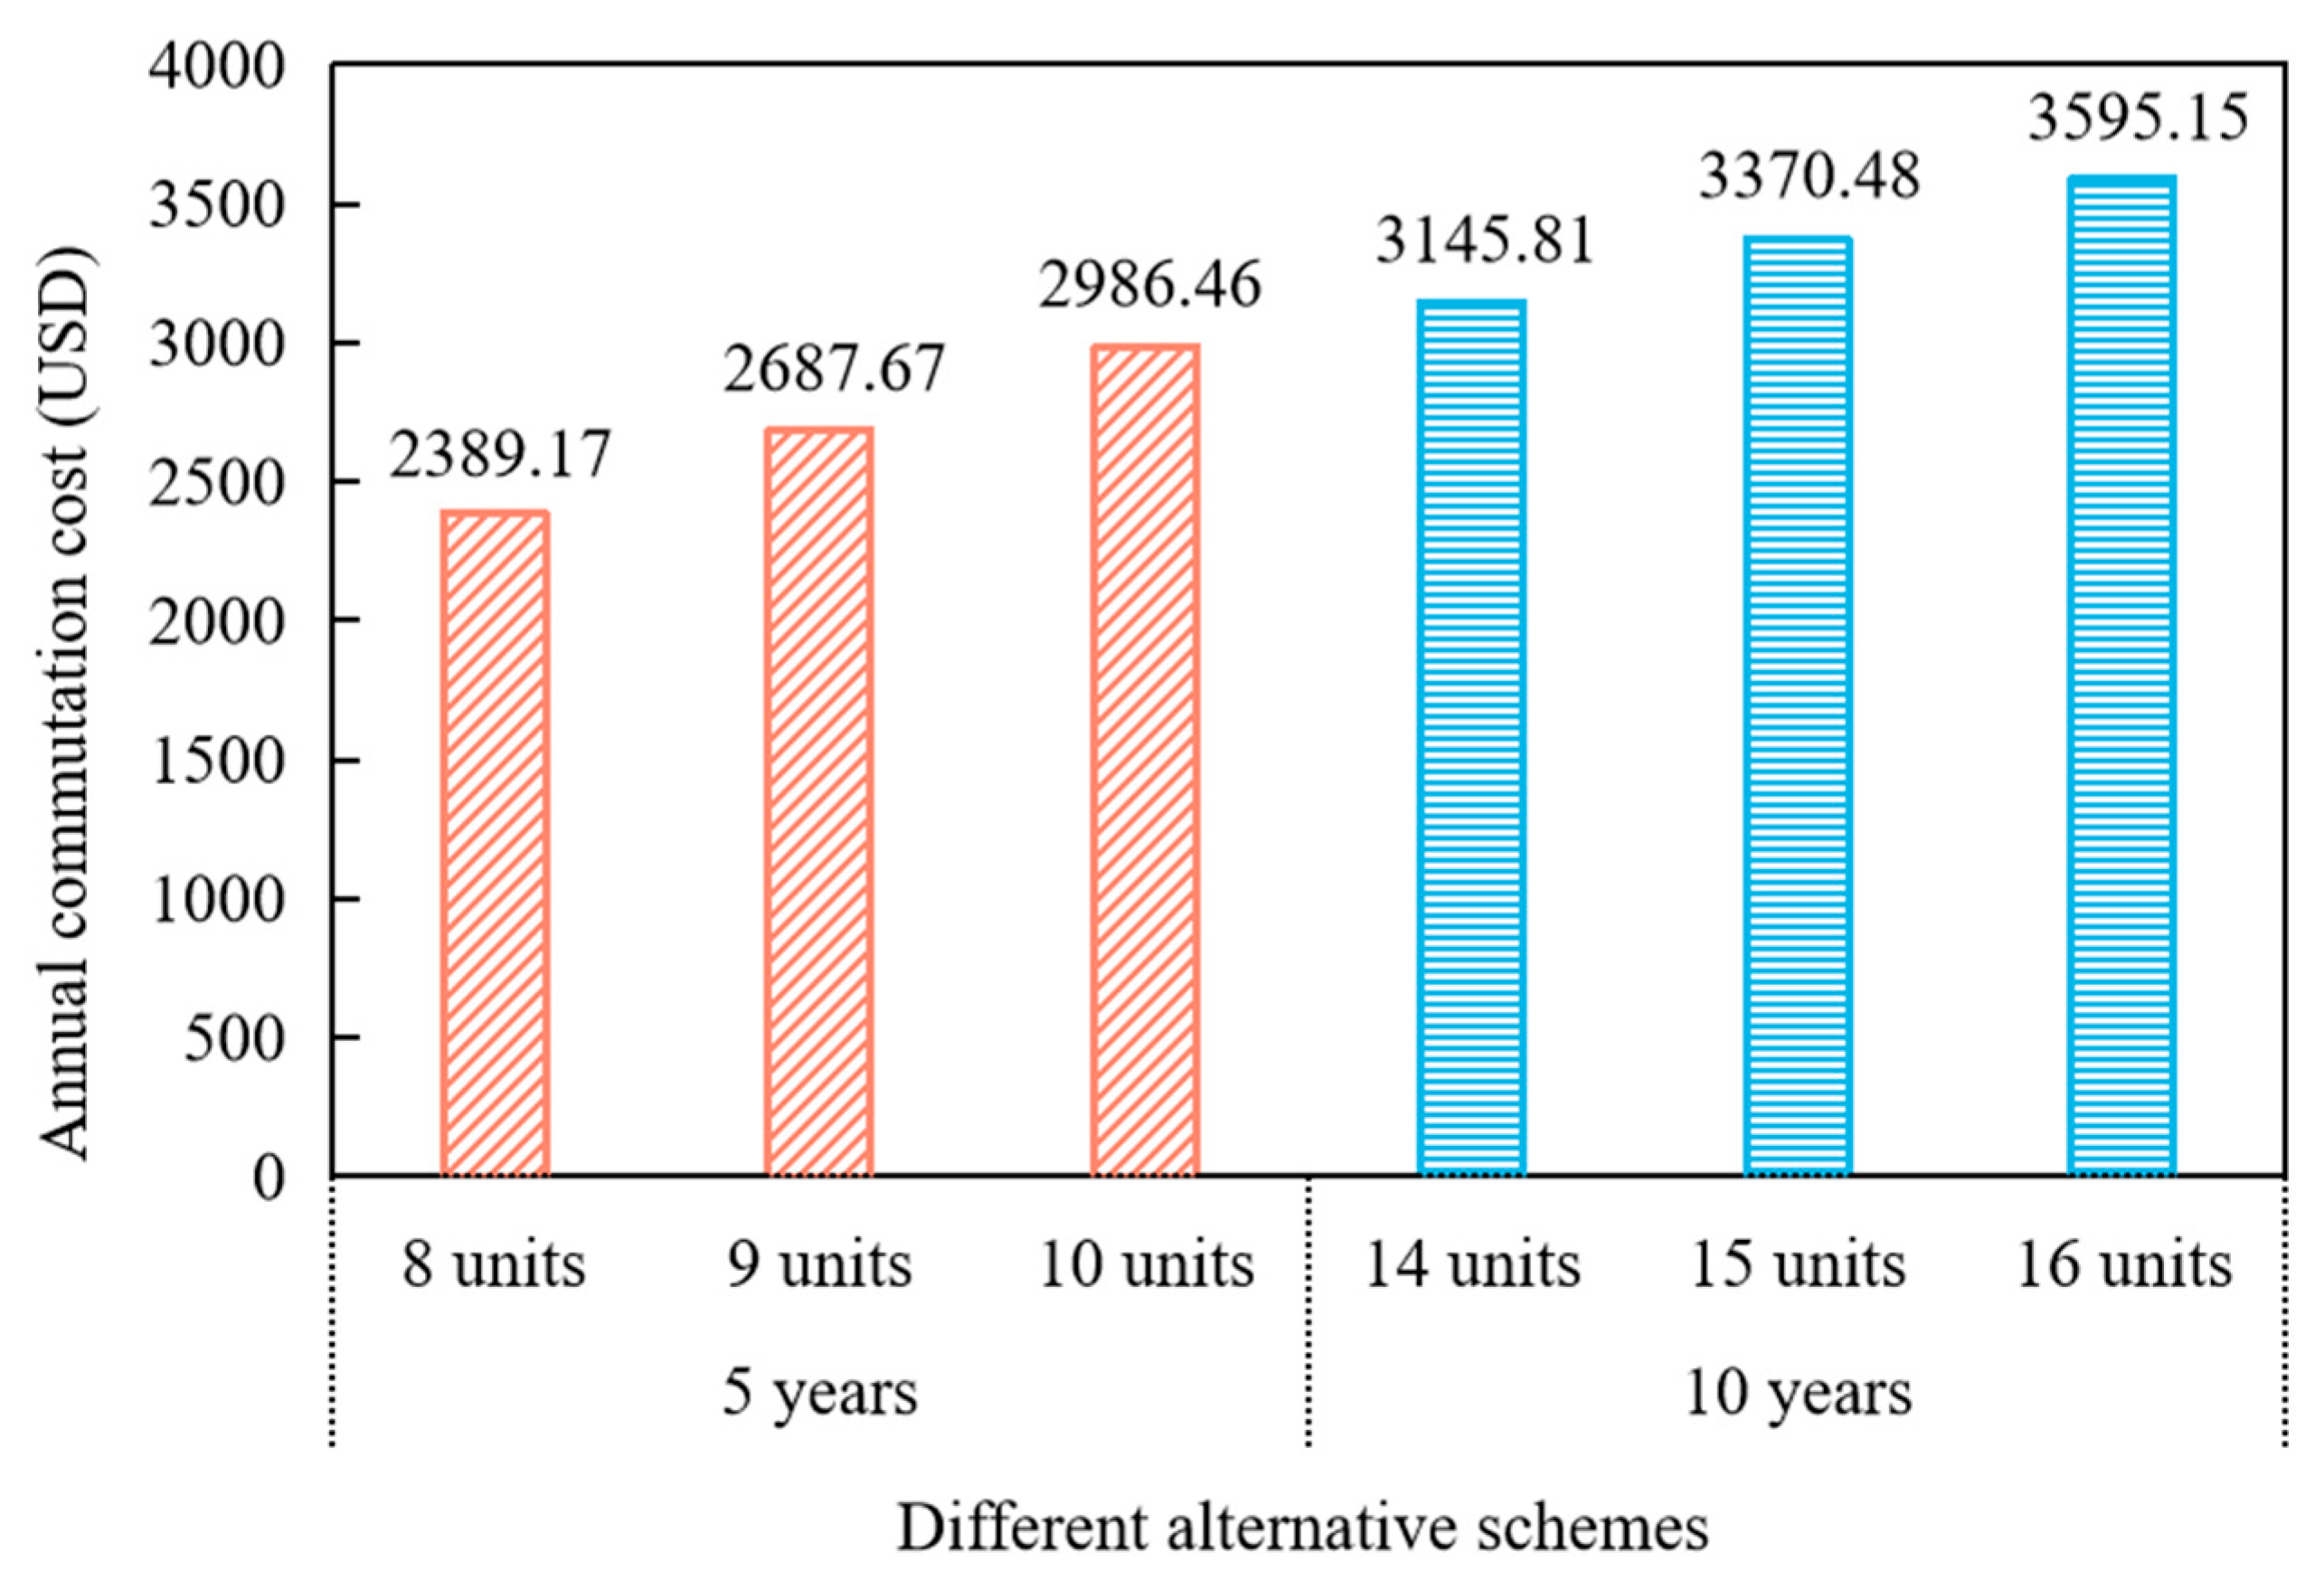
- (1)
- From the building cases with different volumes, the optimal number of piles is 2 times the minimum number of piles under the empirical estimation method when the design period is 5 years, while the optimal number of piles is about 3 times the minimum number of piles under the empirical estimation method when the design period is 10 years. According to the comparison results, designers can make a preliminary estimation of the charging facility configuration scheme for the office building parking lots based on the design period;
- (2)
- Compared with the number of piles recommended in the design standards, the optimal configuration method proposed in this study can significantly improve the average utilization rate of charging facilities and the average satisfaction rate of charging demand. The longer the design period is, the more benefits the optimal configuration scheme will bring. Taking the scientific research office building as an example, when the design period is 5 years and 10 years, the comprehensive effect of the above two indicators can be increased by 8.18% and 17.45%, respectively;
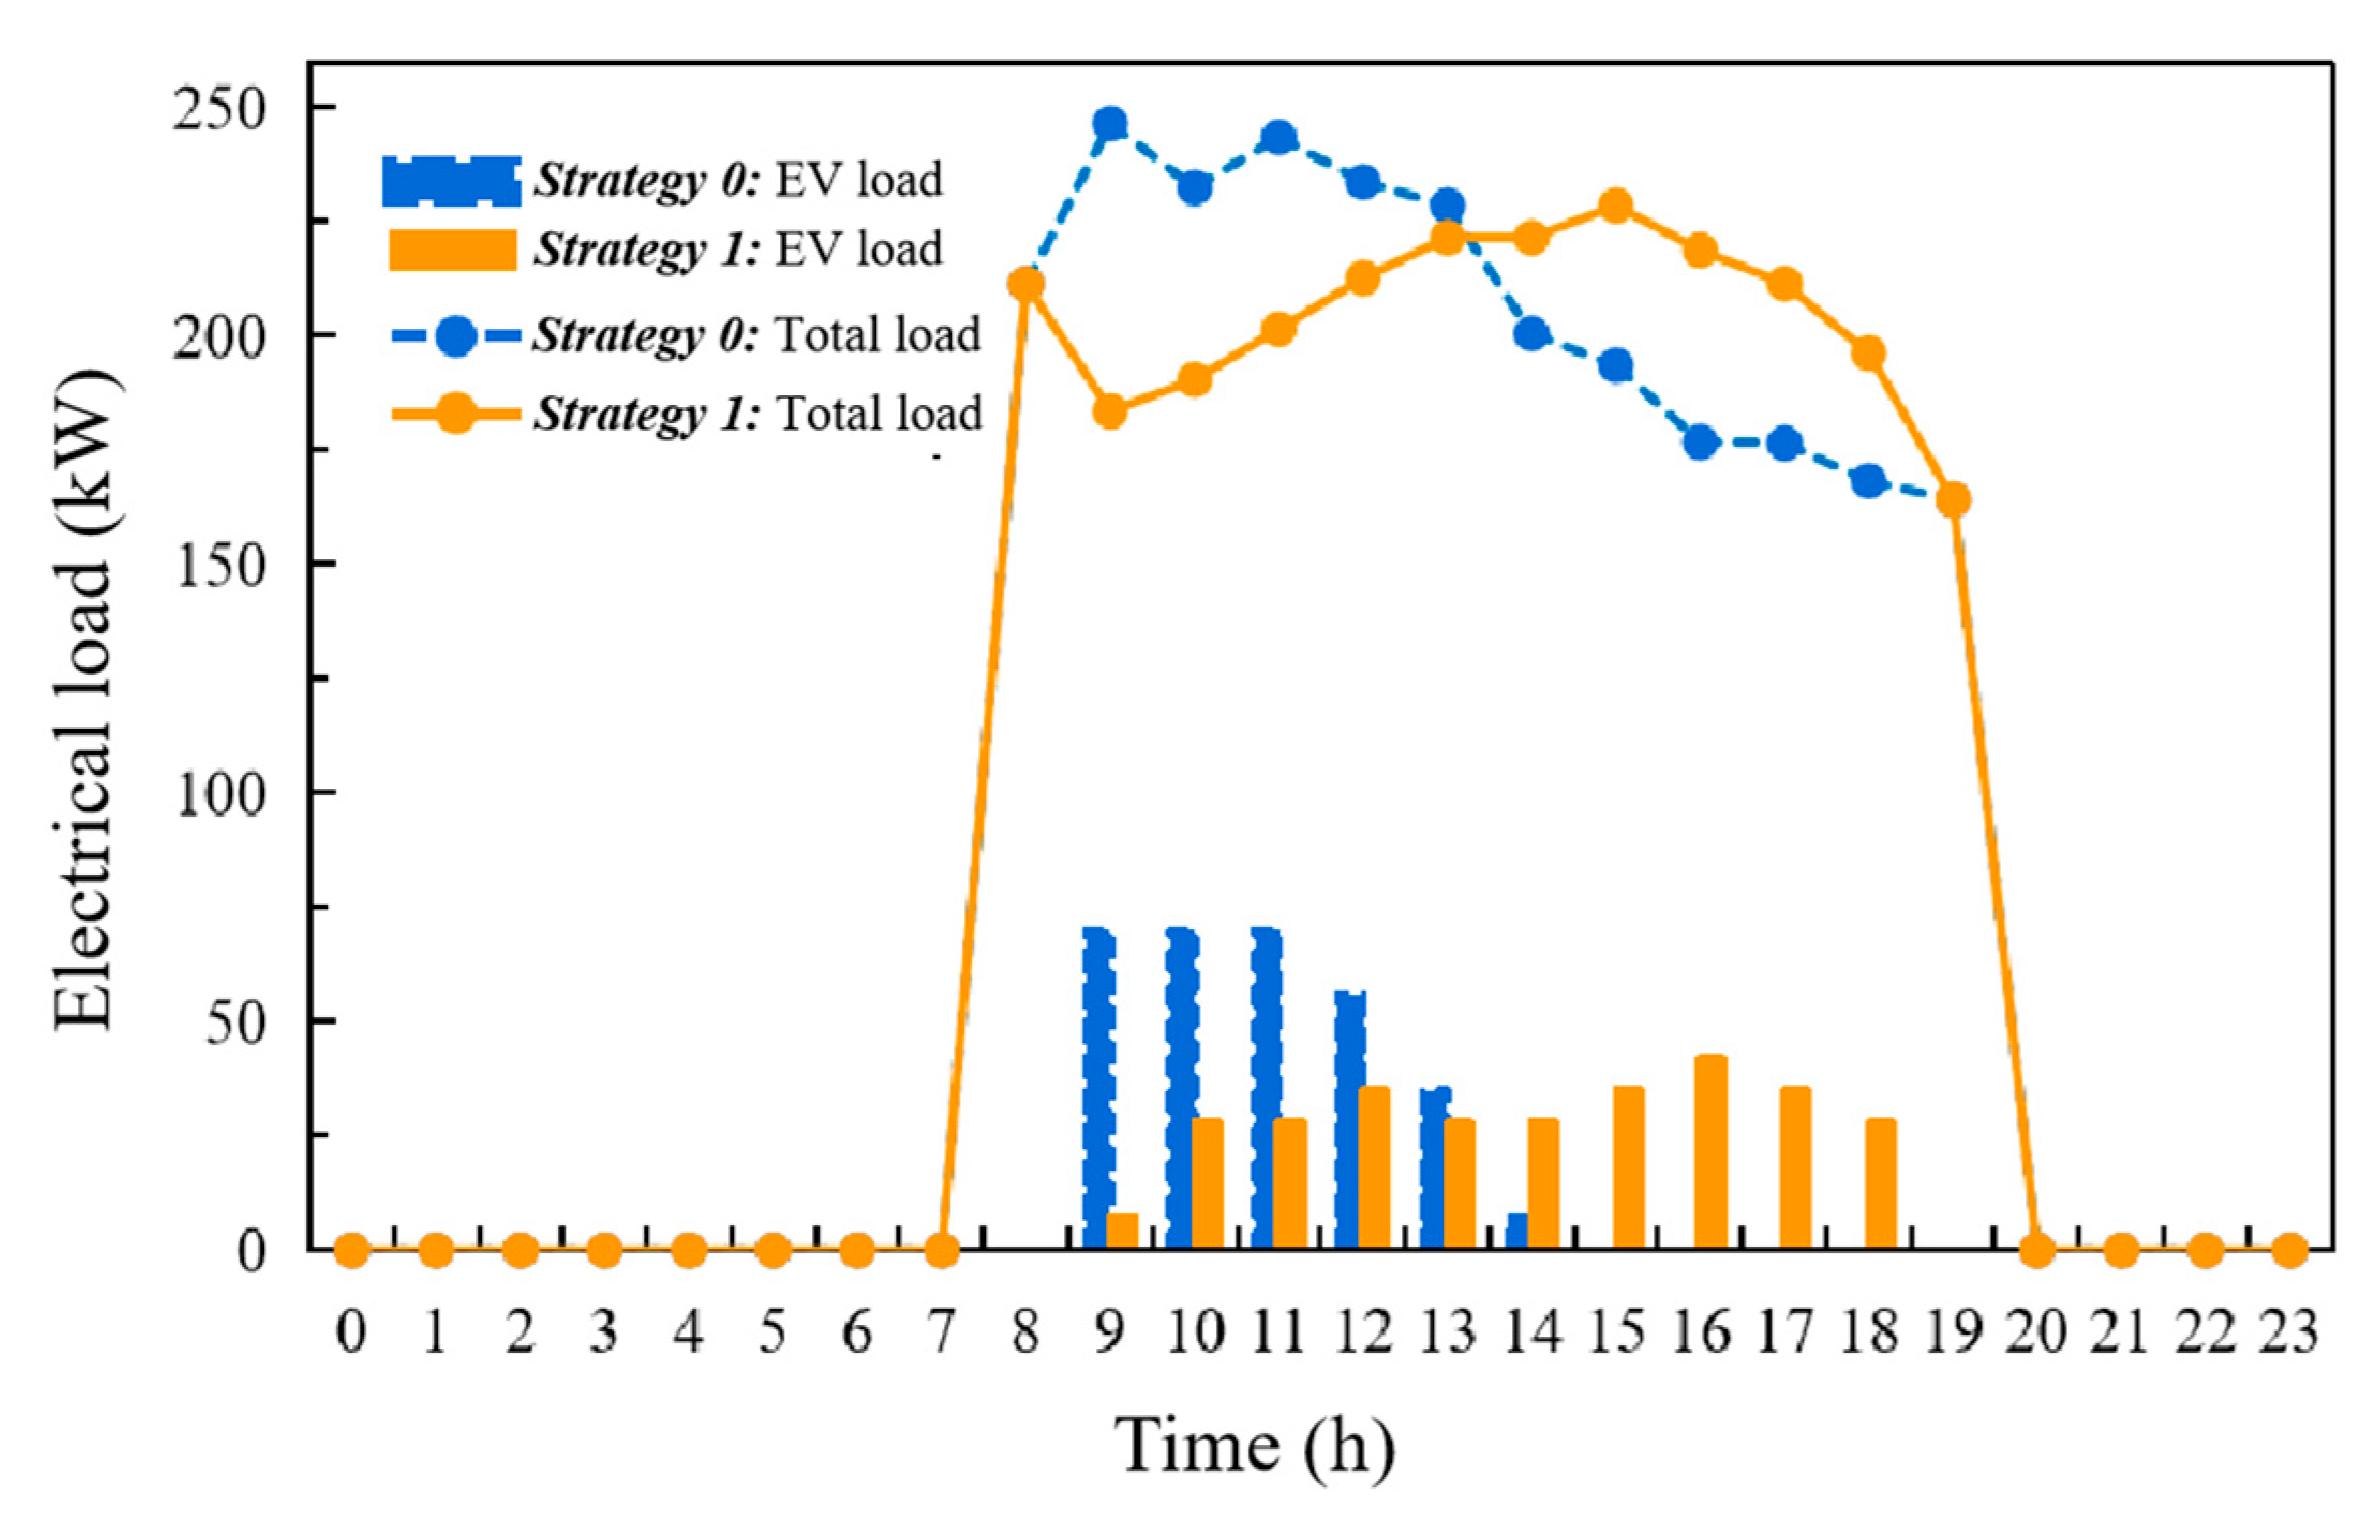
- (3)
- Making reasonable arrangements for the charging scheduling of EVs with the building energy system will help restrain the fluctuation of the power grid through demand response, reduce the peak load with a maximum load transfer rate of 25.55%, and ensure the stability of the building power grid operation.
Author Contributions
Funding
Conflicts of Interest
References
- Xu, S. The paradox of the energy revolution in China: A socio-technical transition perspective. Renew. Sust. Energ. Rev. 2021, 137, 110469. [Google Scholar] [CrossRef]
- Guo, X.; Sun, Y.; Ren, D. Life cycle carbon emission and cost-effectiveness analysis of electric vehicles in China. Energy Sustain Dev. 2023, 72, 1–10. [Google Scholar] [CrossRef]
- Nazari-Heris, M.; Loni, A.; Asadi, S.; Mohammadi-ivatloo, B. Toward social equity access and mobile charging stations for electric vehicles: A case study in Los Angeles. Appl. Energy 2022, 311, 118704. [Google Scholar] [CrossRef]
- Hu, Y.; Qu, S.; Huang, K.; Xue, B.; Yu, Y. The Chinese plug-in electric vehicles industry in post-COVID-19 era towards 2035: Where is the path to revival? J. Clean Prod. 2022, 361, 132291. [Google Scholar] [CrossRef] [PubMed]
- Łuszczyk, M.; Sulich, A.; Siuta-Tokarska, B.; Zema, T.; Thier, A. The development of electromobility in the european union: Evidence from Poland and cross-country comparisons. Energies 2021, 14, 8247. [Google Scholar] [CrossRef]
- GB/T51313-2018; Engineering Technical Standard for Electric Vehicle Dispersal Charging Infrastructure. Ministry of Housing and Urban-Rural Development of the People’s Republic of China: Beijing, China, 2018. Available online: https://www.mohurd.gov.cn/gongkai/fdzdgknr/tzgg/201904/20190404_240029.html (accessed on 1 March 2019).
- Chen, R.; Fan, R.; Wang, D.; Yao, Q. Effects of multiple incentives on electric vehicle charging infrastructure deployment in China: An evolutionary analysis in complex network. Energy 2023, 264, 125747. [Google Scholar] [CrossRef]
- Central People’s Government of the People’s Republic of China. Implementation Opinions of the National Development and Reform Commission and other Departments on Further Improving the Service Guarantee Capacity of Electric Vehicle Charging Infrastructure. Available online: http://www.gov.cn/zhengce/zhengceku/2022-01/21/content_5669780.htm (accessed on 10 January 2022).
- Wang, H.; Zhao, D.; Cai, Y.; Meng, Q.; Ong, O.P. Taxi trajectory data based fast-charging facility planning for urban electric taxi systems. Appl. Energy 2021, 286, 116515. [Google Scholar] [CrossRef]
- Gupta, R.S.; Tyagi, A.; Anand, S. Optimal allocation of electric vehicles charging infrastructure, policies and future trends. J. Energy Storage 2021, 43, 103291. [Google Scholar] [CrossRef]
- Chakir, A.; Abid, M.; Tabaa, M.; Hachimi, H. Demand-side management strategy in a smart home using electric vehicle and hybrid renewable energy system. Energy Rep. 2022, 8, 383–393. [Google Scholar] [CrossRef]
- Yu, Z.; Lu, F.; Zou, Y.; Yang, X. Quantifying energy flexibility of commuter plug-in electric vehicles within a residence–office coupling virtual microgrid. Part II: Case study setup for scenario and sensitivity analysis. Energy Build. 2022, 254, 111552. [Google Scholar] [CrossRef]
- Deb, S.; Tammi, K.; Kalita, K.; Mahanta, P. Review of recent trends in charging infrastructure planning for electric vehicles. Wiley Interdiscip. Rev. Energy Environ. 2018, 7, e306. [Google Scholar] [CrossRef] [Green Version]
- Metais, M.O.; Jouini, O.; Perez, Y.; Berrada, J.; Suomalainen, E. Too much or not enough? Planning electric vehicle charging infrastructure: A review of modeling options. Renew. Sustain. Energ. Rev. 2022, 153, 111719. [Google Scholar] [CrossRef]
- Zhang, Q.; Li, H.; Zhu, L.; Campana, P.W.; Lu, H.; Wallin, F.; Sun, Q. Factors influencing the economics of public charging infrastructures for EV–A review. Renew. Sust. Energ. Rev. 2018, 94, 500–509. [Google Scholar] [CrossRef]
- Mastoi, M.S.; Zhuang, S.; Munir, H.M.; Haris, M.; Hassan, M.; Usman, M.; Bukhari, S.S.H.; Ro, J. An in-depth analysis of electric vehicle charging station infrastructure, policy implications, and future trends. Energy Rep. 2022, 8, 11504–11529. [Google Scholar] [CrossRef]
- Patil, P.; Kazemzadeh, K.; Bansal, P. Integration of charging behavior into infrastructure planning and management of electric vehicles: A systematic review and framework. Sustain. Cities Soc. 2022, 88, 104265. [Google Scholar] [CrossRef]
- Liu, X.; Fu, Z.; Qiu, S.; Li, S.; Zhang, T.; Liu, X.; Jiang, Y. Building-centric investigation into electric vehicle behavior: A survey-based simulation method for charging system design. Energy 2023, 271, 127010. [Google Scholar] [CrossRef]
- Zhang, J.; Yan, J.; Liu, Y.; Zhang, H.; Lv, G. Daily electric vehicle charging load profiles considering demographics of vehicle users. Appl. Energy 2020, 274, 115063. [Google Scholar] [CrossRef]
- Ge, X.; Shi, L.; Fu, Y.; Muyeen, S.M.; Zhang, Z.; He, H. Data-driven spatial-temporal prediction of electric vehicle load profile considering charging behavior. Electr. Power Syst. Res. 2020, 187, 106469. [Google Scholar] [CrossRef]
- Yan, J.; Zhang, J.; Liu, Y.; Lv, G.; Han, S.; Alfonzo, I.E.G. EV charging load simulation and forecasting considering traffic jam and weather to support the integration of renewables and EVs. Renew. Energy 2020, 159, 623–641. [Google Scholar] [CrossRef]
- Tian, J.; Lv, Y.; Zhao, Q.; Gong, Y.; Li, C.; Ding, H.; Yu, Y. Electric vehicle charging load prediction considering the orderly charging. Energy Rep. 2022, 8, 124–134. [Google Scholar] [CrossRef]
- Xing, Y.; Li, F.; Sun, K.; Wang, D.; Chen, T.; Zhang, Z. Multi-type electric vehicle load prediction based on Monte Carlo simulation. Energy Rep. 2022, 8, 966–972. [Google Scholar] [CrossRef]
- Al-Wreikat, Y.; Serrano, C.; Sodré, J.R. Effects of ambient temperature and trip characteristics on the energy consumption of an electric vehicle. Energy 2022, 238, 122028. [Google Scholar] [CrossRef]
- Zhang, X.; Kong, X.; Yan, R.; Liu, Y.; Xia, P.; Sun, X.; Zeng, R.; Li, H. Data-driven cooling, heating and electrical load prediction for building integrated with electric vehicles considering occupant travel behavior. Energy 2023, 264, 126274. [Google Scholar] [CrossRef]
- Muratori, M. Impact of uncoordinated plug-in electric vehicle charging on residential power demand. Nat. Energy 2018, 3, 193–201. [Google Scholar] [CrossRef]
- Morais, H. New approach for electric vehicles charging management in parking lots considering fairness rules. Electr. Power Syst. Res. 2023, 217, 109107. [Google Scholar] [CrossRef]
- Zhang, L.; Zhao, Z.; Yang, M.; Li, S. A multi-criteria decision method for performance evaluation of public charging service quality. Energy 2020, 195, 116958. [Google Scholar] [CrossRef]
- Morrissey, P.; Weldon, P.; O’Mahony, M. Future standard and fast charging infrastructure planning: An analysis of electric vehicle charging behaviour. Energy Policy 2016, 89, 257–270. [Google Scholar] [CrossRef]
- Andrenacci, N.; Ragona, R.; Valenti, G. A demand-side approach to the optimal deployment of electric vehicle charging stations in metropolitan areas. Appl. Energy 2016, 182, 39–46. [Google Scholar] [CrossRef]
- Sachan, S.; Deb, S.; Singh, S.N. Different charging infrastructures along with smart charging strategies for electric vehicles. Sust. Cities Soc. 2020, 60, 102238. [Google Scholar] [CrossRef]
- Xiao, D.; An, S.; Cai, H.; Wang, J.; Cai, H. An optimization model for electric vehicle charging infrastructure planning considering queuing behavior with finite queue length. J. Energy Storage 2020, 29, 101317. [Google Scholar] [CrossRef]
- Woo, S.; Bae, S.; Moura, S.J. Pareto optimality in cost and service quality for an Electric Vehicle charging facility. Appl. Energy 2021, 290, 116779. [Google Scholar] [CrossRef]
- Chen, L.; Huang, X.; Zhang, H.; Luo, Y. A study on coordinated optimization of electric vehicle charging and charging pile selection. Energies 2018, 11, 1350. [Google Scholar] [CrossRef] [Green Version]
- Yang, X.; Guo, X.; Li, Y.; Yang, K. The sequential construction research of regional public electric vehicle charging facilities based on data-driven analysis—Empirical analysis of Shanxi Province. J. Clean Prod. 2022, 380, 134948. [Google Scholar] [CrossRef]
- Bitencourt, L.; Abud, T.P.; Dias, B.H.; Borba, B.S.M.C.; Maciel, R.S.; Quirós-Tortós, J. Optimal location of EV charging stations in a neighborhood considering a multi-objective approach. Electr. Power Syst. Res. 2021, 199, 107391. [Google Scholar] [CrossRef]
- Afshar, S.; Pecenak, Z.K.; Barati, M.; Disfani, V. Mobile charging stations for EV charging management in urban areas: A case study in Chattanooga. Appl. Energy 2022, 325, 119901. [Google Scholar] [CrossRef]
- Zou, W.; Sun, Y.; Gao, D.; Zhang, X.; Liu, J. A review on integration of surging plug-in electric vehicles charging in energy-flexible buildings: Impacts analysis, collaborative management technologies, and future perspective. Appl. Energy 2023, 331, 120393. [Google Scholar] [CrossRef]
- Chen, Y.; Zhang, L.; Xu, P.; Di Gangi, A. Electricity demand response schemes in China: Pilot study and future outlook. Energy 2021, 224, 120042. [Google Scholar] [CrossRef]
- Wang, Q.; Ding, Y.; Kong, X.; Tian, Z.; Xu, L.; He, Q. Load pattern recognition based optimization method for energy flexibility in office buildings. Energy 2022, 254, 124475. [Google Scholar] [CrossRef]
- Benysek, G.; Waśkowicz, B.; Dylewski, R.; Jarnut, M. Electric Vehicles Charging Algorithm with Peak Power Minimization, EVs Charging Power Minimization, Ability to Respond to DR Signals and V2G Functionality. Energies 2022, 15, 5195. [Google Scholar] [CrossRef]
- Saber, H.; Ranjbar, H.; Ehsan, M.; Anvari-Moghaddam, A. Transactive charging management of electric vehicles in office buildings: A distributionally robust chance-constrained approach. Sust. Cities Soc. 2022, 87, 104171. [Google Scholar] [CrossRef]
- Chai, Y.T.; Che, H.S.; Tan, C.K.; Tan, W.; Yip, S.; Gan, M. A two-stage optimization method for Vehicle to Grid coordination considering building and Electric Vehicle user expectations. Int. J. Electr. Power Energy Syst. 2023, 148, 108984. [Google Scholar] [CrossRef]
- Nazemi, S.D.; Jafari, M.A.; Zaidan, E. An incentive-based optimization approach for load scheduling problem in smart building communities. Buildings 2021, 11, 237. [Google Scholar] [CrossRef]
- Tan, Z.; Yang, Y.; Wang, P.; Li, Y. Charging behavior analysis of new energy vehicles. Sustainability 2021, 13, 4837. [Google Scholar] [CrossRef]
- Hardinghaus, M.; Anderson, J.E.; Nobis, C.; Stark, K.; Vladova, G. Booking Public Charging: User Preferences and Behavior towards Public Charging Infrastructure with a Reservation Option. Electronics 2022, 11, 2476. [Google Scholar] [CrossRef]
- Central People’s Government of the People’s Republic of China. A Guideline of The General Office of the State Council on Accelerating the Construction of Electric Vehicle Charging Infrastructure. Available online: http://www.gov.cn/zhengce/content/2015-10/09/content_10214.htm (accessed on 9 October 2015).
- DB33/1121-2016; Code for Allocation and Design of Electric Vehicle Charging Facilities of Civil Buildings. Zhejiang Provincial Department of Housing and Urban-Rural Development: Hangzhou, China, 2016. Available online: https://jst.zj.gov.cn/art/2016/4/21/art_1228990170_131.html (accessed on 21 April 2016).
- China Architecture Standards Design & Research Institute. 18D705-2: Electric vehicle charging infrastructure design and installation. Available online: https://ebook.chinabuilding.com.cn/zbooklib/bookpdf/probation?SiteID=1&bookID=109485 (accessed on 1 August 2018).
- Hu, D.; Huang, L.; Liu, C.; Liu, Z.; Ge, M. Data driven optimization for electric vehicle charging station locating and sizing with charging satisfaction consideration in urban areas. IET Renew. Power Gener. 2022, 16, 2630–2643. [Google Scholar] [CrossRef]
- Saadati, R.; Saebi, J.; Jafari-Nokandi, M. Effect of uncertainties on siting and sizing of charging stations and renewable energy resources: A modified capacitated flow-refueling location model. Sustain. Energy Grids Netw. 2022, 31, 100759. [Google Scholar] [CrossRef]


| Vehicle Type | Charging Start Time | Charging Duration | Driving Distance | Initial SOC | Battery Capacity | Power Consumption per Kilometer | Charging Location | |
|---|---|---|---|---|---|---|---|---|
| [20] | √ | √ | √ | √ | ||||
| [21] | √ | √ | √ | √ | √ | √ | √ | |
| [22] | √ | √ | √ | √ | ||||
| [23] | √ | √ | √ | √ | √ | |||
| [24] | √ | √ | √ | |||||
| [25] | √ | √ | √ | √ |
| Commuting Characteristics | Distribution Characteristics | Probability Density Distribution |
|---|---|---|
| Arrival time () | Normal distribution | |
| Departure time () | Normal distribution | |
| Driving distance (D) | Weibull distribution | |
| SOC at departure () | Bimodal normal distribution | |
| Battery capacities () | Weibull distribution | |
| Power consumption per kilometer () | Uniform distribution |
| Time | Building 1 /Vehicles | Building 2 /Vehicles | Time | Building 1 /Vehicles | Building 2 /Vehicles |
|---|---|---|---|---|---|
| Year 1 | 5 | 40 | Year 6 | 14 | 114 |
| Year 2 | 6 | 51 | Year 7 | 15 | 123 |
| Year 3 | 8 | 65 | Year 8 | 16 | 132 |
| Year 4 | 10 | 83 | Year 9 | 17 | 142 |
| Year 5 | 13 | 106 | Year 10 | 18 | 153 |
| Parameters | Value | Parameters | Value | Parameters | Value |
|---|---|---|---|---|---|
| 5 | 3500 | 0.1 | |||
| 10 | 1500 | k | 10,000 | ||
| 1.278 | 0.9 | 180 () | |||
| 1.075 | 0.95 | 150 () | |||
| 120 () |
| No. | Battery Capacity (kWh) | No. | Battery Capacity (kWh) |
|---|---|---|---|
| EV1 | 87.85 | EV6 | 69.50 |
| EV2 | 61.19 | EV7 | 59.58 |
| EV3 | 81.17 | EV8 | 81.08 |
| EV4 | 66.88 | EV9 | 87.71 |
| EV5 | 71.80 | EV10 | 98.45 |
Disclaimer/Publisher’s Note: The statements, opinions and data contained in all publications are solely those of the individual author(s) and contributor(s) and not of MDPI and/or the editor(s). MDPI and/or the editor(s) disclaim responsibility for any injury to people or property resulting from any ideas, methods, instructions or products referred to in the content. |
© 2023 by the authors. Licensee MDPI, Basel, Switzerland. This article is an open access article distributed under the terms and conditions of the Creative Commons Attribution (CC BY) license (https://creativecommons.org/licenses/by/4.0/).
Share and Cite
Zhu, Y.; Ding, Y.; Wei, S.; Zafar, H.M.Y.; Yan, R. Electric Vehicle Charging Facility Configuration Method for Office Buildings. Buildings 2023, 13, 906. https://doi.org/10.3390/buildings13040906
Zhu Y, Ding Y, Wei S, Zafar HMY, Yan R. Electric Vehicle Charging Facility Configuration Method for Office Buildings. Buildings. 2023; 13(4):906. https://doi.org/10.3390/buildings13040906
Chicago/Turabian StyleZhu, Yan, Yan Ding, Shen Wei, Hafiz Muhammad Yahya Zafar, and Rui Yan. 2023. "Electric Vehicle Charging Facility Configuration Method for Office Buildings" Buildings 13, no. 4: 906. https://doi.org/10.3390/buildings13040906