
Productivity Analysis and Associated Risks in Steel Structures


Abstract
:1. Introduction
2. Literature Review
3. Materials and Methods
3.1. Productivity in Steel Structures
- (kg/h)i.j.: Kilograms per hour of each project for each one of the basic phases of steel structures.
- kgi.j.: Kilograms of each project for each one of the basic phases of steel structures.
- hi.j.: Hours of each project for each one of the basic phases of steel structures.
- i: projects.
- j: the basic phases of steel structures.
3.2. Risk Analysis in Steel Structures
- xij: Decision table entries
- rij: Normalized value
- ej: Entropy
- h: Value depending on the number of alternatives
- wj: Weight of each criterion
- m: Number of alternatives
- x_ij: Normalized matrix values
- Vij: Weighted normalized matrix values
- Vi+: Ideally better value than alternatives
- Vi−: Ideally worse value than alternatives
- Si+: Euclidean distance from ideal best value
- Si−: Euclidean distance from ideal worst value
- Pi: Result of each criterion
- Pi(%): Percentage of each criterion
4. Results and Discussion
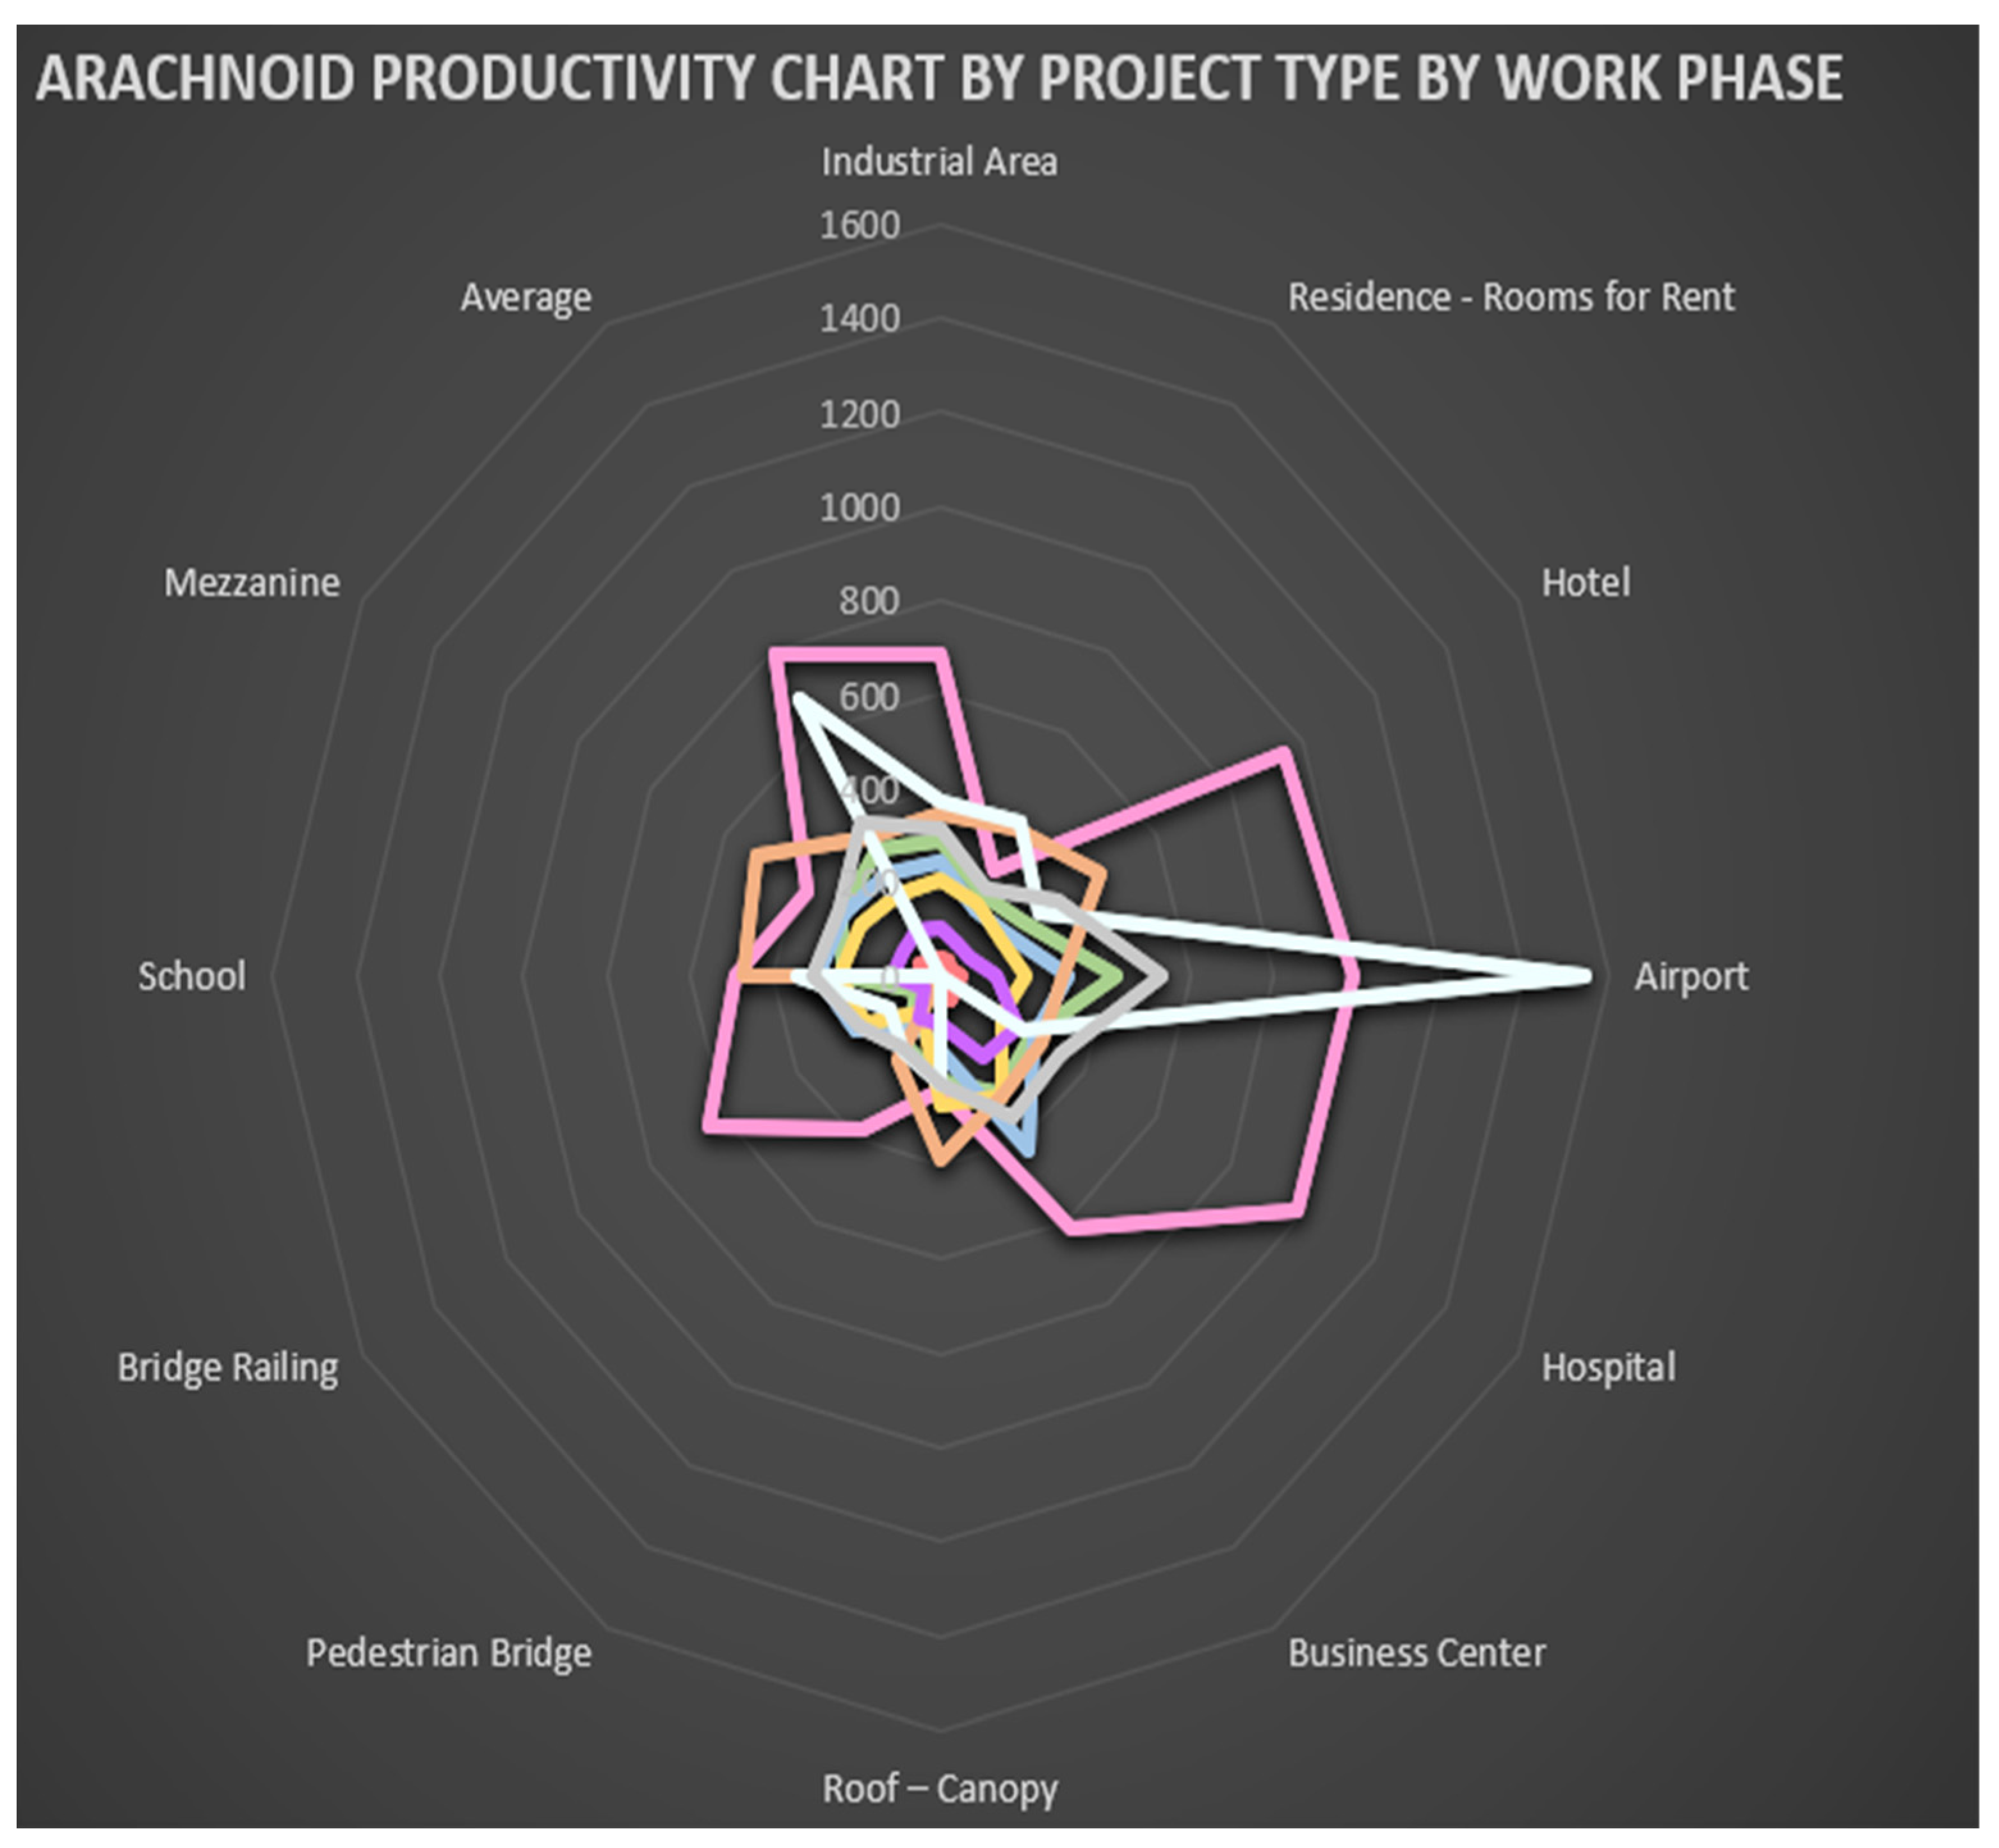
4.1. Productivity in Steel Structures
- The most productive project type for the Design phase is Hospital, at 990 kg/h, while the least productive project type for the Design phase is Residence—Rooms for Rent, at 257 kg/h.
- For the Cutting Long Beams phase, Airport exhibits the highest productivity, at 425 kg/h, while the least productive project type for the basic Cutting Long Beams phase is Bridge Railing, at 64 kg/h.
- For the Cutting Forming Sheets phase, Mezzanine is the most productive, at 57 kg/h, while the least productive project type is Bridge Railing, at 18 kg/h.
- The most productive project type for the basic Montage (Assembly) phase is Business Center, at 428 kg/h, while the least productive project type is Pedestrian Bridge, at 115 kg/h.
- For the Welding phase, Business Center is the most productive project, at 296 kg/h, while the least productive project type is Footbridge, at 89 kg/h.
- For the basic Paint phase, Mezzanine presents the highest productivity, at 512 kg/h, while the least productive project type for the basic Paint phase is Pedestrian Bridge, at 204 kg/h.
- For the basic Erection phase, Hospital is the most productive project, at 212 kg/h, while the least productive project type is Bridge Railing, at 44 kg/h.
- For the basic Various Steel Tasks phase, Airport is the most productive project, at 1545 kg/h, while the least productive project type is Bridge Railing, at 138 kg/h.
- The average productivity of all types of projects and phases is 378 kg/h.
- Overall, the least productive type of project on average is Pedestrian Bridge, at 173 kg/h.
- Finally, the most productive type of project on average is Airport, at 528 kg/h.
4.2. Risk Analysis in Steel Structures
- 1.
- It enables us to define a reasonable range of values regarding both the probability of occurrence of the risks and their consequences [22],
- 2.
- It introduces the concept of interaction of input variables in a computational environment.
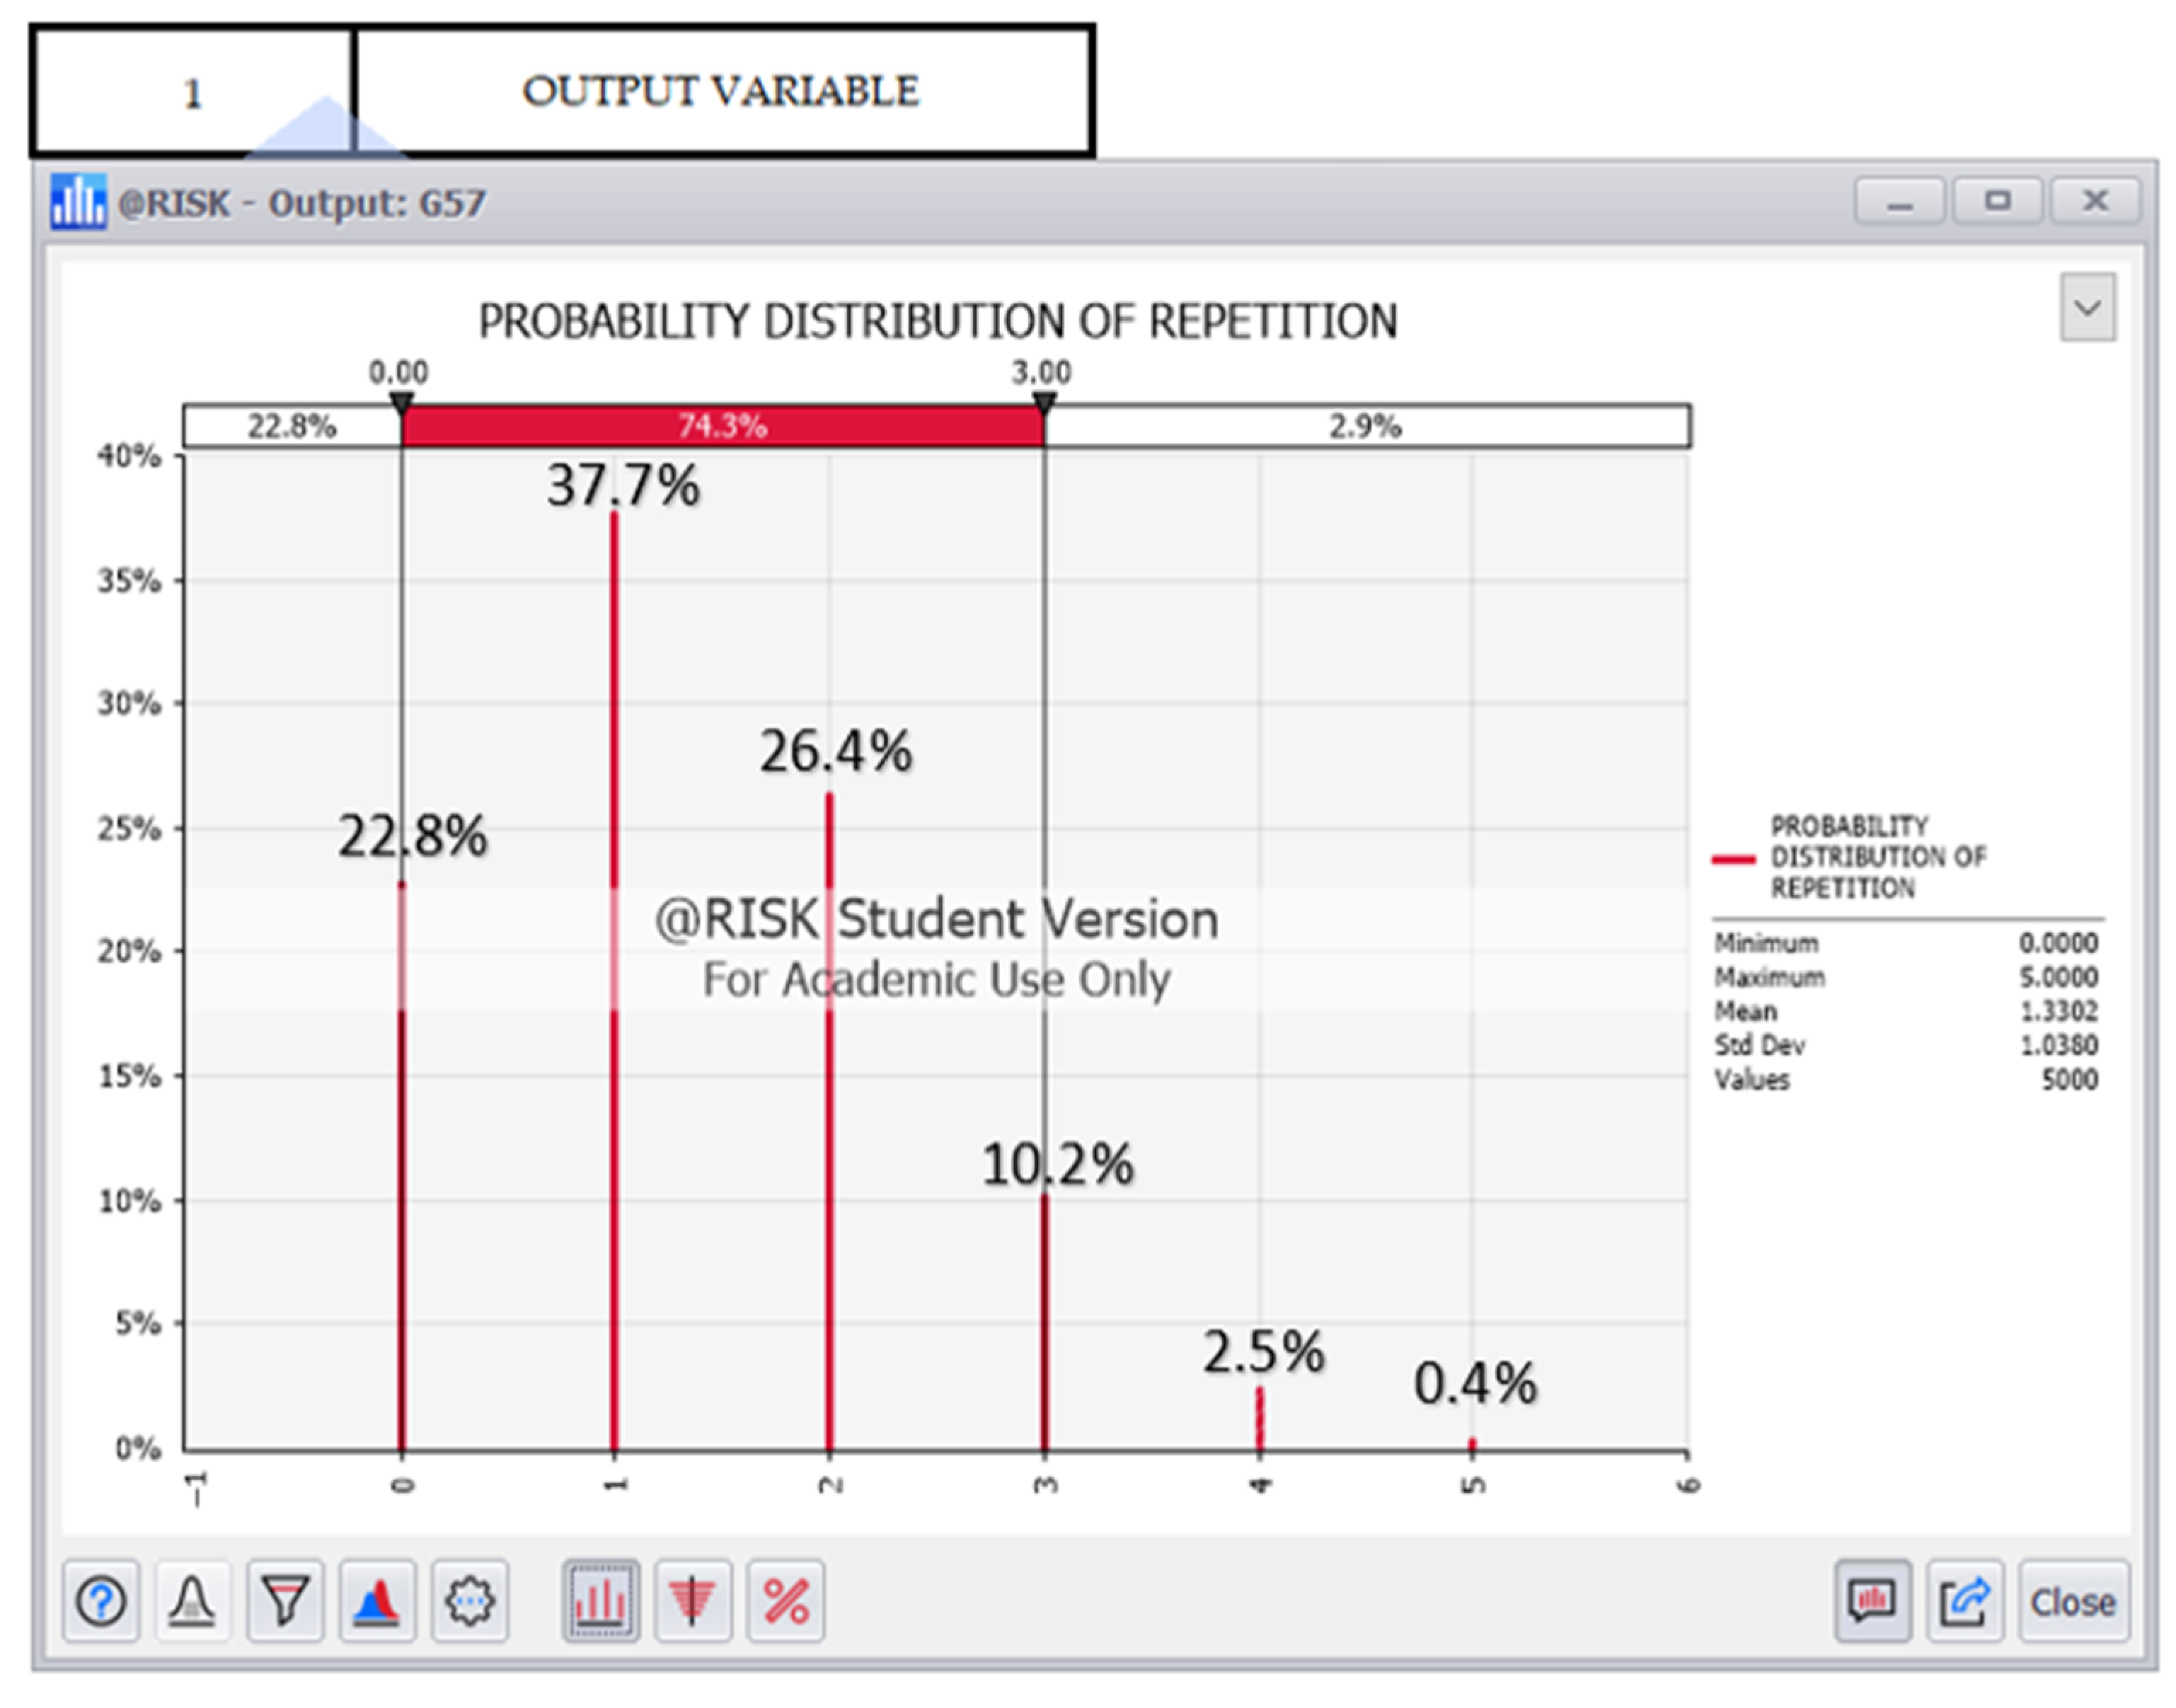
- Exact and Cumulative Distribution Probability Diagram of Total Number of Hazard Occurrences (Repetitions) (Figure 3)
- ○
- There is a 22.8% chance that no risk will occur;
- ○
- There is a 37.7% chance that only one risk will appear;
- ○
- There is a 26.4% chance that 2 risks will appear at the same time;
- ○
- There is a 10.2% chance that 3 risks will appear at the same time;
- ○
- There is a 2.5% chance of 4 risks appearing at the same time;
- ○
- There is a 0.4% chance of 5 risks appearing at the same time;
- ○
- The probability of 4 or 5 risks appearing simultaneously (2.5% or 0.4% respectively);
- ○
- The cumulative probability of 4 and 5 risks occurring at the same time is 2.9%;
- ○
- The maximum number of simultaneous risks appearing is 5.
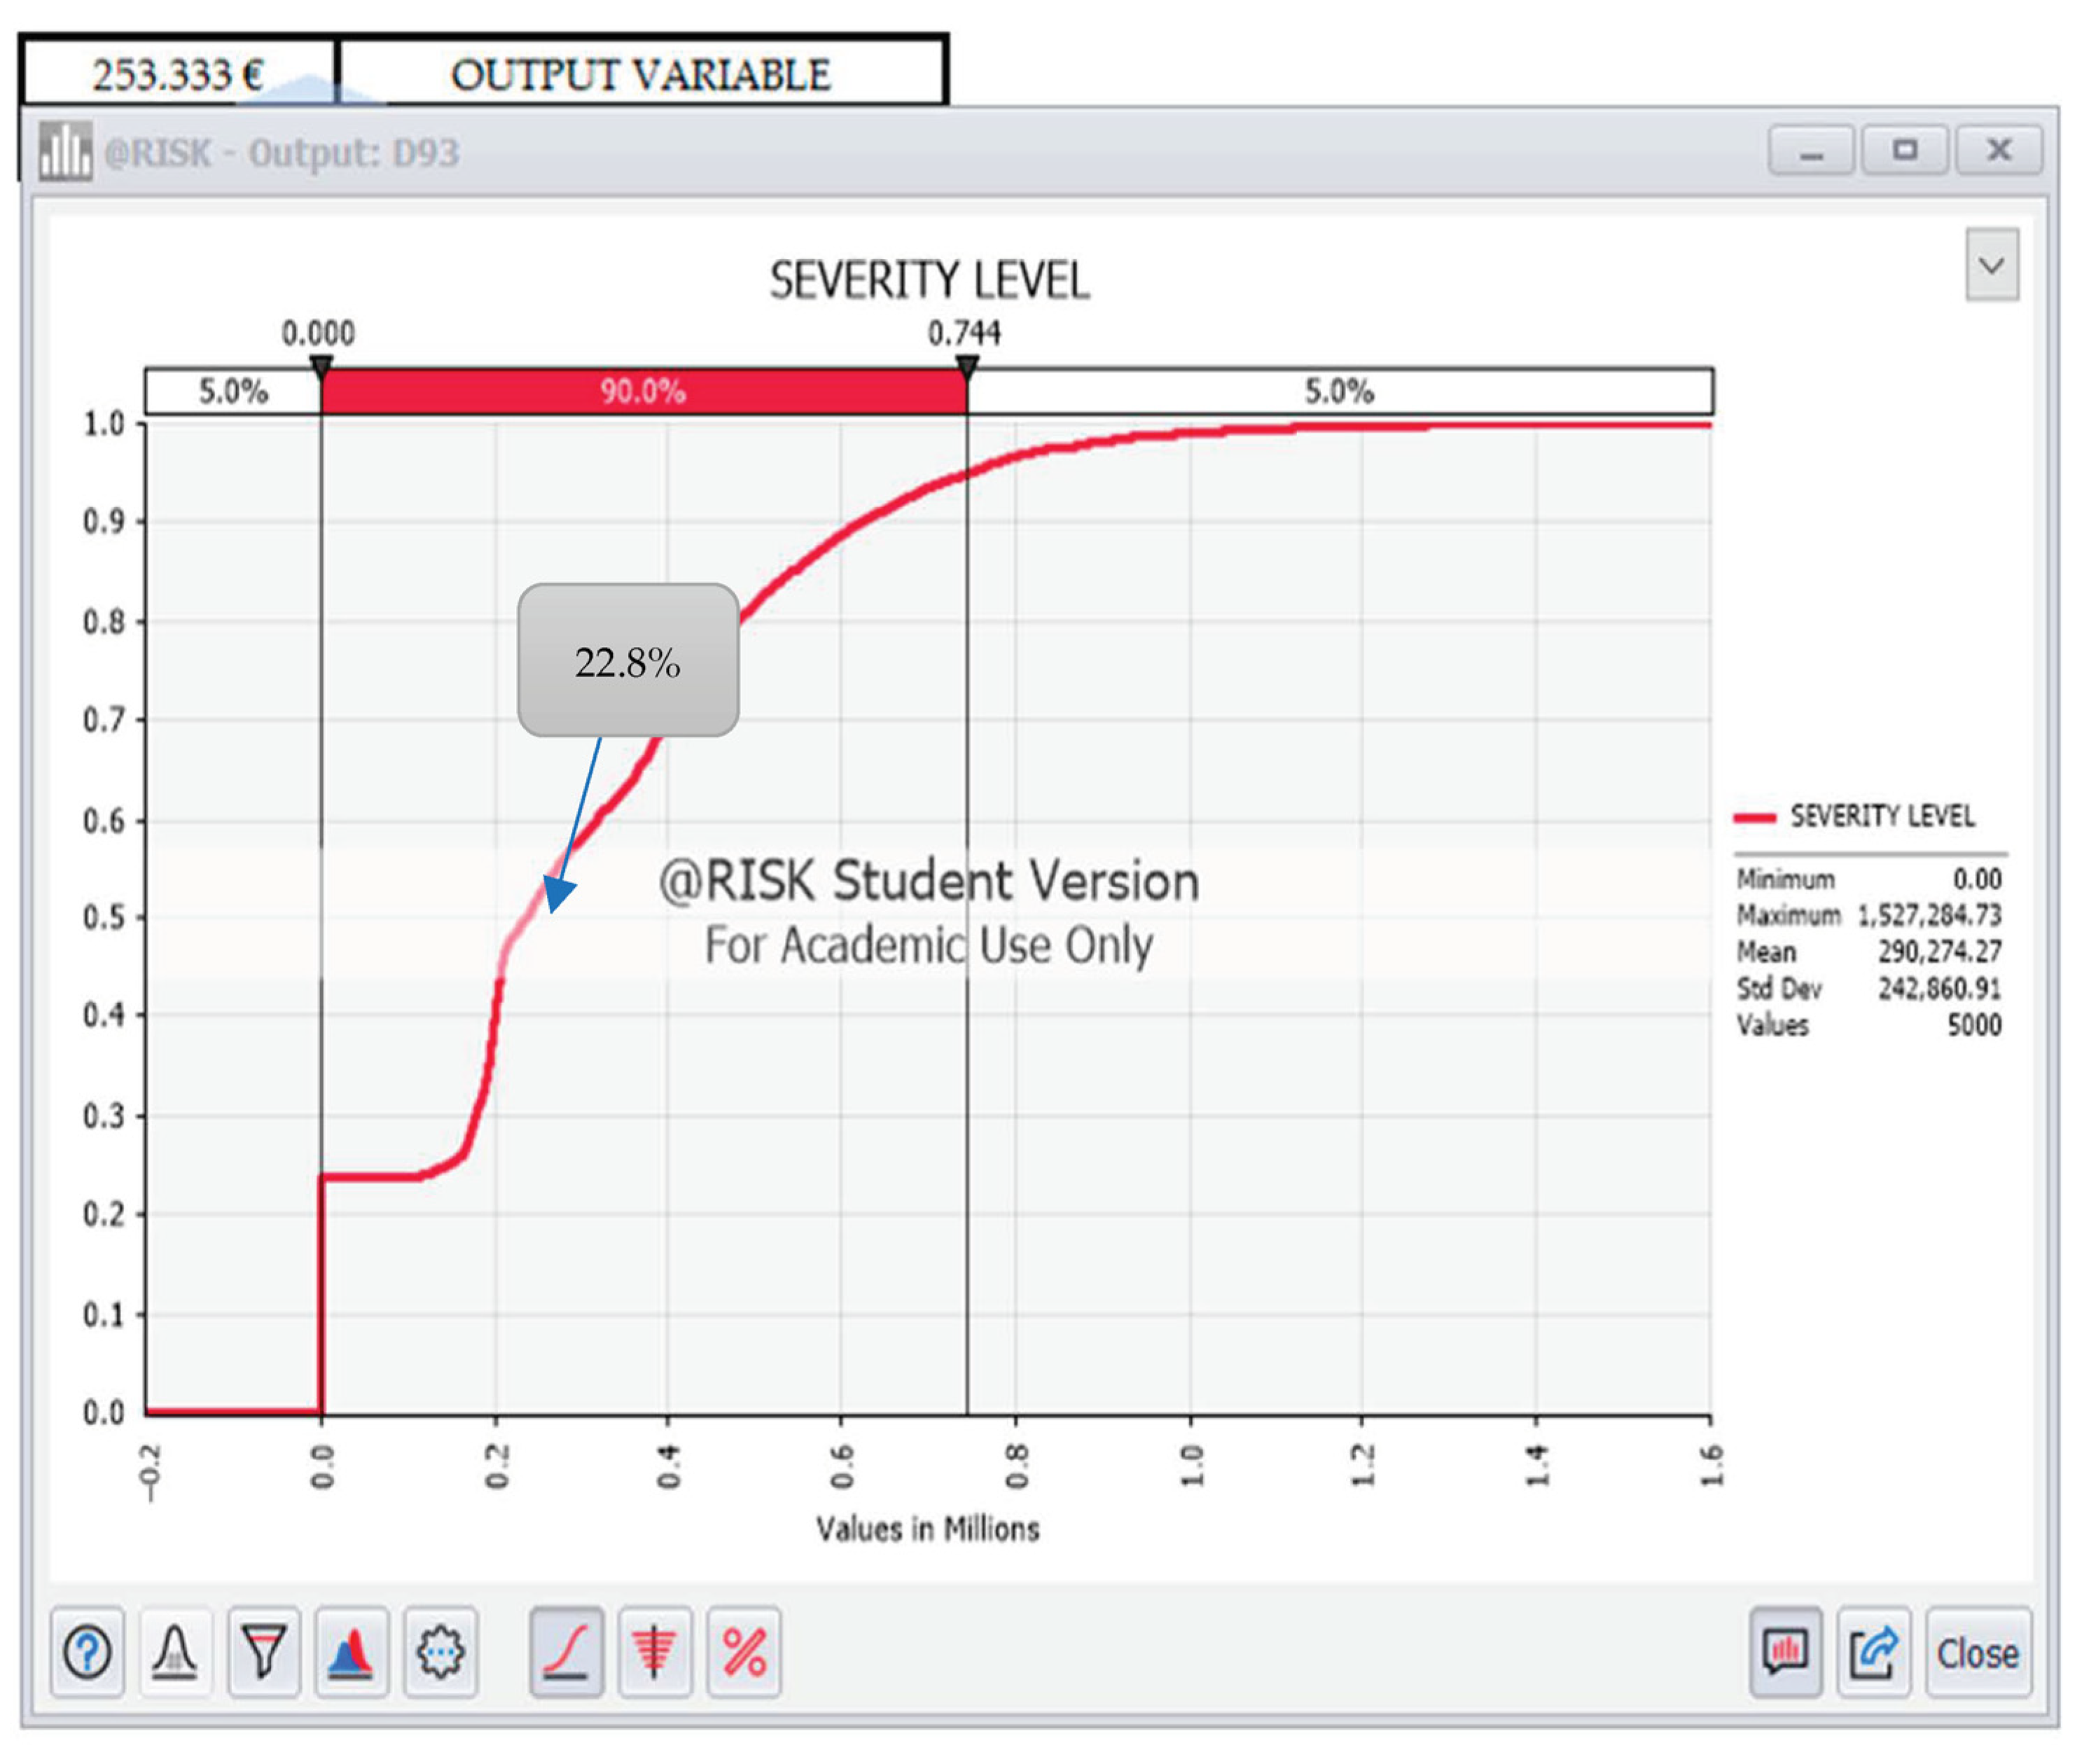
- Diagram of Exact and Cumulative Total Risk Cost Probability Distribution (Figure 4)
- ○
- There is a 22.8% chance that no costs of risks will occur;
- ○
- The maximum cost that can be incurred from the random combination of all the main risks considered is EUR 1,527,284.73;
- ○
- There is a cumulative probability of 95% that the total burden of the business will rise to EUR 744,000 and only a probability of 5% that the cost of the business will range from EUR 744,000 to 1,527,284.73;
- ○
- There is only a 5% cumulative probability that costs of risks will be greater than EUR 786,000 and a 95% probability that costs will be less.
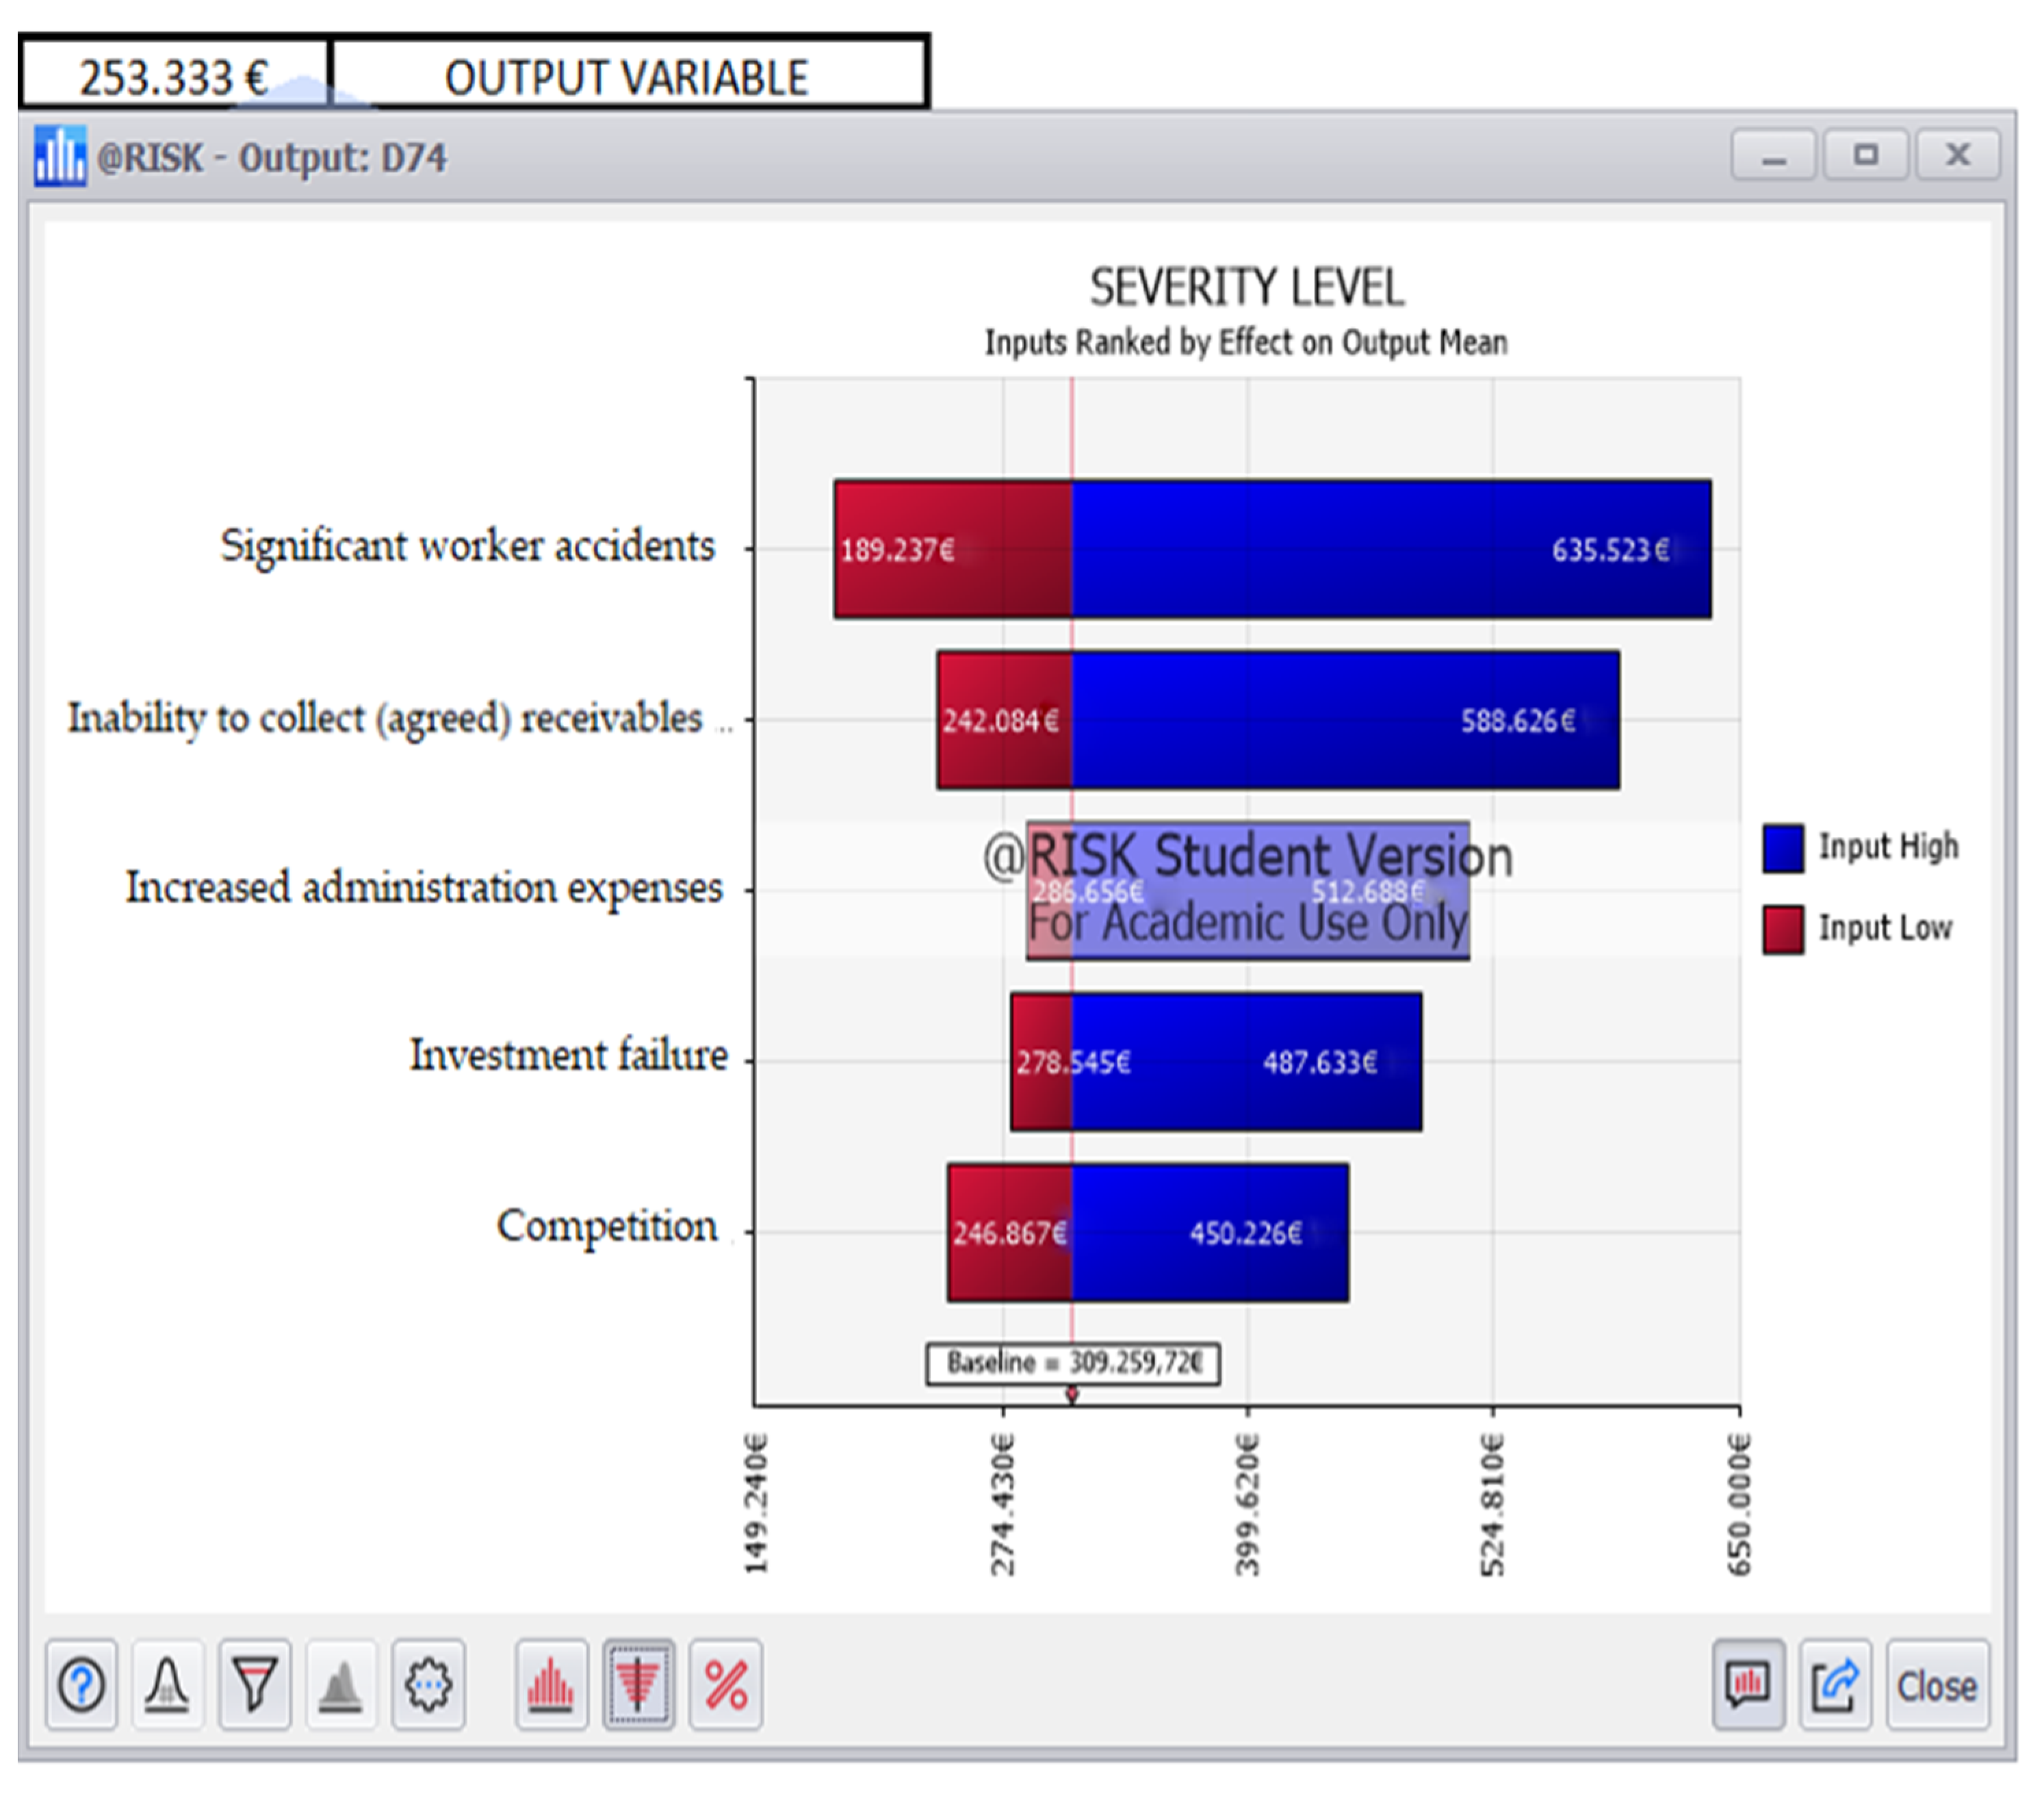
- Total Cost of Risk Tornado Diagram (Figure 5)
- ○
- Significant worker accidents;
- ○
- Inability to collect (agreed) receivables;
- ○
- Increased administration expenses;
- ○
- Competition;
- ○
- Investment failure;
- Tornado Diagram for the Total Number of Risk Occurrences (Figure 6)
- ○
- Significant worker accidents;
- ○
- Inability to collect (agreed) receivables;
- ○
- Competition;
- ○
- Investment failure
- ○
- Increased administration expenses.
5. Discussion and Conclusions
5.1. Discussion
5.2. Conclusions
Author Contributions
Funding
Data Availability Statement
Conflicts of Interest
Abbreviations
| DSGN | Design |
| CTBM | Cutting Long Beams |
| PLAT | Cutting Forming Sheets |
| ASMB | Montage (Assembly) |
| WELD | Welding |
| PANT | Paint |
| ERCT | Erection |
| VARS | Various Steel Tasks |
Appendix A

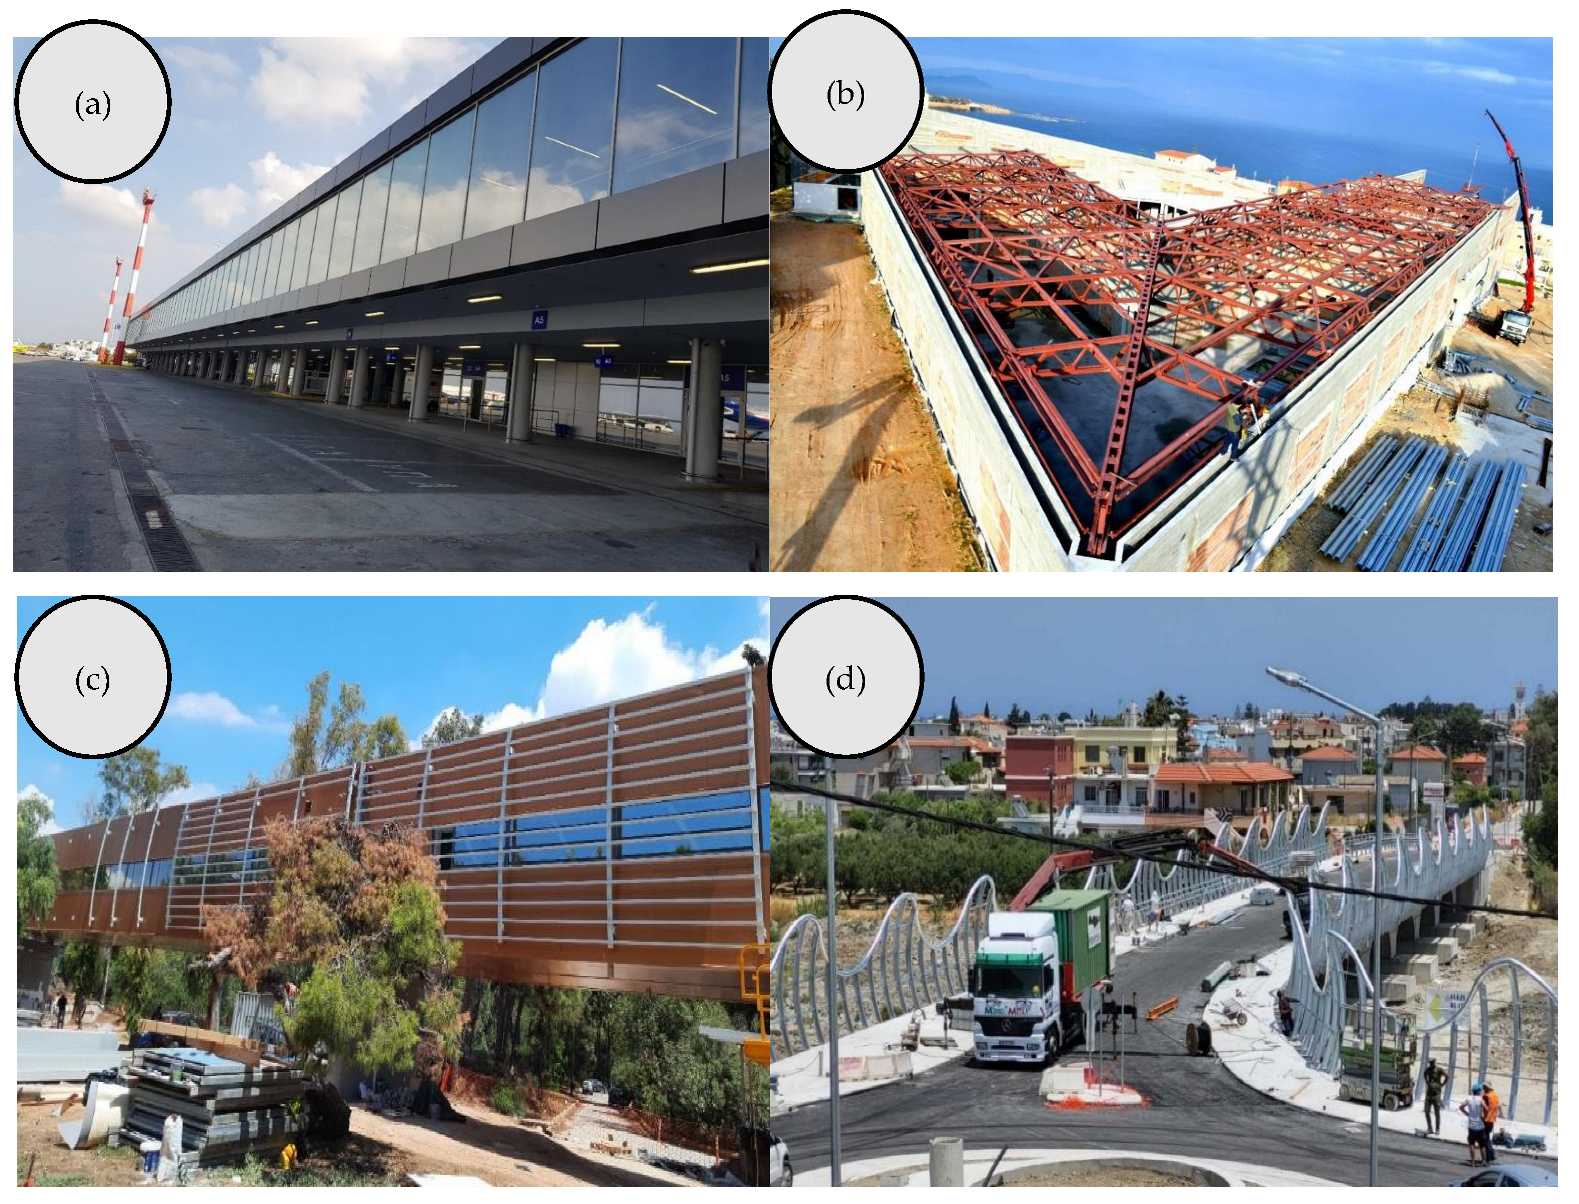
| A/A | Types | Area (m2) | Height (m) | Floors | Comments |
|---|---|---|---|---|---|
| 321 | Industrial Area | 747 m2 | 7.00 m | 1 | Steel Building with Panel |
| 1 | Residence—Rooms for Rent | 200 m2 | 9.00 m | 3 | Composite Multistorey Building |
| 2 | Business Center | 960 m2 | 6.00 m | 1 | Steel Building with Panel |
| 3 | Industrial Area | 477 m2 | 5.70 m | - | Steel Building with Panel |
| 4 | Roof-Canopy | 999 m2 | 1.0–9 | - | Various Many Small Steel Structures |
| 5 | Residence—Rooms for Rent | 139 m2 | 2.50 m | 1 | Steel Frame of House |
| 6 | Airport | 5.240 m2 | 5.0–15 | 1 | Various Steel Structures |
| 7 | Residence—Rooms for Rent | 75 m2 | 2.40 m | 1 | House with Metal Steel and Dry Construction |
| 8 | Mezzanine | - | - | - | Steel Mezzanine |
| 9 | Residence—Rooms for Rent | 218 m2 | 4.00 m | 1 | Steel Frame of House |
| 10 | Residence—Rooms for Rent | 60 m2 | 6.00 m | 2 | Steel—Concrete Frame of House |
| 11 | Residence—Rooms for Rent | 280 m2 | 11.50 m | 5 | House with Steel—Concrete Frame and Dry Construction |
| 12 | Industrial Area | 1.395 m2 | 9.90 m | 2 | Steel—Concrete Building with Panel for Overlay |
| 13 | Various Constructions | - | - | - | Various Many Small Steel Structures |
| 14 | Airport | 5.720 m2 | 5.00 m | 1 | Steel—Concrete Frame of Building |
| 15 | Industrial Area | 516 m2 | 7.20 m | 1 | Steel Building with Panel |
| 16 | Industrial Area | 503 m2 | 6.00 m | 1 | Steel Building with Panel |
| 17 | Various Constructions | - | - | - | Various Many Small Steel Structures |
| 18 | Industrial Area | 67 m2 | 5.00 m | 1 | Steel Building with Panel |
| 19 | Airport | 278 m2 | 4.64 m | 1 | Steel—Concrete Frame of Loft |
| 20 | Industrial Area | 1.175 m2 | 7.00 m | 1 | Steel Building with Panel |
| 21 | Industrial Area | 869 m2 | 7.57 m | 1 | Steel Building Addition with Panel |
| 22 | Airport | 1.075 m2 | 15.23 m | - | Steel Building |
| 23 | Residence—Rooms for Rent | 92 m2 | 3.40 m | 1 | Steel Frame of House |
| 24 | Various Constructions | 8 m2 | 8.70 m | 3 | Steel Frame of Elevator |
| 25 | Airport | 3.680 m2 | 2.6–11 | 1 + 2 | Various Steel Structures |
| 26 | Hotel | 1.150 m2 | 11.00 m | 2 | Steel—Concrete Frame of Hotel |
| 27 | Industrial Area | 440 m2 | 5.50 m | 1 | Steel Roof with Panel |
| 28 | Various Constructions | 20 m2 | 1.00 m | 1 | Steel Structure |
| 29 | Residence—Rooms for Rent | 254 m2 | 12.60 m | 3 | Steel—Concrete Frame of Hotel |
| 30 | Various Constructions | 52 m2 | 3.00 m | 1 | Steel Interior Reinforcements of Existing Home |
| 31 | Industrial Area | 1.825 m2 | 1.00 m | 1 | Steel Building with Panel |
| 32 | Roof-Canopy | 200 m2 | - | - | Reconstruction of a Steel Roof with Panel |
| 33 | Hotel | 4.023 m2 | 18.00 m | 3 | Steel Frame of a Composite Hotel |
| 34 | Roof-Canopy | 168 m2 | 1.20 m | 1 | Steel Roof with Panels |
| 35 | Airport | 250 m2 | 4.60 m | 1 | Steel Building |
| 36 | Roof-Canopy | 108 m2 | 5.50 m | 1 | Steel Roof with Panel |
| 37 | Airport | 240 m2 | 4.70 m | 1 | Various Many Small Steel Structures |
| 38 | Various Constructions | - | - | - | Various Many Small Steel Structures |
| 39 | Various Constructions | 330 m2 | 12.00 m | 3 | Steel Reinforcement of an existing building |
| 40 | Pedestrian Bridge | 60 m2 | 1.00 m | - | Steel Open Pedestrian Bridge |
| 41 | Industrial Area | 425 m2 | 5.00 m | 1 | Steel Building with Panel |
| 42 | Industrial Area | 593 m2 | 9.85 m | 2 | Steel frame of Composite Building |
| 43 | Industrial Area | 420 m2 | 4.50 m | 1 | Steel Building with Panel |
| 44 | Industrial Area | 850 m2 | 5.00 m | 1 | Steel Additions with Panel |
| 45 | Hospital | 2.289 m2 | 4.05 m | 1 | Steel frame of Composite Building |
| 46 | Roof-Canopy | 120 m2 | 4.89 m | 1 | Steel Building with Panels |
| 47 | Residence—Rooms for Rent | 303 m2 | 3.00 m | 1 | Steel House with dry construction on an existing conventional |
| 48 | Hotel | 1.164 m2 | 13.25 m | 4 | Steel frame of Composite Building |
| 49 | Residence—Rooms for Rent | 126 m2 | 8.30 m | 2 | Steel Frame of House |
| 50 | Industrial Area | 36 m2 | 9.50 m | 1 | Steel Building with Panel |
| 51 | Roof-Canopy | 165 m2 | 3.80 m | 1 | Steel Roof |
| 52 | Industrial Area | 609 m2 | 18.80 m | 5 | Steel Building with Panel |
| 53 | Various Constructions | 120 m2 | 3.50 m | 1 | Various Small Steel Structures |
| 54 | Various Constructions | 60 m2 | 8.00 m | 2 | Various Small Steel Structures |
| 55 | Industrial Area | 819 m2 | 7.50 m | 2 | Steel Additions with Panel |
| 56 | Industrial Area | 196 m2 | 4.15 m | 1 | Steel Building with Panel |
| 57 | Residence—Rooms for Rent | 110 m2 | 5.84 m | 2 | House with Steel Frame and Dry Construction |
| 58 | Residence—Rooms for Rent | 237 m2 | 3.41 m | 1 | House with Steel Frame and Dry Construction |
| 59 | Industrial Area | 603 m2 | 7.50 m | 1 | Steel Additions with Panel |
| 60 | Bridge Railing | 1.128 m2 | 4.70 m | 1 | Steel Decorative Bridge Railing |
| 61 | Industrial Area | 3.039 m2 | 7.60 m | 2 | Steel Building with Panel |
| 62 | Pedestrian Bridge | 480 m2 | 3.90 m | 1 | Steel Closed Pedestrian Bridge with Panel |
| 63 | Industrial Area | 224 m2 | 4.50 m | 1 | Steel Building with Panel |
| 64 | Industrial Area | 536 m2 | 7.00 m | 2 | Steel Building with Panel |
| 65 | Industrial Area | 719 m2 | 5.60 m | 1 | Steel Additions with Panel |
| 66 | Industrial Area | 136 m2 | 11.92 m | 2 | Steel Building Open for Silo |
| 67 | School | 887 m2 | 7.20 m | 2 | Steel Building with Panels |
| 68 | Mezzanine | 77 m2 | 3.00 m | - | Steel Mezzanine |
| 69 | Industrial Area | 1.432 m2 | 7.28 m | 1 | Steel Additions with Panel |
| 70 | Residence—Rooms for Rent | 43 m2 | 3.00 m | 1 | House with Steel Frame and Dry Construction |
| 71 | Bridge Railing | 840 m2 | 4.00 m | 1 | Steel Decorative Bridge Railing |
References
- Bröchner, J.; Olofsson, T. Construction Productivity Measures for Innovation Projects. J. Constr. Eng. Manag. 2012, 138, 670–677. [Google Scholar] [CrossRef]
- Barbosa, F.; Woetzel, J.; Mischke, J.; Ribeirinho, M.J.; Sridhar, M.; Parsons, M.; Bertram, N.; Brown, S. Reinventing Construction: A Route to Higher Productivity; Mckinsey Global Insititute: New York, NY, USA, 2017; p. 20. [Google Scholar]
- OECD Infrastructure Financing Instruments and Incentives; OECD Secretary-General: Paris, France, 2015; pp. 1–74.
- Foundation for Economic & Industrial Research. The Role of Infratsructure and Construction Industry the Next Day of Greek Economy; Foundation for Economic & Industrial Research: Athens, Greece, 2021; ISBN 9789607536914. [Google Scholar]
- Salem, A. Study of Factors Influencing Productivity of Hauling Equipment in Earthmoving Projects Using Fuzzy Set Theory. Int. J. Innov. Manag. Technol. 2017, 8, 151–154. [Google Scholar] [CrossRef]
- Ibrahim, M.; Moselhi, O. Automated Productivity Assessment of Earthmoving Operations. J. Inf. Technol. Constr. 2014, 19, 169–184. [Google Scholar]
- Panas, A.; Pantouvakis, J.P. On the Use of Learning Curves for the Estimation of Construction Productivity. Int. J. Constr. Manag. 2018, 18, 301–309. [Google Scholar] [CrossRef]
- Yi, W.; Chan, A.P.C. Critical Review of Labor Productivity Research in Construction Journals. J. Manag. Eng. 2013, 30, 214–225. [Google Scholar] [CrossRef] [Green Version]
- Moselhi, O.; Alkass, S.; Golnaraghi, S.; Zangenehmadar, Z. Modeling Construction Labour Productivity Using Evolutionary Polynomial Regression. Int. J. Product. Qual. Manag. 2020, 1, 1–29. [Google Scholar] [CrossRef]
- Darko, A.; Chan, A.P.C.; Adabre, M.A.; Edwards, D.J.; Hosseini, M.R.; Ameyaw, E.E. Artificial Intelligence in the AEC Industry: Scientometric Analysis and Visualization of Research Activities. Autom. Constr. 2020, 112, 103081. [Google Scholar] [CrossRef]
- Shukla, A.K.; Janmaijaya, M.; Abraham, A.; Muhuri, P.K. Engineering Applications of Artificial Intelligence: A Bibliometric Analysis of 30 Years (1988–2018). Eng. Appl. Artif. Intell. 2019, 85, 517–532. [Google Scholar] [CrossRef]
- Naoum, S.G. Factors Influencing Labor Productivity on Construction Sites: A State-of-the-Art Literature Review and a Survey. Int. J. Product. Perform. Manag. 2016, 65, 401–421. [Google Scholar] [CrossRef]
- Dixit, S.; Mandal, S.N.; Thanikal, J.V.; Saurabh, K. Evolution of Studies in Construction Productivity: A Systematic Literature Review (2006–2017). Ain Shams Eng. J. 2019, 10, 555–564. [Google Scholar] [CrossRef]
- Teizer, J.; Cheng, T.; Fang, Y. Location Tracking and Data Visualization Technology to Advance Construction Ironworkers’ Education and Training in Safety and Productivity. Autom. Constr. 2013, 35, 53–68. [Google Scholar] [CrossRef]
- Liew, J.Y.R.; Chua, Y.S.; Dai, Z. Steel Concrete Composite Systems for Modular Construction of High-Rise Buildings. Structures 2019, 21, 135–149. [Google Scholar] [CrossRef] [Green Version]
- Petroutsatou, K. A Proposal of Project Management Practices in Public Institutions through a Comparative Analyses of Critical Path Method and Critical Chain. Int. J. Constr. Manag. 2019, 22, 242–251. [Google Scholar] [CrossRef]
- Purdy, G. ISO 31000: 2009—Setting a New Standard for Risk Management. Risk Anal. 2010, 30, 881–886. [Google Scholar] [CrossRef] [PubMed]
- PMI. A Guide to the Project Management Body of Knowledge (PMBOOK GUIDE), 4th ed.; PMI: Lausanne, Switzerland, 2009; ISBN 9781933890517. [Google Scholar]
- Antoniou, F. Delay Risk Assessment Models for Road Projects. Systems 2021, 9, 70. [Google Scholar] [CrossRef]
- Jozi, S.A.; Shafiee, M.; Moradimajd, N.; Saffarian, S. An Integrated Shannon’s Entropy—TOPSIS Methodology for Environmental Risk Assessment of Helleh Protected Area in Iran. Environ. Monit. Assess. 2012, 184, 6913–6922. [Google Scholar] [CrossRef] [PubMed]
- Ayyub, B.M. Risk Analysis in Engineering and Economics, 2nd ed.; Taylor & Francis: Abingdon, UK, 2014; ISBN 978-750-8400. [Google Scholar]
- Design, L.; Petroutsatou, K.; Vagdatli, T.; Maravas, A. Probabilistic Approach of Pre-Estimating Life-Cycle Costs of Road Tunnels. Struct. Infrastruct. Eng. 2023, 1–16. [Google Scholar] [CrossRef]


| Basic Phase |
|---|
| Design |
| Cutting Long Beams |
| Cutting Forming Sheets |
| Montage (Assembly) |
| Welding |
| Paint |
| Erection |
| Various Steel Tasks |
| Main Types of Steel Structures |
|---|
| Industrial Area |
| Residence—Rooms for Rent |
| Hotel |
| Airport |
| Hospital |
| Warehouse |
| Business Center |
| Roof–Canopy |
| Pedestrian Bridge |
| Steel House |
| Bridge Railing |
| School |
| Mezzanine |
| Various Constructions |
| A/A | Risk |
|---|---|
| RI.1 | Failure to deliver materials on time |
| RI.2 | Equipment failure |
| RI.3 | Resignation of a person from a “key” position |
| RI.4 | Revaluation of Materials in a project with “locked” prices |
| RI.5 | Inability to collect (agreed) receivables |
| RI.6 | Not significant worker accident |
| RI.7 | Significant worker accidents |
| RI.8 | Tax rate increase |
| RI.9 | Competition |
| RI.10 | Investment failure |
| RI.11 | Bad weather |
| RI.12 | Change in Plans—Delayed Responses |
| RI.13 | Fire—Destruction of factory |
| RI.14 | Increased Administration Expenses |
| RI.15 | Decreased Profit |
| RI.16 | Improper Estimation of Budget |
| A/A | Risk | P | S | V | Rank |
|---|---|---|---|---|---|
| RI.1 | Failure to deliver materials on time | 3 | 3 | 5 | 12 |
| RI.2 | Equipment failure | 3 | 5 | 3 | 7 |
| RI.3 | Resignation of a person from a “key” position | 3 | 5 | 3 | 8 |
| RI.4 | Revaluation of Materials in a project with “locked” prices | 5 | 3 | 7 | 6 |
| RI.5 | Inability to collect (agreed) receivables | 3 | 7 | 7 | 2 |
| RI.6 | Not significant worker accident | 5 | 1 | 3 | 11 |
| RI.7 | Significant worker accidents | 3 | 7 | 5 | 3 |
| RI.8 | Tax rate increase | 1 | 1 | 7 | 16 |
| RI.9 | Competition | 3 | 7 | 5 | 4 |
| RI.10 | Investment failure | 3 | 7 | 9 | 1 |
| RI.11 | Bad weather | 3 | 3 | 3 | 14 |
| RI.12 | Change in Plans—Delayed Responses | 3 | 1 | 1 | 15 |
| RI.13 | Fire—Destruction of factory | 1 | 5 | 5 | 9 |
| RI.14 | Increased administration expenses | 1 | 9 | 7 | 5 |
| RI.15 | Decreased profit | 3 | 3 | 7 | 10 |
| RI.16 | Improper estimation of budget | 3 | 3 | 5 | 13 |
| TYPE | kg/h DSGN | kg/h CTBM | kg/h PLAT | kg/h ASMB | kg/h WELD | kg/h PANT | kg/h ERCTC | kg/h VARS | kg/h AVG |
|---|---|---|---|---|---|---|---|---|---|
| Industrial Area | 686 | 289 | 37 | 244 | 206 | 345 | 102 | 373 | 316 |
| Residence—Rooms for Rent | 257 | 204 | 36 | 166 | 180 | 360 | 83 | 377 | 215 |
| Hotel | 948 | 232 | 29 | 184 | 163 | 441 | 81 | 271 | 327 |
| Airport | 989 | 425 | 50 | 308 | 205 | 294 | 131 | 1545 | 528 |
| Hospital | 990 | 249 | 41 | 256 | 166 | 279 | 212 | 230 | 334 |
| Business Center | 621 | 283 | 56 | 428 | 296 | 293 | 199 | 348 | |
| Roof-Canopy | 242 | 219 | 35 | 160 | 275 | 390 | 100 | 228 | 228 |
| Pedestrian Bridge | 375 | 171 | 31 | 115 | 89 | 204 | 105 | 183 | 173 |
| Bridge Railing | 638 | 64 | 18 | 233 | 204 | 44 | 138 | 219 | |
| School | 492 | 234 | 41 | 294 | 242 | 472 | 112 | 343 | 310 |
| Mezzanine | 367 | 271 | 57 | 266 | 224 | 512 | 102 | 280 | |
| Average | 787 | 311 | 41 | 254 | 198 | 342 | 116 | 682 | 378 |
| A/A | Risk | Consequence Probability Distribution | Probability Distribution of Repetition | Risk Severity Level |
|---|---|---|---|---|
| RI.5 | Inability to collect (agreed) receivables | 231,250 € | 0 | 0 € |
| RI.7 | Significant worker accidents | 253,333 € | 1 | 253,333 € |
| RI.9 | Competition | 200,333 € | 0 | 0 € |
| RI.10 | Investment failure | 178,500 € | 0 | 0 € |
| RI.14 | Increased administration expenses | 445,000 € | 0 | 0 € |
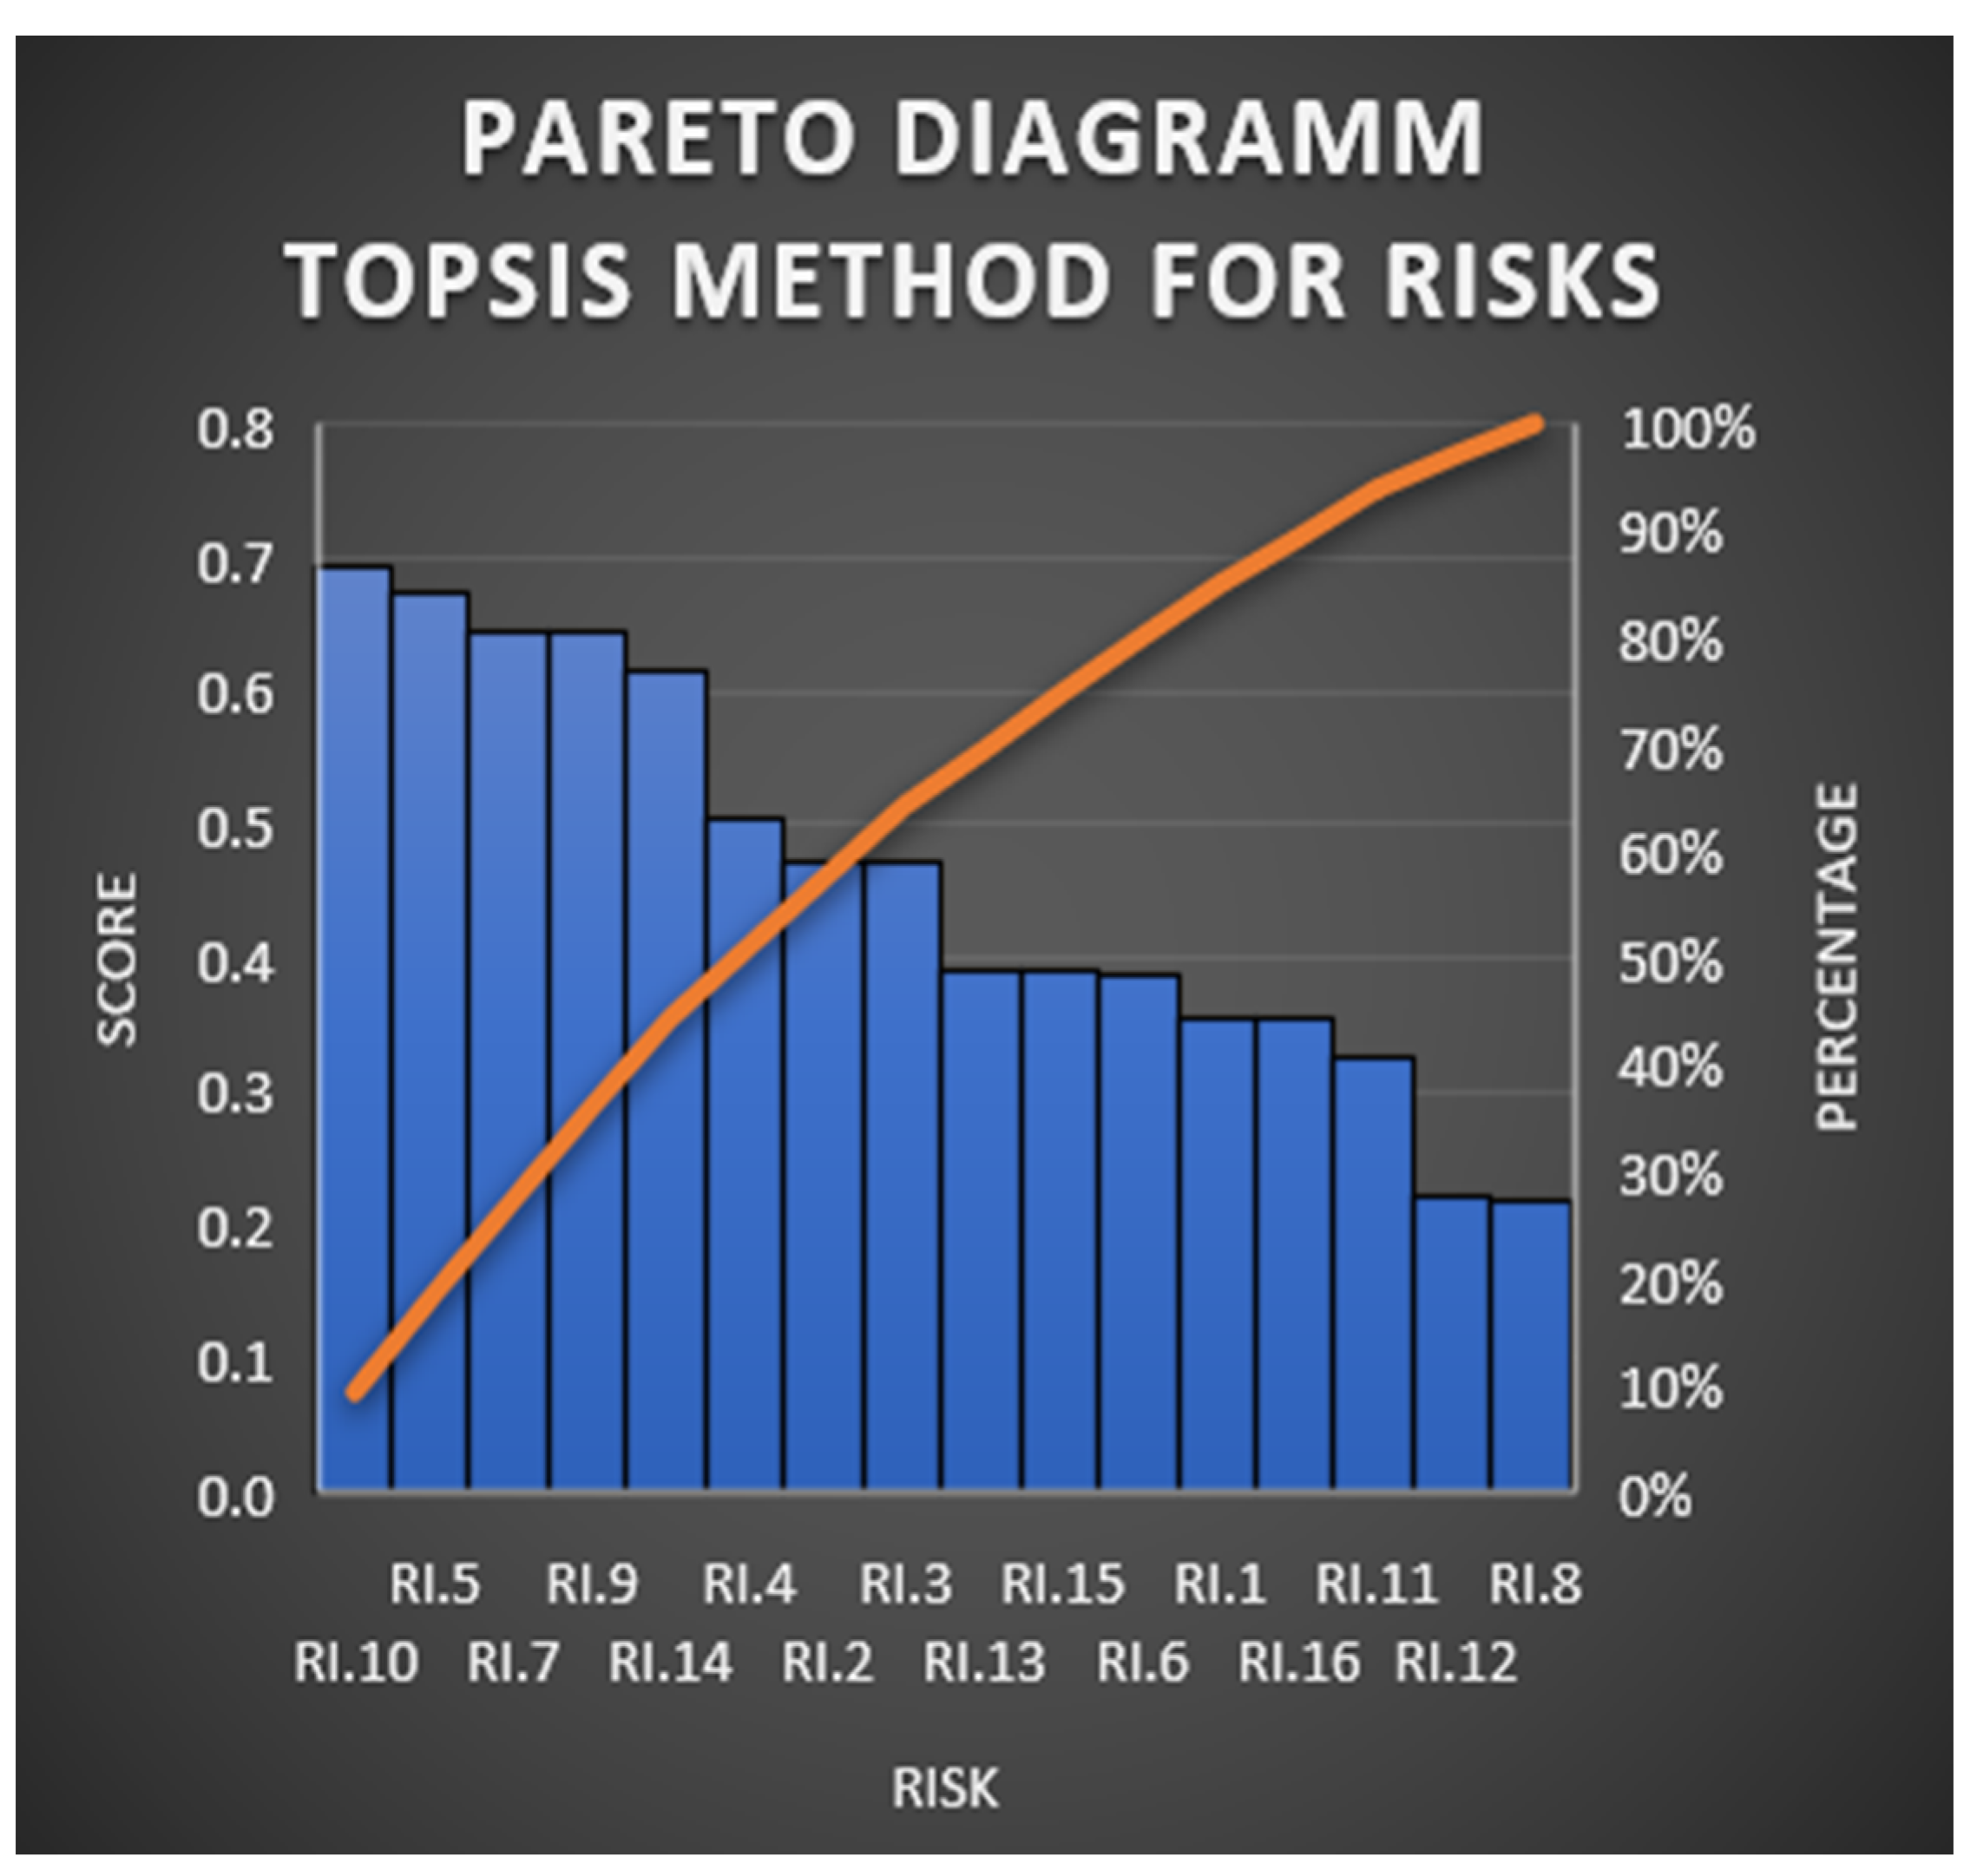
| A/A | Risk | Score | % | Rank |
|---|---|---|---|---|
| RI.10 | Investment failure | 0.6934 | 9.42 | 1 |
| RI.5 | Inability to collect (agreed) receivables | 0.6746 | 9.17 | 2 |
| RI.7 | Significant worker accidents | 0.6448 | 8.76 | 3 |
| RI.9 | Competition | 0.6448 | 8.76 | 4 |
| RI.14 | Increased administration expenses | 0.6141 | 8.34 | 5 |
Disclaimer/Publisher’s Note: The statements, opinions and data contained in all publications are solely those of the individual author(s) and contributor(s) and not of MDPI and/or the editor(s). MDPI and/or the editor(s) disclaim responsibility for any injury to people or property resulting from any ideas, methods, instructions or products referred to in the content. |
© 2023 by the authors. Licensee MDPI, Basel, Switzerland. This article is an open access article distributed under the terms and conditions of the Creative Commons Attribution (CC BY) license (https://creativecommons.org/licenses/by/4.0/).
Share and Cite
Petroutsatou, K.; Kantilierakis, D. Productivity Analysis and Associated Risks in Steel Structures. Buildings 2023, 13, 905. https://doi.org/10.3390/buildings13040905
Petroutsatou K, Kantilierakis D. Productivity Analysis and Associated Risks in Steel Structures. Buildings. 2023; 13(4):905. https://doi.org/10.3390/buildings13040905
Chicago/Turabian StylePetroutsatou, Kleopatra, and Dimitrios Kantilierakis. 2023. "Productivity Analysis and Associated Risks in Steel Structures" Buildings 13, no. 4: 905. https://doi.org/10.3390/buildings13040905