
Parametric BIM-Based Lifecycle Performance Prediction and Optimisation for Residential Buildings Using Alternative Materials and Designs
Abstract
:Highlights
- Proposal of a BIM-based framework for lifecycle carbon prediction and optimisation.
- Proposal of a standard method with generic formulations to calculate the embodied carbon.
- Exploration of BIM-enabled parametric modelling for optimising low-carbon alternative design.
- Exploration of the interoperability between BIM and energy simulation for lifecycle energy analysis.
- Investigation of low-carbon materials and designs in the lifecycle carbon of residential buildings.
Abstract

1. Introduction
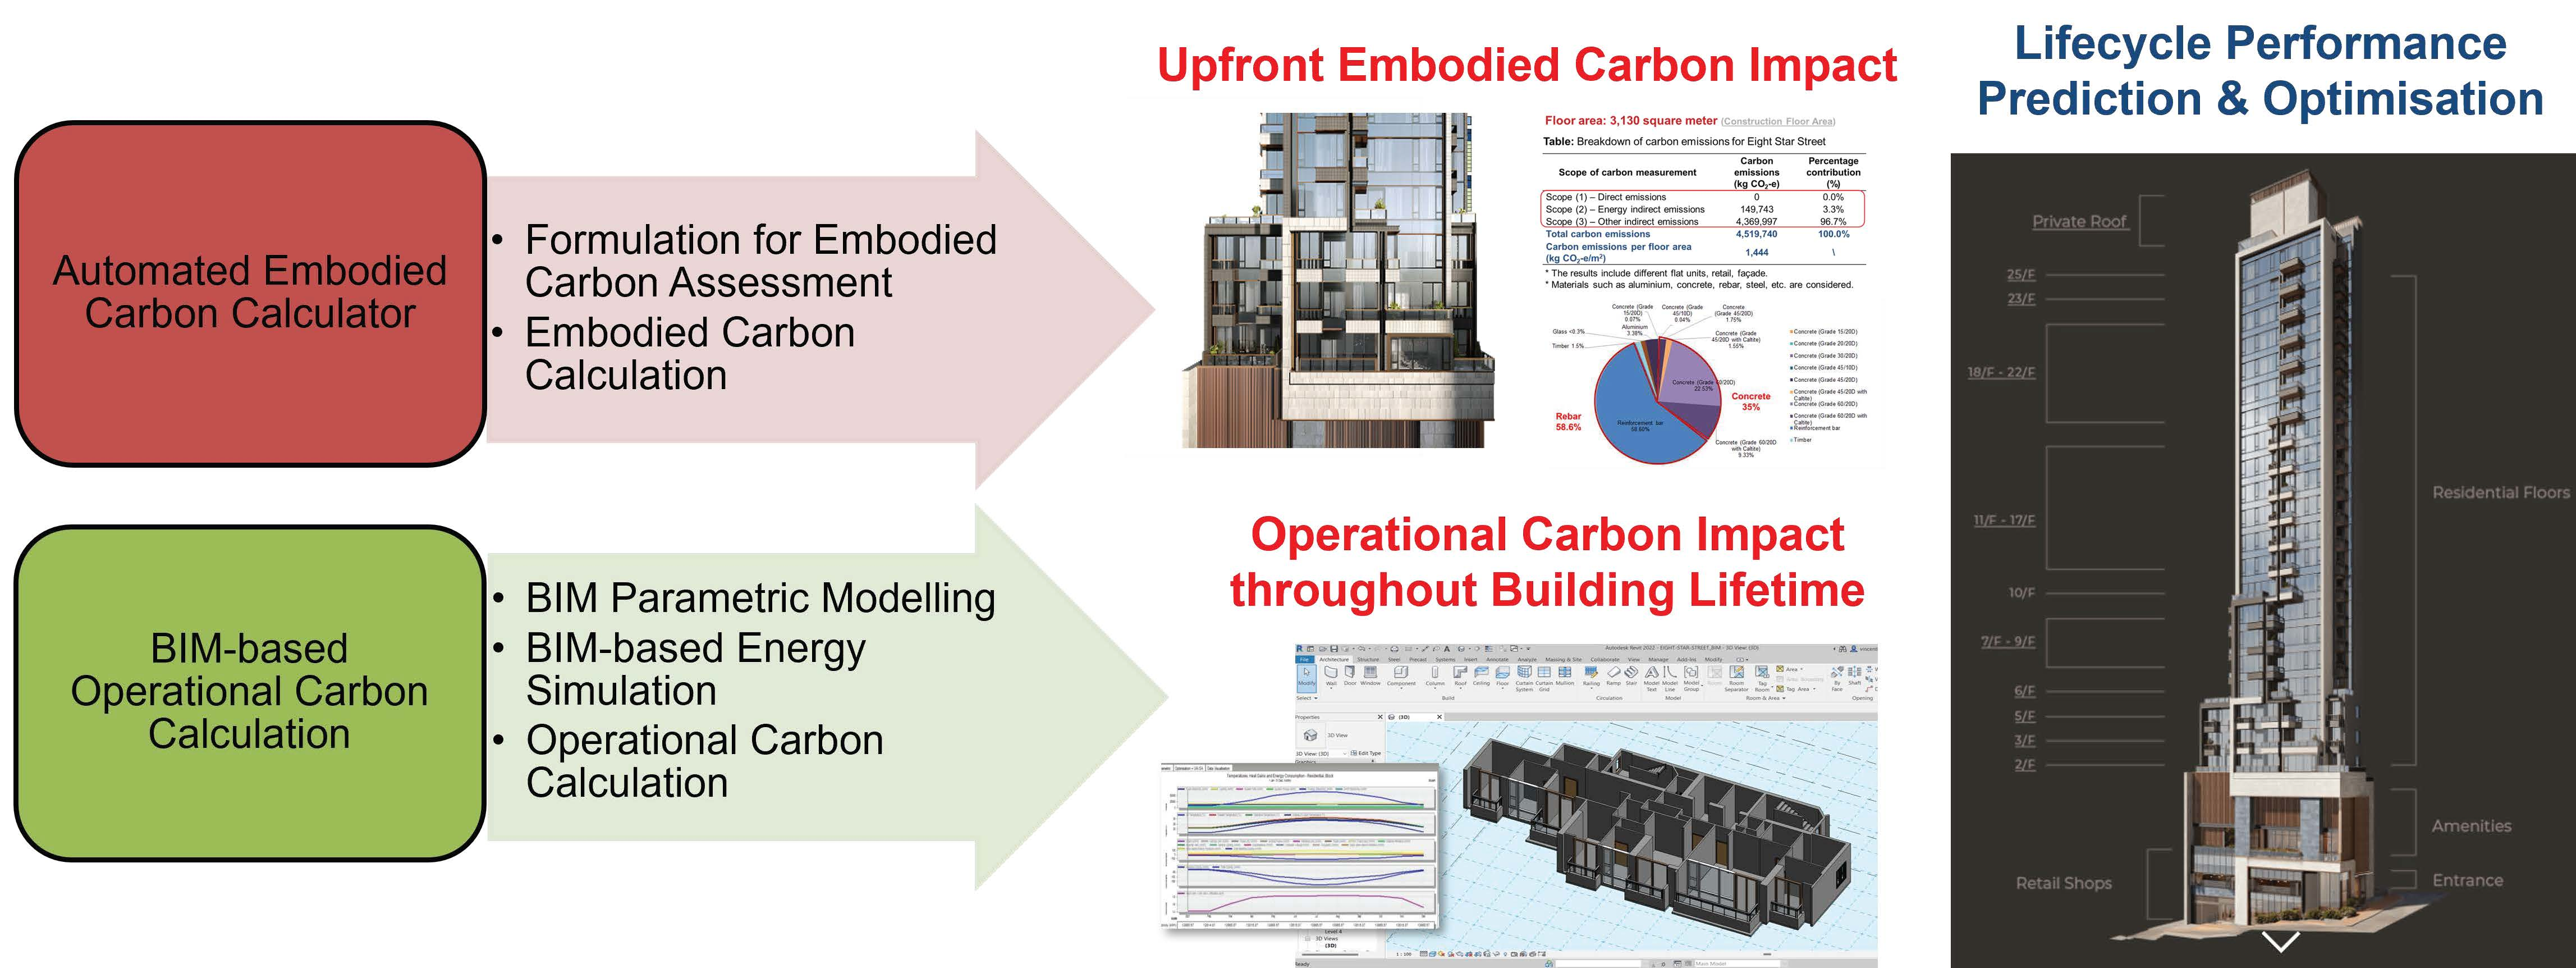
- Firstly, a system workflow for lifecycle carbon prediction and optimisation is proposed in this study. The proposed workflow integrates building information from various project development phases such as project inception, conceptualisation, criteria definition, design, implementation, operation, and maintenance. It enables assessment and analysis of building performance throughout its lifecycle, enhancing the ability to predict and optimise carbon emissions.
- Secondly, a standard method with generic formulations is proposed to calculate and analyse the upfront embodied carbon. The present study generalises the formulation and emission factors for evaluating the material embodied carbon, contributing to improved carbon performance prediction and optimisation.
- Thirdly, BIM-enabled parametric modelling is explored for optimising and analysing low-carbon alternative design. The crucial variables influencing lifecycle energy consumption in buildings, such as geometrics and structural layout, spatial planning, and building usage pattern, suggest a BIM-based energy modelling technique to contrast various building usages for energy conservation. The BIM-enabled parametric modelling approach allows for exploring alternative materials and designs and evaluating their impacts on the building’s lifecycle carbon performance. This process provides valuable insights into optimal design strategies and their contributions to reducing the building’s carbon footprint.
- The data interoperability between BIM and energy simulation for lifecycle energy performance analysis is explored. Improving the interoperability between BIM and energy simulation tools enhances the recovery of the BIM digital model, minimising the risk of data loss during data transfer, and addresses compatibility issues between platforms. This integration enables a more precise assessment of energy conservation potential and influential factors in residential buildings, contributing to practical carbon assessment and analysis development.
- Lastly, the present study investigates low-carbon materials and design alternatives for the lifecycle carbon footprint of residential buildings. This involves the usage of cement substitutes, steel scraps, and green hydrogen steel and the application of DfMA and modular construction to mitigate the carbon footprint of residential buildings. The carbon emission hotspots have also been identified with a comprehensive data analysis. Findings relevant to energy conservation and carbon reduction can inform future residential development.
2. Methodology
2.1. Automated Embodied Carbon Calculator
2.1.1. Formulation for Embodied Carbon Assessment
- (1)
- Upfront Carbon Emissions of Construction Materials
- (2)
- Carbon Emissions from Construction Activities
- (3)
- Carbon Emissions due to Waste Disposal and Sewage Treatment
2.1.2. Validation of Embodied Carbon Calculation
2.2. BIM-Based Operational Carbon Assessment
2.2.1. Identification of Influential Factors
- Geometrics and structural layout consist of the placement, orientation, shape, and size of the building elements, as well as the type of materials and their properties such as the U-value of the curtain walls, boundaries’ definition of the materials from room to room and floor to floor.
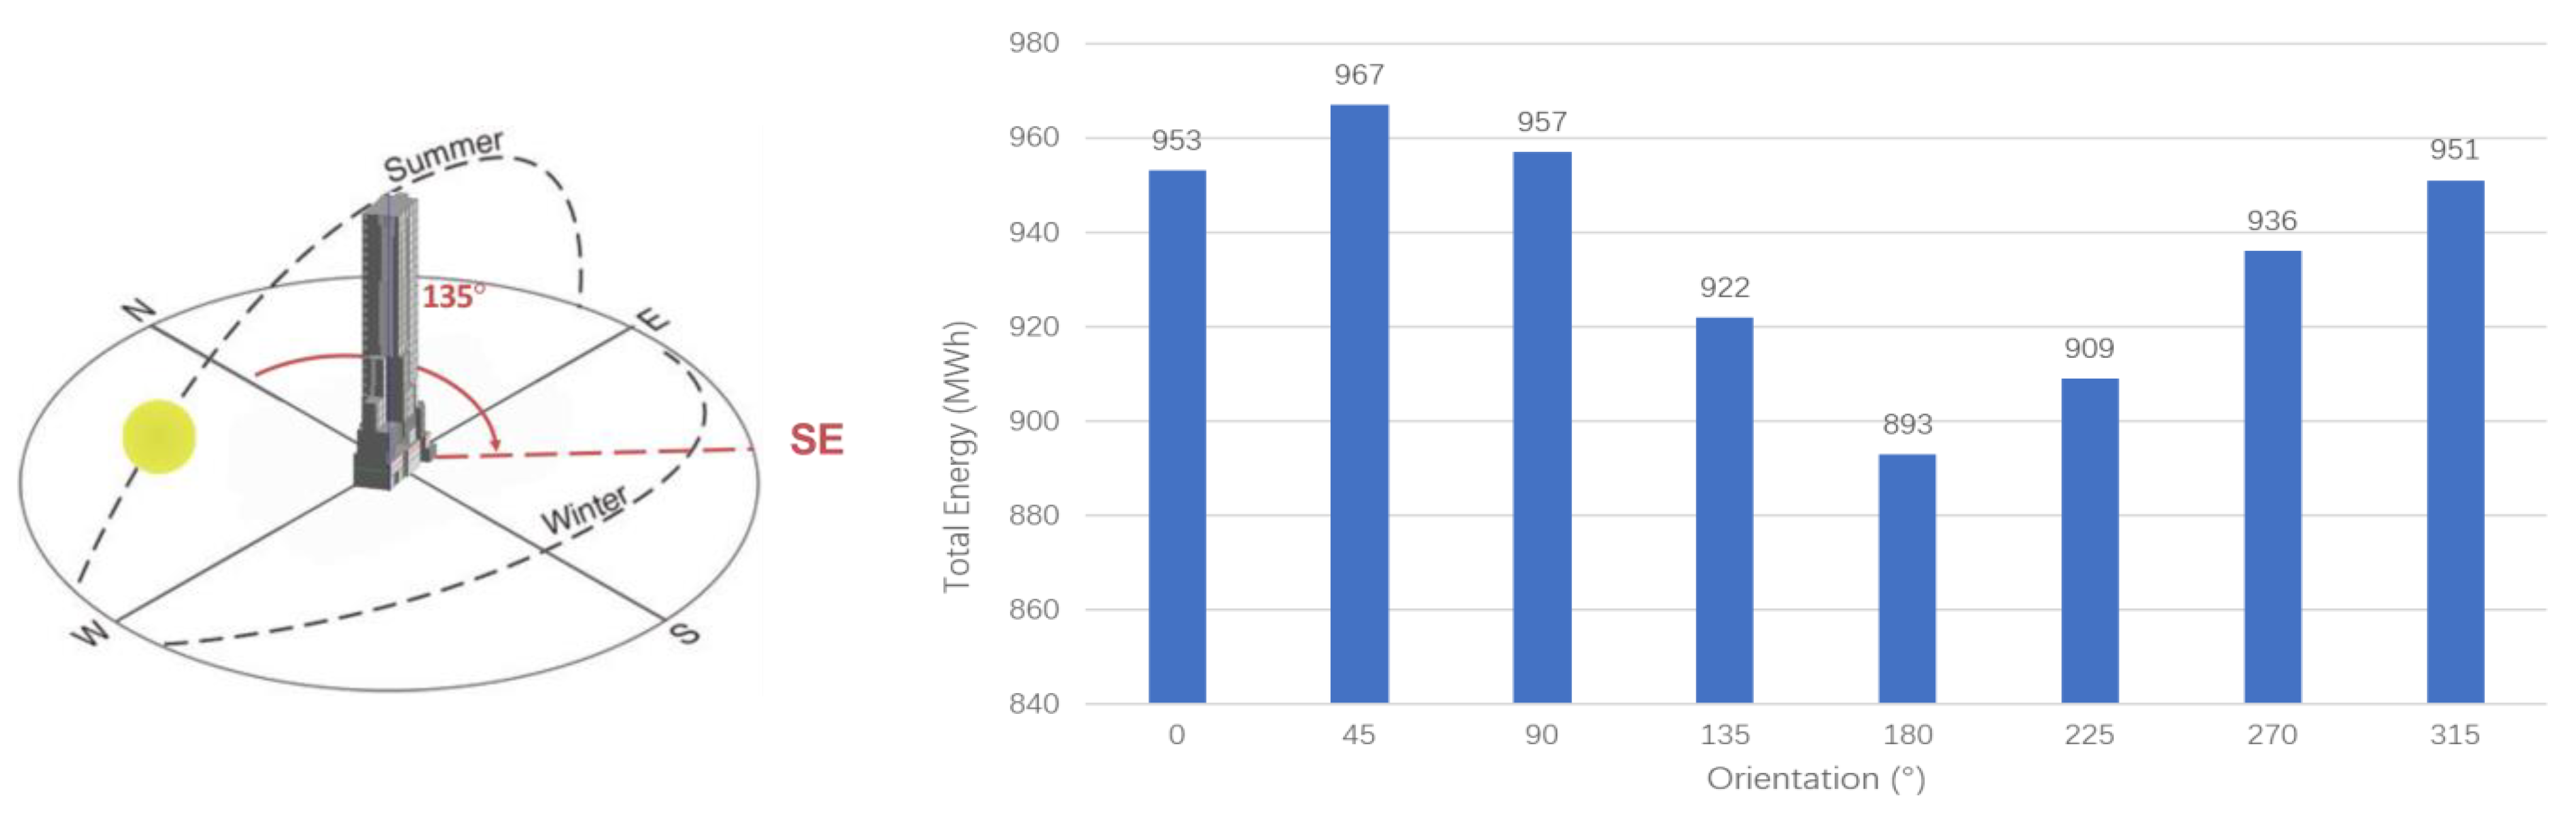
- Spatial planning refers to the different space usages defined for each room in the building. It also includes each building’s floor layout and space organisation. It involves optimising space for different functions to meet the various requirements of the stakeholders. Additionally, building orientations play a big part in building energy consumption, as a building can attain energy savings by maximising daylighting and minimising heat gain.
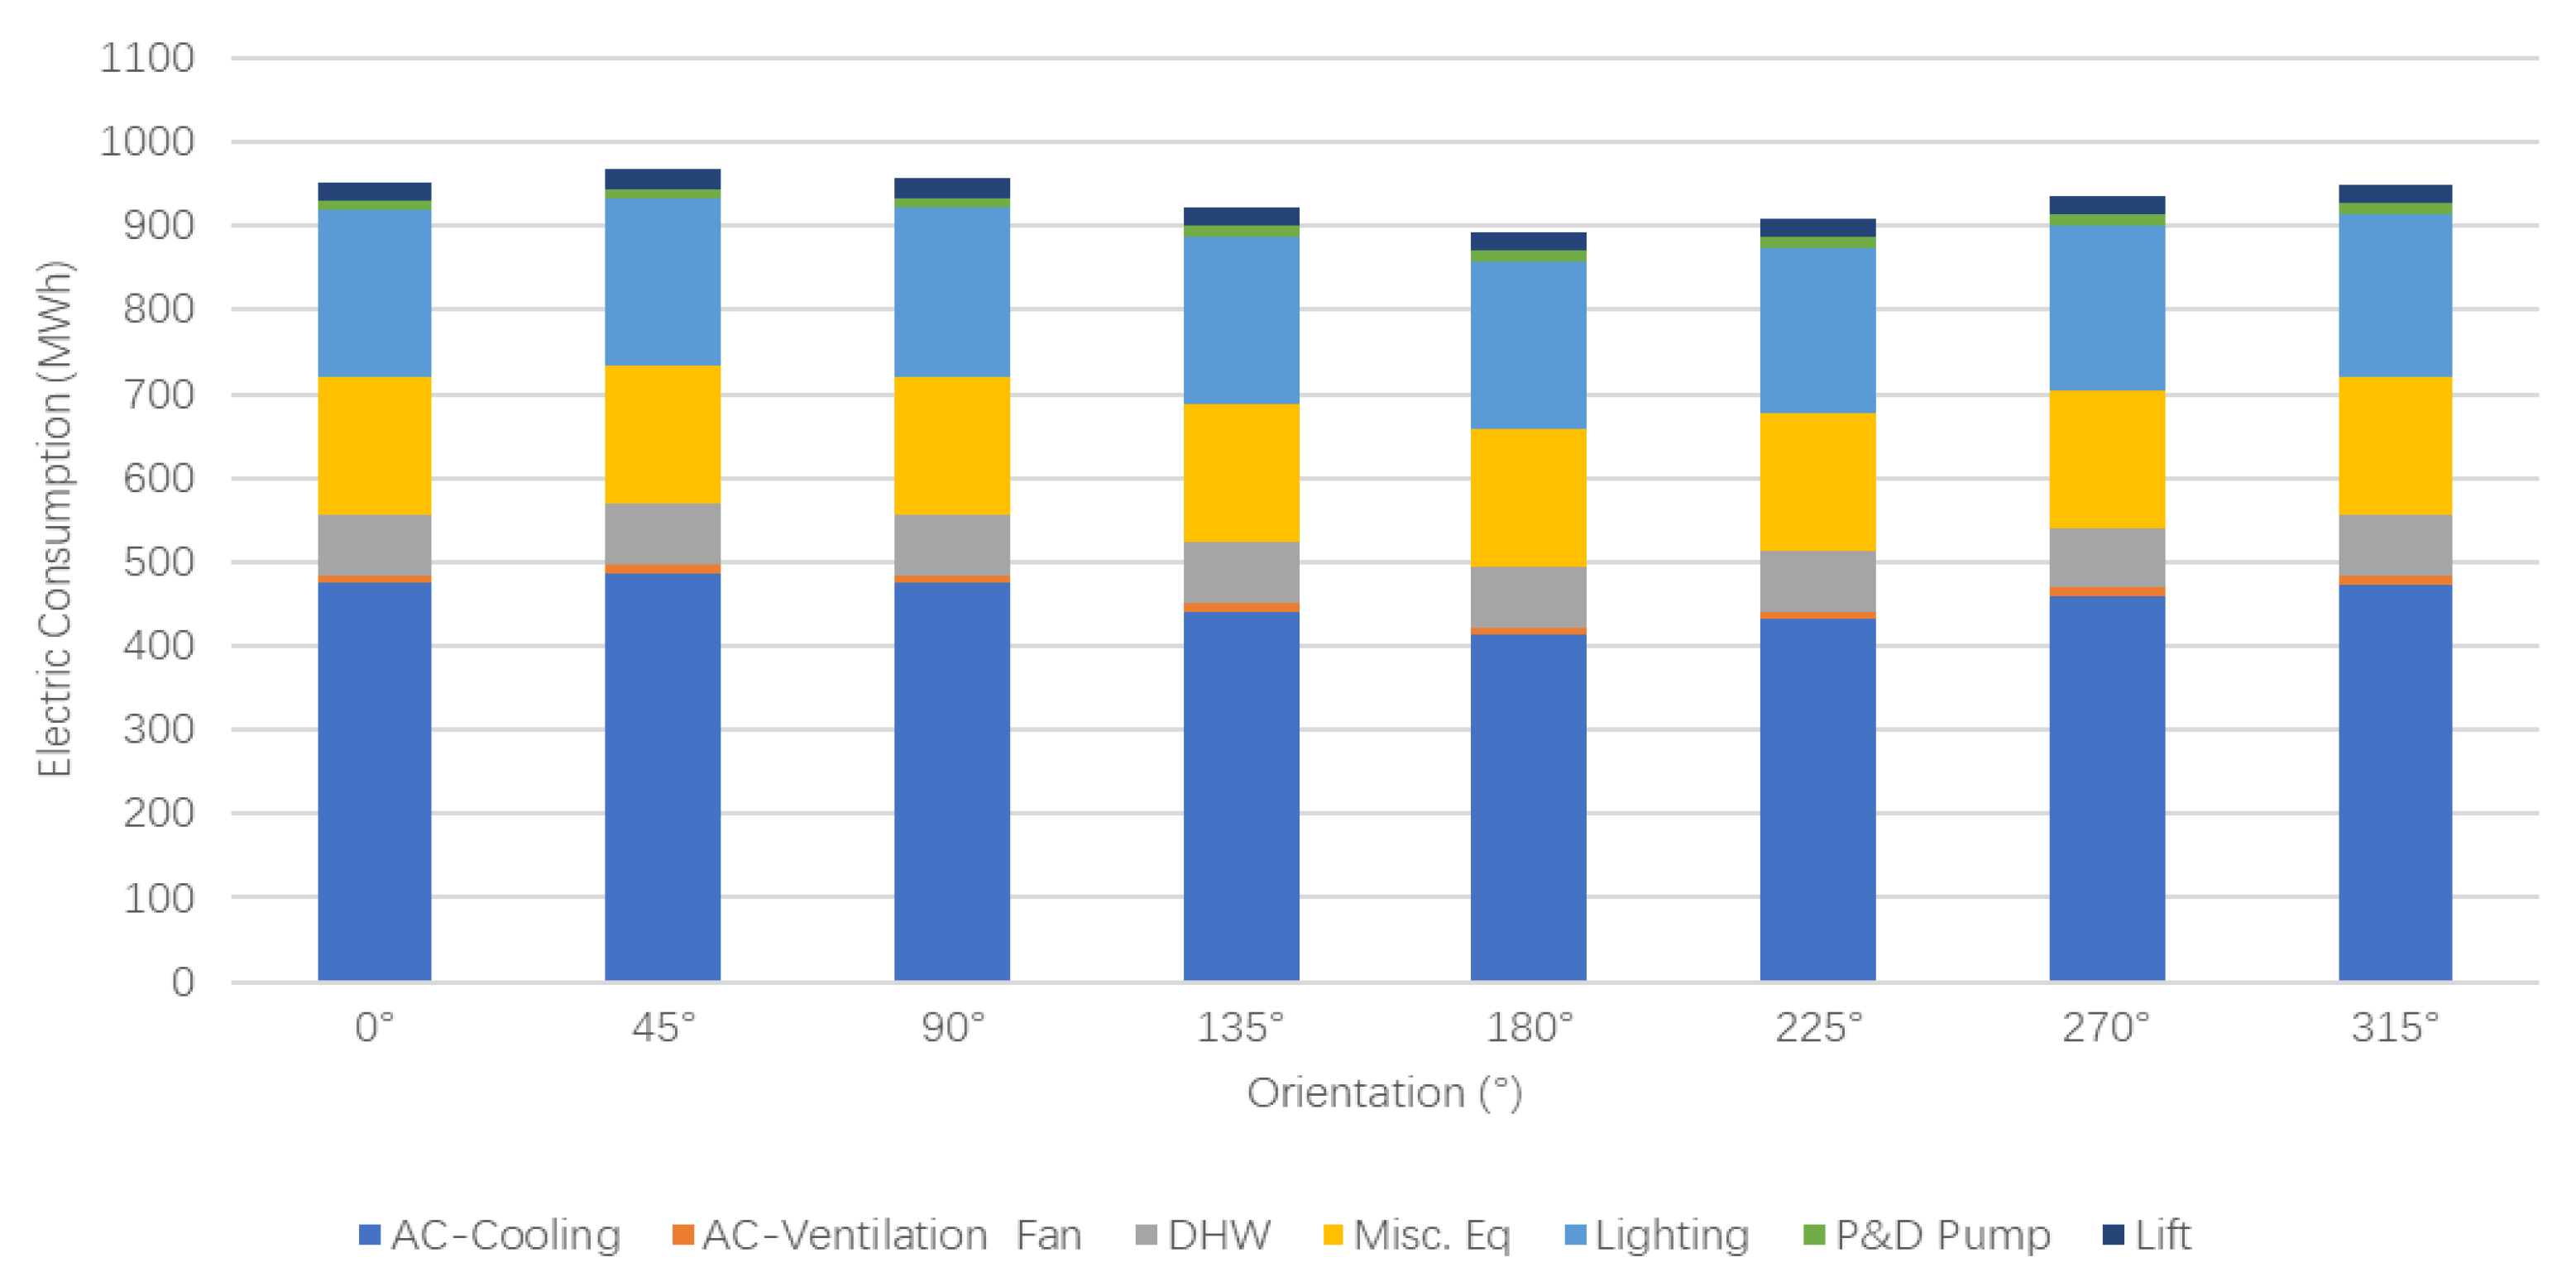
- Building usage pattern mainly refers to the varying demand of energy consumption parameters from HVAC systems, lighting, miscellaneous equipment, domestic hot water consumption, etc. in the building. For HVAC systems, it refers to the type of cooling system such as a VRF system or split AC system. It also takes into consideration ventilation-related parameters such as the rate of airflow. For a lighting system, the type of lighting, its fixture, and lux value are essential, influential factors affecting energy consumption. Regarding miscellaneous equipment, the electrical load of each piece and the heat emitted from the equipment can affect energy consumption.
2.2.2. Parametric BIM
2.2.3. Interoperable Exchange between BIM and Energy Simulation
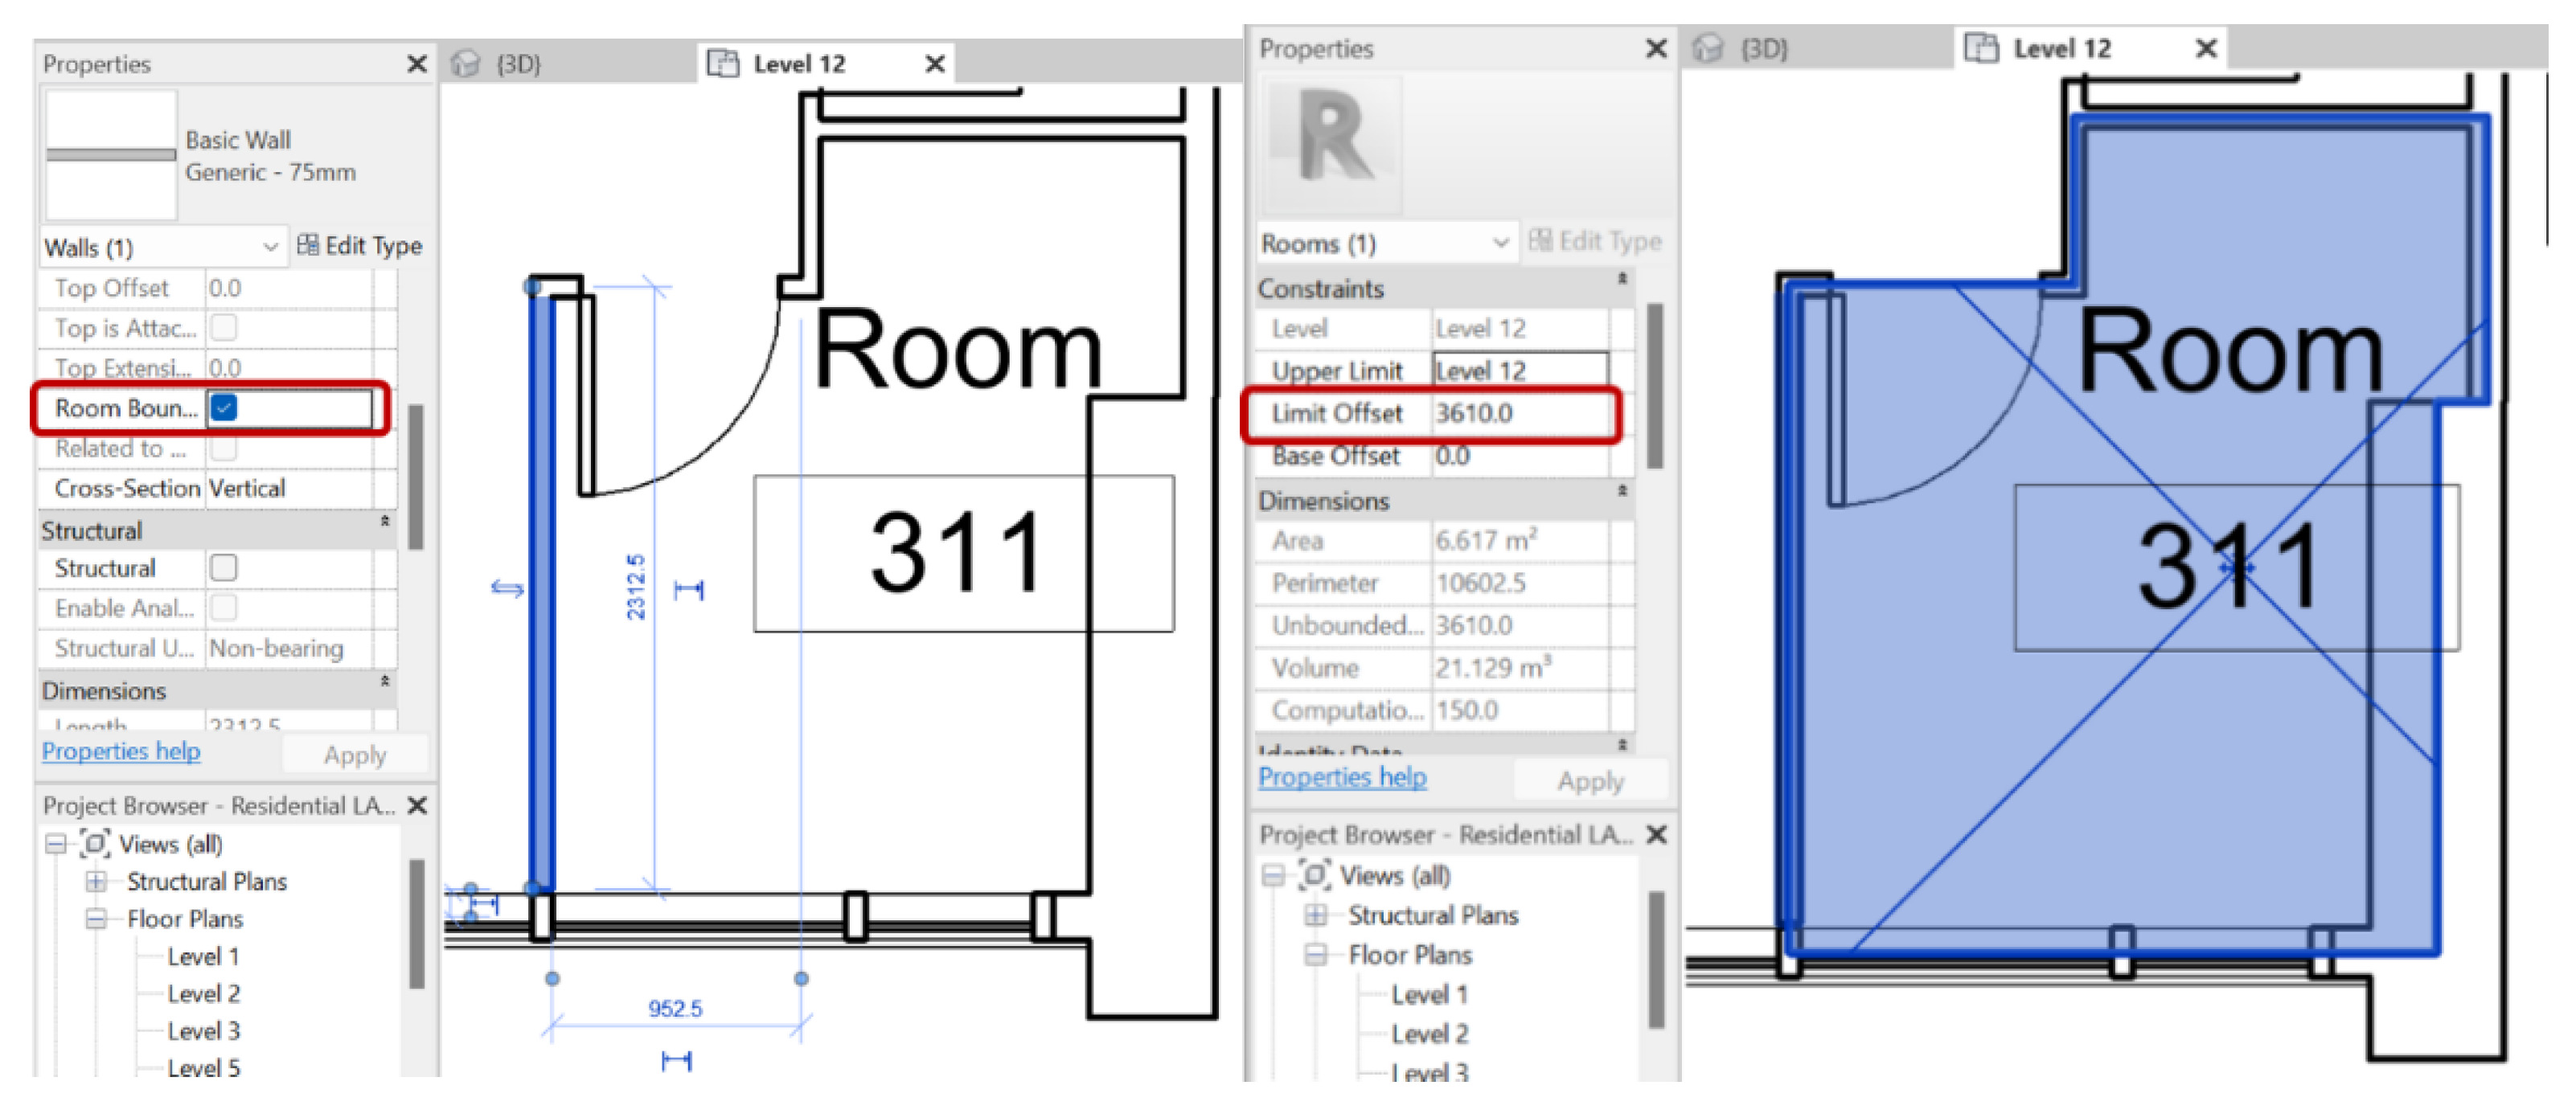
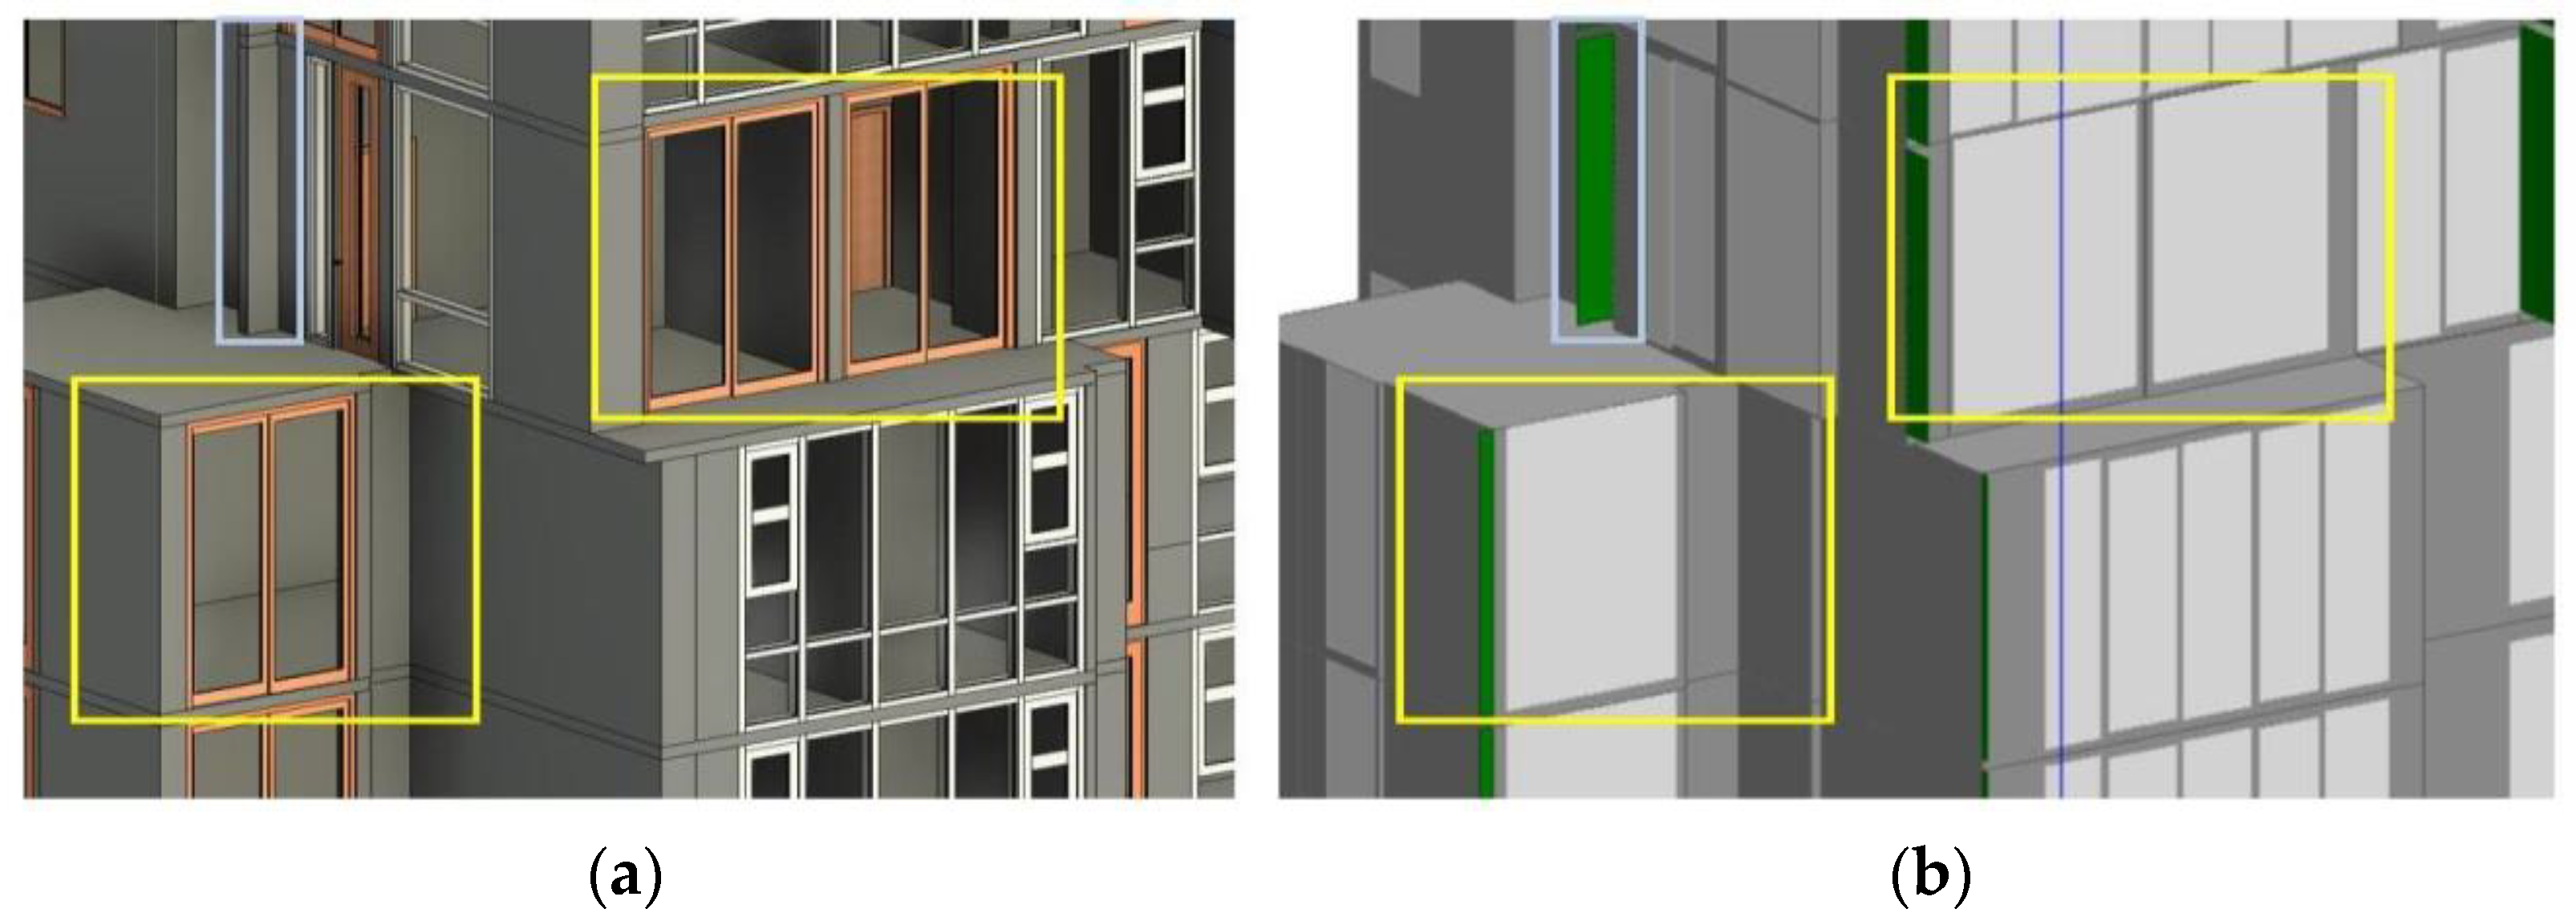
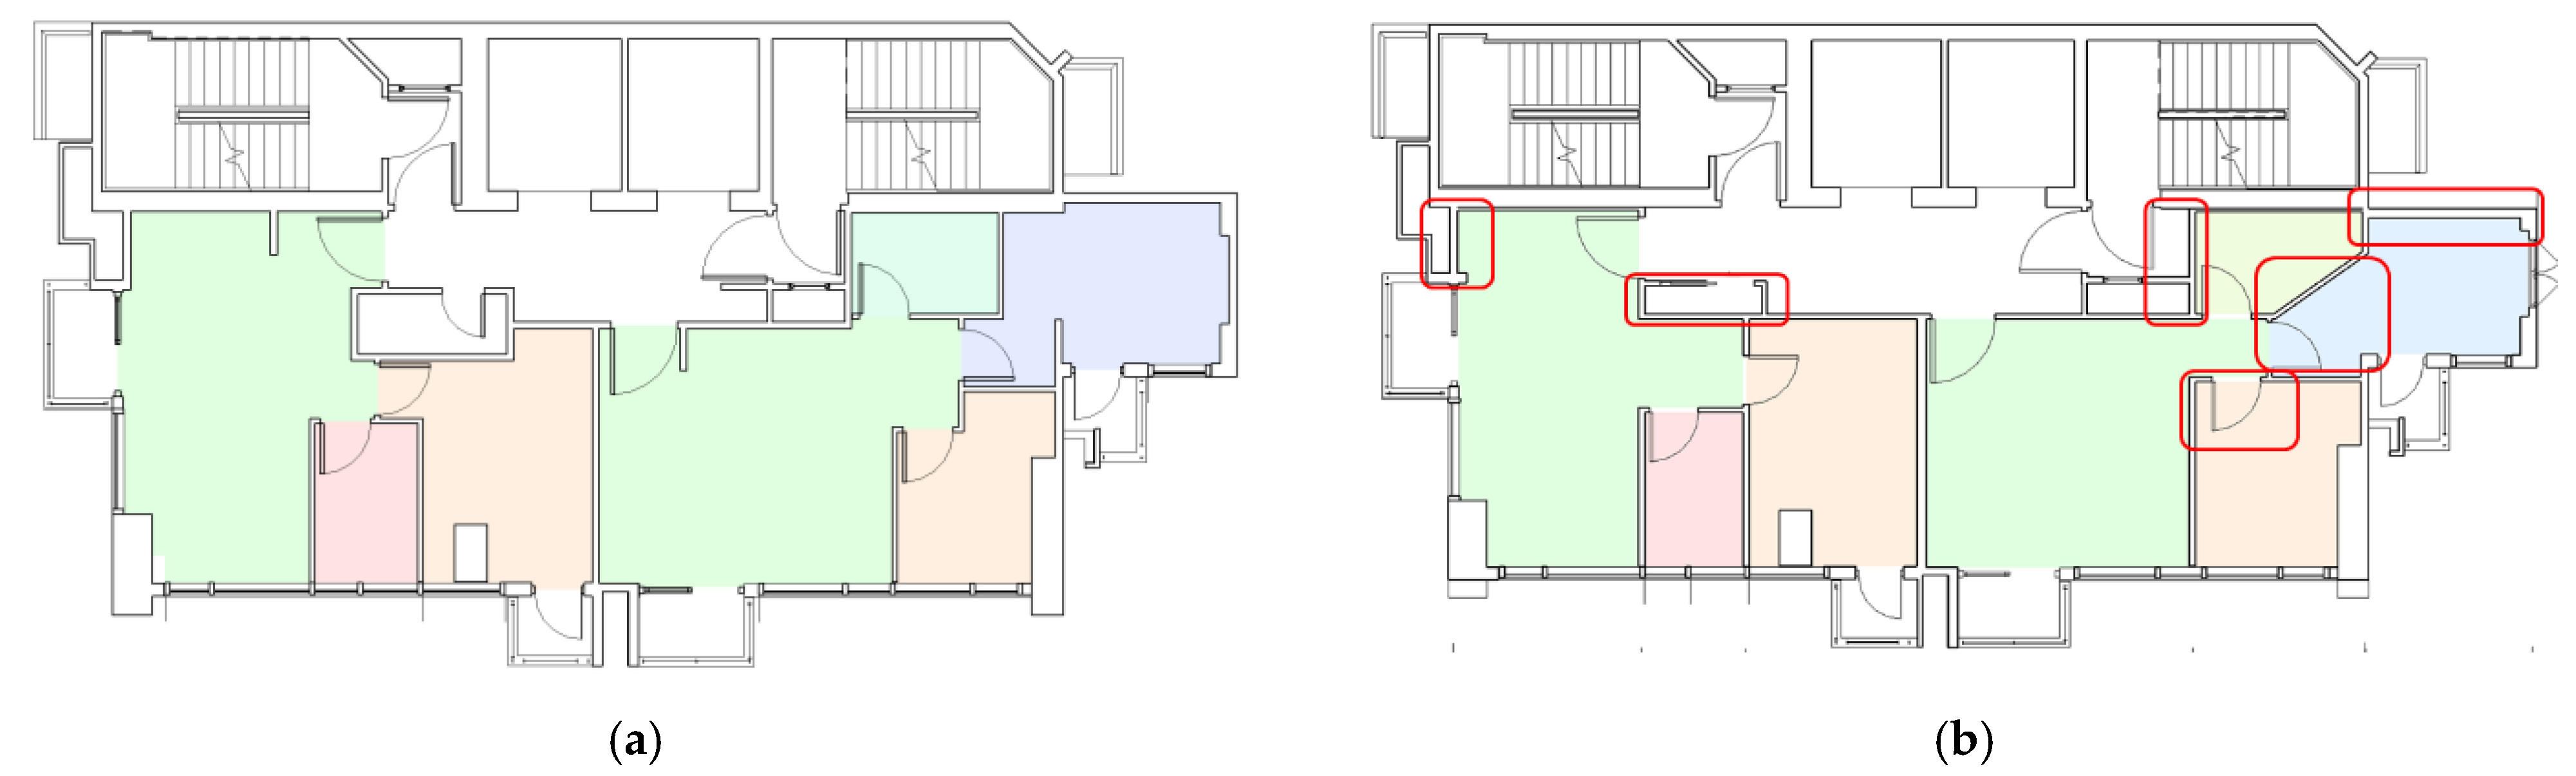
- Firstly, rectifying incompatible and missing elements and redefining parameters are performed to recover data lost through the transfer. There are glasses modelled in BIM along the external façade, but they could not be detected as a transparent element in energy simulation because they are opaque. Such glazed elements are remodelled using the window functions to retain their properties, as highlighted in Figure 4. There are also green shadings after importing BIM models. Some of the green shadings appeared to reflect architectural elements that are hanging and do not take part in forming the model enclosure, making them dispensable in energy simulation. This discrepancy is due to the inability of energy simulation to identify thin elements with zero thickness. The green shadings can be eliminated by removing the BIM element.
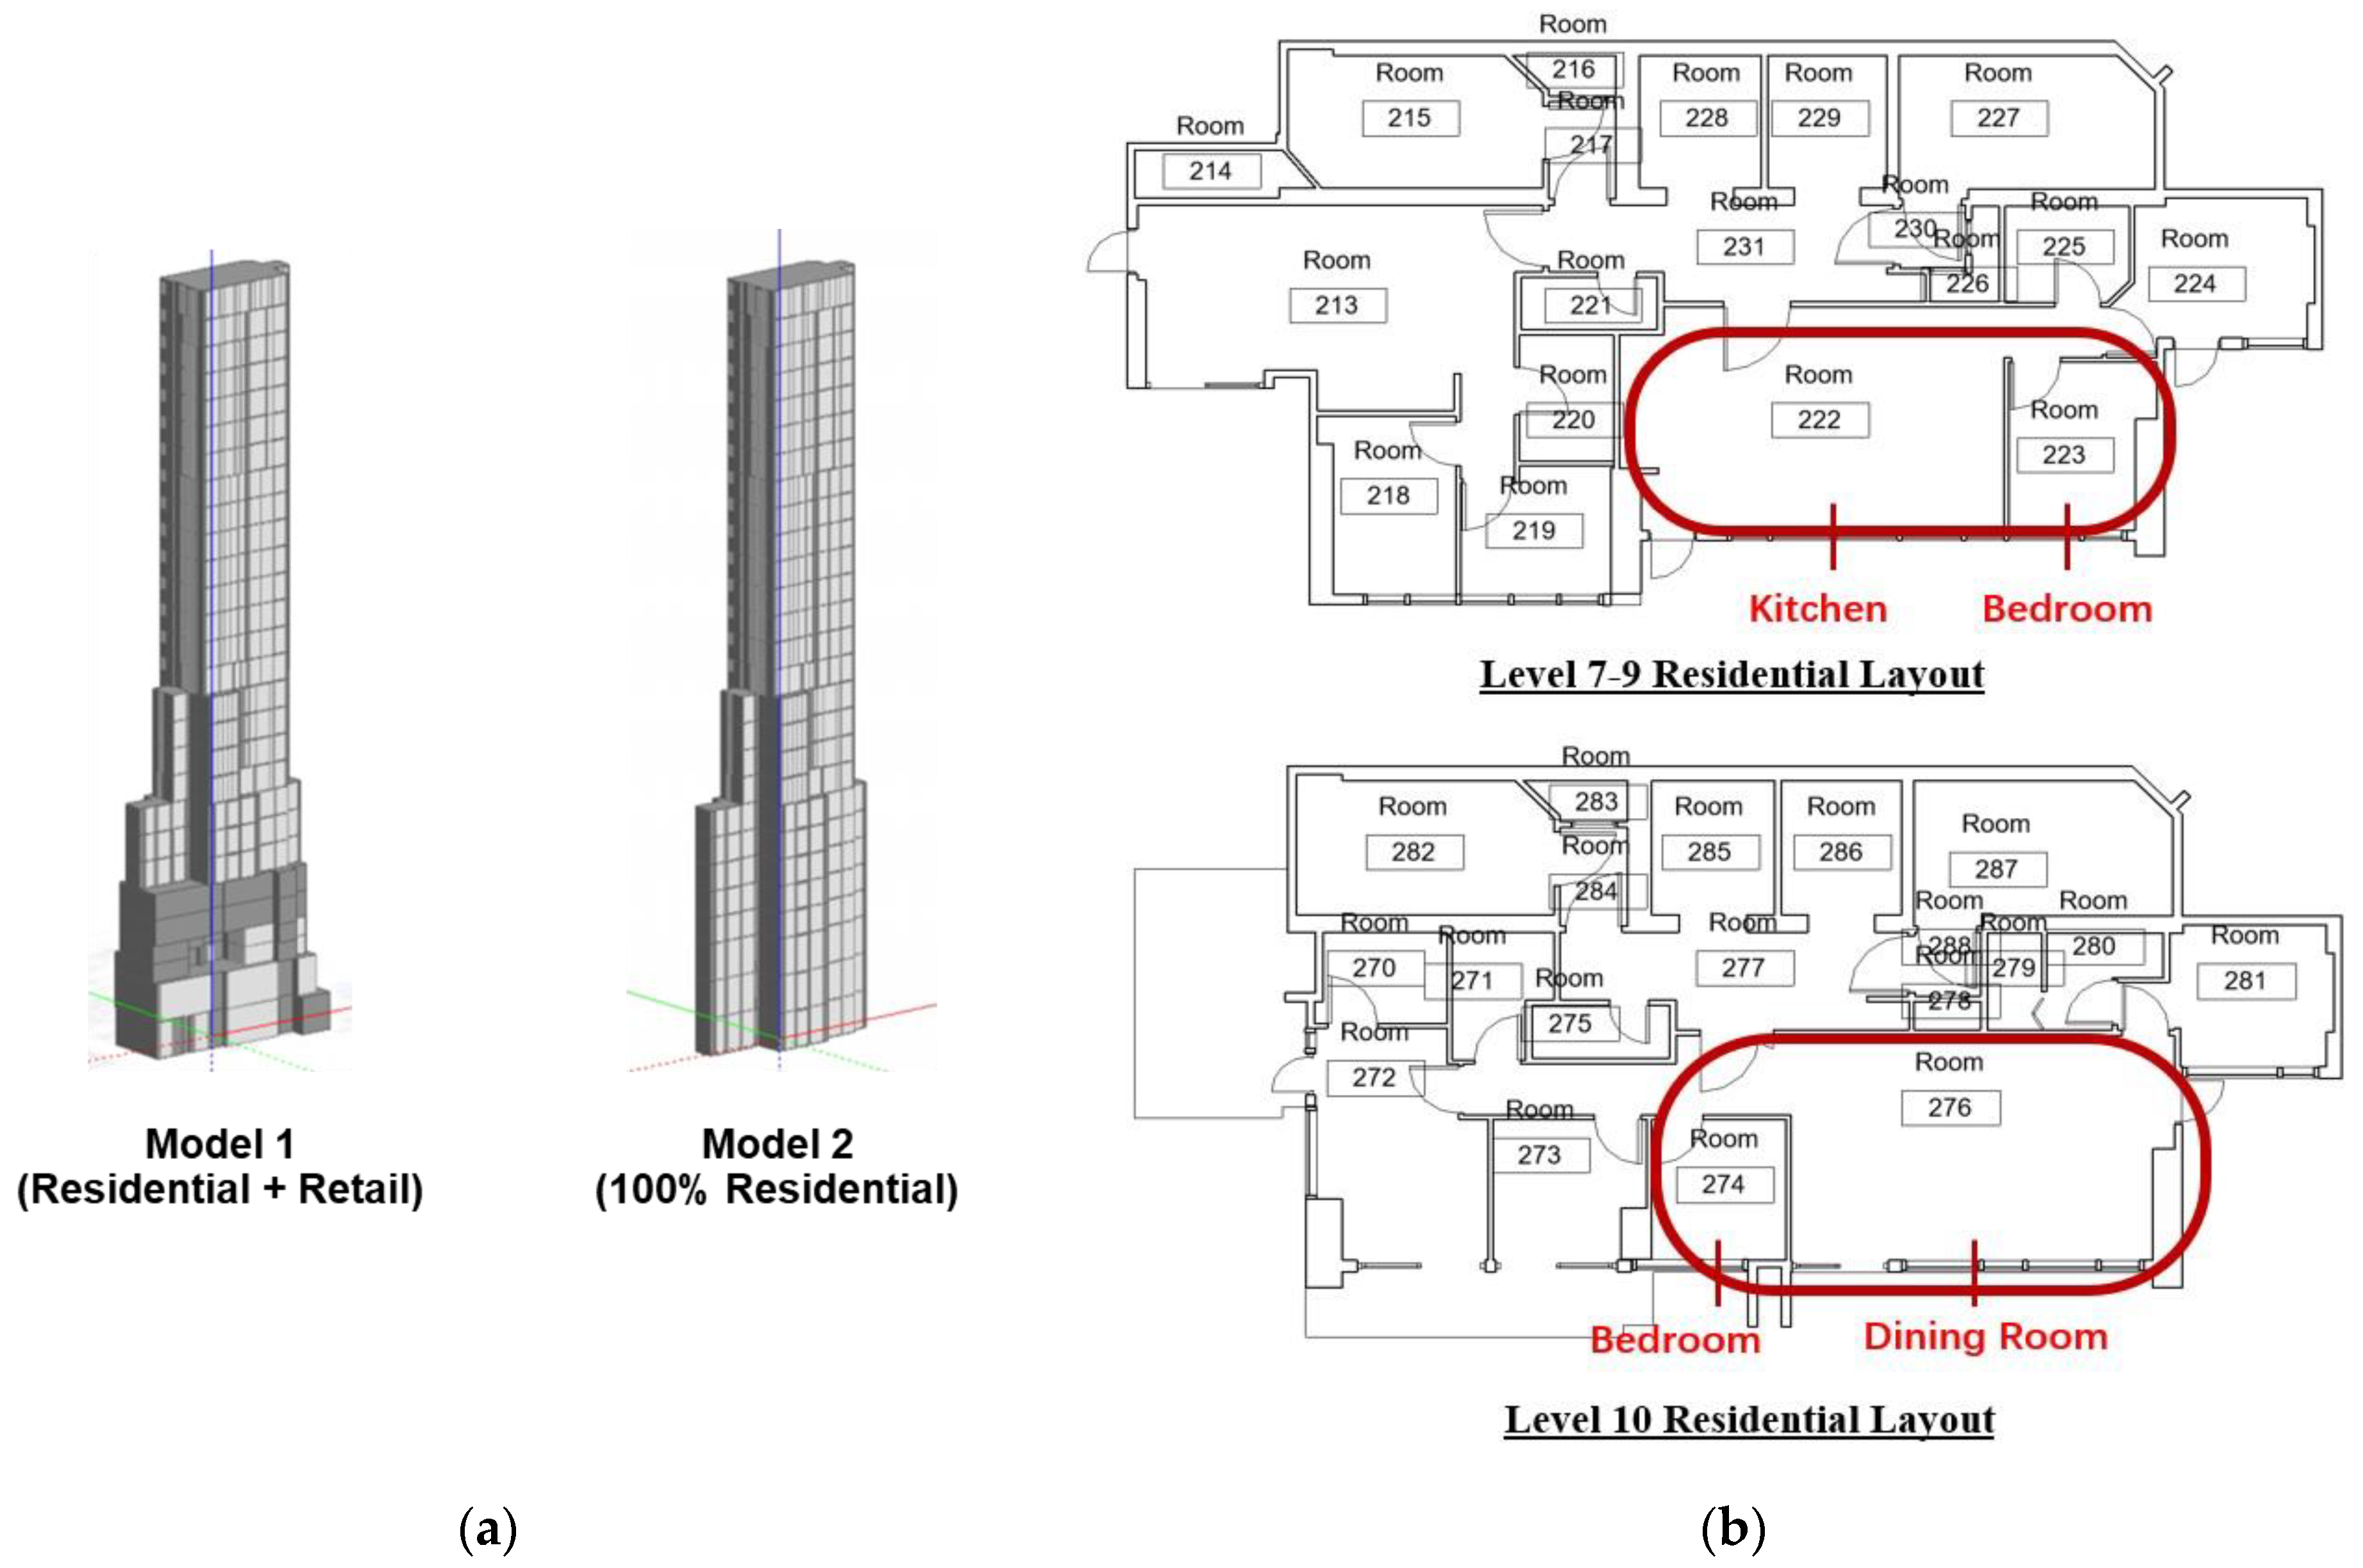
- Secondly, direct remodelling is carried out in the energy simulation software to minimise the risk of data loss and interoperability issues during the data transfer. This is essentially carried out by adding and removing Model 1 to regenerate the full-residential Model 2. For example, LG, G, and Level 1 have heights of 5010 mm, Levels 2 to 25 have heights of 3160 mm, and Level 25 to the roof has a height of 4000 mm. The total height of the model adds up to around 102,010 mm. Elements in Model 2 need to be modified in energy simulation software, and then each room in the model is zoned to include the residential features. Then, the building usage parameters are loaded to obtain the completed analytical model.

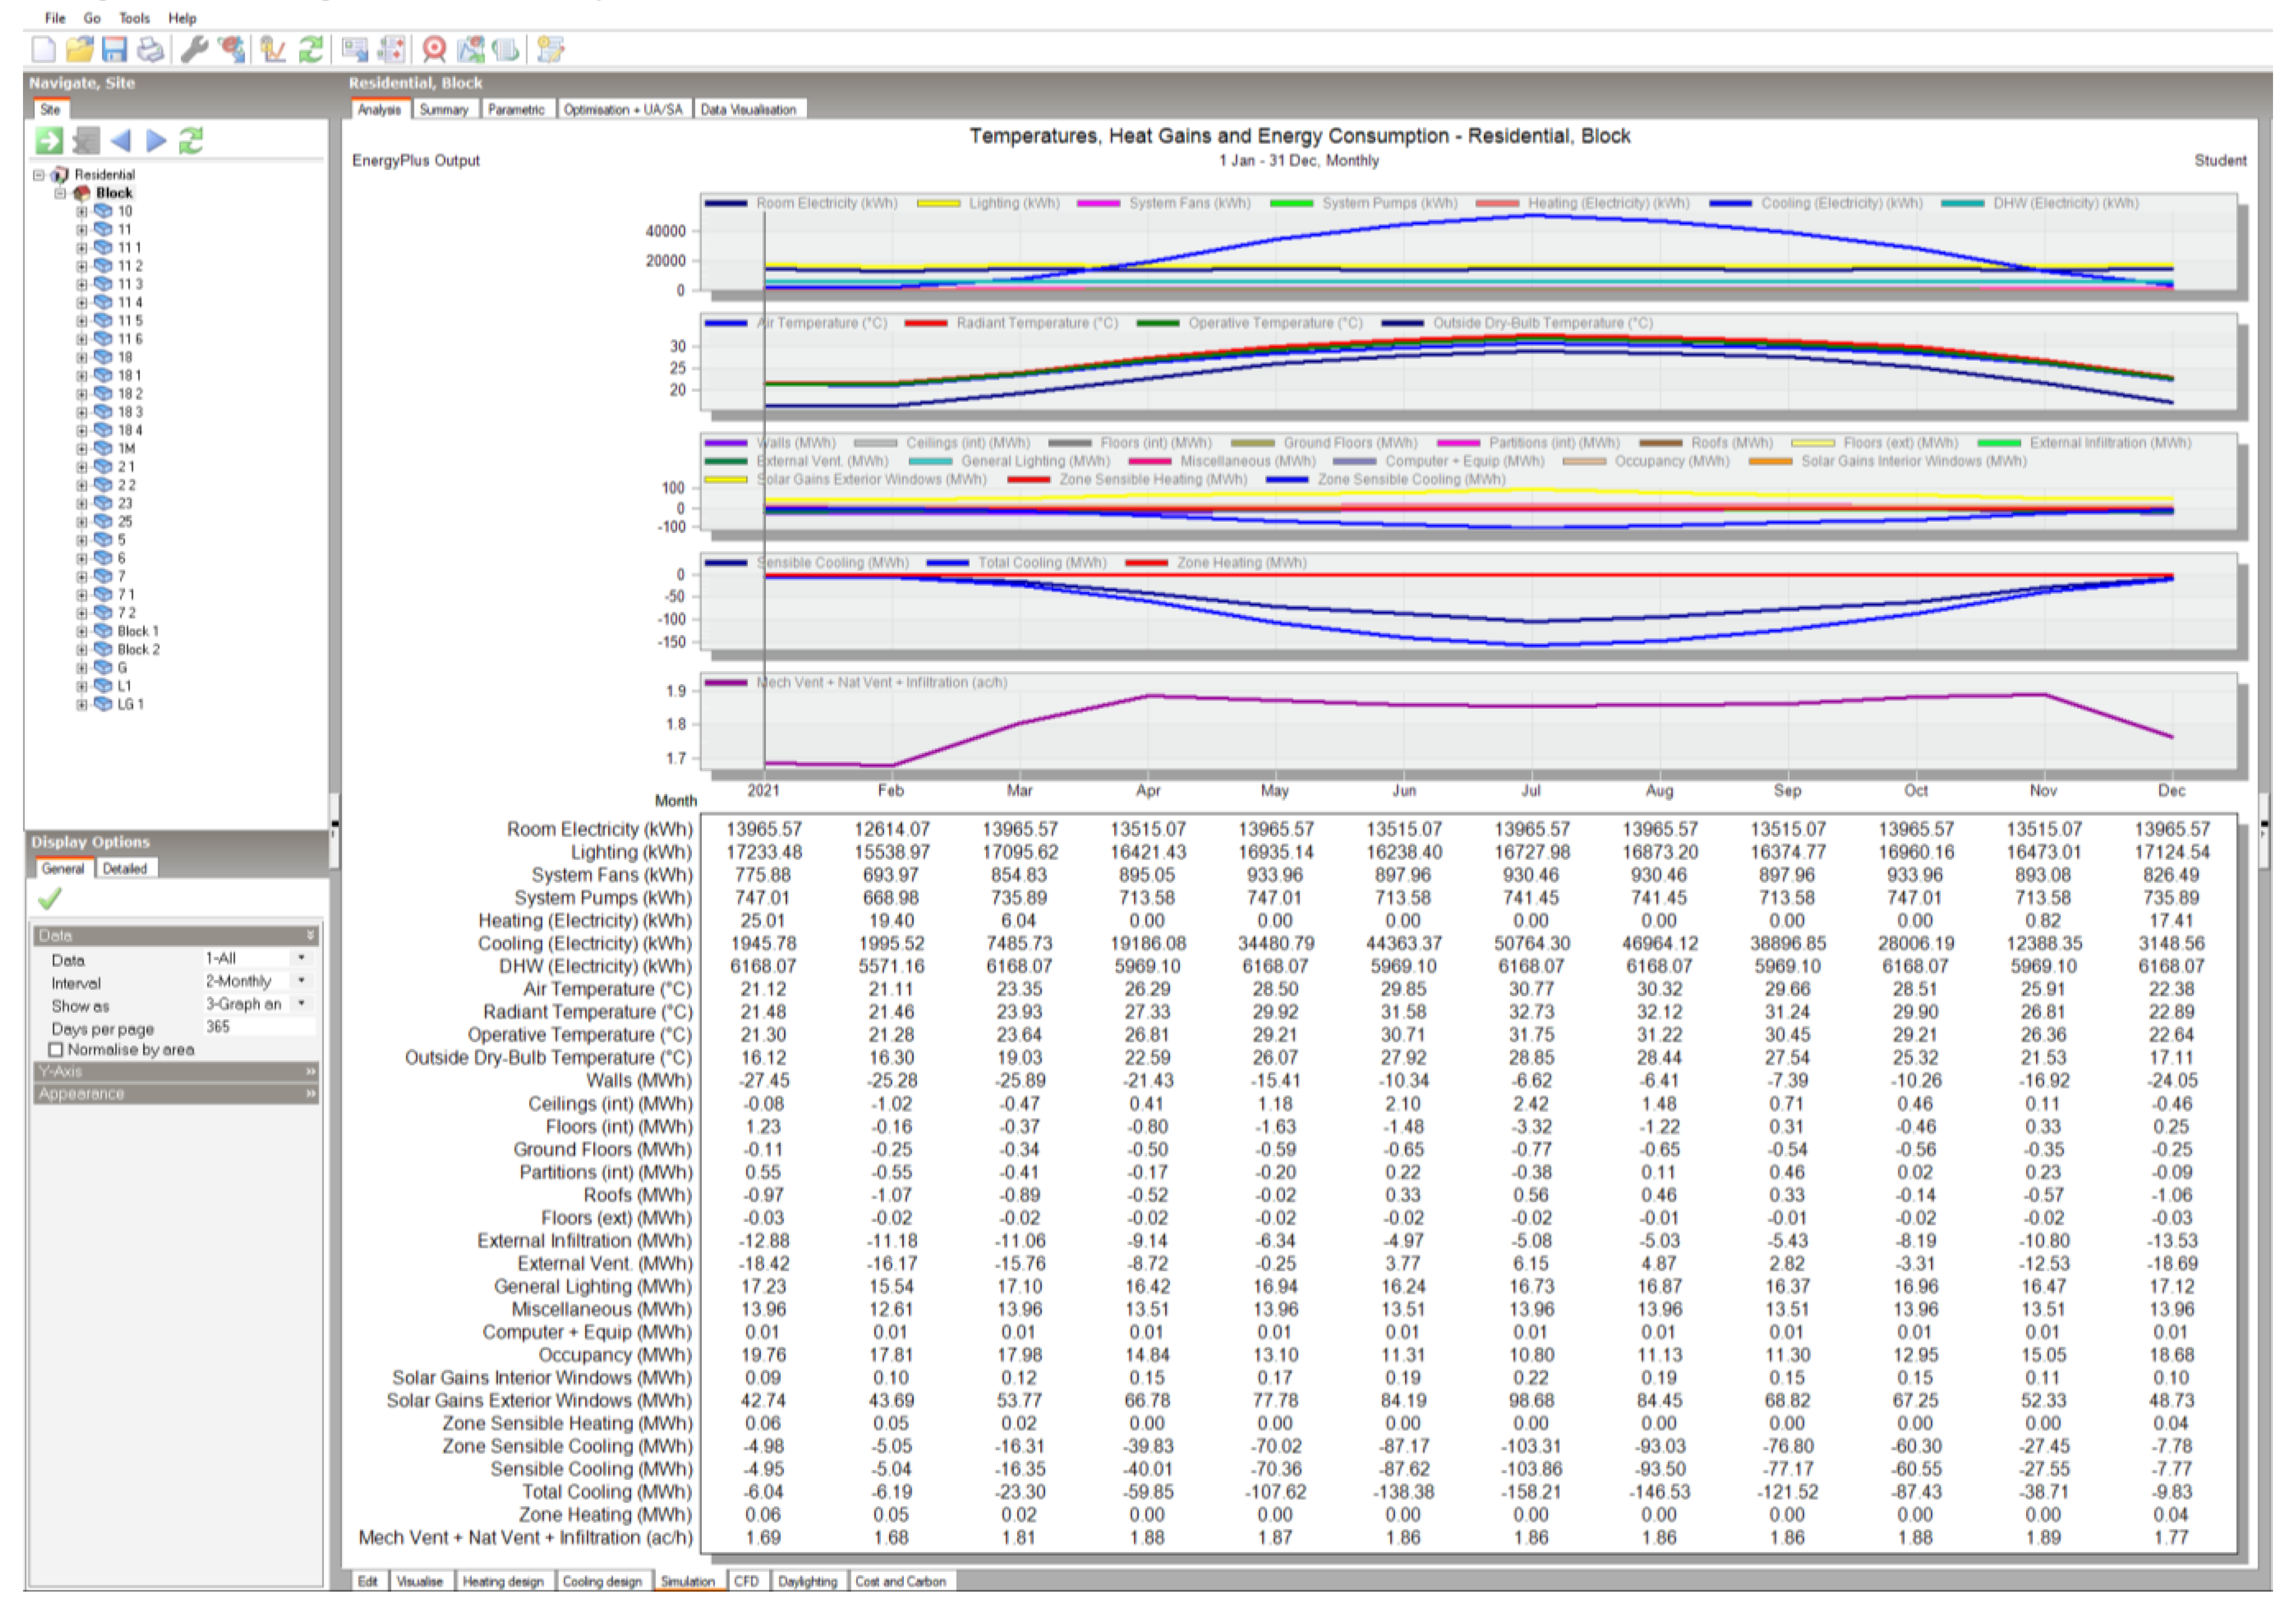
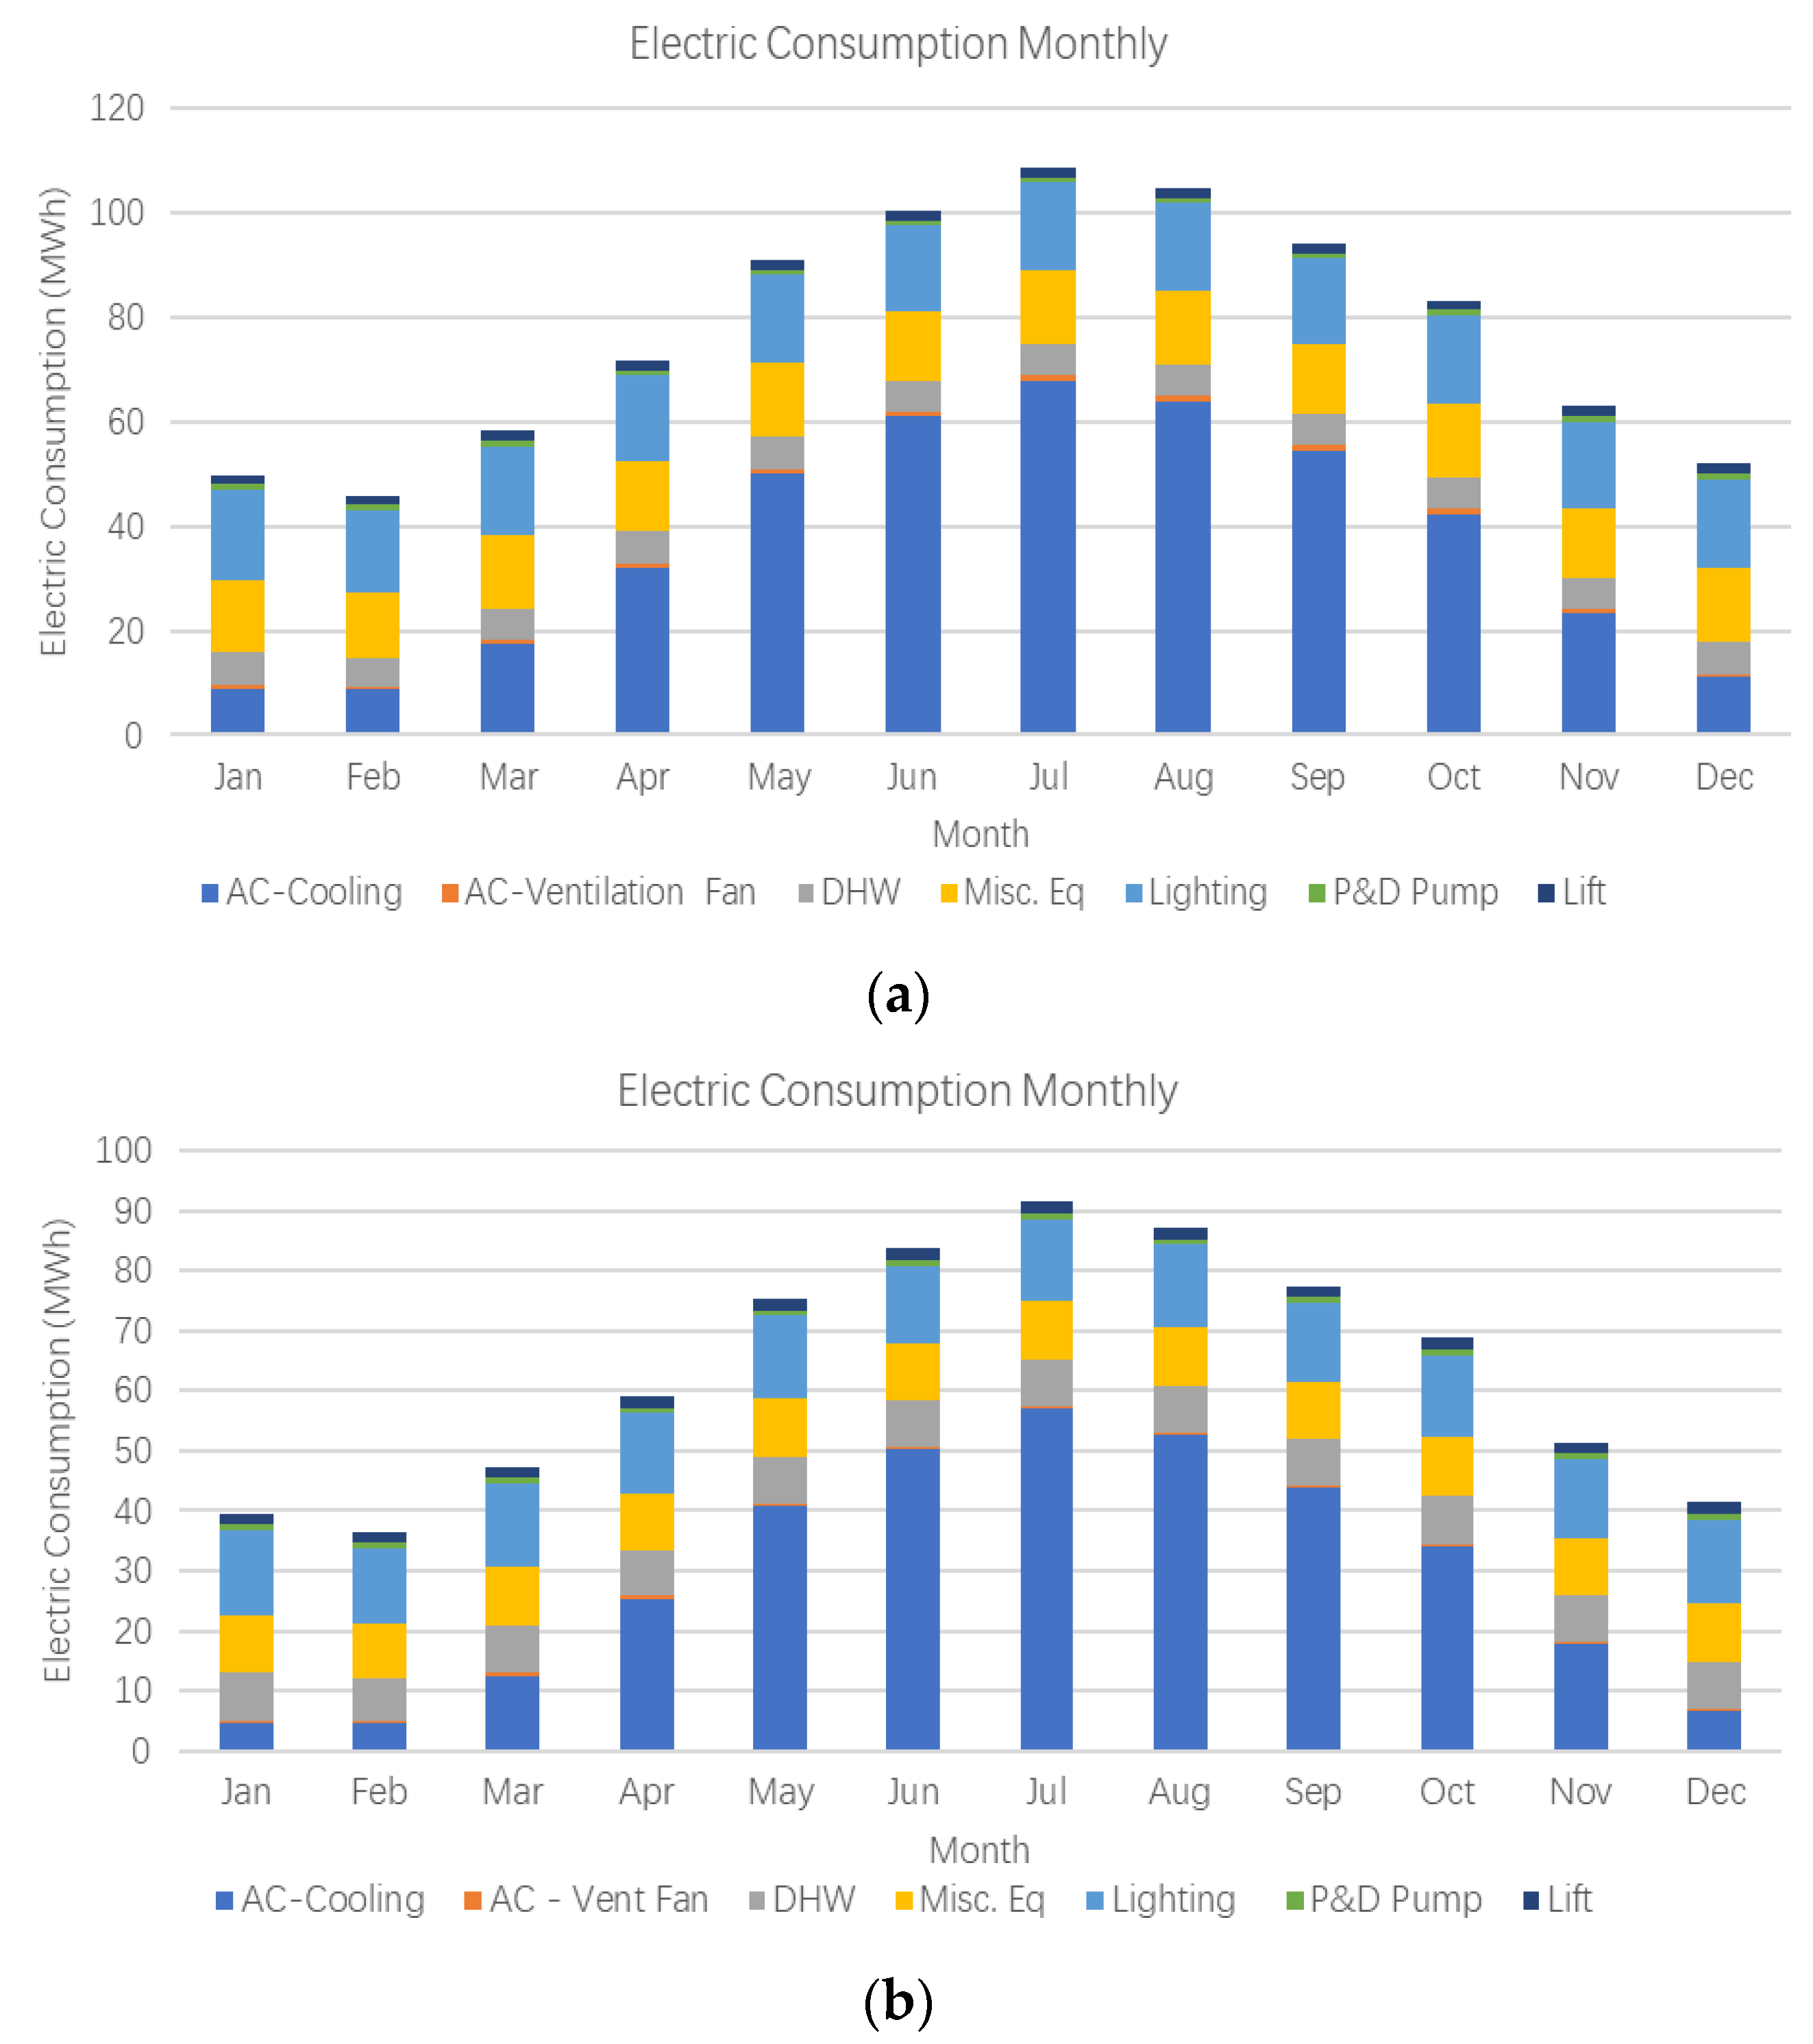
2.2.4. BIM-Based Energy Simulations
2.2.5. Operational Carbon Calculation Considering Climate Action Plan
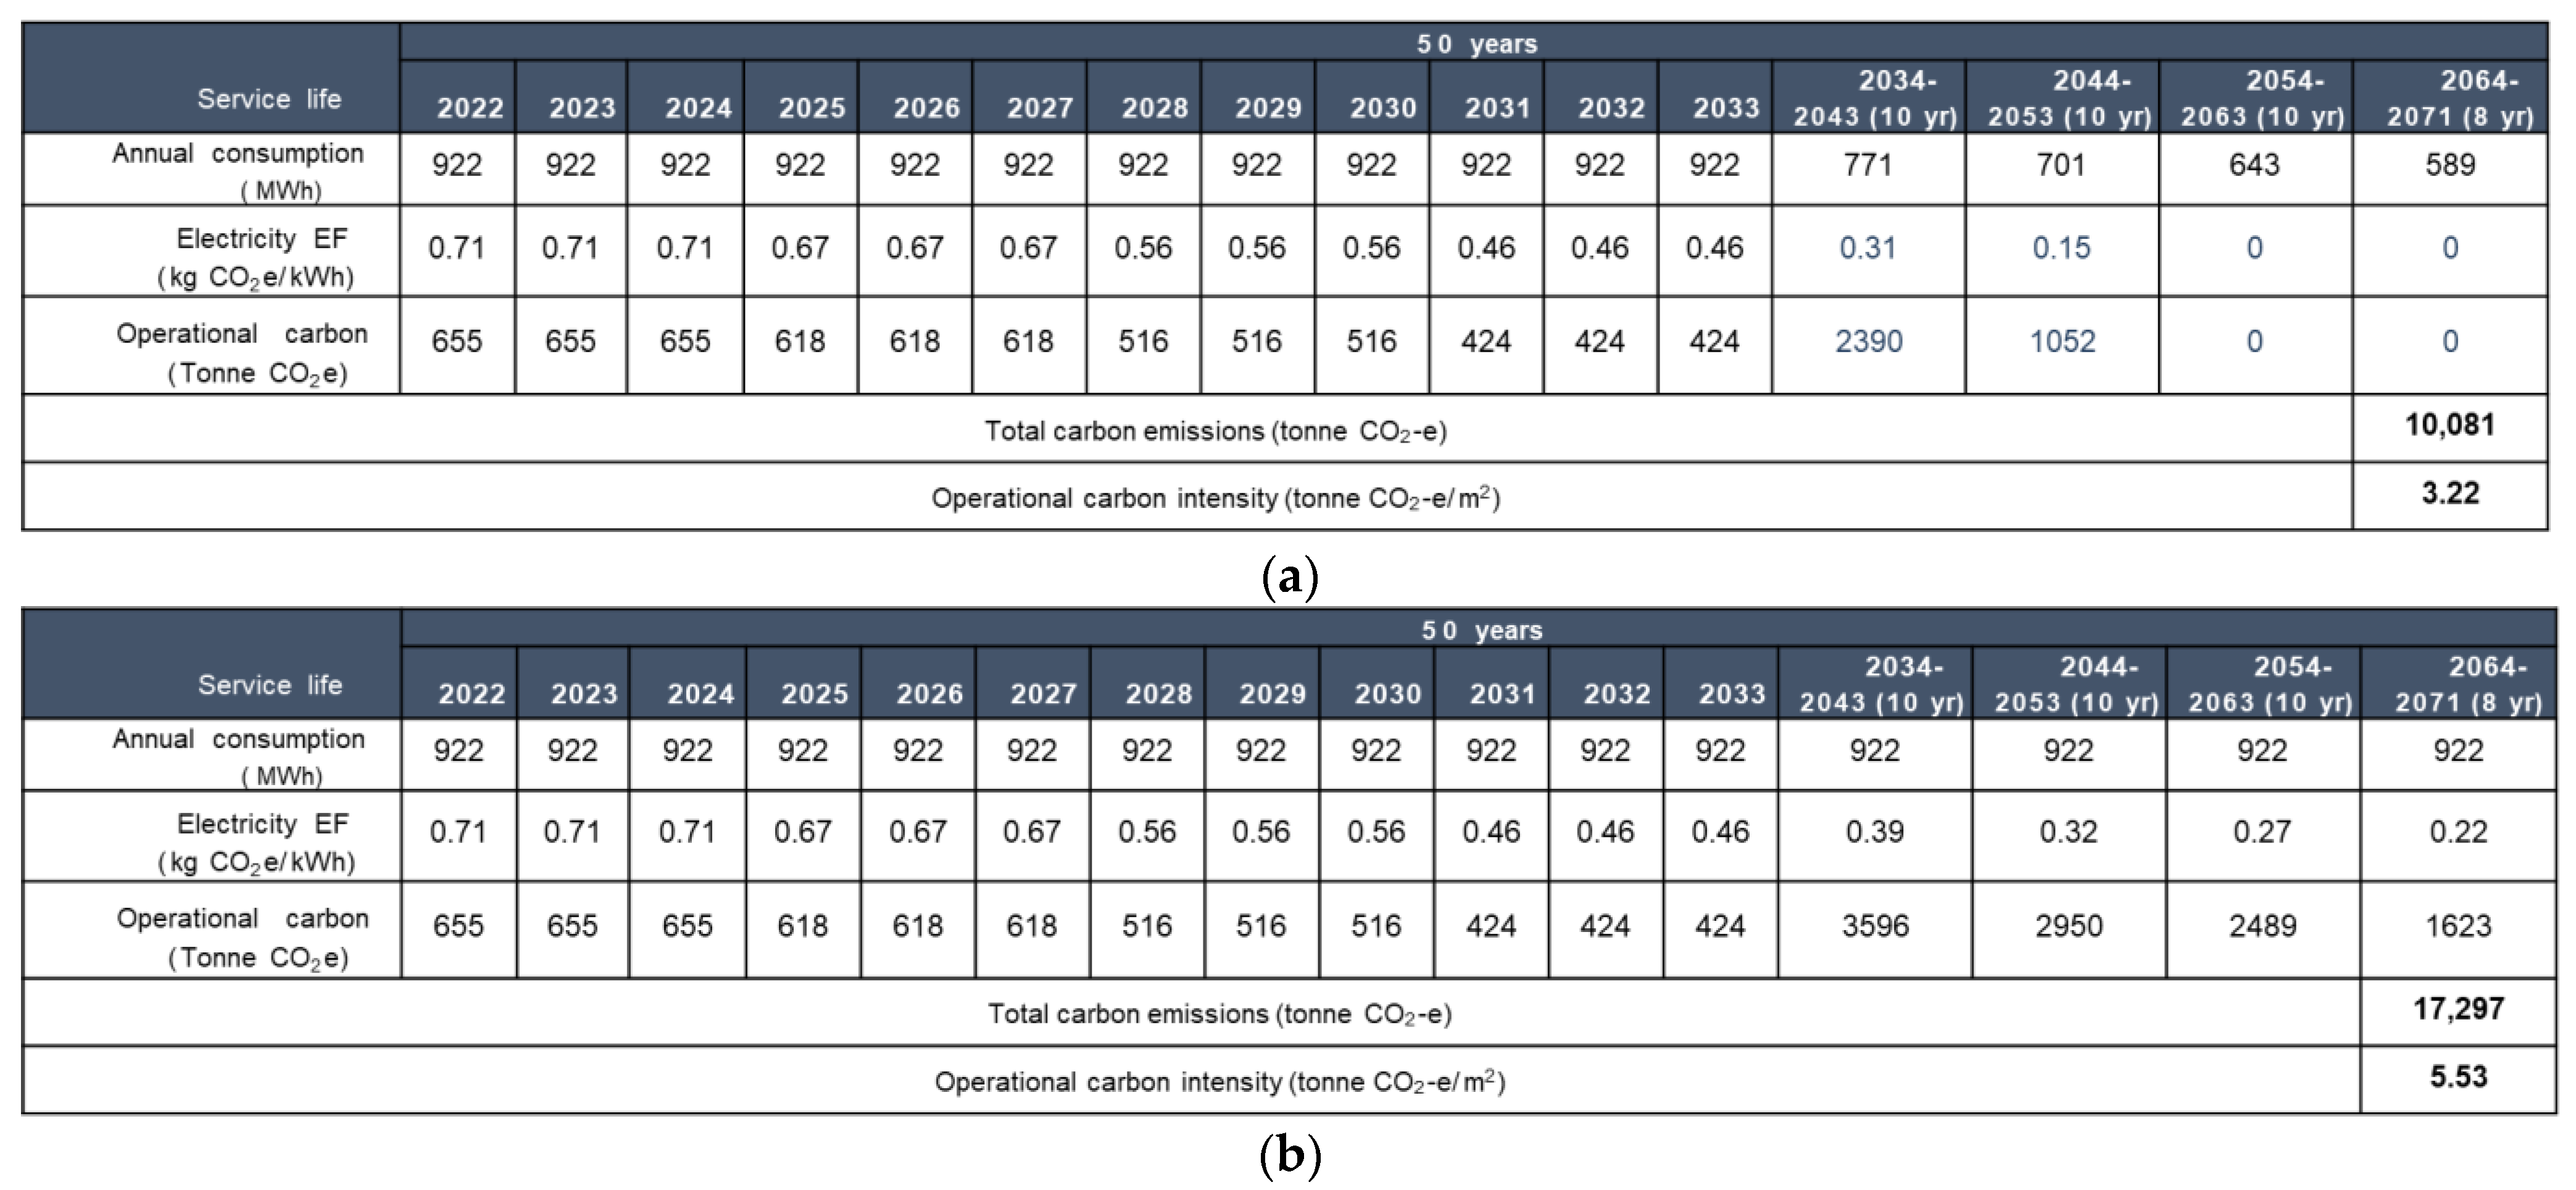
- 1.5 °C Net-Zero World Scenario: a world where global warming is limited to 1.5 °C through stringent climate policies, innovation, and demand-led change reaching global net-zero CO2 emissions around 2050. This assumes that energy consumption in each decade will continue to reduce due to the technological advancement of HVAC systems. For example, the COP for HVAC will improve by around 15% per decade to meet Hong Kong’s Climate Action Plan 2050 of the Hong Kong government. In addition, it is assumed under this modelled scenario that Hong Kong Electric will achieve 100% gas-fired electricity output in the next decade (by 2033). The electricity emission factor is expected to be reduced from 0.71 kg CO2-e/kWh (2022) to 0.46 kg CO2-e/kWh (2033), and it is assumed to further reduce with a linear progression to reach net zero in 2050 thereafter.
- 3 °C Hot House World Scenario: a scenario that represents a world where no additional action is taken beyond the current policies that are in place. There will be insufficient technological investment in low-emission technologies and a continued reliance on carbon-intensive technologies to fuel growth. This assumes that the energy consumption level will stay unchanged after 2034 without any improvement. In addition, it is assumed under this modelled scenario that Hong Kong Electric will achieve 100% gas-fired electricity output in the next decade (by 2033). The electricity emission factor will be reduced from 0.71 kg CO2-e/kWh (2022) to 0.46 kg CO2-e/kWh (2033). It is assumed that the electricity emission factor will further improve and continue to drop by 15% per decade to meet the tightened HK’s 2050 Climate Action Plan.
3. Optimisation for Lifecycle Carbon Mitigation
3.1. Architectural Design
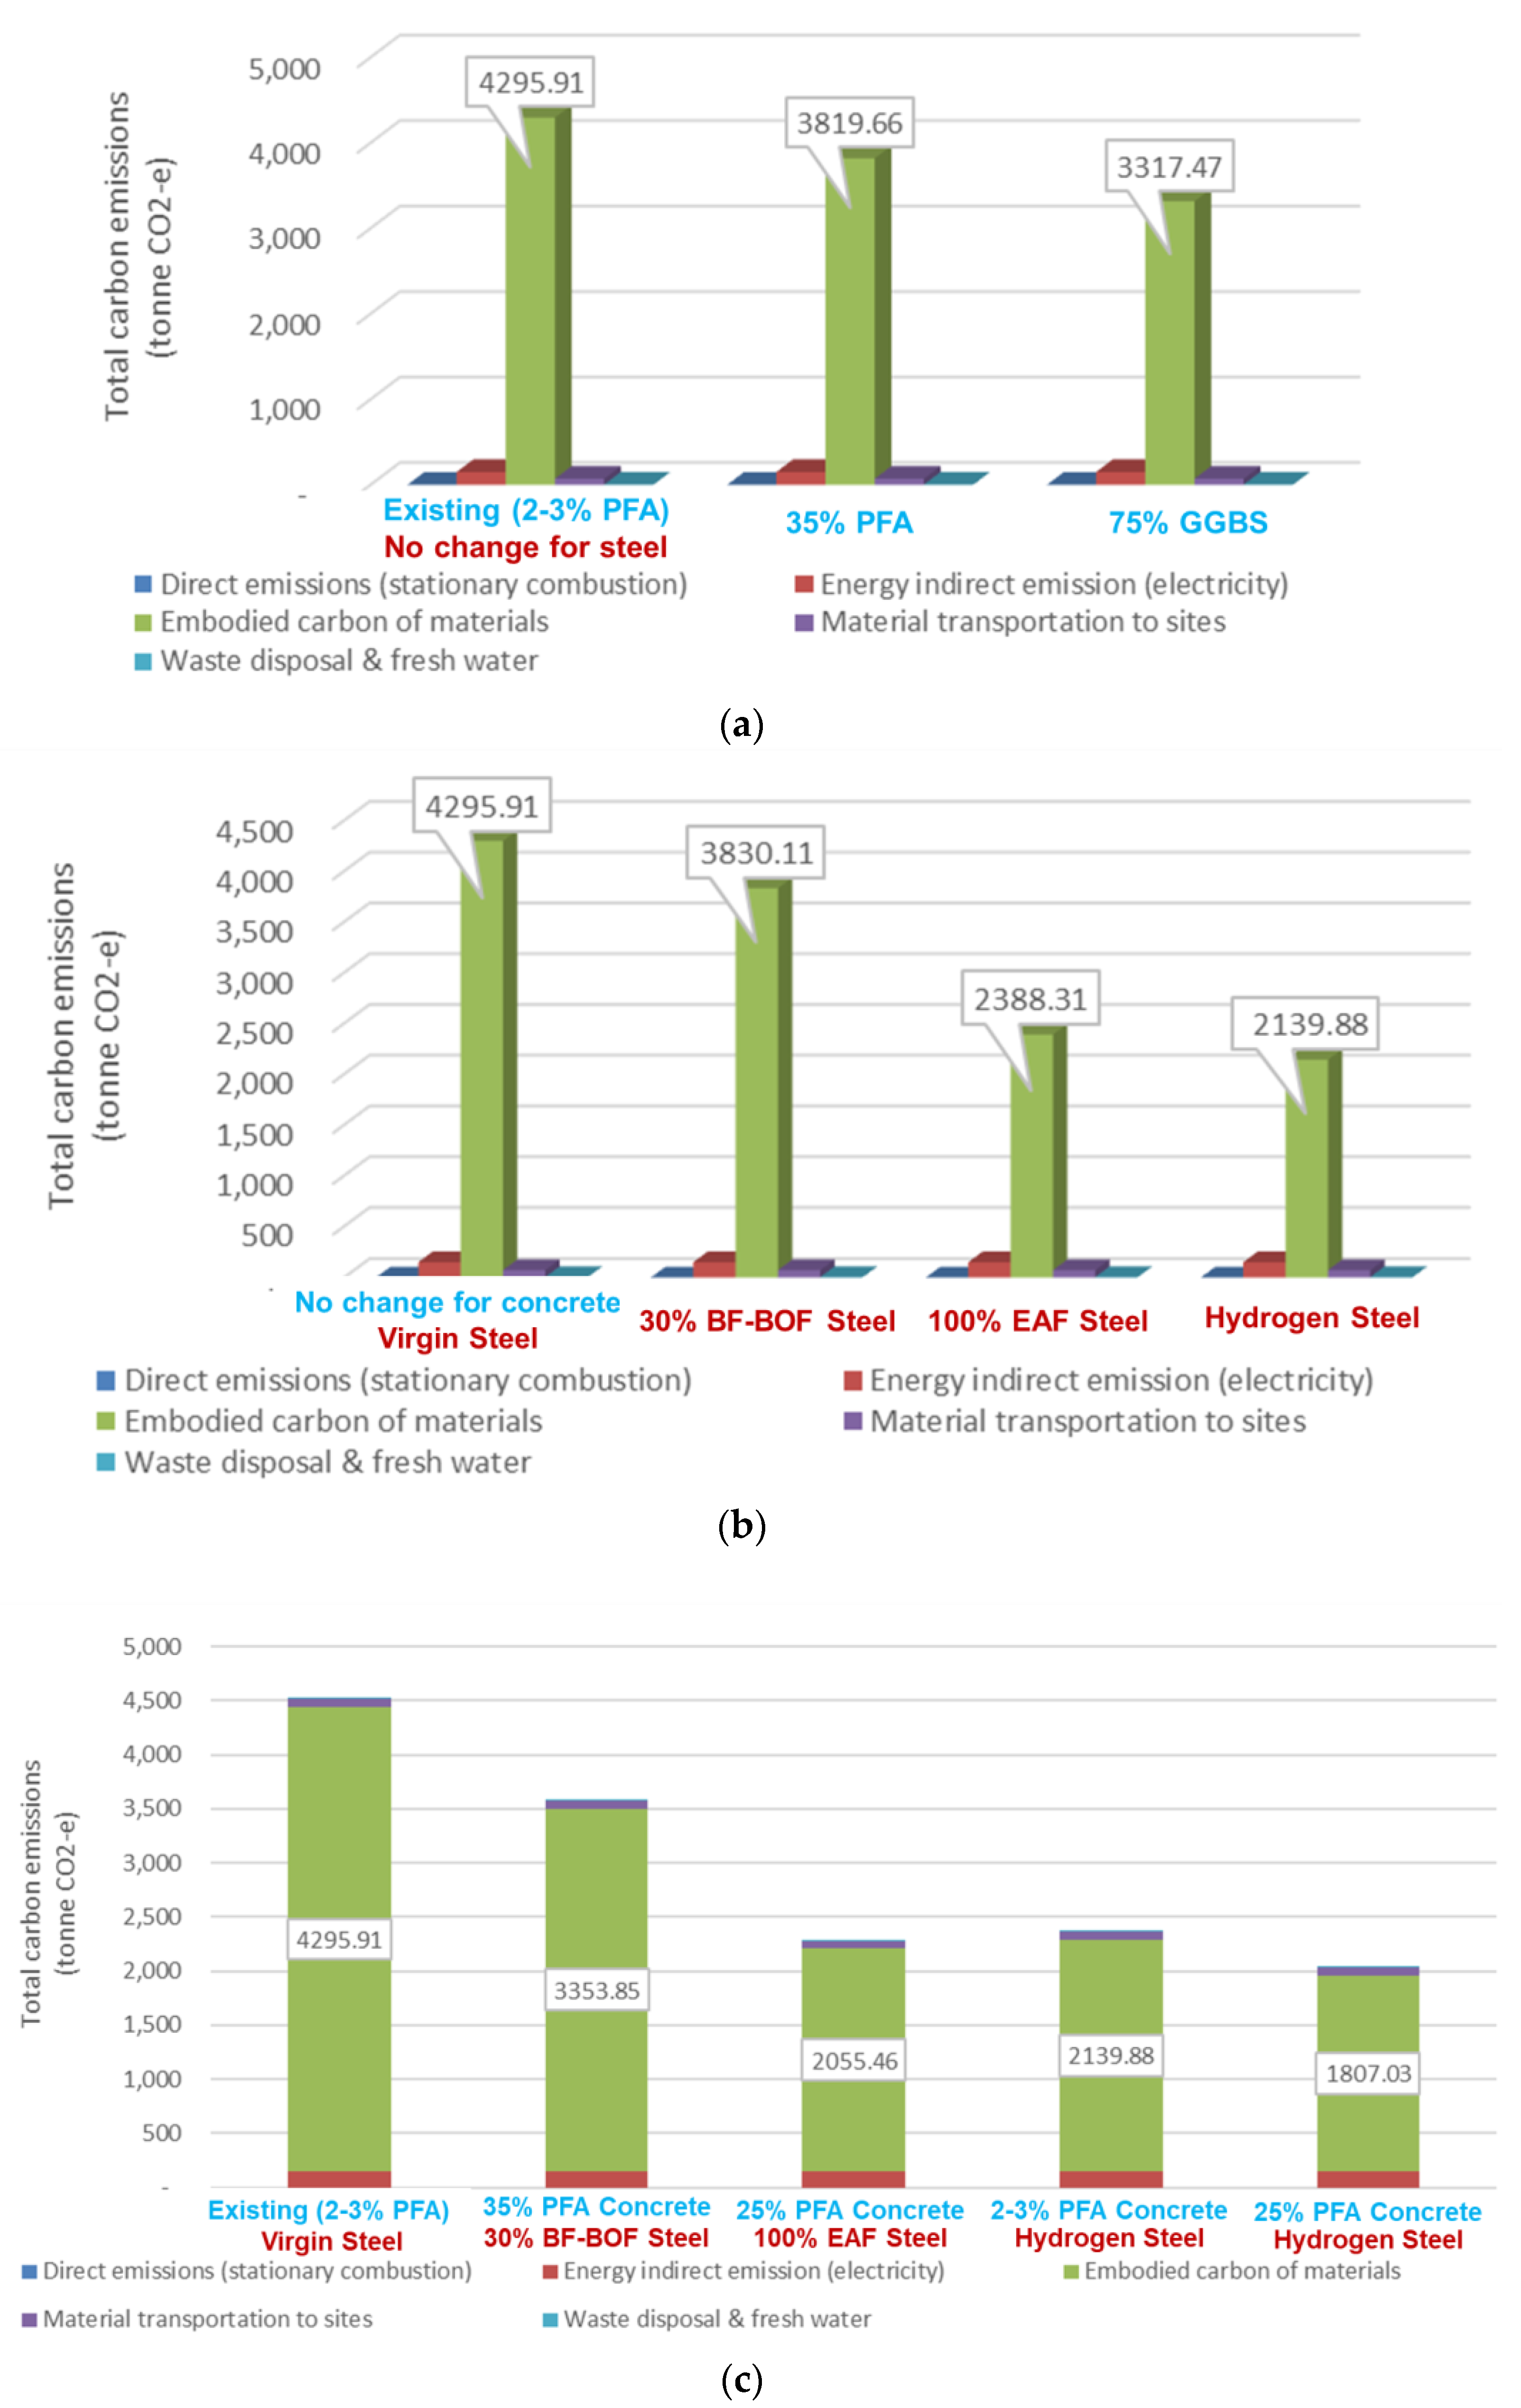
3.2. Low-Carbon Construction Materials
3.3. Modular Integrated Construction and DfMA
4. Conclusions
Author Contributions
Funding
Institutional Review Board Statement
Informed Consent Statement
Data Availability Statement
Conflicts of Interest
References
- UNEP. Buildings and Climate Change—Summary for Decision Makers; United Nations Environment Programme (UNEP): Athens, Greece, 2009. [Google Scholar]
- U.S. Department of Energy. Re-Assessing Green Building Performance: A Post Occupancy Evaluation of 22 GSA Buildings; U.S. Department of Energy and GSA: Washington, DC, USA, 2011. [Google Scholar]
- Wu, H.J.; Yuan, Z.W.; Zhang, L.; Bi, J. Life cycle energy consumption and CO2 emission of an office building in China. Int. J. Life Cycle Assess. 2012, 17, 105–118. [Google Scholar] [CrossRef]
- Soust-Verdaguer, B.; Llatas, C.; García-Martínez, A. Critical review of bim-based LCA method to buildings. Energy Build. 2017, 136, 110–120. [Google Scholar] [CrossRef]
- Gan, V.J.L.; Lo, I.M.C.; Ma, J.; Tse, K.T.; Cheng, J.C.P.; Chan, C.M. Simulation optimisation towards energy efficient green buildings: Current status and future trends. J. Clean. Prod. 2020, 254, 120012. [Google Scholar] [CrossRef]
- Carlander, J.; Thollander, P. Drivers for implementation of energy-efficient technologies in building construction projects—Results from a Swedish case study. Resour. Environ. Sustain. 2022, 10, 100078. [Google Scholar] [CrossRef]
- Salemdeeb, R.; Saint, R.; Clark, W.; Lenaghan, M.; Pratt, K.; Millar, F. A pragmatic and industry-oriented framework for data quality assessment of environmental footprint tools. Resour. Environ. Sustain. 2021, 3, 100019. [Google Scholar] [CrossRef]
- Benjamin, S.; Christopher, R.; Carl, H. Feature modeling for configurable and adaptable modular buildings. Adv. Eng. Inform. 2022, 51, 101514. [Google Scholar] [CrossRef]
- Chen, B.; Liu, Q.; Chen, H.; Wang, L.; Deng, T.; Zhang, L.; Wu, X. Multiobjective optimization of building energy consumption based on BIM-DB and LSSVM-NSGA-II. J. Clean. Prod. 2021, 294, 126153. [Google Scholar] [CrossRef]
- Kamel, E.; Memari, A.M. Review of BIM’s application in energy simulation: Tools, issues, and solutions. Autom. Constr. 2019, 97, 164–180. [Google Scholar] [CrossRef]
- Tushar, Q.; Bhuiyan, M.A.; Zhang, G.; Maqsood, T. An integrated approach of BIM-enabled LCA and energy simulation: The optimized solution towards sustainable development. J. Clean. Prod. 2021, 289, 125622. [Google Scholar] [CrossRef]
- Schlueter, A.; Thesseling, F. Building information model based energy/exergy performance assessment in early design stages. Autom. Constr. 2009, 18, 153–163. [Google Scholar] [CrossRef]
- Ahn, K.-U.; Kim, Y.-J.; Park, C.-S.; Kim, I.; Lee, K. BIM interface for full vs. semi-automated building energy simulation. Energy Build. 2014, 68, 671–678. [Google Scholar] [CrossRef]
- Utkucu, D.; Szer, H. Interoperability and data exchange within BIM platform to evaluate building energy performance and indoor comfort. Autom. Constr. 2020, 116, 103225. [Google Scholar] [CrossRef]
- Weerasuriya, A.U.; Zhang, X.; Gan, V.J.L.; Tan, Y. A holistic framework to utilize natural ventilation to optimize energy performance of residential high-rise buildings. Build. Environ. 2019, 153, 218–232. [Google Scholar] [CrossRef]
- Gan, V.J.L.; Wong, H.K.; Tse, K.T.; Cheng, J.C.P.; Lo, I.M.C.; Chan, C.M. Simulation-based evolutionary optimization for energy-efficient layout plan design of high-rise residential buildings. J. Clean. Prod. 2019, 231, 1375–1388. [Google Scholar] [CrossRef]
- Schmidt, M.; Åhlund, C. Smart buildings as Cyber-Physical Systems: Data-driven predictive control strategies for energy efficiency. Renew. Sustain. Energy Rev. 2018, 90, 742–756. [Google Scholar] [CrossRef] [Green Version]
- Gao, X.; Pishdad-Bozorgi, P. BIM-enabled facilities operation and maintenance: A review. Adv. Eng. Inform. 2019, 39, 227–247. [Google Scholar] [CrossRef]
- Tang, S.; Shelden, D.R.; Eastman, C.M.; Pishdad-Bozorgi, P.; Gao, X. A review of building information modeling (BIM) and the internet of things (IoT) devices integration: Present status and future trends. Autom. Constr. 2019, 101, 127–139. [Google Scholar] [CrossRef]
- Chen, W.; Gan, V.J.L.; Chen, K.; Cheng, J.C.P. A BIM-based approach for implementing WELL standard on human health and comfort analysis. In Proceedings of the 17th International Conference on Computing in Civil and Building Engineering (ICCCBE), Tampere, Finland, 5–6 June 2018. [Google Scholar]
- Marzouk, M.; Abdelaty, A. Monitoring thermal comfort in subways using building information modeling. Energy Build. 2014, 84, 252–257. [Google Scholar] [CrossRef]
- Eastman, C.M.; Eastman, C.; Teicholz, P.; Sacks, R.; Liston, K. BIM Handbook: A Guide to Building Information Modeling for Owners, Managers, Designers, Engineers and Contractors; John Wiley & Sons: Hoboken, NJ, USA, 2011. [Google Scholar]
- Stamatescu, G.; Stamatescu, I.; Arghira, N.; Fagarasan, I. Data-driven modelling of smart building ventilation subsystem. J. Sens. 2019, 2019, 3572019. [Google Scholar] [CrossRef]
- Shaikh, P.H.; Nor, N.B.M.; Nallagownden, P.; Elamvazuthi, I.; Ibrahim, T. A review on optimized control systems for building energy and comfort management of smart sustainable buildings. Renew. Sustain. Energy Rev. 2014, 34, 409–429. [Google Scholar] [CrossRef]
- Ahmad, M.W.; Mourshed, M.; Yuce, B.; Rezgui, Y. Computational intelligence techniques for HVAC systems: A review. Build. Simul. 2016, 9, 359–398. [Google Scholar] [CrossRef] [Green Version]
- Ruta, M.; Scioscia, F.; Loseto, G.; Di Sciascio, E. Semantic-based resource discovery and orchestration in home and building automation: A multi-agent approach. IEEE Trans. Ind. Inform. 2013, 10, 730–741. [Google Scholar] [CrossRef]
- Marino, C.; Nucara, A.; Peri, G.; Pietrafesa, M.; Pudano, A.; Rizzo, G. An MAS-based subjective model for indoor adaptive thermal comfort. Sci. Technol. Built Environ. 2015, 21, 114–125. [Google Scholar] [CrossRef]
- Kofoworola, O.F.; Gheewala, S.H. Environmental life cycle assessment of a commercial office building in Thailand. Int. J. Life Cycle Assess. 2008, 13, 498–511. [Google Scholar] [CrossRef]
- Hollberg, A.; Genova, G.; Habert, G. Evaluation of BIM-based LCA results for building design. Autom. Constr. 2020, 109, 102972. [Google Scholar] [CrossRef]
- Alwan, Z.; Nawarathna, A.; Ayman, R.; Zhu, M.; ElGhazi, Y. Framework for parametric assessment of operational and embodied energy impacts utilising BIM. J. Build. Eng. 2021, 42, 102768. [Google Scholar] [CrossRef]
- Gan, V.J.; Deng, M.; Tse, K.T.; Chan, C.M.; Lo, I.M.; Cheng, J.C. Holistic BIM framework for sustainable low carbon design of high-rise buildings. J. Clean. Prod. 2018, 195, 1091–1104. [Google Scholar] [CrossRef]
- Xu, J.; Teng, Y.; Pan, W.; Zhang, Y. BIM-integrated LCA to automate embodied carbon assessment of prefabricated buildings. J. Clean. Prod. 2022, 374, 133894. [Google Scholar] [CrossRef]
- Sobhkhiz, S.; Taghaddos, H.; Rezvani, M.; Ramezanianpour, A.M. Utilization of semantic web technologies to improve BIM-LCA applications. Autom. Constr. 2021, 130, 103842. [Google Scholar] [CrossRef]
- Gan, V.J. BIM-based graph data model for automatic generative design of modular buildings. Autom. Constr. 2022, 134, 104062. [Google Scholar] [CrossRef]
- Gan, V.J. BIM-Based Building Geometric Modeling and Automatic Generative Design for Sustainable Offsite Construction. J. Constr. Eng. Manag. 2022, 148, 04022111. [Google Scholar] [CrossRef]
- Shadram, F.; Johansson, T.D.; Lu, W.; Schade, J.; Olofsson, T. An integrated BIM-based framework for minimizing embodied energy during building design. Energy Build. 2016, 128, 592–604. [Google Scholar] [CrossRef]
- Abbasi, S.; Noorzai, E. The BIM-Based multi-optimization approach in order to determine the trade-off between embodied and operation energy focused on renewable energy use. J. Clean. Prod. 2021, 281, 125359. [Google Scholar] [CrossRef]
- As, I.; Pal, S.; Basu, P. Artificial intelligence in architecture: Generating conceptual design via deep learning. Int. J. Archit. Comput. 2018, 16, 306–327. [Google Scholar] [CrossRef] [Green Version]
- Nauata, N.; Chang, K.-H.; Cheng, C.-Y.; Mori, G.; Furukawa, Y. House-gan: Relational generative adversarial networks for graph-constrained house layout generation. In Proceedings of the European Conference on Computer Vision, Glasgow, UK, 23–28 August 2020; pp. 162–177. [Google Scholar]
- Ghannad, P.; Lee, Y.-C. Automated modular housing design using a module configuration algorithm and a coupled generative adversarial network (CoGAN). Autom. Constr. 2022, 139, 104234. [Google Scholar] [CrossRef]
- Sydora, C.; Stroulia, E. Rule-based compliance checking and generative design for building interiors using BIM. Autom. Constr. 2020, 120, 103368. [Google Scholar] [CrossRef]
- Gan, V.J.; Cheng, J.C.; Lo, I.M. A comprehensive approach to mitigation of embodied carbon in reinforced concrete buildings. J. Clean. Prod. 2019, 229, 582–597. [Google Scholar] [CrossRef]
- Gan, V.J.; Chan, C.M.; Tse, K.; Lo, I.M.; Cheng, J.C. A comparative analysis of embodied carbon in high-rise buildings regarding different design parameters. J. Clean. Prod. 2017, 161, 663–675. [Google Scholar] [CrossRef]
- Rechberger, K.; Spanlang, A.; Sasiain Conde, A.; Wolfmeir, H.; Harris, C. Green hydrogen-based direct reduction for low-carbon steelmaking. Steel Res. Int. 2020, 91, 2000110. [Google Scholar] [CrossRef]
- Hammond, G.; Jones, C. Inventory of Carbon & Energy: ICE; Sustainable Energy Research Team, Department of Mechanical Engineering, University of Bath: Bath, UK, 2008. [Google Scholar]
- Sinha, A.; Kutnar, A. Carbon footprint versus performance of aluminum, plastic, and wood window frames from cradle to gate. Buildings 2012, 2, 542–553. [Google Scholar] [CrossRef] [Green Version]
- Atkins Ltd/ERM. SAS120—Aluminium Environmental Product Declarations (EPD); SAS International: London, UK, 2019. [Google Scholar]
- HKE. Eletricity Emission Factor. 2022. Available online: https://www.hkelectric.com/en/customer-services/carbon-calculator (accessed on 15 April 2022).
- WRI and WBCSB. Greenhouse Gas Protocol—Product Life Cycle Accounting and Reporting Standard; WRI and WBCSB: Geneva, Switzerland, 2011. [Google Scholar]
- Construction Industry Council. Carbon Assessment Tool. HKCIC. 2022. Available online: https://www.cic.hk/eng/index.html (accessed on 15 April 2022).
- Liu, G.; Gu, T.; Xu, P.; Hong, J.; Shrestha, A.; Martek, I. A production line-based carbon emission assessment model for prefabricated components in China. J. Clean. Prod. 2019, 209, 30–39. [Google Scholar] [CrossRef]


| Materials or Energy | Recycled Content | Amount | Unit |
|---|---|---|---|
| Concrete (Grade 15/20D 75 mm) | No PFA | 13 | m3 |
| Concrete (Grade 20/20D 75 mm) | 1.5% PFA | 18 | m3 |
| Concrete (Grade 30/20D 125 mm) | 2.0% PFA | 19 | m3 |
| Concrete (Grade 45/10D 125 mm) | 2.30% PFA | 5 | m3 |
| Concrete (Grade 45/20D 125 mm) | 2.40% PFA | 216 | m3 |
| Concrete (Grade 45/20D 125 mm WP with Caltite) | 2.40% PFA | 192 | m3 |
| Concrete (Grade 60/20D 200 mm) | 2.6% PFA | 2456 | m3 |
| Concrete (Grade 60/20D 200 mm WP with Caltite) | 2.6% PFA | 1017 | m3 |
| Reinforcement Bar | Virgin | 1,109,070 | kg |
| Timber | N/A | 151 | m3 |
| Glass for Curtain Wall | Virgin | 42,700 | kg |
| Aluminium | Virgin | 96,261 | kg |
| Electricity | N/A | 210,906 | kWh |
| Major Construction Materials | Emission Factor | Data Source | |
|---|---|---|---|
| Concrete (Grade 15)—No PFA | 247 | kg CO2-e/m3 | EF from [42] |
| Concrete (Grade 20)—1.5% PFA | 260 | kg CO2-e/m3 | |
| Concrete (Grade 30)—2.0% PFA | 289 | kg CO2-e/m3 | |
| Concrete (Grade 35)—1.8% PFA | 309 | kg CO2-e/m3 | |
| Concrete (Grade 45)—2.3–2.4% PFA | 347–348 | kg CO2-e/m3 | |
| Concrete (Grade 60)—2.6% PFA | 394 | kg CO2-e/m3 | |
| Concrete (Grade 80)—3.0% PFA | 462 | kg CO2-e/m3 | |
| Reinforcement Bar—Virgin | 2.27 | kg CO2-e/kg | EF from [43] |
| Reinforcement Bar—30% BF-BOF | 1.85 | kg CO2-e/kg | |
| Reinforcement Bar—100% EAF | 0.55 | kg CO2-e/kg | |
| Reinforcement Bar—Green Hydrogen Steel | 0.33 | kg CO2-e/kg | EF from hydrogen steel [44] and rebar processing [43] |
| Timber | 1.97 | kg CO2-e/kg | EF from [45], using a density of 570 kg/m3. Reuse: 3 times |
| Glass | 1.20 | kg CO2-e/kg | The carbon emission factor for float glass is 0.94 kg CO2-e/kg glass from data provided by manufacturers. To factor in the speciality glass used in buildings and the energy sources of different suppliers, the actual emission factors can be as high as 1.2 kg CO2-e/kg |
| Aluminium | 1.51 | kg CO2-e/kg | The carbon emission factor for aluminium end products (curtain wall, window frame, ceiling, etc.) ranges from 20–490 kg CO2-e/m2, with reference to literature such as [46,47] and internal communications with suppliers. This amounts to 0.09–2.56 kg CO2e/kg end products, assuming a standard density of 2710 kg/m3; 1.51 kg CO2-e/kg taken in the calculation is an arithmetic mean or average of the EFs for different end products |
| Electricity | 0.71 | kgCO2-e/kwh | EF from [48] |
| Road Transportation | 0.204 | kg CO2-e/tonne∙km | EF from [49] |
| Railway | 0.017 | kg CO2-e/tonne∙km | |
| Marine Shipment | 0.048 | kg CO2-e/tonne∙km | |
| Scope of Embodied Carbon | EC Calculator (Tonne CO2-e) | CIC Tool (Tonne CO2-e) |
|---|---|---|
| Scope (1)—Direct emissions | N/A | N/A |
| Scope (2)—Indirect emissions (energy-related) | 149.7 | 168.7 |
| Scope (3)—Other indirect emissions | 4369.9 | 4857.4 |
| 3.1 Upfront embodied carbon emissions of construction materials | 4296.0 | 4852.0 |
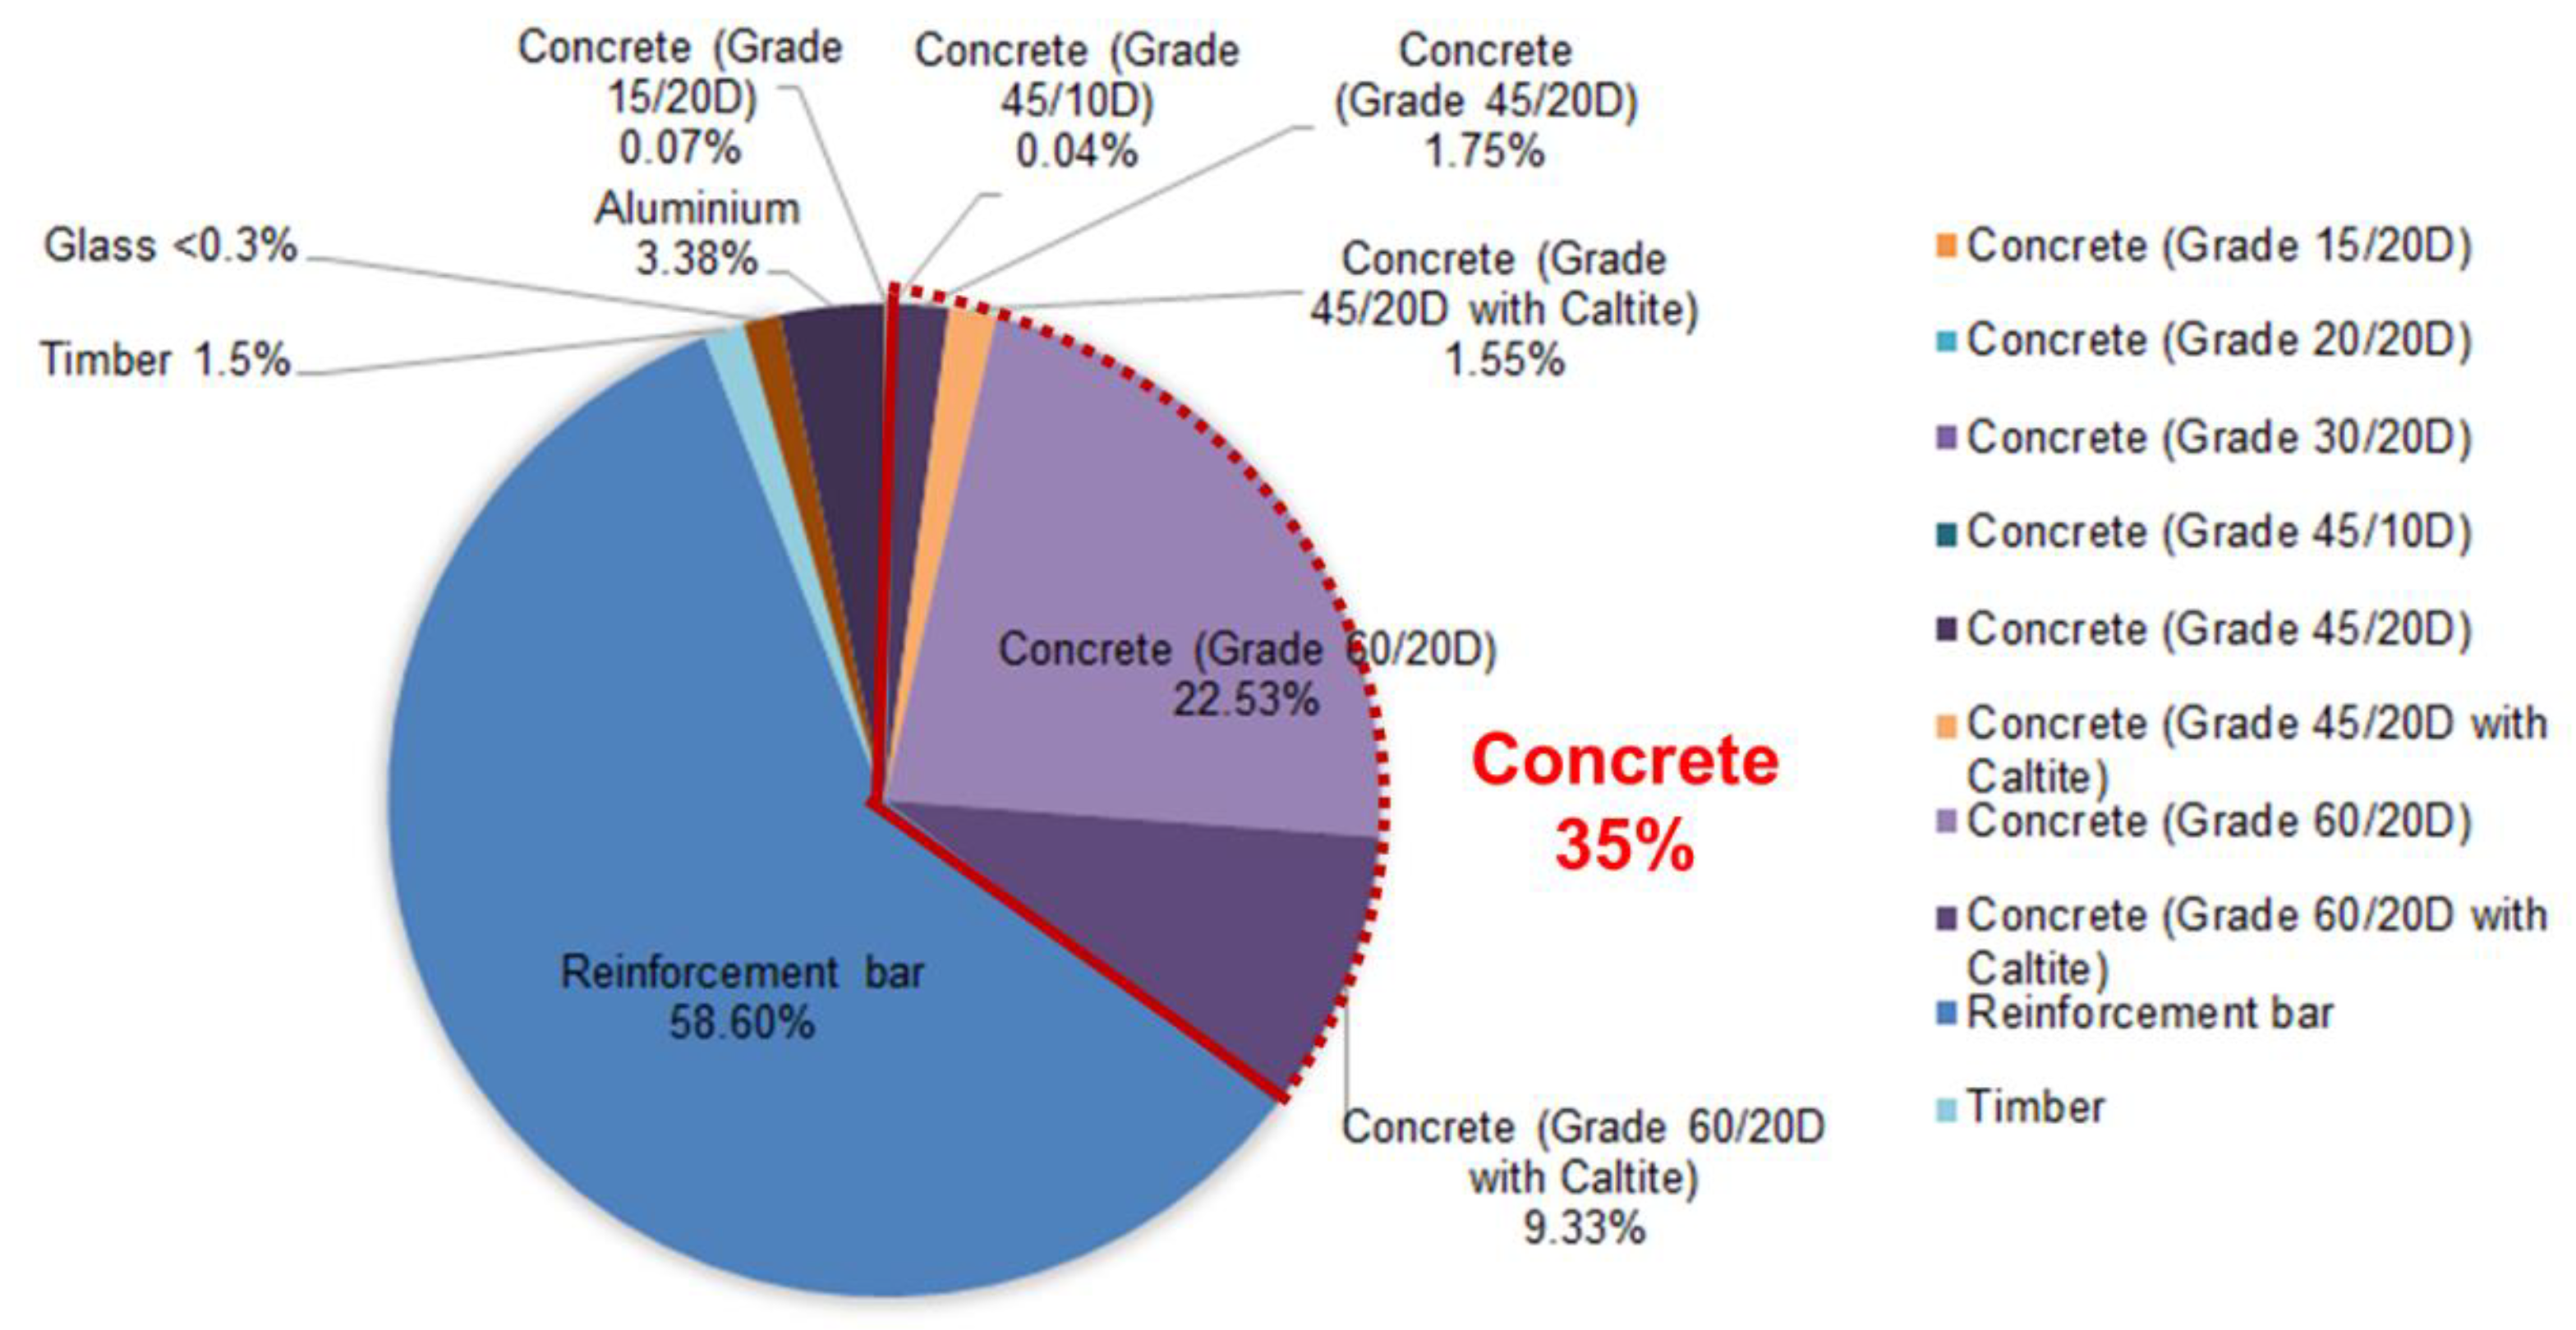
| Concrete | 1525.3 | 1822.0 |
| Rebar | 2517.6 | 2620.0 |
| Timber | 56.5 | 67.0 |
| Glass | 51.2 | 343.0 |
| Aluminium | 145.4 | N/A |
| 3.2 Carbon emissions from the transportation of construction materials | 71.8 | N/A (CIC tool integrates transportation emissions with embodied carbon) |
| Concrete | 31.9 | |
| Rebar | 25.4 | |
| Timber | 0.25 | |
| Glass | 4.4 | |
| Aluminium | 9.8 | |
| 3.3 Carbon emissions due to waste disposal and sewage treatment | 2.3 | 5.4 |
| Total carbon emissions (tonne CO2-e) | 4519.7 | 5025.0 |
| Per construction floor area (tonne CO2-e/m2) | 1.44 | 1.61 |
| Concrete | EC Calculator (kg CO2-e/m3) | CIC Tool (kg CO2-e/m3) a |
|---|---|---|
| Grade 20 | 260 | 309 |
| Grade 30 | 288 | 345 |
| Grade 35 | 309 | 367 |
| Grade 40 | 335 | 391 |
| Grade 45 | 348 | 427 |
| Grade 50 | 365 | 453 |
| Grade 60 | 394 | 467 |
| EC Calculator | CIC Tool | ||
|---|---|---|---|
| Steel Category | Emission Factor (kg CO2-e/tonne) | Steel Category | Emission Factor (kg CO2-e/tonne) a |
| BF-BOF (no scraps) | 2270 | General reinforcement bar | 2145 |
| EAF (no scraps) | 1700 | Low recycled content (0–29%) | 2362 |
| BF-BOF (30% scraps) | 1830 | Average recycled content (30–59%) | 1860 |
| EAF (100% scraps) | 550 | High recycled content (≥60%) | 1358 |
| Scope of Carbon Calculation and Analysis | Carbon Footprint |
|---|---|
| Total embodied carbon (tonne) | 4519.7 |
| Scope (1)—Direct emissions | - |
| Scope (2)—Energy indirect emissions | 149.7 |
| Scope (3)—Other indirect emissions | 4369.9 |
| Embodied carbon per floor area (tonne CO2-e/m2) | 1.44 |
| Total operational carbon over 50 years (tonne) | 10,080.6 |
| Operational carbon per floor area (tonne CO2-e/m2) | 3.22 |
| Total carbon emissions (tonne CO2-e/m2) | 4.66 |
| RC | MiC | |
|---|---|---|
| The volume of concrete (m3) | 1967.4 | 1945.2 |
| Emission factor (kg CO2-e/m3) | 394 (Grade 60) a | 391 (Precast concrete) b |
| Carbon emissions for main concrete applications (kg CO2-e) | 775,155.6 | 760,573.2 |
Disclaimer/Publisher’s Note: The statements, opinions and data contained in all publications are solely those of the individual author(s) and contributor(s) and not of MDPI and/or the editor(s). MDPI and/or the editor(s) disclaim responsibility for any injury to people or property resulting from any ideas, methods, instructions or products referred to in the content. |
© 2023 by the authors. Licensee MDPI, Basel, Switzerland. This article is an open access article distributed under the terms and conditions of the Creative Commons Attribution (CC BY) license (https://creativecommons.org/licenses/by/4.0/).
Share and Cite
Gan, J.; Li, K.; Li, X.; Mok, E.; Ho, P.; Law, J.; Lau, J.; Kwok, R.; Yau, R. Parametric BIM-Based Lifecycle Performance Prediction and Optimisation for Residential Buildings Using Alternative Materials and Designs. Buildings 2023, 13, 904. https://doi.org/10.3390/buildings13040904
Gan J, Li K, Li X, Mok E, Ho P, Law J, Lau J, Kwok R, Yau R. Parametric BIM-Based Lifecycle Performance Prediction and Optimisation for Residential Buildings Using Alternative Materials and Designs. Buildings. 2023; 13(4):904. https://doi.org/10.3390/buildings13040904
Chicago/Turabian StyleGan, Jielong, Kexin Li, Xiuqi Li, Emil Mok, Patrick Ho, Jenny Law, Joey Lau, Raymond Kwok, and Raymond Yau. 2023. "Parametric BIM-Based Lifecycle Performance Prediction and Optimisation for Residential Buildings Using Alternative Materials and Designs" Buildings 13, no. 4: 904. https://doi.org/10.3390/buildings13040904