
Nano Engineered Paraffin-Based Phase Change Material for Building Thermal Management
 ,
,
Abstract
:1. Introduction
2. Experimental Section
2.1. Materials and Methods
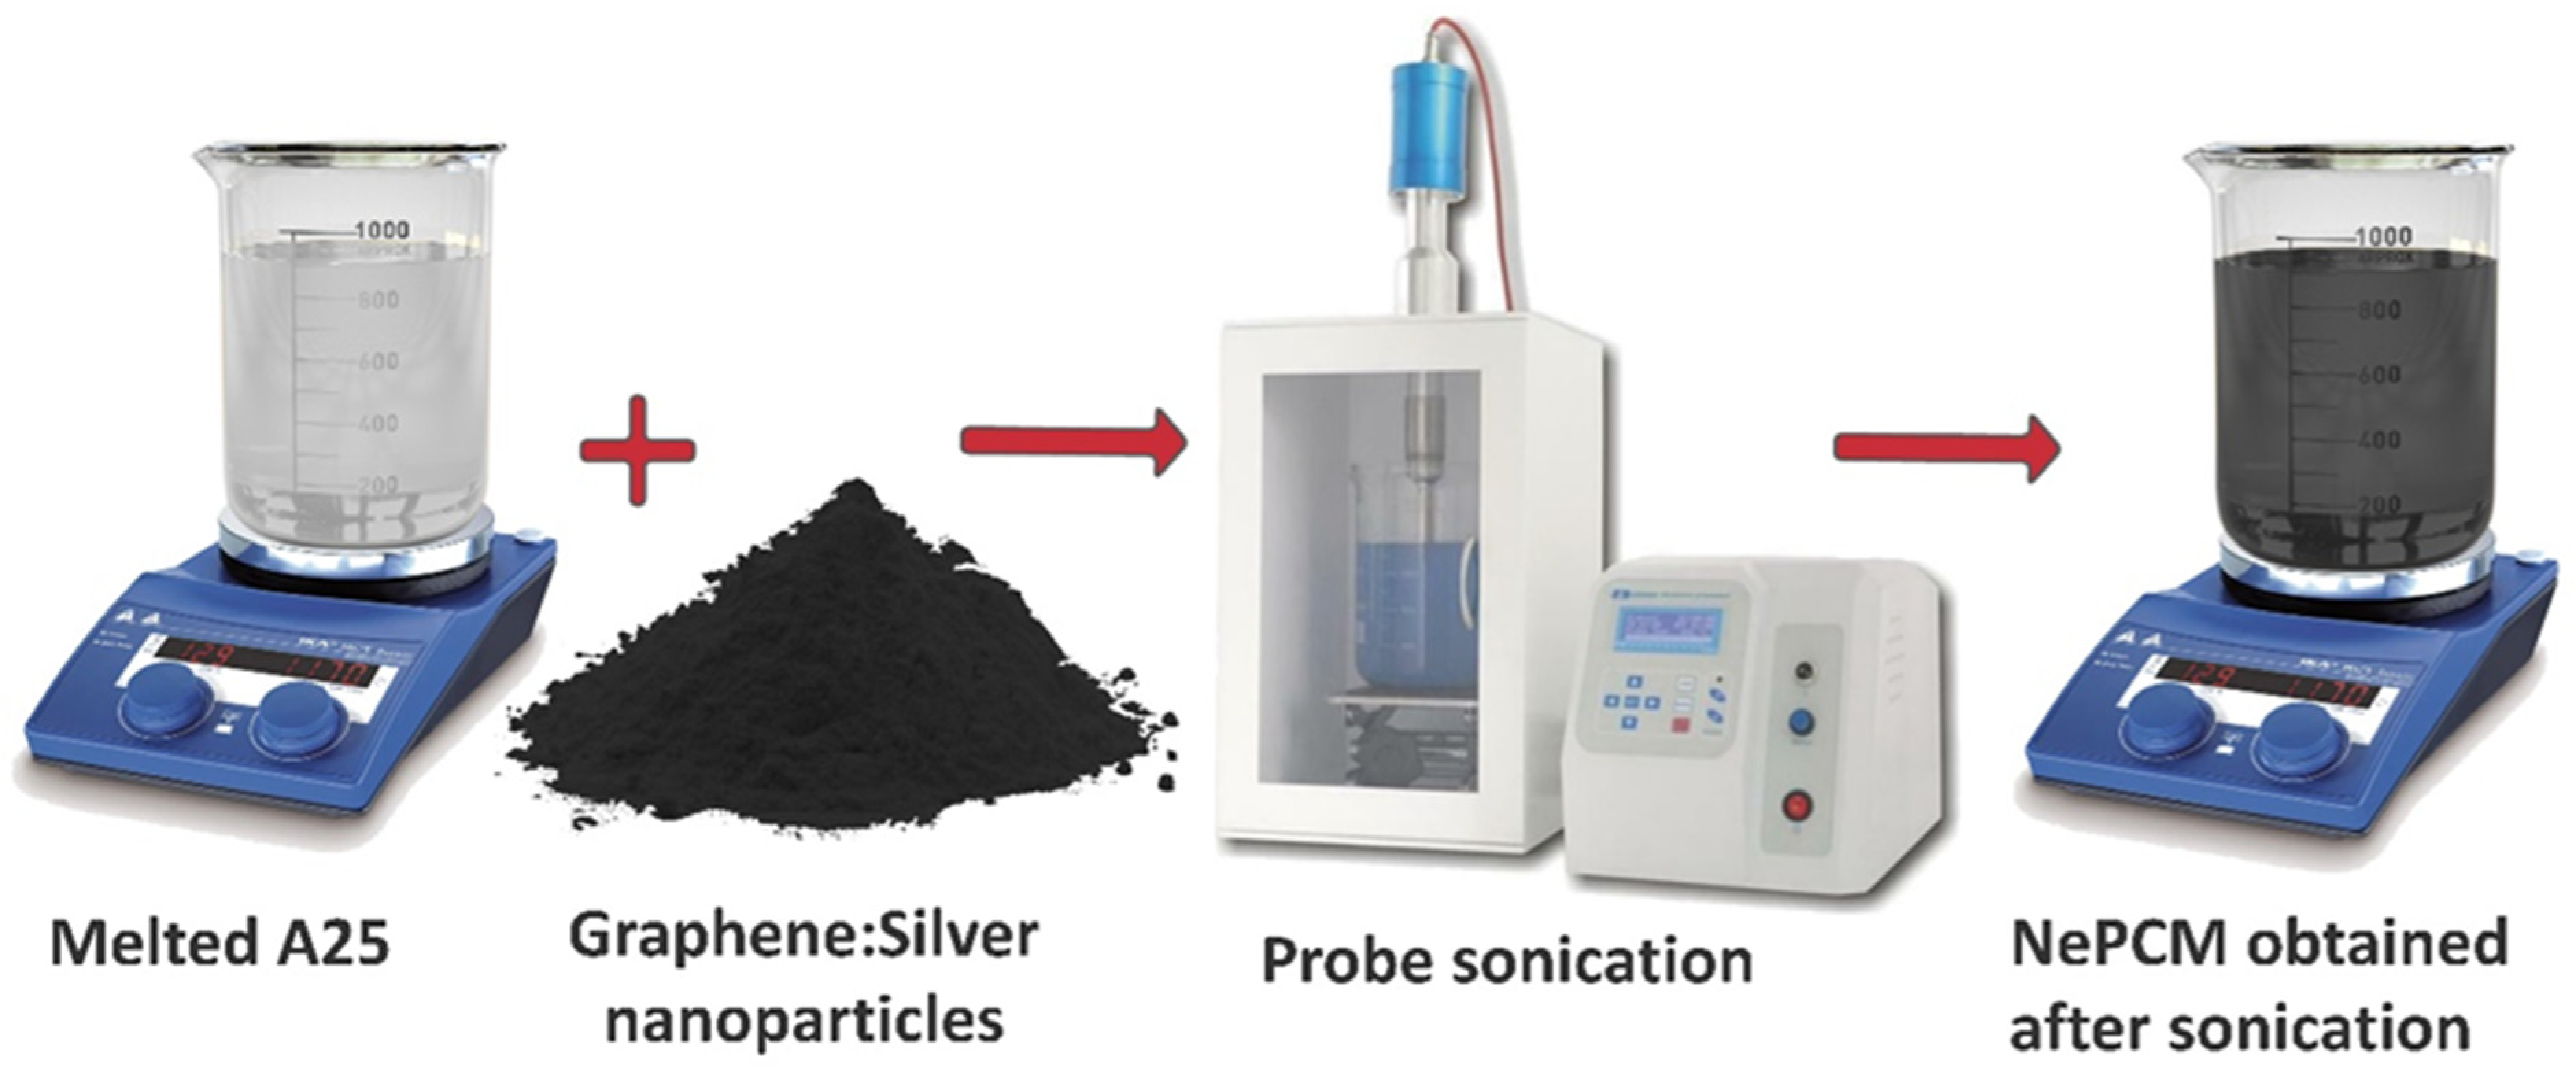
2.2. Synthesis of Paraffin/Graphene: Silver Hybrid Nanocomposites
2.3. Characterization Techniques
2.4. Uncertainty Analysis
3. Results and Analysis
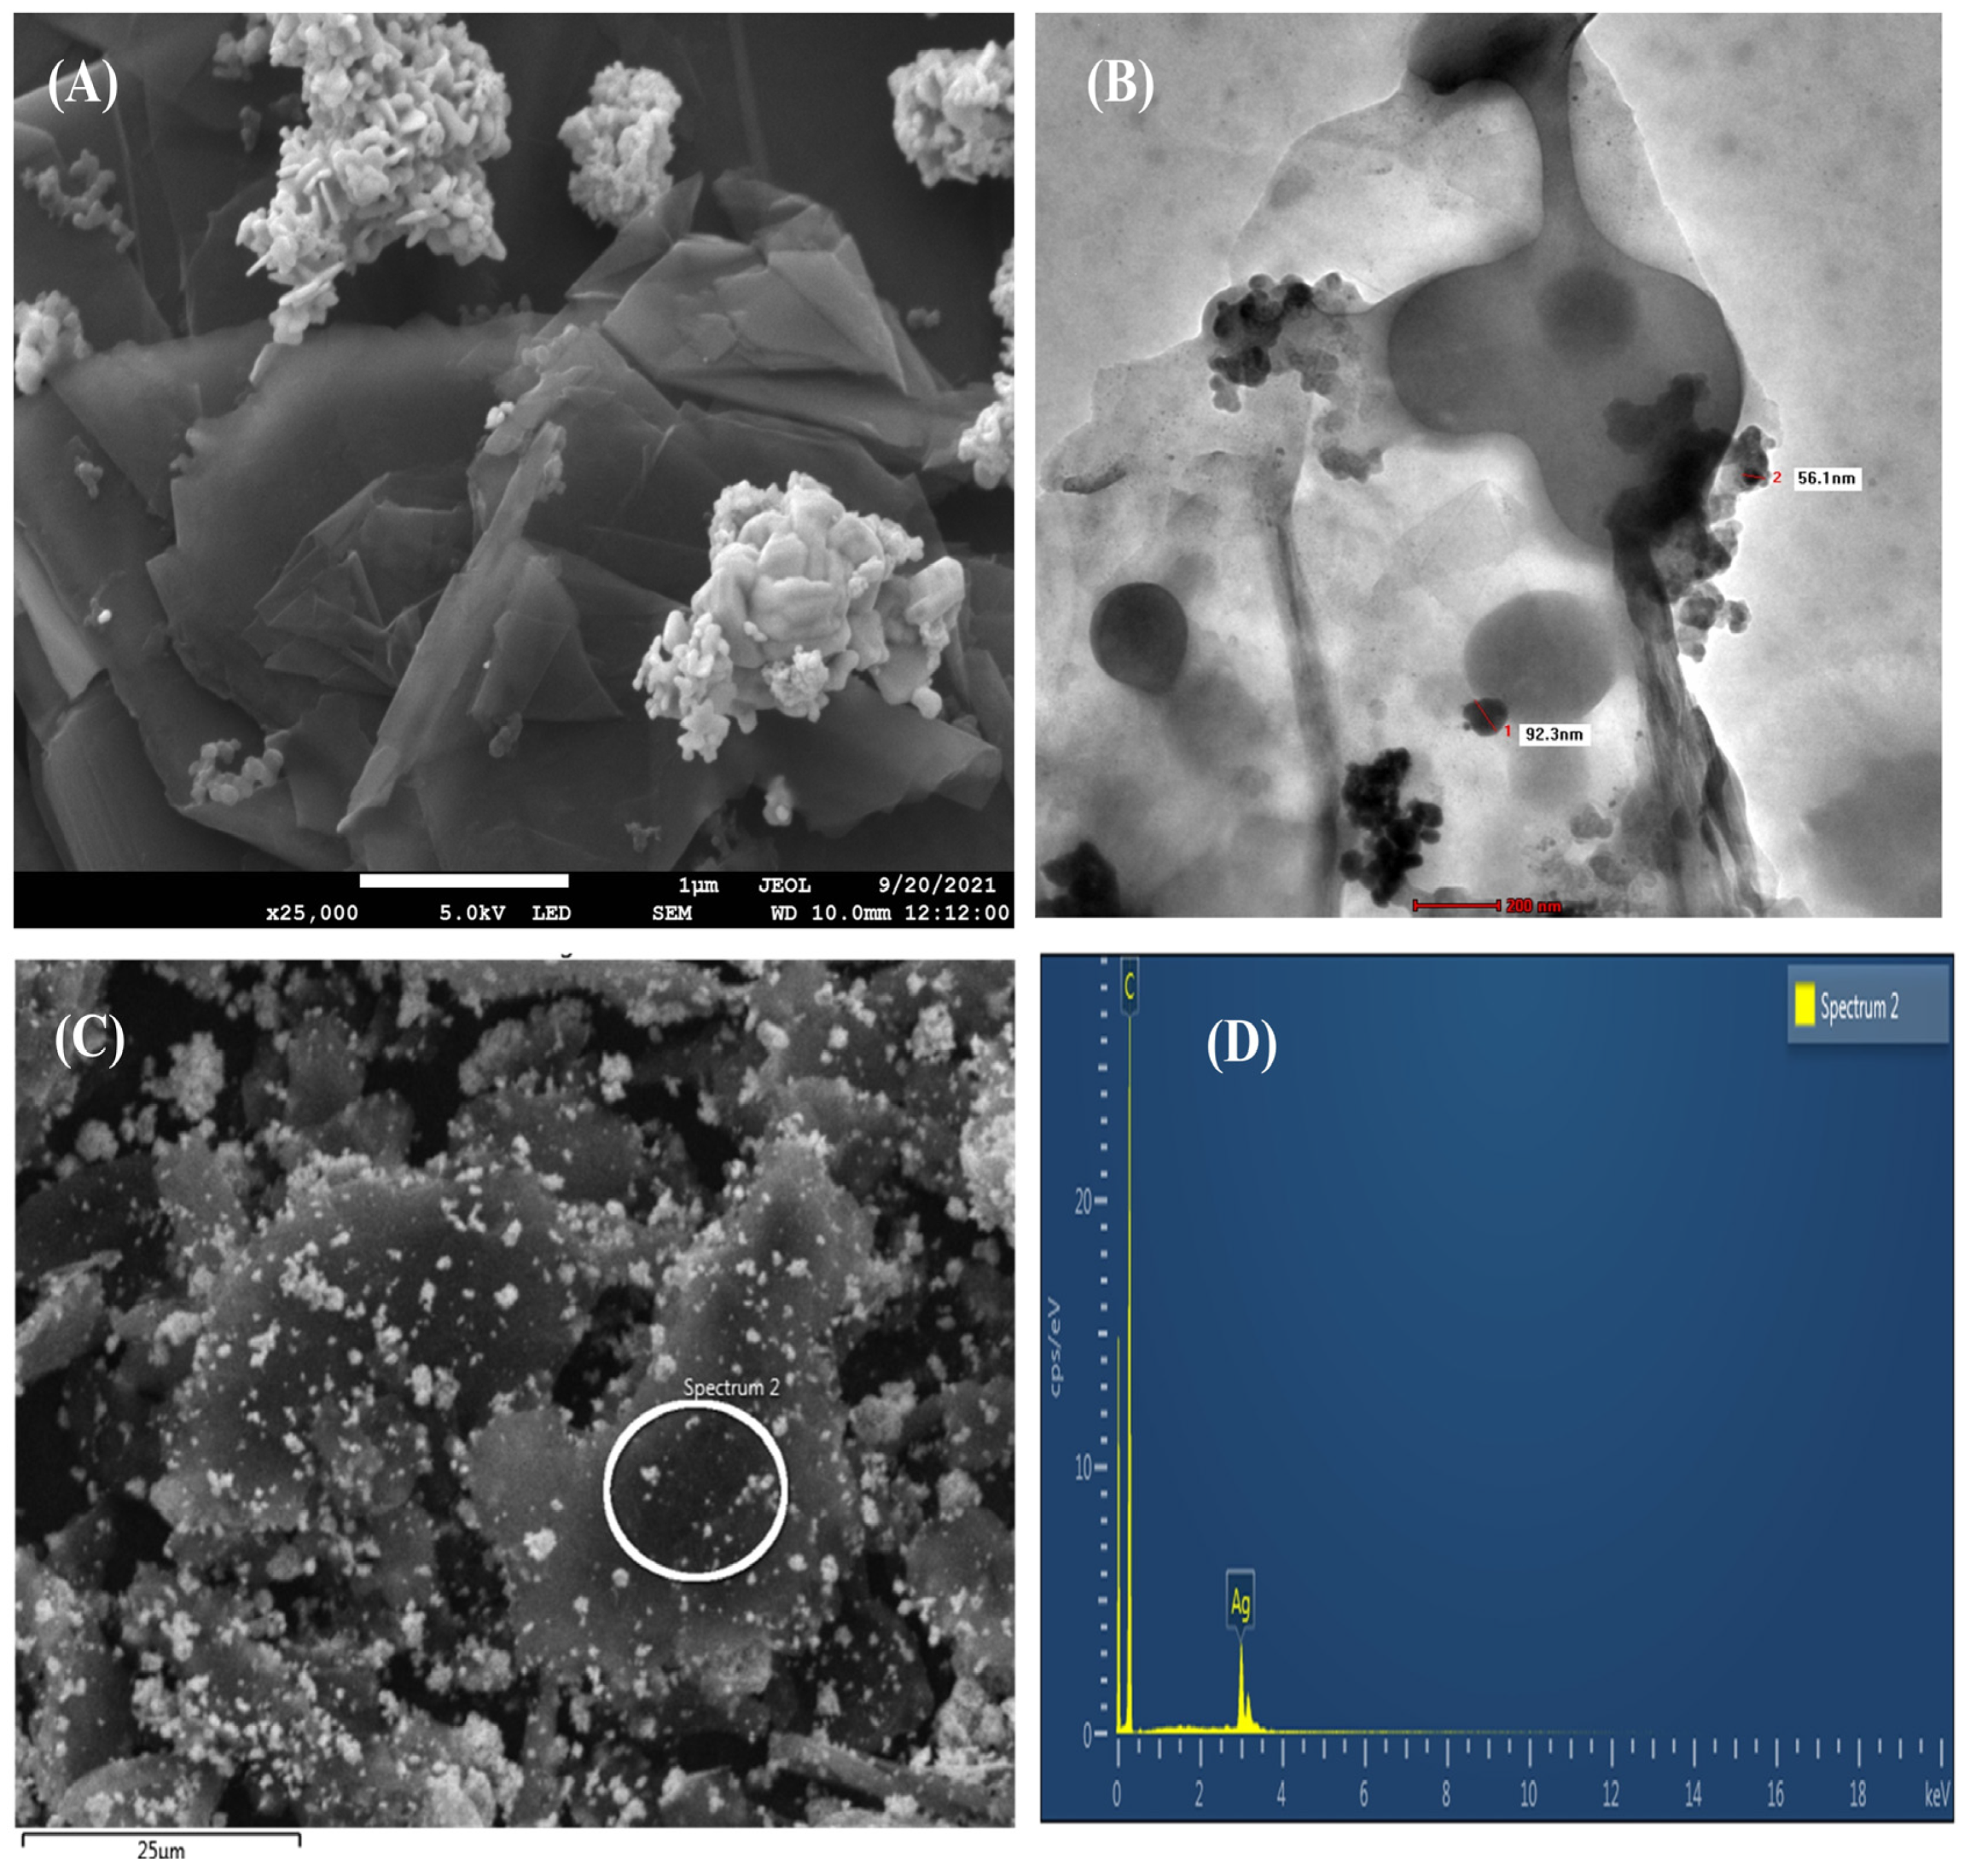
3.1. Morphological Analysis of Hybrid Nanoparticles
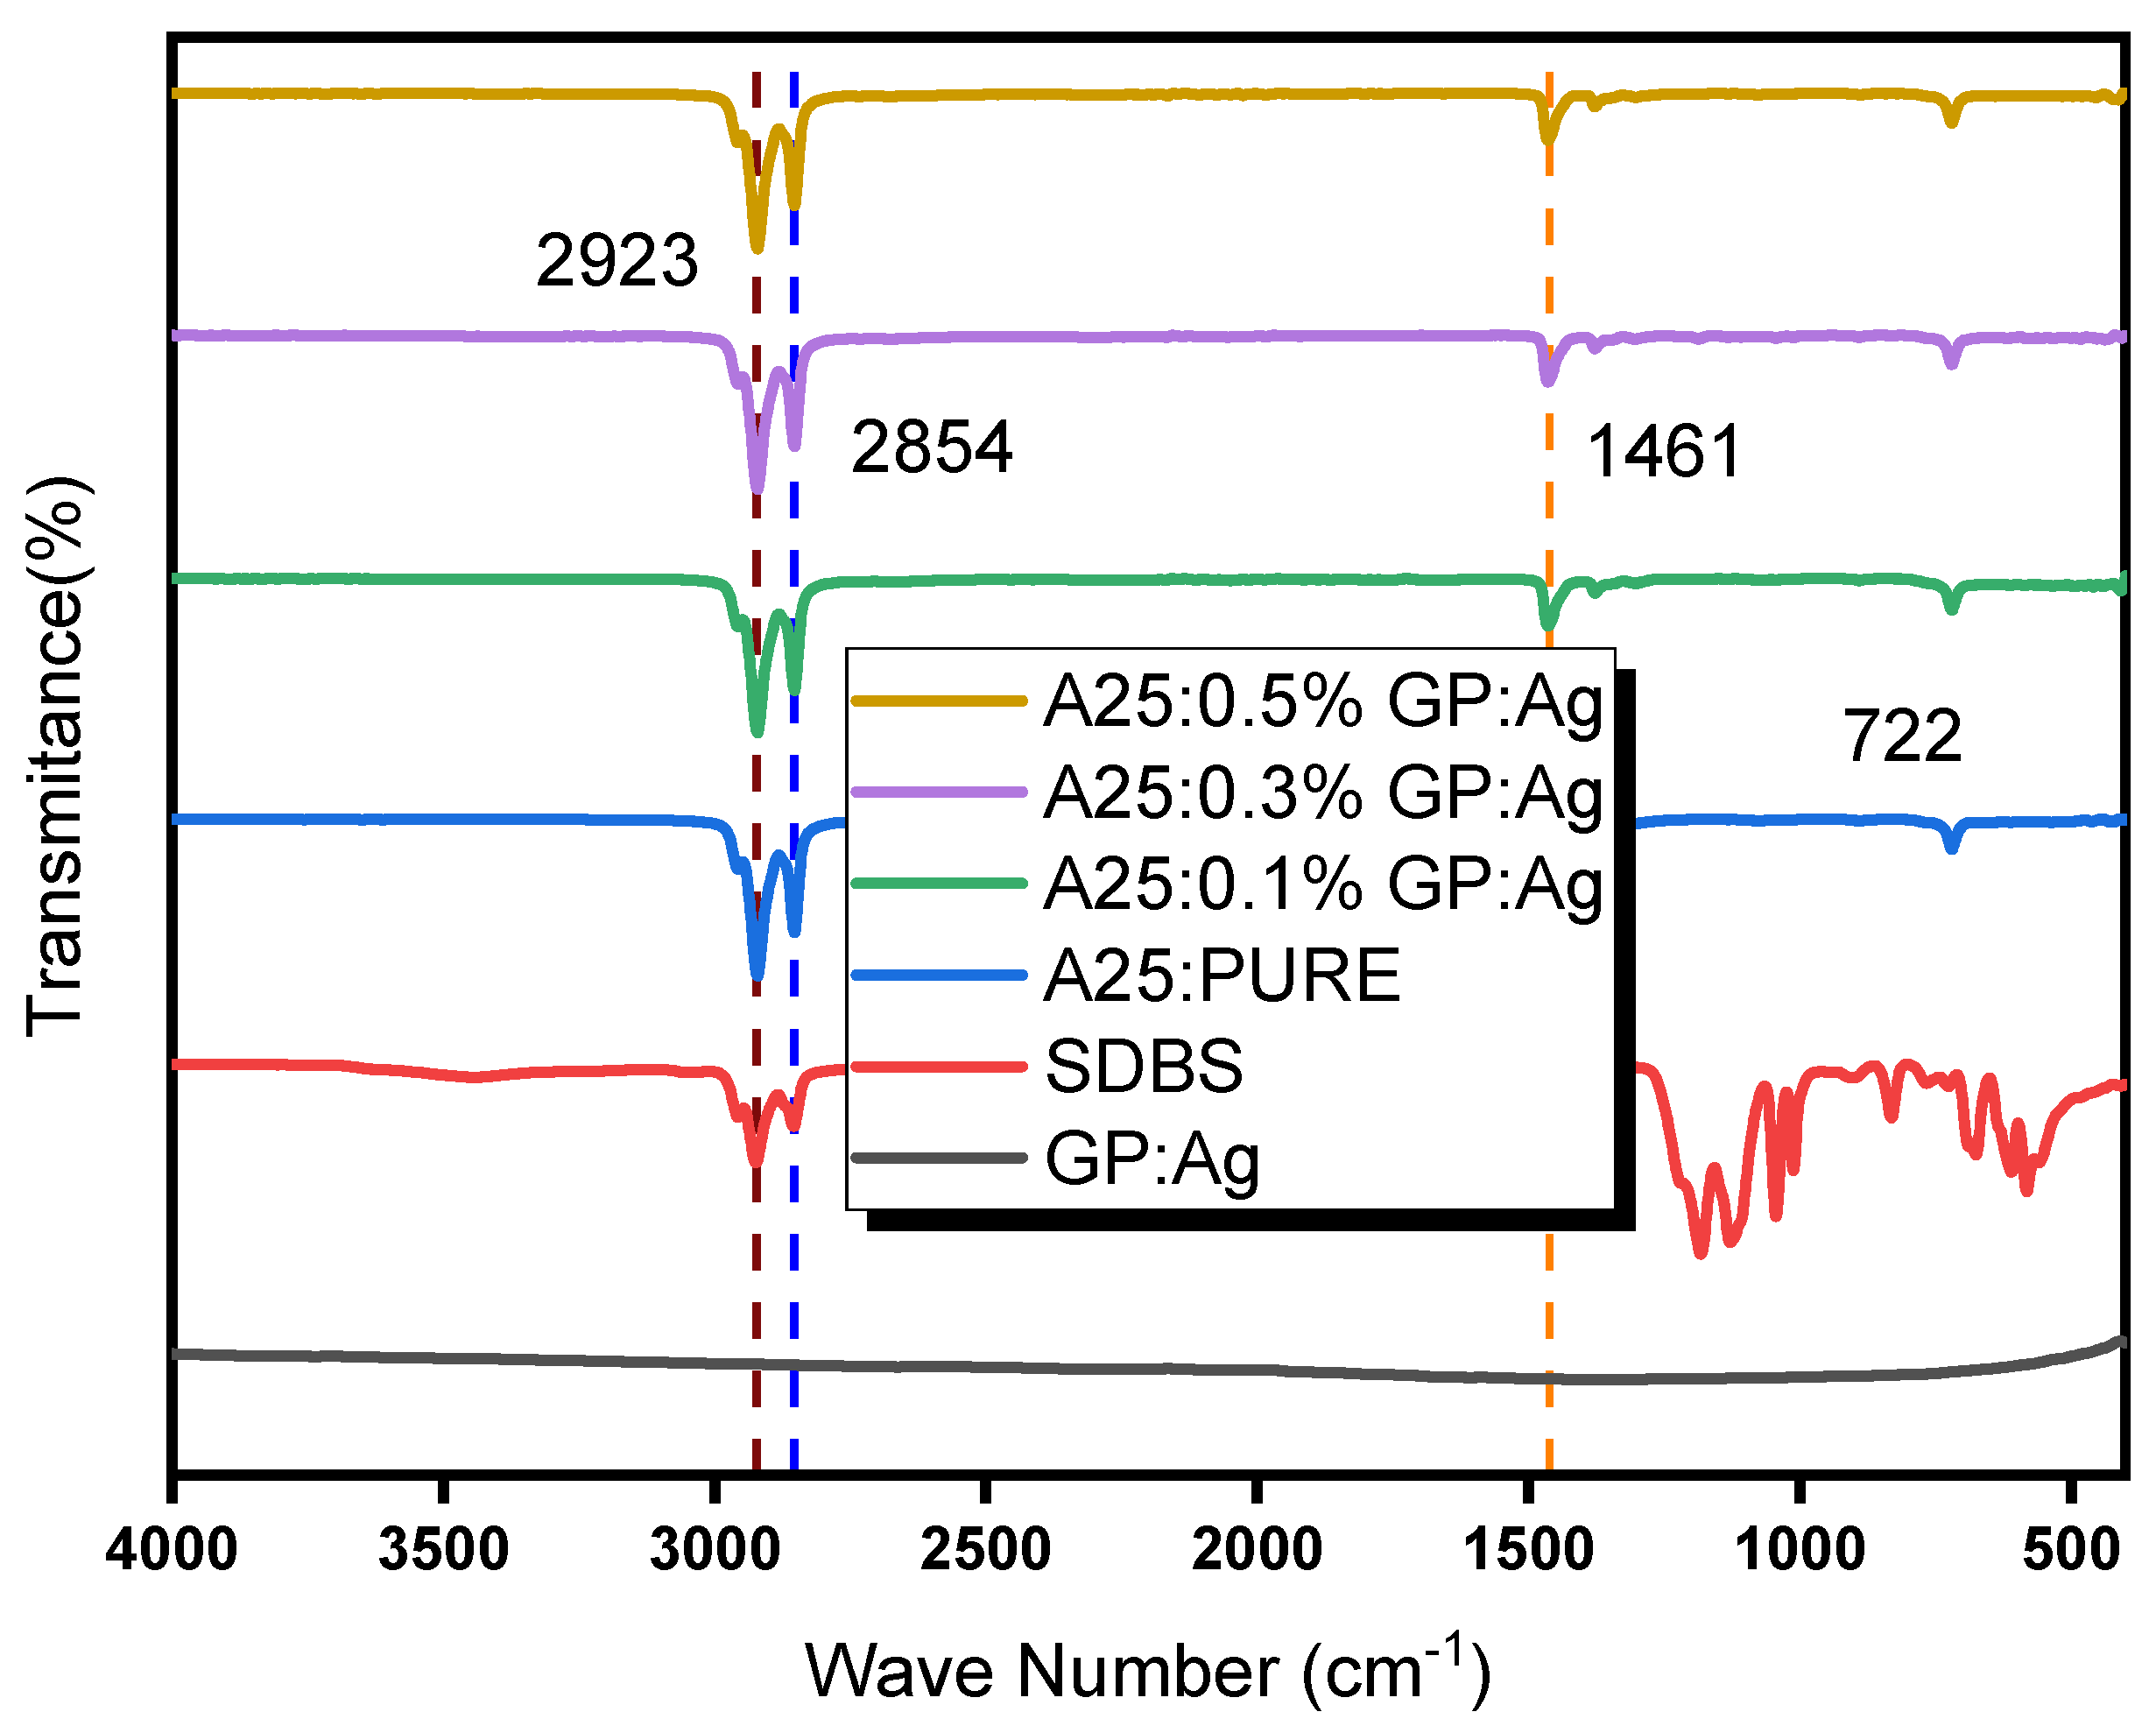
3.2. FT-IR Spectrum Analysis of Hybrid Nanocomposites
3.3. UV-Visible Spectrometer Spectrum Analysis of Nanocomposites
3.4. Thermal Stability of Paraffin/Graphene: Silver Nanocomposites
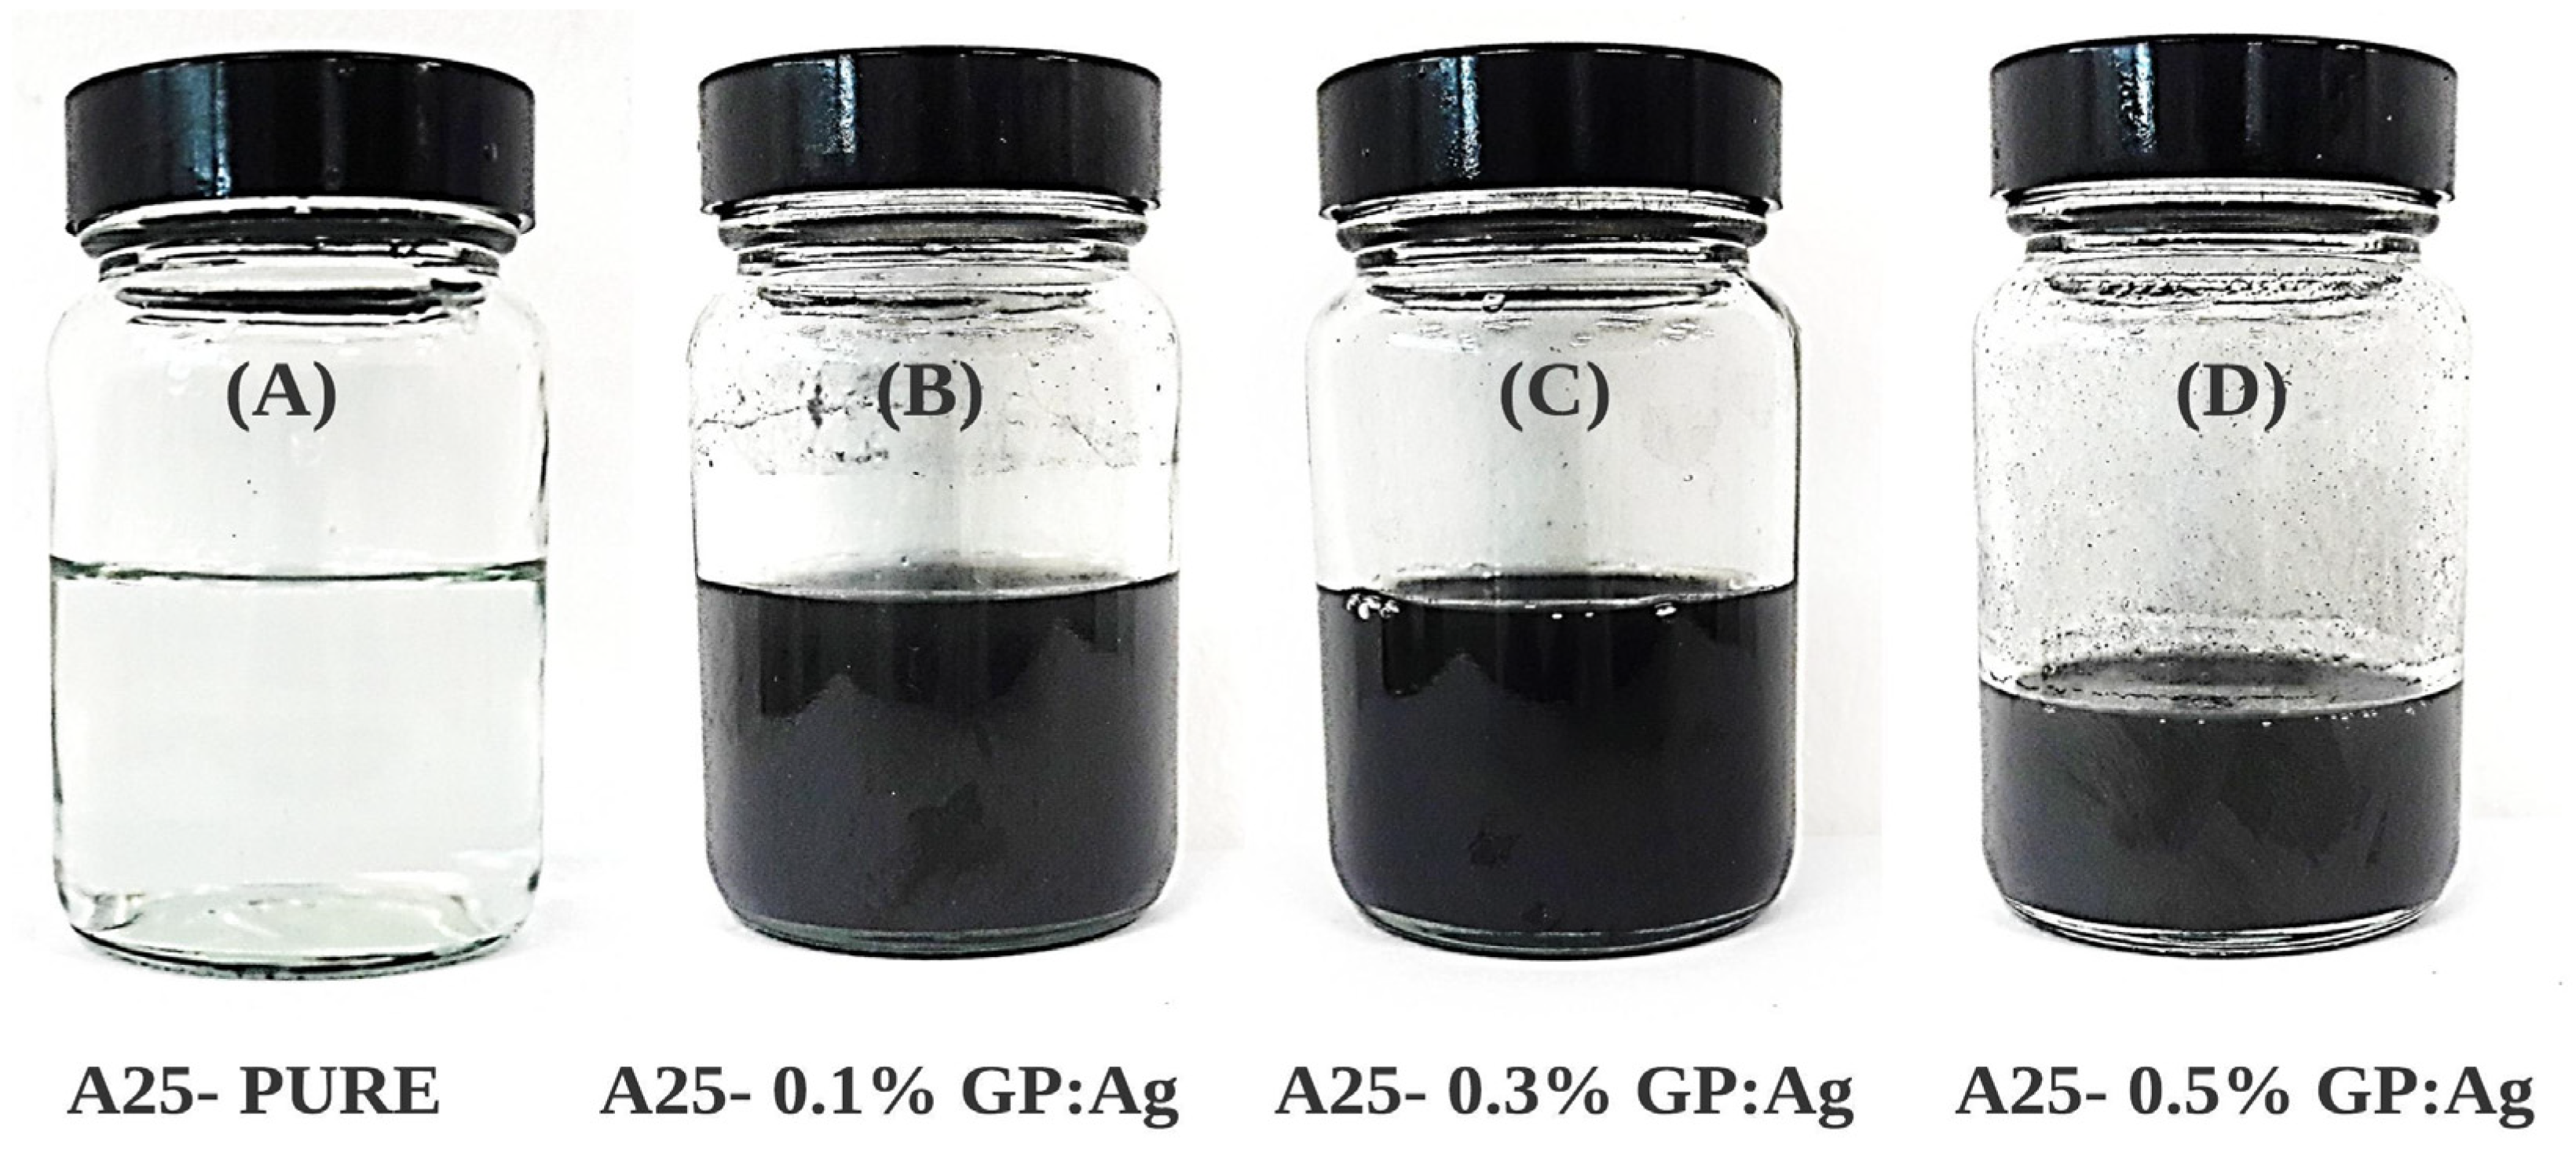
3.5. Effect of Graphene: Silver Dispersion on the Thermal Behavior of Hybrid Nanocomposites

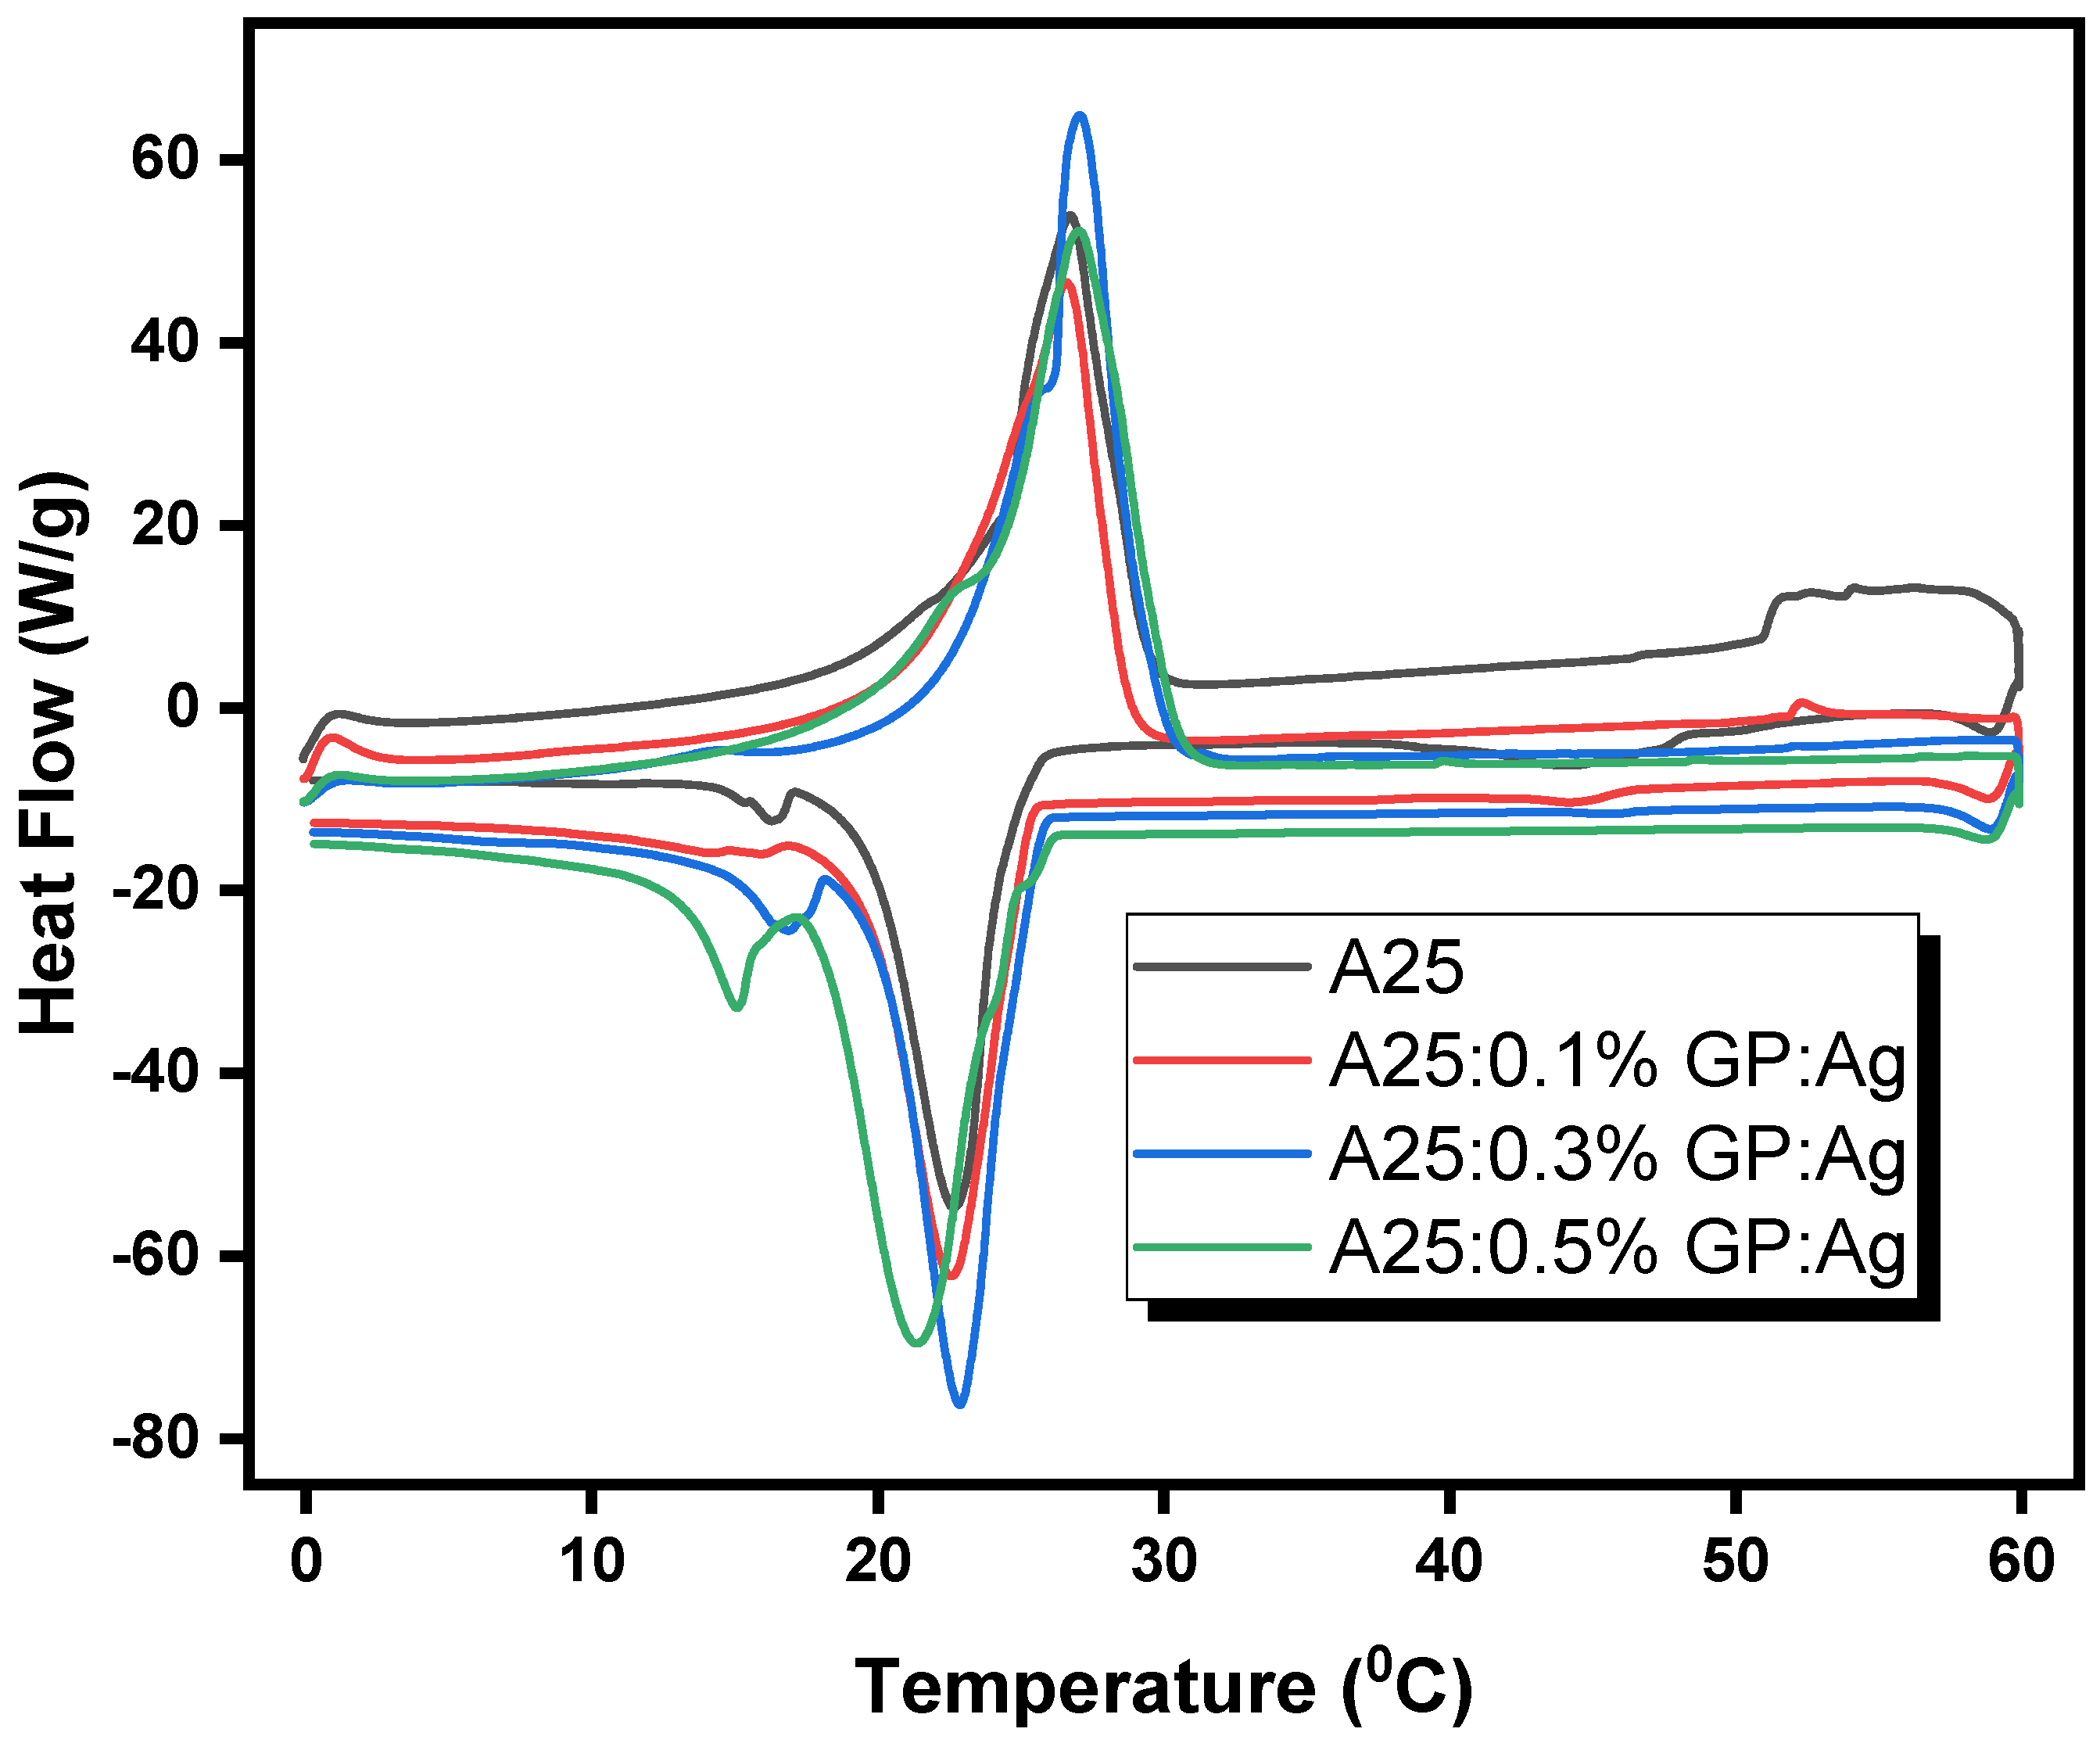
| Sample | Enthalpy of Melting (J/g) | Melting Point Tm (°C) | Enthalpy of Freezing (J/g) | Freezing Point Tf (°C) | Degree of Supercooling (°C) | Heat Storage Efficiency (%) |
|---|---|---|---|---|---|---|
| A25-0.0% | 253.52 | 26.72 | 241.98 | 22.68 | 4.04 | 4.55 |
| A25-0.1% | 265.75 | 26.60 | 253.32 | 22.58 | 4.02 | 4.68 |
| A25-0.3% | 270.32 | 27.07 | 262.36 | 22.86 | 4.21 | 2.94 |
| A25-0.5% | 269.90 | 27.03 | 256.40 | 21.38 | 5.65 | 5.00 |
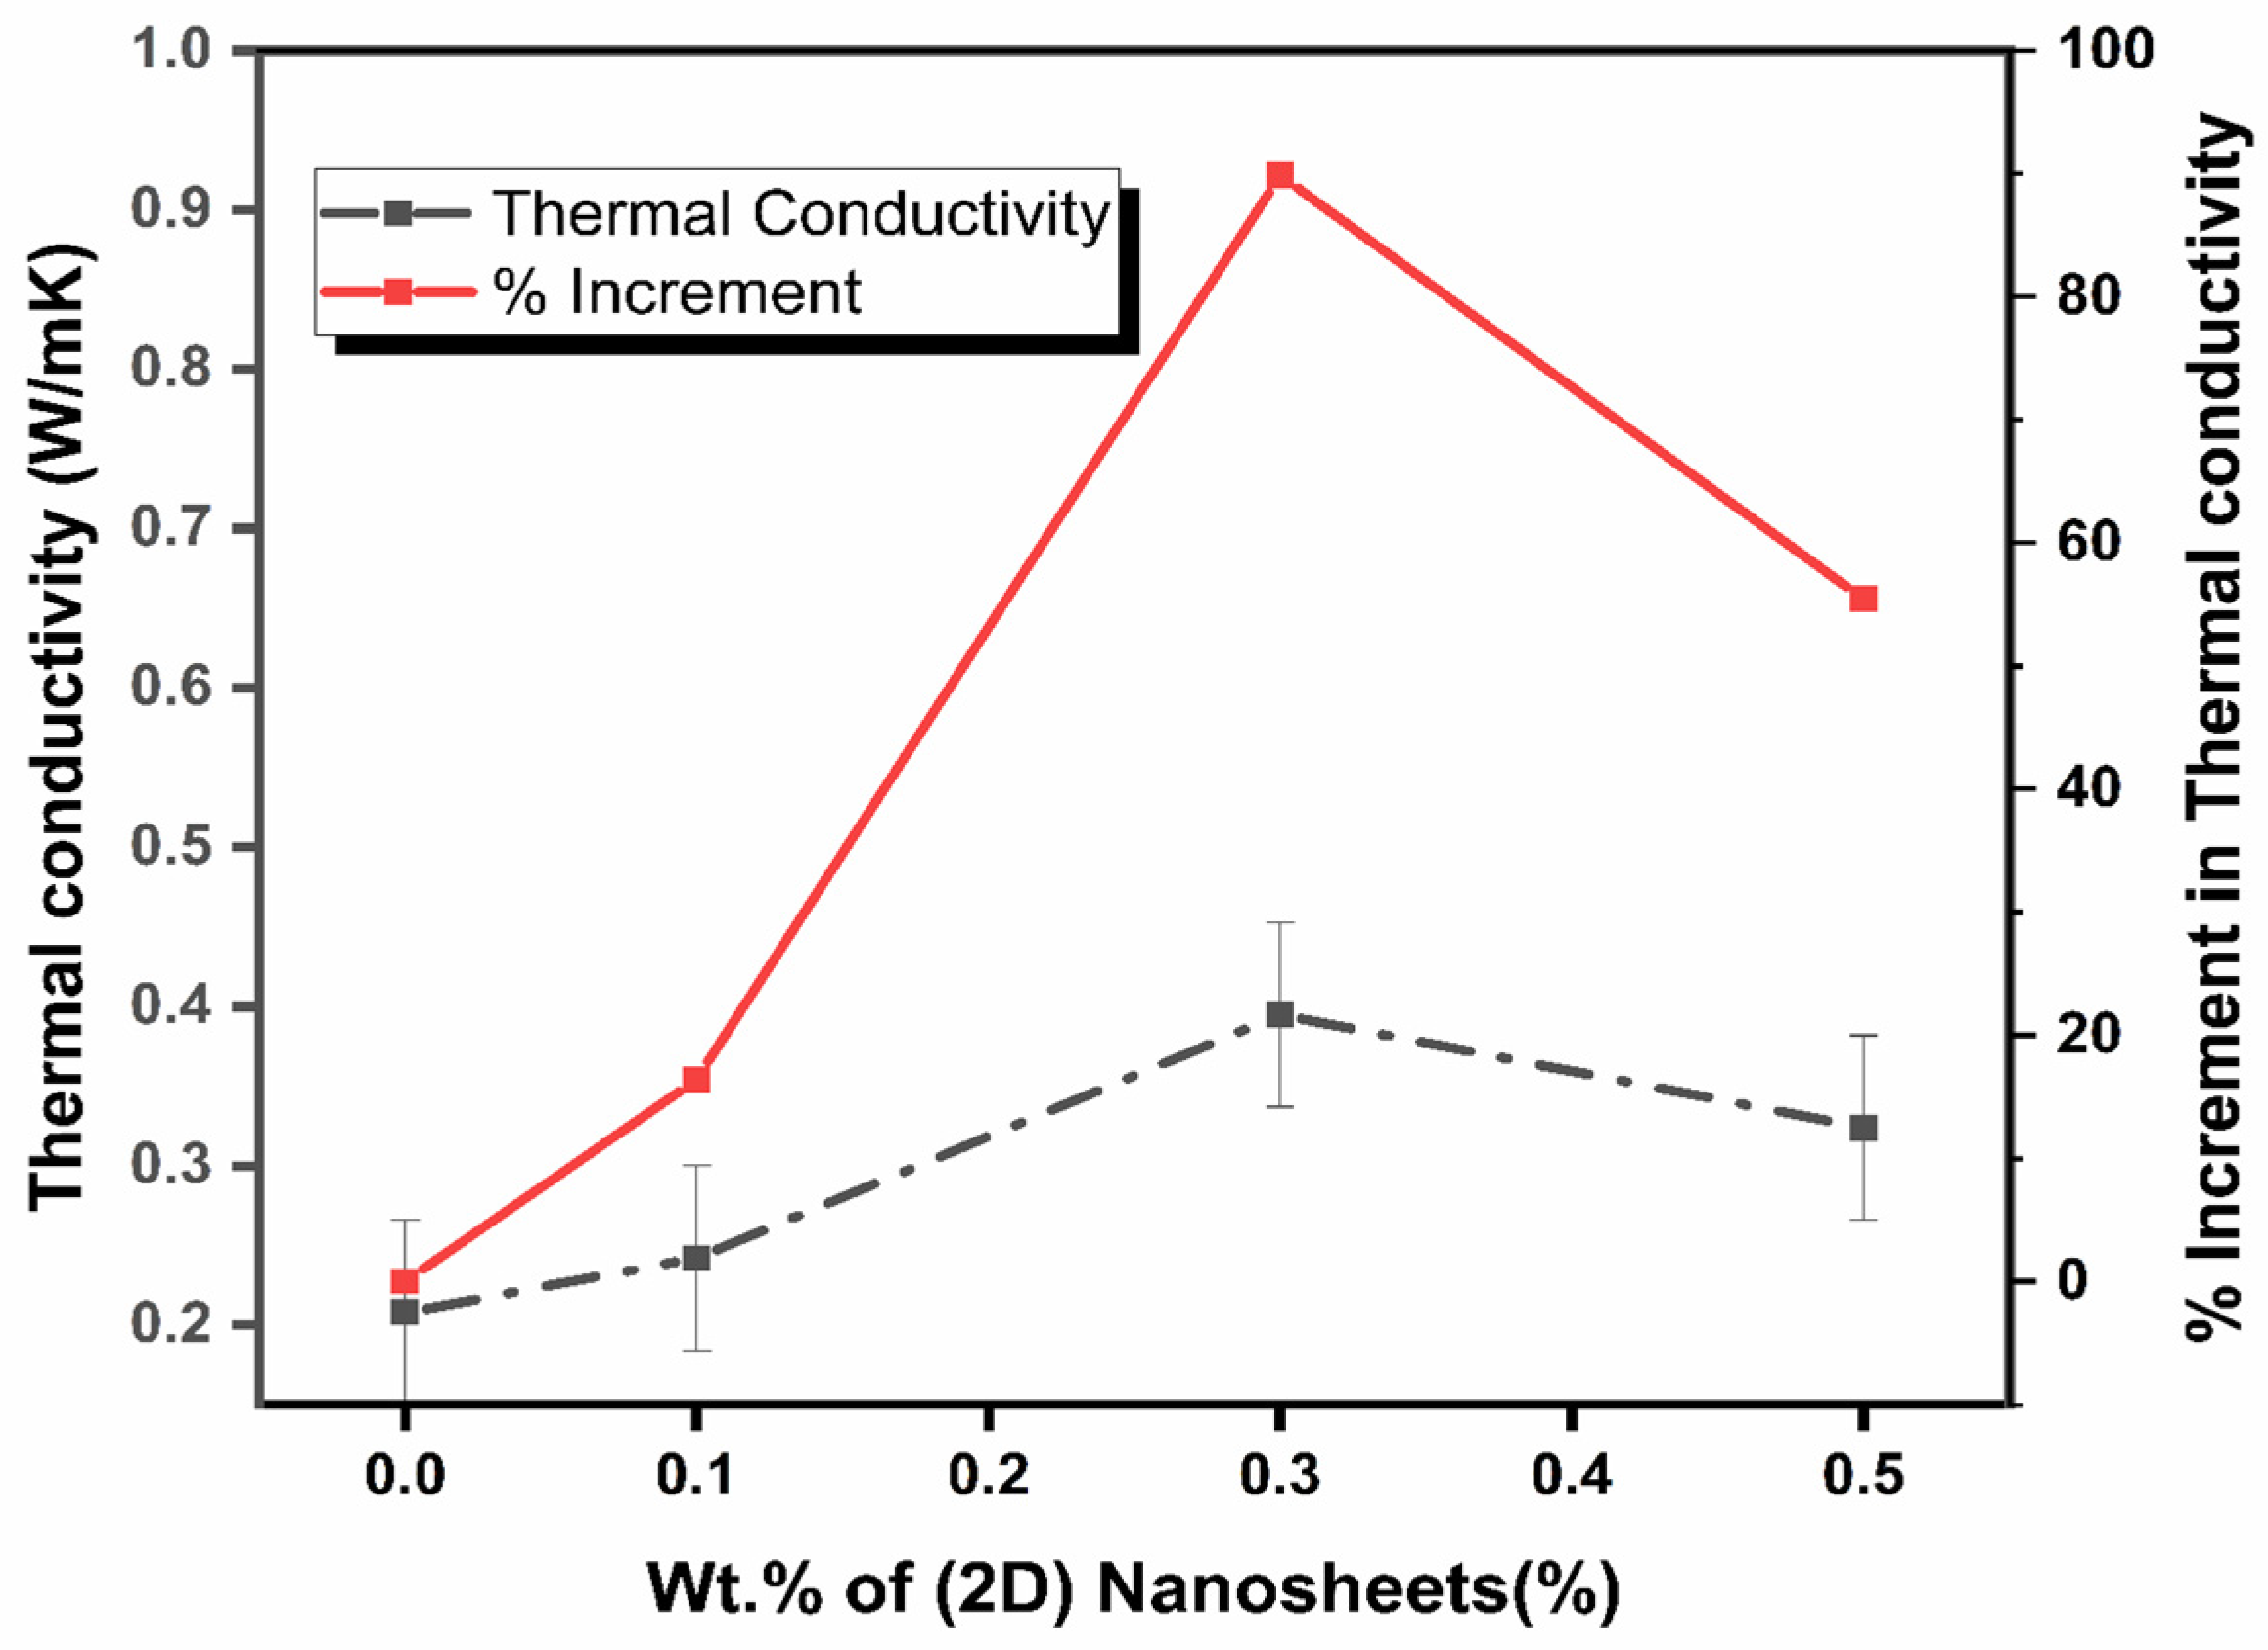
3.6. Thermal Conductivity of Hybrid Nanocomposites
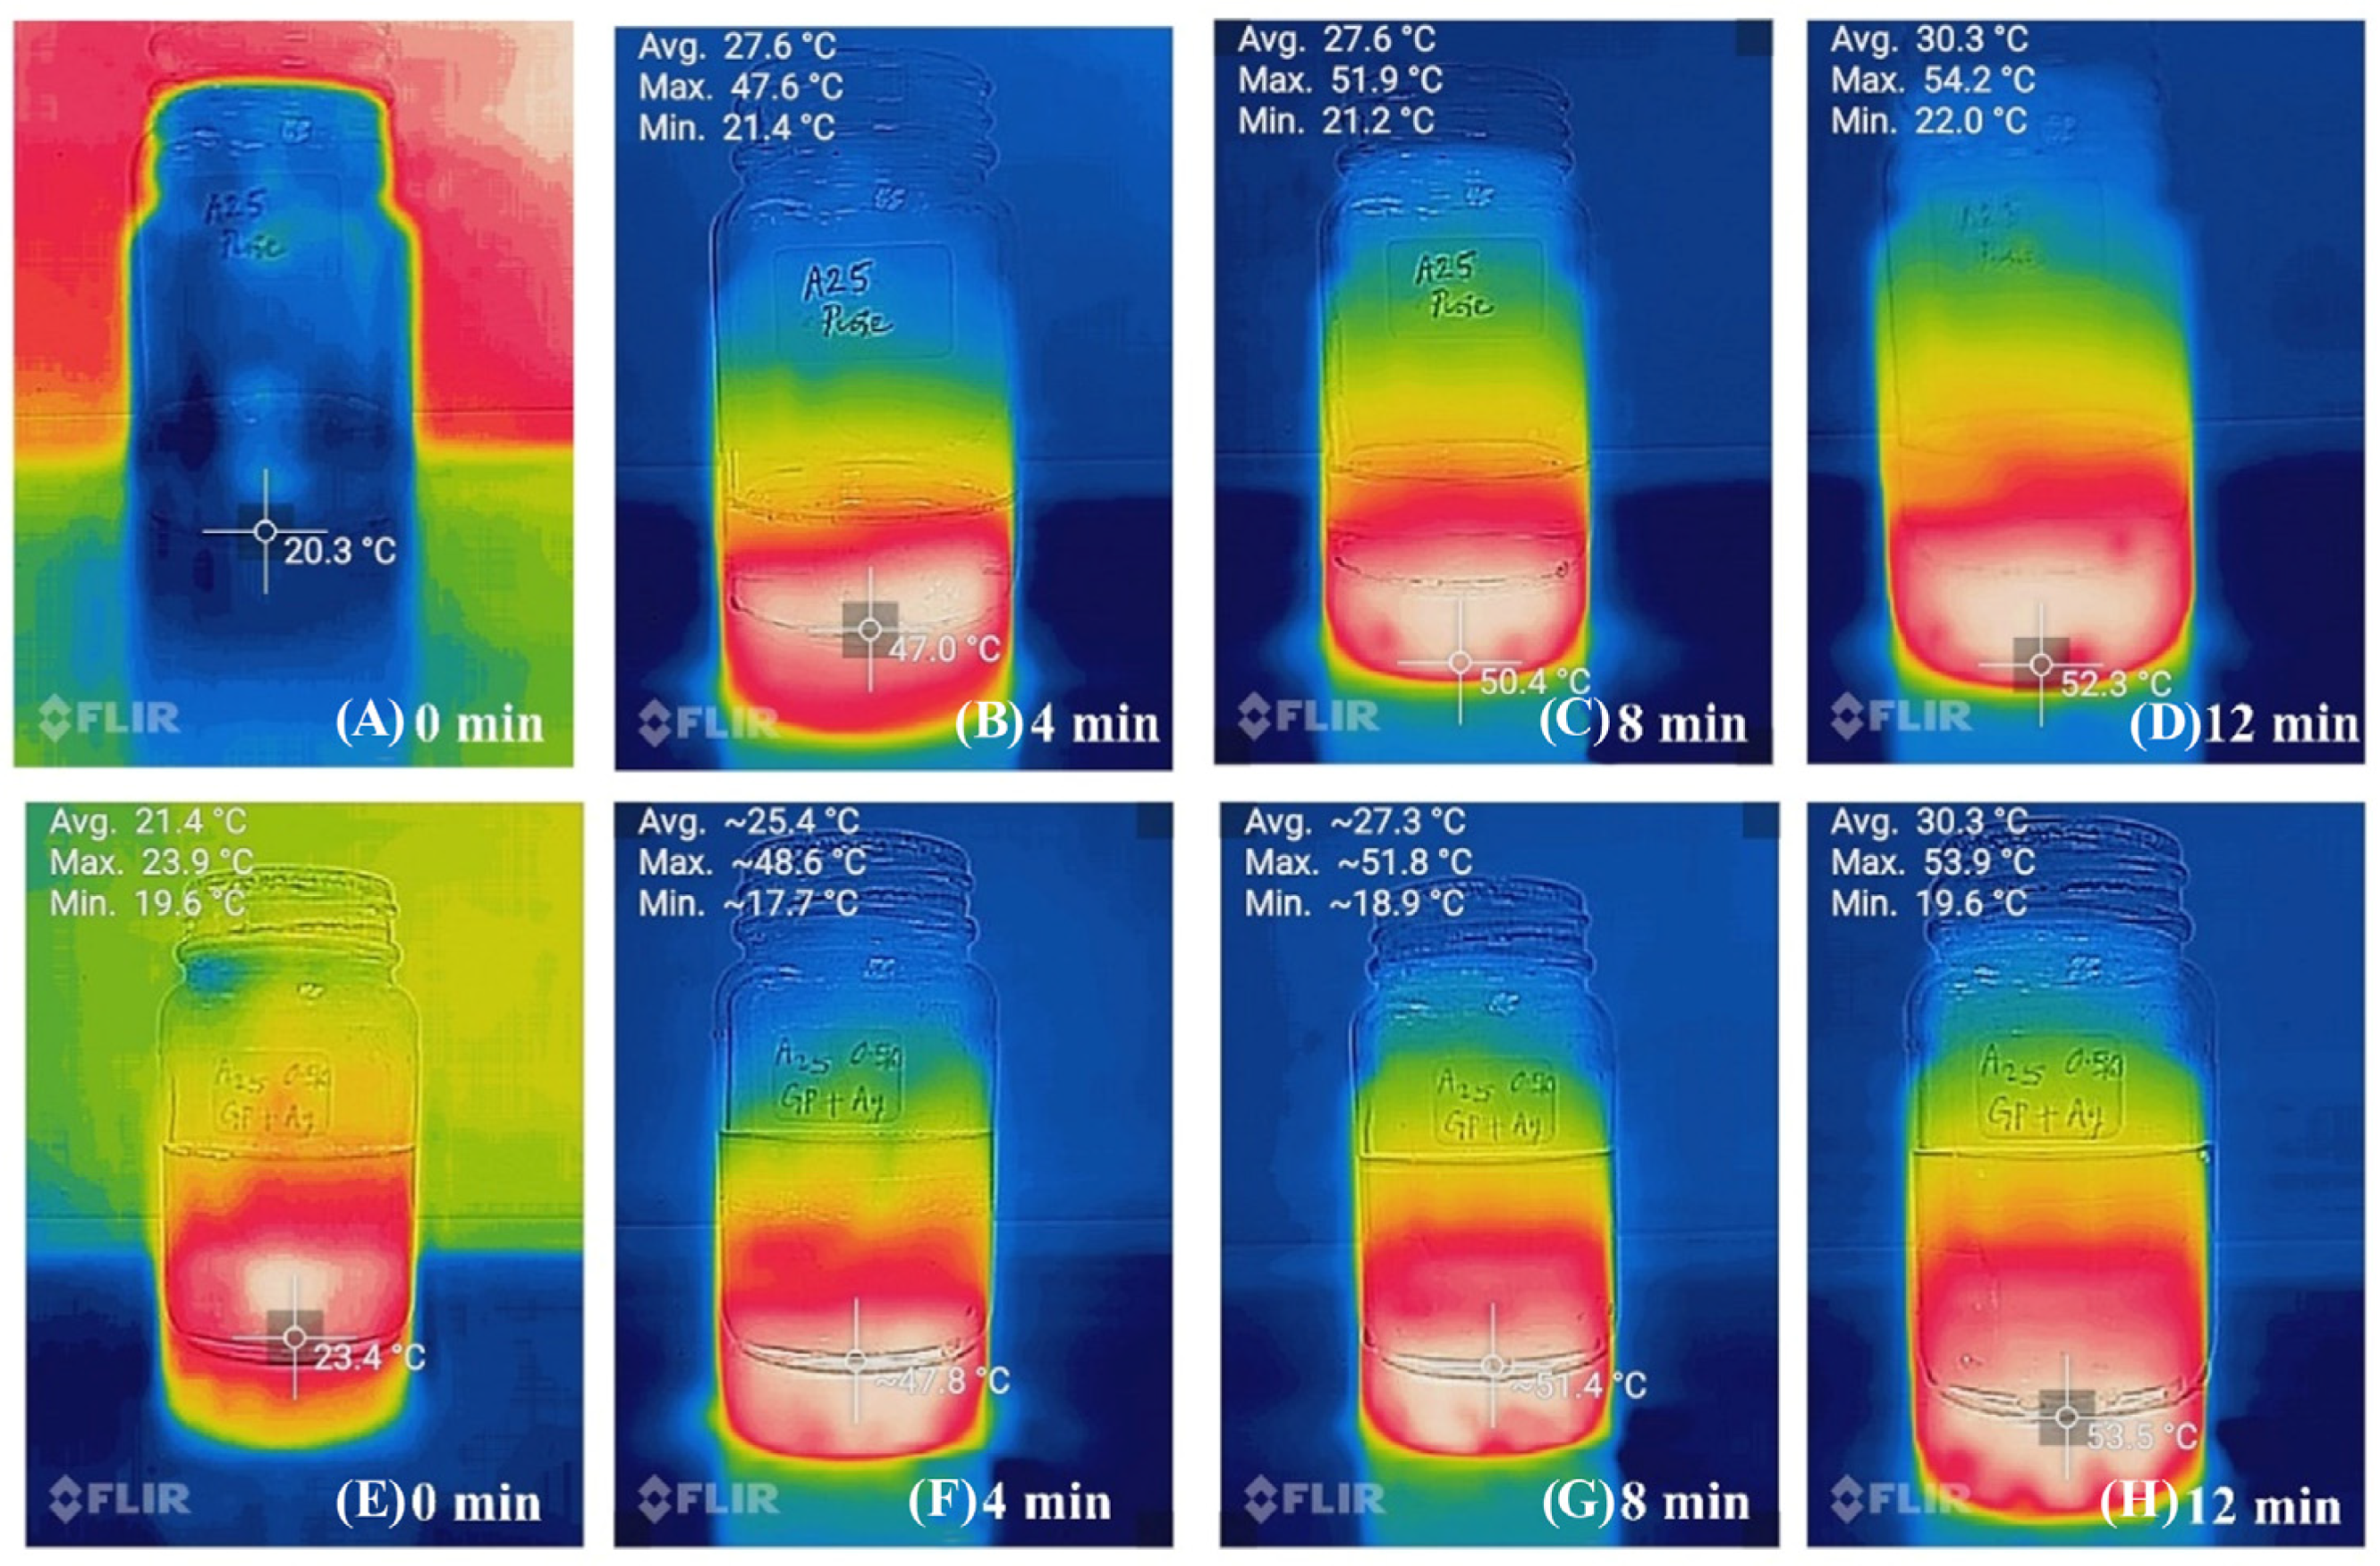
3.7. Infrared Thermal Imaging
4. Conclusions
- (1)
- The novel hybrid nano-enhanced composite phase change material logged an increment in enthalpy in comparison with base (6.7%). An increment in enthalpy for nanocomposite is preferable as it can retain more heat, even with the same amount of PCM.
- (2)
- Thermal conductivity was increase by a maximum of 90% with the dispersion of graphene: silver nanofillers (0.3 wt%). Enrichment in thermal conductivity causes a drop in interfacial thermal resistance, and this improves the charging efficiency of HNePCM when used for thermal energy storage.
- (3)
- The pure paraffin had a maximal solar transmissivity of around 87%, and the A25-0.3% sample (0.3% nanofiller loaded) clocked a maximum transmissivity of 0.01%. This result shows that the hybrid nanocomposite could be used in shielding UV rays.
- (4)
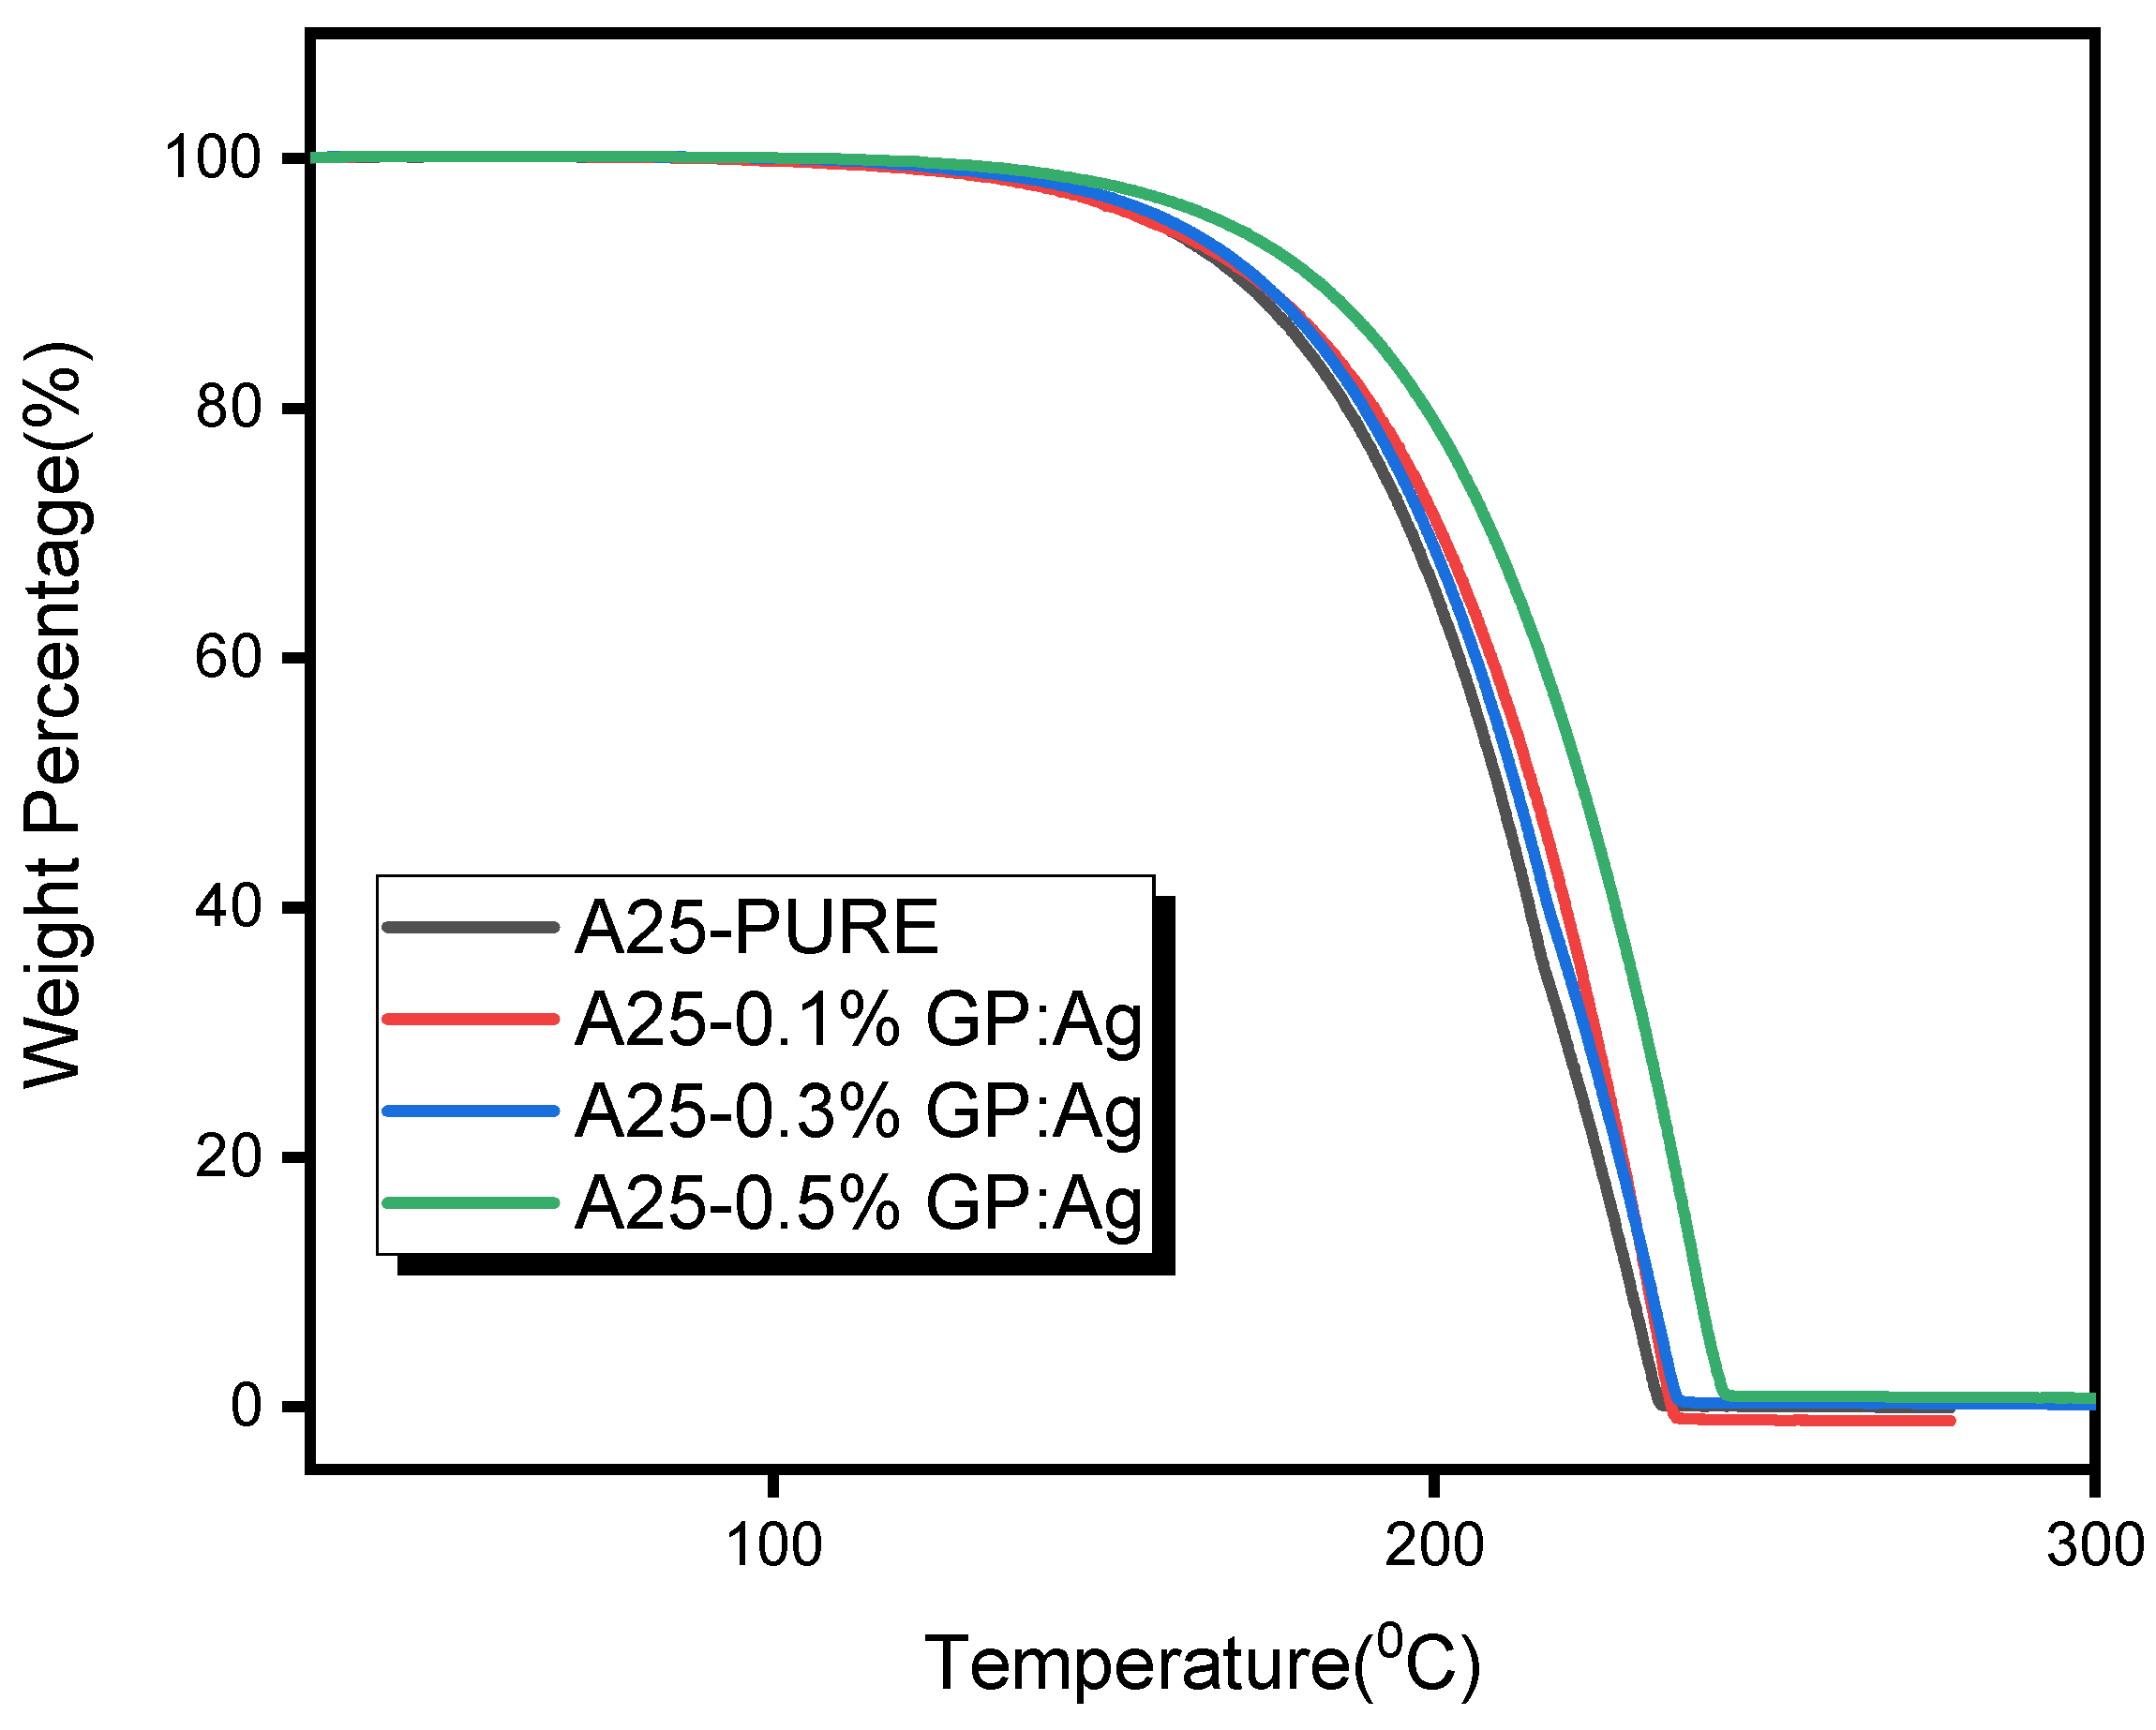
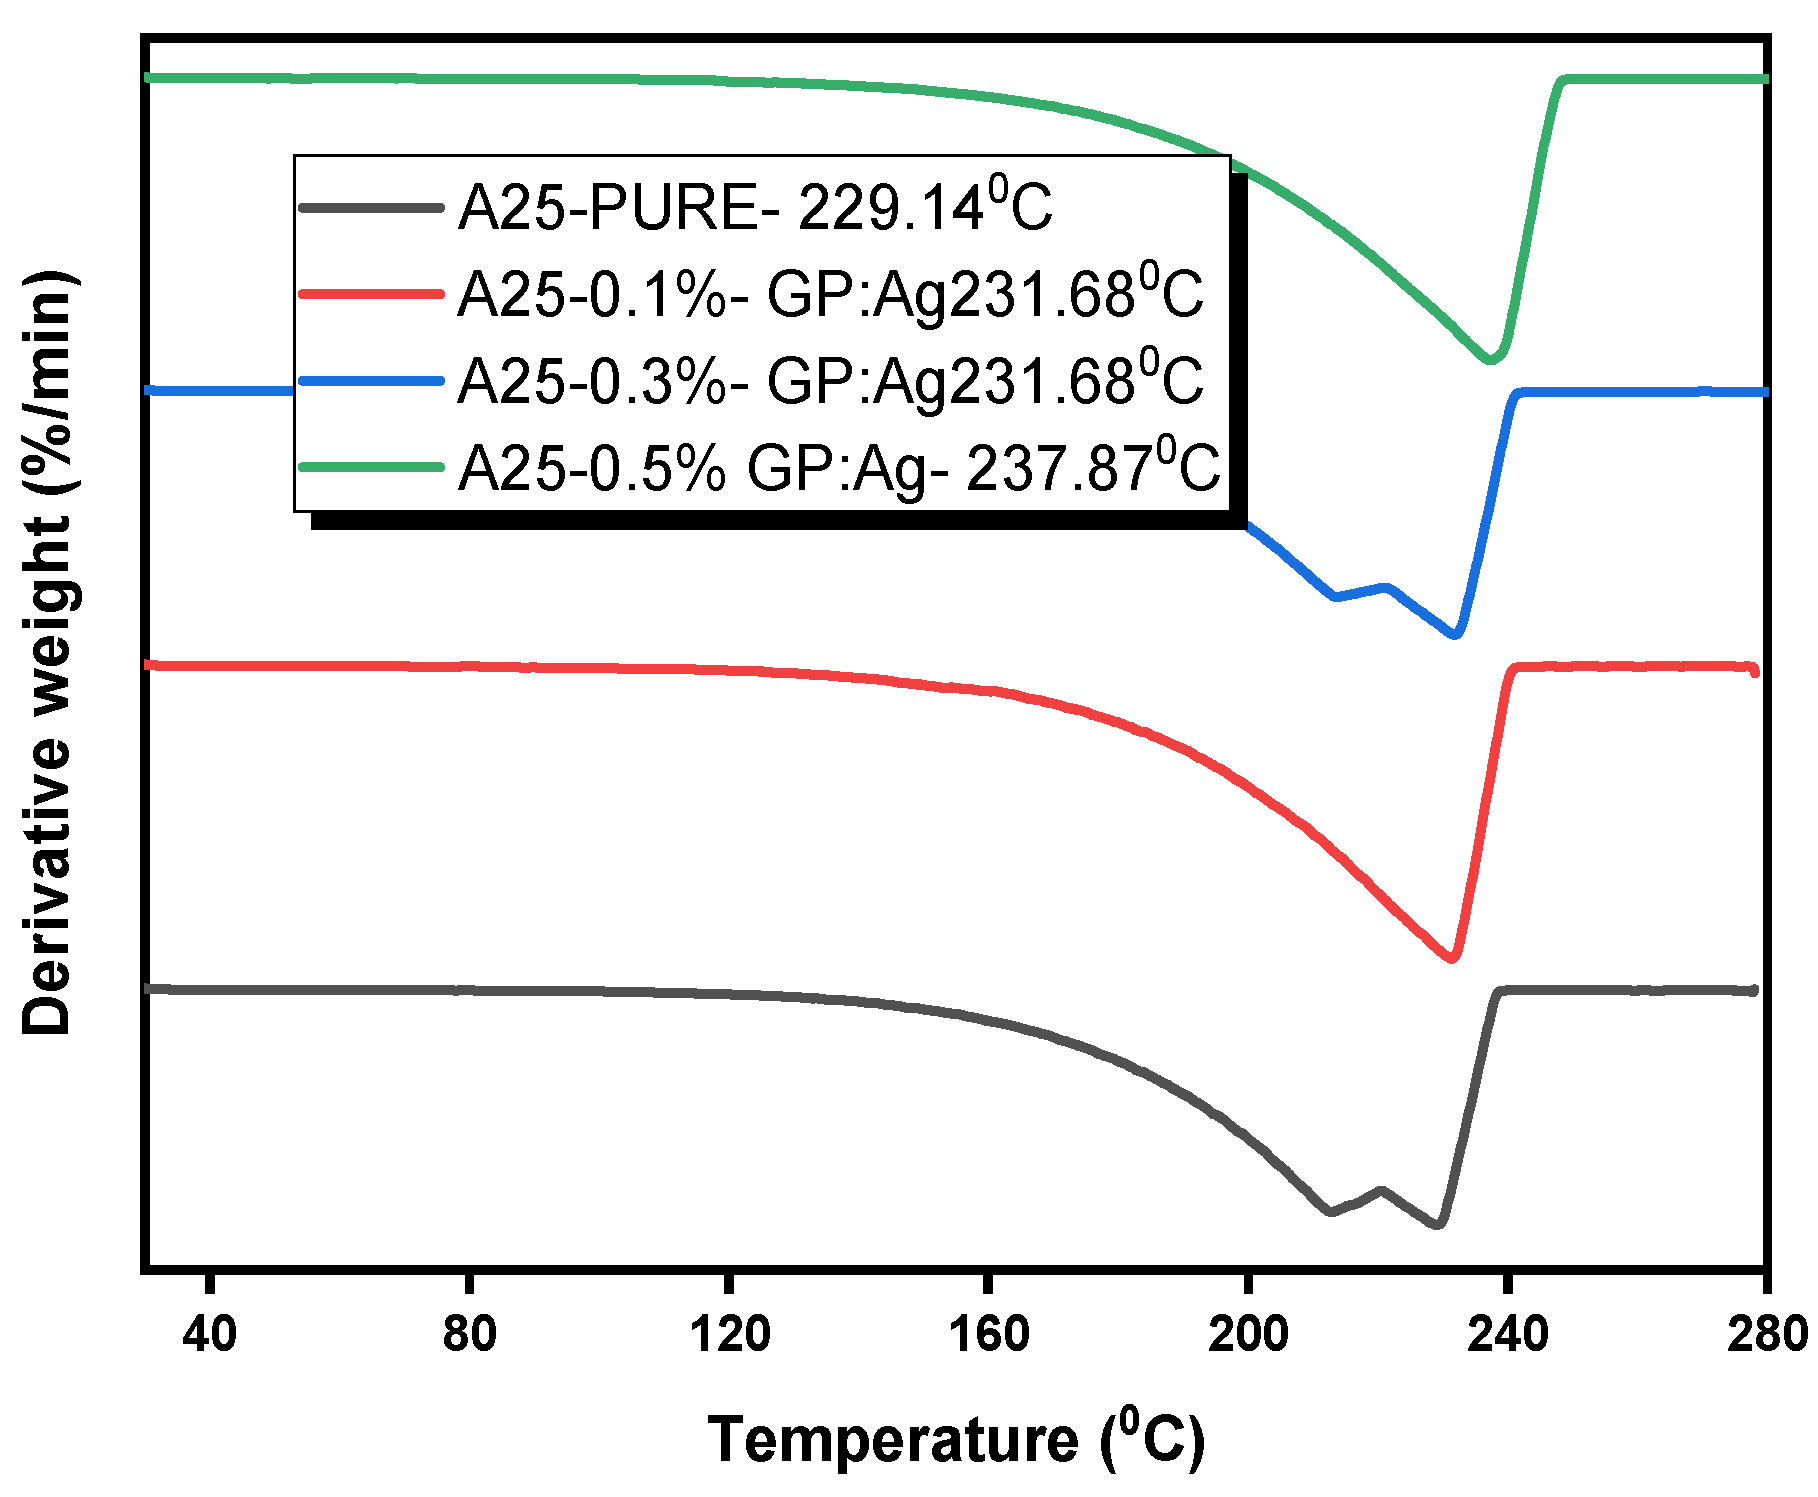
- The thermal stability of the composites was also enhanced with the nanofiller infusion. A maximum increment of 5.7 °C was found in THRI results.
- (5)
- Moreover, FT-IR results confirm that the synthesized samples were composites.
Author Contributions
Funding
Institutional Review Board Statement
Informed Consent Statement
Data Availability Statement
Conflicts of Interest
References
- Cui, Y.; Zhu, J.; Zhang, F.; Shao, Y.; Xue, Y. Current Status and Future Development of Hybrid PV/T System with PCM Module: 4E (Energy, Exergy, Economic and Environmental) Assessments. Renew. Sustain. Energy Rev. 2022, 158, 112147. [Google Scholar] [CrossRef]
- Du, R.; Wu, Y.; Yang, Y.; Zhai, T.; Zhou, T.; Shang, Q.; Zhu, L.; Shang, C.; Guo, Z. Porosity Engineering of MOF-Based Materials for Electrochemical Energy Storage. Adv. Energy Mater. 2021, 2100154, 2100154. [Google Scholar] [CrossRef]
- Jacob, J.; Pandey, A.K.; Rahim, N.A.; Selvaraj, J.; Samykano, M.; Saidur, R.; Tyagi, V.V. Concentrated Photovoltaic Thermal (CPVT) Systems: Recent Advancements in Clean Energy Applications, Thermal Management and Storage. J. Energy Storage 2022, 45, 103369. [Google Scholar] [CrossRef]
- Ismail, K.A.R.; Lino, F.A.M.; Teggar, M.; Arıcı, M.; Machado, P.L.O.; Alves, T.A.; De Paula, A.C.O.; Benhorma, A. A Comprehensive Review on Phase Change Materials and Applications in Buildings and Components. ASME Open J. Eng. 2022, 1, 011049. [Google Scholar]
- Cheng, P.; Chen, X.; Gao, H.; Zhang, X.; Tang, Z.; Li, A.; Wang, G. Different Dimensional Nanoadditives for Thermal Conductivity Enhancement of Phase Change Materials: Fundamentals and Applications. Nano Energy 2021, 85, 105948. [Google Scholar] [CrossRef]
- Zhang, N.; Yuan, Y.; Cao, X.; Du, Y.; Zhang, Z.; Gui, Y. Latent Heat Thermal Energy Storage Systems with Solid–Liquid Phase Change Materials: A Review. Adv. Eng. Mater. 2018, 20, 1–30. [Google Scholar] [CrossRef]
- D’Oliveira, E.J.; Pereira, S.C.C.; Groulx, D.; Azimov, U. Thermophysical Properties of Nano-Enhanced Phase Change Materials for Domestic Heating Applications. J. Energy Storage 2022, 46, 103794. [Google Scholar] [CrossRef]
- Magendran, S.S.; Khan, F.S.A.; Mubarak, N.M.; Vaka, M.; Walvekar, R.; Khalid, M.; Abdullah, E.C.; Nizamuddin, S.; Karri, R.R. Synthesis of Organic Phase Change Materials (PCM) for Energy Storage Applications: A Review. Nano-Struct. Nano-Objects 2019, 20, 100399. [Google Scholar] [CrossRef]
- Martín, M.; Villalba, A.; Fernández, A.I.; Barreneche, C. Energy & Buildings Development of New Nano-Enhanced Phase Change Materials (NEPCM) to Improve Energy Efficiency in Buildings: Lab-Scale Characterization. Energy Build. 2019, 192, 75–83. [Google Scholar] [CrossRef]
- Paul, J.; Kadirgama, K.; Samykano, M.; Pandey, A.K.; Tyagi, V.V. A Comprehensive Review on Thermophysical Properties and Solar Thermal Applications of Organic Nano Composite Phase Change Materials. J. Energy Storage 2022, 45, 103415. [Google Scholar] [CrossRef]
- Leong, K.Y.; Abdul Rahman, M.R.; Gurunathan, B.A. Nano-Enhanced Phase Change Materials: A Review of Thermo-Physical Properties, Applications and Challenges. J. Energy Storage 2019, 21, 18–31. [Google Scholar] [CrossRef]
- Chen, L.; Zou, R.; Xia, W.; Liu, Z.; Shang, Y.; Zhu, J.; Wang, Y.; Lin, J.; Xia, D.; Cao, A. Electro- and Photodriven Phase Change Composites Based on Wax-Infiltrated Carbon Nanotube Sponges. ACS Nano 2012, 6, 10884–10892. [Google Scholar] [CrossRef]
- Ma, T.; Liu, Z.; Wen, J.; Gao, Y.; Ren, X.; Chen, H.; Jin, C.; Ma, X.L.; Xu, N.; Cheng, H.M.; et al. Tailoring the Thermal and Electrical Transport Properties of Graphene Films by Grain Size Engineering. Nat. Commun. 2017, 8, 1–9. [Google Scholar] [CrossRef] [PubMed]
- Kargar, F.; Barani, Z.; Salgado, R.; Debnath, B.; Lewis, J.S.; Aytan, E.; Lake, R.K.; Balandin, A.A. Thermal Percolation Threshold and Thermal Properties of Composites with High Loading of Graphene and Boron Nitride Fillers. ACS Appl. Mater. Interfaces 2018, 10, 37555–37565. [Google Scholar] [CrossRef] [PubMed]
- Zheng, R.; Gao, J.; Wang, J.; Chen, G. Reversible Temperature Regulation of Electrical and Thermal Conductivity Using Liquid-Solid Phase Transitions. Nat. Commun. 2011, 2, 289. [Google Scholar] [CrossRef]
- Suresh, C.; Kumar Hotta, T.; Saha, S.K. Phase Change Material Incorporation Techniques in Building Envelopes for Enhancing the Building Thermal Comfort-A Review. Energy Build. 2022, 268, 112225. [Google Scholar] [CrossRef]
- George, M.; Pandey, A.K.; Abd, N.; Tyagi, V.V.; Shahabuddin, S.; Saidur, R. A Novel Polyaniline (PANI)/Para Ffi n Wax Nano Composite Phase Change Material: Superior Transition Heat Storage Capacity, Thermal Conductivity and Thermal Reliability. Sol. Energy 2020, 204, 448–458. [Google Scholar] [CrossRef]
- Habib, N.A.; Ali, A.J.; Chaichan, M.T.; Kareem, M. Carbon Nanotubes/Paraffin Wax Nanocomposite for Improving the Performance of a Solar Air Heating System. Therm. Sci. Eng. Prog. 2021, 23, 100877. [Google Scholar] [CrossRef]
- Sheng, N.; Rao, Z.; Zhu, C.; Habazaki, H. Honeycomb Carbon Fibers Strengthened Composite Phase Change Materials for Superior Thermal Energy Storage. Appl. Therm. Eng. 2020, 164, 114493. [Google Scholar] [CrossRef]
- Joseph, M.; Sajith, V. Graphene Enhanced Paraffin Nanocomposite Based Hybrid Cooling System for Thermal Management of Electronics. Appl. Therm. Eng. 2019, 163, 114342. [Google Scholar] [CrossRef]
- Aslfattahi, N.; Saidur, R.; Arifutzzaman, A.; Sadri, R.; Bimbo, N.; Sabri, M.F.M.; Maughan, P.A.; Bouscarrat, L.; Dawson, R.J.; Said, S.M.; et al. Experimental Investigation of Energy Storage Properties and Thermal Conductivity of a Novel Organic Phase Change Material/MXene as A New Class of Nanocomposites. J. Energy Storage 2020, 27, 101115. [Google Scholar] [CrossRef]
- Paul, J.; Pandey, A.K.; Mishra, Y.N.; Said, Z.; Mishra, Y.K.; Ma, Z.; Jacob, J.; Kadirgama, K.; Samykano, M.; Tyagi, V.V. Nano-Enhanced Organic Form Stable PCMs for Medium Temperature Solar Thermal Energy Harvesting: Recent Progresses, Challenges, and Opportunities. Renew. Sustain. Energy Rev. 2022, 161, 112321. [Google Scholar] [CrossRef]
- Wang, J.; Xie, H.; Xin, Z. Thermal Properties of Paraffin Based Composites Containing Multi-Walled Carbon Nanotubes. Thermochim. Acta 2009, 488, 39–42. [Google Scholar] [CrossRef]
- B, K.; Pandey, A.K.; Shahabuddin, S.; George, M.; Sharma, K.; Samykano, M.; Tyagi, V.V.; Saidur, R. Synthesis and Characterization of Conducting Polyaniline@cobalt-Paraffin Wax Nanocomposite as Nano-Phase Change Material: Enhanced Thermophysical Properties. Renew. Energy 2021, 173, 1057–1069. [Google Scholar] [CrossRef]
- Li, M. A Nano-Graphite/Paraffin Phase Change Material with High Thermal Conductivity. Appl. Energy 2013, 106, 25–30. [Google Scholar] [CrossRef]
- Sun, L.; Diao, R.; Yang, F.; Lin, B. Analysis of the Thermal Performance of the Embedded Composite Phase Change Energy Storage Wall. ACS Omega 2020, 5, 17005–17021. [Google Scholar] [CrossRef] [PubMed]
- Wang, S.; Wang, C.; Ji, X. Towards Understanding the Salt-Intercalation Exfoliation of Graphite into Graphene. RSC Adv. 2017, 7, 52252–52260. [Google Scholar] [CrossRef]
- Ramesh, B.P.; Blau, W.J.; Tyagi, P.K.; Misra, D.S.; Ali, N.; Gracio, J.; Cabral, G.; Titus, E. Thermogravimetric Analysis of Cobalt-Filled Carbon Nanotubes Deposited by Chemical Vapour Deposition. Thin Solid Films 2006, 494, 128–132. [Google Scholar] [CrossRef]
- Cheng, C.; Li, D. Solvated Graphenes: An Emerging Class of Functional Soft Materials. Adv. Mater. 2013, 25, 13–30. [Google Scholar] [CrossRef] [PubMed]
- Jacob, J.; Pandey, A.K.; Rahim, N.A.; Selvaraj, J.; Paul, J.; Samykano, M.; Saidur, R. Quantifying Thermophysical Properties, Characterization, and Thermal Cycle Testing of Nano-Enhanced Organic Eutectic Phase Change Materials for Thermal Energy Storage Applications. Sol. Energy Mater. Sol. Cells 2022, 248, 112008. [Google Scholar] [CrossRef]
- Aslfattahi, N.; Saidur, R.; Arifutzzaman, A.; Abdelrazik, A.S.; Samylingam, L.; Sabri, M.F.M.; Sidik, N.A.C. Improved Thermo-Physical Properties and Energy Efficiency of Hybrid PCM/Graphene-Silver Nanocomposite in a Hybrid CPV/Thermal Solar System. J. Therm. Anal. Calorim. 2022, 147, 1125–1142. [Google Scholar] [CrossRef]
- Mekaddem, N.; Ali, S.B.; Fois, M.; Hannachi, A. Paraffin/Expanded Perlite/Plaster as Thermal Energy Storage Composite. Energy Procedia 2019, 157, 1118–1129. [Google Scholar] [CrossRef]
- Allahyarzadeh, V.; Montazer, M.; Nejad, N.H.; Samadi, N. In Situ Synthesis of Nano Silver on Polyester Using NaOH/Nano TiO 2. J. Appl. Polym. Sci. 2013, 129, 892–900. [Google Scholar] [CrossRef]
- Kim, C.H.; Joo, C.K.; Chun, H.J.; Yoo, B.R.; Noh, D.I.; Shim, Y.B. Instrumental Studies on Silicone Oil Adsorption to the Surface of Intraocular Lenses. Appl. Surf. Sci. 2012, 262, 146–152. [Google Scholar] [CrossRef]
- Mansur, H.S.; Oréfice, R.L.; Mansur, A.A.P. Characterization of Poly(Vinyl Alcohol)/Poly(Ethylene Glycol) Hydrogels and PVA-Derived Hybrids by Small-Angle X-Ray Scattering and FTIR Spectroscopy. Polymer 2004, 45, 7193–7202. [Google Scholar] [CrossRef]
- Gueymard, C.A. The Sun’s Total and Spectral Irradiance for Solar Energy Applications and Solar Radiation Models. Sol. Energy 2004, 76, 423–453. [Google Scholar] [CrossRef]
- Wang, J.; Li, Y.; Deng, L.; Wei, N.; Weng, Y.; Dong, S.; Qi, D.; Qiu, J.; Chen, X.; Wu, T. High-Performance Photothermal Conversion of Narrow-Bandgap Ti2O3Nanoparticles. Adv. Mater. 2017, 29, 1–6. [Google Scholar] [CrossRef]
- Yang, Z.; Mao, Z.; Xiang, B.; Zhang, J. Construction of a Binary Channel Efficient Cooling Composites with Reflective and Phase-Change Properties. Compos. Part B Eng. 2019, 178, 107517. [Google Scholar] [CrossRef]
- Shaikh, S.; Lafdi, K.; Hallinan, K. Carbon Nanoadditives to Enhance Latent Energy Storage of Phase Change Materials. J. Appl. Phys. 2008, 103, 094302. [Google Scholar] [CrossRef]
- Arshad, A.; Jabbal, M.; Yan, Y. Preparation and Characteristics Evaluation of Mono and Hybrid Nano-Enhanced Phase Change Materials (NePCMs) for Thermal Management of Microelectronics. Energy Convers. Manag. 2020, 205, 112444. [Google Scholar] [CrossRef]
- Qu, Y.; Wang, S.; Zhou, D.; Tian, Y. Experimental Study on Thermal Conductivity of Paraffin-Based Shape-Stabilized Phase Change Material with Hybrid Carbon Nano-Additives. Renew. Energy 2020, 146, 2637–2645. [Google Scholar] [CrossRef]
- Balandin, A.A.; Ghosh, S.; Bao, W.; Calizo, I.; Teweldebrhan, D.; Miao, F.; Lau, C.N. Superior Thermal Conductivity of Single-Layer Graphene. Nano Lett. 2008, 8, 902–907. [Google Scholar] [CrossRef] [PubMed]
- Shahil, K.M.F.; Balandin, A.A. Graphene-Multilayer Graphene Nanocomposites as Highly Efficient Thermal Interface Materials. Nano Lett. 2012, 12, 861–867. [Google Scholar] [CrossRef] [PubMed]
- Sadasivuni, K.K.; Ponnamma, D.; Kim, J.; Thomas, S. Graphene-Based Polymer Nanocomposites in Electronics. In Graphene-Based Polymer Nanocomposites in Electronics; Sadasivuni, K.K., Ponnamma, D., Kim, J., Sabu, T., Eds.; Springer International Publishing: Berlin/Heidelberg, Germany, 2015; pp. 25–45. ISBN 9783319138756. [Google Scholar]
- Barkoula, N.M.; Alcock, B.; Cabrera, N.O.; Peijs, T. Flame-Retardancy Properties of Intumescent Ammonium Poly(Phosphate) and Mineral Filler Magnesium Hydroxide in Combination with Graphene. Polym. Polym. Compos. 2008, 16, 101–113. [Google Scholar]
- Baby, T.T.; Ramaprabhu, S. Investigation of Thermal and Electrical Conductivity of Graphene Based Nanofluids. J. Appl. Phys. 2010, 108, 124308. [Google Scholar] [CrossRef]
- Warzoha, R.J.; Fleischer, A.S. Heat Flow at Nanoparticle Interfaces. Nano Energy 2014, 6, 137–158. [Google Scholar] [CrossRef]


| Nanocomposites | Change in Thermal Conductivity (W/mK) | Change in Enthalpy (J/g) | Nanocomposites | Ref. |
|---|---|---|---|---|
| Paraffin/Graphene | 59.5% increment | 12.4% decline | Paraffin/Graphene | [20] |
| Paraffin/CNT | 39.0% increment | 0.90% decline | Paraffin/CNT | [23] |
| Paraffin/PANI | 46.7% increment | 8.20% increment | Paraffin/PANI | [17] |
| Paraffin/CuO | 63.5% increment | 7.80% increment | Paraffin/CuO | [17] |
| Paraffin/Co-PANI | 17.6%increment | 8.06% decline | Paraffin/Co-PANI | [24] |
| Paraffin/Nanographene | 741% increment | 13.10% decline | Paraffin/Nanographene | [25] |
| Paraffin/GP: Ag | 90% increment | 6.70% increment | Paraffin/GP: Ag | PW |
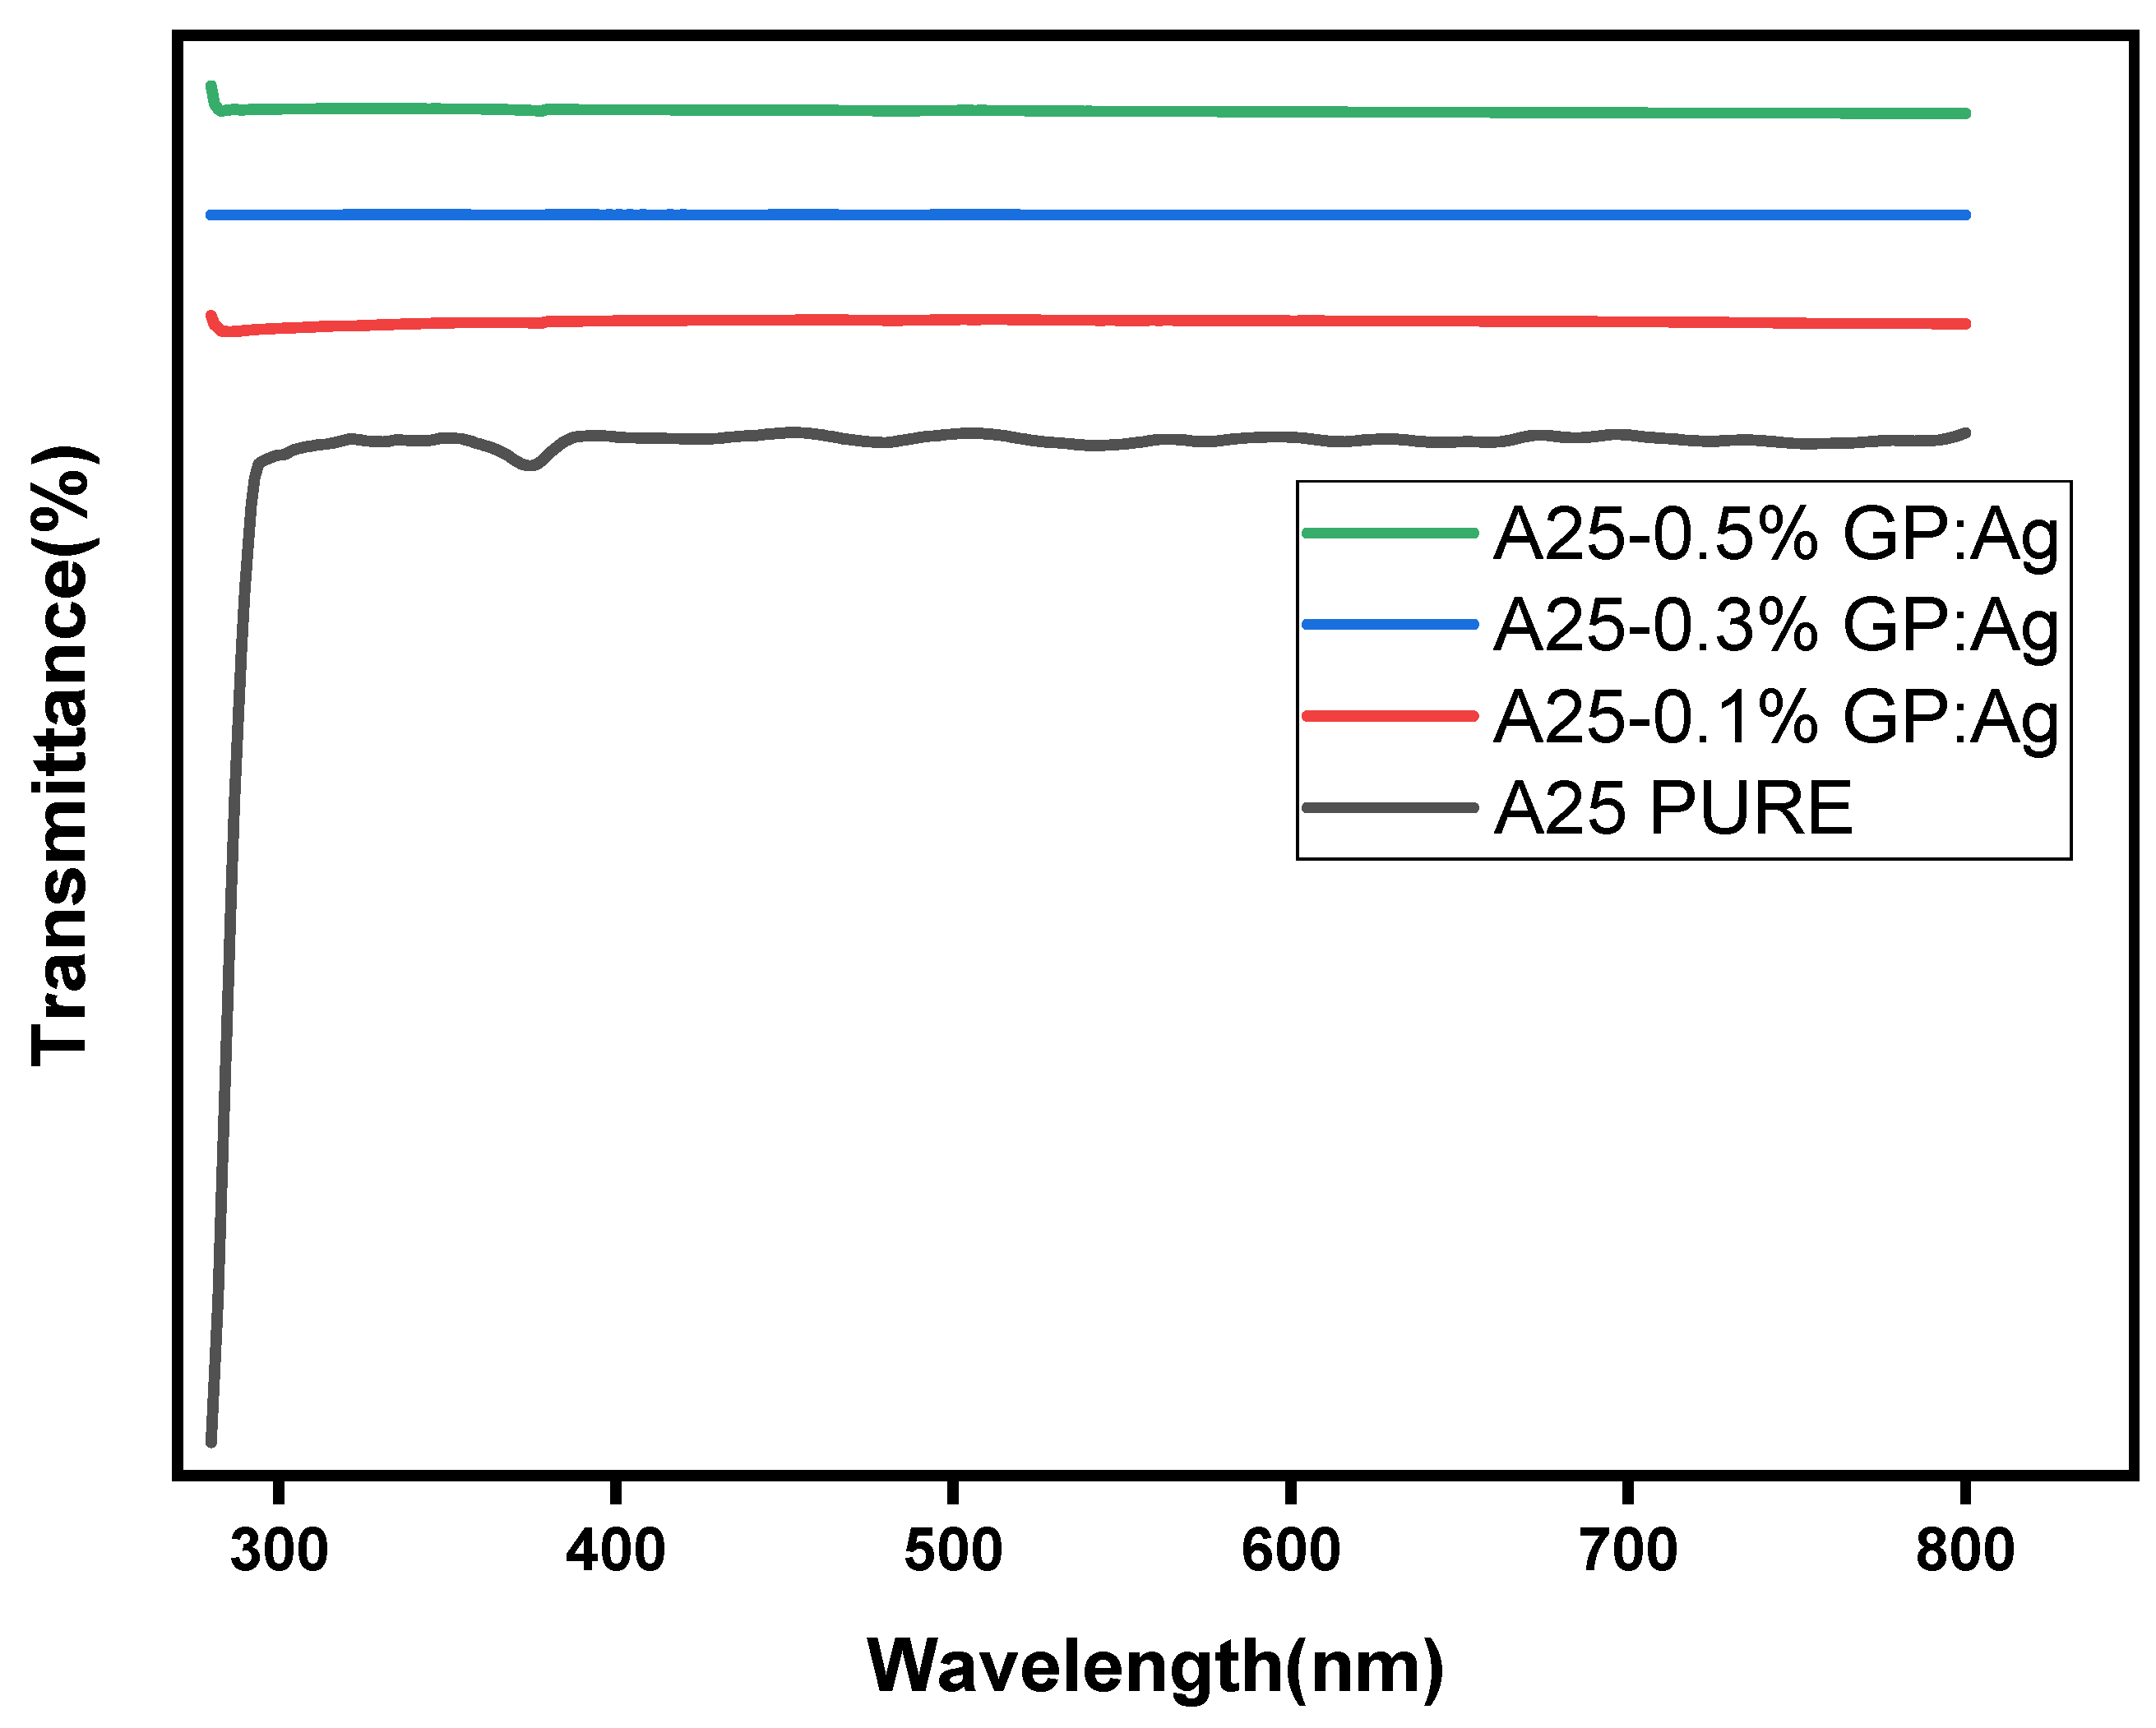
| SAMPLE | TOTAL | UV | VISIBLE | IR | Reference |
|---|---|---|---|---|---|
| SOLAR spectrum | 100% | 7% | 50% | 43% | [37] |
| A25-0.0% | 86.78% | 6.28% | 80.63% | 13.09% | Current work |
| A25-0.1% | 2.65% | 5.88% | 81.73% | 12.39% | Current work |
| A25-0.3% | 0.01% | 0% | 78.03% | 21.97% | Current work |
| A25-0.5% | 0.25% | 2.51% | 76.13% | 21.37% | Current work |
| Samples | (°C) | (°C) | (°C) | Heat Resistance Index (°C) |
|---|---|---|---|---|
| A25-0.0% | 157.37 | 196.57 | 229.14 | 88.63610 |
| A25-0.1% | 156.73 | 201.1 | 231.68 | 89.84248 |
| A25-0.3% | 159.92 | 199.11 | 231.68 | 89.88266 |
| A25-0.5% | 167.96 | 208.73 | 237.87 | 94.28678 |
| Sample | Thermal Conductivity of Composites (W/mK) | Enhancement in Thermal Conductivity (%) |
|---|---|---|
| A25-0.0% | 0.208 ± 0.029 | ---- |
| A25-0.1% | 0.242 ± 0.029 | 16.44 |
| A25-0.3% | 0.395 ± 0.029 | 89.88 |
| A25-0.5% | 0.290 ± 0.029 | 55.42 |
Disclaimer/Publisher’s Note: The statements, opinions and data contained in all publications are solely those of the individual author(s) and contributor(s) and not of MDPI and/or the editor(s). MDPI and/or the editor(s) disclaim responsibility for any injury to people or property resulting from any ideas, methods, instructions or products referred to in the content. |
© 2023 by the authors. Licensee MDPI, Basel, Switzerland. This article is an open access article distributed under the terms and conditions of the Creative Commons Attribution (CC BY) license (https://creativecommons.org/licenses/by/4.0/).
Share and Cite
Paul, J.; Samykano, M.; Pandey, A.K.; Kadirgama, K.; Tyagi, V.V. Nano Engineered Paraffin-Based Phase Change Material for Building Thermal Management. Buildings 2023, 13, 900. https://doi.org/10.3390/buildings13040900
Paul J, Samykano M, Pandey AK, Kadirgama K, Tyagi VV. Nano Engineered Paraffin-Based Phase Change Material for Building Thermal Management. Buildings. 2023; 13(4):900. https://doi.org/10.3390/buildings13040900
Chicago/Turabian StylePaul, John, Mahendran Samykano, Adarsh Kumar Pandey, Kumaran Kadirgama, and Vineet Veer Tyagi. 2023. "Nano Engineered Paraffin-Based Phase Change Material for Building Thermal Management" Buildings 13, no. 4: 900. https://doi.org/10.3390/buildings13040900