

Implementation of Modified Compression Field Theory to Simulate the Behavior of Fiber-Reinforced Polymer Shear-Strengthened Reinforced Concrete Beams under Monotonic Loading

Abstract
:1. Introduction
- Improve understanding of the VecTor2 software to model the behavior of control specimens under monotonic loading;
- Simulate the behavior of FRP shear-strengthened RC beams subjected to monotonic loading using the VecTor2 software;
- Compare the effectiveness of two methodologies to model the FRP composites for shear strengthening to select the method that captures the actual response.
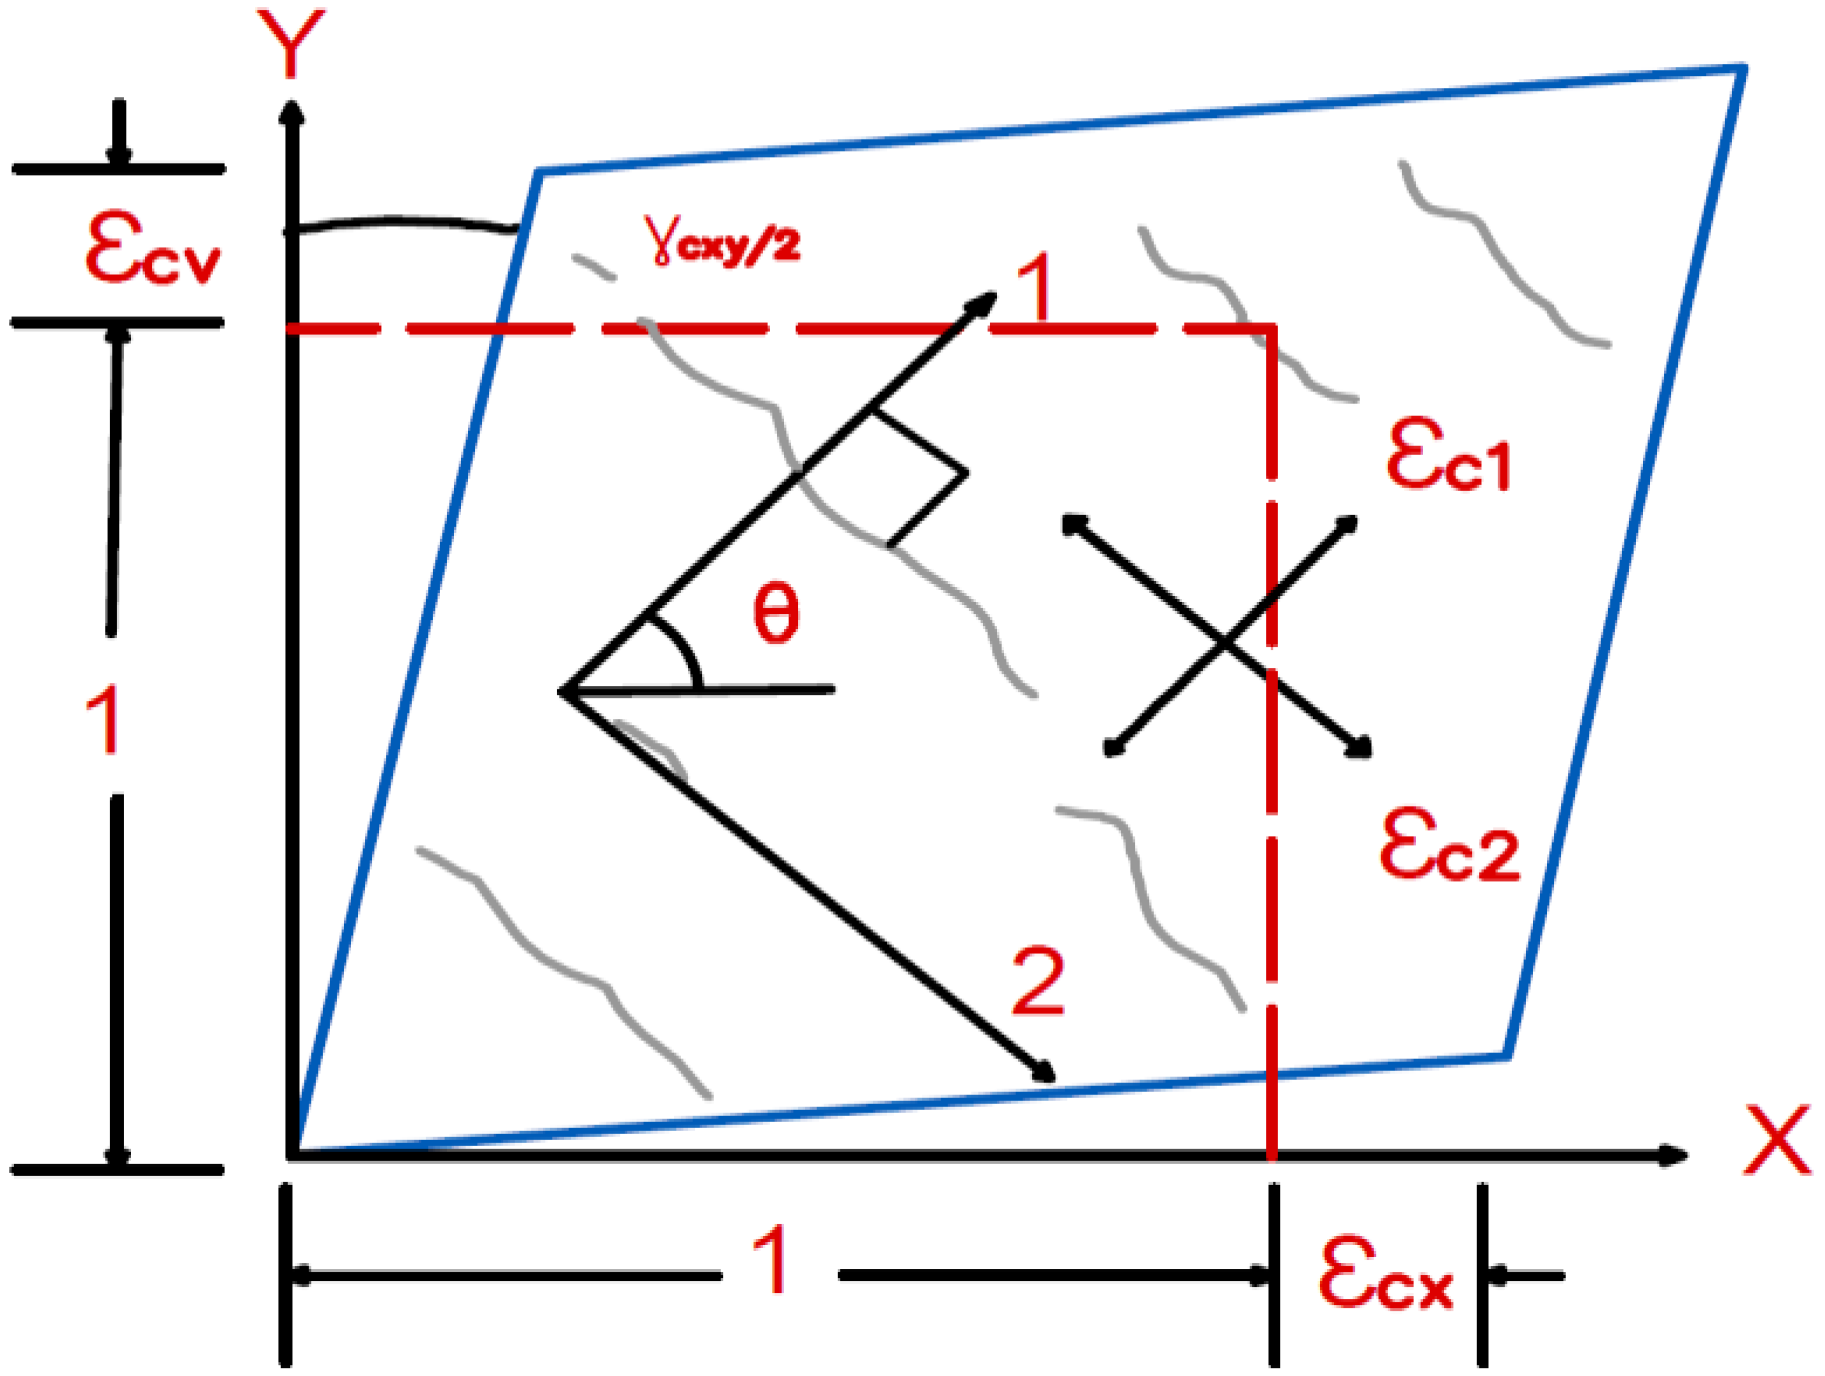
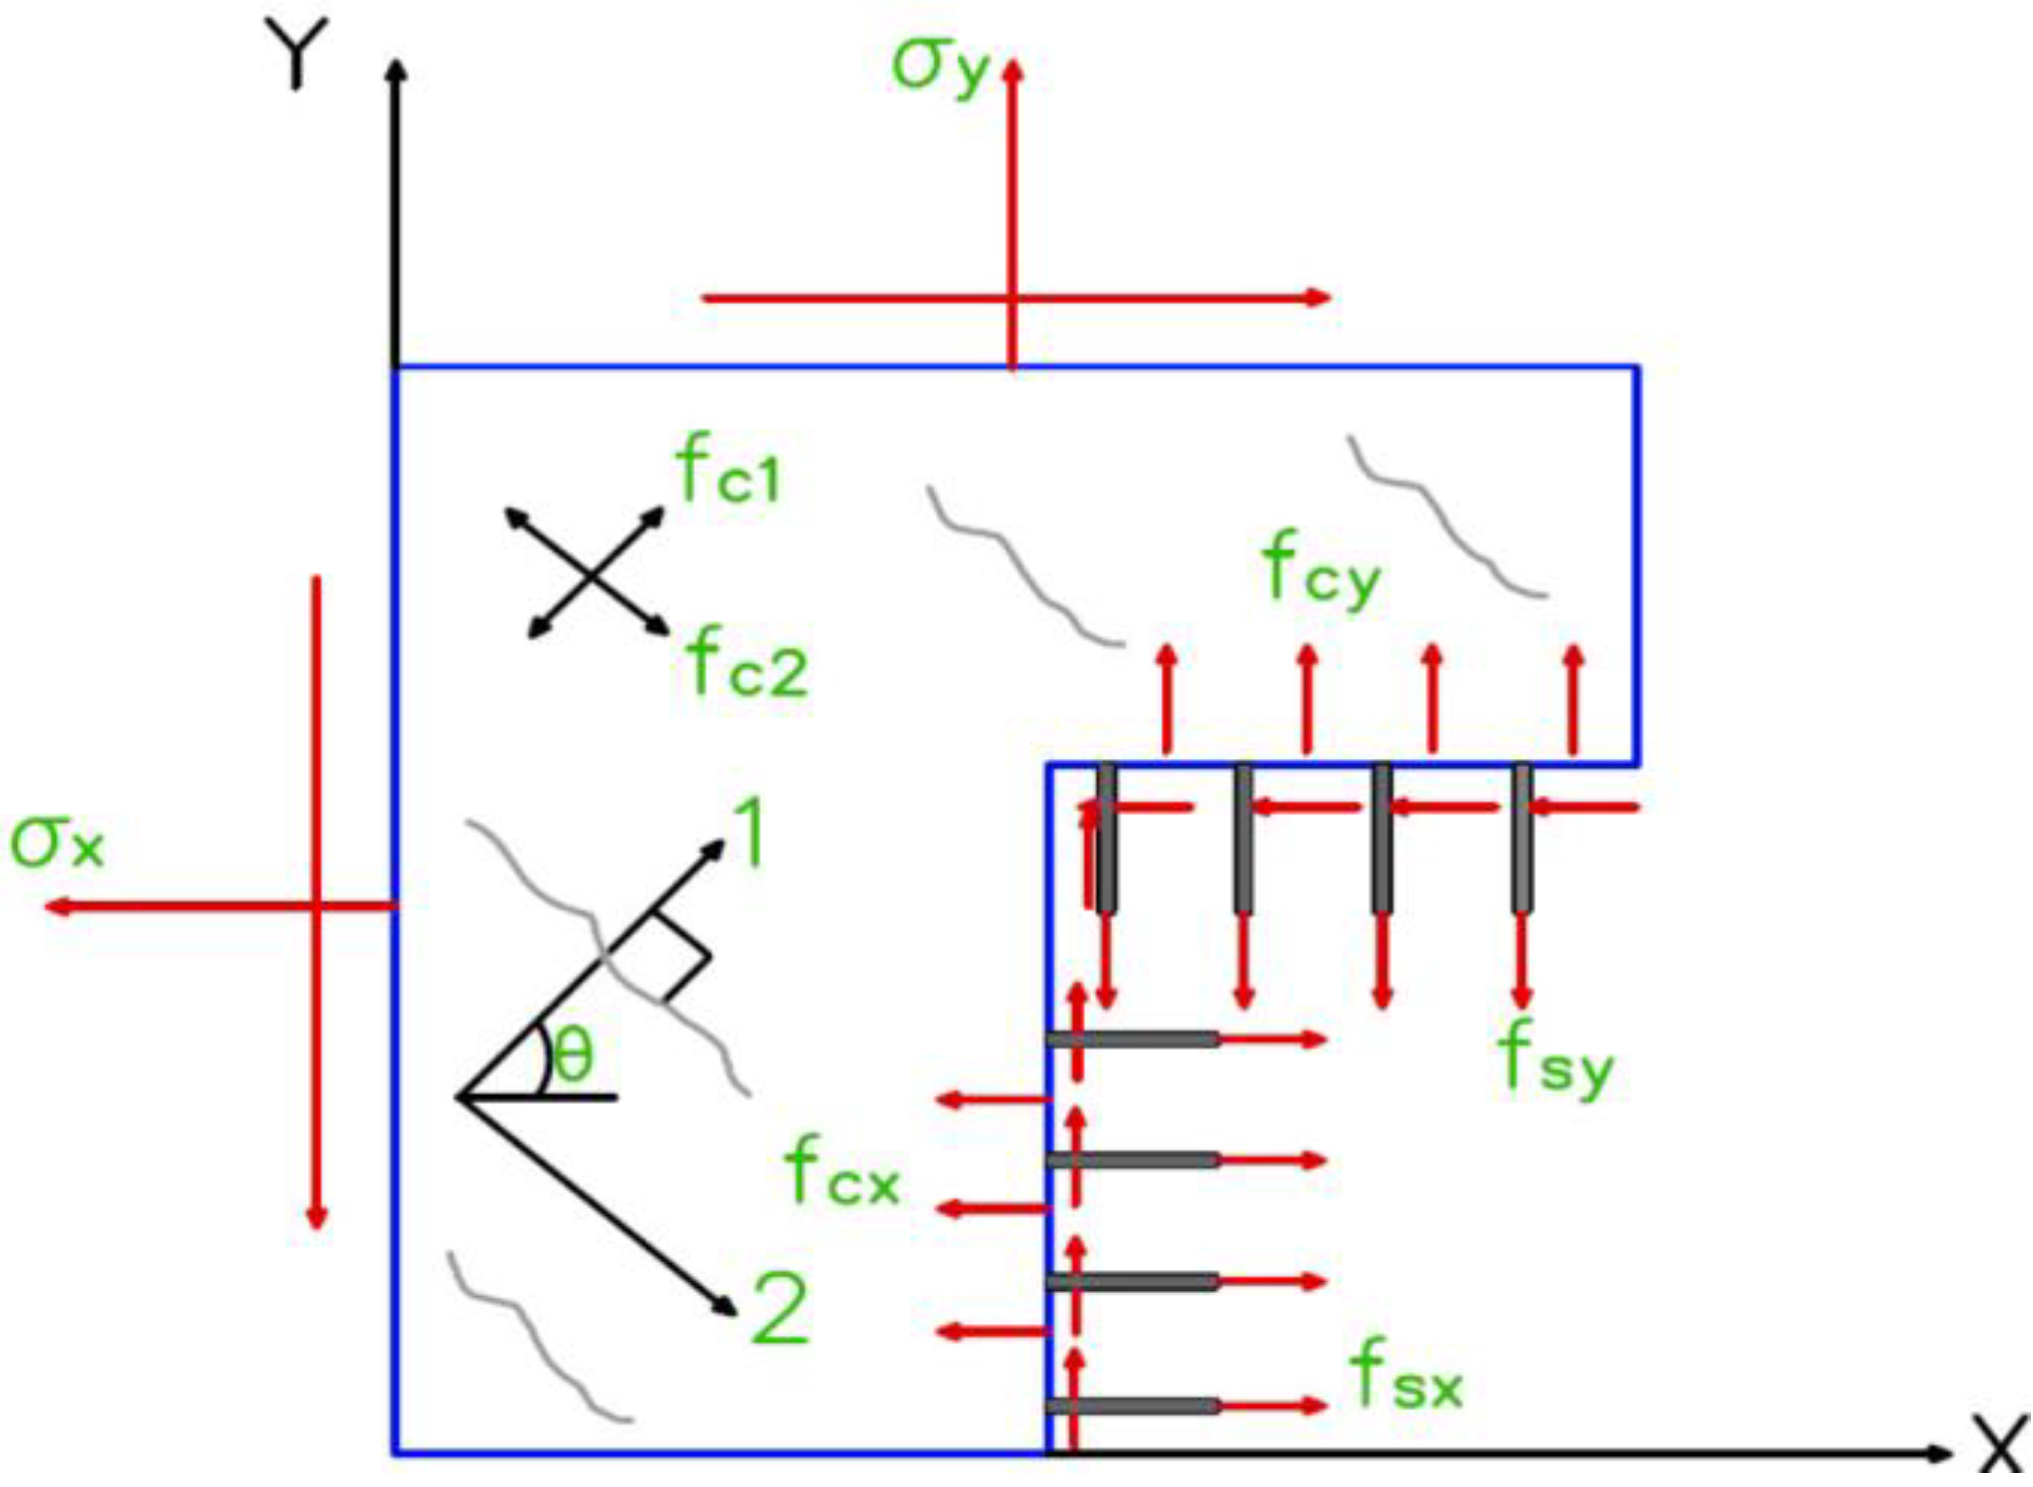
2. Modified Compression Field Theory (MCFT)
- The smeared rotating cracks are uniformly distributed;
- The reinforcements are uniformly distributed;
- Full contact bond between the concrete and the reinforcing steel;
- The cumulative strain history is neglected, and each strain phase is independent of the precedent;
- The three sets creating the MCFT are expressed in the form of average stresses and strains;
- At crack locations, local strains and stresses are accounted for.
Compatibility, Equilibrium, and Constitutive Relationships
3. Finite Element Modeling
3.1. Material Modeling
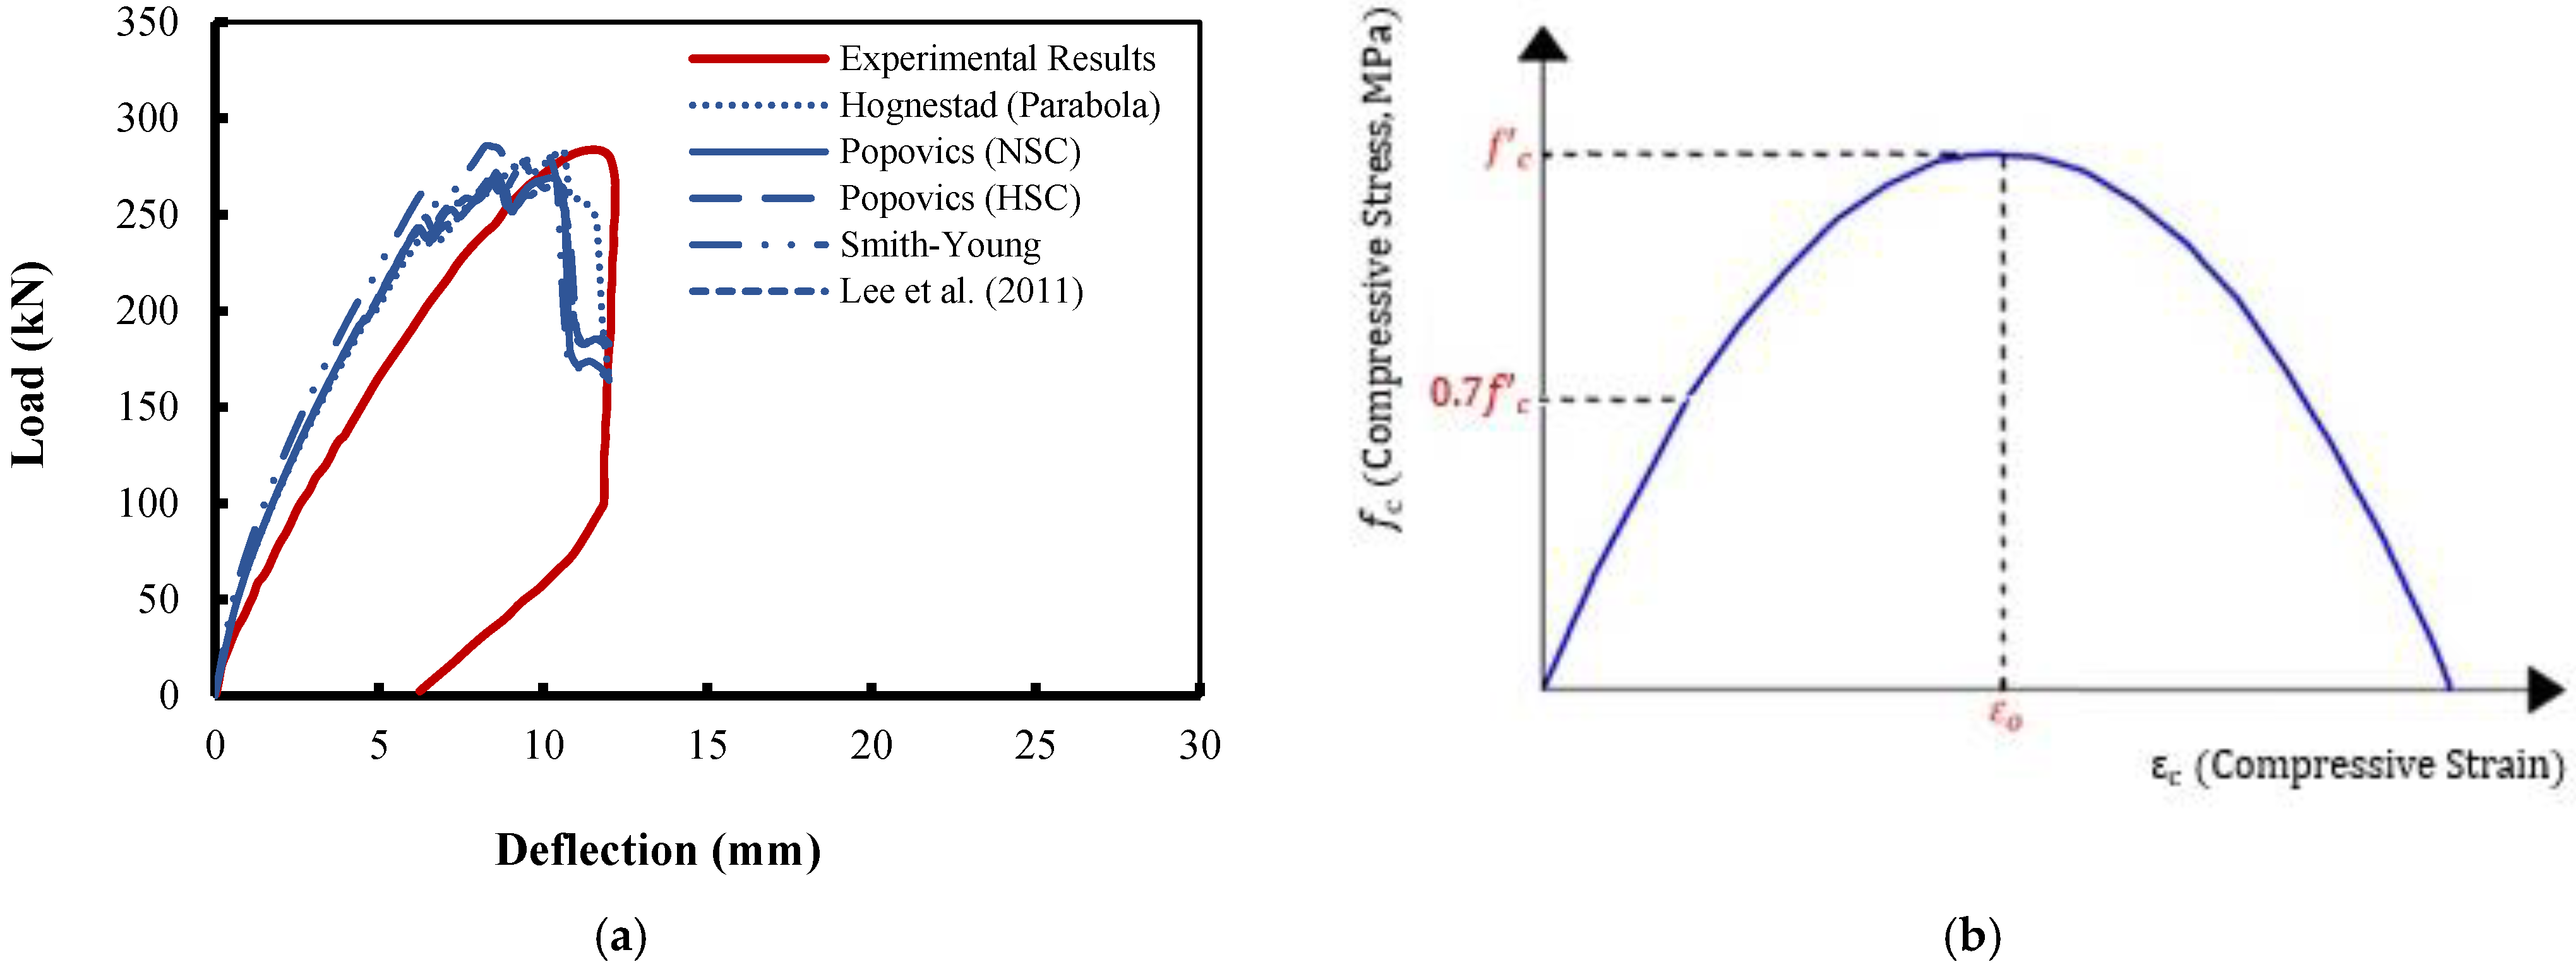
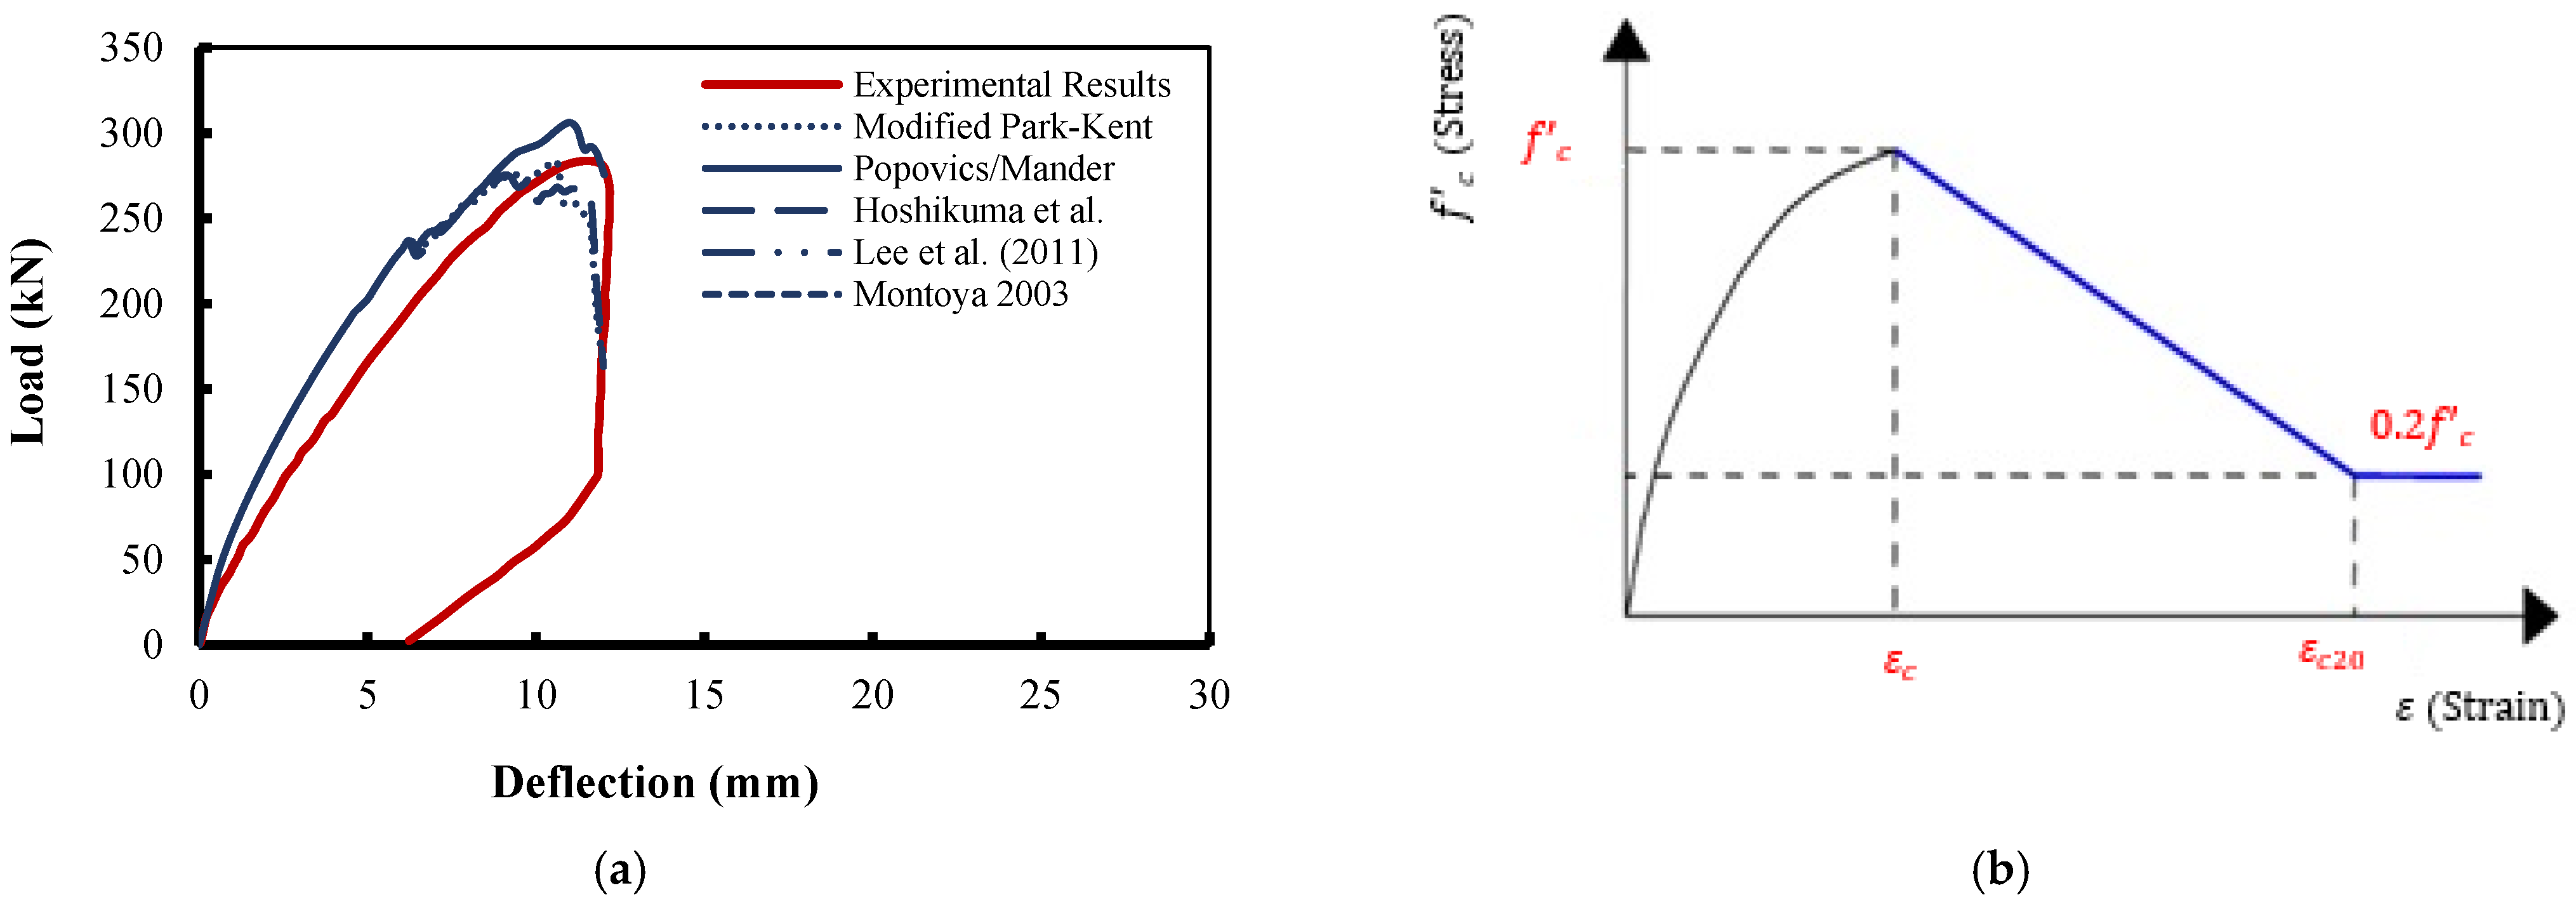
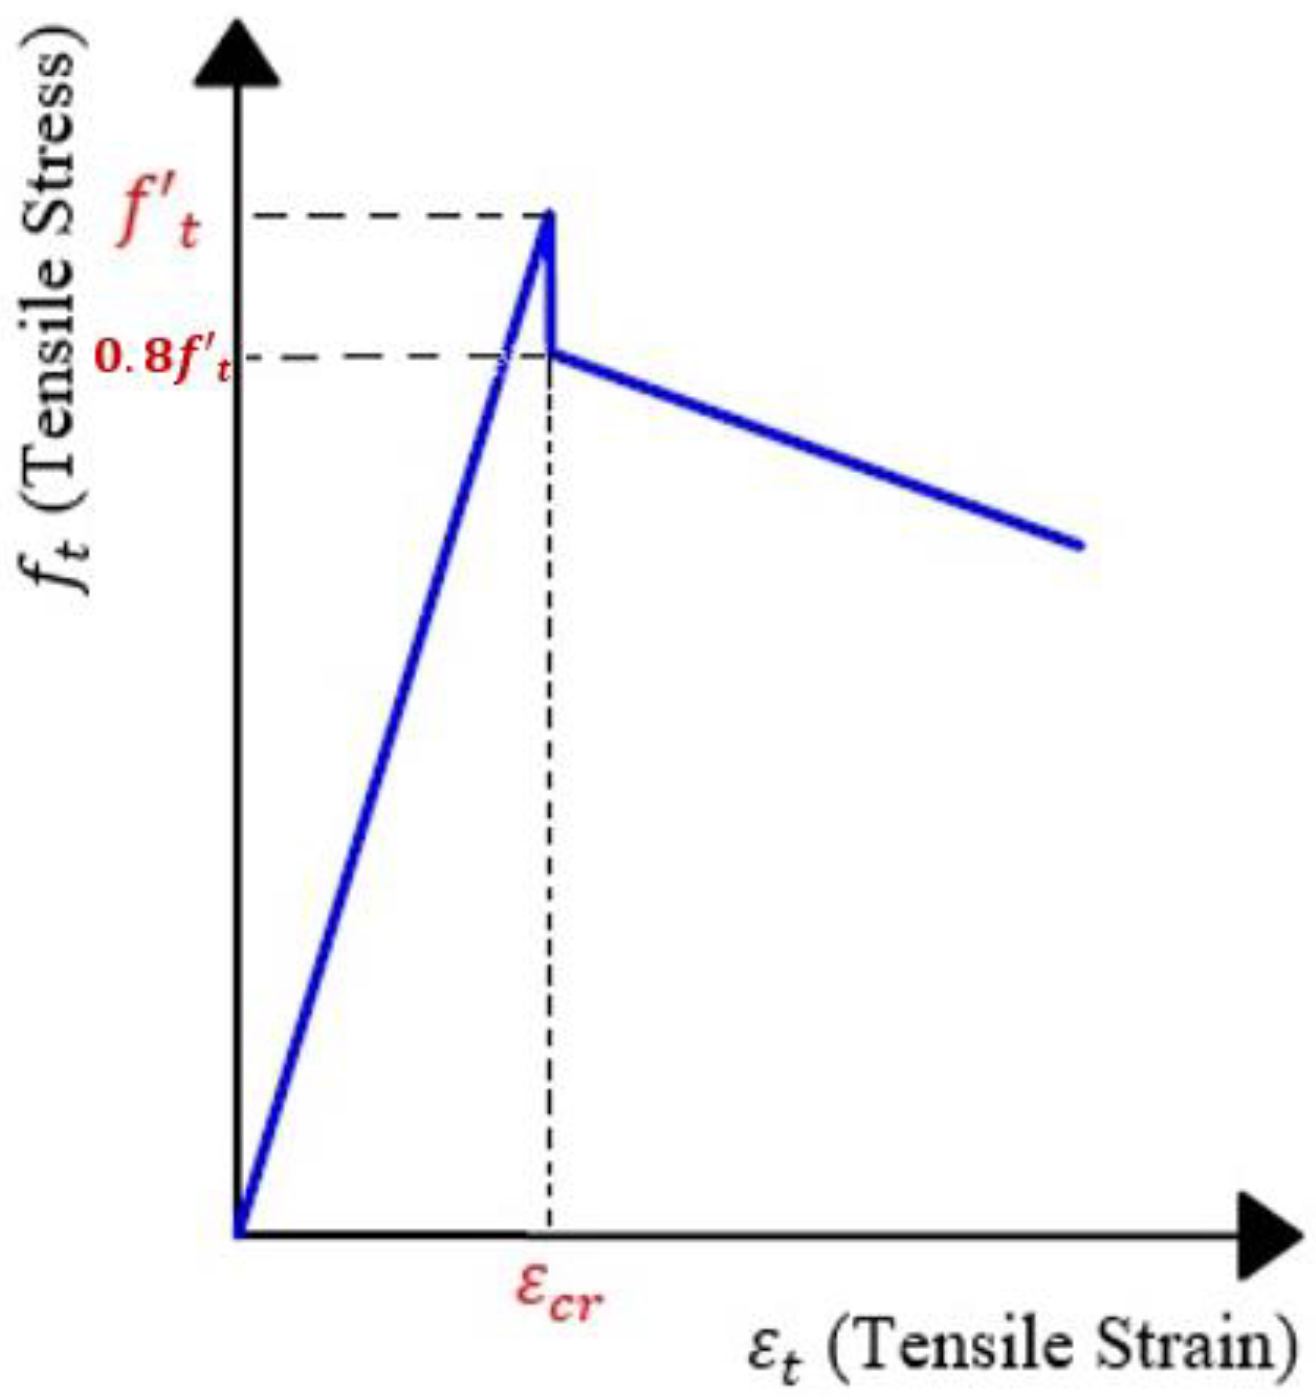
3.1.1. Concrete
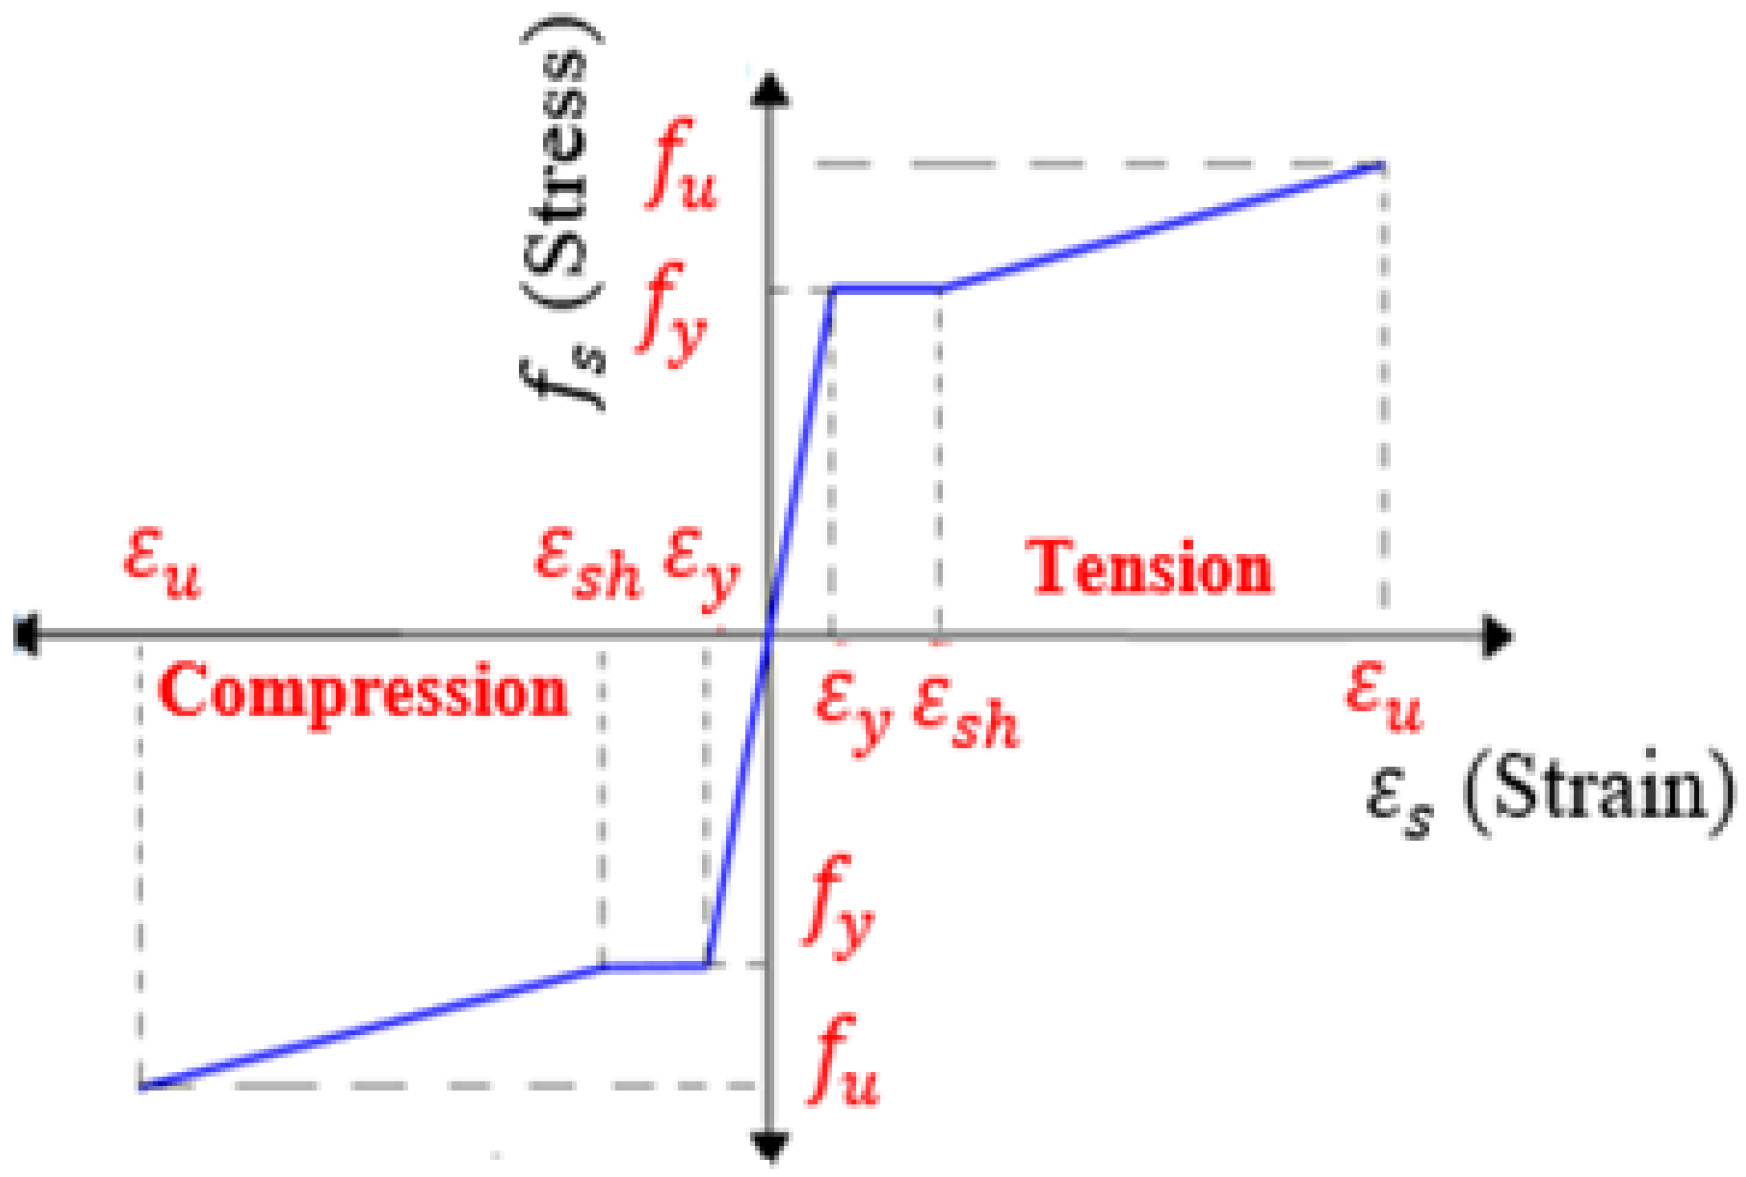
3.1.2. Steel Reinforcement
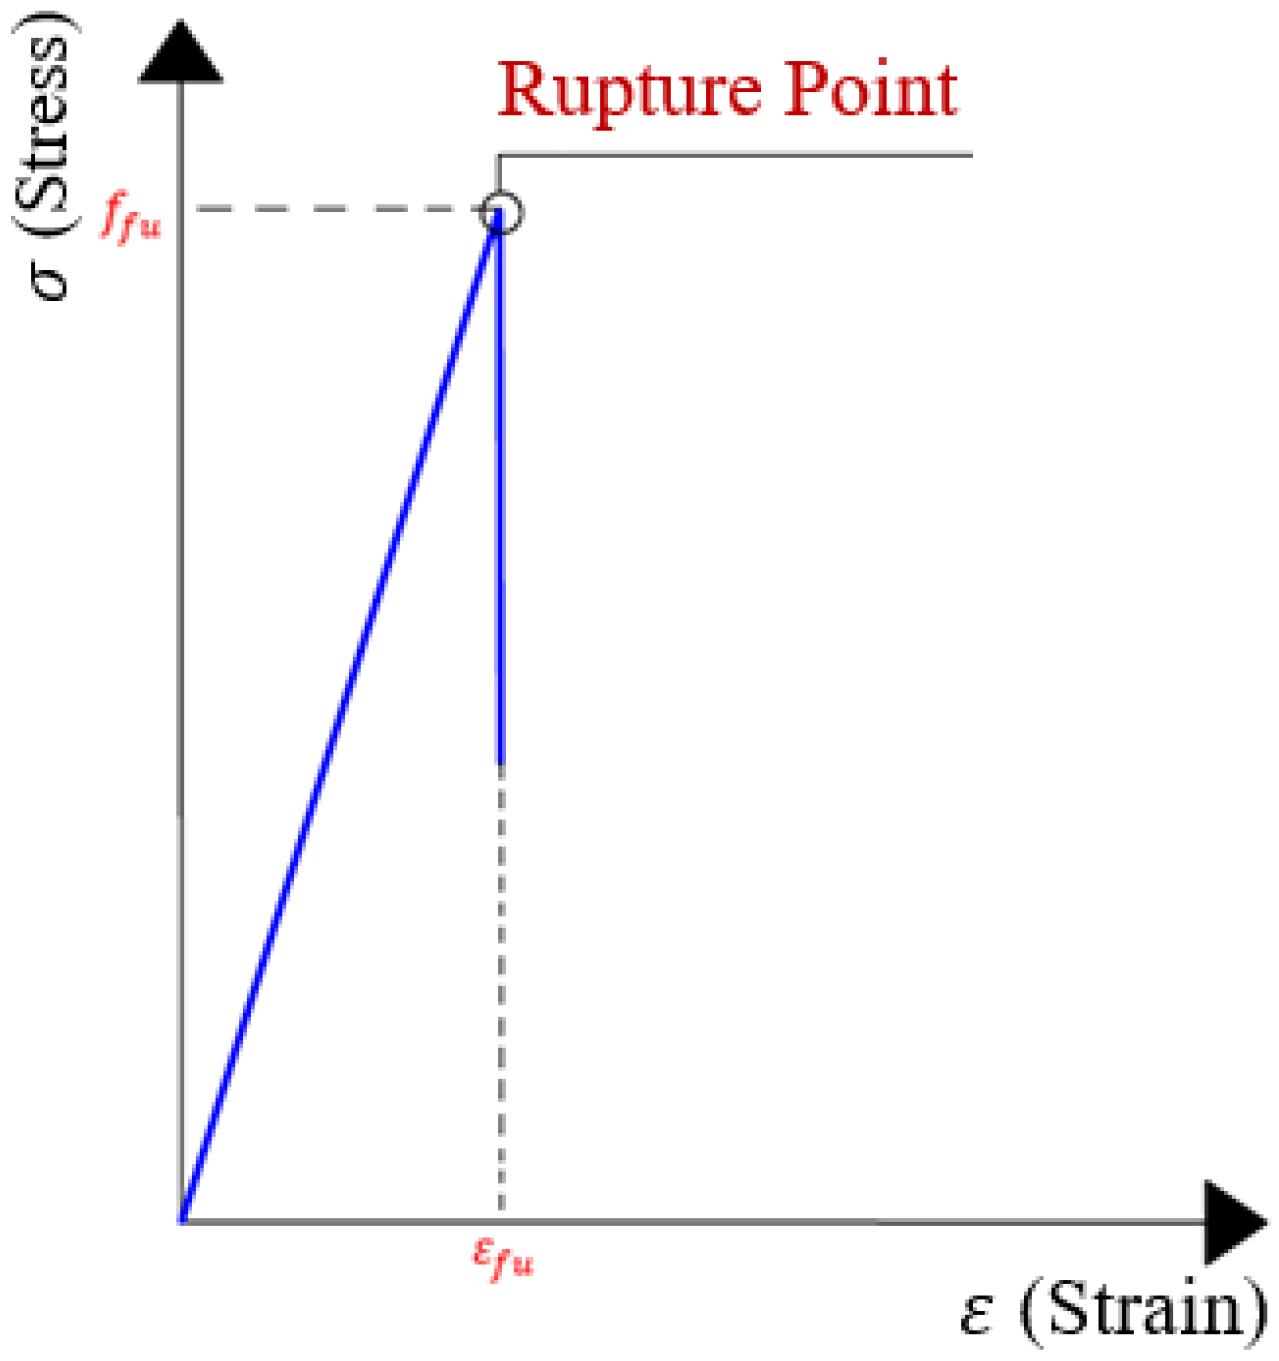
3.1.3. Fiber-Reinforced Polymers
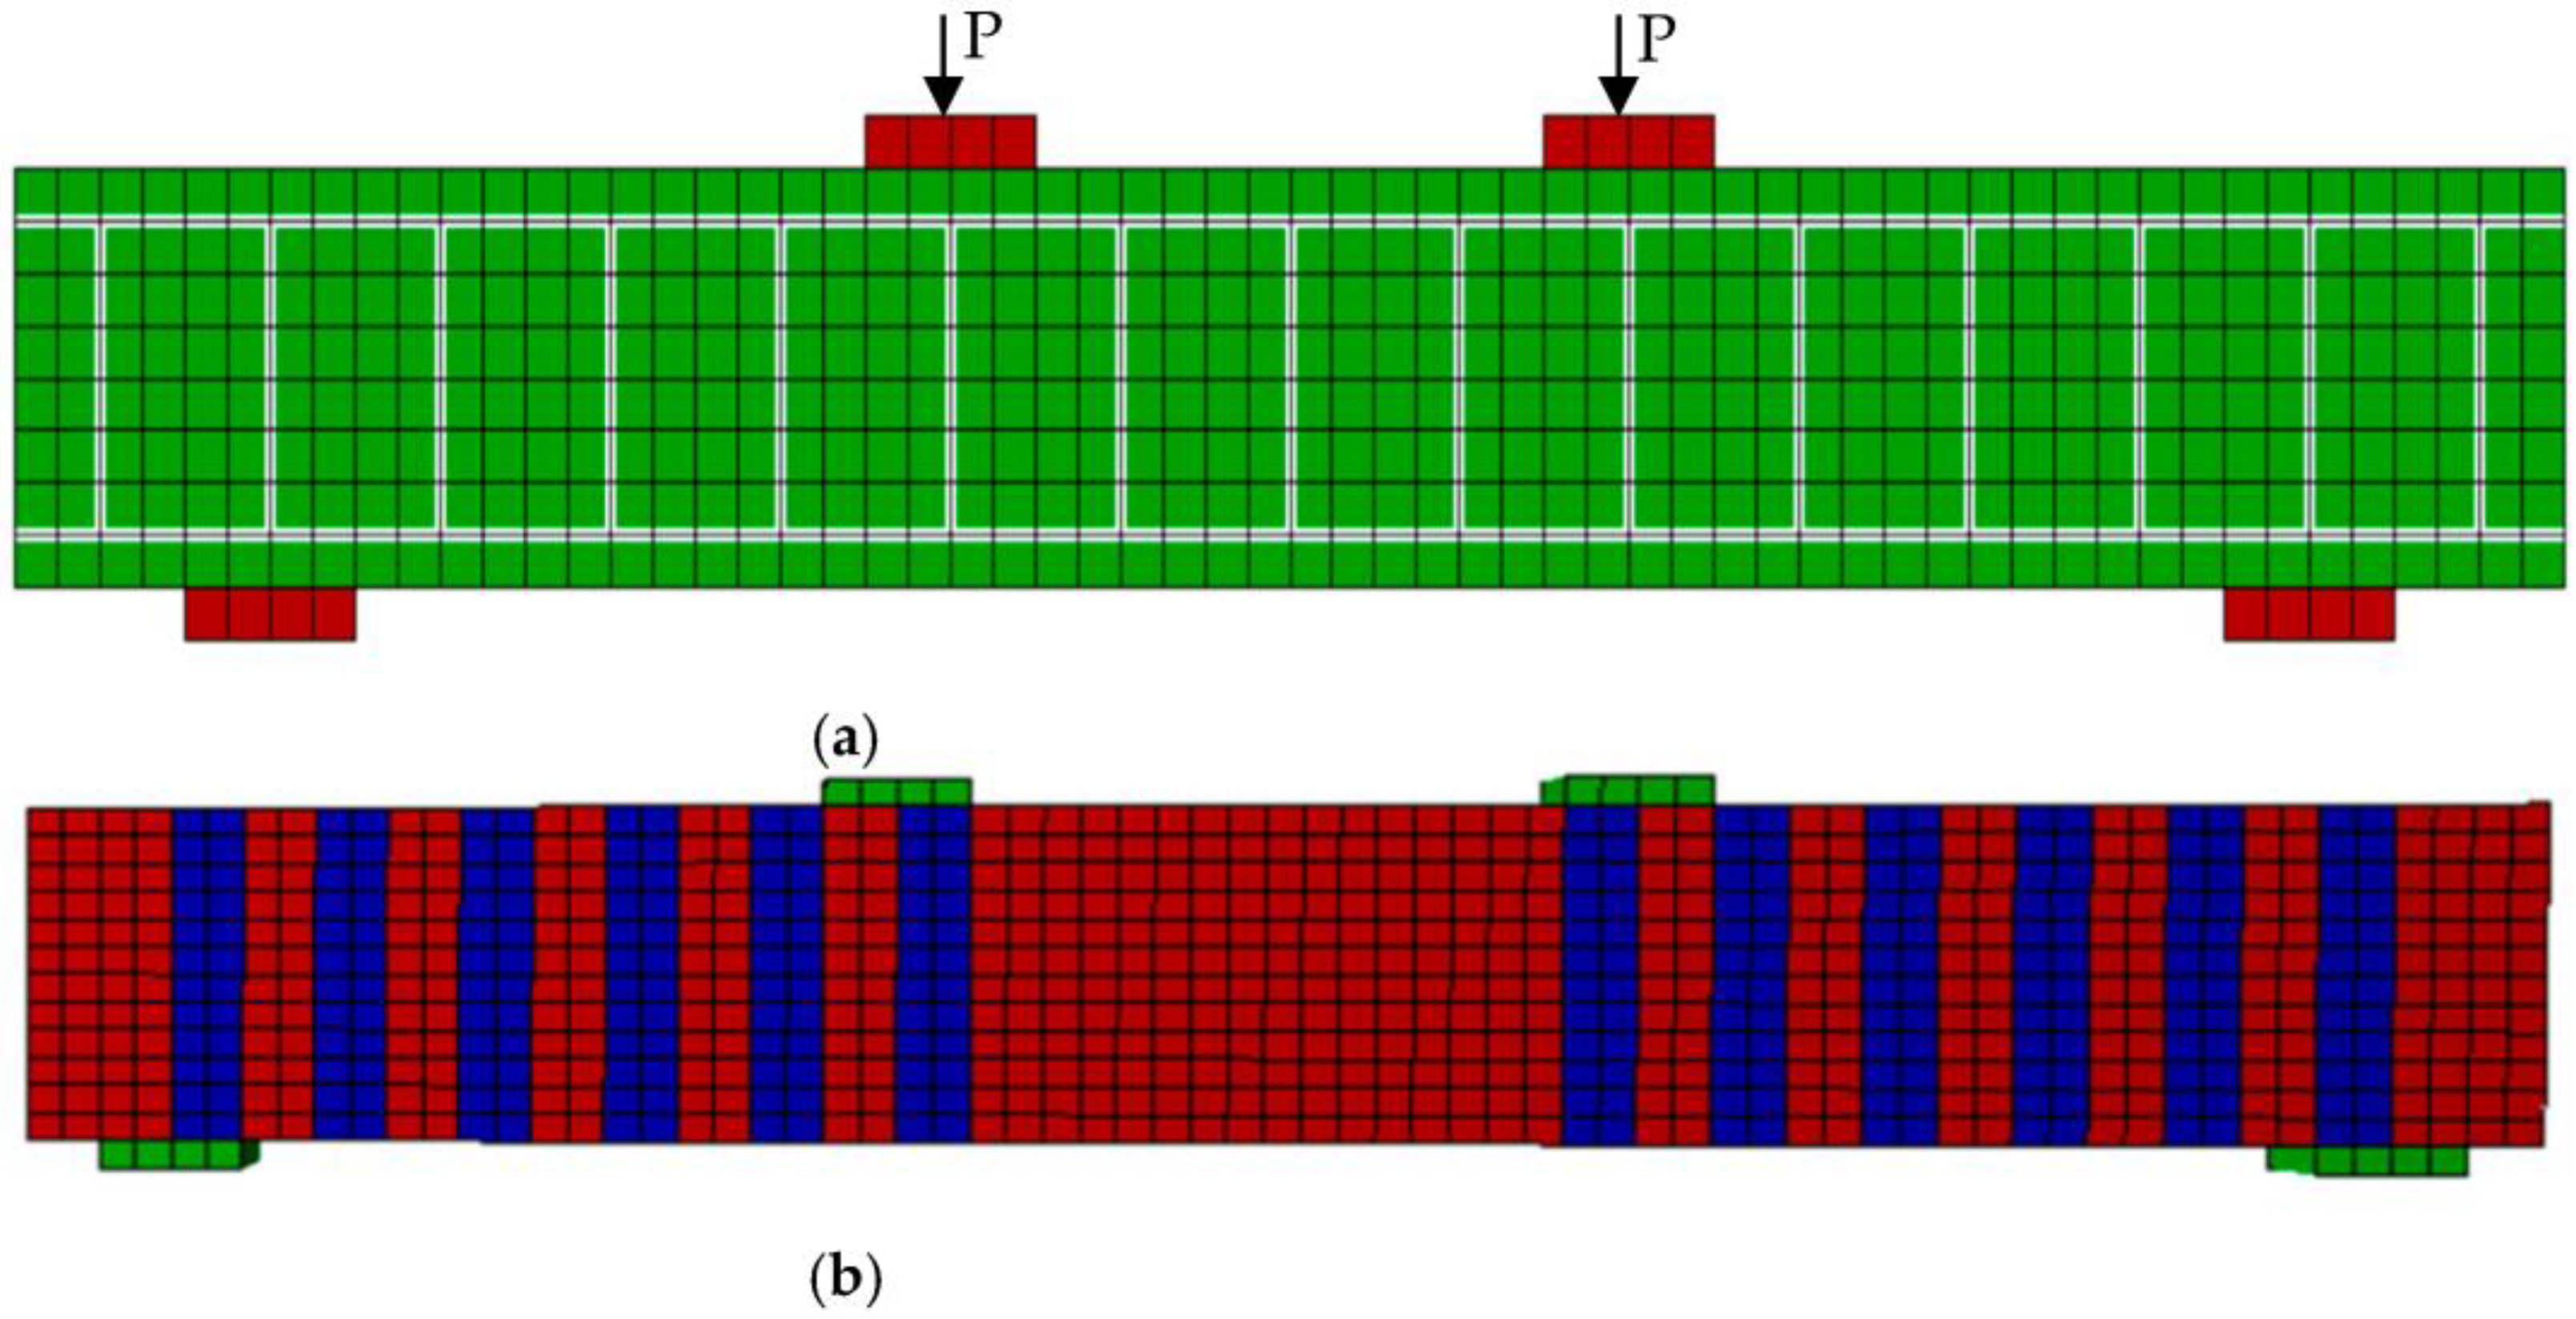
3.2. Structural Modeling (Concrete and Reinforcement Elements)
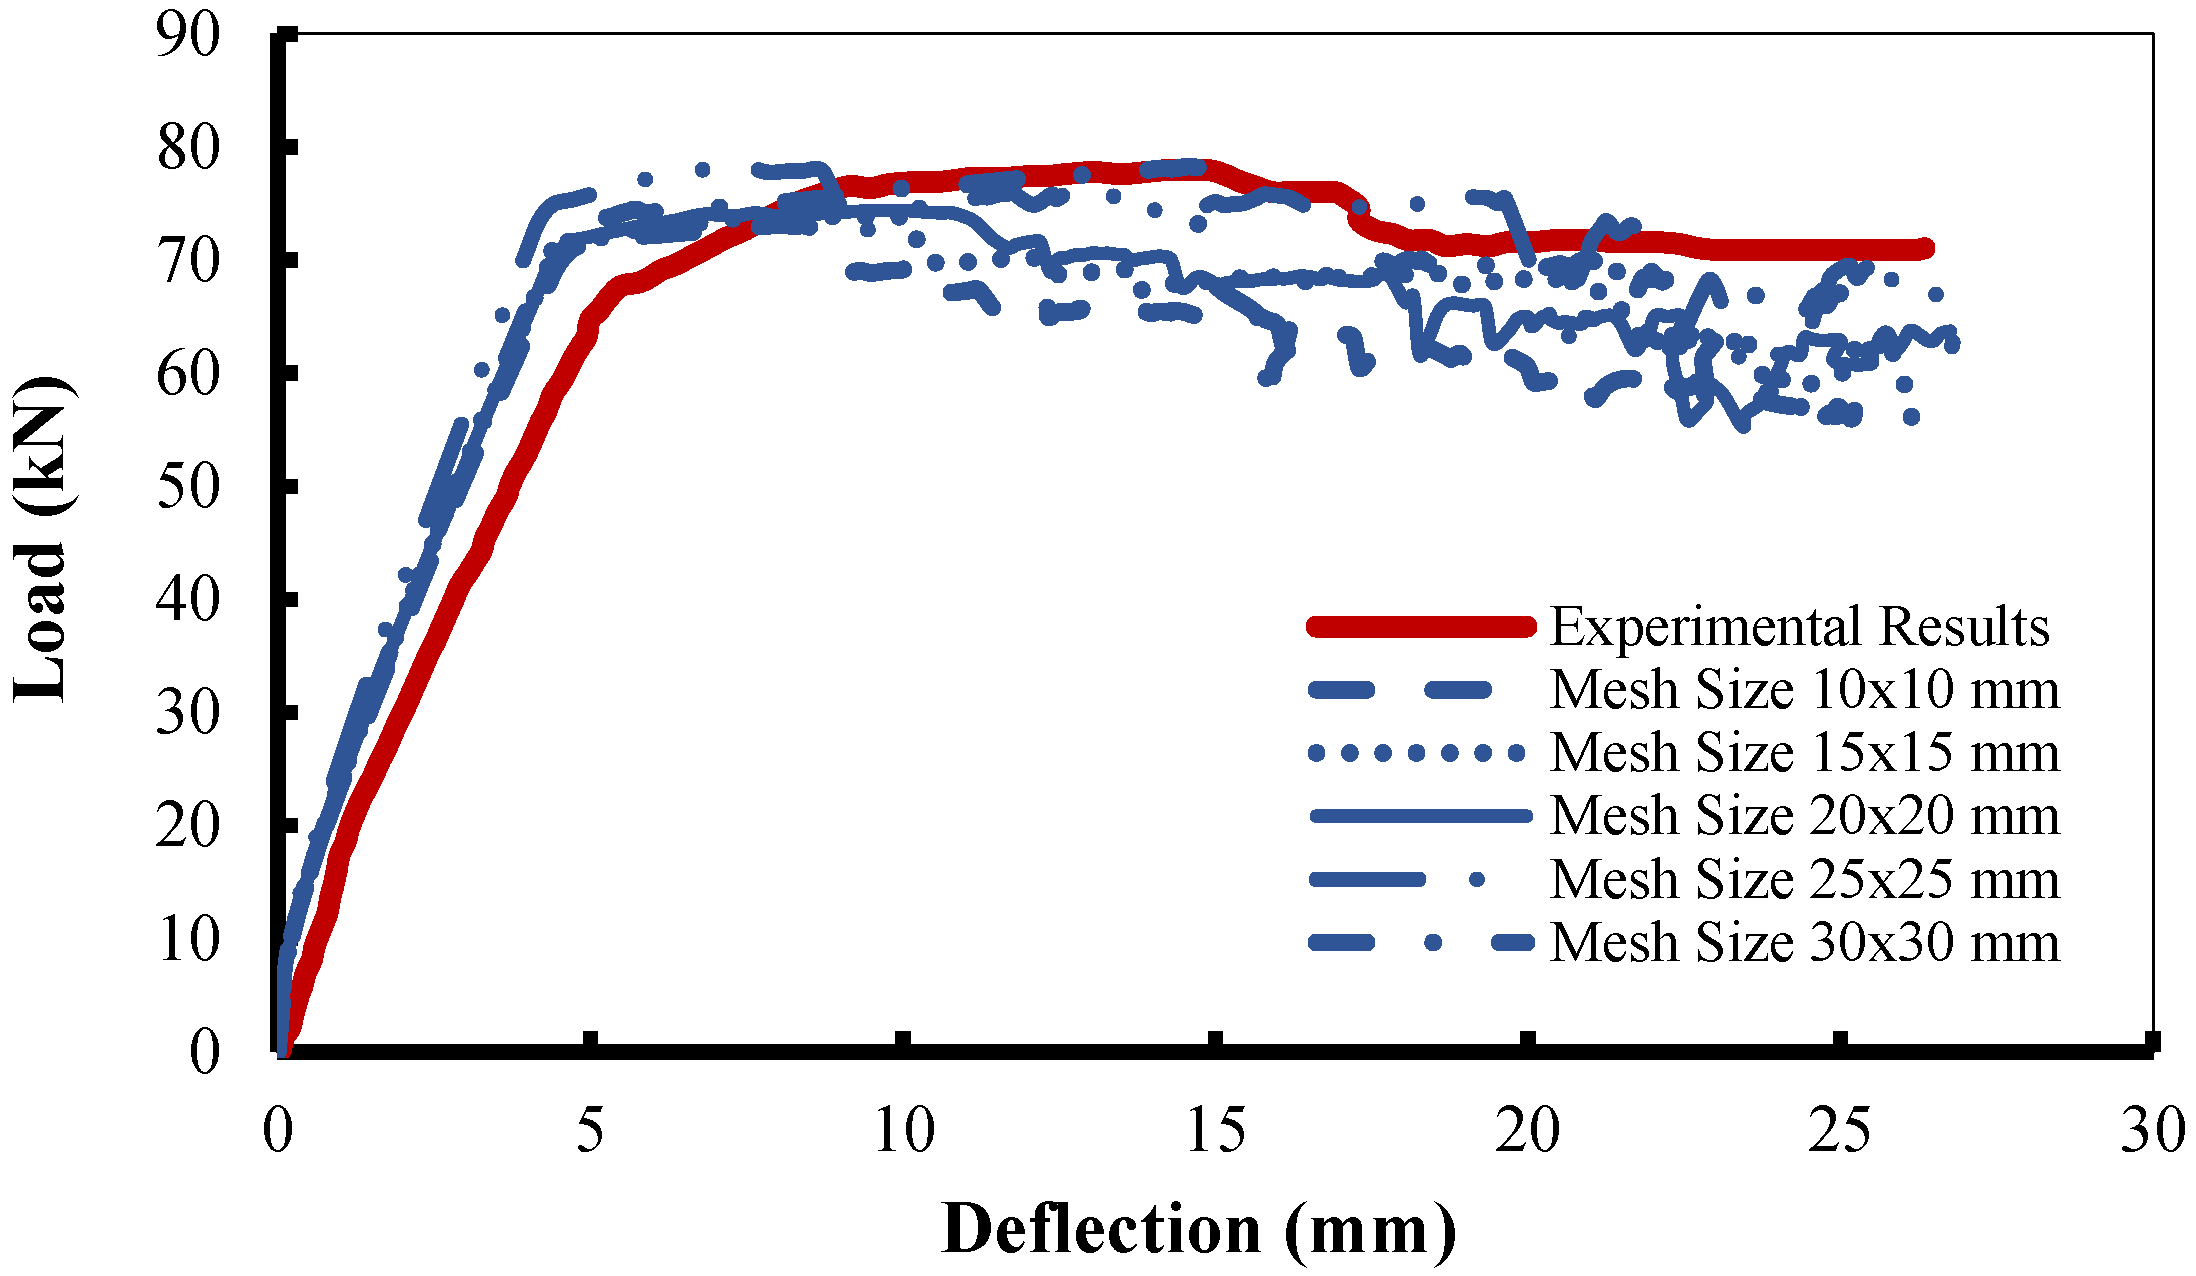
3.3. Sensitivity Analysis
3.4. Modelled Test Specimens
4. Results and Discussions
4.1. Validation of Control Specimens
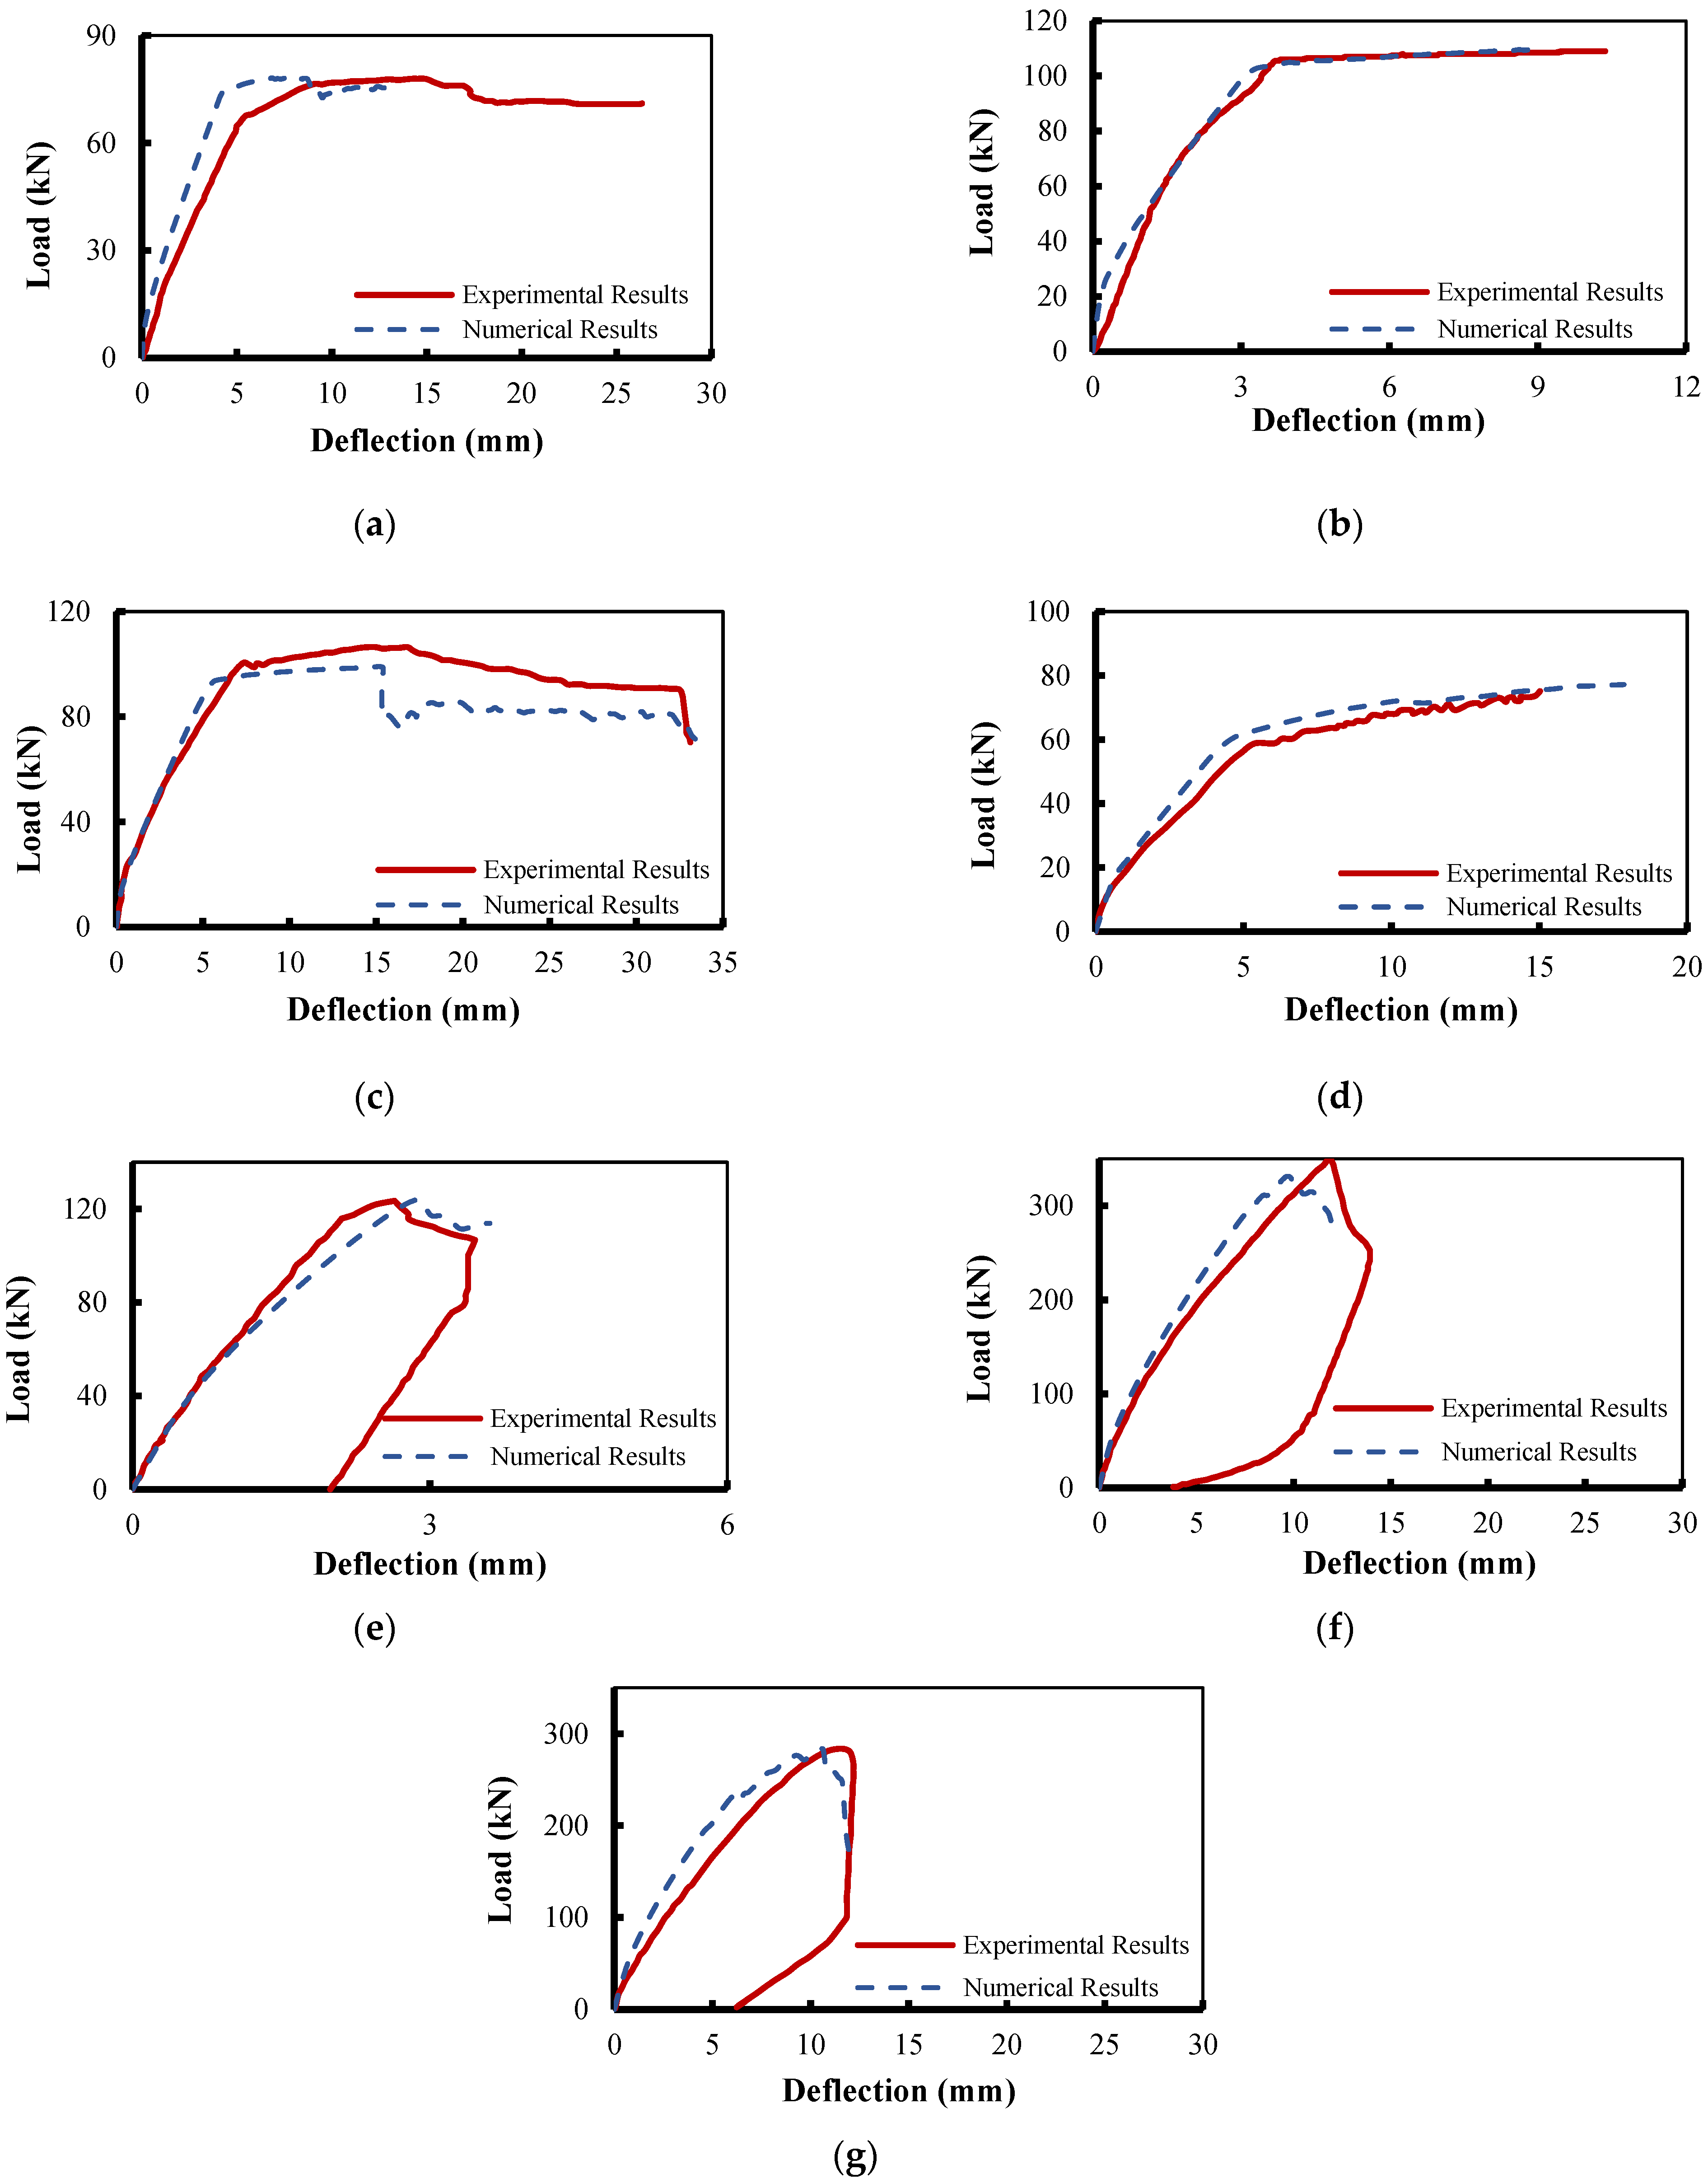
4.1.1. Load–Deflection Response
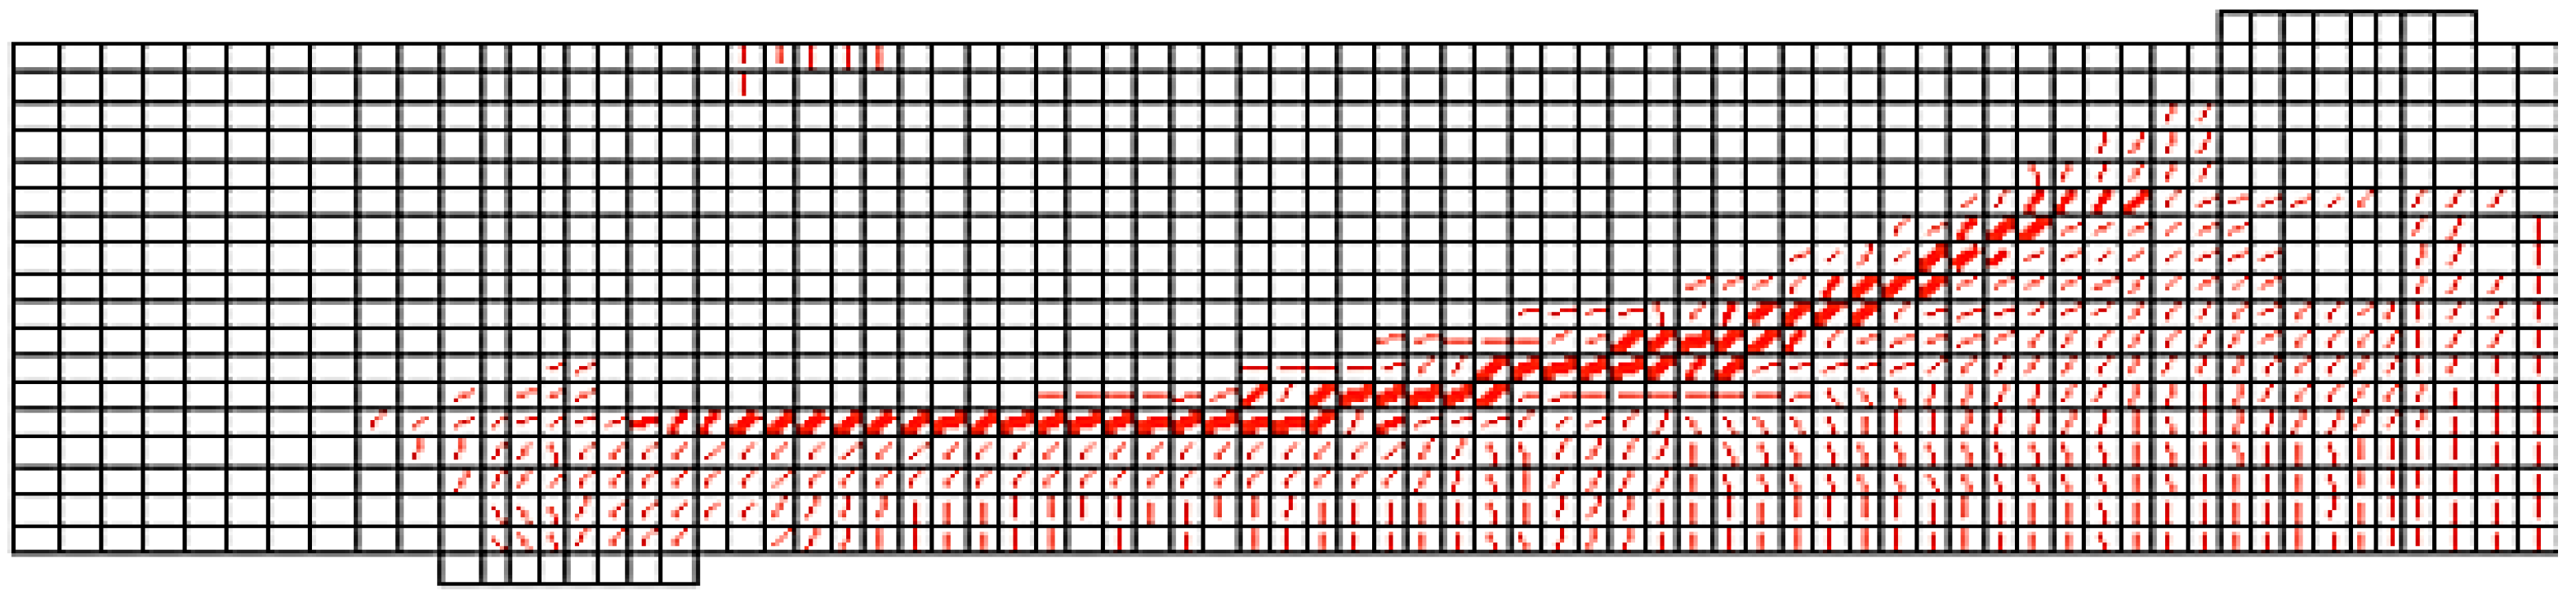
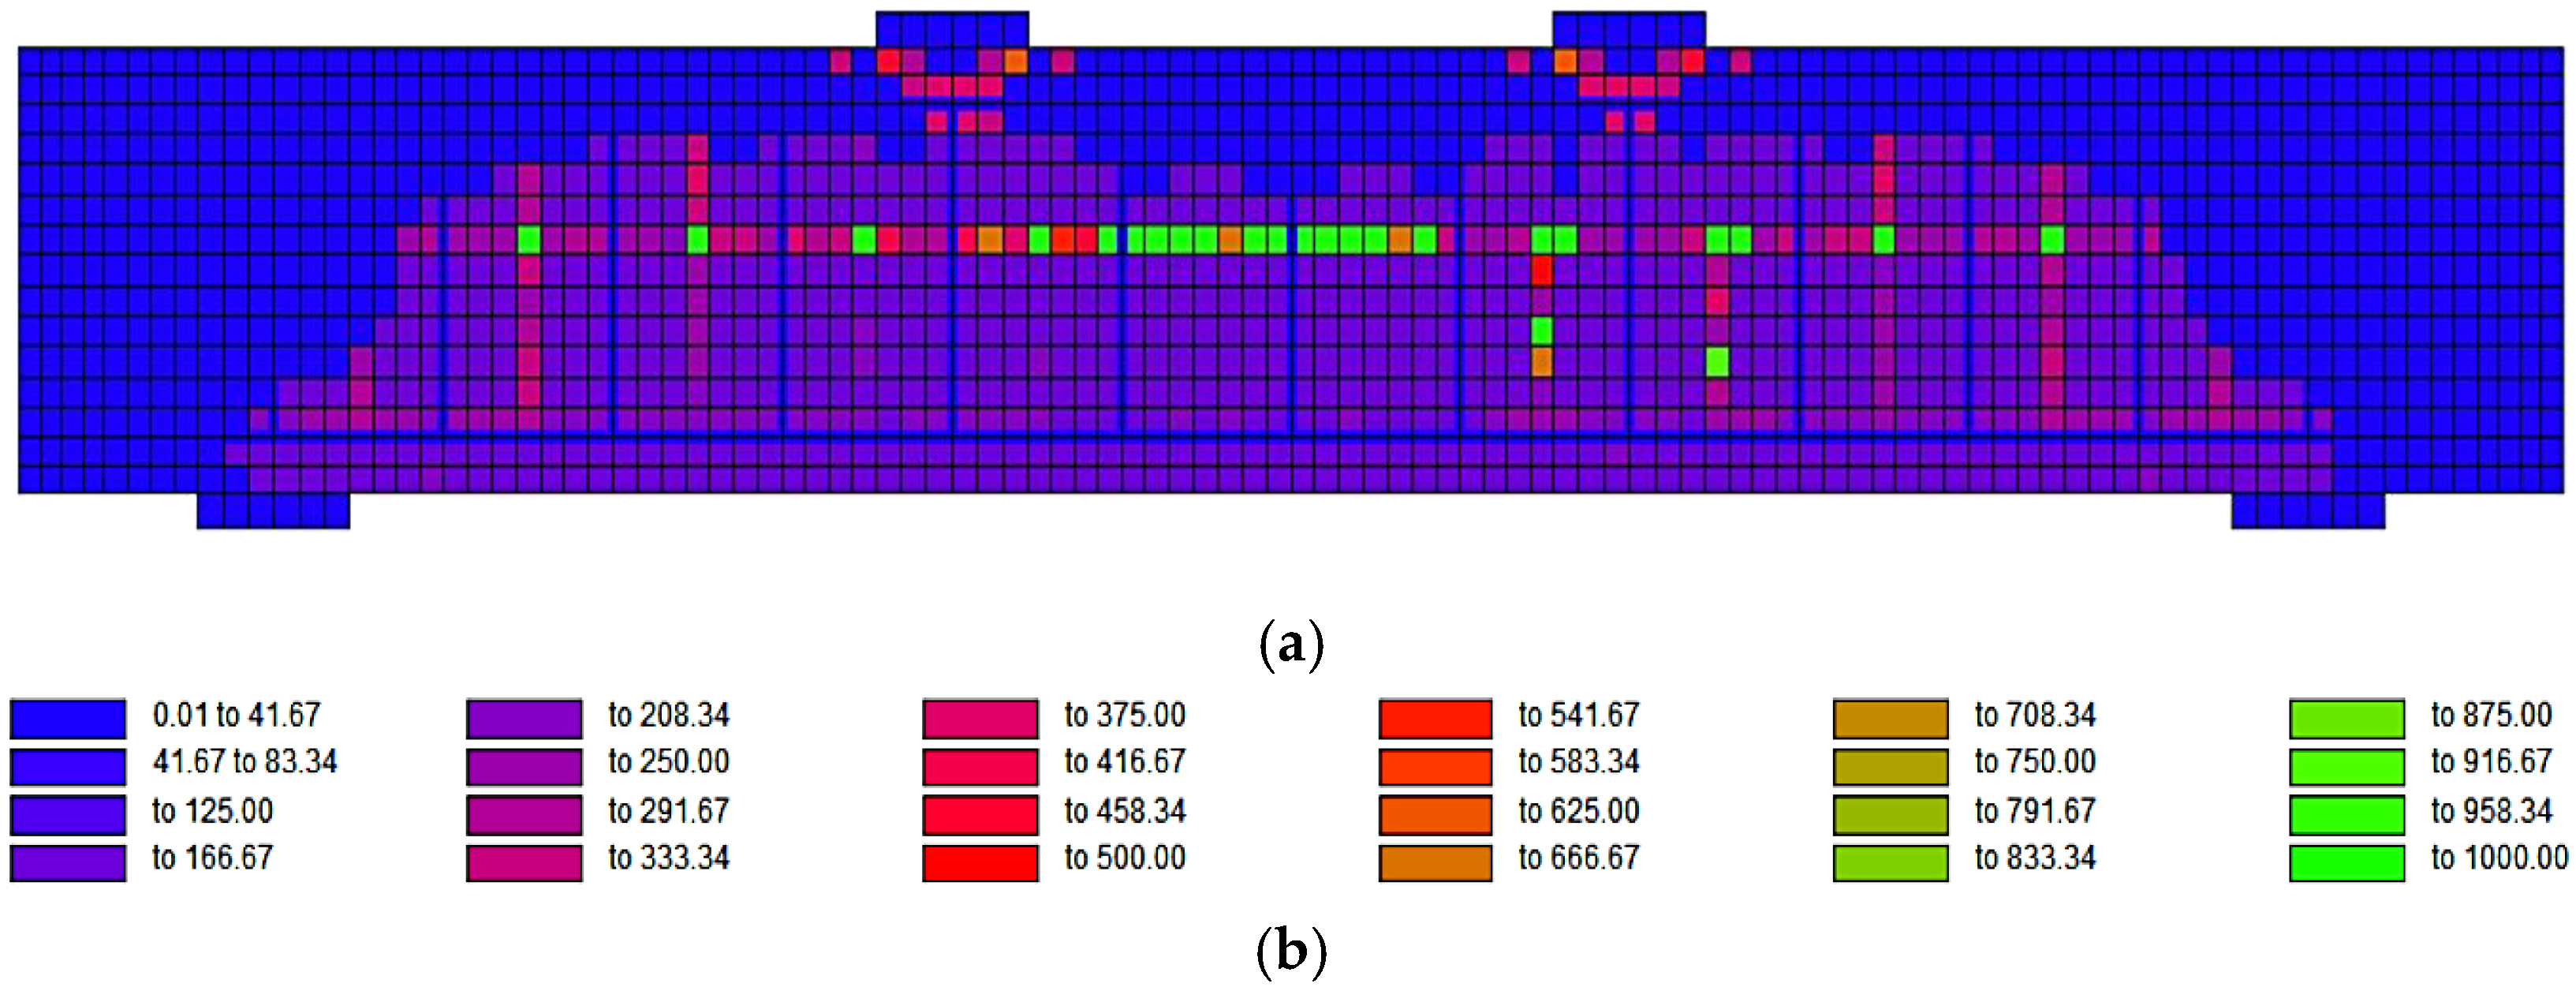
4.1.2. Failure Mode and Crack Pattern
4.2. Validation of FRP Shear-Strengthened Specimens
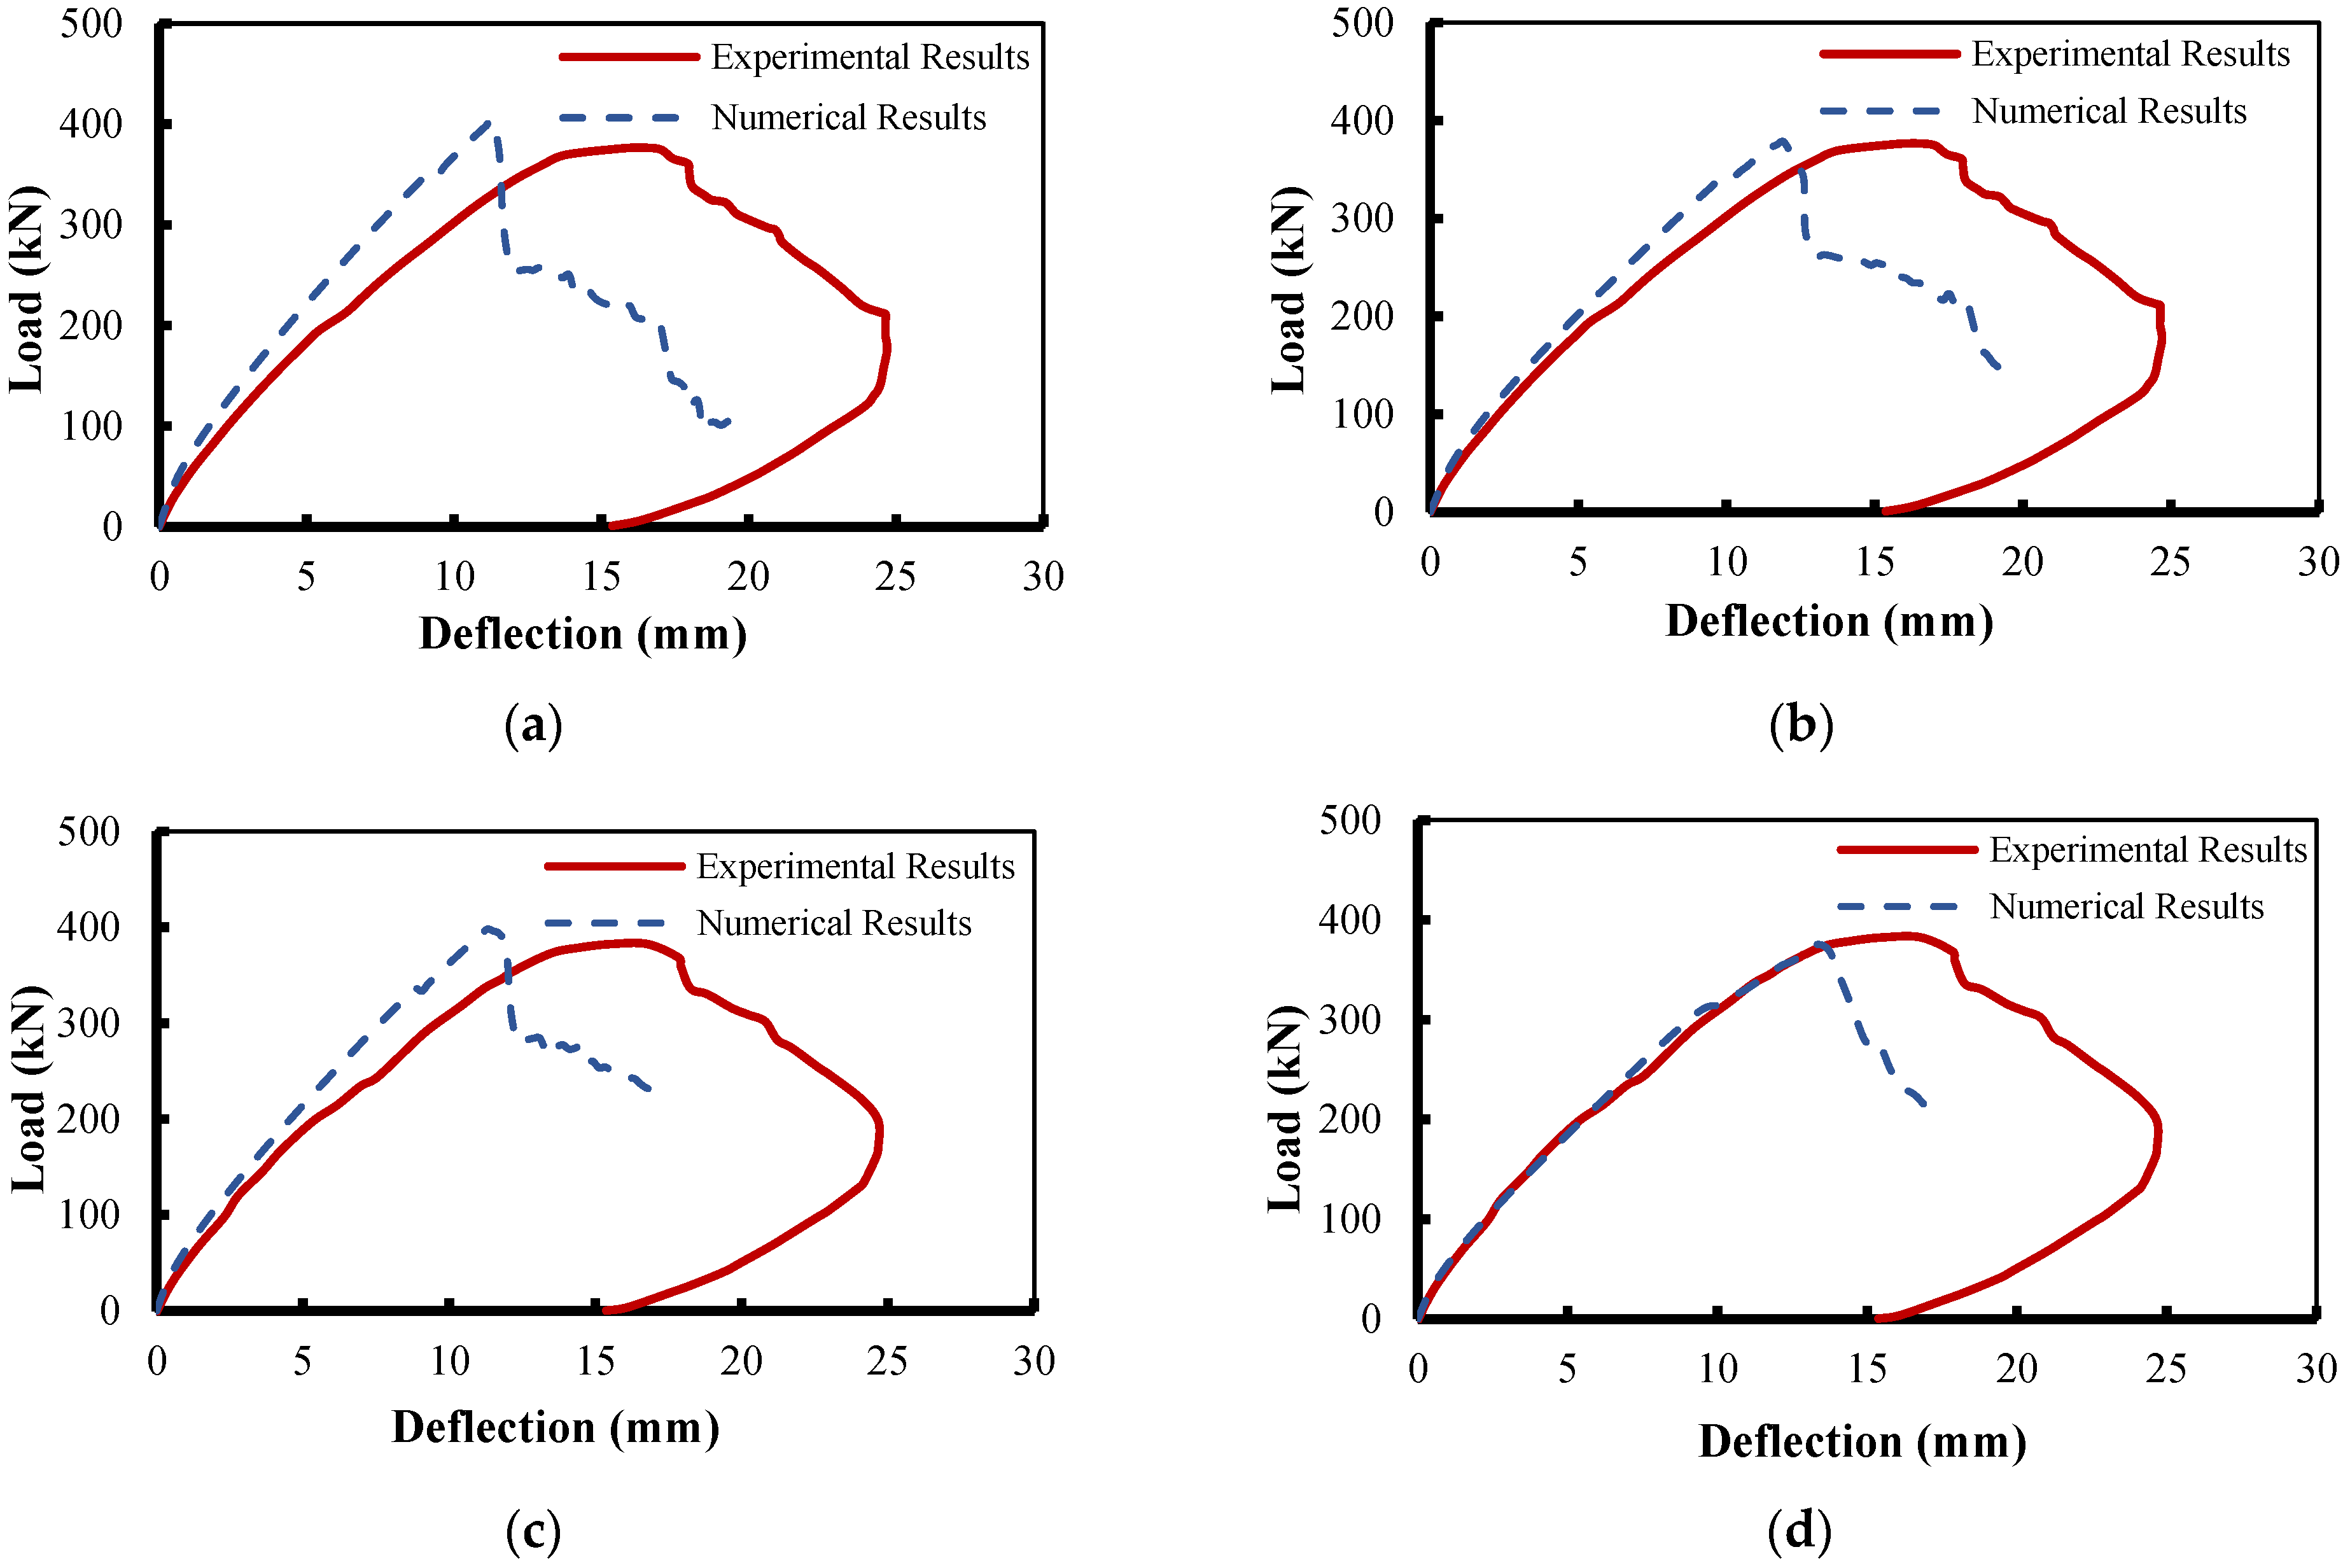
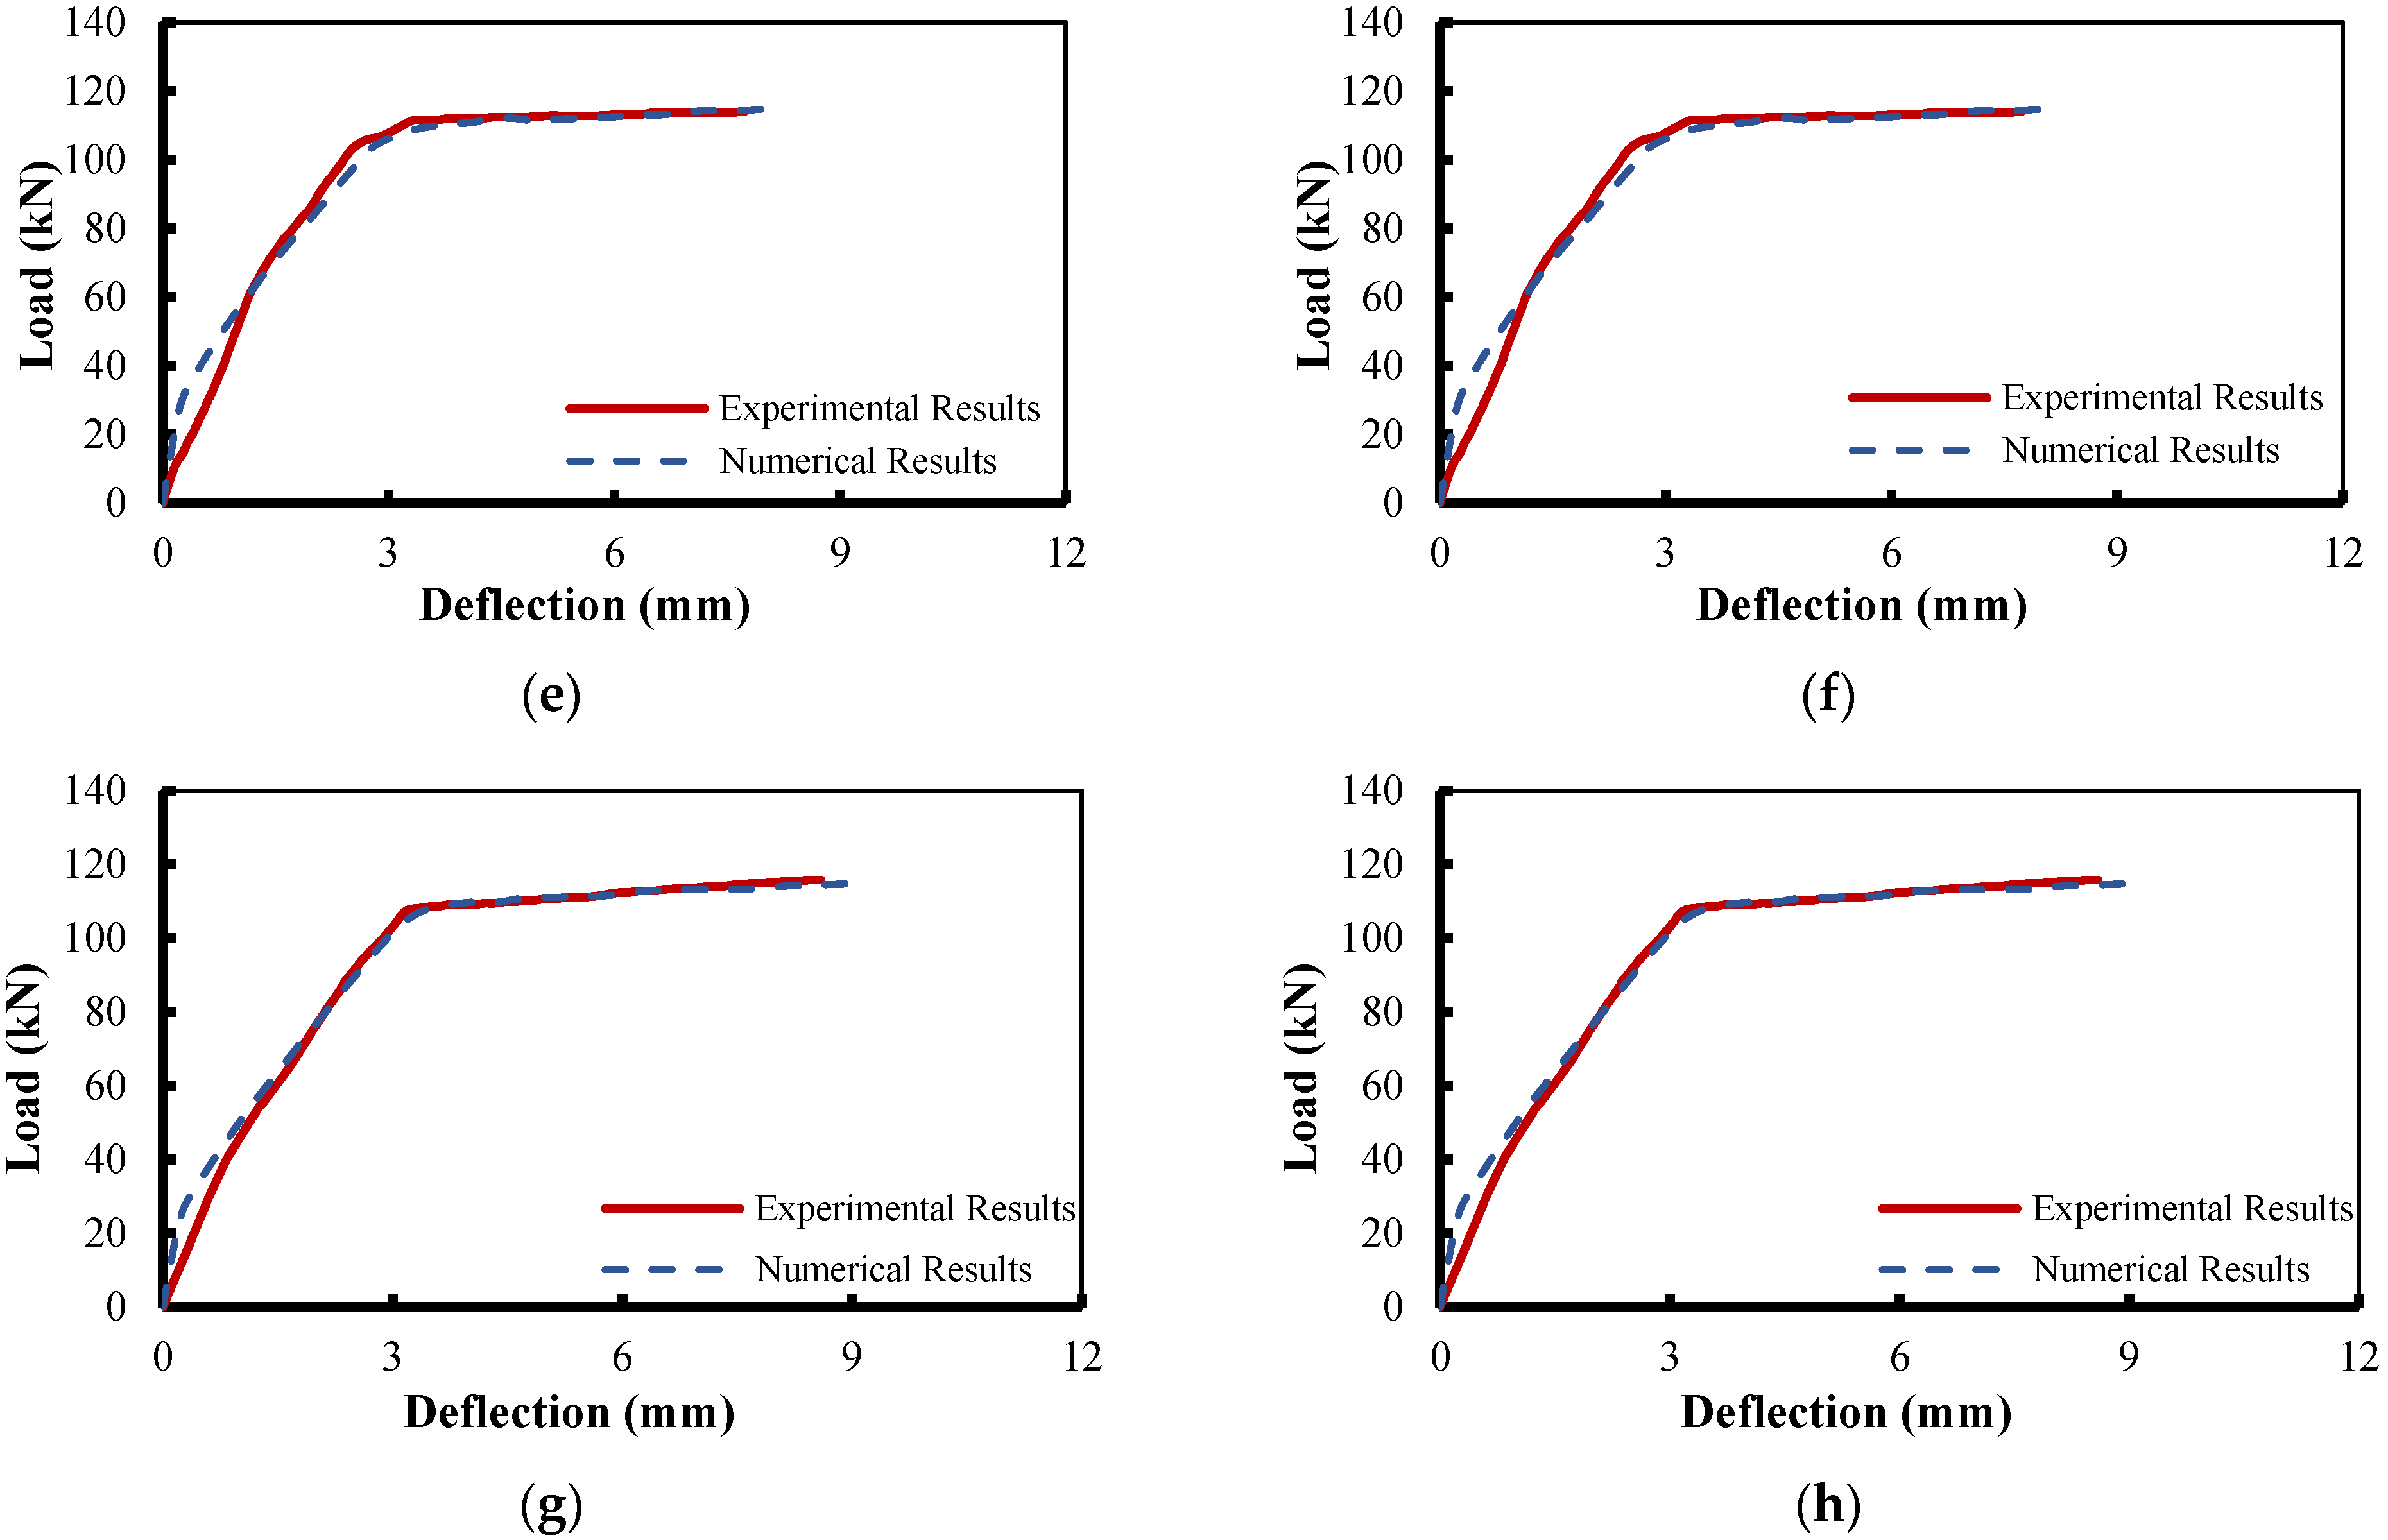
4.2.1. Load–Deflection Response
4.2.2. Failure Mode and Crack Pattern
5. Conclusions
- The numerical model results showed very good correlations when compared to experimental ones in terms of the ultimate carrying capacities and load–deflection relationships. This indicates that the VecTor2 finite element model software, which is developed based on the MCFT, is a successful candidate for simulating RC beams when loaded monotonically;
- The numerical models can notably provide an accurate simulation of the structural performance at the pre-peak behavior, post-peak behavior, failure mode, crack patterns, and maximum deflections;
- The two options for modeling the FRP composites indicate that both modeling options are effective for representing the behavior of FRP composites since, somehow, similar results were obtained;
- The concluded results reveal that the numerical models can successfully detect the crack propagation until failure;
- For FRP shear-strengthened beams, the predicted results showed that both methods adopted to simulate the FRP composites (discrete truss elements and Smeared layer element) compare very well to the experimental results.
Author Contributions
Funding
Institutional Review Board Statement
Informed Consent Statement
Data Availability Statement
Conflicts of Interest
References
- Pohoryles, D.A.; Melo, J.; Rossetto, T. Combined Flexural and Shear Strengthening of RC T-Beams with FRP and TRM: Experimental Study and Parametric Finite Element Analyses. Buildings 2021, 11, 520. [Google Scholar] [CrossRef]
- Chaallal, O.; Boussaha, F.; Bousselham, A. Fatigue Performance of RC Beams Strengthened in Shear with CFRP Fabrics. J. Compos. Constr. 2010, 14, 415–423. [Google Scholar] [CrossRef]
- Naser, M.Z.; Hawileh, R.A.; Abdalla, J. Modeling Strategies of Finite Element Simulation of Reinforced Concrete Beams Strengthened with FRP: A Review. J. Compos. Sci. 2021, 5, 19. [Google Scholar] [CrossRef]
- Sbahieh, S.; Rabie, M.; Ebead, U.; Al-Ghamdi, S.G. The Mechanical and Environmental Performance of Fiber-Reinforced Polymers in Concrete Structures: Opportunities, Challenges and Future Directions. Buildings 2022, 12, 1417. [Google Scholar] [CrossRef]
- Rajak, D.K.; Pagar, D.D.; Menezes, P.L.; Linul, E. Fiber-Reinforced Polymer Composites: Manufacturing, Properties, and Applications. Polymers 2019, 11, 1667. [Google Scholar] [CrossRef] [PubMed]
- Qureshi, J. A Review of Fibre Reinforced Polymer Structures. Fibers 2022, 10, 27. [Google Scholar] [CrossRef]
- Dong, J.; Wang, Q.; Guan, Z. Structural behaviour of RC beams externally strengthened with FRP sheets under fatigue and monotonic loading. Eng. Struct. 2012, 41, 24–33. [Google Scholar] [CrossRef]
- Teng, J.G.; Lam, L.; Chen, J.F. Shear strengthening of RC beams with FRP composites. Prog. Struct. Eng. Mater. 2004, 6, 173–184. [Google Scholar] [CrossRef]
- Bank, L.C. Composites for Construction: Structural Design with FRP Materials; John Wiley & Sons: Hoboken, NJ, USA, 2006. [Google Scholar]
- Teng, J.G.; Chen, J.F.; Smith, S.T. Debonding Failures in FRP-Strengthened RC Beams: Failure Modes, Existing Research and Future Challenges. In Composites in Construction; Wiley Online Library: Capri, Italy, 2001. [Google Scholar] [CrossRef]
- ACI 440.2R-08. 2008; Guide for the Design and Construction of Externally Bonded FRP Systems for Strengthening Concrete Structures. ACI Committee 440: Farmington Hills, MI, USA, 2008.
- Wong, P.S.; Vecchio, F.J.; Trommels, H. Vector2 & Formworks User’s Manual Second Edition; University of Toronto: Toronto, ON, Canada, 2013. [Google Scholar]
- Baingo, D. A Framework for Stochastic Finite Element Analysis of Reinforced Concrete Beams Affected by Reinforcement Corrosion. Ph.D. Thesis, University of Ottawa, Ottawa, ON, Canada, 2012. [Google Scholar] [CrossRef]
- Godat, A.; Neale, K.W.; Labossière, P. Numerical Modeling of FRP Shear-Strengthened Reinforced Concrete Beams. J. Compos. Constr. 2007, 11, 640–649. [Google Scholar] [CrossRef]
- Chen, G.; Chen, J.; Teng, J. On the finite element modelling of RC beams shear-strengthened with FRP. Constr. Build. Mater. 2012, 32, 13–26. [Google Scholar] [CrossRef]
- Chen, G. Behaviour and Strength of RC Beams Shear-Strengthened with Externally Bonded FRP Reinforcement. 2010. Available online: https://theses.lib.polyu.edu.hk/handle/200/5740 (accessed on 20 June 2022).
- Arduini, M.; Nanni, A.; Di Tommaso, A.; Focacci, F. Shear response of continuous RC beams strengthened with carbon FRP sheets. In Proceedings of the Third International Symposium on Non-Metallic (FRP) Reinforcement on Concrete Structures, Sapporo, Japan, 14–16 October 1997. [Google Scholar]
- Malek, A.; Saadatmanesh, H. Ultimate Shear Capacity of Reinforced Concrete Beams Strengthened with Web-Bonded Fiber-Reinforced Plastic Plates. ACI Struct. J. 1998, 95, 391–399. [Google Scholar] [CrossRef]
- Malek, A.; Saadatmanesh, H. Analytical Study of Reinforced Concrete Beams Strengthened with Web-Bonded Fiber Reinforced Plastic Plates or Fabrics. ACI Struct. J. 1998, 95, 343–352. [Google Scholar] [CrossRef]
- Kachlakev, D.; McCurry, D. Behavior of full-scale reinforced concrete beams retrofitted for shear and flexural with FRP laminates. Compos. Part B Eng. 2000, 31, 445–452. [Google Scholar] [CrossRef]
- Wong, R. Towards Modelling of Reinforced Concrete Members with Externally-Bonded Fibre Reinforced Polymer, FRP, Composites. Master’s Thesis, University of Toronto, Toronto, ON, Canada, 2001. Available online: https://library-archives.canada.ca/eng/services/services-libraries/theses/Pages/item.aspx?idNumber=1006758496 (accessed on 24 February 2023).
- Vecchio, F.J.; Collins, M.P. The modified compression-field theory for reinforced concrete elements subjected to shear. ACI J. 1986, 83, 219–231. [Google Scholar]
- Salgado, R.A.; Guner, S. A Numerical Analysis Methodology for the Strengthening of Deep Cap Beams. Spec. Publ. 2019, 333, 1–18. [Google Scholar] [CrossRef]
- Benmokrane; Neale, K.W.; Belarbi, A.; Yahia, A. Performance and Strut Efficiency Factor of Concrete Deep Beams Reinforced With Gfrp Bars. Ph.D. Thesis, University of Sherbrooke, Sherbrooke, QC, Canada, 2015. [Google Scholar]
- Rezvanisharif, M.; Ketabi, M.S. FE Modeling and Seismic Performance Evaluation of Hybrid SMA-Steel RC Beam-Column Joints. Lat. Am. J. Solids Struct. 2019, 16, e192. [Google Scholar] [CrossRef]
- Habibi, S. Finite Element Modelling of Corrosion Damaged Reinforced Concrete Structures. Master’s Thesis, University of Torono, Toronto, ON, Canada, 2017. Available online: https://www.proquest.com/docview/1934400235?pq-origsite=gscholar&fromopenview=true (accessed on 1 February 2023).
- Bentz, E.C.; Vecchio, F.J.; Collins, M.P. Simplified Modified Compression Field Theory for Calculating Shear Strength of Reinforced Concrete Elements. ACI Struct. J. 2006, 103, 614–624. [Google Scholar] [CrossRef]
- Vass, G. Finite Element Modelling of Different Strengthening Strategies for Reinforced Concrete Deep Beams. Master’s Thesis, Université de Liège, Liège, Belgique, 2018. Available online: https://matheo.uliege.be/handle/2268.2/4439 (accessed on 27 February 2022).
- Sadeghian, V.; Vecchio, F. The Modified Compression Field Theory: Then and Now. ACI Struct. J. 2018, 328, 20. [Google Scholar] [CrossRef]
- Comparison of Nonlinear Finite Element Modeling Tools for Structural Concrete. Available online: https://scholar.google.com/scholar?hl=en&as_sdt=0%2C5&q=Comparison+of+Nonlinear+Finite+Element+Modeling+Tools+for+Structural+Concrete&btnG= (accessed on 2 December 2022).
- Ceresa, P.; Víquez, A.G. Nonlinear Analysis of Shear Critical Rc Members Using Current Fe Software. In Proceedings of the 6th International Conference on Computational Methods in Structural Dynamics and Earthquake Engineering Methods in Structural Dynamics and Earthquake Engineering, Rhodes Island, Greece, 15–17 June 2017. [Google Scholar] [CrossRef]
- Arafa, A.; Farghaly, A.S.; Benmokrane, B. Nonlinear Finite-Element Analysis for Predicting the Behavior of Concrete Squat Walls Reinforced with GFRP Bars. J. Struct. Eng. 2019, 145, 04019107. [Google Scholar] [CrossRef]
- Pathak, P.; Zhang, Y.X. Finite Element Simulation for Nonlinear Finite Element Analysis of FRP Strengthened RC Beams with Bond-Slip Effect. Appl. Mech. Mater. 2016, 846, 440–445. [Google Scholar] [CrossRef]
- Rasheed, H.A. Strengthening Design of Reinforced Concrete with FRP; CRC Press: Boca Raton, FL, USA, 2014. [Google Scholar] [CrossRef]
- Arafa, A.; Ahmed, N.; Farghaly, A.S.; Chaallal, O.; Benmokrane, B. Exploratory Study on Incorporating Glass FRP Reinforcement to Control Damage in Steel-Reinforced Concrete Bridge Pier Walls. J. Bridg. Eng. 2021, 26, 04020116. [Google Scholar] [CrossRef]
- Al-Rousan, R.; Issa, M. Fatigue performance of reinforced concrete beams strengthened with CFRP sheets. Constr. Build. Mater. 2011, 25, 3520–3529. [Google Scholar] [CrossRef]
- Kent, D.C.; Park, R. Flexural Members with Confined Concrete. J. Struct. Div. 1971, 97, 1969–1990. [Google Scholar] [CrossRef]
- Junior, S.A.A.; Parvin, A. Performance of Continuous Concrete Beams with Reinforced FRP Bars and Sheets. In Proceedings of the 5th International Conference on Smart Monitoring, Assessment and Rehabilitation of Civil Structures, Potsdam, Germany, 27–29 August 2019; p. 8. [Google Scholar]
- Baji, H.; Eslami, A.; Ronagh, H. Development of a nonlinear FE modelling approach for FRP-strengthened RC beam-column connections. Structures 2015, 3, 272–281. [Google Scholar] [CrossRef]
- Ibrahim, N.; Elkholy, S.; Godat, A. Finite Element Simulation of Reinforced Concrete Beams under Fatigue Loading. In Proceedings of the 7th World Congress on Civil, Structural, and Environmental Engineering, CSEE 2022, Lisbon, Portugal, 10–12 April 2022. [Google Scholar] [CrossRef]
- Ibrahim, A.M.; Mahmood, M.S. Finite Element Modeling of Reinforced Concrete Beams Strengthened with FRP Laminates. Eur. J. Sci. Res. 2009, 30, 526–541. [Google Scholar]
- Godat, A.; Labossière, P.; Neale, K.W.; Chaallal, O. Behavior of RC members strengthened in shear with EB FRP: Assessment of models and FE simulation approaches. Comput. Struct. 2012, 92–93, 269–282. [Google Scholar] [CrossRef]
- Ferreira, D.; Oller, E.; Marí, A.; Bairán, J. Numerical Analysis of Shear Critical RC Beams Strengthened in Shear with FRP Sheets. J. Compos. Constr. 2013, 17, 04013016. [Google Scholar] [CrossRef]
- Prajapati, G.N.; Aalok, A.D.P.; Reddy, T.B. Finite Element Simulation of Shear Strengthened Rc Beams Externally Reinforced with Frp. 2021, Volume 18, No. 3, pp. 357–370, January 2017. Available online: https://www.sid.ir/en/Journal/ViewPaper.aspx?ID=517766 (accessed on 26 December 2021).
- Said, S.; Sadeghian, V.; Lau, D. Modelling of Frp-Strengthened Shear Walls With Special Consid-Eration to End-Anchorage and Debonding Effects. In Proceedings of the 17th World Conference on Earthquake Engineering, Sendai, Japan, 13–18 September 2020; p. 13. [Google Scholar]
- Palermo, D.; Vecchio, F.J. Simulation of Cyclically Loaded Concrete Structures Based on the Finite-Element Method. J. Struct. Eng. 2007, 133, 728–738. [Google Scholar] [CrossRef]
- Shin, D.-H.; Kim, H.-J. Cyclic response of rectangular RC columns retrofitted by hybrid FRP sheets. Structures 2020, 28, 697–712. [Google Scholar] [CrossRef]
- Murthy, A.R.; Karihaloo, B.; Rani, P.V.; Priya, D.S. Fatigue behaviour of damaged RC beams strengthened with ultra high performance fibre reinforced concrete. Int. J. Fatigue 2018, 116, 659–668. [Google Scholar] [CrossRef]
- Banjara, N.K.; Ramanjaneyulu, K. Investigations on behaviour of flexural deficient and CFRP strengthened reinforced concrete beams under static and fatigue loading. Constr. Build. Mater. 2019, 201, 746–762. [Google Scholar] [CrossRef]
- Papakonstantinou, C.G.; Petrou, M.F.; Harries, K.A. Fatigue Behavior of RC Beams Strengthened with GFRP Sheets. J. Compos. Constr. 2001, 5, 246–253. [Google Scholar] [CrossRef]
- Papakonstantinou, G.; Balaguru, P.N.; Petrou, M.F. Analysis of Reinforced Concrete Beams Strengthened with Composites Subjected to Fatigue Loading; ACI Special Publication: Farmington Hills, MI, USA, 2002; pp. 41–60. [Google Scholar]
- Mofidi, A.; Chaallal, O. Shear Strengthening of RC Beams with Externally Bonded FRP Composites: Effect of Strip-Width-to-Strip-Spacing Ratio. J. Compos. Constr. 2011, 15, 732–742. [Google Scholar] [CrossRef]
- Bourget, S.; El-Saikaly, G.; Chaallal, O. Behavior of Reinforced Concrete T-Beams Strengthened in Shear Using Closed Carbon Fiber-Reinforced Polymer Stirrups Made of Laminates and Ropes. ACI Struct. J. 2017, 114, 1087–1098. [Google Scholar] [CrossRef]
- El-Saikaly, G.; Chaallal, O. Extending the Fatigue Life of Reinforced Concrete T-Beams Strengthened in Shear with Externally Bonded FRP: Upgrading versus Repairing. J. Compos. Constr. 2015, 19, 04014027. [Google Scholar] [CrossRef]
- El-Saikaly, G.; Chaallal, O. Fatigue behavior of RC T-beams strengthened in shear with EB CFRP L-shaped laminates. Compos. Part B Eng. 2015, 68, 100–112. [Google Scholar] [CrossRef]
- Mofidi, A.; Thivierge, S.; Chaallal, O.; Shao, Y. Behavior of Reinforced Concrete Beams Strengthened in Shear Using L-Shaped CFRP Plates: Experimental Investigation. J. Compos. Constr. 2014, 18, 04013033. [Google Scholar] [CrossRef]
- Gusella, F. Effect of the plastic rotation randomness on the moment redistribution in reinforced concrete structures. Eng. Struct. 2021, 252, 113652. [Google Scholar] [CrossRef]
- D’Angela, D.; Magliulo, G.; Celano, F.; Cosenza, E. Characterization of local and global capacity criteria for collapse assess-ment of code-conforming RC buildings. Bull. Earthq. Eng. 2021, 19, 3701–3743. [Google Scholar] [CrossRef]


| Material | Factor | Constitutive Model |
|---|---|---|
| Concrete | Compression Pre-Peak | Hognestad (Parabola) |
| Compression Post-Peak | Modified Park–Kent | |
| Compression Softening | Vecchio 1992-A (e1/e2-Form) | |
| Tension Stiffening | Modified Bentz 2005 | |
| Tension Softening | Non-Linear (Hordjik) | |
| Confined Strength | Kupfer/Richart | |
| Cracking Criterion | Mohr–Coulomb | |
| Steel Reinforcement | Reinforcement Stress–Strain | Elastic–Plastic |
| FRP | FRP Stress–Strain | Linear Elastic |
| Number | Specimen | Beam Dimensions (mm) | 6 | Cross-Section | Beam Status | ||||
|---|---|---|---|---|---|---|---|---|---|
| 1 | 2 | 3 | 4 | 5 | |||||
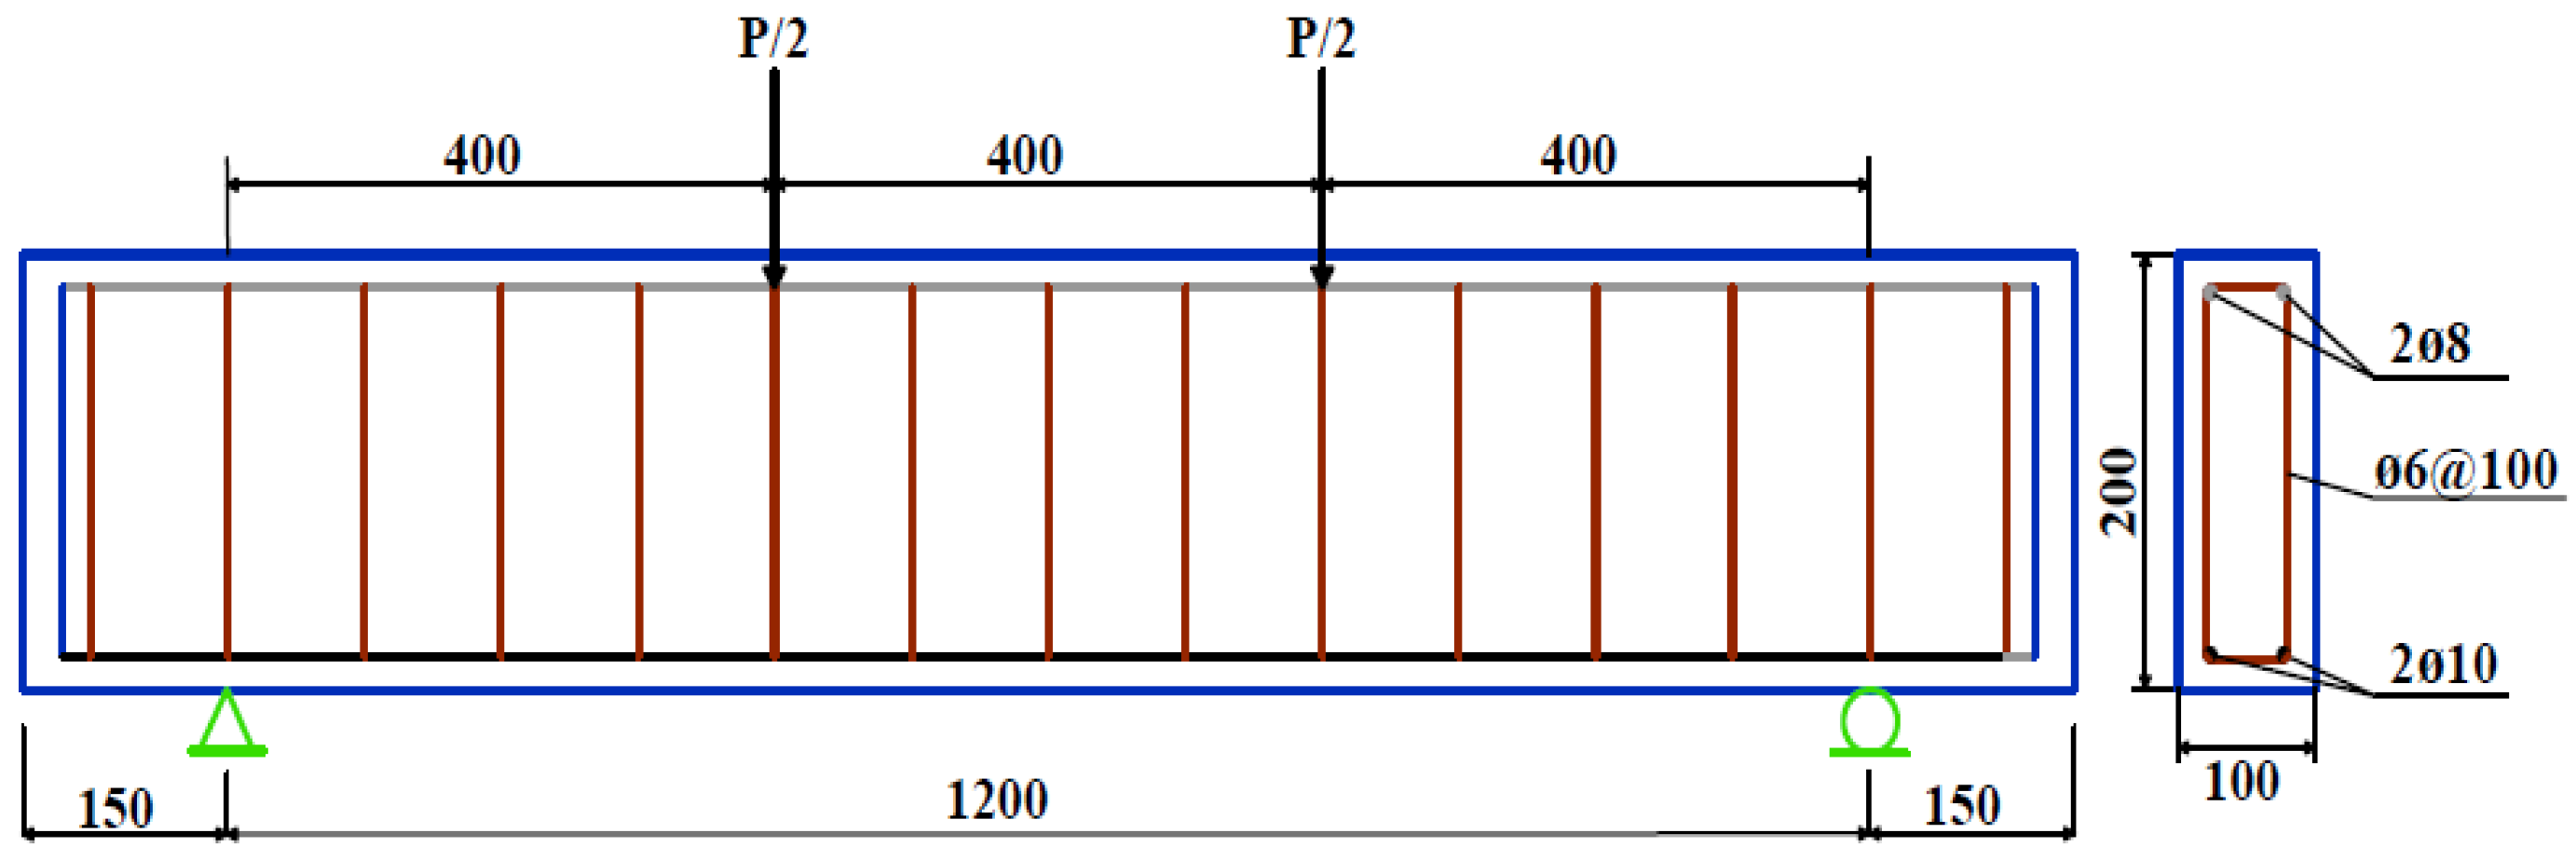
| 1 [48] | CBA | 1200 | 100 | - | 200 | - | 2.00 | R-Beam | Control |
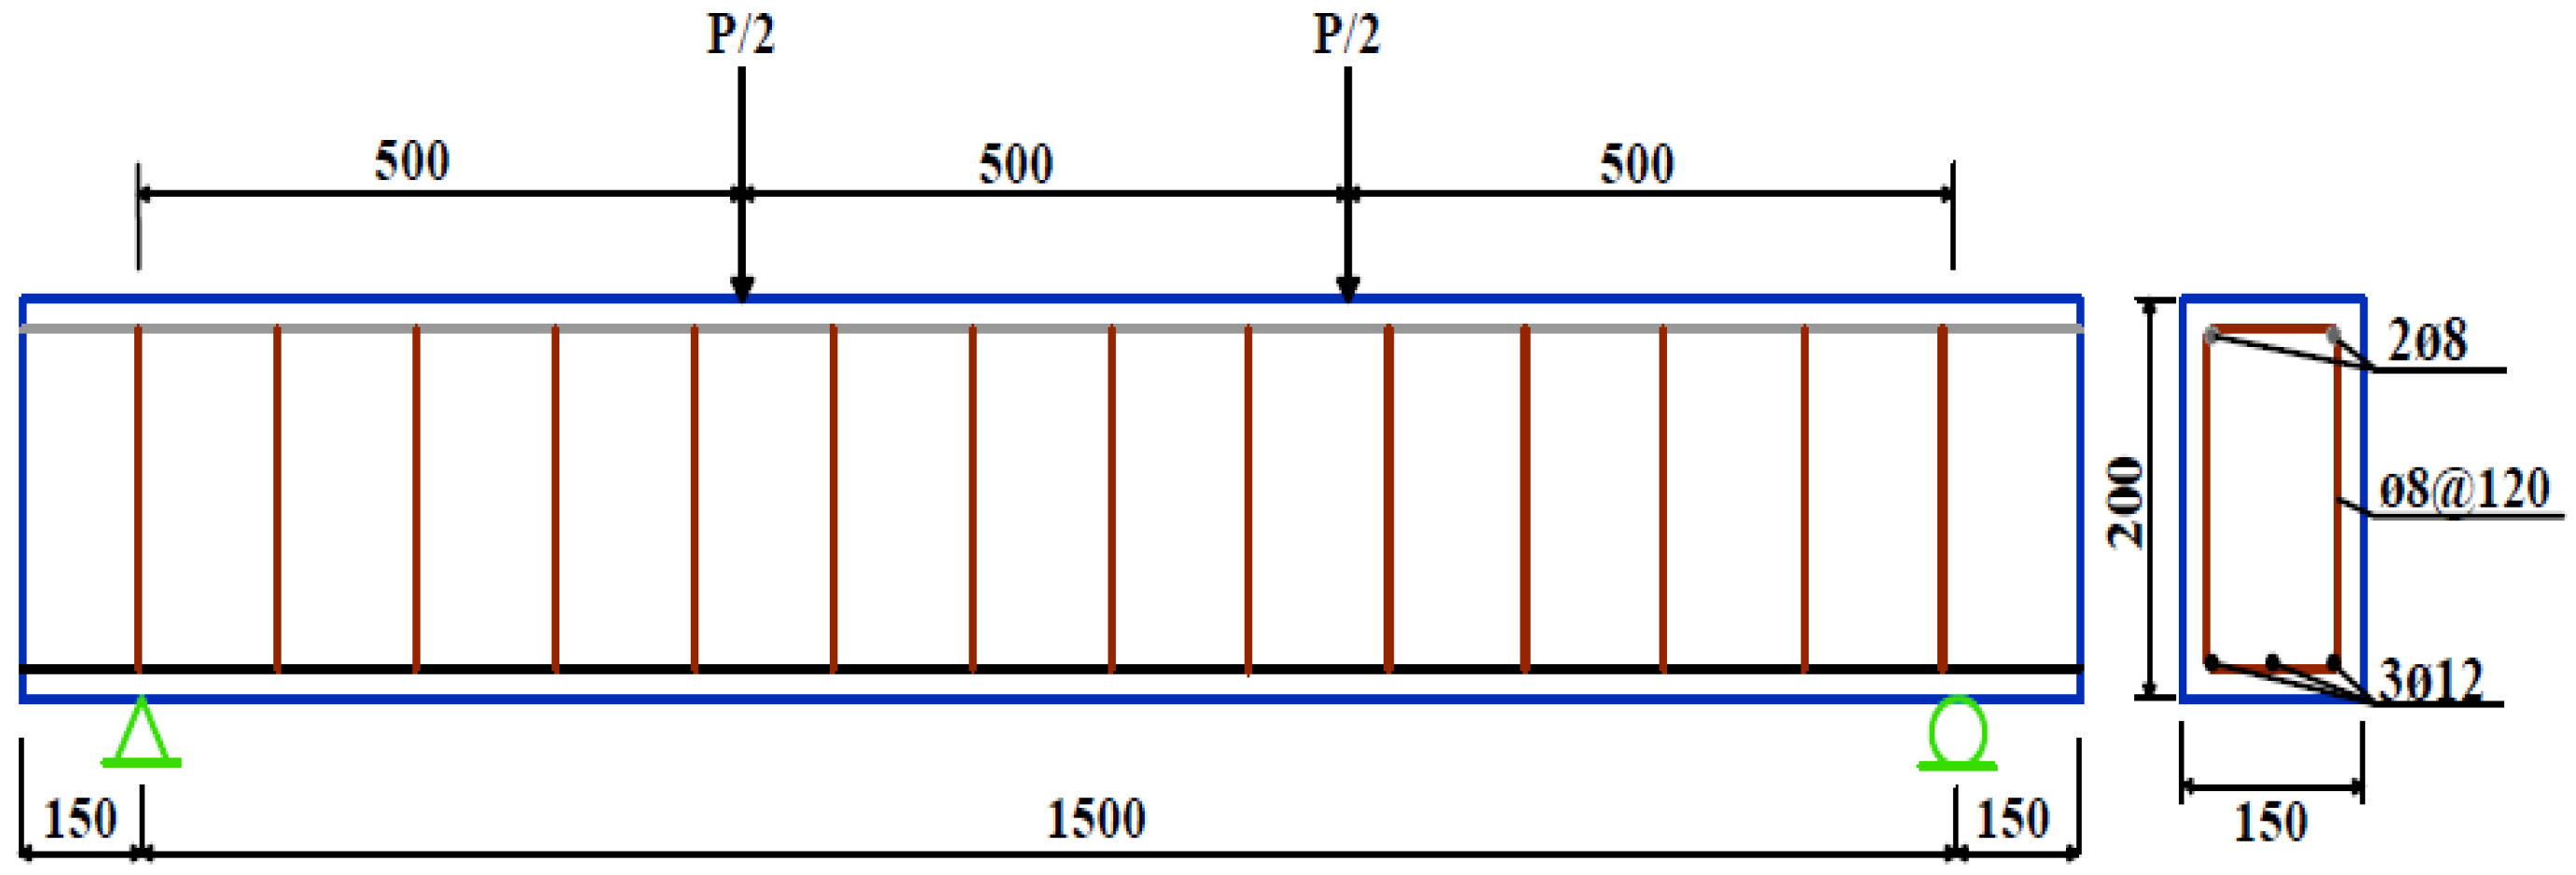
| 2 [49] | C | 1500 | 150 | - | 200 | - | 2.50 | R-Beam | Control |
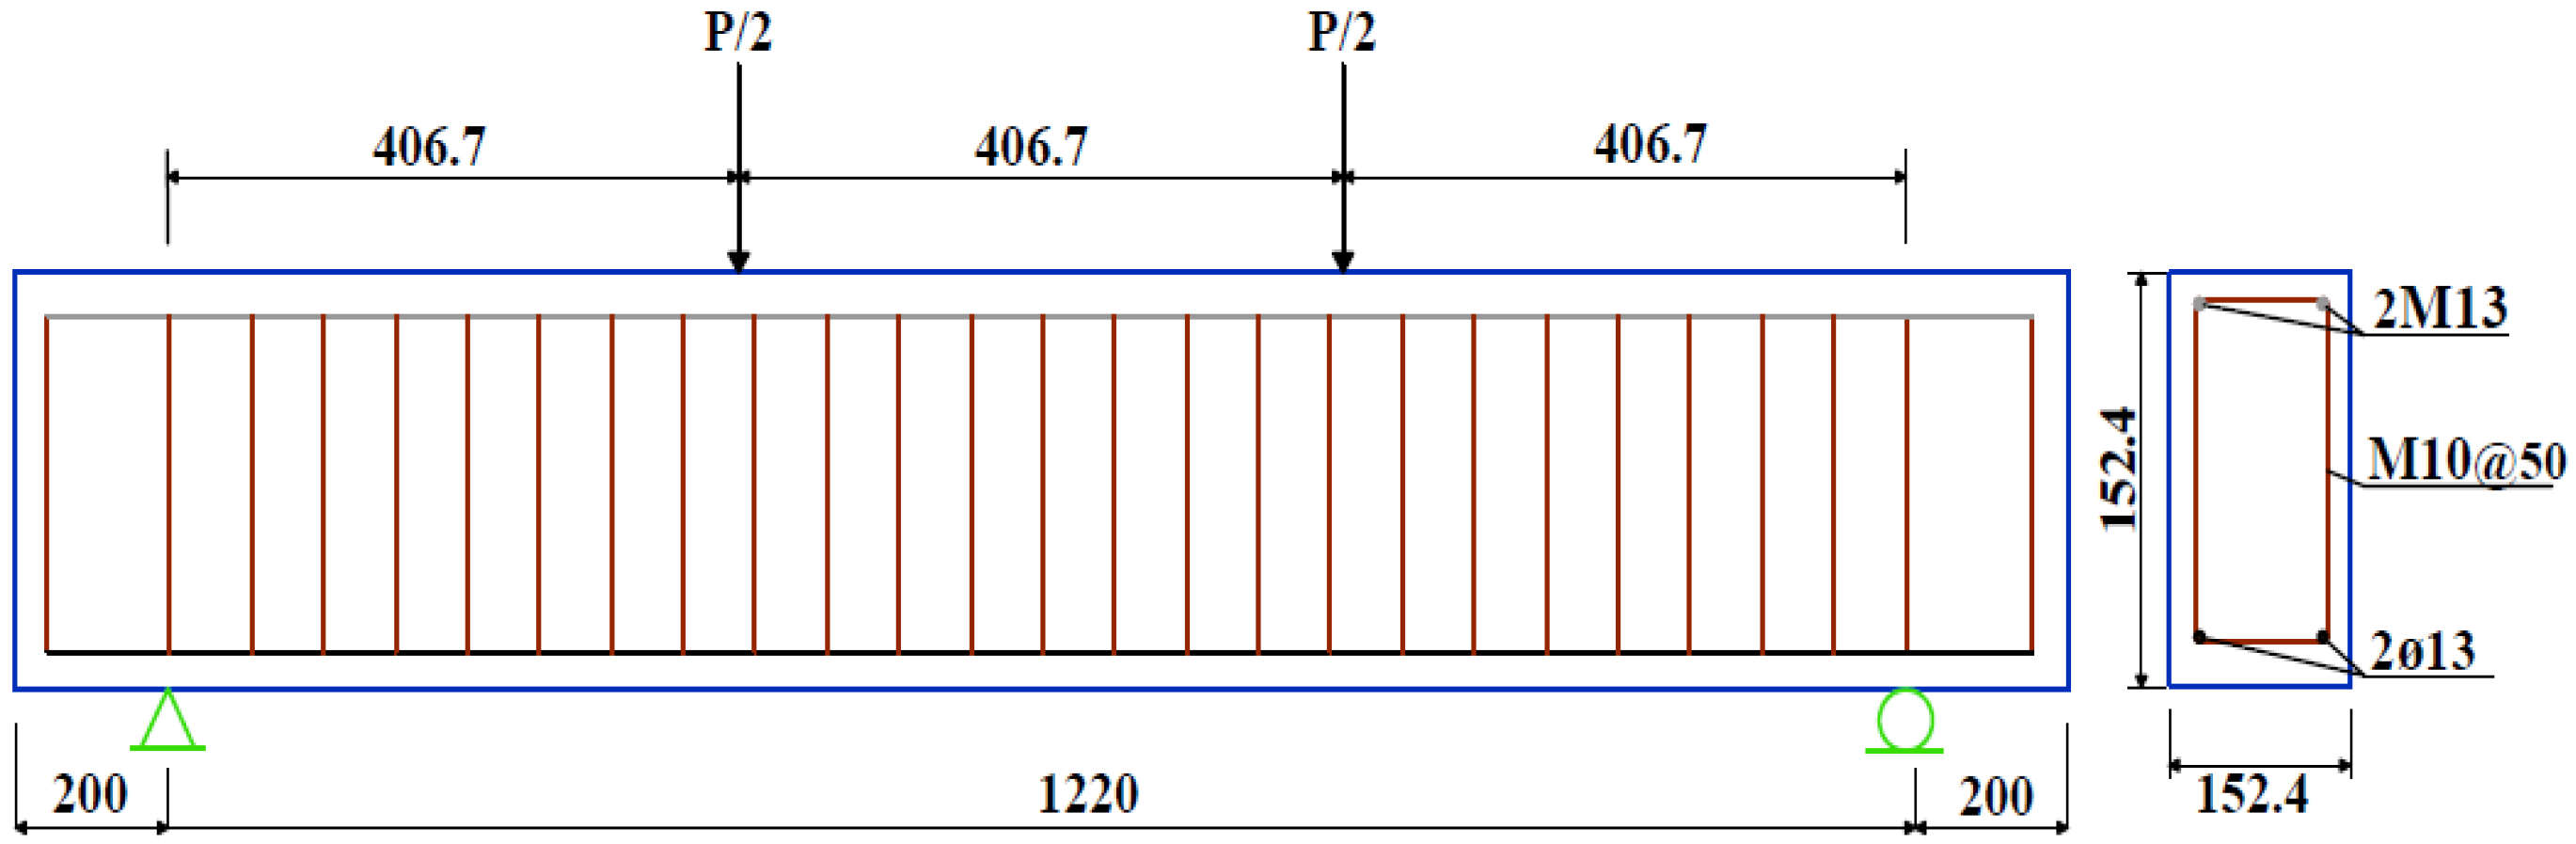
| 3 [50,51] | N-1 | 1220 | 152.4 | - | 152.4 | - | 2.67 | R-Beam | Control |
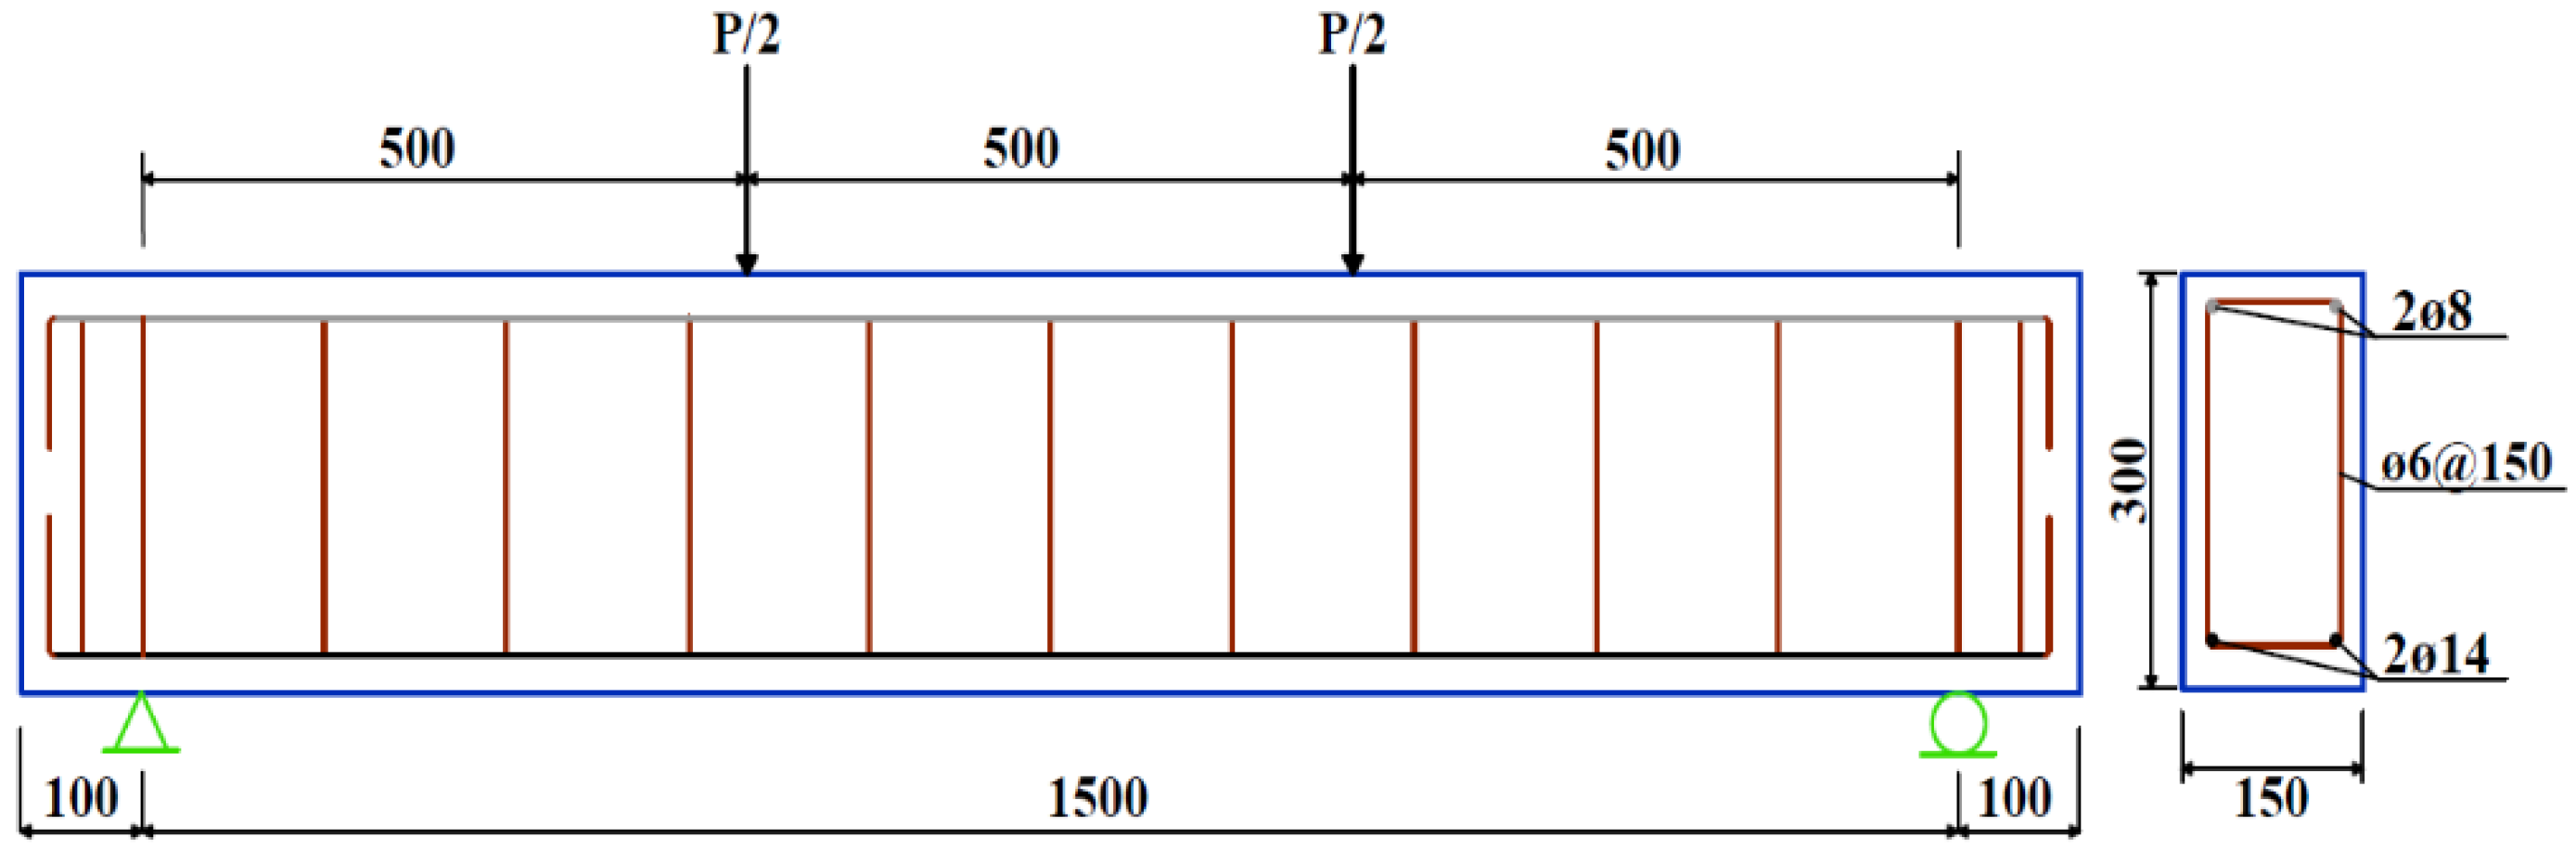
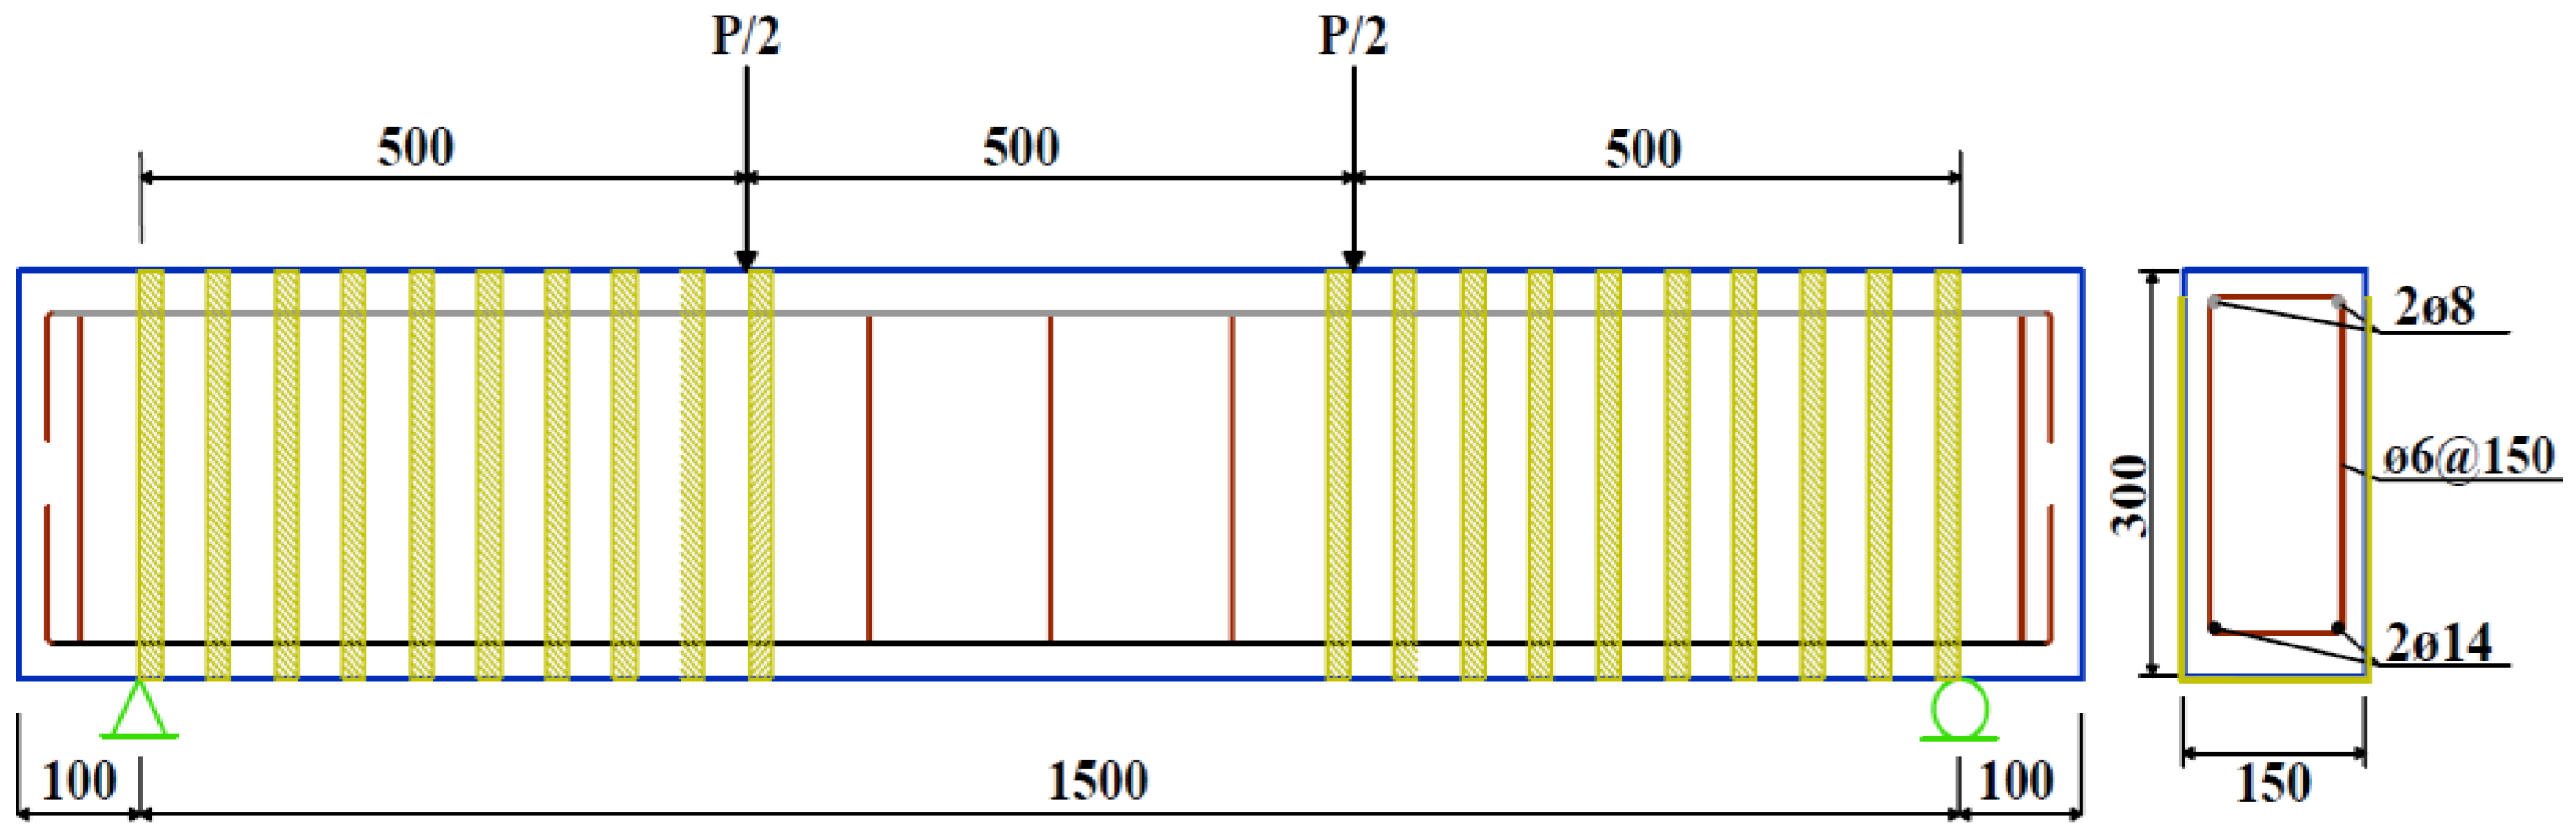
| 4 [7] | FB30-1 | 1500 | 150 | - | 300 | - | 1.67 | R-Beam | Control |
| 5 [7] | FB30-2 | Strengthened | |||||||
| 6 [7] | FB30-3 | ||||||||
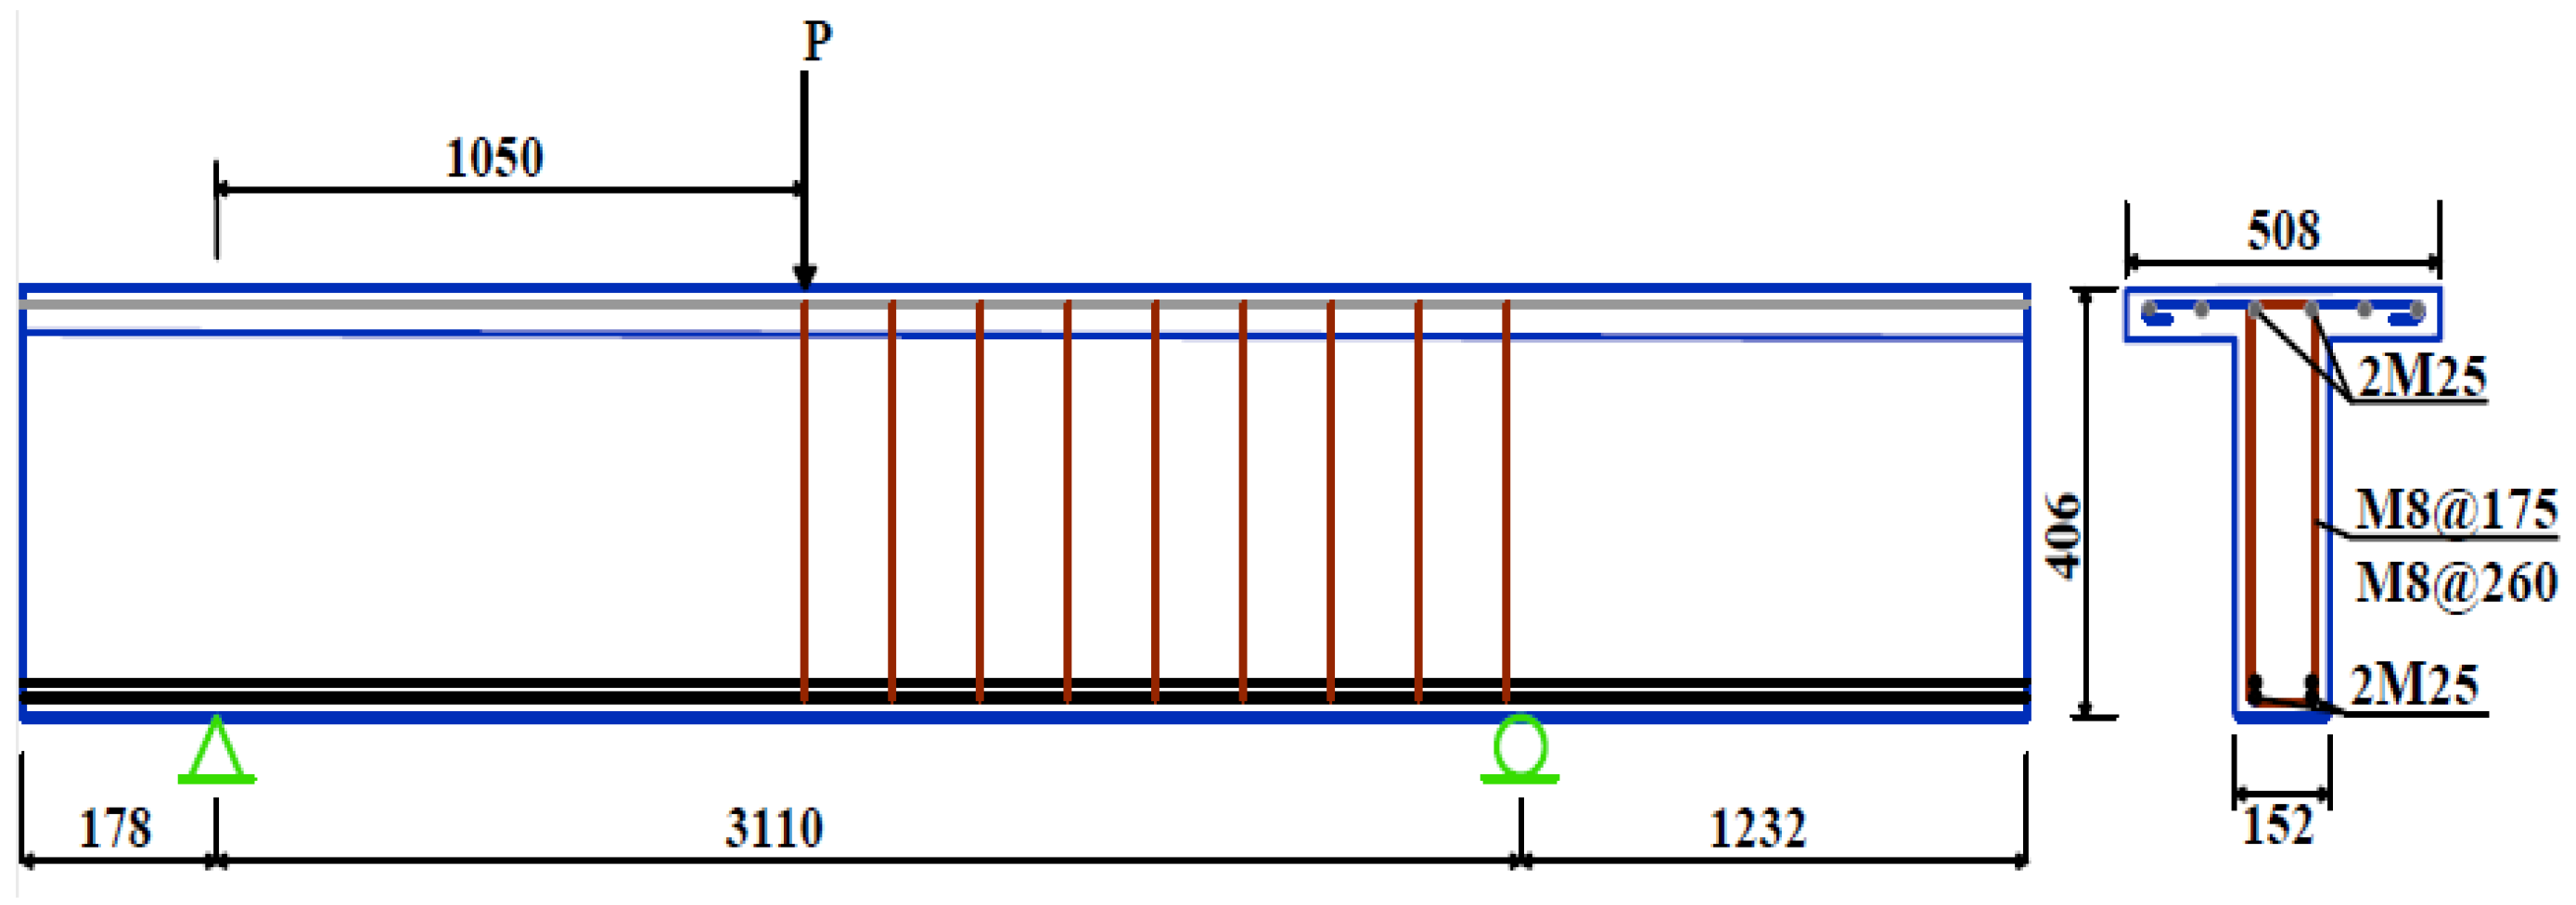
| 7 [52,53] | CON-S0 | 3110 | 152 | 508 | 304 | 102 | 3.00 | T-Beam | Control |
| 8 [52,53] | CON-S1 | ||||||||
| 9 [52,53] | CON-S3 | ||||||||
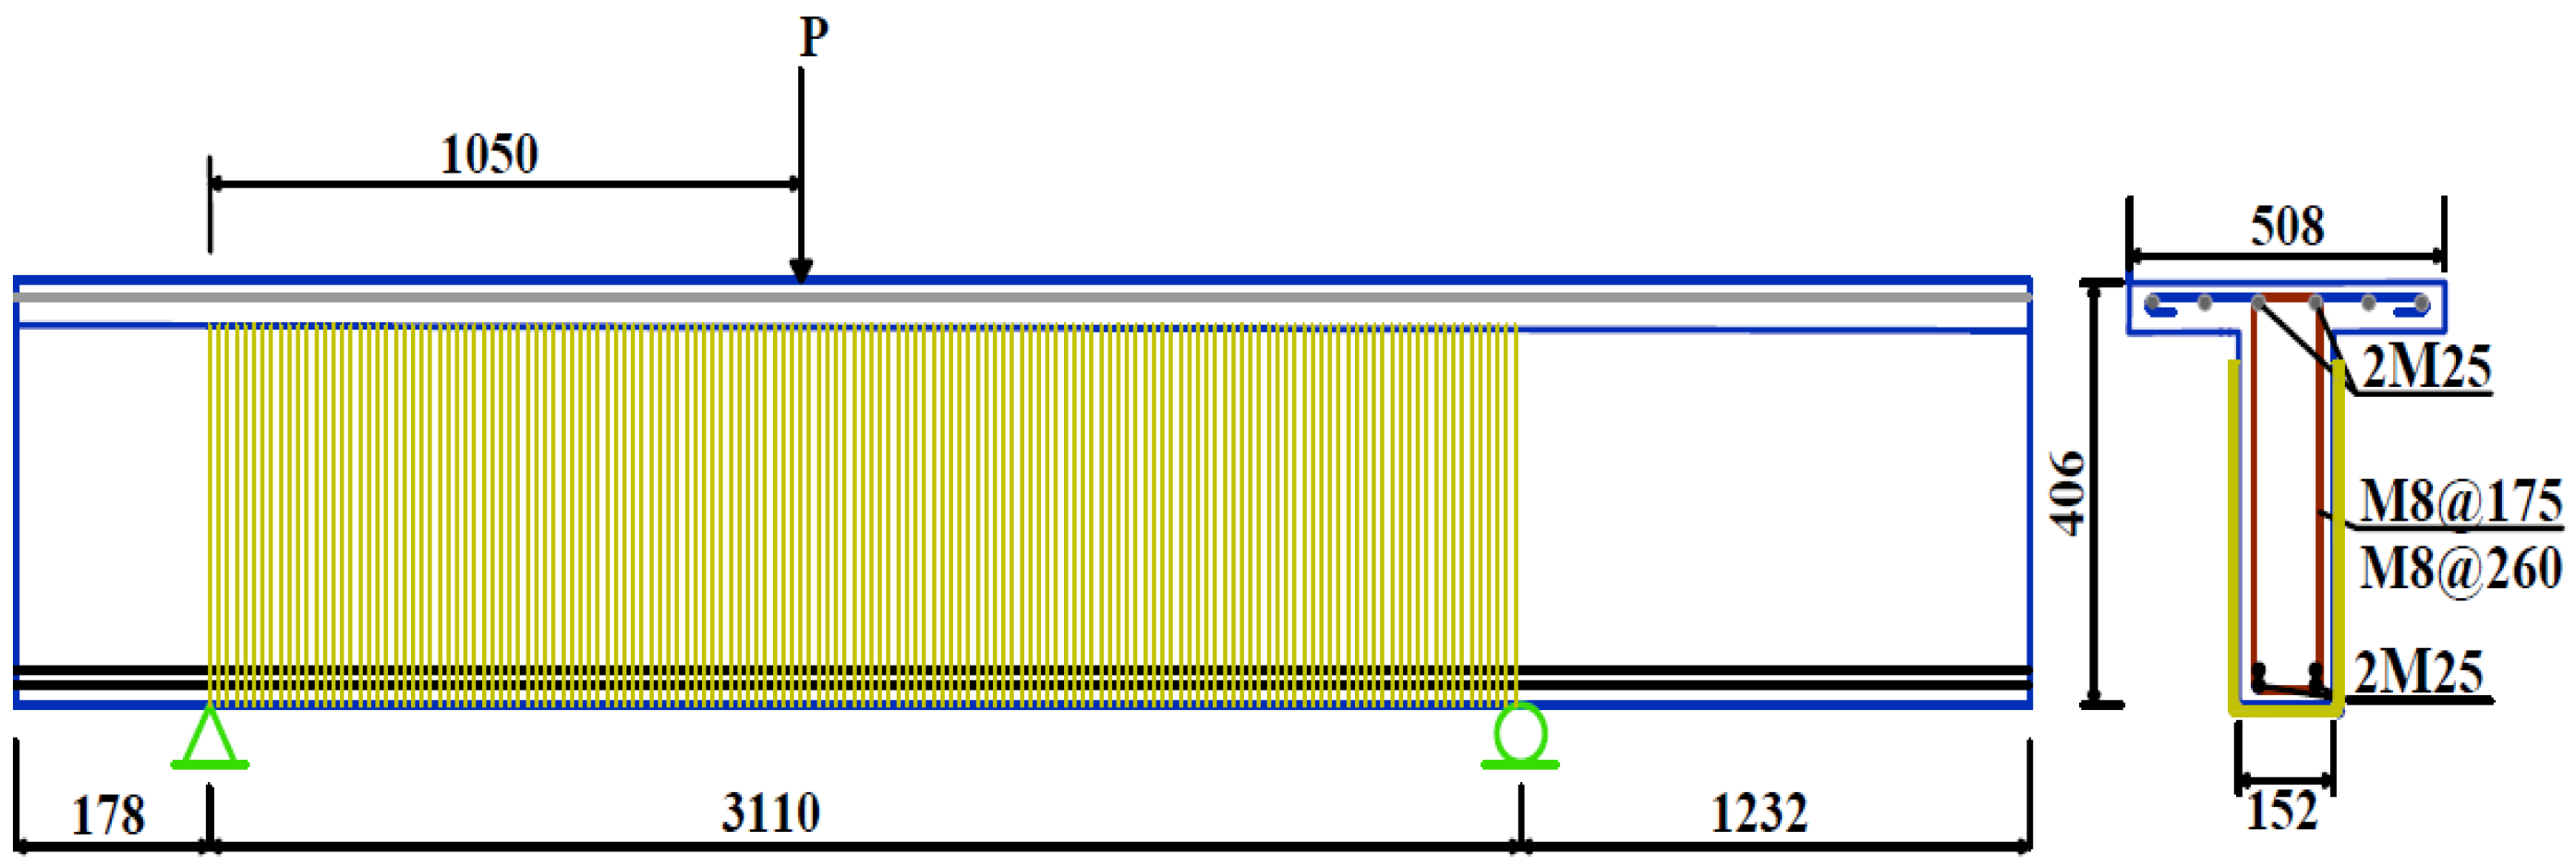
| 10 [2,54,55,56] | S1-0.33R | Strengthened | |||||||
| 11 [2,54,55,56] | S3-EB | ||||||||
| Number | Specimen | 1 (MPa) | Longitudinal Steel | Transverse Steel | ||||
|---|---|---|---|---|---|---|---|---|
| Top | Bottom | |||||||
| Dia. 2 (mm) | Yield Stress (MPa) | Dia. (mm) | Yield Stress (MPa) | Dia. (mm) at Spacing (mm) | Yield Stress (MPa) | |||
| 1 [48] | CBA | 35 | 2 8 | 300 | 2 10 | 590 | 6 @ 100 | 240 |
| 2 [49] | C | 35 | 2 8 | 300 | 3 12 | 420 | 8 @ 120 | 300 |
| 3 [50,51] | N-1 | 39.3 | 2 13 | 427 | 2 13 | 427 | 10 @ 50 | 320 |
| 4 [7] | FB30-1 | 25 | 2 8 | 330 | 2 14 | 410 | 6 @ 150 | 240 |
| 5 [7] | FB30-2 | |||||||
| 6 [7] | FB30-3 | |||||||
| 7 [52,53] | CON-S0 | 31 | 6 10 | 480 | 2 25 | 500 | None | - |
| 8 [52,53] | CON-S1 | 8 @ 175 | 540 | |||||
| 9 [52,53] | CON-S3 | 8 @ 260 | 540 | |||||
| 10 [2,54,55,56] | S1-0.33R | 8 @ 175 | 540 | |||||
| 11 [2,54,55,56] | S3-EB | 8 @ 260 | 540 | |||||
| Number | Specimen | FRP Type | 1 (mm) | 2 (mm) at Spacing | Ultimate Strength (MPa) | E 3 (GPa) | Ultimate Strain (%) |
|---|---|---|---|---|---|---|---|
| 5 [7] | FB30-2 | CFRP Strips | 0.11 | 50 @ 50 | 4103 | 242 | 1.7 |
| 6 [7] | FB30-3 | GFRP Strips | 0.27 | 50 @ 50 | 3400 | 73 | 2.7 |
| 10 [2,54,55,56] | S1-0.33R | CFRP Sheet | 0.11 | - | 3450 | 230 | 1.33 |
| 11 [2,54,55,56] | S3-EB | CFRP Sheet | 0.11 | - | 3450 | 230 | 1.33 |
| Number | Specimen | Experimental Results | Numerical Results | Difference (%) 1 | |||||||||
|---|---|---|---|---|---|---|---|---|---|---|---|---|---|
(kN) | (mm) | (kN) | (mm) | (kN) | (mm) | (kN) | (mm) | (%) | (%) | (%) | (%) | ||
| 1 | CBA [48] | 77.95 | 14.23 | 71.04 | 26.34 | 78.17 | 6.86 | 75.38 | 13.29 | 0.28 | 0.53 | 6.11 | 49.54 |
| 2 | C [49] | 105.32 | 17.09 | 88.01 | 32.66 | 98.39 | 15.40 | 81.15 | 31.86 | 6.58 | 9.90 | 7.79 | 2.45 |
| 3 | N-1 [50,51] | 75.14 | 15.02 | 75.14 | 15.02 | 77.19 | 17.86 | 77.19 | 17.86 | 2.73 | 18.91 | 2.73 | 18.91 |
| 4 | FB30-1 [7] | 106.48 | 16.80 | 109.49 | 11.50 | 99.08 | 15.20 | 109.67 | 8.87 | 6.95 | 9.52 | 0.16 | 22.87 |
| 7 | CON-S0 [52,53] | 123.48 | 2.64 | 107.72 | 3.38 | 123.61 | 2.91 | 123.61 | 2.91 | 0.11 | 10.23 | 14.75 | 13.91 |
| 8 | CON-S1 [52,53] | 349.68 | 11.82 | 349.68 | 11.82 | 331.18 | 9.65 | 331.18 | 9.65 | 5.29 | 18.36 | 5.29 | 18.36 |
| 9 | CON-S3 [52,53] | 283.38 | 11.31 | 283.38 | 11.31 | 283.04 | 10.63 | 283.04 | 10.63 | 0.12 | 6.01 | 0.12 | 6.01 |
| Mean | 3.15 | 10.49 | 5.28 | 18.86 | |||||||||
| Standard Deviation | 3.10 | 6.50 | 5.10 | 15.37 | |||||||||
| No. | Specimen | Experimental Results | Numerical Results | Difference (%) | |||||||
|---|---|---|---|---|---|---|---|---|---|---|---|
| SL 1 | DT 2 | SL | DT | ||||||||
(kN) | (mm) | (kN) | (mm) | (kN) | (mm) | (kN) | (mm) | (kN) | (mm) | ||
| 5 | FB30-2 [7] | 114.37 | 7.68 | 114.88 | 8.17 | 114.88 | 8.17 | 0.45 | 6.38 | 0.45 | 6.38 |
| 6 | FB30-3 [7] | 107.37 | 3.17 | 108.52 | 3.57 | 108.52 | 3.57 | 1.07 | 12.62 | 1.07 | 12.62 |
| 10 | S1-0.33R [2,54,55,56] | 376.63 | 16.53 | 403.62 | 11.29 | 367.74 | 12.16 | 7.17 | 31.70 | 2.36 | 26.44 |
| 11 | S3-EB [2,54,55,56] | 382.54 | 16.78 | 380.32 | 11.96 | 368.48 | 13.74 | 0.58 | 28.72 | 3.68 | 18.12 |
| Mean | 2.32 | 19.86 | 1.89 | 15.89 | |||||||
| Standard Deviation | 2.81 | 10.64 | 1.24 | 7.37 | |||||||
Disclaimer/Publisher’s Note: The statements, opinions and data contained in all publications are solely those of the individual author(s) and contributor(s) and not of MDPI and/or the editor(s). MDPI and/or the editor(s) disclaim responsibility for any injury to people or property resulting from any ideas, methods, instructions or products referred to in the content. |
© 2023 by the authors. Licensee MDPI, Basel, Switzerland. This article is an open access article distributed under the terms and conditions of the Creative Commons Attribution (CC BY) license (https://creativecommons.org/licenses/by/4.0/).
Share and Cite
Ibrahim, N.; Elkholy, S.; Godat, A.; El-Kholy, A. Implementation of Modified Compression Field Theory to Simulate the Behavior of Fiber-Reinforced Polymer Shear-Strengthened Reinforced Concrete Beams under Monotonic Loading. Buildings 2023, 13, 898. https://doi.org/10.3390/buildings13040898
Ibrahim N, Elkholy S, Godat A, El-Kholy A. Implementation of Modified Compression Field Theory to Simulate the Behavior of Fiber-Reinforced Polymer Shear-Strengthened Reinforced Concrete Beams under Monotonic Loading. Buildings. 2023; 13(4):898. https://doi.org/10.3390/buildings13040898
Chicago/Turabian StyleIbrahim, Nagwa, Said Elkholy, Ahmed Godat, and Ahmed El-Kholy. 2023. "Implementation of Modified Compression Field Theory to Simulate the Behavior of Fiber-Reinforced Polymer Shear-Strengthened Reinforced Concrete Beams under Monotonic Loading" Buildings 13, no. 4: 898. https://doi.org/10.3390/buildings13040898