3.1. Optimization of MPFA Concrete
In this study, the BWM–Taguchi multi-objective optimization framework was applied to optimize the MPFA concrete. The details of each step taken are described sequentially in this section.
Step 1. Define optimization objectives and quality criteria (QC) to facilitate the multi-criteria decision-making process. Specify appropriate design factors and levels with overarching impacts on QC for the design of the experiment.
Nine QC were proposed to provide a quantitative evaluation of the durability and mechanical properties of MPFA concrete. The air content (X1) measures the volume of air present in fresh concrete mixtures. The first cluster of QCs includes water absorption (X2), water permeability (X3), chloride permeability (X4), and ultrasonic pulse velocity (X5), which provides quantitative evidence on the transport properties of concrete mixtures. The next cluster of QCs covers compressive strengths at 7 (X6) and 28 (X7) days, flexural (X8), and splitting tensile strengths (X9) at 28 days, which provides quantitative information on the mechanical properties of concrete mixtures. These QCs, when reviewed altogether, provide useful insights into the durability and mechanical performances of MPFA concrete. The target performance of each QC is tabulated in
Table 2.
Four design factors identified with critical influence over QC, namely, cement content (P), water to cement (w/c) ratio (Q), FA to total aggregate (TA) ratio (R), and MPFA content (S), each with three levels considered in the study are shown in
Table 3.
Step 2. Identify one best (highest priority) and one worst (lowest priority) criterion based on experts’ preferences. Carry out a pairwise comparison between the best criterion against other criteria and other criteria against the worst criterion by assigning a number between 1 to 9 to obtain the best-to-others (BO) and others-to-worst (OW) vectors, respectively.
A questionnaire was curated and conducted through guided video calls or email communications with industry experts having 5 to 25 years of experience in the built environment sector, i.e., academia, accredited testing laboratories, and ready-mix suppliers. The responses gathered from the questionnaire indicated X7 compressive strength at 28 days and X5 UPV at 28 days as the best (top priority) and worst (least priority) criterion, respectively. The BO and OW pairwise comparisons over the nine QC are shown in
Table 4.
Step 3. Compute optimal weights of QC using the BWM linear model with respect to BO and OW vectors determined in Step 2.
Using the BO and OW vectors in
Table 4, the optimal weights of QC are shown in listed in
Table 5. It is evident that the QC with higher priority yielded a greater weightage over QC with lower priority and vice-versa.
Step 4. Select Taguchi orthogonal array (OA) for the design of the experiment based on the number of design factors and levels proposed in the study.
An L9 Taguchi OA was selected based on four three-level (3
4) design factors proposed in this study. The corresponding mix specifications of MPFA concrete for each experimental run are summarized in
Table 6.
Step 5. Collect experimental responses by conducting experimental runs based on selected OA. For each QC, repeat Step 2 to compute the optimal weights for an individual experimental response using the BWM linear model. The selection of best and worst criteria should be based on the target performance of individual QC.
Table 7 shows the experimental responses of MPFA concrete obtained from each experimental run. Analogous to Step 2, the best and worst experimental responses for individual QC were identified with respect to the corresponding target performance described in
Table 2. Then, the BO and OW vectors’ individual QC can be constructed accordingly, as shown in
Table 8. Finally, the optimal weights of each experimental run with respect to individual QC were computed using the BWM linear model listed in
Table 9.
For example, the target performance for X1 air content is the smaller, the better; thus, experimental runs with the lowest and highest air content values were considered the best (MP8) and worst (MP3), respectively. The air content value of MP8 was compared against all other experimental runs in pairs, and the air content values of all other experimental runs were compared with the air content of MP3 to determine the BO and OW vectors, respectively. Subsequently, the optimal weight of each experimental run was then computed with both BO and OW vectors using the BWM linear model. This process is then repeated for all QC.
Step 6. Compute the total weight (overall quality) of each experimental run as a composite of vectors between optimal weights of QC ( and optimal weights of individual experimental response with respect to each QC .
The total weight is derived by multiplying the optimal weights of QC obtained in
Table 5 and the optimal weights of individual experimental responses with respect to each QC listed in
Table 9 (
. The resultant composite vector also represents the overall quality of each experimental run factored in the experts’ preference over the nine QC. The total weight of each experimental run is listed in
Table 10.
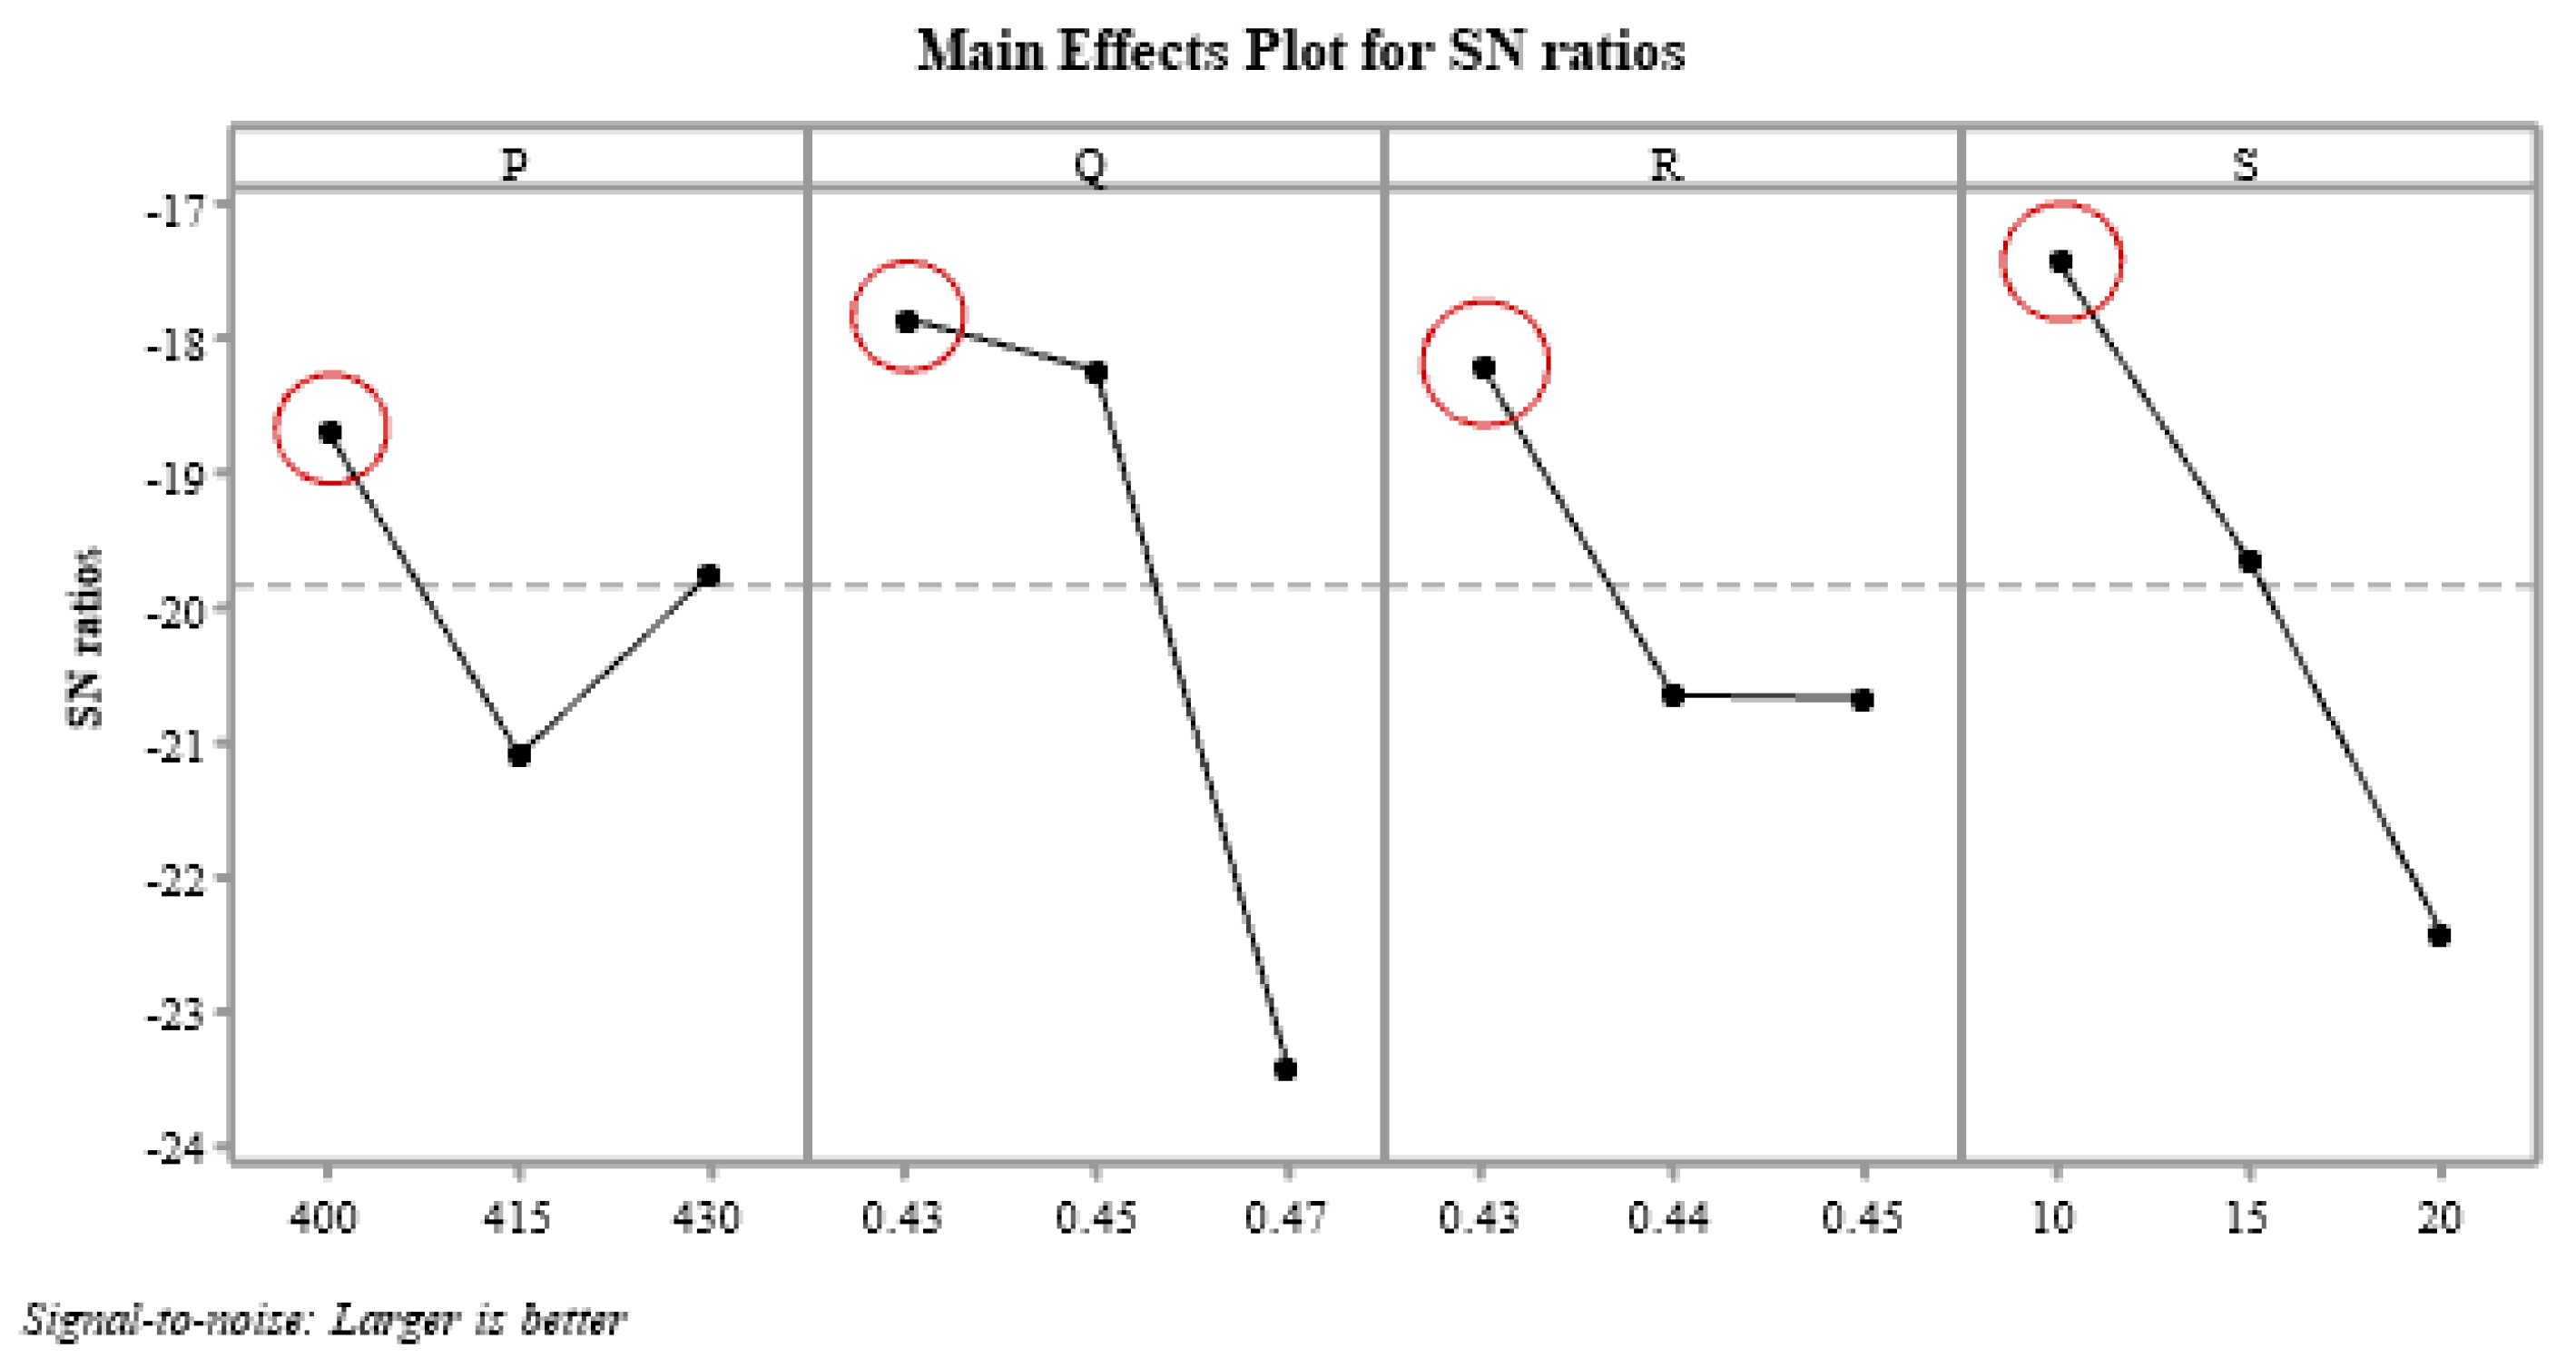
Step 7. Calculate the SN ratio and determine the optimal level of design factors that correspond with the highest SN ratio obtained.
The larger, the better Taguchi loss function was applied to the total weight derived for each experimental run to compute the SN ratios tabulated in
Table 11. A main effect plot used to examine the effects of different levels of design factors categorically was generated using the MINITAB software. The combination of levels for every design factor with the highest SN ratio was deemed to be the optimal level. From
Figure 5, it was deduced that the optimal level to produce MPFA concrete with the best quality to be
P1Q1R1S1, which translates to 400 kg/m
3 cement content (P), 0.43 W/C ratio (Q), 0.43 FA/TA ratio (R) and 10 vol% MPFA content (S). The optimal level with the highest SN ratio corresponds to the mix specification of the experimental run MP1; hence no confirmation test was required.
3.2. Performance Benchmark of Material Tailoring Strategies
Three additional experimental runs were prepared to validate the effects of the above materials tailoring strategies on the durability and mechanical properties of cement concretes. They include:
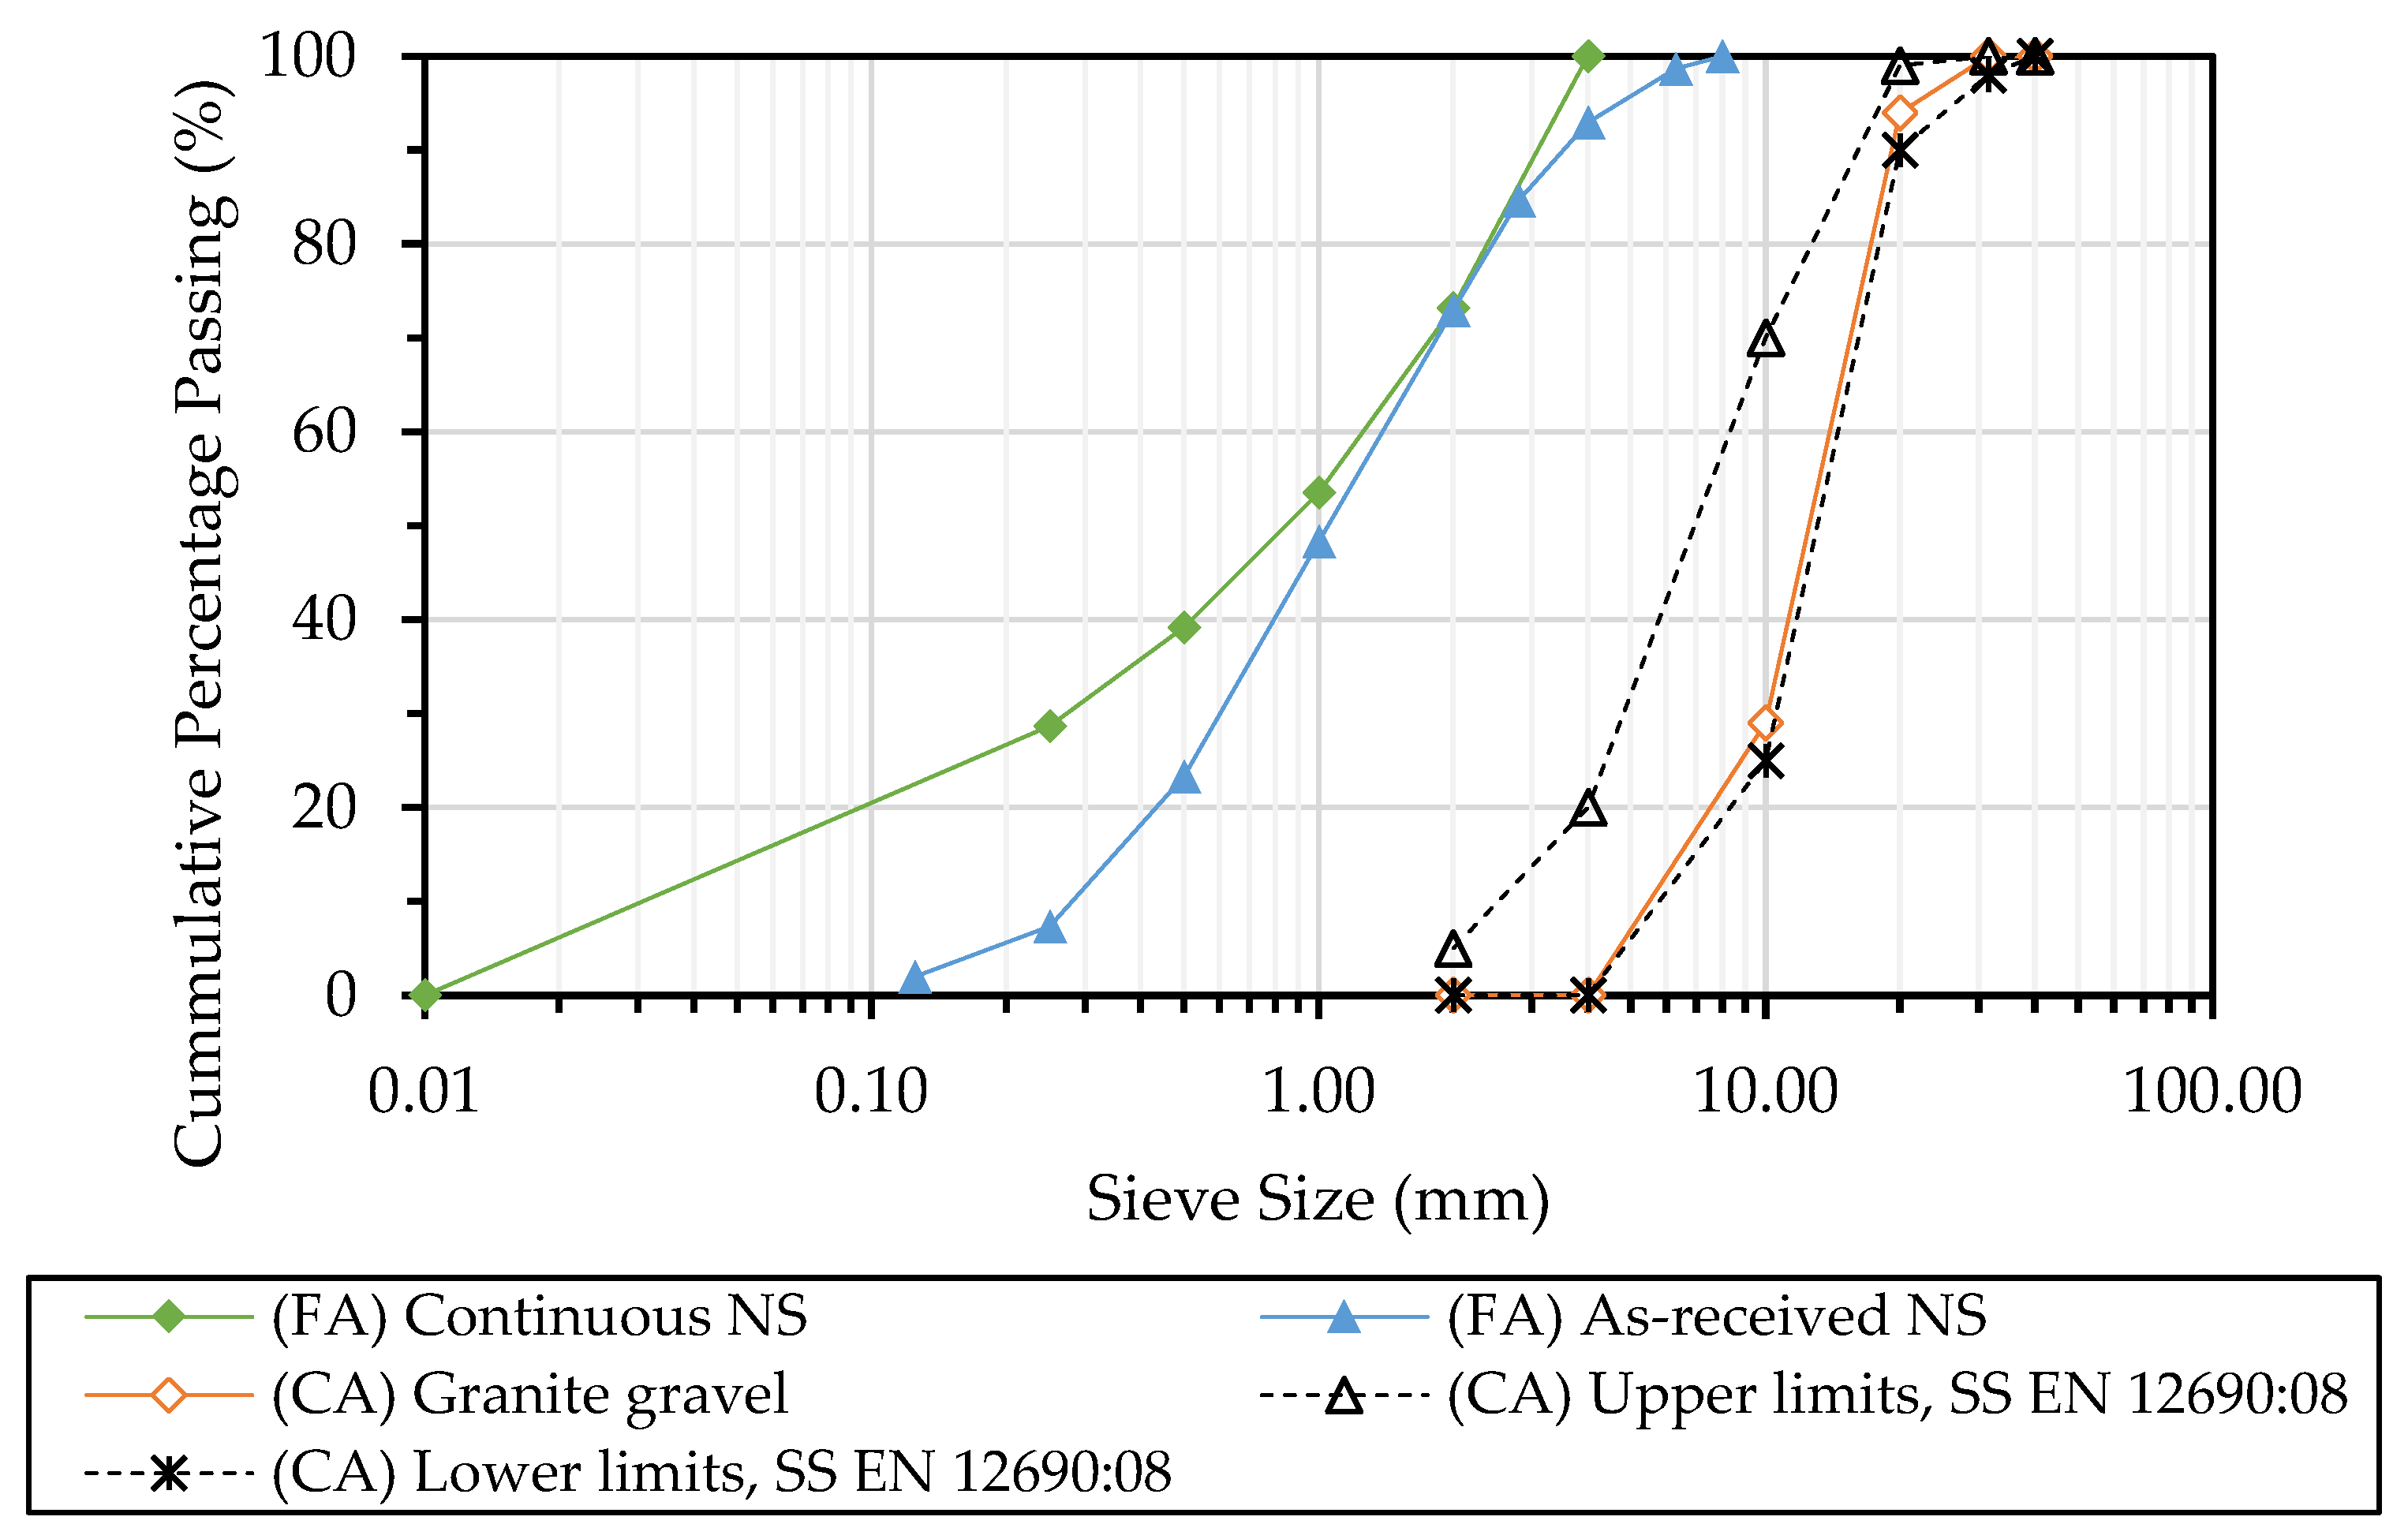
Reference cement concrete with continuous graded NS only and 0% MPFA (Ref)
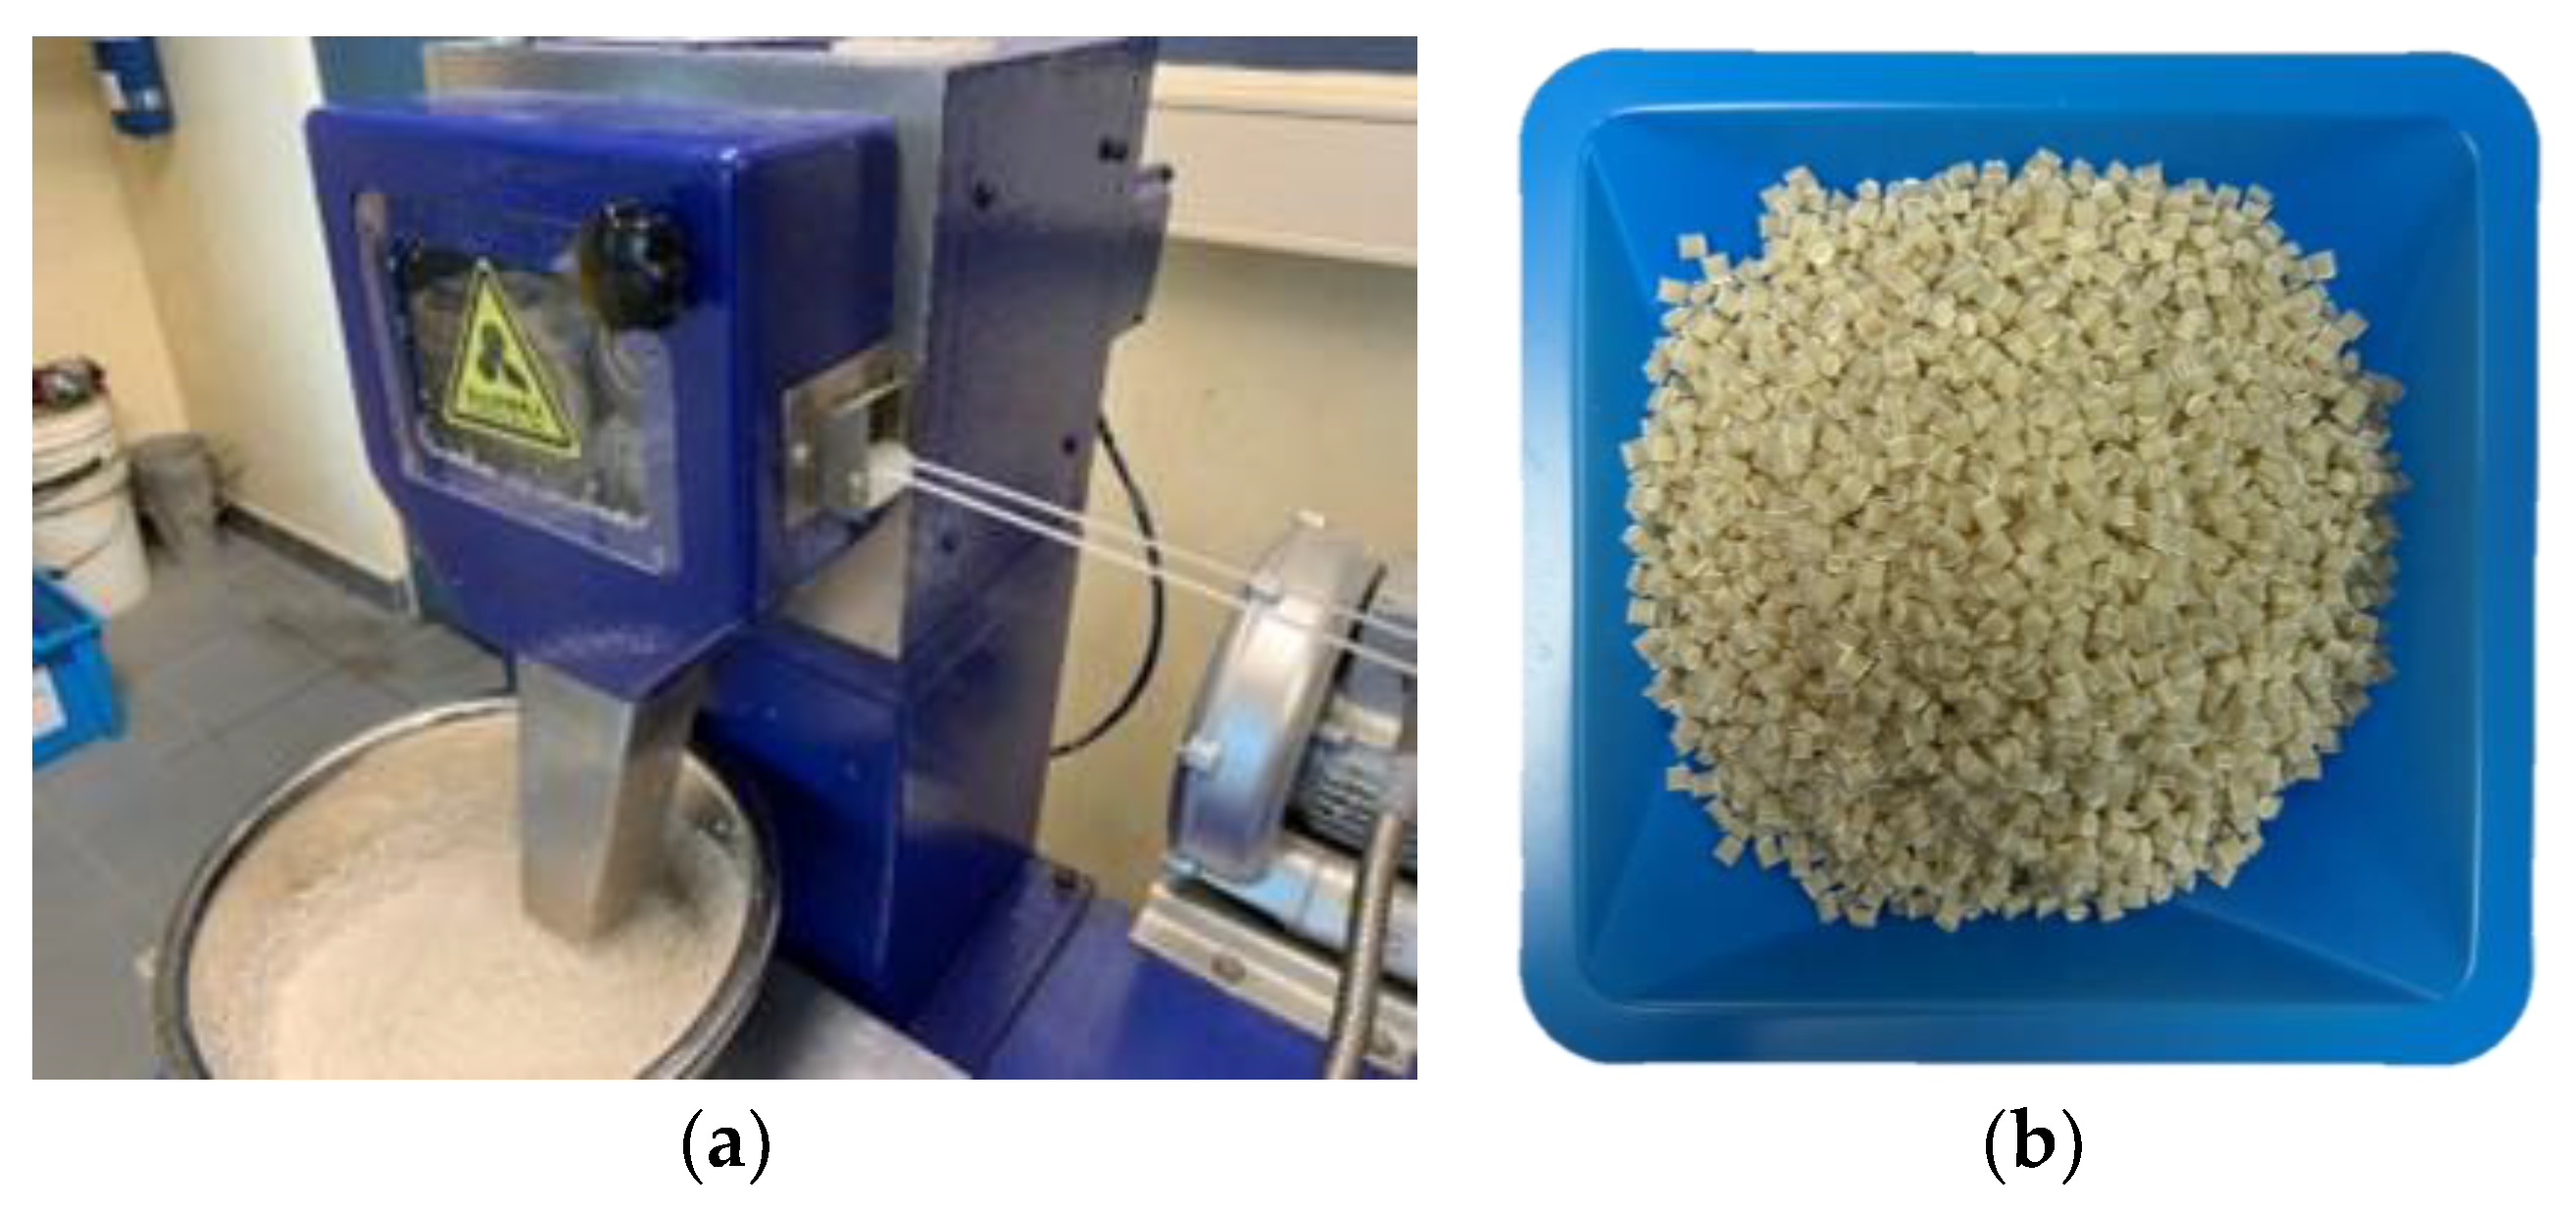
MP1 cement concrete containing mixed plastic waste in loose form with an identical concoction instead of pelletized MPFA (MP1-LMP)
MP1 cement concrete made with MPFA NS fine aggregate system with as-received NS instead of continuous graded NS (MP1-arNS).
The results of additional experimental runs were benchmarked against MP1 in
Table 12. The test result of MPFA concrete MP1 compared against the reference concrete Ref revealed significant improvement in air content (44.1%), splitting tensile strength (14.4%), resistance to water penetration (18.6%) and chloride permeability (5.80%), with only slight decrease in UPV (1.80%), flexural strength at 28-day (5.55%) and compressive strength at 7-day (3.44%) and 28-day (6.91%).
Next, incorporating MPFA of standardized form in cement concrete resulted in superior durability and mechanical performances across the board as compared with using mixed plastic waste in loose form, as observed in the test results for cement concretes MP1 and MP1-LMP. Finally, the performance comparison between cement concretes MP1 and MP1-arNS saw improvements in air content, compressive, and splitting tensile strength with all other QC to be relatively comparable. Overall, the proper design of the MPFA NS fine aggregate system has proven to be beneficial and effective in designing quality MPFA concrete without the need for chemical-based surface modification treatments of recycled plastics, bridging the gap for large-scale MPFA concrete production in traditional batching plants.
A leaching compliance test was conducted to characterize the potential release of heavy metal substances from reference concrete Ref and MPFA concrete MP1. The solid concrete samples were pulverized and prepared in accordance with BS EN 12457-1:2002 [
47] and tested based on APHA 3120 [
48] and APHA 3125 [
49] using an inductively coupled plasma mass spectrometry machine.
The leaching compliance test results of the concrete samples are tabulated in
Table 13. The concentration of leachate parameters is expressed in terms of milligram equivalent mass of parameter per kilogram of solid sample. The limit of reporting (LOR) for the individual parameter are provided, and the values obtained below the LOR will be marked <LOR value accordingly. The heavy metal contents for both samples are low and relatively comparable, with the MPFA concrete MP1 recording lower Pb and Hg content present in the leachate solution in comparison with reference concrete Ref.


