
Bond Performance of Anti-Corrosion Bar Embedded in Ceramsite Concrete in Freeze–Thaw Cycles and Corrosive Environments
Abstract
:1. Introduction
2. Materials and Methods
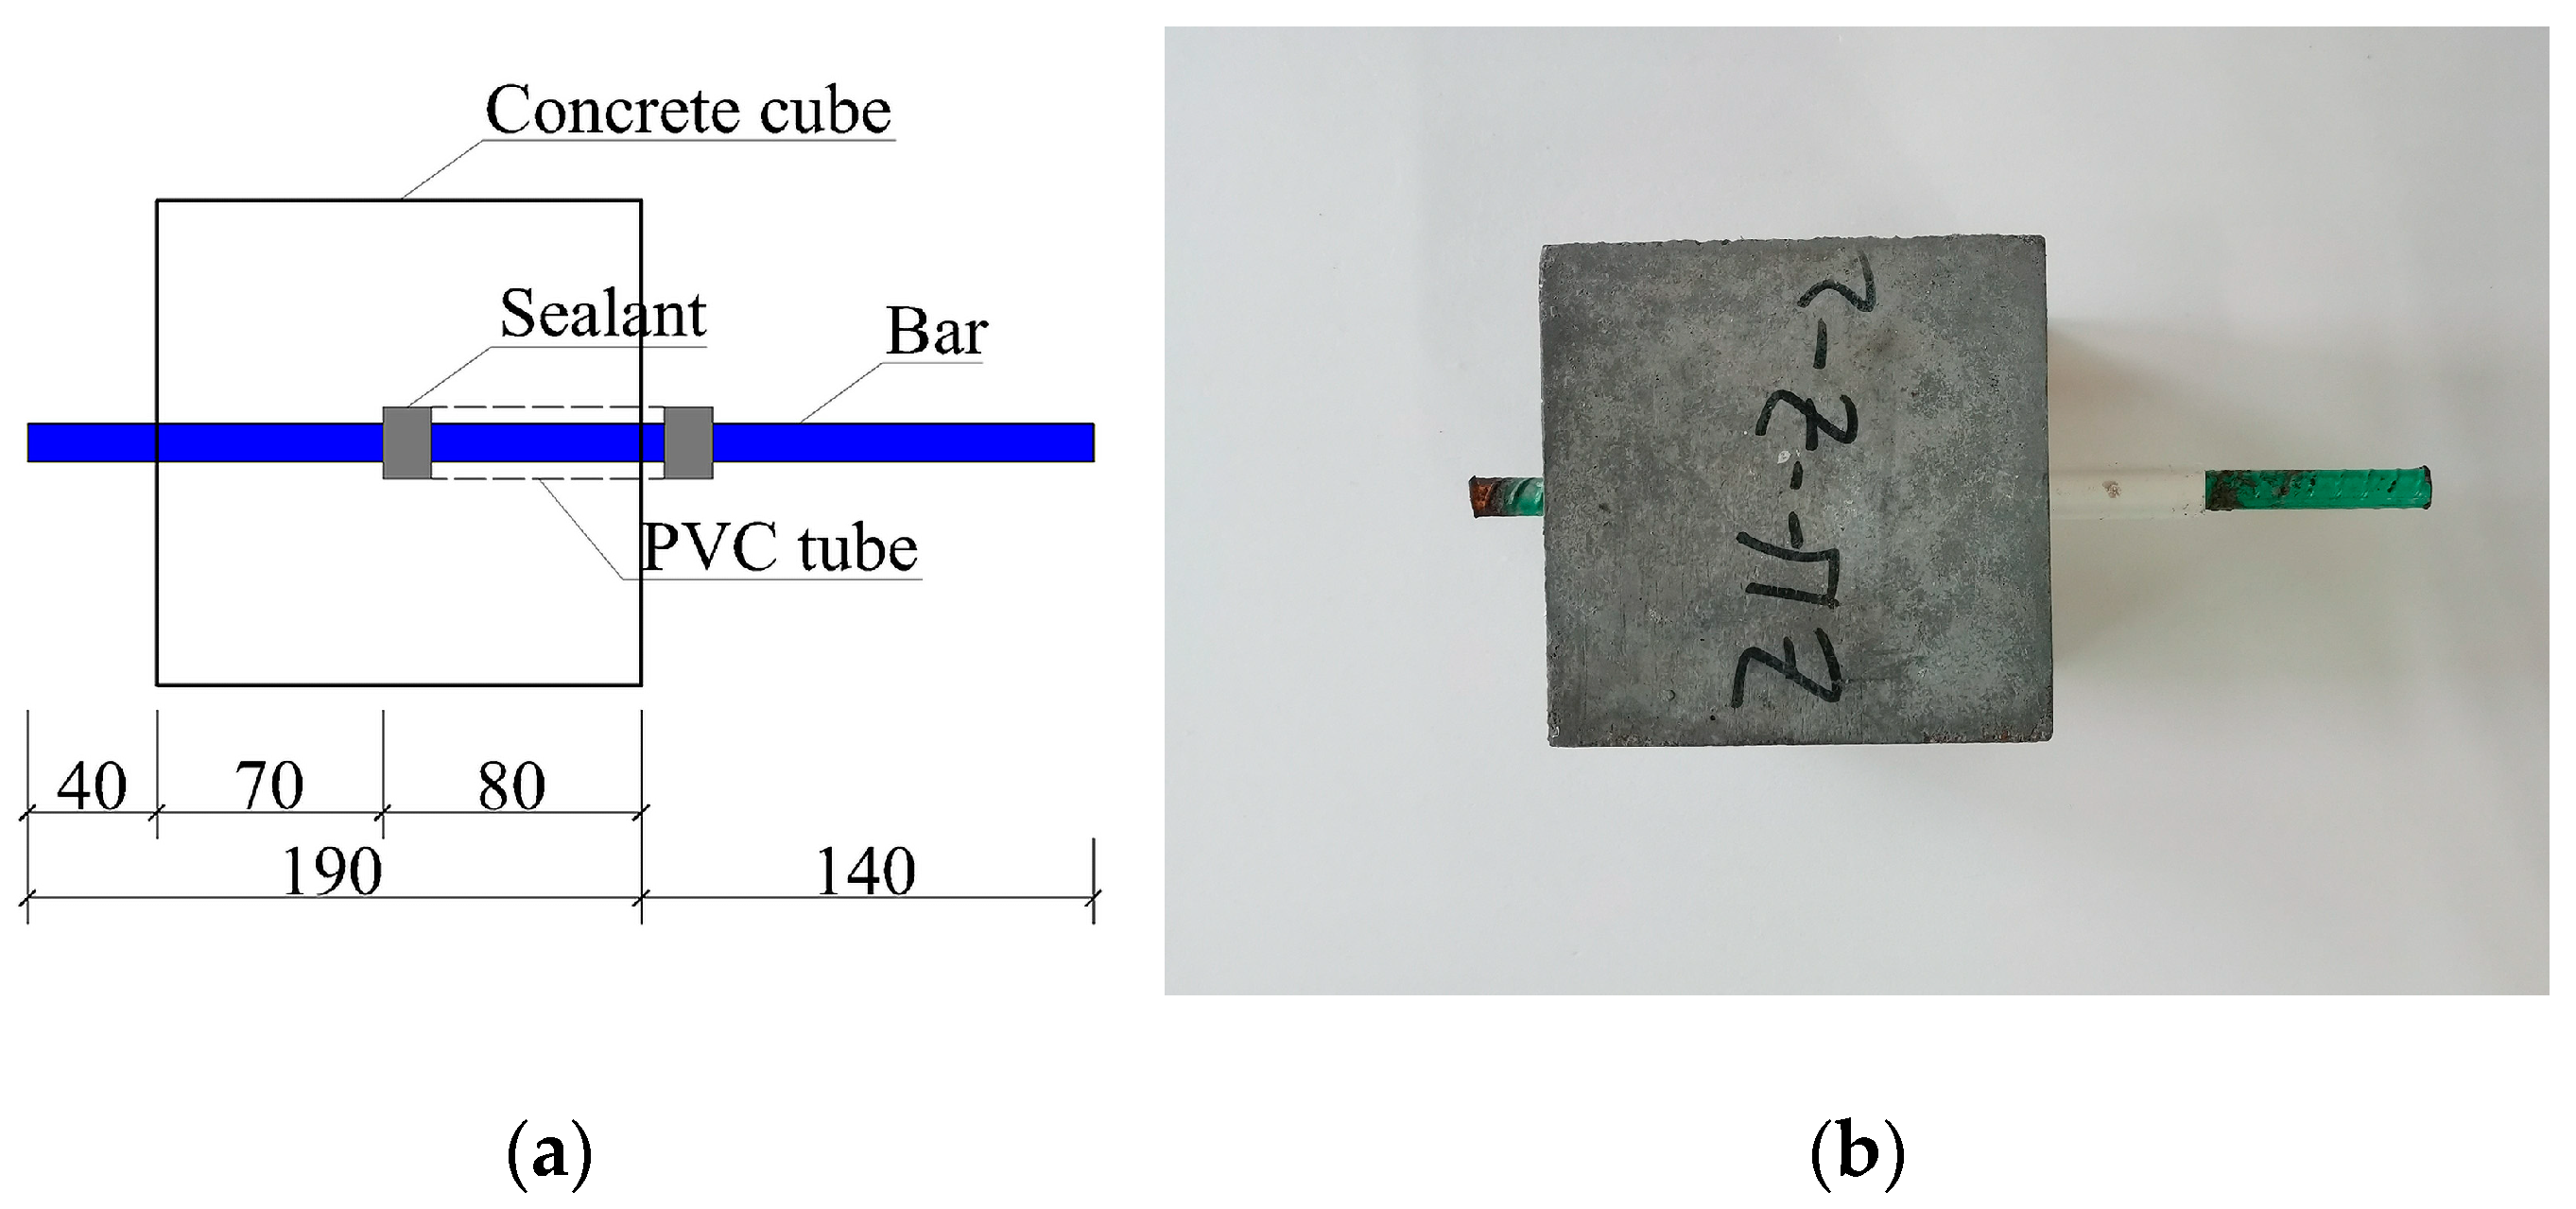
2.1. Specimen Size and Structure
2.2. Raw Materials
2.2.1. Concrete
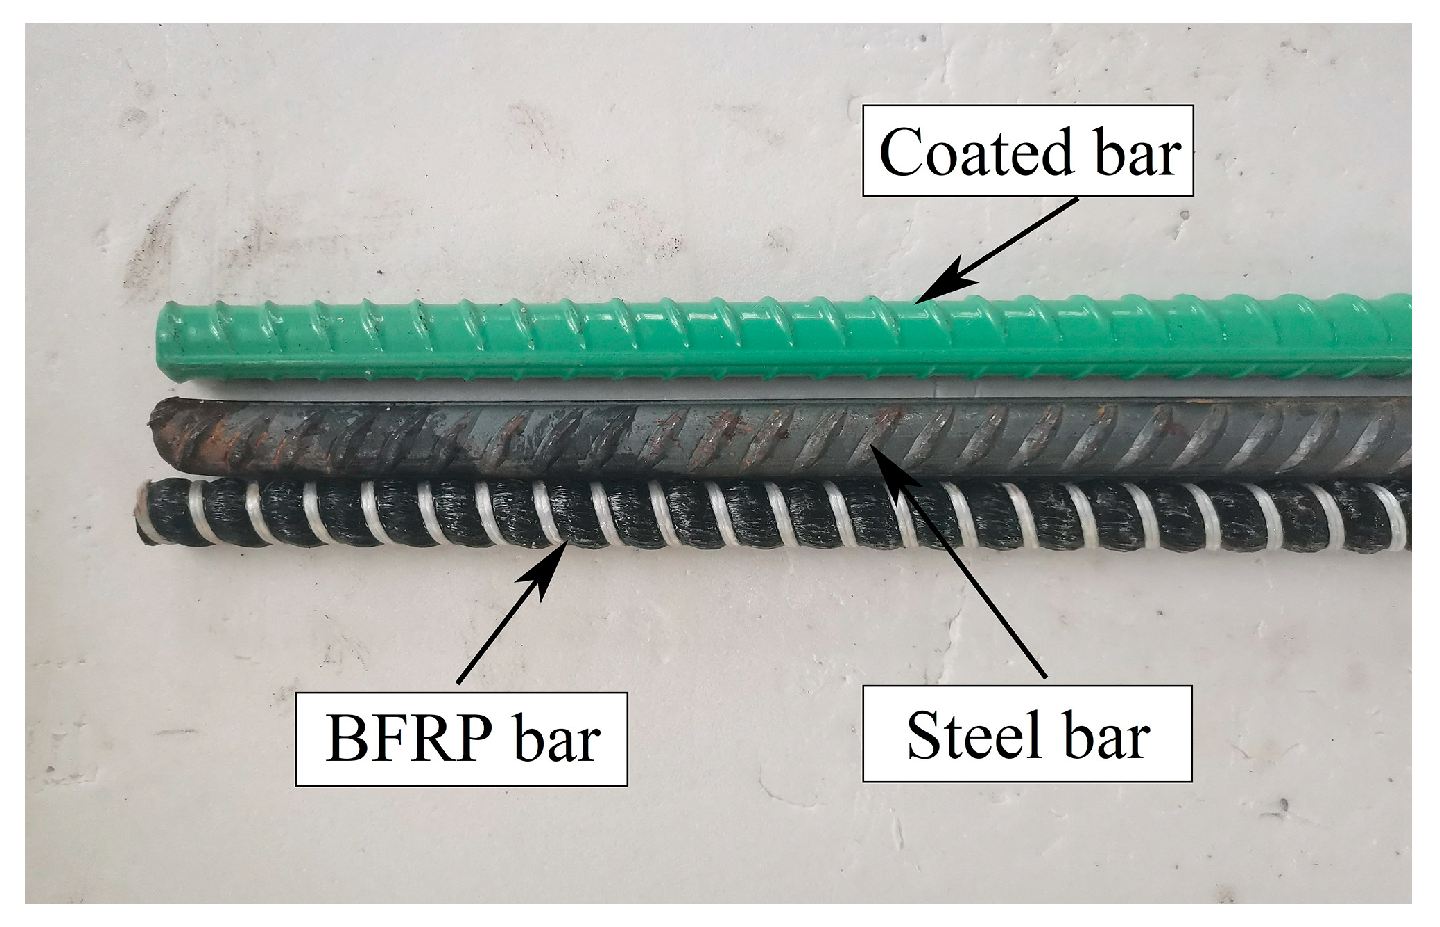
2.2.2. Bars
2.3. Experimental Scheme
2.3.1. Bond Specimens and Concrete Test Cube
2.3.2. FT Cycles
2.3.3. Three Different Corrosive Solutions
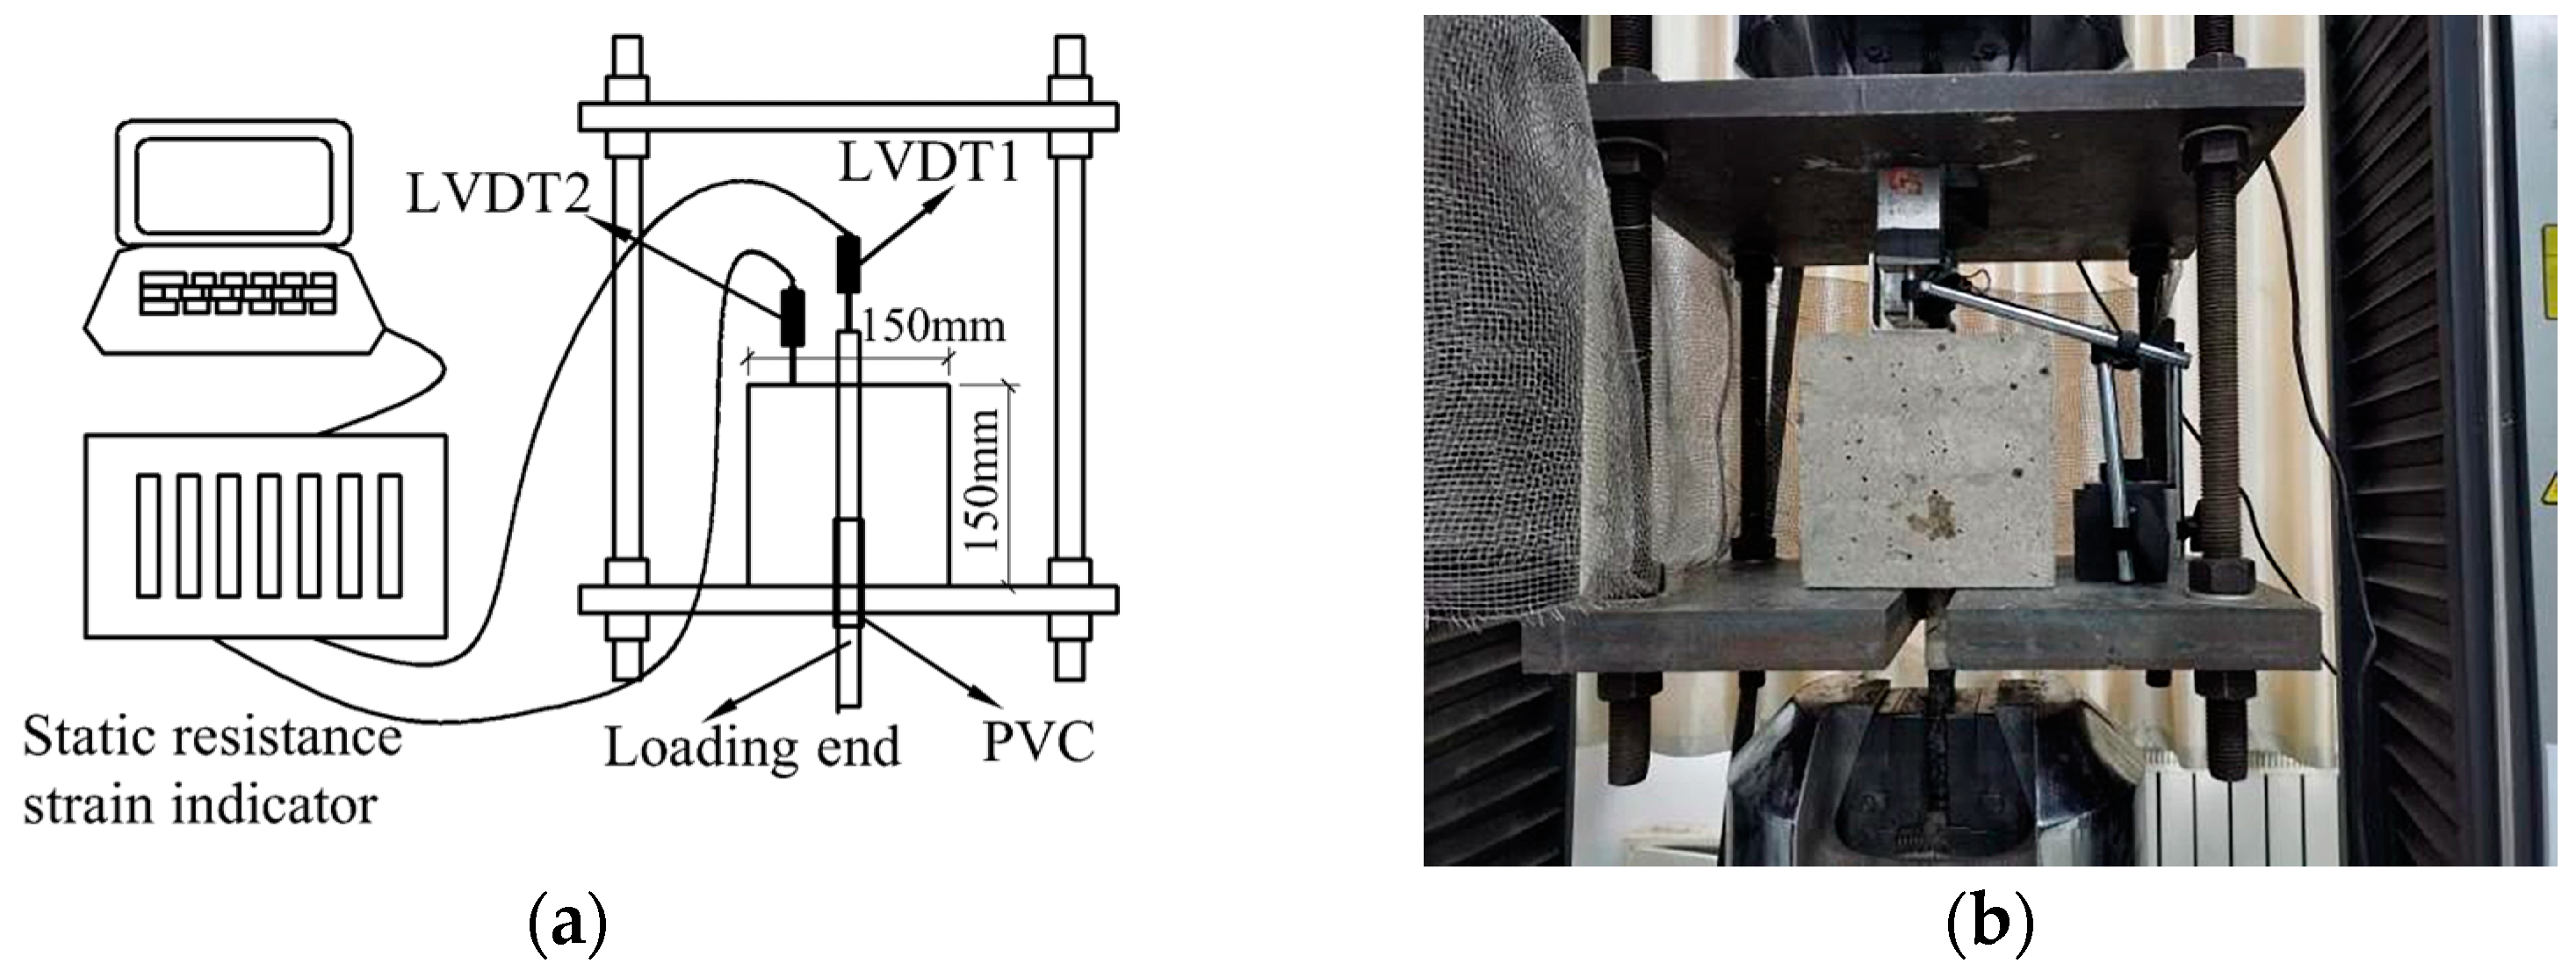
2.4. Pullout Test Scheme
3. Test Results and Discussion
3.1. The Bond Stress
3.2. Concrete Compressive Strength
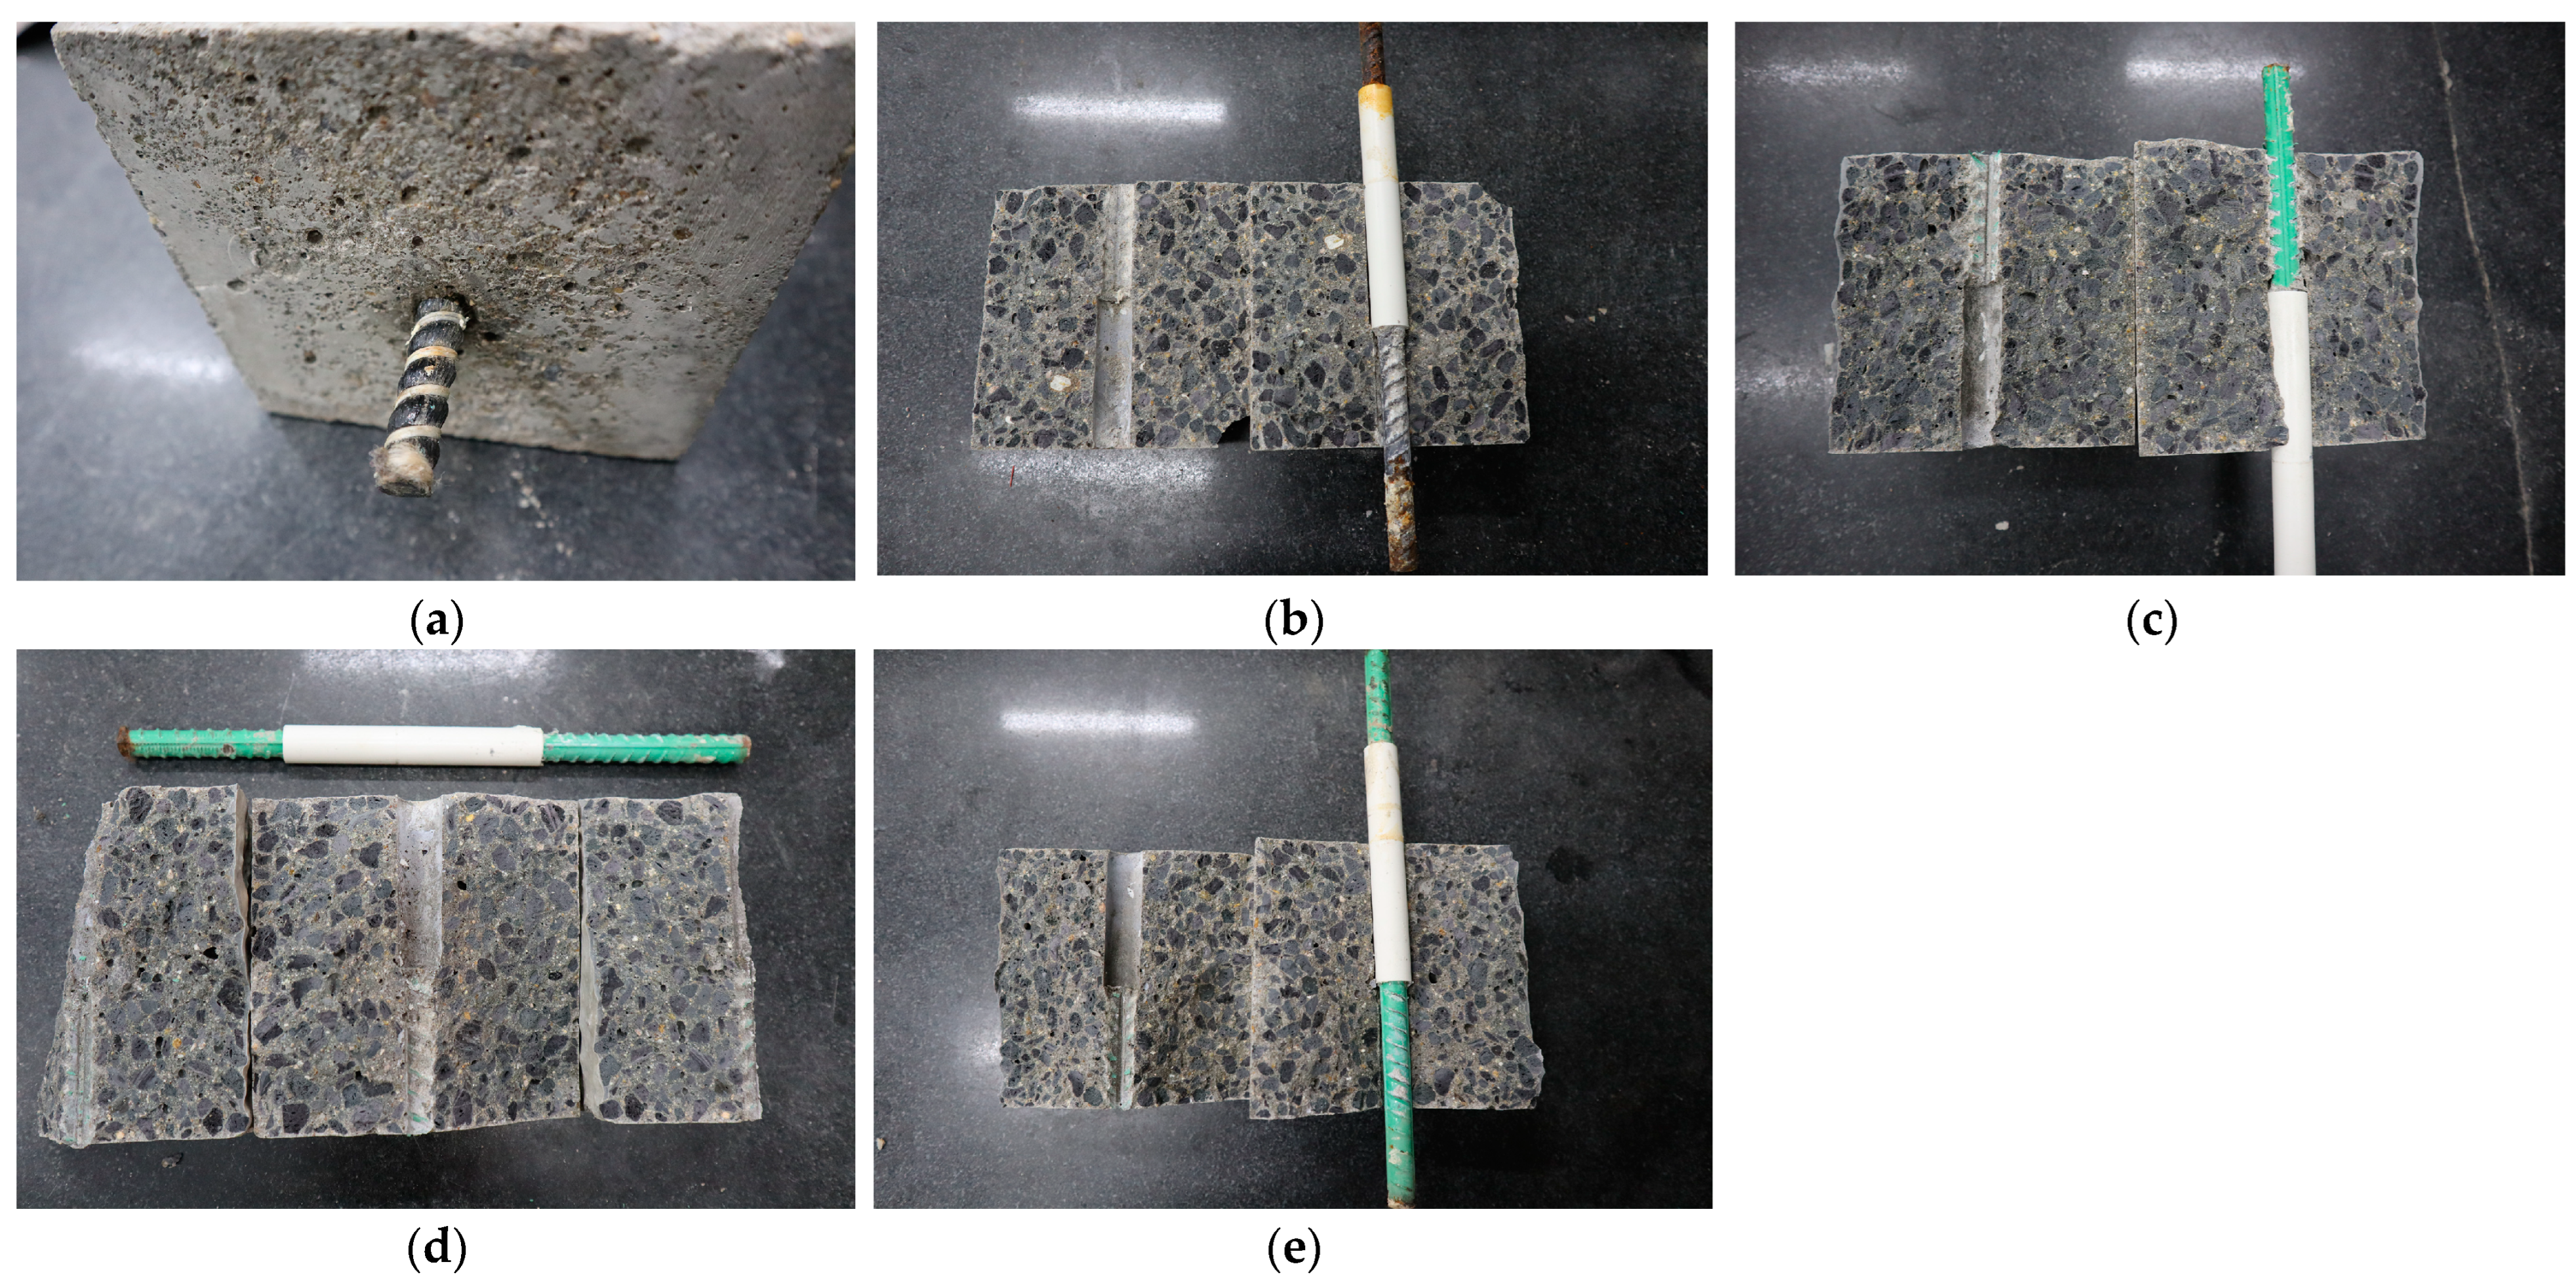
3.3. Failure Mode
3.3.1. Specimens in Corrosive Environments
3.3.2. Specimens in FT Cycles and Corrosive Environments
3.4. Weight Loss
3.5. Bond Stress–Slip Curves
3.6. Analysis of Influence Factors of Bond Strength
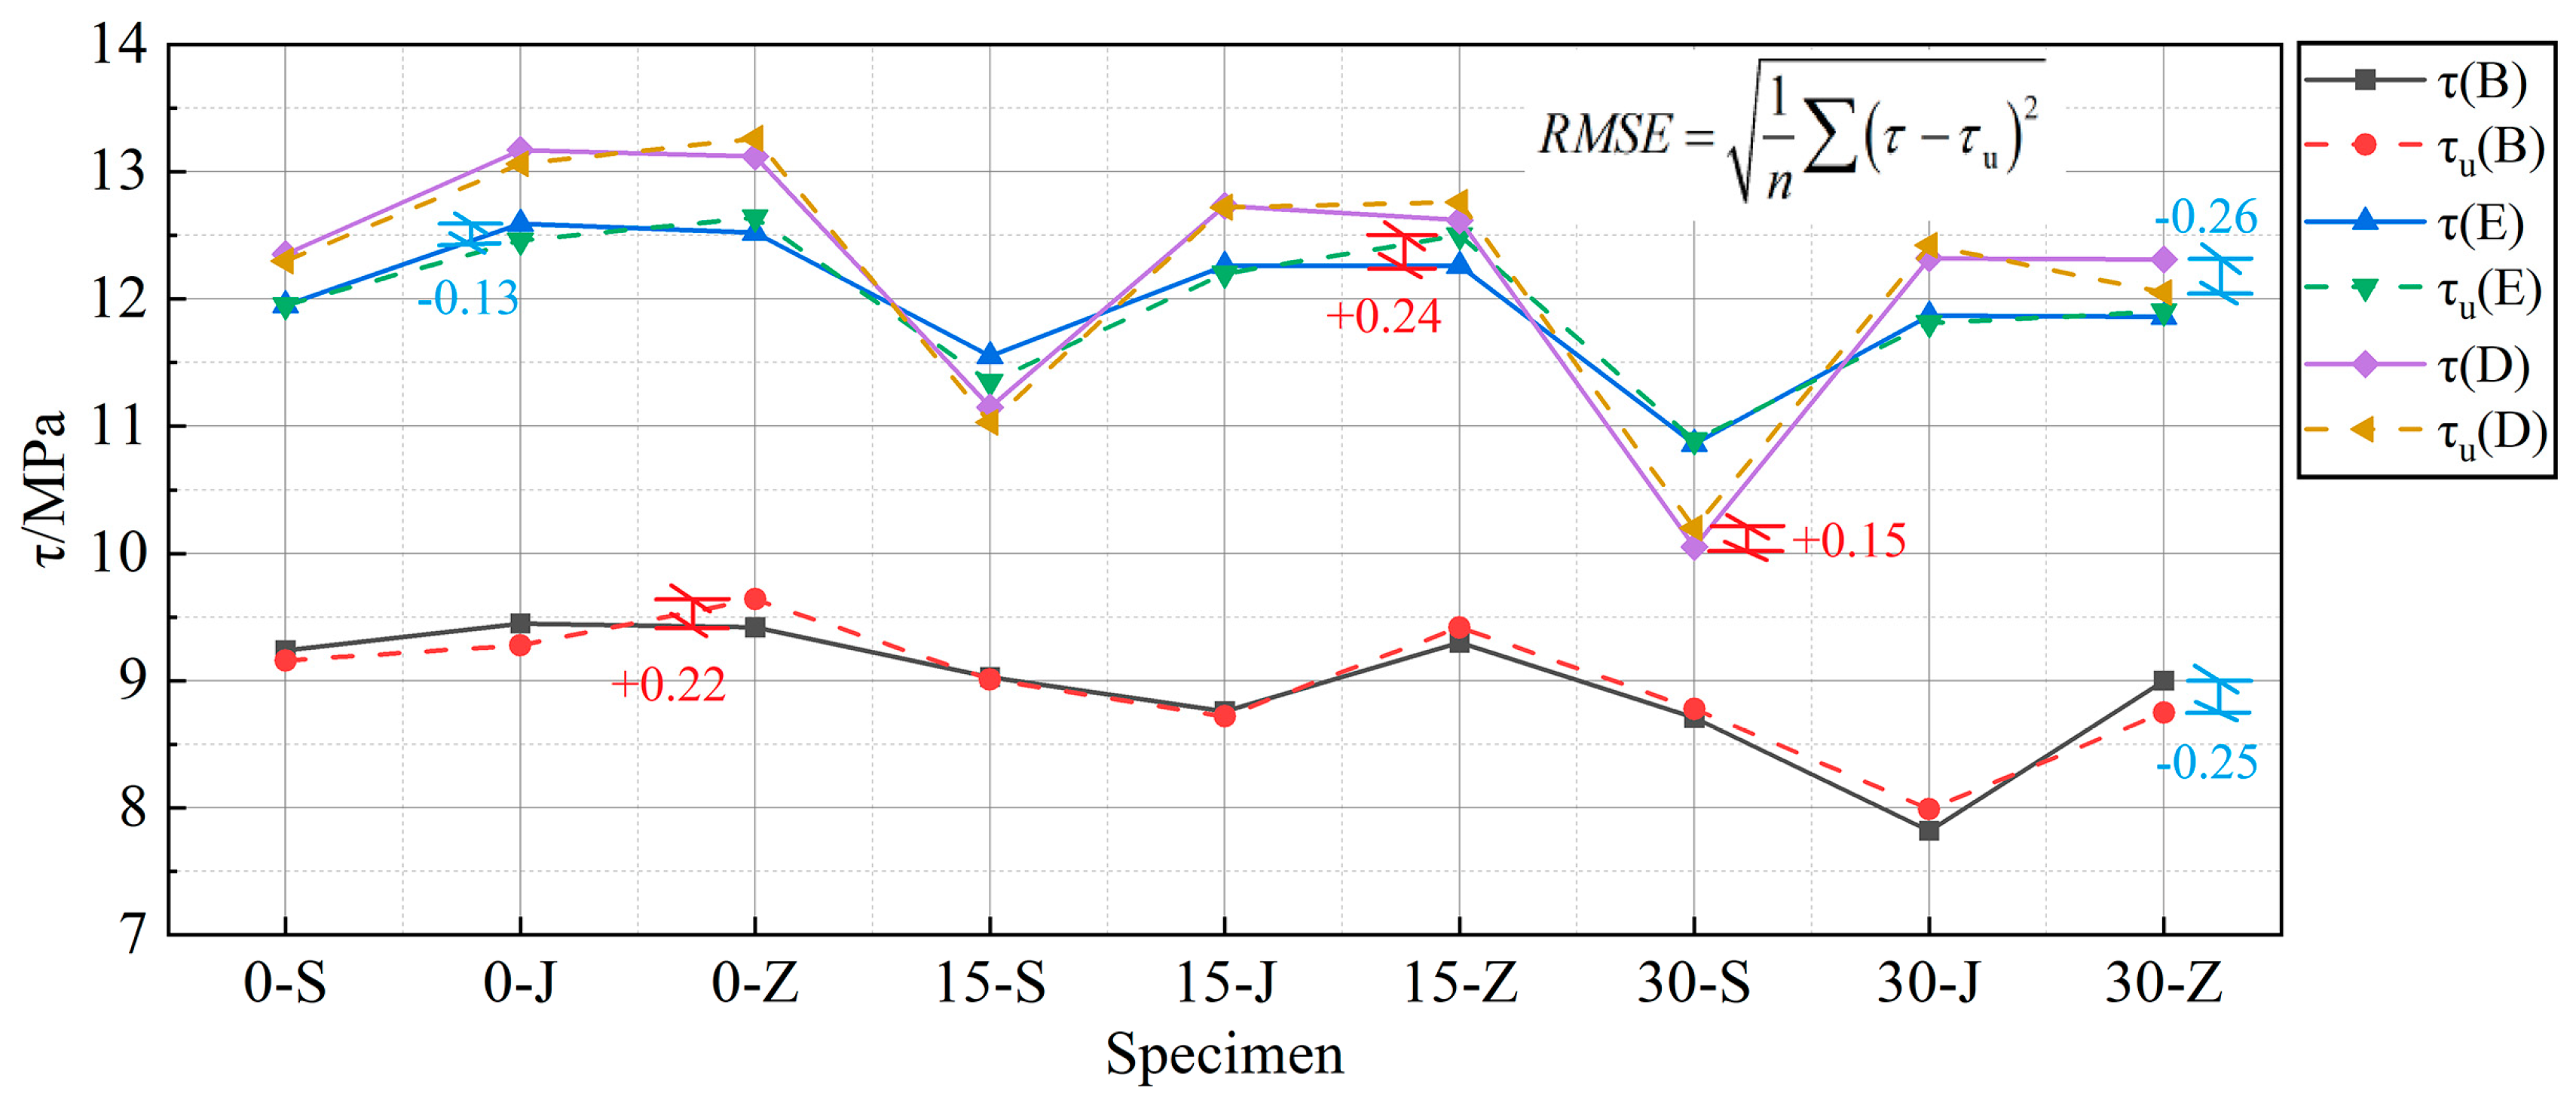
4. Calibration of Bonding Models to FT Cycles and Corrosive Environments
5. Conclusions
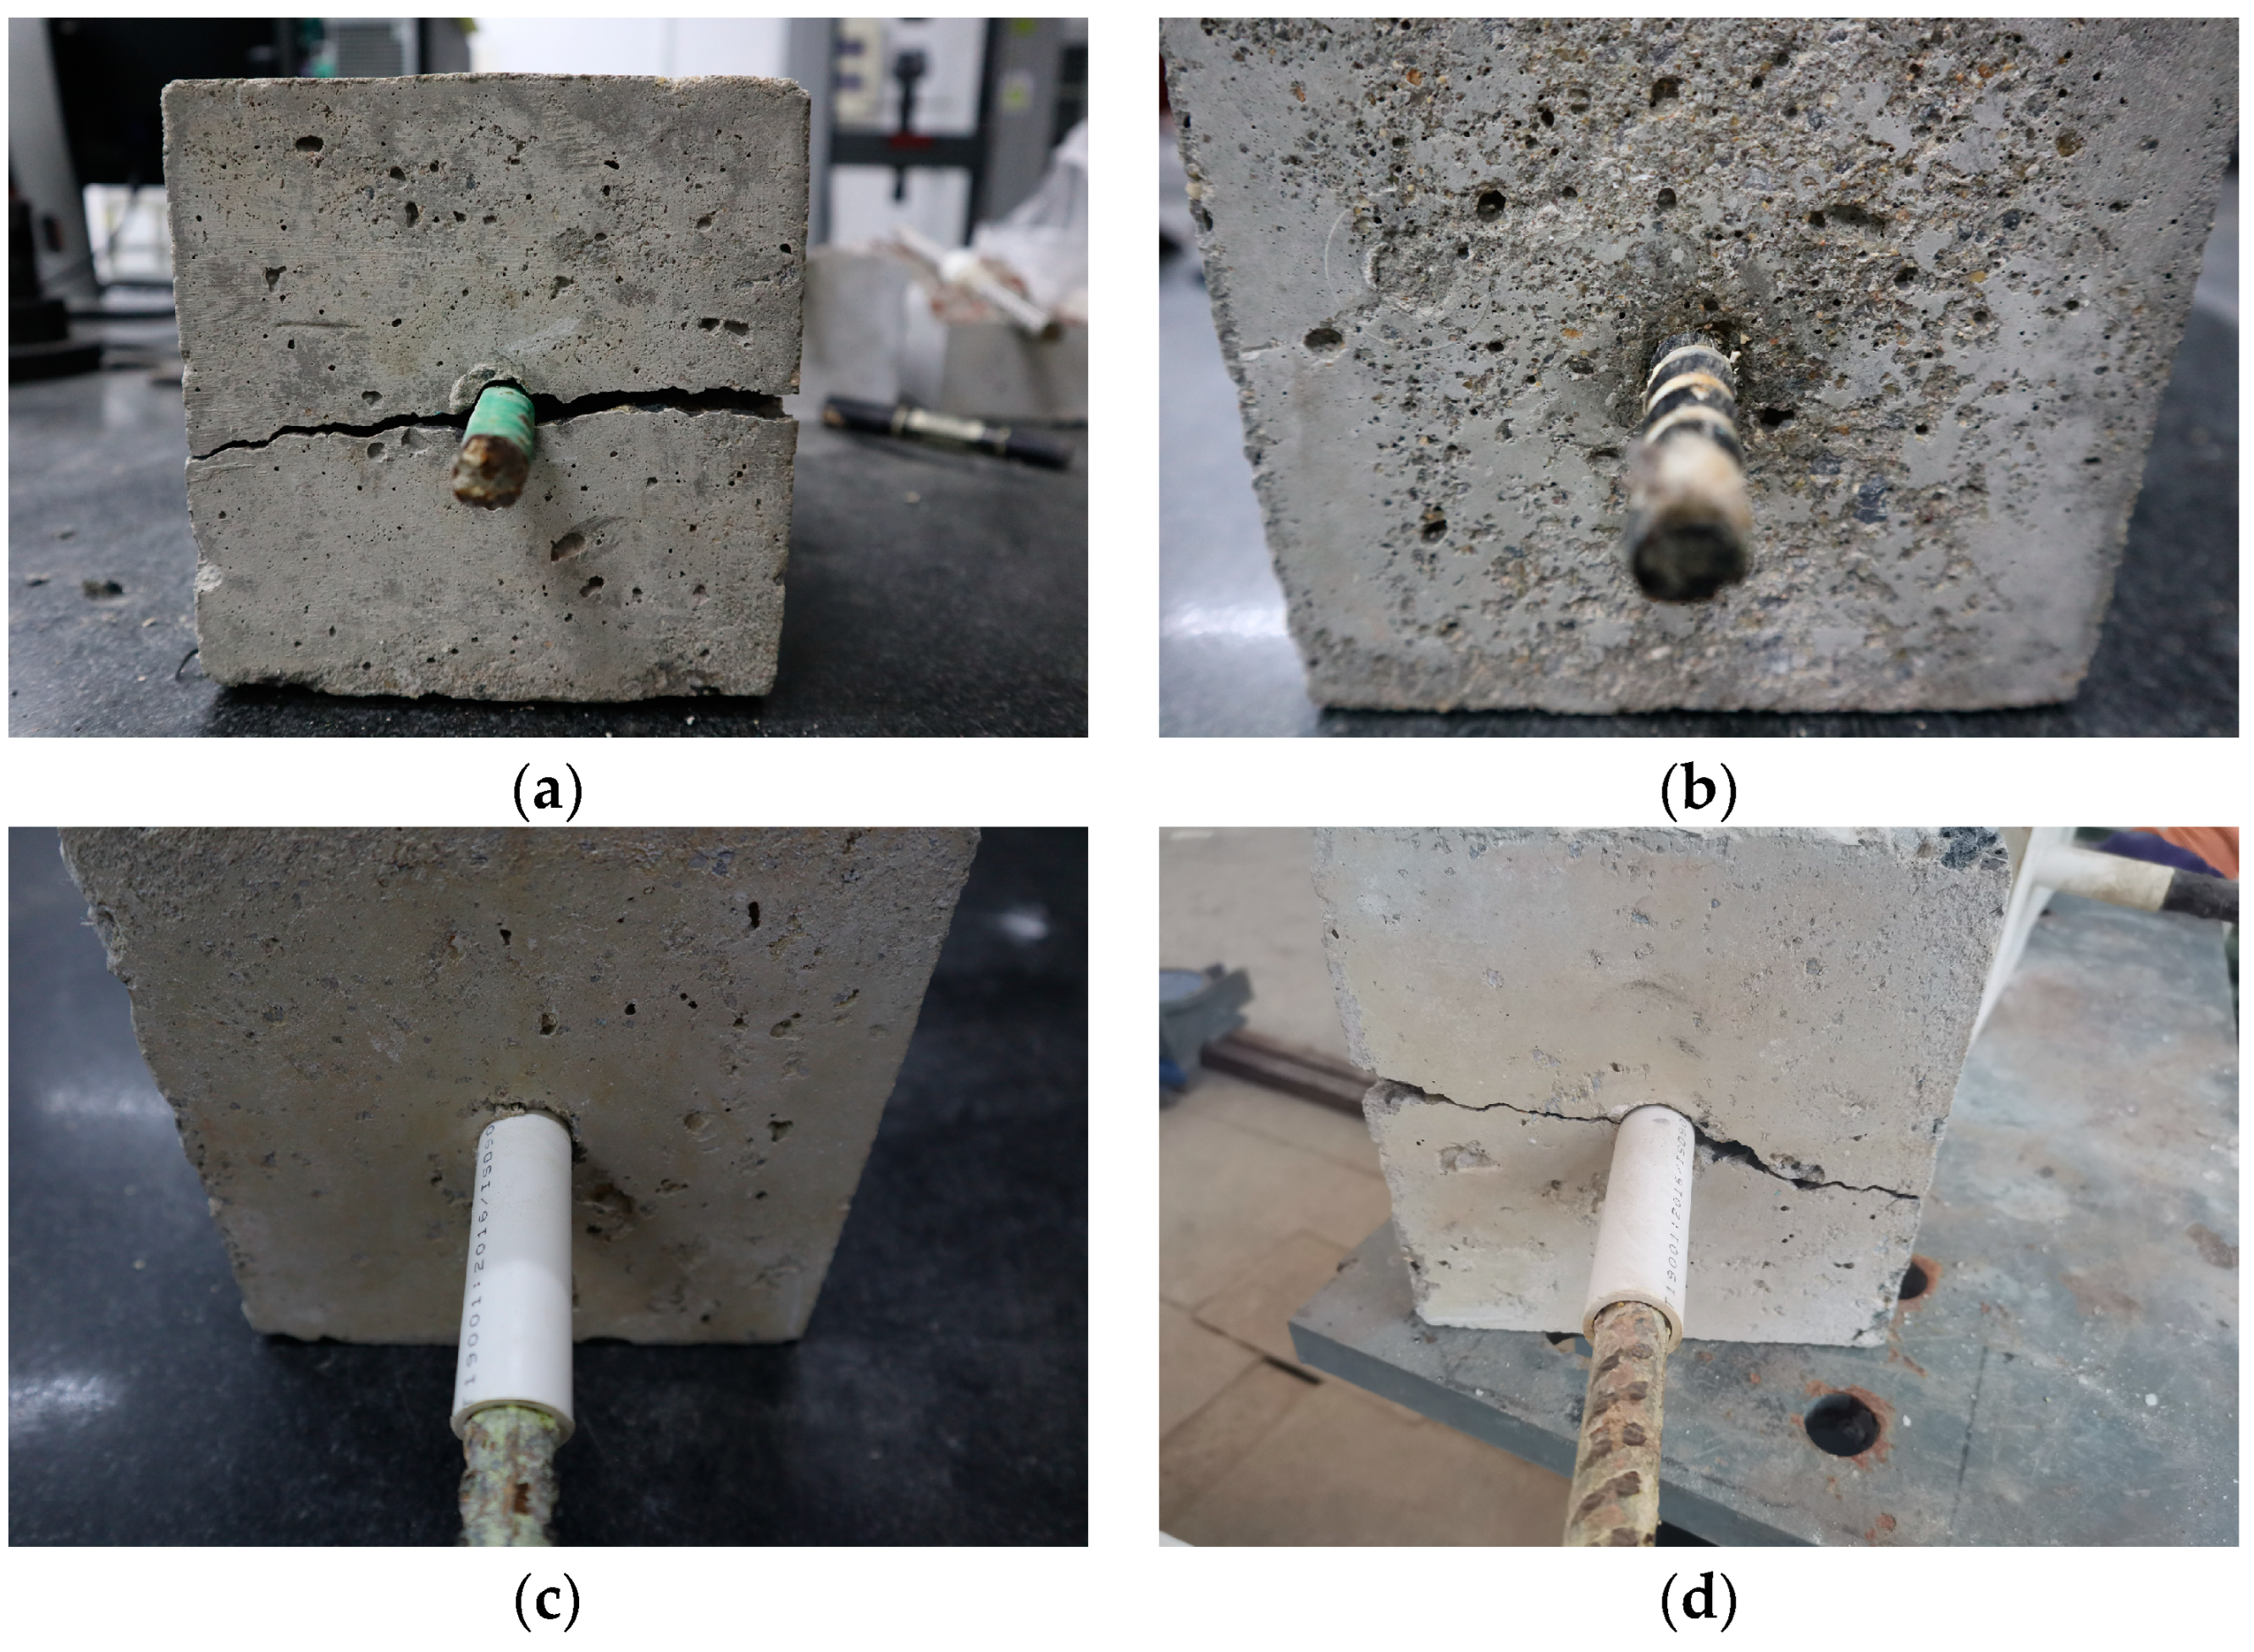
- In three corrosive environments, the failure mode of BFRP-bar-CC specimens and OSB-CC specimens was a pullout failure, while the failure mode of ECR-CC specimens was a split failure. When FT and corrosion acted together, the failure mode of BFRP-bar-CC specimens and ECR-CC specimens did not change, while the failure mode of OSB-CC specimens changed from a pullout failure to a splitting failure as the number of FT cycles increased from 15 to 30;
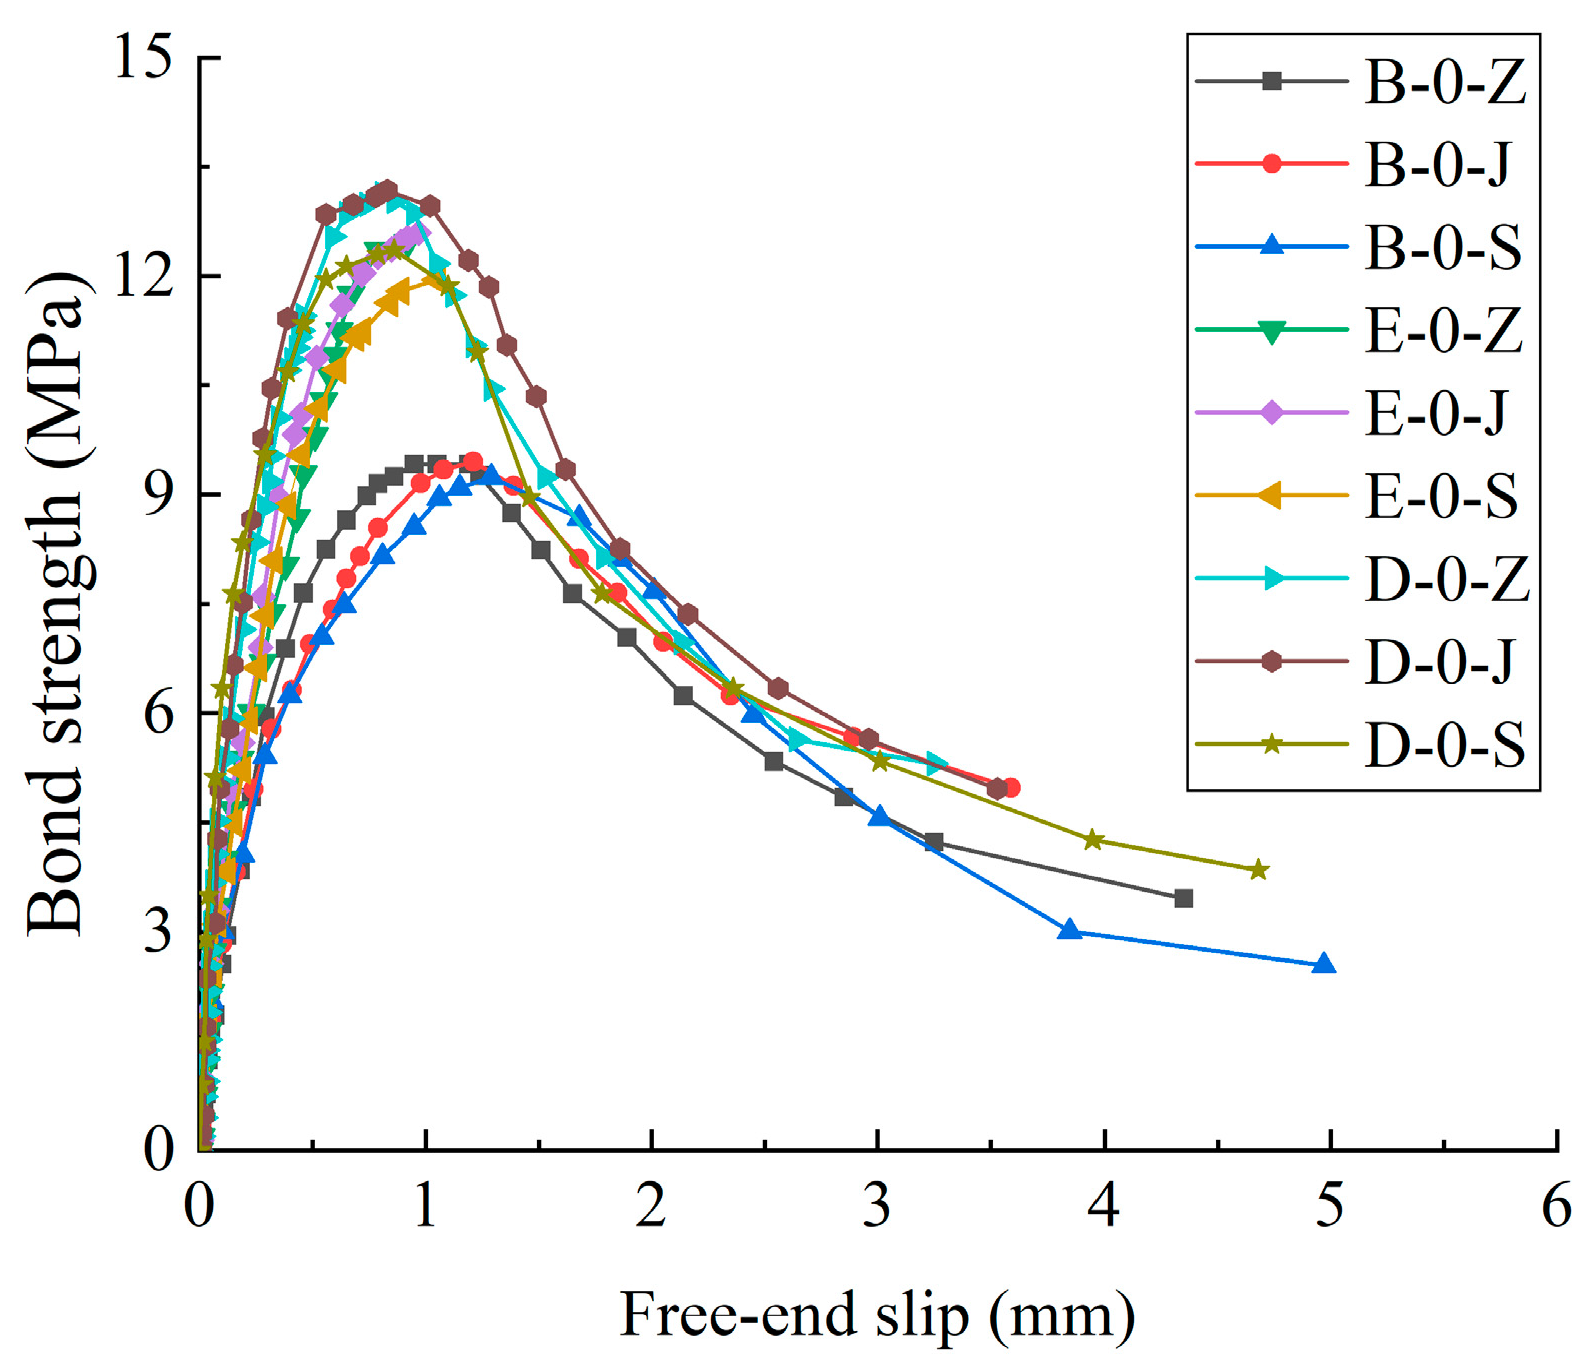
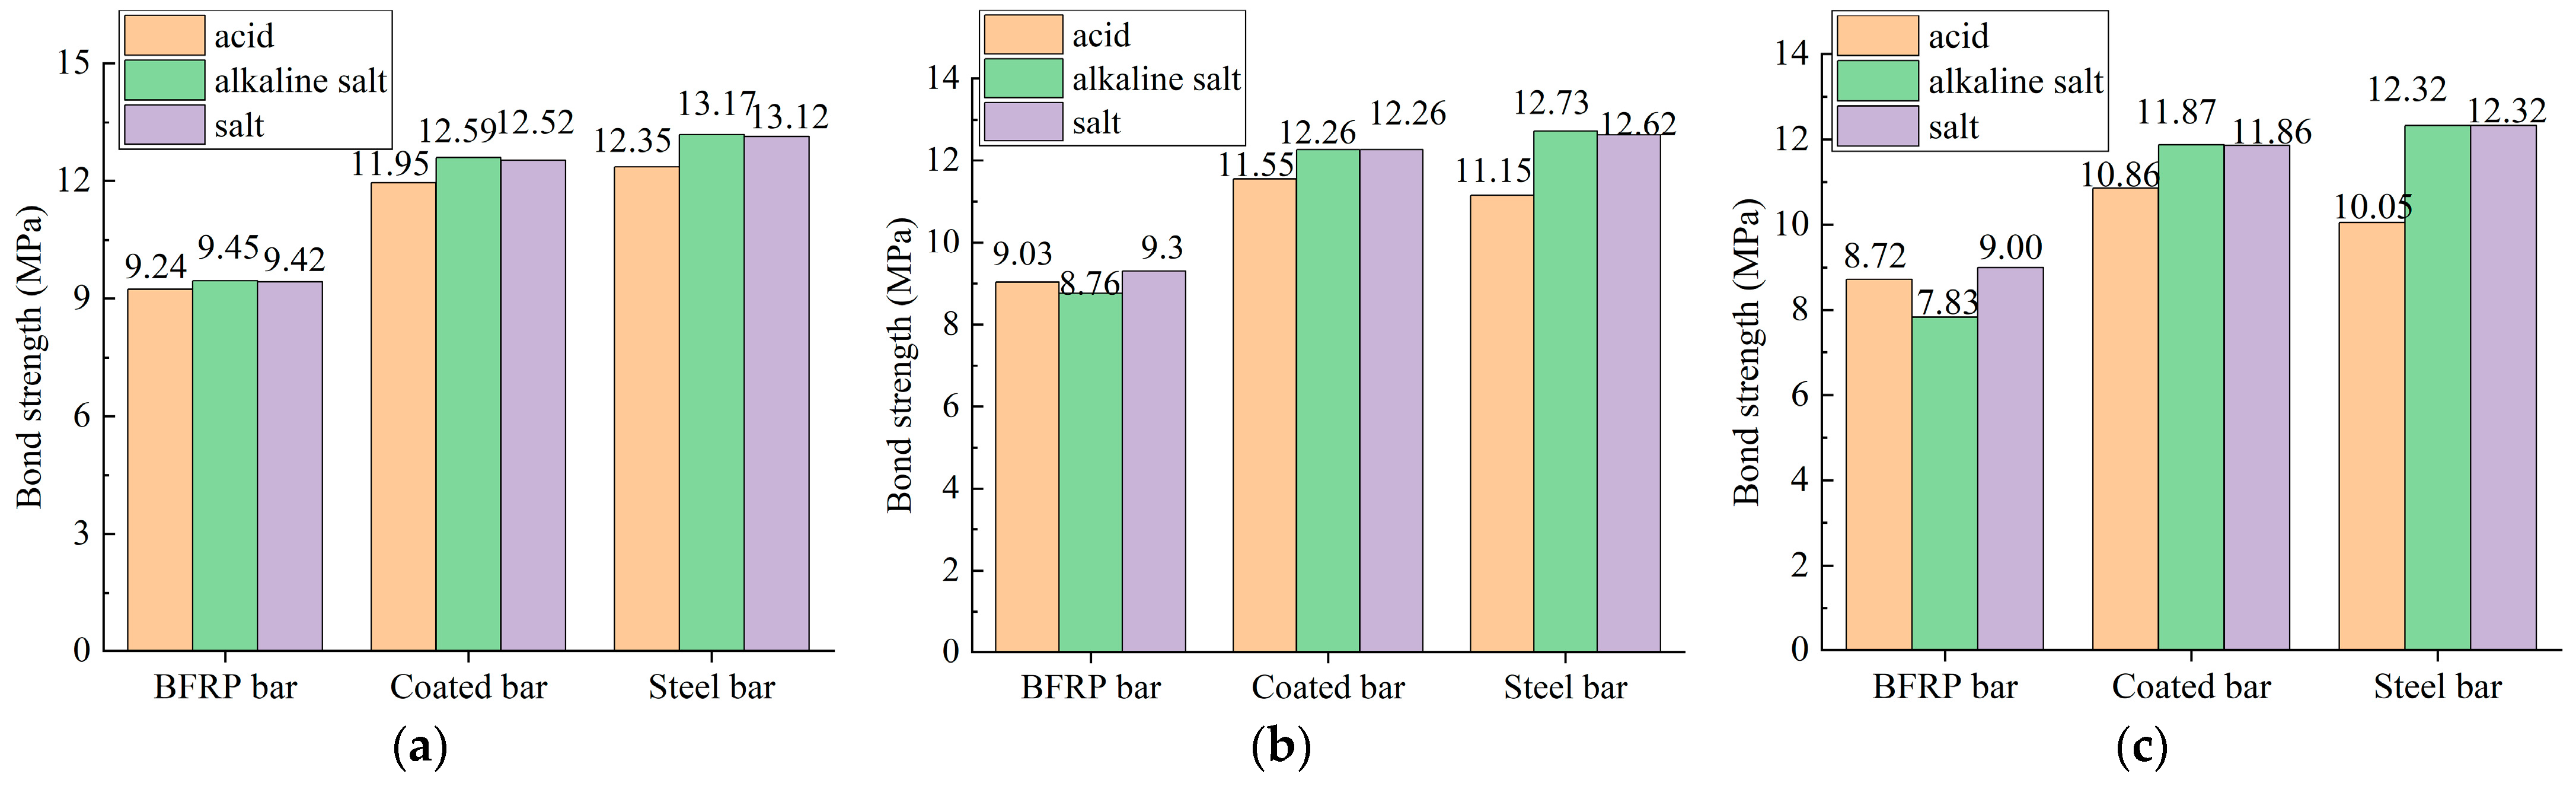
- For the same bar-CC specimens, different corrosive environments had a slight influence on the bonding property of the specimens. For BFRP-bar-CC specimens, the most rapid decline of bond strength was observed in an acid environment. Compared with an acid environment, the bond strength in an alkaline salt environment and a salt environment increased by 2.2% and 1.9%, respectively;
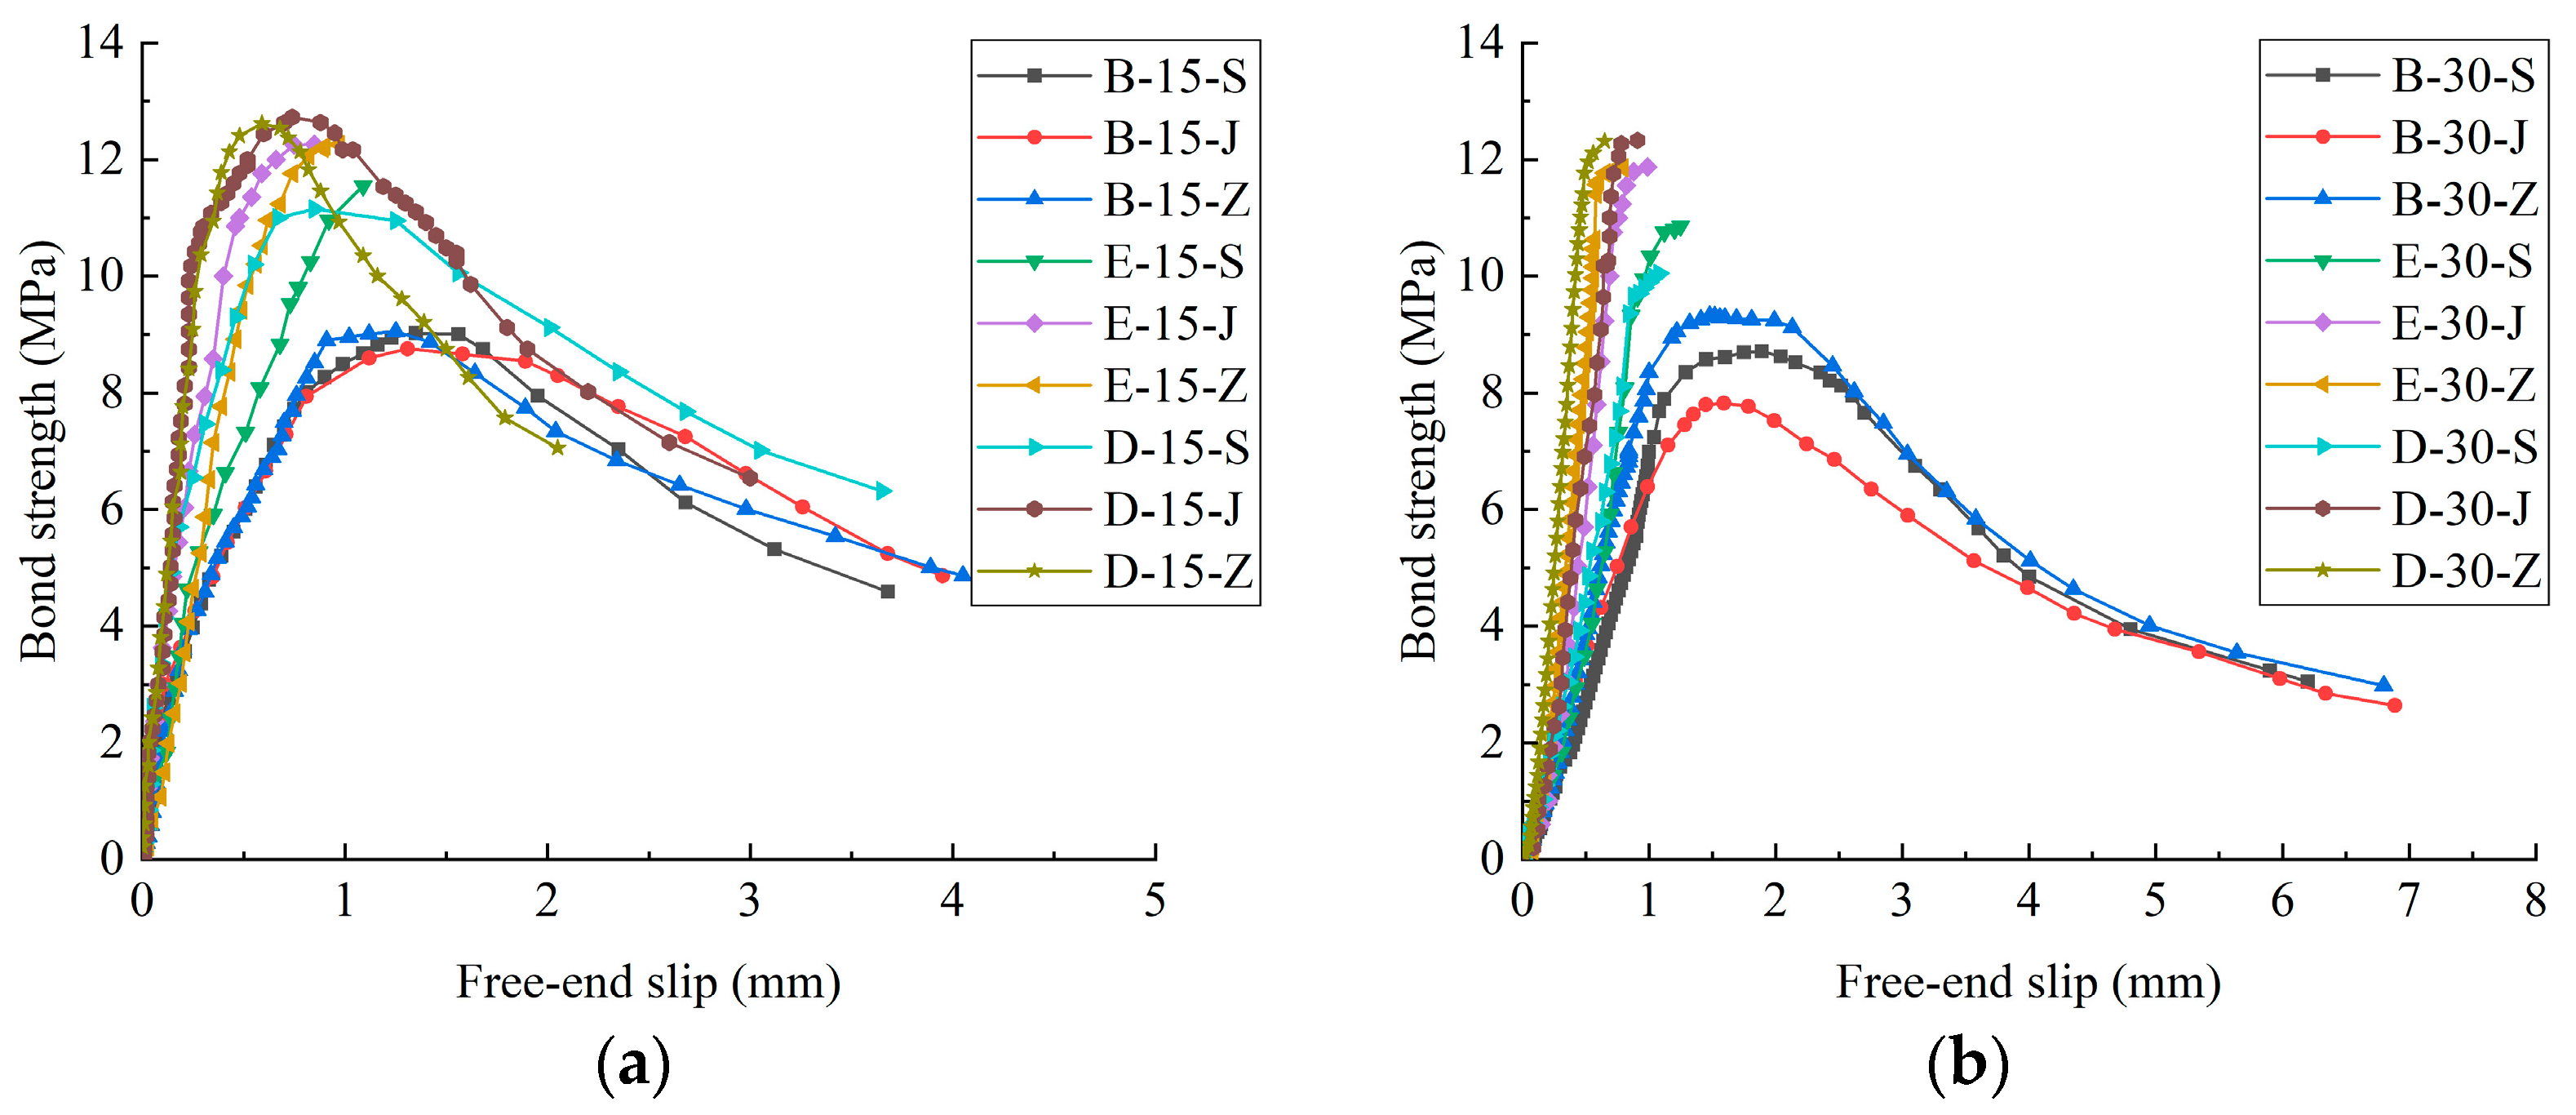
- When exposed to the coupled effect of an acid environment and 30 FT cycles, the bond strength of BFRP-bar-CC specimens, OSB-CC specimens, and ECR-CC specimens were decreased 5.7%, 18.6%, and 9.12%, respectively. This indicates that the BFRP-bar-CC specimens possessed good acid corrosion resistance, which can effectively prevent bond strength reduction;
- When exposed to the coupled effect of 30 FT cycles and a corrosive environment, BFRP-CC specimens showed the most rapid decline (17.2%) in an alkaline environment, while OSB-CC specimens and ECR-CC specimens showed the most rapid degradation (18.6% and 9.12%, respectively) in an acid environment;
- The formulas for calculating the ultimate bond strength of BFRP bars, ECRS, and OSBS with CC under the combined action of FT cycles and corrosive environments are provided. The obtained results are in good agreement with the experimental results.
Author Contributions
Funding
Data Availability Statement
Conflicts of Interest
References
- ACI 318; Building Code Requirements for Structural Concrete (ACI 318-08) and Commentary (ACI 318R-08). American Concrete Institute: Farmington Hills, MI, USA, 2009.
- EN 1992; Eurocode 2: Design of Concrete Structures—Part 1-1: General Rules and Rules for Buildings. European Committee for Standardization (CEN): Brussels, Belgium, 2014.
- GB 50010-2010; Code for Design of Concrete Structures. China Architecture & Building Press: Beijing, China, 2015.
- Mehany, S.; Mohamed, H.M.; Benmokrane, B. Contribution of lightweight self-consolidated concrete (LWSCC) to shear strength of beams reinforced with basalt FRP bars. Eng. Struct. 2021, 231, 111758. [Google Scholar] [CrossRef]
- Ji, T.; Zheng, D.; Chen, X.; Lin, X.; Wu, H. Effect of prewetting degree of ceramsite on the early-age autogenous shrinkage of lightweight aggregate concrete. Constr. Build. Mater. 2015, 98, 102–111. [Google Scholar] [CrossRef]
- Tanyildizi, H.; Coskun, A. The effect of high temperature on compressive strength and splitting tensile strength of structural lightweight concrete containing fly ash. Constr. Build. Mater. 2008, 22, 2269–2275. [Google Scholar] [CrossRef]
- Fu, X.; Chung, D. Effect of corrosion on the bond between concrete and steel rebar. Cem. Concr. Res. 1997, 27, 1811–1815. [Google Scholar] [CrossRef]
- Bautista, A.; Blanco, G.; Velasco, F. Corrosion behaviour of low-nickel austenitic stainless steels reinforcements: A comparative study in simulated pore solutions. Cem. Concr. Res. 2006, 36, 1922–1930. [Google Scholar] [CrossRef]
- Nie, R.; Huang, Y.; Li, X.; Sun, H.; Li, D. Bond of epoxy-coated reinforcement to seawater coral aggregate concrete. Ocean Eng. 2020, 208, 107350. [Google Scholar] [CrossRef]
- McDonald, D.B.; Pfeifer, D.W.; Sherman, M.R. Corrosion evaluation of epoxy-coated, metallic-clad and solid metallic reinforcing bars in concrete. Aust. Civ. Eng. Trans. 2002, 44, 103–107. [Google Scholar]
- Huang, Y.; Qi, X.; Li, C.; Gao, P.; Wang, Z.; Ying, J. Seismic behaviour of seawater coral aggregate concrete columns reinforced with epoxy-coated bars. Structures 2022, 36, 822–836. [Google Scholar] [CrossRef]
- Gerardo, G.C. Resistances of a Stainless Steel-Clad Reinforcing Bar to Chloride-Induce Corrosion in Concrete; Virginia Transportation Research Council: Charlottesville, VA, USA, 2004. [Google Scholar]
- Wang, J.; Gong, J.; Gong, Z.; Yang, X.; Wang, B. Effect of curing agent polarity on water absorption and free volume in epoxy resin studied by PALS. Nucl. Instrum. Methods Phys. Res. Sect. B Beam Interact. Mater. At. 2010, 268, 2355–2361. [Google Scholar] [CrossRef]
- Sagar, B.; Sivakumar, M.V.N. Performance evaluation of basalt fibre-reinforced polymer rebars in structural concrete members—A review. Innov. Infrastruct. Solut. 2021, 6, 75. [Google Scholar] [CrossRef]
- Lopresto, V.; Leone, C.; De Iorio, I. Mechanical characterisation of basalt fibre reinforced plastic. Compos. Part B Eng. 2011, 4, 717–723. [Google Scholar] [CrossRef]
- Lapko, A.; Urbanski, M. Experimental and theoretical analysis of deflections of concrete beams reinforced with basalt rebar. Arch. Civ. Mech. Eng. 2015, 15, 223–230. [Google Scholar] [CrossRef]
- Wang, X.; Wu, G.; Wu, Z.; Dong, Z.; Xie, Q. Evaluation of prestressed basalt fiber and hybrid fiber reinforced polymer tendons under marine environment. Mater. Des. 2014, 64, 721–728. [Google Scholar] [CrossRef]
- Garcia-Espinel, J.D.; Castro-Fresno, D.; Gayo, P.P.; Ballester-Munoz, F. Effects of sea water environment on glass fiber reinforced plastic materials used for marine civil engineering constructions. Mater. Des. 2015, 66, 46–50. [Google Scholar] [CrossRef]
- Borrie, D.; Liu, H.B.; Zhao, X.L.; Singh, R.R.K.; Bai, Y. Bond durability of fatigued CFRP-steel double-lap joints preexposed to marine environment. Compos. Struct. 2015, 131, 799–809. [Google Scholar] [CrossRef]
- Mark, F.G.; Luke, A.B.; Yves, B. Effect of freeze–thaw cycles on the bond durability between fibre reinforced polymer plate reinforcement and concrete. Can. J. Civ. Eng. 2000, 27, 949–959. [Google Scholar] [CrossRef]
- Achillides, Z.; Pilakoutas, K. Bond Behavior of Fiber Reinforced Polymer Bars under Direct Pullout Conditions. J. Compos. Constr. 2005, 8, 173–181. [Google Scholar] [CrossRef]
- Refai, A.; Ammar, M. Bond Performance of Basalt Fiber-Reinforced Polymer Bars to Concrete. J. Compos. Constr. 2015, 19, 1–12. [Google Scholar] [CrossRef]
- Shi, J.; Zhu, H.; Wu, Z. Bond Behavior between Basalt Fiber–Reinforced Polymer Sheet and Concrete Substrate under the Coupled Effects of Freeze-Thaw Cycling and Sustained Load. J. Compos. Constr. 2013, 17, 530–542. [Google Scholar] [CrossRef]
- Firas, A.; Jean-Michel, M.; Mohamed, S. Bond strength of different strengthening systems-Concrete elements under freeze-thaw cycles and salt water immersion exposure. Constr. Build. Mater. 2014, 70, 399–409. [Google Scholar] [CrossRef]
- Dong, Z.Q.; Wu, G. Research progress on durability of FRP bars reinforced concrete structures. China Civ. Eng. J. 2019, 52, 1–19. [Google Scholar] [CrossRef]
- Hassan, M.; Benmokrane, B.; ElSafty, A. Bond durability of basalt-fiber-reinforced-polymer (BFRP) bars embedded in concrete in aggressive environments. Compos. Part B Eng. 2016, 106, 262–272. [Google Scholar] [CrossRef]
- Fei, Y.; Zhibin, L.; Dalu, Z. Experimental study on bond durability of glass fiber reinforced polymer bars in concrete exposed to harsh environmental agents: Freeze-thaw cycles and alkaline-saline solution. Compos. Part B Eng. 2017, 116, 406–421. [Google Scholar] [CrossRef]
- Wu, G.; Dong, Z.Q.; Wang, X.; Zhu, Y. Prediction of long-term performance and durability of BFRP bars under the combined effect of sustained load and corrosive solutions. J. Compos. Constr. 2015, 19, 04014058. [Google Scholar] [CrossRef]
- Rifai, M.A.; El-Hassan, H.; El-Maaddawy, T. Durability of basalt FRP reinforcing bars in alkaline solution and moist concrete environments. Constr. Build. Mater. 2020, 243, 118258. [Google Scholar] [CrossRef]
- Altalmas, A.; Refai, A.; Abed, F. Bond degradation of basalt fiber-reinforced polymer (BFRP) bars exposed to accelerated aging conditions. Constr. Build. Mater. 2015, 81, 162–171. [Google Scholar] [CrossRef]
- ACI 440.6M-08; Guide Test Methods for Fiber-Reinforced Polymer (FRP) Composites for Reinforcing or Strengthening Concrete and Masonry Structures. American Concrete Institute: Farmington Hills, MI, USA, 2004.
- Lu, Z.; Su, L.; Lai, J.; Xie, J.; Yuan, B. Bond durability of BFRP bars embedded in concrete with fly ash in aggressive environments. Compos. Struct. 2021, 271, 114121. [Google Scholar] [CrossRef]
- CAN/CSA S807e10 (R2015); Specification for Fiber Reinforced Polymers. Canadian Standards Association: Rexdale, ON, Canada, 2015.
- ASTM C666/C666M; Standard Test Method for Resistance of Concrete to Rapid Freezing and Thawing. American Society for Testing and Materials: West Conshohocken, PA, USA, 2015.
- Rilem, F.C. Tentative recommendations, recommendations for reinforcing steel, bond test for reinforcing steel: 1-Beam test (7-II-28 d) 2-pull-out test (7-II-128). Mater. Struct. 1973, 6, 79–118. [Google Scholar]
- Amini, K.; Jalalpour, M.; Delatte, N. Advancing concrete strength prediction using non-destructive testing: Development and verification of a generalizable model. Constr. Build. Mater. 2016, 102, 762–768. [Google Scholar] [CrossRef] [Green Version]
- Institute of Building Structure and Chinese Academy of Building Sciences. Research and Application of Lightweight Aggregate Concrete; China Architecture & Building Press: Beijing, China, 1981. [Google Scholar]
- Deng, P.; Cong, Z.R.; Liu, Y.; Huang, Y.Y.; Zhu, Q. Effect of Dry-Wet Cycles on BFRP Bars and Modified Ceramsite Concrete in Marine Environments. J. Mater. Civ. Eng. 2022, 34, 040221251–0402212512. [Google Scholar] [CrossRef]
- Shang, H.S.; Zhao, T.J.; Cao, W.Q. Bond behavior between steel bar and recycled aggregate concrete after freeze–thaw cycles. Cold Reg. Sci. Technol. 2015, 118, 38–44. [Google Scholar] [CrossRef]
- Deng, P.; Wang, Y.J.; Sun, Y.; Liu, Y.; Guo, W.H. Bond durability of basalt-fiber-reinforced-polymer bars embedded in lightweight aggregate concrete subjected to freeze–thaw cycles. Struct. Concr. 2021, 22, 2829–2848. [Google Scholar] [CrossRef]
- Wang, H.Z. An Experimental Study on the Deterioration of Properties of Fiber–Reinforced Concrete in Acid Corrosive Environments. Master’s Thesis, Zhejiang University of Technology, Hangzhou, China, 2018. [Google Scholar]
- Kong, H.L.; Orbison, J.G. Concrete deterioration due to acid precipitation. ACI Mater. J. 1987, 84, 110–115. [Google Scholar] [CrossRef]
- Bank, L.C.; Puterman, M.; Katz, A. Effect of material degradation on bond properties of fiber reinforced plastic reinforcing bars in concrete. ACI Mater. J. 1998, 95, 232–243. [Google Scholar]
- Barneyback, R.S.; Diamond, S. Expression and analysis of pore fluids from hardened cement pastes and mortars. Cem. Concr. Res. 1981, 11, 279–285. [Google Scholar] [CrossRef]
- Fang, C.Q.; Karin, L.G.; Chen, L.G. Corrosion influence on bond in reinforced concrete. Cem. Concr. Res. 2004, 10, 2159–2167. [Google Scholar] [CrossRef]
- Lee, S.T. Performance Deterioration of Portland Cement Matrix due to Magnesium Sulfate Attack. KSCE J. Civ. Eng. 2007, 11, 157–163. [Google Scholar] [CrossRef]
- Lee, S.T.; Kim, D.G. Sulfate Attack of Cement Matrix Containing Inorganic Alkali-free Accelerator. KSCE J. Civ. Eng. 2009, 13, 49–54. [Google Scholar] [CrossRef]
- Xun, Y.L.; Liu, L.X.; Guan, P.W.; Zeng, D.G. Anchorage Performance and Design Method of Epoxy Resin Coated Steel Bar. Port Waterw. Eng. 1999, 8, 33–37. [Google Scholar] [CrossRef]
- Wang, P. Experimental Research on the Fundamental Mechanical Behavior of Ceramisite Concrete. Master’s Thesis, Changsha University of Science & Technology, Changsha, China, 2008. [Google Scholar] [CrossRef]


| Ceramsite Type | Density Grad (kg/m3) | Nominal Diameter (mm) | Packing Density (kg/m3) | Water Absorption 1 h (%) | Compressive Strength (MPa) |
|---|---|---|---|---|---|
| SC | 500 | 5–20 | 470 | 7.6 | 2.6 |
| Compressive Strength | Cement (kg/m3) | Water (kg/m3) | Fine Aggregate (kg/m3) | Coarse Aggregate (kg/m3) |
|---|---|---|---|---|
| LC30 * | 400 | 200 | 680 | 490 |
| Compressive Strength | Measured Compressive Strength (MPa) | Mean (MPa) | ||
|---|---|---|---|---|
| 1 | 2 | 3 | ||
| LC30 | 34.56 | 33.58 | 31.48 | 33.21 |
| Bar Type | Diameter (mm) | Ultimate Tensile Strength (MPa) | Yield Strength (MPa) | Elastic Modulus (GPa) |
|---|---|---|---|---|
| BFRP bars | 14 | 703 | - | 40 |
| ECRs | 14 | 660 | 470 | 208 |
| OSBs | 14 | 655 | 566 | 202 |
| Grouping | Specimens | Bar Type | FT Cycles | Corrosive Environment | Number of Specimens |
|---|---|---|---|---|---|
| Group 1 * | B-0-S/J/Z | BFRP | 0 | pH = 2/10/7 | 3/3/3 |
| Group 2 | E-0-S/J/Z | ECR | 0 | pH = 2/10/7 | 3/3/3 |
| Group 3 | D-0-S/J/Z | OSB | 0 | pH = 2/10/7 | 3/3/3 |
| Group 4 | B-15-S/J/Z | BFRP | 15 | pH = 2/10/7 | 3/3/3 |
| Group 5 | E-15-S/J/Z | ECR | 15 | pH = 2/10/7 | 3/3/3 |
| Group 6 | D-15-S/J/Z | OSB | 15 | pH = 2/10/7 | 3/3/3 |
| Group 7 | B-30-S/J/Z | BFRP | 30 | pH = 2/10/7 | 3/3/3 |
| Group 8 | E-30-S/J/Z | ECR | 30 | pH = 2/10/7 | 3/3/3 |
| Group 9 | D-30-S/J/Z | OSB | 30 | pH = 2/10/7 | 3/3/3 |
| Group 10 | - | - | Untreated specimen | 3 | |
| Group11 | 0-S/J/Z | - | 0 | pH = 2/10/7 | 3/3/3 |
| Group12 | 15-S/J/Z | - | 15 | pH = 2/10/7 | 3/3/3 |
| Group13 | 30-S/J/Z | - | 30 | pH = 2/10/7 | 3/3/3 |
| Specimen | Failure Mode | P (kN) | (kN) 3 | (mm) | (mm) 5 | |||||
|---|---|---|---|---|---|---|---|---|---|---|
| 1 | 2 | 3 | 1 | 2 | 3 | |||||
| B-0-S | PO 1 | 29.01 | 28.52 | 27.49 | 28.34 | 9.24 | 1.33 | 1.30 | 1.24 | 1.29 |
| B-0-J | PO | 28.43 | 28.02 | 29.68 | 28.71 | 9.45 | 1.20 | 1.16 | 1.27 | 1.21 |
| B-0-Z | PO | 28.34 | 28.90 | / 6 | 28.62 | 9.42 | 1.13 | 1.25 | / | 1.19 |
| E-0-S | S 2 | 37.86 | 35.53 | 36.94 | 36.77 | 11.95 | 1.08 | 1.15 | 0.93 | 1.05 |
| E-0-J | S | 38.79 | 36.43 | 39.53 | 38.25 | 12.59 | 1.04 | 0.88 | 0.99 | 0.97 |
| E-0-Z | S | 35.23 | 40.49 | 39.30 | 38.34 | 12.52 | 0.79 | 1.12 | 0.85 | 0.92 |
| D-0-S | PO | / | 36.32 | 39.68 | 38.00 | 12.35 | / | 0.77 | 0.95 | 0.86 |
| D-0-J | PO | 39.69 | 40.39 | 39.95 | 40.01 | 13.17 | 0.86 | 0.90 | 0.73 | 0.83 |
| D-0-Z | PO | 37.60 | 42.60 | 39.38 | 39.86 | 13.12 | 0.70 | 0.94 | 0.79 | 0.81 |
| B-15-S | PO | 25.52 | 27.77 | 30.02 | 27.77 | 9.03 | 1.21 | 1.31 | 1.53 | 1.35 |
| B-15-J | PO | 25.76 | 26.05 | 29.01 | 26.94 | 8.76 | 1.30 | 1.27 | 1.36 | 1.31 |
| B-15-Z | PO | 28.54 | 29.62 | 27.67 | 28.61 | 9.30 | 1.20 | 1.38 | 1.17 | 1.25 |
| E-15-S | S | 33.27 | 37.64 | 32.59 | 34.50 | 11.55 | 1.11 | 1.17 | 0.99 | 1.09 |
| E-15-J | S | 40.61 | 37.26 | 35.26 | 37.71 | 12.26 | 1.03 | 0.78 | 0.74 | 0.85 |
| E-15-Z | S | 36.91 | 38.51 | / | 37.71 | 12.26 | 0.89 | 1.05 | / | 0.97 |
| D-15-S | PO | 31.60 | 33.82 | 37.51 | 34.31 | 11.15 | 0.80 | 0.80 | 0.95 | 0.85 |
| D-15-J | PO | 40.35 | 39.50 | 37.63 | 39.16 | 12.73 | 0.88 | 0.67 | 0.67 | 0.74 |
| D-15-Z | PO | 39.75 | 35.32 | 41.39 | 38.82 | 12.62 | 0.54 | 0.66 | 0.57 | 0.59 |
| B-30-S | PO | 25.67 | 26.03 | 28.73 | 26.81 | 8.71 | 1.79 | 1.87 | 2.01 | 1.89 |
| B-30-J | PO | 23.38 | / | 24.76 | 24.07 | 7.82 | 1.63 | / | 1.55 | 1.59 |
| B-30-Z | PO | 27.19 | 26.59 | 29.32 | 27.70 | 9.00 | 1.49 | 1.34 | 1.61 | 1.48 |
| E-30-S | S | 34.81 | 31.59 | 33.83 | 33.41 | 10.86 | 1.39 | 1.09 | 1.27 | 1.25 |
| E-30-J | S | 38.77 | 33.83 | 36.96 | 36.52 | 11.87 | 1.04 | 0.86 | 1.07 | 0.99 |
| E-30-Z | S | 37.96 | 33.12 | 38.36 | 36.48 | 11.86 | 0.80 | 0.67 | 0.90 | 0.79 |
| D-30-S | S | 29.86 | 31.96 | / | 30.91 | 10.05 | 1.15 | 1.01 | / | 1.08 |
| D-30-J | S | 38.40 | 36.24 | 39.12 | 37.92 | 12.32 | 1.02 | 0.79 | 0.92 | 0.91 |
| D-30-Z | S | 39.37 | 38.21 | 36.09 | 37.89 | 12.31 | 0.81 | 0.62 | 0.52 | 0.65 |
| Grouping | Specimen | ||||
|---|---|---|---|---|---|
| 1 | 2 | 3 | |||
| Group 10 | Untreated specimen | 34.56 | 33.58 | 31.48 | 33.21 |
| Group 11 | 0-S | 28.41 | 28.72 | 28.22 | 28.45 |
| 0-J | 34.22 | 33.41 | 32.62 | 33.42 | |
| 0-Z | 31.51 | 32.56 | 34.63 | 32.90 | |
| Group 12 | 15-S | 22.02 | 21.76 | 21.09 | 21.62 |
| 15-J | 16.90 | 26.75 | 28.90 | 26.75 | |
| 15-Z | 28.04 | 26.53 | 25.35 | 26.64 | |
| Group 13 | 30-S | 18.26 | 18.32 | 17.62 | 18.07 |
| 30-J | 25.17 | 20.92 | 22.43 | 22.84 | |
| 30-Z | 21.96 | 21.53 | 22.92 | 22.14 | |
| Specimen | Mean (%) | |||||||||
|---|---|---|---|---|---|---|---|---|---|---|
| 1 | 2 | 3 | 1 | 2 | 3 | 1 | 2 | 3 | ||
| 0-S | 1749 | 1698 | 1704 | 1745 | 1694 | 1700 | 0.23 | 0.24 | 0.24 | 0.24 |
| 0-J | 1681 | 1704 | 1662 | 1678 | 1698 | 1654 | 0.18 | 0.19 | 0.18 | 0.18 |
| 0-Z | 1648 | 1668 | 1645 | 1646 | 1668 | 1643 | 0.12 | 0.00 | 0.12 | 0.12 |
| 15-S | 1664 | 1709 | 1737 | 1649 | 1693 | 1721 | 0.91 | 0.95 | 0.93 | 0.93 |
| 15-J | 1632 | 1651 | 1671 | 1619 | 1638 | 1656 | 0.80 | 0.79 | 0.91 | 0.83 |
| 15-Z | 1636 | 1623 | 1677 | 1620 | 1609 | 1665 | 0.83 | 0.87 | 0.72 | 0.81 |
| 30-S | 1656 | 1657 | 1705 | 1626 | 1627 | 1674 | 1.85 | 1.84 | 1.85 | 1.85 |
| 30-J | 1712 | 1640 | 1740 | 1685 | 1613 | 1712 | 1.60 | 1.67 | 1.64 | 1.64 |
| 30-Z | 1695 | 1775 | 1647 | 1668 | 1746 | 1620 | 1.62 | 1.66 | 1.67 | 1.65 |
Disclaimer/Publisher’s Note: The statements, opinions and data contained in all publications are solely those of the individual author(s) and contributor(s) and not of MDPI and/or the editor(s). MDPI and/or the editor(s) disclaim responsibility for any injury to people or property resulting from any ideas, methods, instructions or products referred to in the content. |
© 2023 by the authors. Licensee MDPI, Basel, Switzerland. This article is an open access article distributed under the terms and conditions of the Creative Commons Attribution (CC BY) license (https://creativecommons.org/licenses/by/4.0/).
Share and Cite
Liu, Y.; Zhu, Q.; Teng, J.; Deng, P.; Sun, Y. Bond Performance of Anti-Corrosion Bar Embedded in Ceramsite Concrete in Freeze–Thaw Cycles and Corrosive Environments. Buildings 2023, 13, 884. https://doi.org/10.3390/buildings13040884
Liu Y, Zhu Q, Teng J, Deng P, Sun Y. Bond Performance of Anti-Corrosion Bar Embedded in Ceramsite Concrete in Freeze–Thaw Cycles and Corrosive Environments. Buildings. 2023; 13(4):884. https://doi.org/10.3390/buildings13040884
Chicago/Turabian StyleLiu, Yan, Qiang Zhu, Jinhua Teng, Peng Deng, and Yan Sun. 2023. "Bond Performance of Anti-Corrosion Bar Embedded in Ceramsite Concrete in Freeze–Thaw Cycles and Corrosive Environments" Buildings 13, no. 4: 884. https://doi.org/10.3390/buildings13040884