Article

Collapse Assessment of Mid-Rise RC Dual Wall-Frame Buildings Subjected to Subduction Earthquakes

by
Marco F. Gallegos
1,
Gerardo Araya-Letelier
2,3,*,
Diego Lopez-Garcia
1,4,* and
Pablo F. Parra
5
1
Department of Structural & Geotechnical Engineering, Pontificia Universidad Catolica de Chile, Santiago 7820436, RM, Chile
2
School of Civil Construction, Faculty of Engineering, Pontificia Universidad Catolica de Chile, Santiago 7820436, RM, Chile
3
Concrete Innovation Hub UC (CIHUC), Pontificia Universidad Catolica de Chile, Santiago 7820436, RM, Chile
4
Research Center for Integrated Disaster Risk Management (CIGIDEN) ANID FONDAP 1522A0005, Santiago 7820436, RM, Chile
5
Facultad de Ingenieria y Ciencias, Universidad Adolfo Ibanez, Santiago 7941169, RM, Chile
*
Authors to whom correspondence should be addressed.
Buildings 2023, 13(4), 880; https://doi.org/10.3390/buildings13040880
Submission received: 22 February 2023 / Revised: 16 March 2023 / Accepted: 19 March 2023 / Published: 28 March 2023
(This article belongs to the Special Issue Seismic Risk Analysis and Management of Structure Systems)

Abstract

:
In Chile, office buildings are typically reinforced concrete (RC) structures whose lateral load-resisting system comprises core structural walls and perimeter moment frames (i.e., dual wall-frame system). In the last 20 years, nearly 800 new dual wall-frame buildings have been built in the country and roughly 70% of them have less than ten stories. Although the seismic performance of these structures was deemed satisfactory in previous earthquakes, their actual collapse potential is indeed unknown. In this study, the collapse performance of Chilean code-conforming mid-rise RC buildings is assessed considering different hazard levels (i.e., high and moderate seismic activity) and different soil types (i.e., stiff and moderately stiff). Following the FEMA P-58 methodology, 3D nonlinear models of four representative structural archetypes were subjected to sets of Chilean subduction ground motions. Incremental dynamic analysis was used to develop collapse fragilities. The results indicate that the archetypes comply with the ‘life safety’ risk level defined in ASCE 7, which is consistent with the observed seismic behavior in recent mega-earthquakes in Chile. However, the collapse risk is not uniform. Differences in collapse probabilities are significant, which might indicate that revisions to the current Chilean seismic design code might be necessary.

1. Introduction

In recent decades, Chilean reinforced concrete (RC) mid- and high-rise buildings were subjected to strong subduction earthquakes (e.g., Mw 8.0 1985 Valparaiso, Mw 8.8 2010 Maule, Mw 8.2 2014 Iquique, Mw 8.3 2015 Illapel, and Mw 7.6 2016 Chiloe [1]), and the seismic behavior of these buildings was deemed satisfactory. During the 2010 earthquake, only 2.0% of RC buildings with nine or more stories and only 0.4% of buildings with three or more stories suffered severe damage due to strong shaking [2]. In particular, this event caused only a few partial collapses (e.g., the O’Higgins Tower) and one total collapse (i.e., the Alto Rio building) [3], as shown in Figure 1.
The main objective of modern seismic design codes is to prevent collapse. Structural collapse, either partial or total, is the leading cause of casualties, injuries, and economic losses, as well as downtime and environmental impacts [4]. For these reasons, quantification of the collapse probability of code-conforming structures (e.g., buildings) is a very important issue in earthquake engineering, particularly in countries where the seismic activity is high and the seismic behavior of their buildings has not been adequately characterized [5].
In Chile, observations of the effects of recent earthquakes [3,6,7] indicate that the ‘collapse prevention’ target performance level of the current seismic design regulations for buildings [8,9] was achieved. However, in these regulations the ‘collapse prevention’ limit state is defined in qualitative terms rather than in quantitative metrics. The seismic design code NCh 433 [8] states that “although presenting damage, buildings should avoid collapse when subjected to exceptionally intense ground motions”, but “exceptionally intense ground motions” are not defined, and neither are the target collapse metrics. In other words, quantitative acceptance criteria such as those defined in ASCE 7-22 [10] (i.e., a probability of collapse in 50 years of less than 1% and a probability of collapse conditional to the Maximum Considered Earthquake (MCE) of less than 10%) are not specified in the Chilean regulations.
Chilean RC mid- and high-rise buildings can be characterized by two types of structural systems. On the one hand, the structural system of residential buildings consists of a large number of shear walls, typically in a ‘fish-bone’ plan layout. This structural system is rarely found outside Chile, which is why it is sometimes referred to as the ‘Chilean building’. On the other hand, the structural system of office buildings consists of core shear walls and perimeter moment frames. This structural system is commonly known as a dual wall-frame system and is frequently used in other earthquake-prone regions. The floor system typically consists of flat post-tensioned slabs (17–20 cm thickness) and the span lengths are relatively large (8–10 m). The perimeter moment frames are mainly intermediate moment frames (IMFs) designed for less than 25% of the base shear and the core walls are special structural walls (SWs) [11]. The core walls in office buildings are shorter and thicker than those in residential buildings but the wall density (i.e., the ratio of the area of the walls to the total floor area) is similar in both types of buildings. As a consequence of a commonly adopted criterion in Chilean engineering practice, the wall density is always greater than 0.1% [12].
The level of seismic hazard is high in Chile, mainly due to subduction-type earthquakes, but research to quantitatively assess the actual level of seismic collapse protection of buildings is still limited. To the best of the authors’ knowledge, the collapse probability of Chilean RC buildings, assessed per the Performance-Based Earthquake Engineering (PBEE) framework proposed by the Pacific Earthquake Engineering Research Center (PEER) to implement the FEMA P-58 [13] methodology, has been analyzed in just two studies [14,15]. Within the FEMA P-58 framework, the current state-of-the-art procedure for collapse assessment is based on the FEMA P695 [16] methodology. Araya-Letelier et al. [14] analyzed the collapse risk of a code-conforming 16-story dual wall-frame building located in Santiago. The mean annual frequency of collapse, λc, was found to be 2.61 × 10⁻⁵ and the collapse probability in 50 years, Pc(50), was found to be 0.13%. Cando et al. [15] analyzed the seismic performance of a suite of four code-conforming 20-story shear-wall buildings located in Santiago. The λc values were found to range from 2.7 × 10⁻⁴ to 6.9 × 10⁻⁴ and the values of Pc(50) were found to range from 1.3% to 3.4%. The latter probabilities were not only higher than those calculated by Araya-Letelier et al. [14] but also exceeded the 1% in 50 years target collapse probability indicated in ASCE 7-22 [10]. According to Cando et al. [15], these relatively high Pc(50) values may be related to the assumed soil type (soil type B in [14], soil type C in [15], as defined by the Chilean seismic design code [9]) and small differences in the seismic hazard model. It must be noted that in each of these studies, only a single building archetype located at a particular location on a specific soil type was analyzed. In other words, the potential influence of different seismicity levels and soil types on the collapse probability when buildings are subjected to subduction earthquakes was not accounted for. Moreover, since these studies focused on the performance of tall buildings, the quantitative collapse performance of mid-rise dual wall-frame RC office buildings in Chile remains unclear.
The potential impact of these and other relevant variables (e.g., structural system, building height, modeling parameters, seismicity source, etc.) on the building’s seismic performance has been evaluated to a limited extent. Some studies have analyzed buildings of different heights [17,18,19,20]. For instance, Dabaghi et al. [19] found that the collapse capacity decreases as the number of stories increases. Terzic et al. [20] examined low- and mid-rise office buildings and found that, although the seismic response (e.g., floor accelerations, story drifts, and residual drifts) is smaller in shorter buildings than in taller structures, shorter buildings suffer significantly higher levels of structural and nonstructural damage, which of course leads to higher repair costs per floor. In addition, Marafi et al. [21] pointed out that modeling assumptions (e.g., deformation capacity) and the level of axial load on the walls have a significant influence on the collapse risk of dual wall-frame buildings. Few studies have focused on subduction ground motions [22,23,24]. For example, Medalla et al. [24] revealed that the collapse probability of mid- and high-rise steel moment-frame (MF) buildings in subduction-prone locations could be up to two times higher than that in crustal-prone locations. The seismic response of dual wall-frame buildings on soft soils that are subjected to subduction ground motions has received relatively little attention. In one of these studies, Marafi et al. [25] analyzed the seismic performance of buildings considering the Seattle basin effects and Cascadia subduction earthquakes. High collapse probabilities were found due to the simultaneous effects of spectral acceleration, spectral shape and duration, and basin effects. This research review shows that some variables (e.g., type of seismic demand, height of the building, soil type, etc.) have a direct influence on the seismic performance of buildings, especially on the collapse potential, which needs to be further evaluated.
It is clear then that despite acceptable behavior during recent earthquakes, the collapse capacity of RC buildings subjected to Chilean subduction ground motions is still largely unknown. This is the main motivation for the present study, which aims at quantitatively characterizing the collapse capacity of Chilean RC dual wall-frame buildings. Emphasis is placed on mid-rise buildings, which represent a relevant proportion of current office buildings. The objective of this paper is to provide more insights into the collapse capacity of RC mid-rise dual wall-frame buildings by taking into account the influence of the level of seismic hazard and soil type. In particular, this paper focuses on post-2010 Chilean buildings subjected to Chilean subduction ground motions. To the best of the authors’ knowledge, the collapse capacity of the class of buildings analyzed in this paper has not yet been quantitatively characterized. Even though such collapse capacity is expected to be acceptable (the empirical evidence indicates that pre-2010 buildings performed well when subjected to a huge earthquake and post-2010 buildings are expected to perform even better), quantitative characterizations are nevertheless necessary. The methodology used to evaluate the collapse capacity is described in Section 2. The specific research objectives are (1) to select a structural layout representative of Chilean RC dual wall-frame buildings (Section 3); (2) to design and model a suite of four building archetypes located in different seismic zones (i.e., high and moderate seismicity) and on different soil types (i.e., very stiff and moderately stiff soil), following post-2010 seismic provisions (Section 3); (3) to select and scale hazard-consistent ground motions (Section 4); and (4) to develop collapse fragilities and combine them with the respective hazard in order to assess the seismic collapse capacities (Section 5). The seismic behavior was evaluated using the well-established FEMA P-58 methodology [13] by performing Incremental Dynamic Analysis (IDA) [26] of 3D nonlinear structural models. The record-to-record (RTR) variability was accounted for by sets of carefully selected Chilean subduction ground motions. Values of several collapse-related metrics (i.e., probability of collapse conditional to the MCE, Collapse Margin Ratio (CMR), λc, Pc(50)) were calculated. Finally, all relevant findings are discussed in Section 6.

2. Collapse Assessment Methodology

Despite significant advances in the structural design and analysis of buildings, deterministic predictions of building collapse under earthquake shaking are still not possible. Rather, the evaluation of the seismic collapse performance should be addressed through probabilistic criteria [27]. For this research, probabilistic seismic collapse assessments were developed using the FEMA P-58 methodology [13] within the PBEE-PEER framework. The principal result was the earthquake-induced building-specific collapse fragility function, which is the probability of triggering a structural collapse based on a specific ground-motion (GM) intensity measure (IM). The collapse fragility functions were developed based on the IDA [26] and the IM adopted was the pseudo-spectral acceleration ordinate at the fundamental period of the structure, Sa(T1). Based on recent studies, Sa(T1) is still an adequate predictor of collapse for stiff RC structures whose seismic response is dominated by the fundamental vibration mode [28,29] (e.g., mid-rise RC dual wall-frame buildings). Consequently, for each archetype building model and GM record, nonlinear response history (NLRH) analyses at increasing Sa(T1) levels were performed until collapse. Further details of this methodology are provided in the following subsections.

2.1. Estimation of Sa(T1) Intensities That Trigger Collapse

Initially, all possible (global or local) building collapse types were identified. Current state-of-the-art studies describe alternatives that can be used to identify earthquake-induced structural collapse [13,16,26]. In this study, both non-simulated and simulated collapses were assessed (further details can be found in Section 3.3 and Section 3.4). Subsequently, mathematical 3D models, which capture all failure modes of the structures, were developed. These models took into account the effects of material deterioration on strength and stiffness, as well as geometric nonlinearities (P-delta effects).
In the next step, structural 3D models were subjected to NLRH analyses using sets of subduction GM records (from Chile) that were scaled to increasing Sa(T1) values at 0.05 g steps until collapse. The sets of subduction GM records represented the aleatory uncertainty of the seismic hazard (called RTR variability), which is the dominant source of uncertainty compared to epistemic uncertainty (i.e., modeling uncertainty) [13]. Still, important epistemic uncertainty, such as damage and material decay due to, for example, climate factors, should be incorporated in future studies. To reduce the significant computational costs, the IDAs were performed only along the shorter horizontal plan direction, i.e., the direction along which the collapse fragility was greater. The lowest Sa(T1) value at which either the global or local structural collapse criteria were met was recorded for each structural model and each GM. Since earthquake-induced collapse should be evaluated in a probabilistic way, the dispersion of the Sa(T1) collapse intensity values was calculated to develop the respective building-specific collapse fragility functions.

2.2. Estimation of Collapse Fragility Functions

Earthquake-induced building-specific collapse fragility functions provide the probability of structural collapse based on the GM intensity Sa(T1), which is represented by P(C|Sa(T1), and assume a lognormal probability function (PF) [30,31,32]. These PFs are defined by two parameters: (1) the median (i.e., median collapse capacity, θ ^ ); and (2) the logarithmic standard deviation (i.e., dispersion, β ^ ). Both parameters were estimated using the Maximum Likelihood Method (MLM) [33]. Then, Kolmogorov–Smirnov (K–S) and Lilliefors goodness-of-fit tests, both at a 5% significance level, were used to evaluate the quality of the lognormal PFs. The K–S test is a distribution-free (non-parametric) test used for continuous distributions [34], whereas the Lilliefors test, recommended by FEMA P-58 [13], is a more severe (compared to the K–S test) test and is recommended when the parameters are not specified but estimated from the sample [35].

2.3. Collapse Performance Metrics: P(C|Sa(T1)MCE), CMR, λc, and Pc(50)

The probability of collapse based on the MCE hazard level, P(C|Sa(T1)MCE), is obtained from the collapse fragility curves. This collapse performance metric is used to assess safety considerations, for instance, US code-conforming buildings must not have values greater than 10% [10]. Another collapse performance metric is the Collapse Margin Ratio (CMR), which is defined by FEMA P695 [16] as the median collapse capacity θ ^ divided by Sa(T1)MCE, as shown in Equation (1).
CMR = θ ^ S a ( T 1 ) MCE
A complementary collapse performance metric is the mean annual frequency of collapse, λc, which represents the average number of earthquake-induced structural collapses of a given structure per year. This λc value is a combination of the product of the collapse fragility and the seismic hazard (Equation (2), where dλSa/dSa is the derivative of the seismic hazard curve).
λ c = 0 P C S a ( T 1 ) · d λ S a d S a · d S a
Finally, the probability of one earthquake-induced collapse in 50 years, Pc(50), is obtained using Equation (3) and assumes a Poisson process. This performance metric is the collapse potential in 50 years and is also used to analyze safety considerations. For instance, US code-conforming buildings must not have Pc(50) values greater than 1% [10].
P c 50 = 1 e λ c · 50

2.4. Deaggregation of λc

Lastly, the contribution of each Sa(T1) value to λc is obtained through the deaggregation of λc. Deaggregated λc values based on Sa(T1) are obtained using Equation (4), whose terms have been previously defined.
Deaggregated   λ c S a = P C S a ( T 1 ) · d λ S a d S a · d S a

3. Methodology to Define Code-Conforming Archetype Buildings

3.1. Statistical Evaluation of Chilean RC Buildings

The archetype buildings were selected based on a statistical analysis of the available data on RC buildings in the Chilean national database of buildings [36]. The database contains disaggregated information on buildings with at least 3 stories that were built between 2002 and 2020 (both years included) such as the location, construction material used, number of stories, equivalent floor area, etc. In more detail, there are 8078 RC buildings of which roughly 10% are office buildings and roughly 90% are residential buildings. Of these, 470 are office buildings located in the Metropolitan Region (MR-Region) and 62 are office buildings located in the Valparaiso Region (V-Region), which are the most densely populated regions in the country. Figure 2a presents the classification of these office buildings as a function of the number of stories. The International Building Code (IBC) [37] defines a high-rise building as a building that is more than 22.86 m (75 ft) above the lowest level (Figure 2b). Considering an average story height of 2.5 m, this may correspond to a building of 10 stories or more. Therefore, a mid-rise building can be defined as a building that has more than 3 stories but no more than 9 stories. In Figure 2a, it is noted that 359 office buildings are classified as mid-rise buildings, whereas 173 office buildings are classified as high-rise buildings (i.e., ~70% and ~30%, respectively).
This research focused on mid-rise buildings for two reasons. First, the seismic response of mid-rise buildings can be expected to be dominated by the fundamental mode of vibration. Such a response generates a somewhat uniform distribution of story drift ratios, which may affect the collapse performance and economic losses [38]. Second, most of the existing RC office buildings are mid-rise buildings (roughly 70%), which makes them of great interest on a regional level in terms of their collapse performance. Furthermore, recent research [39] has also highlighted the need to study the actual seismic performance of mid-rise RC shear-wall buildings, which are a typical structure in Chile. From the database [36], it is also noted that the equivalent floor area is independent of the number of stories for RC office buildings, with an average value of 1000 m2.
The influences of the hazard level and soil type were also assessed due to their impact on seismic design requirements, seismic hazard, and, possibly, collapse performance. Hence, two different cities, Santiago and Vina del Mar, were considered. Based on the Chilean seismic design provisions for buildings [8], Santiago and Vina del Mar are located in seismic zones 2 (moderate seismicity zone) and 3 (high seismicity zone), respectively. Furthermore, two different soil types were considered based on the Chilean seismic soil classification code [9], i.e., soil types B and D. In more detail, soil type B is fractured rock or very dense/firm soil, whereas soil type D is moderately dense/firm soil (soil type D is softer than soil type B). For the archetypes the naming convention of Bld-07-zX-sY was used, where 07 designates the number of stories, zX denotes the seismic zone (i.e., z2 or z3), and sY represents the soil type (i.e., sB or sD). For example, Bld-07-z3-sD denotes a 7-story archetype building located in seismic zone 3 on soil type D.

3.2. Structural Layout and Code-Conforming Design Procedure of the Archetype Buildings

The structural layout adopted was a minor simplification of the actual layout of a representative mid-rise office RC building. This building was selected because its geometric characteristics (i.e., height and equivalent floor area) and dimensions, as well as the arrangement of its structural elements (i.e., basement walls, shear walls, beams, and columns), were consistent with the results of the statistical survey and Chilean practices. In this sense, the archetype buildings have seven stories and three basement levels. The typical floor dimensions are 24 m × 40 m (960 m2), whereas the beam span lengths are 8.0 m. The underground levels are surrounded by 20 cm thick perimeter walls. Figure 3a shows a typical floor plan view and Figure 3b shows a typical underground floor plan view. Likewise, Figure 3c depicts the lateral transverse view and a 3D view is provided in Figure 3d.
The slabs are post-tensioned slabs with thicknesses of 22 cm and 20 cm in the underground and other levels, respectively. The story height of the underground stories and the first story is 3.50 m, whereas the story height of the remaining stories is 3.20 m. The structural system comprises two core C-shaped SWs and IMFs at the perimeter. Core walls are continuous walls from the foundation to the top. Chilean professional engineering practices and prescriptive code-based procedures were considered in the design of the archetype buildings [12]. The design was developed using the software ETABS [40], a commercial software that is used for structural design [41]. Concrete and steel bars with a nominal strength (f’c) of 35 MPa and nominal yield strength (fy) of 420 MPa, respectively, were assumed. A dead load of 2 kPa and a live load of 3 kPa were used for the underground levels, whereas 5 kPa and 2 kPa were considered for the typical stories and the roof, respectively.
The design process was based on the current Chilean seismic code NCh 433 [8], which was updated after the 2010 earthquake [9]. Therefore, the archetype buildings considered in this study are, in a strict sense, representative of post-2010 buildings. However, the statistical survey described in Section 3.1 provides data on characteristics (e.g., number of stories and floor area) that were not influenced by the 2010 earthquake. Hence, these data are representative of both pre- and post-2010 buildings and, consequently, so is the architectural layout of the archetypes.
The code-confirming design process was based on a modal response spectrum analysis. Seismic forces are provided by an elastic spectrum divided by an effective response modification factor (Reff). The initial estimate of the response modification factor (R*) depends exclusively on the building’s fundamental period, the structural system, and the soil type. If the base-shear demand, Vb, divided by the seismic weight of the building, W, (normalized base-shear demand, C) satisfies both the upper (Cmax) and lower (Cmin) limits (i.e., Cmin ≤ C ≤ Cmax), then Reff = R*. Or else, R* is modified so that Cmin ≤ C ≤ Cmax, and in this case, Reff is set equal to the modified value of R*. The relevant design factors are summarized in Table 1.
It must be noted that in the transverse direction, the seismic design of the archetypes on soil type B (i.e., Bld-07-z2-sB and Bld-07-z3-sB) was controlled by the minimum base-shear requirement (Cmin), which depends on the importance factor (equal to 1.0 due to occupation category II), seismic zone, and soil type. As explained later, the design of the remaining archetypes in the transverse direction (i.e., Bld-07-z2-sD and Bld-07-z3-sD) was controlled by the axial deformation demand on the RC core walls. Figure 4 shows the elastic and reduced code-conforming design spectra (NCh 433) for each archetype building. The vertical dashed lines indicate the fundamental period of vibration (T1) in the transverse direction (i.e., the direction of analysis). The reduced values of Sa(T1) used in the design of the structural members are indicated in each figure.
Moreover, the Design-Basis Earthquake (DBE) uniform hazard spectra (UHS) (i.e., UHS with a 10% probability of exceedance in 50 years) and elastic code (NCh 433) spectra are shown in Figure 5 for each archetype for comparison purposes. As a reference, the DBE-UHS Sa(T1) values are indicated in each figure. The UHS and elastic NCh 433 spectra of the archetype buildings on soil type B (Figure 5a,c) have similar spectral shapes but differences in the values of the spectral ordinates are evident. On the other hand, the UHS and elastic code spectra of the archetype buildings on soil type D (Figure 5b,d) have dissimilar spectral shapes but the corresponding spectral ordinates are very close to each other at the fundamental period. It is worth mentioning that the elastic spectra specified in the current Chilean seismic code [8,9] are not probabilistic in nature but calibrated for the structural demands observed in recent earthquakes (1985 and 2010 earthquakes [12]). Therefore, differences between the DBE-UHS and elastic code spectra were expected. The process used to obtain the UHS spectra is explained in Section 4.
The member dimensions are summarized in Table 2. The length of the web and flanges of the core walls are the same in all archetype buildings (see Figure 3). The corresponding thicknesses were defined so that wall densities were greater than 0.1% in all stories (common Chilean engineering practice [12]). Beams and columns were designed per the Chilean standard DS 60 [11], which refers to ACI 318-08 [42]. Perimeter frames are IMFs because they were designed for less than 25% of the story shear at all stories. As required by the current Chilean codes, boundary elements (special, SBE, and ordinary, OBE) were provided at the ends of the flanges of the core walls of all archetypes. SBEs were provided only at the first two stories below ground level and at the first three (archetypes on soil type B) and two (archetypes on soil type D) stories above ground level. As commonly implemented in Chilean practice, the thickness of the shear walls was set to be constant along the entire height. Regarding the IMFs, all beams at all stories had the same cross-section. All columns from the third underground story to the second story had the same cross-section and all columns from the third story to the top story also had the same cross-section (Table 2). It is noted that archetypes Bld-07-z2-sB, Bld-07-z2-sD, and Bld-07-z3-sB had similar member sections and, hence, similar fundamental periods (T1 values of 0.92 s, 0.84 s, and 0.91 s, respectively). On the other hand, archetype Bld-07-z3-sD had larger member sections (walls, beams, and columns) and was a significantly stiffer structure (T1 = 0.67 s).

3.3. Modeling Details

The software Perform-3D [43] was used to create the 3D mathematical models, taking into account the latest nonlinear (NL) modeling guidelines [44,45,46,47,48,49,50]. Perform-3D was chosen because it provides an adequate balance between accuracy and computational costs. Very recent studies (e.g., [51,52]) used Perform-3D to analyze RC shear-wall buildings, indicating that this software is adequate for the seismic analysis of the archetype buildings considered in this investigation. Figure 6a shows a typical Perform-3D model of the archetype buildings. The expected values of the material strength and member stiffness were considered in the structural models. The ‘shear wall’ element (Figure 6b) was used to model the shear walls because the walls were slender and had no openings. This macro-element (4 nodes and 24 degrees of freedom) is typically used in engineering practice and research studies [53,54] to model the NL response of flexure-controlled RC walls subjected to both lateral and vertical loading.
The ‘shear wall’ macro-element integrated three models to simulate the RC wall behavior: (1) a fiber-type section model, including NL steel and concrete fibers, which simulated the in-plane axial-flexural response; (2) a uniform shear layer, with a one-dimensional NL shear model that simulated the in-plane shear response; and (3) a uniform linear-elastic plate-bending model that simulated the out-of-plane response. In the ‘shear wall’ element, the bending and axial effects were coupled, whereas the bending and shear effects were not. As indicated by recent modeling recommendations [53], the NL material properties of the wall cross-section fibers were defined based on the uniaxial constitutive relationship (i.e., stress vs. strain backbone curve) YULRX (Y: yielding; U: ultimate; L: loss; R: residual; X: maximum).
As recommended by engineering practice [48], the nominal reinforcing steel and concrete strengths were multiplied by 1.17 and 1.3, respectively. Furthermore, the material cyclic response (i.e., unloading and reloading stiffnesses degradation) was included by defining an energy dissipation factor for concrete material and energy dissipation and stiffness factors for reinforcing steel material [53]. The shear layer was defined by an elastic-perfectly plastic shear stress vs. shear-strain backbone curve that considers the potential nonlinear shear behavior of the walls. The expected shear strength of the walls was set to 1.5 times the nominal shear strength, as defined by ACI 318-08 [42], whereas the effective shear stiffness was set to 10% of the uncracked shear stiffness (Gceff A = 0.1 Gc A, where Gc = 0.4 Ec, A is the cross-section, and Ec is the elastic modulus) [45]. This procedure is an indirect way to consider shear cracking because the shear-wall element captures neither nonlinear shear deformations nor coupling with nonlinear flexural deformations under cyclic loading. Figure 7 presents examples of the constitutive functions of the concrete and steel fibers of the core walls of archetype Bld-07-z3-sD.
It is important to note that the concrete materials (both confined and unconfined) incorporated regularization derived from the theory of constant compressive crushing energy [55]. The effect of regularized materials for confined and unconfined uniaxial YULRX curves was exemplified for the SBEs and OBEs (Figure 7a and Figure 7b, respectively). For reinforcing steel fibers, the steel materials indirectly incorporated the buckling of steel bars for when the cover concrete material reaches the crushing point (i.e., R in YULRX curve), as shown in Figure 7c. The shear layer constitutive relationships are shown in Figure 7d. The results of the experimental tests of slender walls with different types of cross-sections (planar [56] and T-shaped [57]) were used to validate the number of shear-wall elements per story, the material regularization, and the number of fibers in the cross-sections, among other modeling aspects. This validation, not presented here for brevity, was essentially identical to that performed in previous studies [45,53,58].
Beams and columns were modeled using ‘frame-type’ elements (see Figure 6c) with fiber-based plasticity regions of length Lp at both ends and a linear-elastic region in between. YULRX backbone functions were also adopted to represent the uniaxial stress–strain relationships between steel and concrete materials. Length Lp was determined following recommendations found in the literature [59] (Lp = 0.5 h, where h is the depth of the element). Geometric nonlinearity was also implemented to consider the P-delta effects in the columns and walls. As indicated in previous studies [60,61], long-span post-tensioned slabs in core-wall buildings were considered so as not to substantially affect the building response. Thus, these elements were not explicitly modeled. In its place, rigid diaphragms were implemented at all floor levels and the self-weight and mass of the slabs were incorporated into the models. Lastly, energy dissipation was mostly modeled directly by the hysteretic force–deformation response of the structural components. Modal damping was set to 2.4% for all modes and the additional Rayleigh damping was set to 0.1% at 0.2 T1 and 1.5 T1 [43,44].

3.4. Seismic Collapse Criteria

Predictions of seismic collapse require the identification of all possible collapse modes and the evaluation of structural seismic collapse through simulated and non-simulated collapse modes. Figure 8 schematizes the collapse criteria adopted in the analyses.
The simulated failure criteria considered the local response parameters derived from the axial-bending demands on the walls. Collapse due to fracture of the reinforcement bars was assumed to occur when the tensile strains in the longitudinal reinforcement exceed 0.05, as indicated by Gogus and Wallace [17]. Moreover, collapse due to longitudinal reinforcement buckling and concrete crushing was assumed to occur when the concrete compressive strains exceed the crushing limit (the point where the post-peak descending branch of the concrete stress–strain curve reaches 20% of the peak stress of the confined concrete or 0.1% of the peak stress of the unconfined concrete [17]). In the case of non-simulated criteria, on the other hand, collapse is related to either axial wall failure or slab-column failure. As indicated by Kim and Foutch [62], slab-column failure was assumed to occur when a story drift ratio (SDR) exceeds 5% at any story. In addition, axial wall failure was assumed to occur when the roof drift ratio (RDR) exceeds 5% [17]. Other collapse measures, such as numerical instability or excessive increases in story drift demands for small increases of the ground motion IM (Sa(T1)), were not detected.

3.5. Pushover Analyses

Initially, pushover analyses (nonlinear static analyses) were implemented to evaluate the seismic response of each archetype building in terms of strength, stiffness, and the type and location of the damage. First, the gravitational loads (100% of dead loads plus 25% of live loads) were applied. Second, a first-mode lateral force pattern, as recommended by ASCE 41-17 [63], was applied in the transverse direction (i.e., the same direction along which the NLRH analyses were performed), both positive and negative. Figure 9 shows the pushover curves of the archetype buildings, along with some points of interest.
In more detail, Figure 9a,b show the pushover curves in terms of the base shear versus the roof displacement, whereas Figure 9c,d present the same curves in terms of the base0shear coefficient (i.e., base shear divided by the structural weight) versus the RDR. The base shear Vb was evaluated at the ground level (see Figure 3) and normalized by the seismic weight of the stories above. The capacity curves in the positive direction were not equal to those in the negative direction due to the asymmetric plan layout of the core walls (see Figure 3a). Moreover, Figure 9 depicts some points of interest: (1) the first fiber at any wall that reached steel yielding, concrete crushing, shear strength, and steel fracture; and (2) the SDR reaching 5% at any story.
The pushover curves show some interesting features. Firstly, archetype Bld-07-z3-sD had considerably more stiffness and strength than the other archetypes, likely because of the increased cross-sections of the shear walls, beams, and columns. Secondly, in all cases, the maximum base-shear capacity (Vmax) was reached at roughly the same value of the RDR (≈1.5~2.0%). Finally, there was always a clear drop in strength after the first concrete crushing when the seismic loads were applied in the positive direction. It is interesting to note that this first concrete crushing occurred at the SBEs of the walls located at the first story, where the shear and moment demands were expected to be more significant, and at RDR values higher than 2.5% (i.e., excessive drift demands).
The overstrength factor (Ω), i.e., the ratio of Vmax to the design base shear Vdes, was calculated. Table 3 summarizes the pushover analysis results, where the ratios of Vdes (also above ground level) and Vmax to the seismic weight are also shown. Along the positive transverse direction, the Ω+ values ranged from 2.4 to 4.4, with an average value of 3.3. Along the negative transverse direction, on the other hand, the Ω values ranged from 2.5 to 3.7, with an average value of 3.0. Again, the high values of Vmax for archetype Bld-07-z3-sD (2918 tonf for Vmax+, and 3149 tonf for Vmax−) were consistent with the larger cross-section dimensions of the structural members, resulting in an archetype that had more strength.
Referring to the location of the damage, the first nonlinear incursions of the concrete and steel fibers of the shear-wall elements appeared at the stories immediately above and below ground level. As expected, these stories were among the stories where the seismic code requires the inclusion of SBEs. As previously mentioned, when pushover was applied in the positive direction (i.e., boundary elements of the walls in compression), the first concrete crushing in the boundary elements was observed to occur at the first story, where the shear and moment demands were expected to be more significant. An example (archetype Bld-07-z2-sB) of this behavior can be seen in Figure 10, where the concrete fiber strains of SBEs are shown for two RDR values (1.5% in Figure 10a and 3.0% in Figure 10b). In addition, a schematic representation of the uniaxial constitutive relationship ‘YULRX’ is depicted in Figure 10c, where the colors represent the aforementioned regions of interest.

4. Seismic Hazard Analyses and Selection of Subduction Ground Motions

4.1. Seismic Hazard Analyses

Probabilistic seismic hazard analysis (PSHA) was used to integrate the rupture scenarios defined in a recent Chilean seismic source model (SSM) with current Chilean ground-motion models (GMMs). The seismicity model defined by Poulos et al. [64] and the GMMs proposed by Montalva et al. [65] and Idini et al. [66] were integrated into the computational platform SeismicHazard [67] to assess the PHSA. Calculations were performed incorporating the GMM epistemic uncertainties using a logic tree with equal weights of 1/2. Figure 11a depicts the calculated seismic hazard curves in terms of the Sa(T1) versus the mean annual frequency of exceedance, λSa(T1), and Figure 11b depicts the Sa(T1) versus the mean return period, Tr. Horizontal lines are also drawn to represent the traditional λSa hazard levels related to return periods of 2475, 475, and 72 years, i.e., the maximum considered earthquake (MCE), design-basis earthquake (DBE), and service-level earthquake (SLE), respectively.
The Sa(T1) values for the different hazard levels are presented in Table 4, along with the values of both the Chilean code elastic design spectra, Sa(T1)des,e, and the reduced design spectra, Sa(T1)des,red, (see Figure 4). It is noted that there were relatively small differences in terms of the Sa(T1)SLE, Sa(T1)DBE, and Sa(T1)MCE values between the archetypes on soil type B (i.e., Bld-07-z2-sB and Bld-07-z3-sB), which had very similar values of T1. On the other hand, the Sa(T1) values for the archetype Bld-07-z3-sD were almost 1.5 times higher than those for archetype Bld-07-z2-sD, indicating a considerable increase in seismic demand. It is interesting to note that the values of Sa(T1)des,e were different from those of Sa(T1)DBE. These differences were expected because the elastic design spectra of the Chilean seismic design code NCh 433 [8,9] are not uniform-hazard spectra. In addition, the Chilean code does not explicitly define the SLE and MCE hazard levels. These levels were defined as indicated in ASCE 7-22 [10].
For comparison purposes, Table 4 also shows the probability of exceedance in 50 years and the related return period of the spectral ordinates Sa(T1)des,e (i.e., spectral ordinates of the Chilean code elastic design spectra). For the archetypes on soil type D, the probabilities of exceedance in 50 years were nearly 10% (Tr ~475 years), which is a worldwide standard for the DBE hazard level. For the archetypes on soil type B, on the other hand, the probabilities of exceedance in 50 years were higher than 22% (Tr ~200 years). In other words, the hazard level associated with the elastic design NCh 433 spectra for soil type B was smaller than that associated with the DBE. These observations are consistent with the previous results shown in Figure 5.

4.2. Selection of Ground Motions

Special care was taken to obtain sets of Chilean subduction ground motions consistent with the IM-based seismic hazard at different sites of different seismicity levels and different soil types. First, from the hazard curves obtained in the preceding section, uniform hazard spectra (UHS) were calculated at different levels of seismic hazard. A single UHS represents the acceleration spectral values for the same probability of exceedance (uniform) in a given exposure time (50 years, commonly used). For each site–soil case, the UHS with a 10% probability of exceedance in 50 years (DBE hazard level) was constructed based on the hazard curves obtained from the ‘SeismicHazard‘ platform [67] (see Figure 5). Then, the UHS with a 2% probability of exceedance in 50 years was constructed. For each archetype, a Conditional Spectrum (CS) was rigorously constructed and defined as a target spectrum in this study. The approach proposed by Baker [68] was adopted to define the hazard-consistent target Sa(T) distribution (with conditional mean and conditional standard deviation at each period within the range of interest). The CS calculations considered the target Sa(T1) for the 2%—50-year hazard level and the mean causal magnitude M, distance R, and epsilon ε obtained from the PSHA deaggregation, where each GMM was considered separately. The mean and standard deviation of logarithmic Sa(T) also considered the correlation model proposed by Candia et al. [69] for the Chilean subduction zone, where the correlations are generally higher than those for other subduction zones such as Japan. Finally, single GMM calculations were combined using assumed logic-tree weights, following method 2, which was suggested by Lin et al. [70], to obtain the composite CS of each case. Although logic-tree weights are not rigorously correct, it was considered a convenient approximation for this investigation.
Using the Chilean strong motion database ‘SIBER-RISK’ [71], for each archetype, a hazard-consistent ensemble of 44 subduction ground motions (a typical number of records used in research [41]) was selected and scaled to match the target mean, variance, and correlations of the spectral acceleration values, Sa(T), at a period between 0.2 T1 and 2.0 T1, following the procedure proposed by Baker and Lee [72]. Since NLRH analyses of the 3D archetypes were performed only in the transverse direction, each ground motion was a horizontal component. Following current selection guidelines [16,73], these components met the selection criteria and the objectives of consistency, representativeness, and statistical sufficiency to permit the statistical evaluation of the RTR variability in the structural response. To avoid bias in the probability of collapse when Sa(T1) was used as the IM, the amplitude scaling factor that modifies the ground motions to achieve the desired intensity level was limited to a maximum value of 5.0, as suggested by recent studies [74,75] where the spectral shape was appropriately accounted for in the selection process.
Following this procedure, 4 different sets of 44 GM records were selected and scaled (i.e., a set for each archetype), which were consistent with the respective deaggregated M, R, ε, and soil type. Figure 12 shows the spectra, mean, and dispersion of the four ground motion sets (one for each archetype building) and the respective target composite CS. The dispersion of the spectral ordinates, Sa(T), was higher for archetypes on soil type D (Figure 12b,d) than for those on soil type B (Figure 12a,c). This variability was inherited from the Chilean GMMs used in the PSHA and may impact the variability of the structural response.

5. Response and Collapse Assessment Results

5.1. IDAs, Collapse Fragility Functions, P(C|Sa(T1)MCE), and CMR

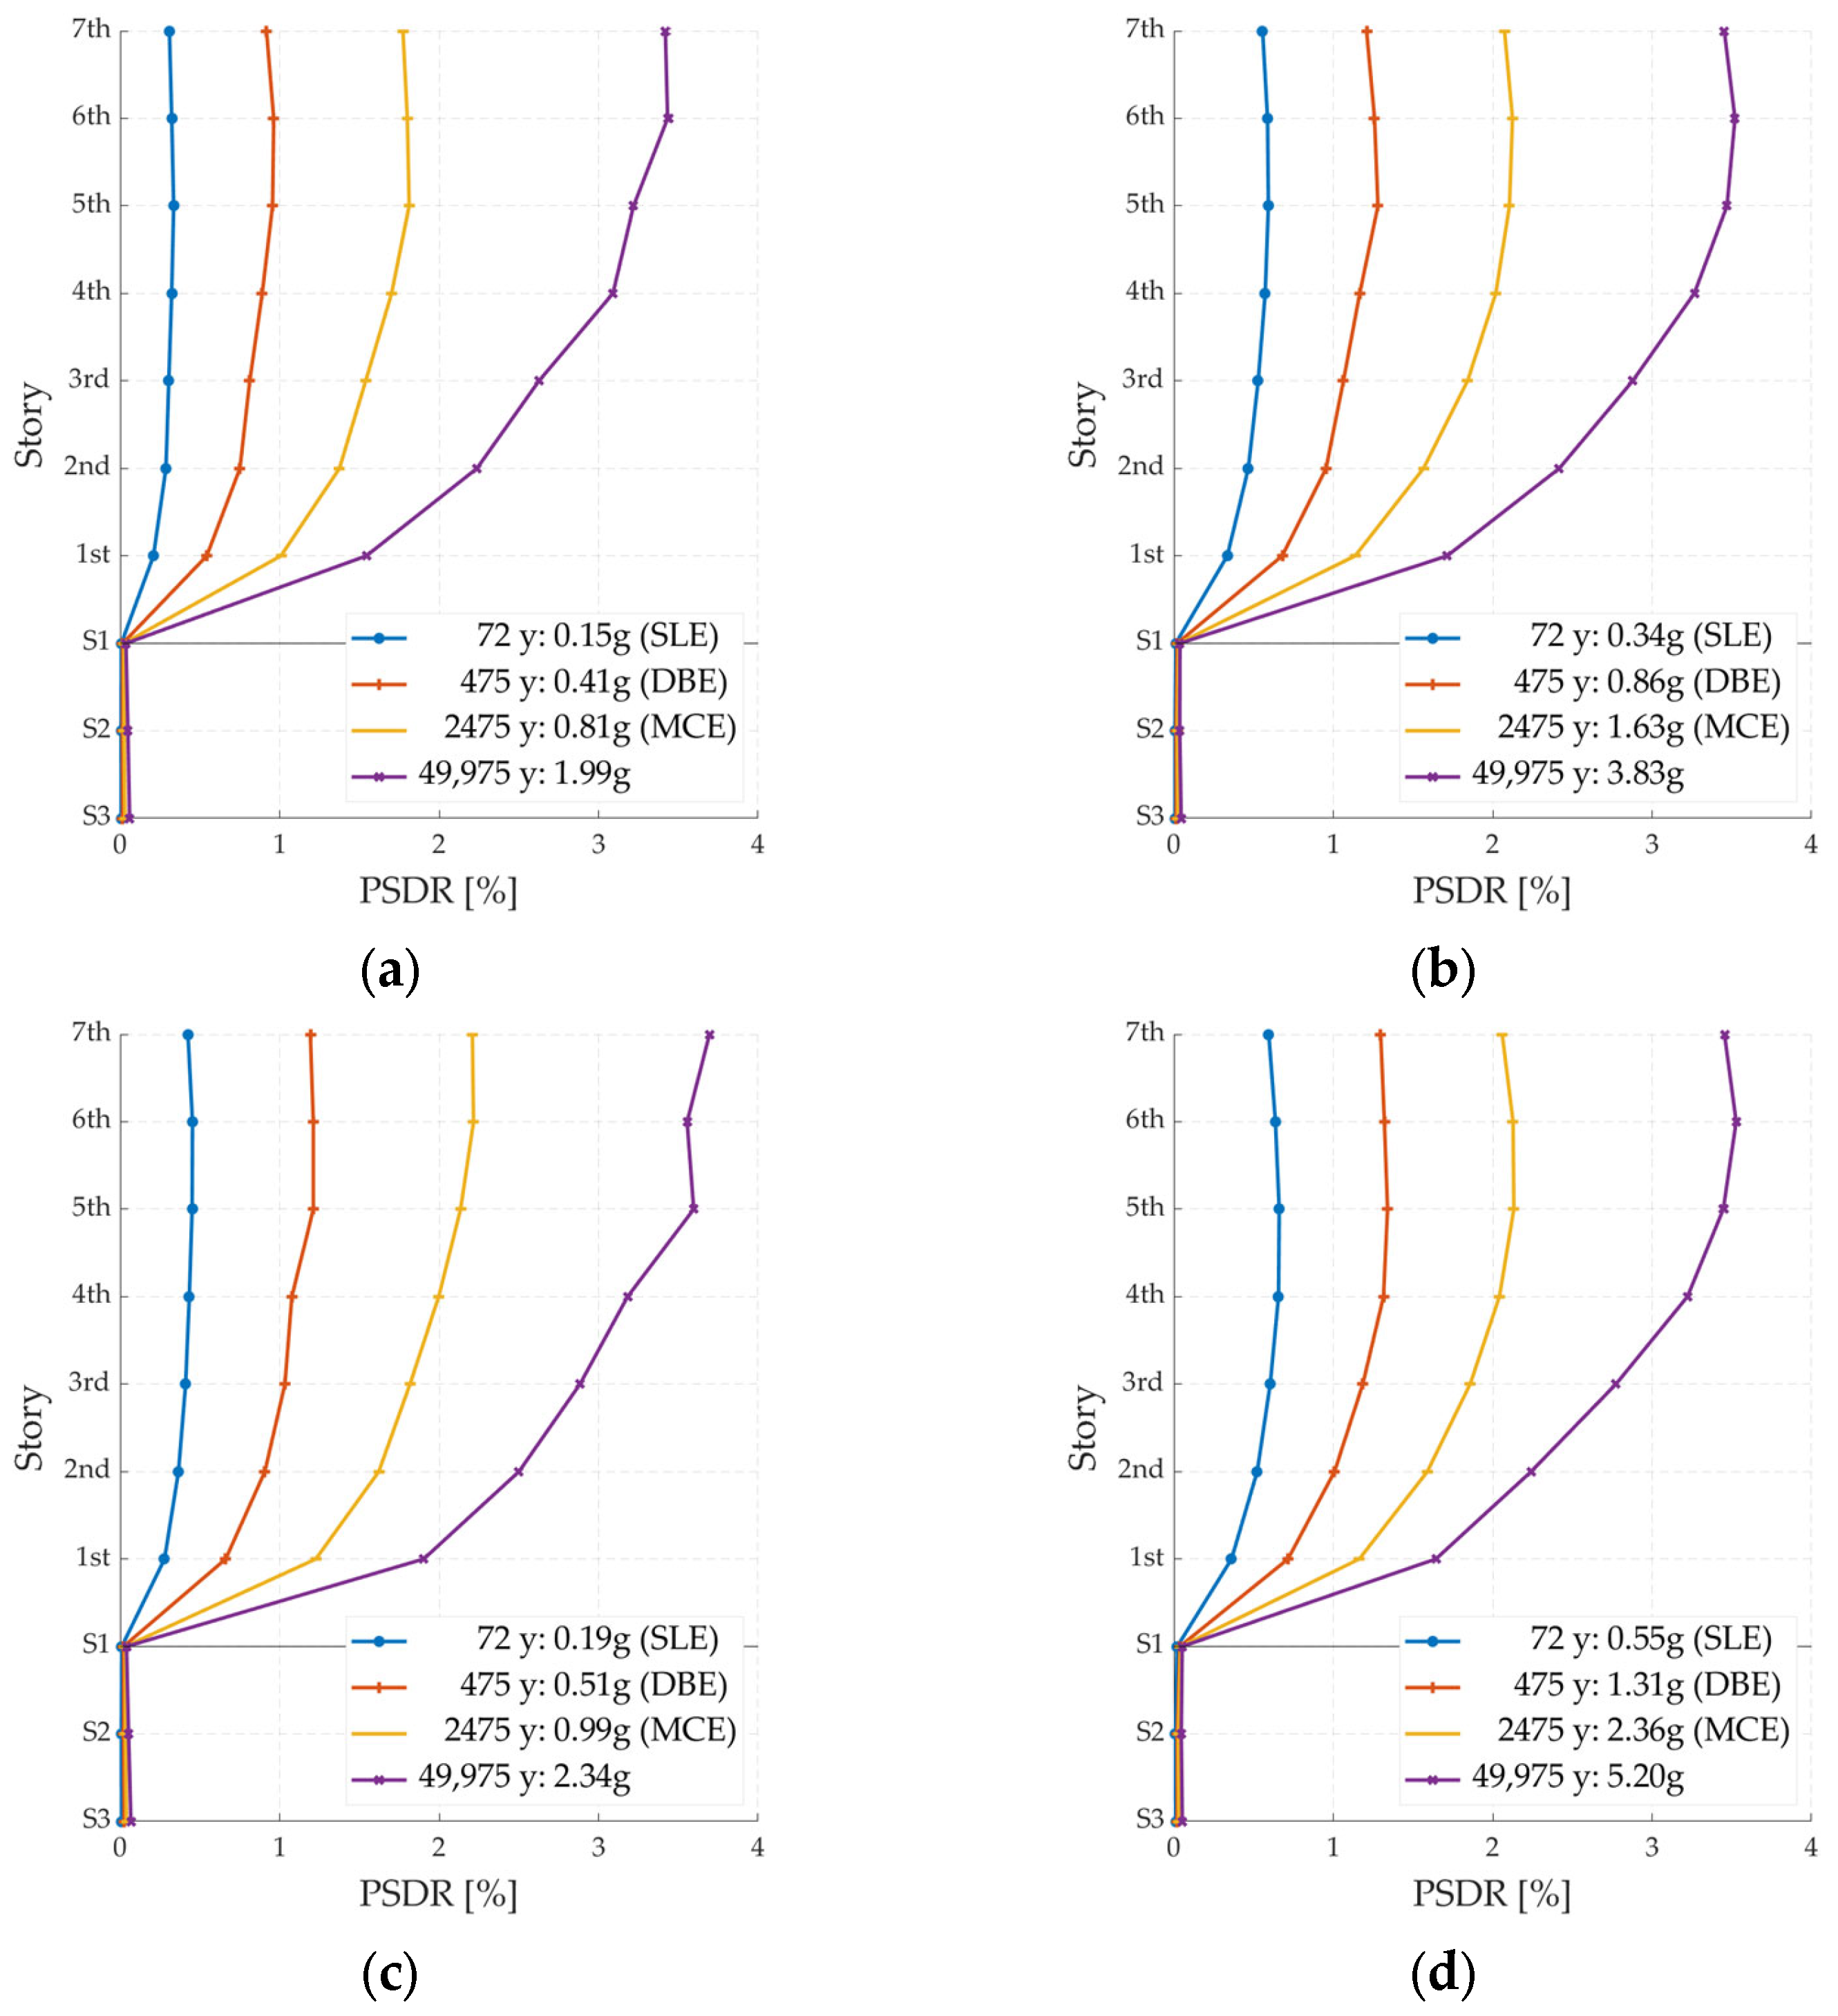
The results from the structural analyses are summarized in Figure 13, which shows the median Peak Story Drift Ratios (PSDRs) considering different intensity levels. As a reference, the three main intensity levels (i.e., MCE, DBE, and SLE) are explicitly indicated in the legends with the corresponding values of the Sa(T1) level. As expected, the median PSDRs increased with an increasing return period (i.e., increasing hazard level). For comparison purposes, the response for a ~50,000-year return period is also presented. Although this is an extremely large return period, the corresponding Sa(T1) values were close to the median Sa(T1) collapse values (units of gravity, g) that are presented later.
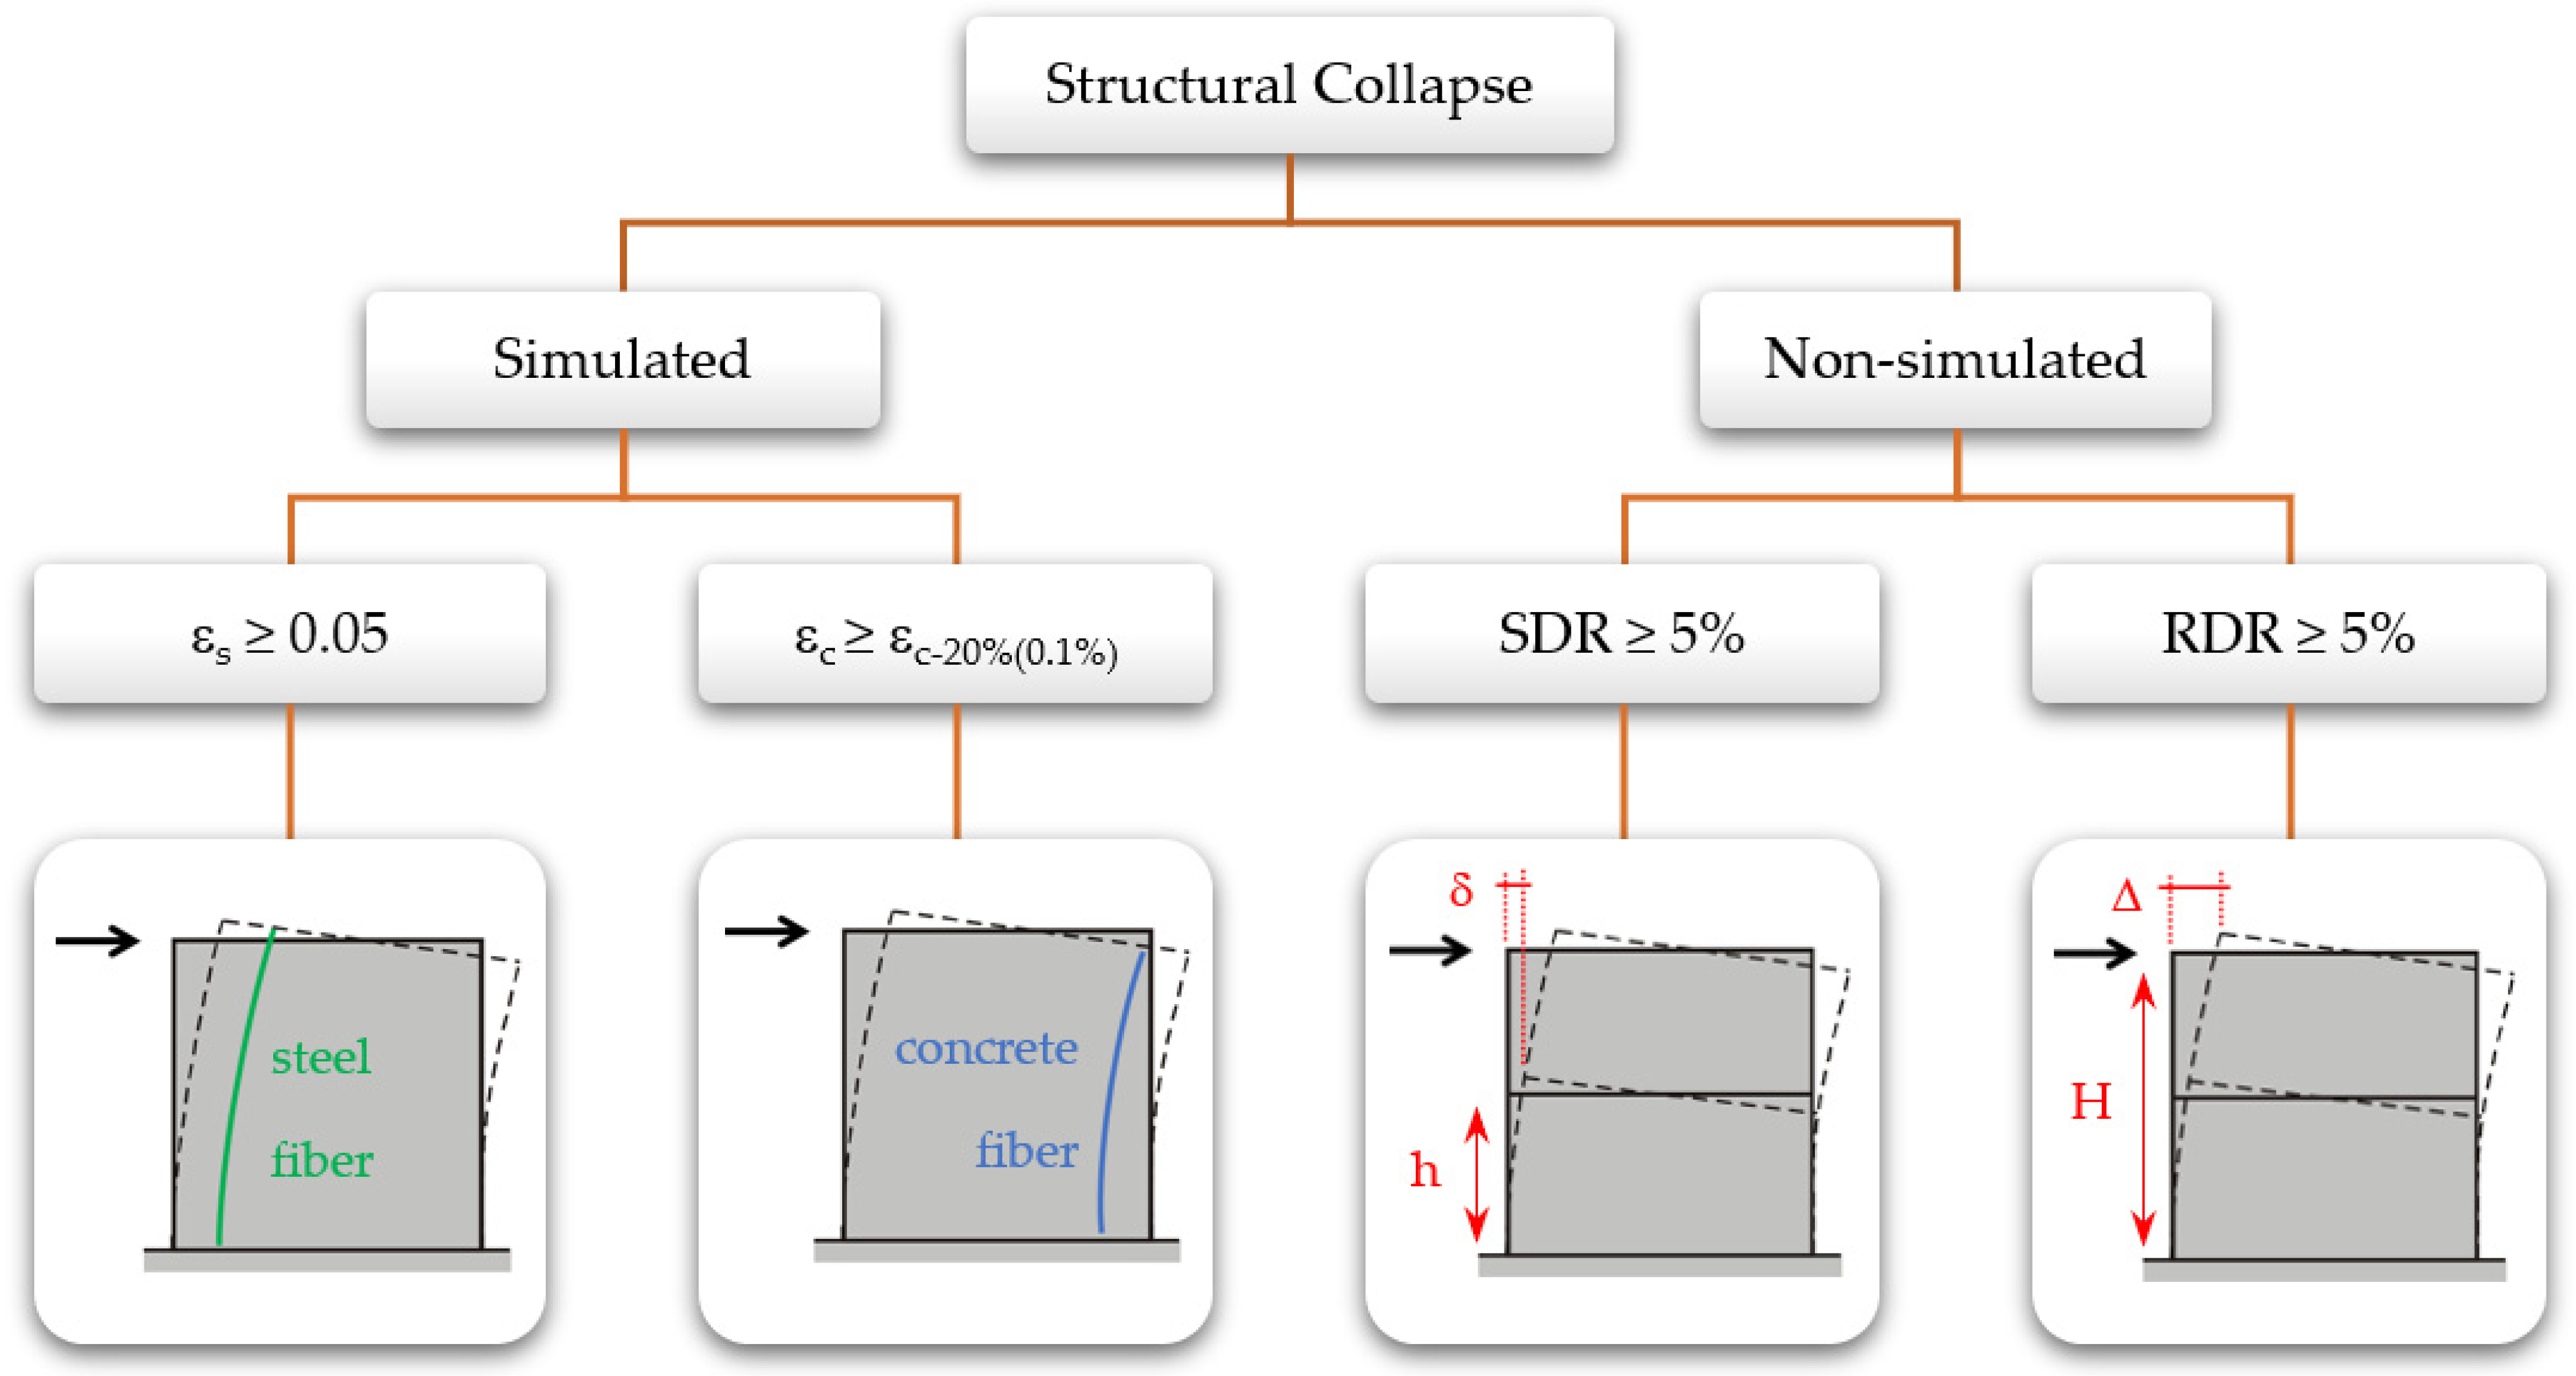
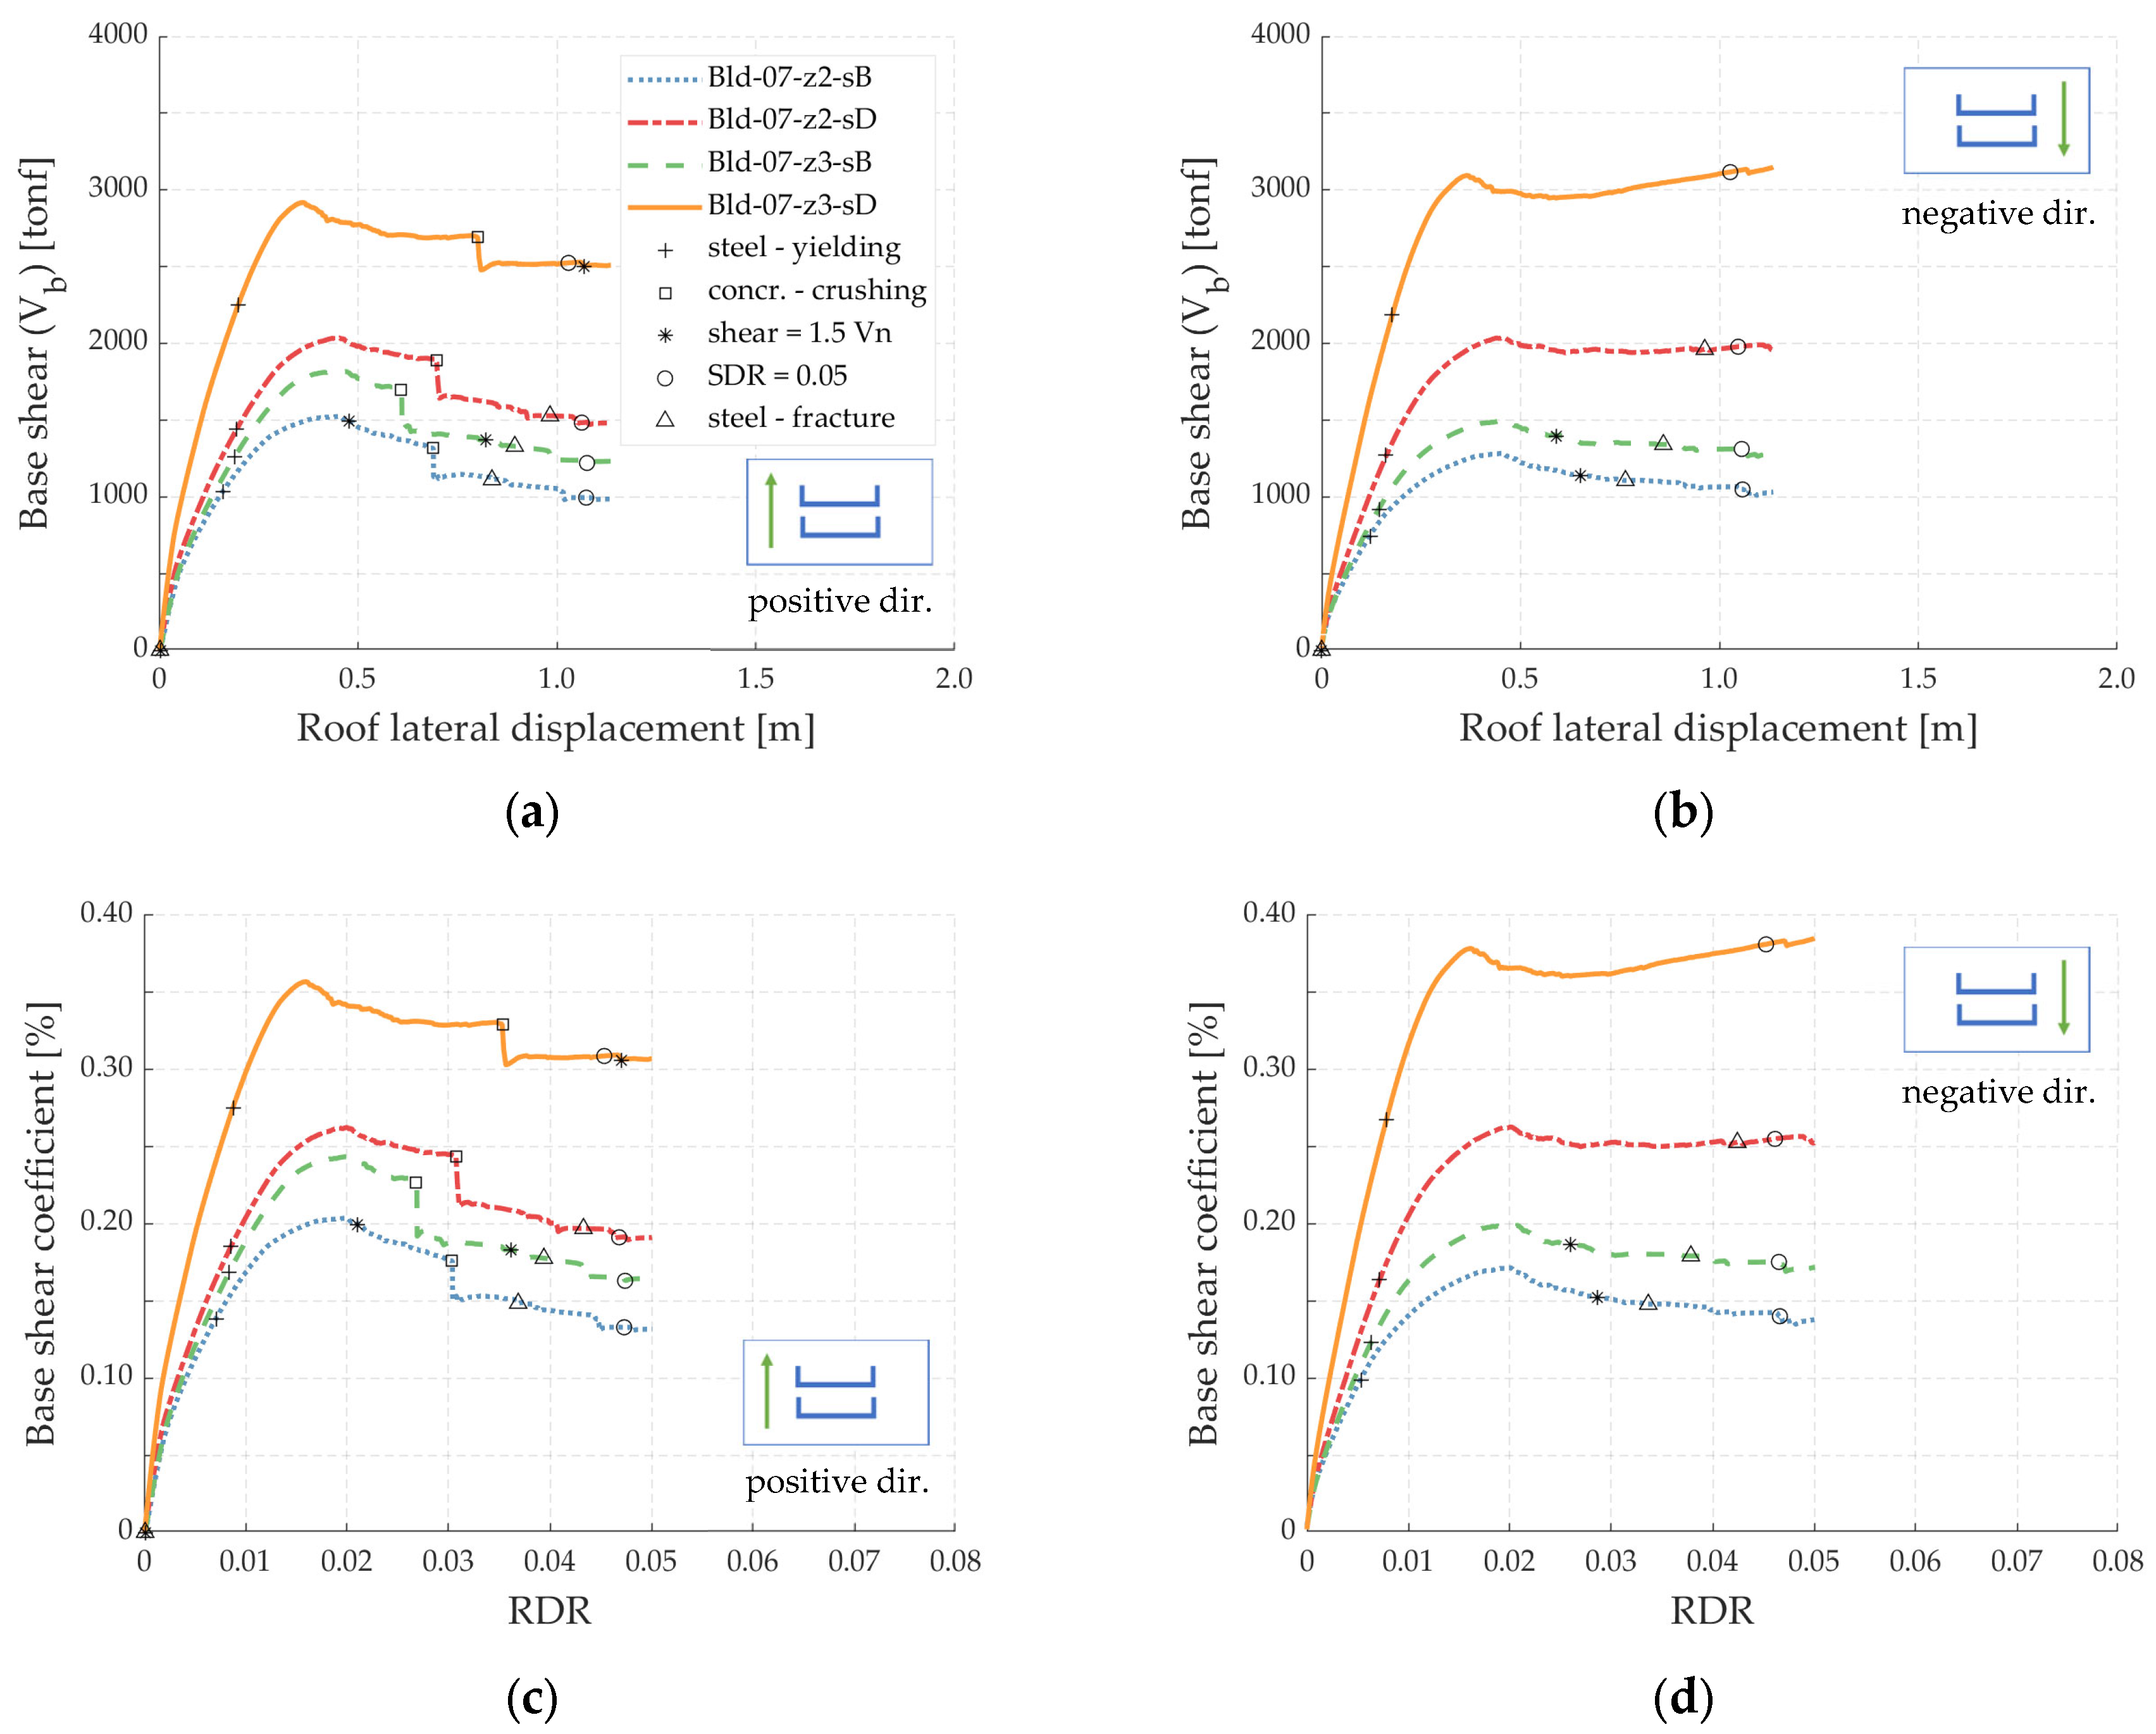
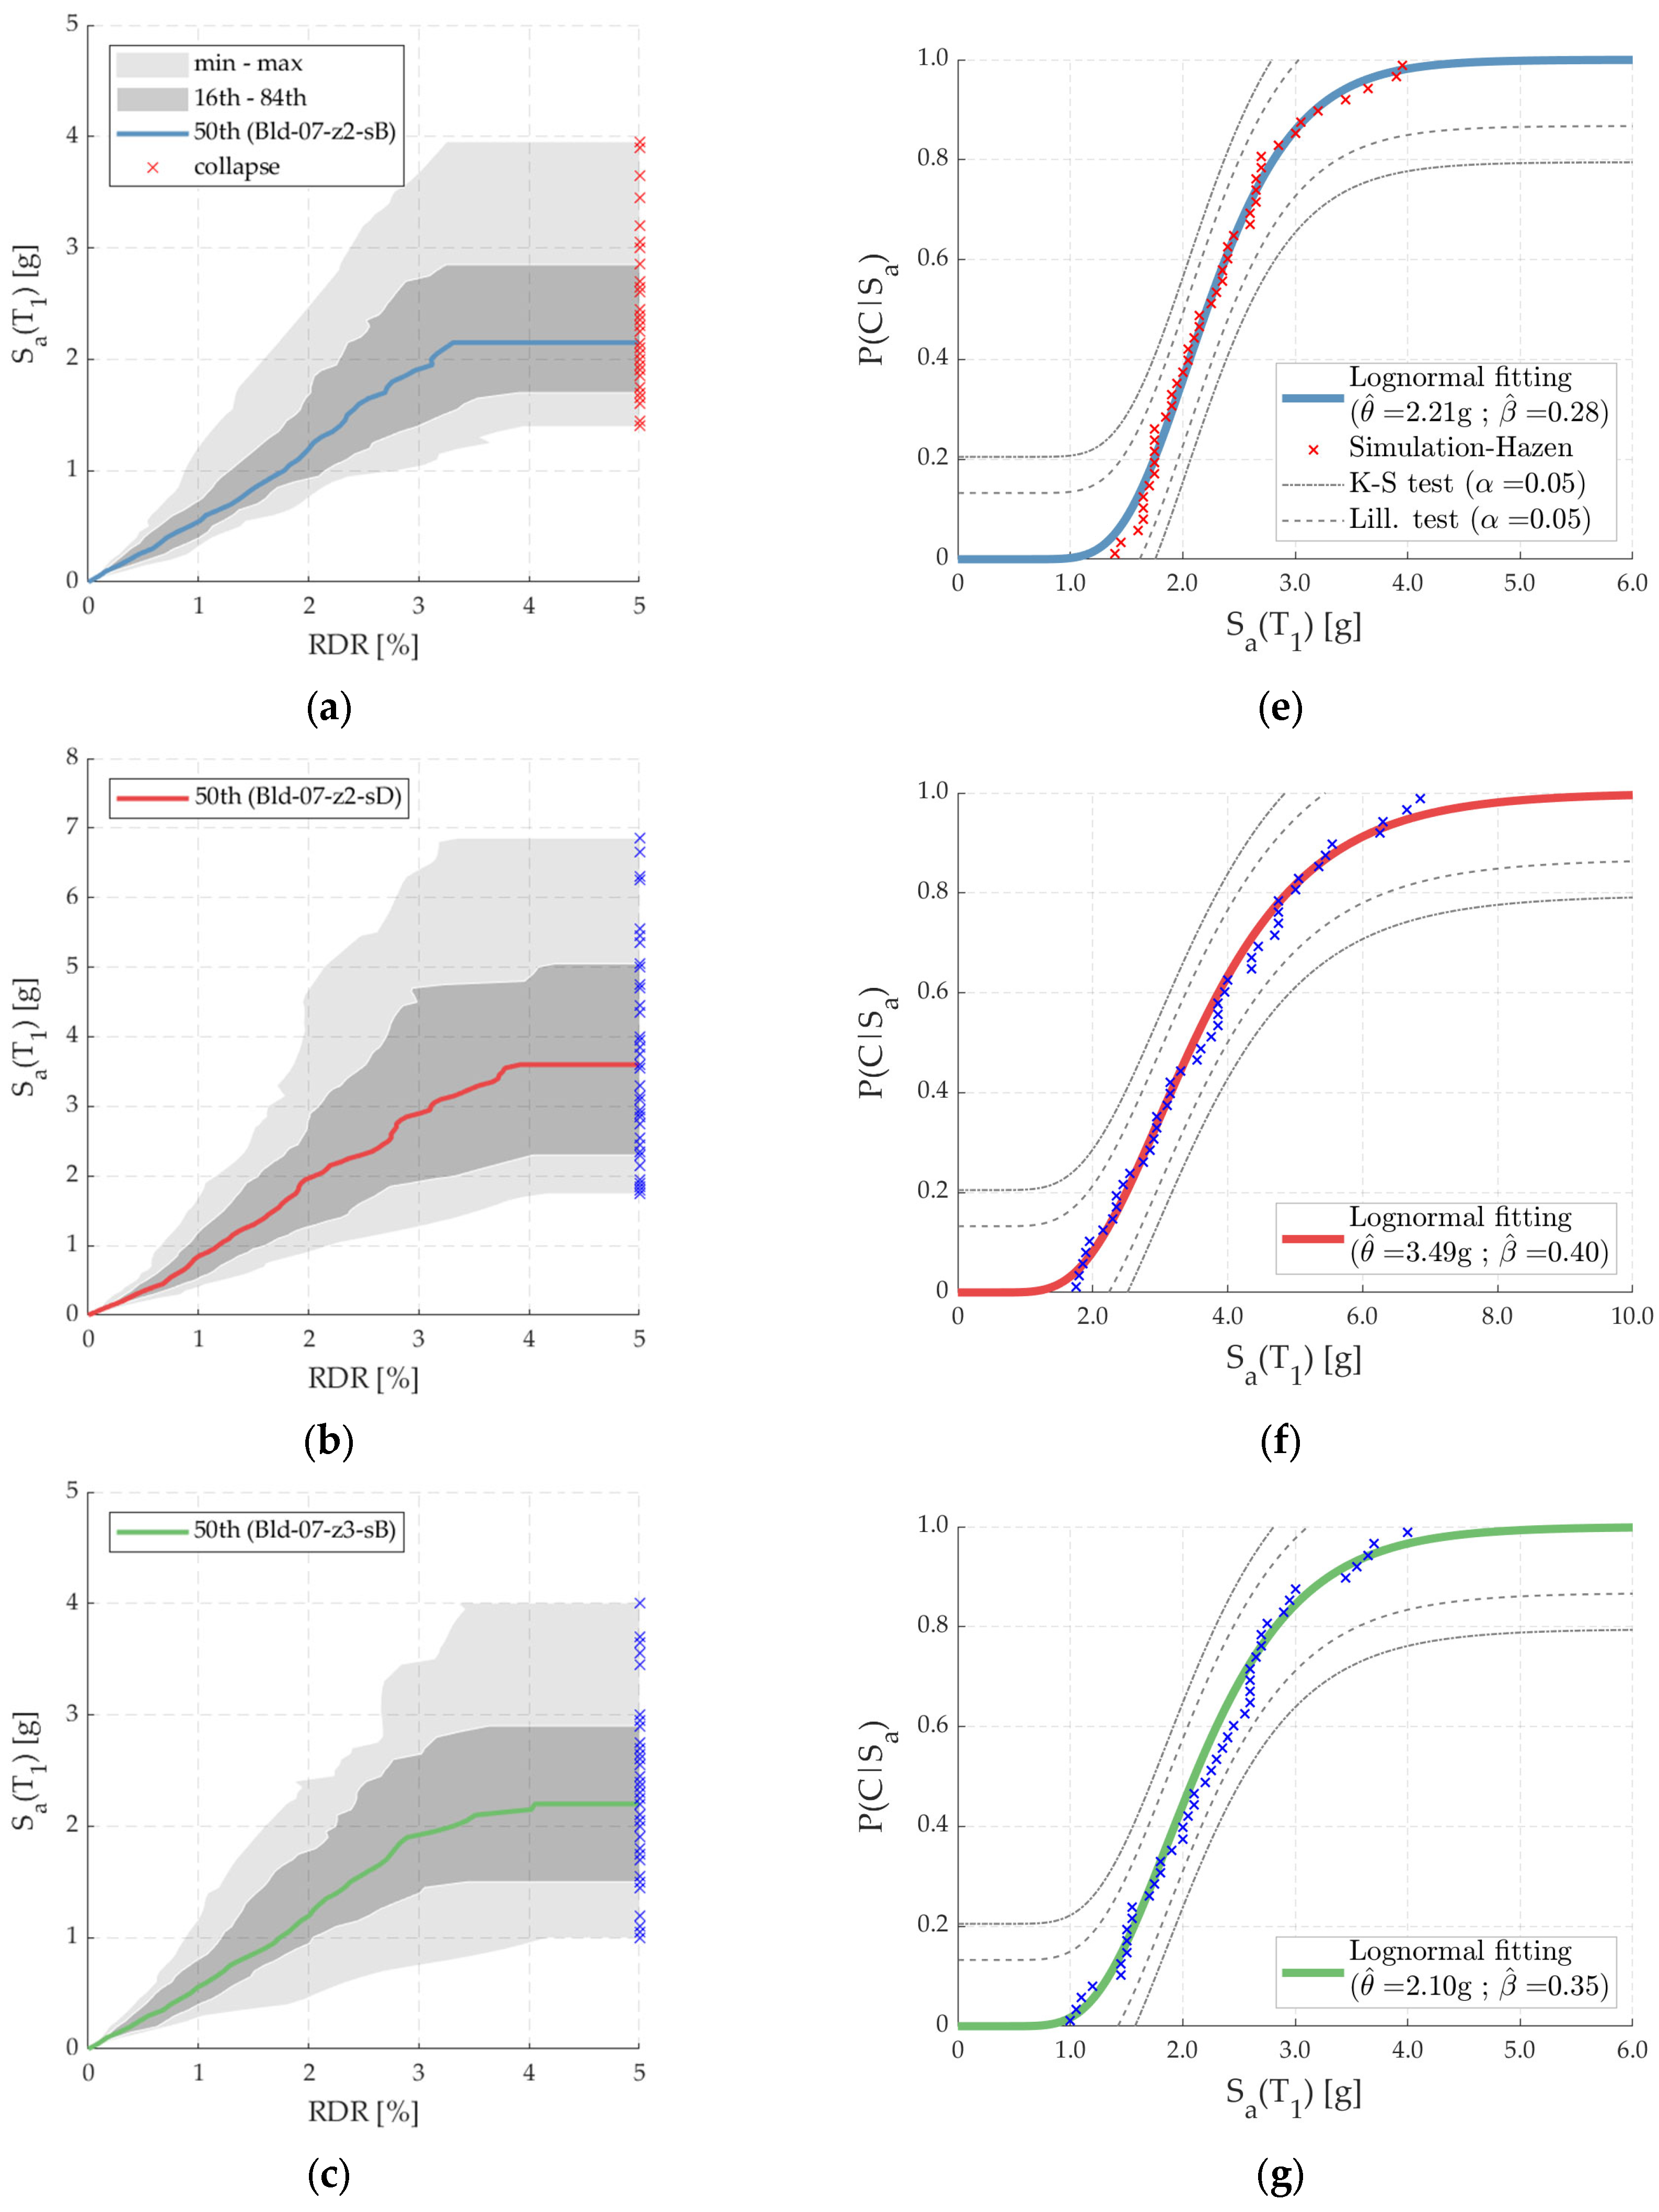
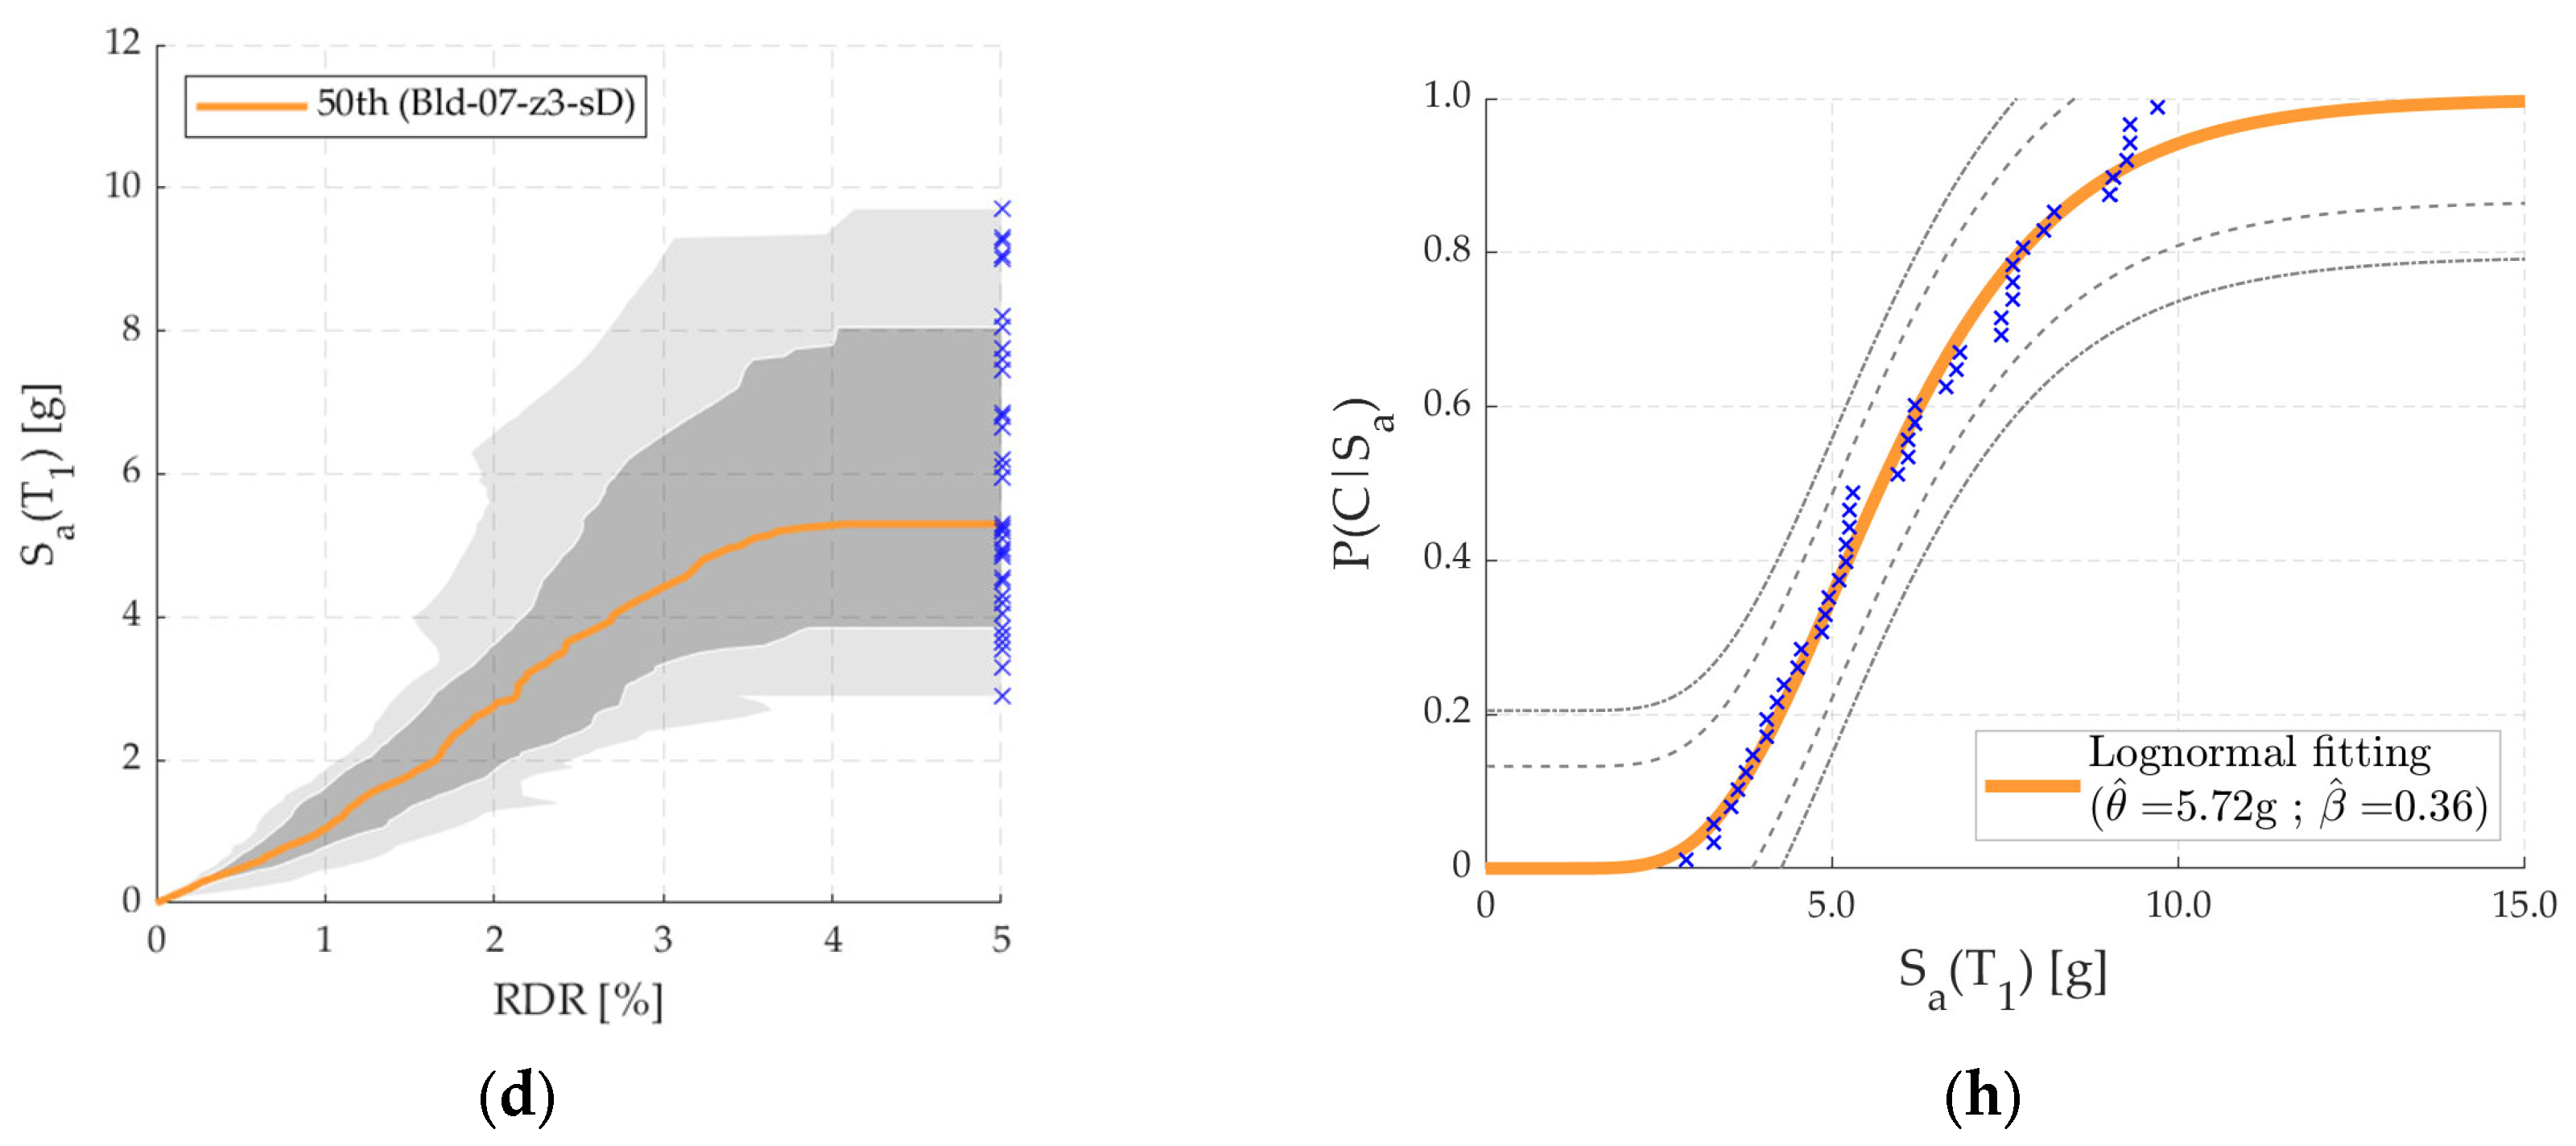
For each archetype, the Sa(T1) values that triggered a collapse and the collapse mode (i.e., either simulated or non-simulated) were identified and recorded for each ground motion. The collapse modes were found to depend on the archetypes. For instance, more than 60% of collapses of archetypes Bld-07-z2-sB, Bld-07-z3-sB, and Bld-07-z2-sD were due to local collapse criteria. Concrete crushing and, at the same time, steel buckling at the wall boundary elements when the buildings were loaded in the positive transverse direction (i.e., boundary elements in compression) were mostly observed. On average, 40% of collapses occurred in the negative transverse direction (i.e., boundary elements in tension) due to the global collapse criteria (SRD ≥ 5%). On the other hand, 70% of the collapses of archetype Bld-07-z3-sD were due to the global collapse criteria (in either the negative or positive transverse direction).
Figure 14 shows the collapse assessment results. For brevity, the IDA curves present information about one of the EDPs (i.e., RDR) as an indicator of the global structural seismic response. In more detail, Figure 14a–d show the IDA results for each building, plotted as the RDR values against the Sa(T1) values. The figures also present the 50th collapse percentile (median), as well as the 16th and 84th collapse percentiles (equal to one logarithmic standard deviation below and above the mean when a lognormal distribution is assumed). Moreover, Figure 14e–h shows the estimated lognormal collapse fragility curves and the values of the Sa(T1) collapse intensity.
These figures also exhibit both the estimated median ( θ ^ ) and dispersion ( β ^ ) values (obtained using the MLM) and the results of the K–S and Lilliefors goodness-of-fit tests, both at a 5% significance level. The fragility functions passed both tests, indicating a proper representation of the Sa(T1) collapse intensity data. In more detail, seismic zone 2 Bld-07-z2-sB had Sa(T1) collapse values that ranged from 1.40 g to 3.95 g, with θ ^ = 2.21 g, whereas Bld-07-z2-sD had Sa(T1) collapse intensity values ranging from 1.75 g to 6.85 g, with a greater θ ^ of 3.49 g. On the other hand, seismic zone 3 Bld-07-z3-sB exhibited Sa(T1) collapse values that ranged from 1.00 g to 4.00 g, with θ ^ = 2.10 g, whereas Bld-07-z3-sD exhibited Sa(T1) collapse intensities ranging from 2.90 g to 9.70 g, with a significantly greater θ ^ of 5.72 g. In particular, the θ ^ results were consistent with the seismic design code strength requirement (i.e., θ ^ = 2.21 g for Bld-07-z2-sB (Vbdes = 0.05 W) was smaller than θ ^ = 5.72 g for Bld-07-z3-sD (Vbdes = 0.10 W)).
In terms of dispersion, the archetype buildings had quite similar values of β ^ , which were less than 0.40. Dispersion values of 0.28, 0.40, 0.35, and 0.36 were estimated for archetypes Bld-07-z2-sB, Bld-07-z2-sD, Bld-07-z3-sB, and Bld-07-z3-sD, respectively. Although the dispersion of the Sa(T1) collapse values seemed to be rather high, the estimated values of β ^ were either equal to or smaller than those recommended by FEMA P-58 [13].
The estimated values of θ ^ and β ^ as well as the results of the goodness-of-fit tests, are presented in Table 5. In terms of the effect of the seismic zone, the θ ^ value of archetype Bld-07-z2-sB (stiff soil, moderate seismic activity) was slightly higher than that of archetype Bld-07-z3-sB (high seismic activity, also stiff soil), whereas the θ ^ value of archetype Bld-07-z2-sD (moderate seismic activity, moderately stiff soil) was smaller than that of archetype Bld-07-z3-sD (high seismic activity, moderately stiff soil). In other words, there was no clear relationship between the level of seismic activity and θ ^ . The effect of the soil type was more relevant on the archetype buildings located in seismic zone 3 ( θ ^ = 2.10 g for Bld-07-z3-sB and θ ^ = 5.72 g for Bld-07-z3-sD) than on those located in seismic zone 2 ( θ ^ = 2.21 g for Bld-07-z2-sB and θ ^ = 3.49 g for Bld-07-z2-sD).
Based on the results shown in Table 5 it can be stated that (i) the values of β ^ for archetype buildings located on soil type D were greater than those for archetype buildings located on soil type B, and (ii) there was no clear relationship between the β ^ values and the seismic zone. Additionally, the effect of the soil type seemed to be more relevant than that of the seismic zone. Higher values of β ^ for archetype buildings located on soil type D could be the result of a greater dispersion of the CS spectral ordinates, as mentioned in Section 4.2.
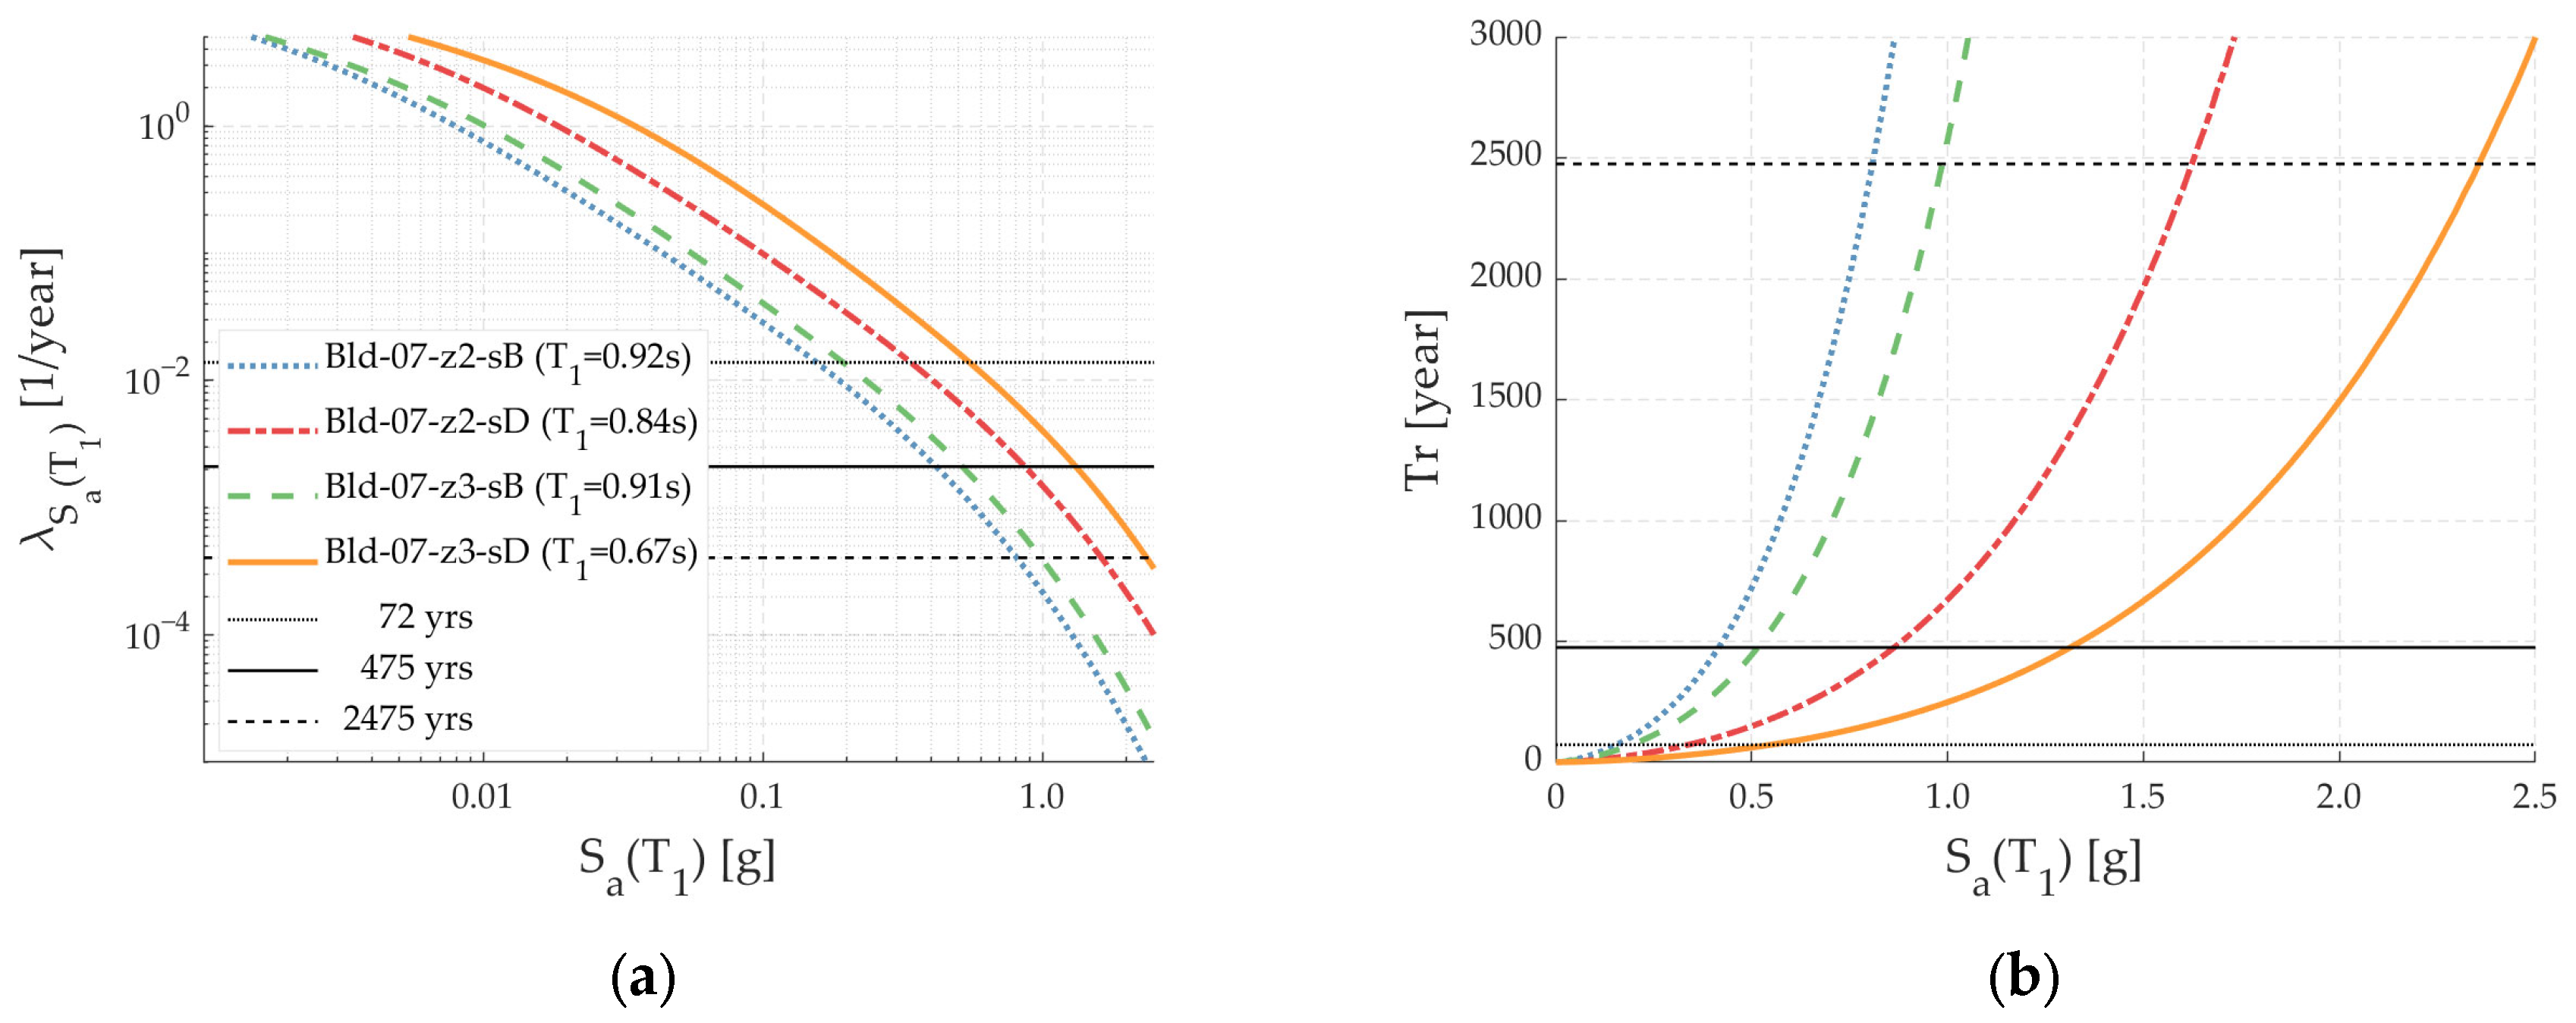
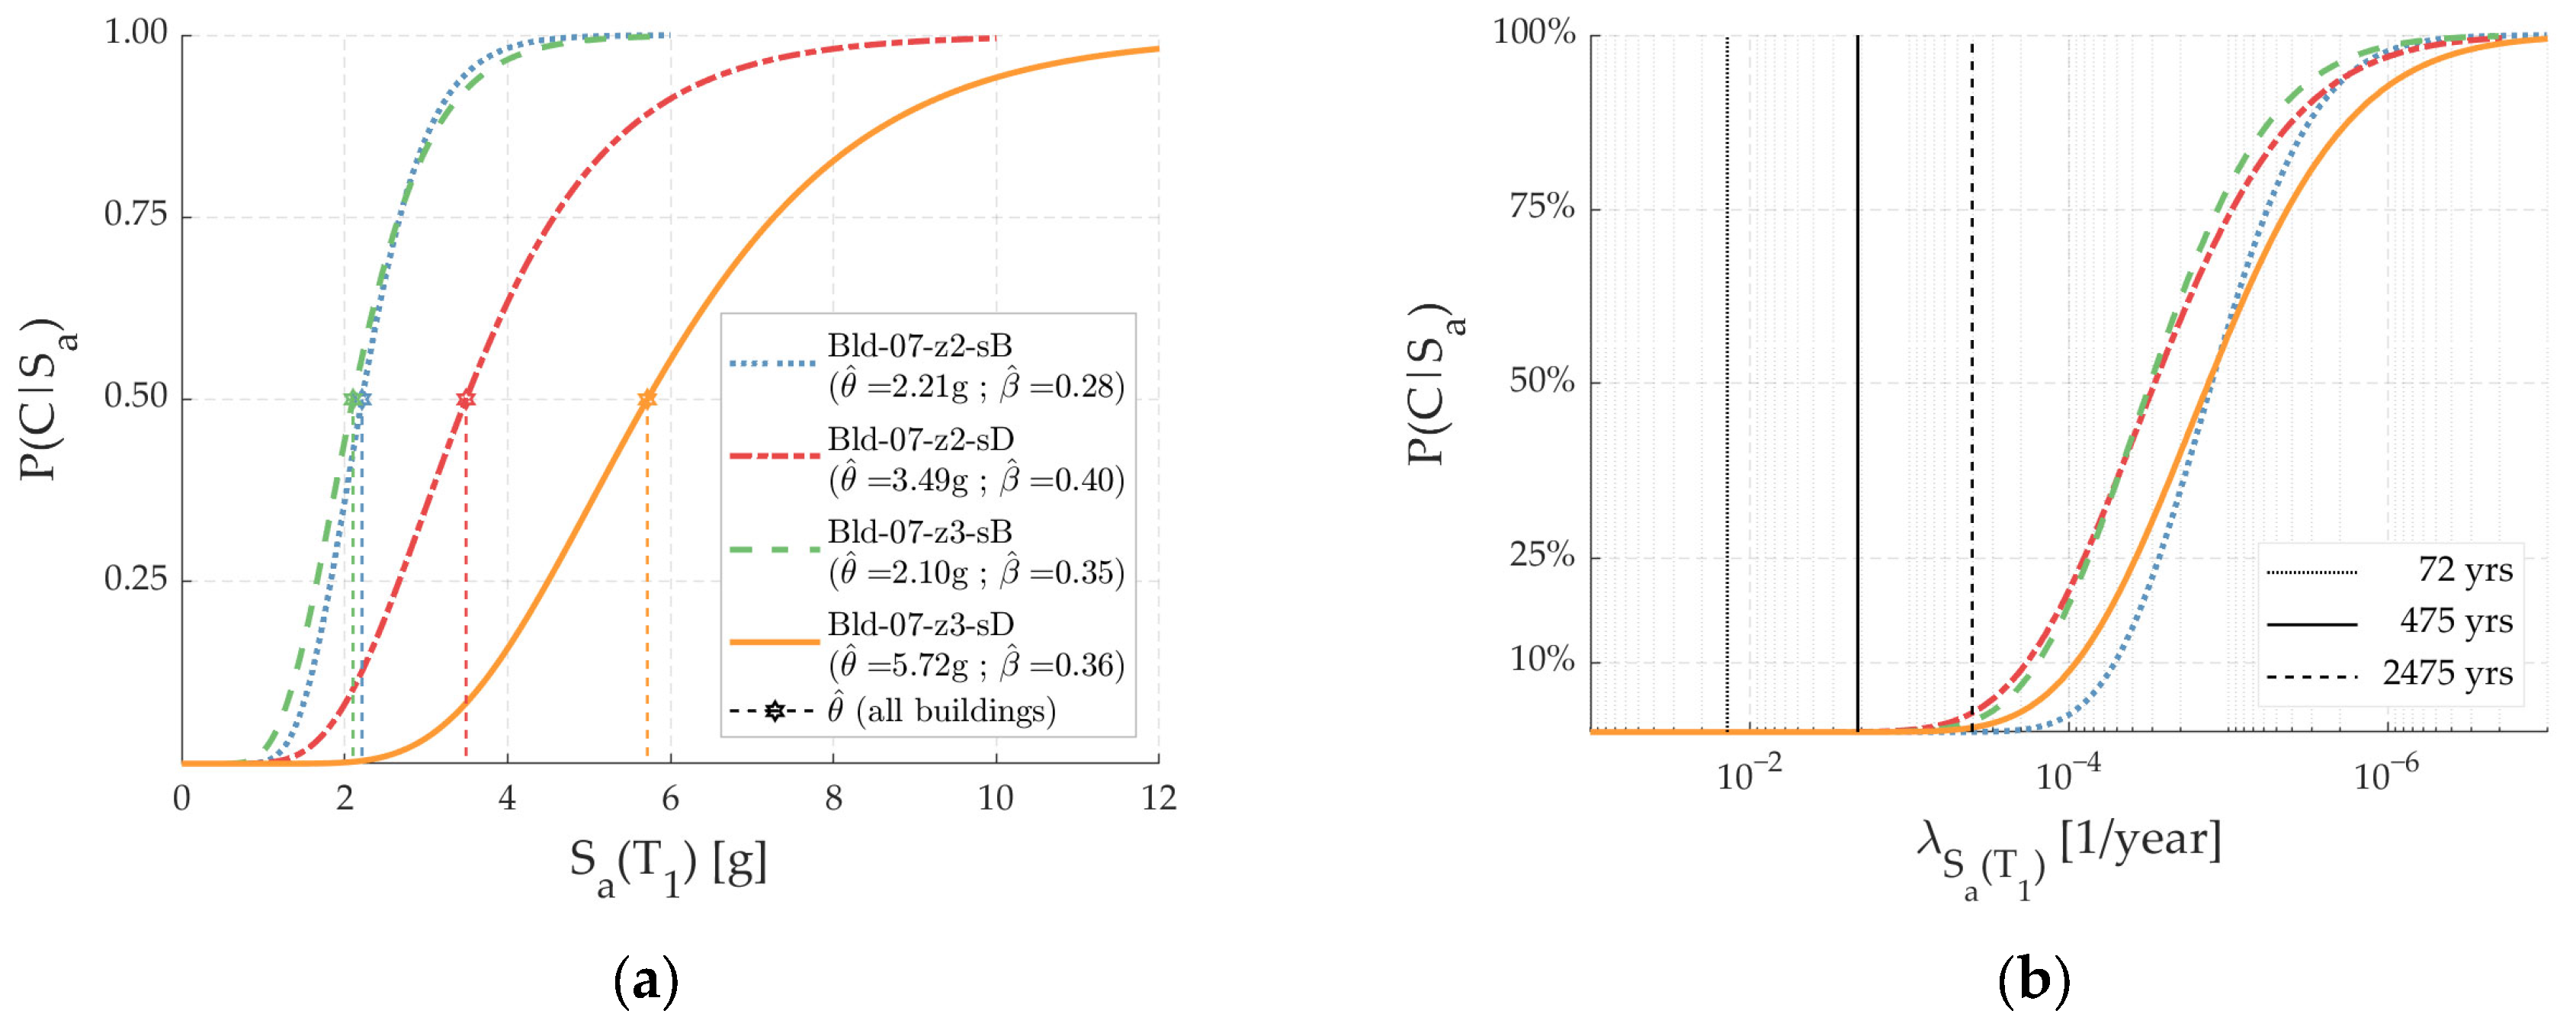
The collapse fragility curves of each archetype building (plotted as a function of Sa(T1)) are presented in Figure 15a and it can be observed that the fragility curves of archetypes Bld-07-z2-sB and Bld-07-z3-sB are quite similar to each other, whereas those of archetypes Bld-07-z2-sD and Bld-07-z3-sD are situated far to the right. At first glance, this observation could suggest that the latter archetype buildings have a superior seismic collapse performance, but it is important to note that for a specified Sa(T1) value, the corresponding λSa(T1) value may differ significantly for different archetype buildings depending on the fundamental period, seismic zone, and soil type. Thus, a direct comparison of the fragility functions expressed in terms of Sa(T1) can be misleading [38]. Consequently, Figure 15b shows the collapse fragility curves but plotted as a function of the corresponding λSa(T1) values, where vertical lines at different hazard levels (i.e., probabilities of exceedance equal to 2%, 10%, and 50% in 50 years, or, in other words, return periods of 72, 475 and 2475 years, respectively) are also shown.
By looking at Figure 15a,b it is clear why a direct comparison of the collapse fragility functions plotted as functions of Sa(T1) was misleading. For instance, the Sa(T1) collapse fragility curve of archetype Bld-07-z2-sB was located to the left of the remaining curves in Figure 15a (which may have been misunderstood as being inferior performance), whereas the corresponding λSa(T1) collapse fragility curve was located to the right of the other curves, which indicates a superior collapse performance (relative to that of the archetypes on soil type D). Although fragility functions plotted as a function of λSa(T1) may not provide sufficient information to quantitatively rank the earthquake-induced collapse performance of different buildings (as opposed to the information provided by λc, for example), this analysis provides a useful tool to compare different buildings to each other.
Figure 15b shows that each archetype building had negligible collapse probability values at hazard levels of 10% and 50% in 50 years (i.e., SLE and DBE earthquakes, respectively). Likewise, at the MCE earthquake (i.e., hazard level of 2% in 50 years) archetypes Bld-07-z2-sB and Bld-07-z3-sD had negligible collapse probability values. Instead, archetypes Bld-07-z2-sD and Bld-07-z3-sB had small but non-negligible collapse probability values (2.8% and 1.6%, respectively). Table 5 shows the collapse probability value of each archetype building at their respective MCE intensities, and it can be observed that each archetype building met the 10% conditional probability target indicated by ASCE 7-22 [10]. The latter was consistent with the satisfactory collapse prevention performance exhibited by modern Chilean RC buildings in recent earthquakes [3,6,7]. In terms of the effect of the soil type and seismic zone, the results shown in Figure 15b do not show a clear pattern. Lastly, the CMR values are also shown in Table 5 and it can be seen that these values ranged from 2.1 to 2.7 (average of 2.3) and were higher (i.e., lower collapse risk) than those indicated in FEMA P695 for RC structures, whose design seismic response coefficients and collapse uncertainties are similar to those of the archetype buildings assessed in this study [16].

5.2. Values of λc and Pc(50)

The estimated values of λc and Pc(50) are presented in 
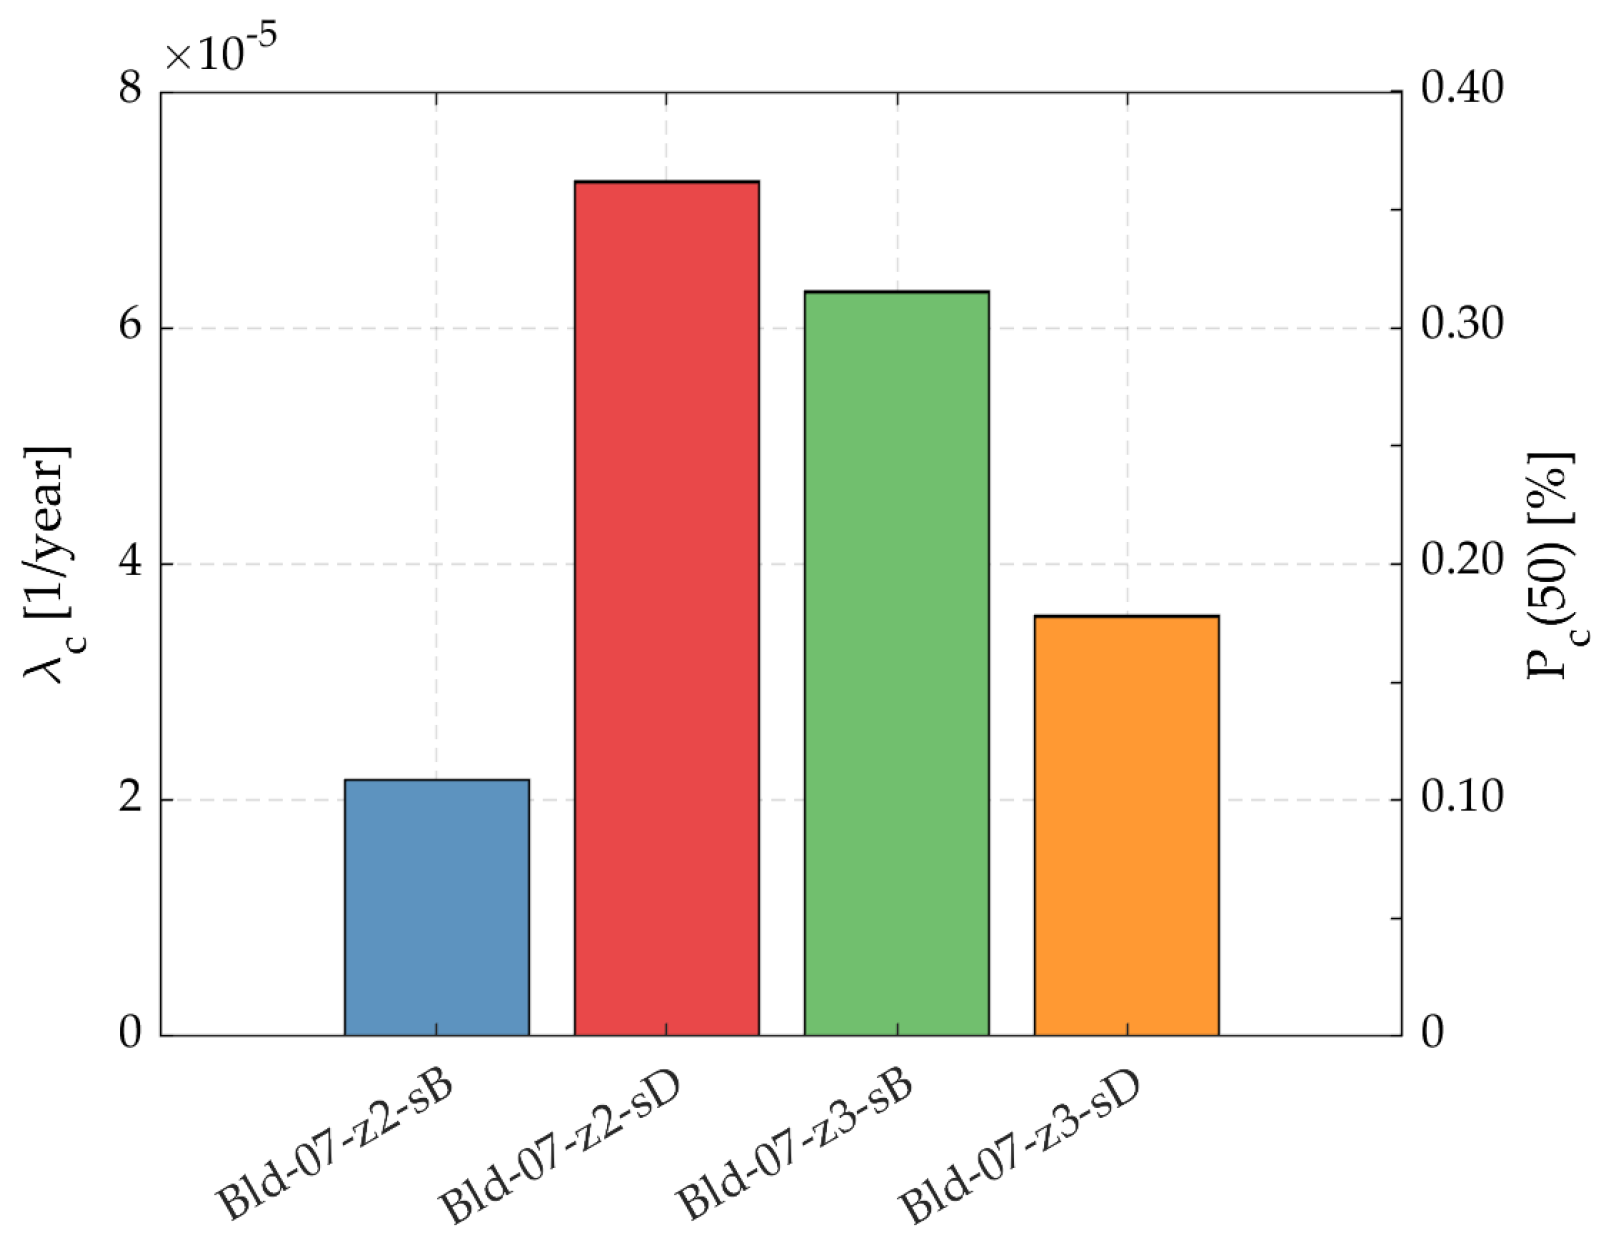
Table 6 and it can be observed that these values ranged from 2.17 × 10⁻⁵ to 7.24 × 10⁻⁵ and from 0.11% to 0.36%, respectively. The estimated values of Pc(50) were small and consistent with the seismic response of modern Chilean RC buildings empirically observed in recent earthquakes. In addition, the target maximum probability of collapse of 1% in 50 years indicated by ASCE 7-22 [10] was achieved by each archetype building and, therefore, post-2010 Chilean RC mid-rise dual wall-frame buildings are expected to reach the collapse prevention limit state (at least at the locations and soil types considered in this study).
There was no clear pattern in terms of the influence of the soil type and seismic zone on the Pc(50) values. For soil type B, the Pc(50) value for seismic zone 3 was higher than that for seismic zone 2. Specifically, the Pc(50) values for archetypes Bld-07-z3-sB and Bld-07-z2-sB were 0.31% and 0.11%, respectively. In contrast, for soil type D, the Pc(50) value for seismic zone 3 was smaller than that for seismic zone 2. Specifically, values of Pc(50) for archetypes Bld-07-z3-sD and Bld-07-z2-sD were 0.18% and 0.36%, respectively. Regarding the influence of the soil type, the Pc(50) values for archetypes Bld-07-z2-sB and Bld-07-z2-sD were 0.11% and 0.36%, respectively, whereas those for archetypes Bld-07-z3-sB and Bld-07-z3-sD Pc(50) were 0.31% and 0.18%, respectively. Although the effect of the seismic zone and soil type on the Pc(50) values may appear counter-intuitive (even chaotic), it is important to highlight that Chilean seismic design codes are mostly prescriptive and do not include explicit PBEE design targets. Given that normalized design base shears, Vdes/W, for the archetype buildings on soil type D were higher than those for the archetype buildings on soil type B (see Table 3), higher Pc(50) values for the soil type D archetype buildings seemed to indicate that the difference between the actual demand and the design demand was greater on soil type D than on soil type B. Since current Chilean design codes are prescriptive and lack PBEE design targets (such as uniform collapse risk on different soil types), the substantial differences observed in the Pc(50) values may be expected (which does not make them less unacceptable).

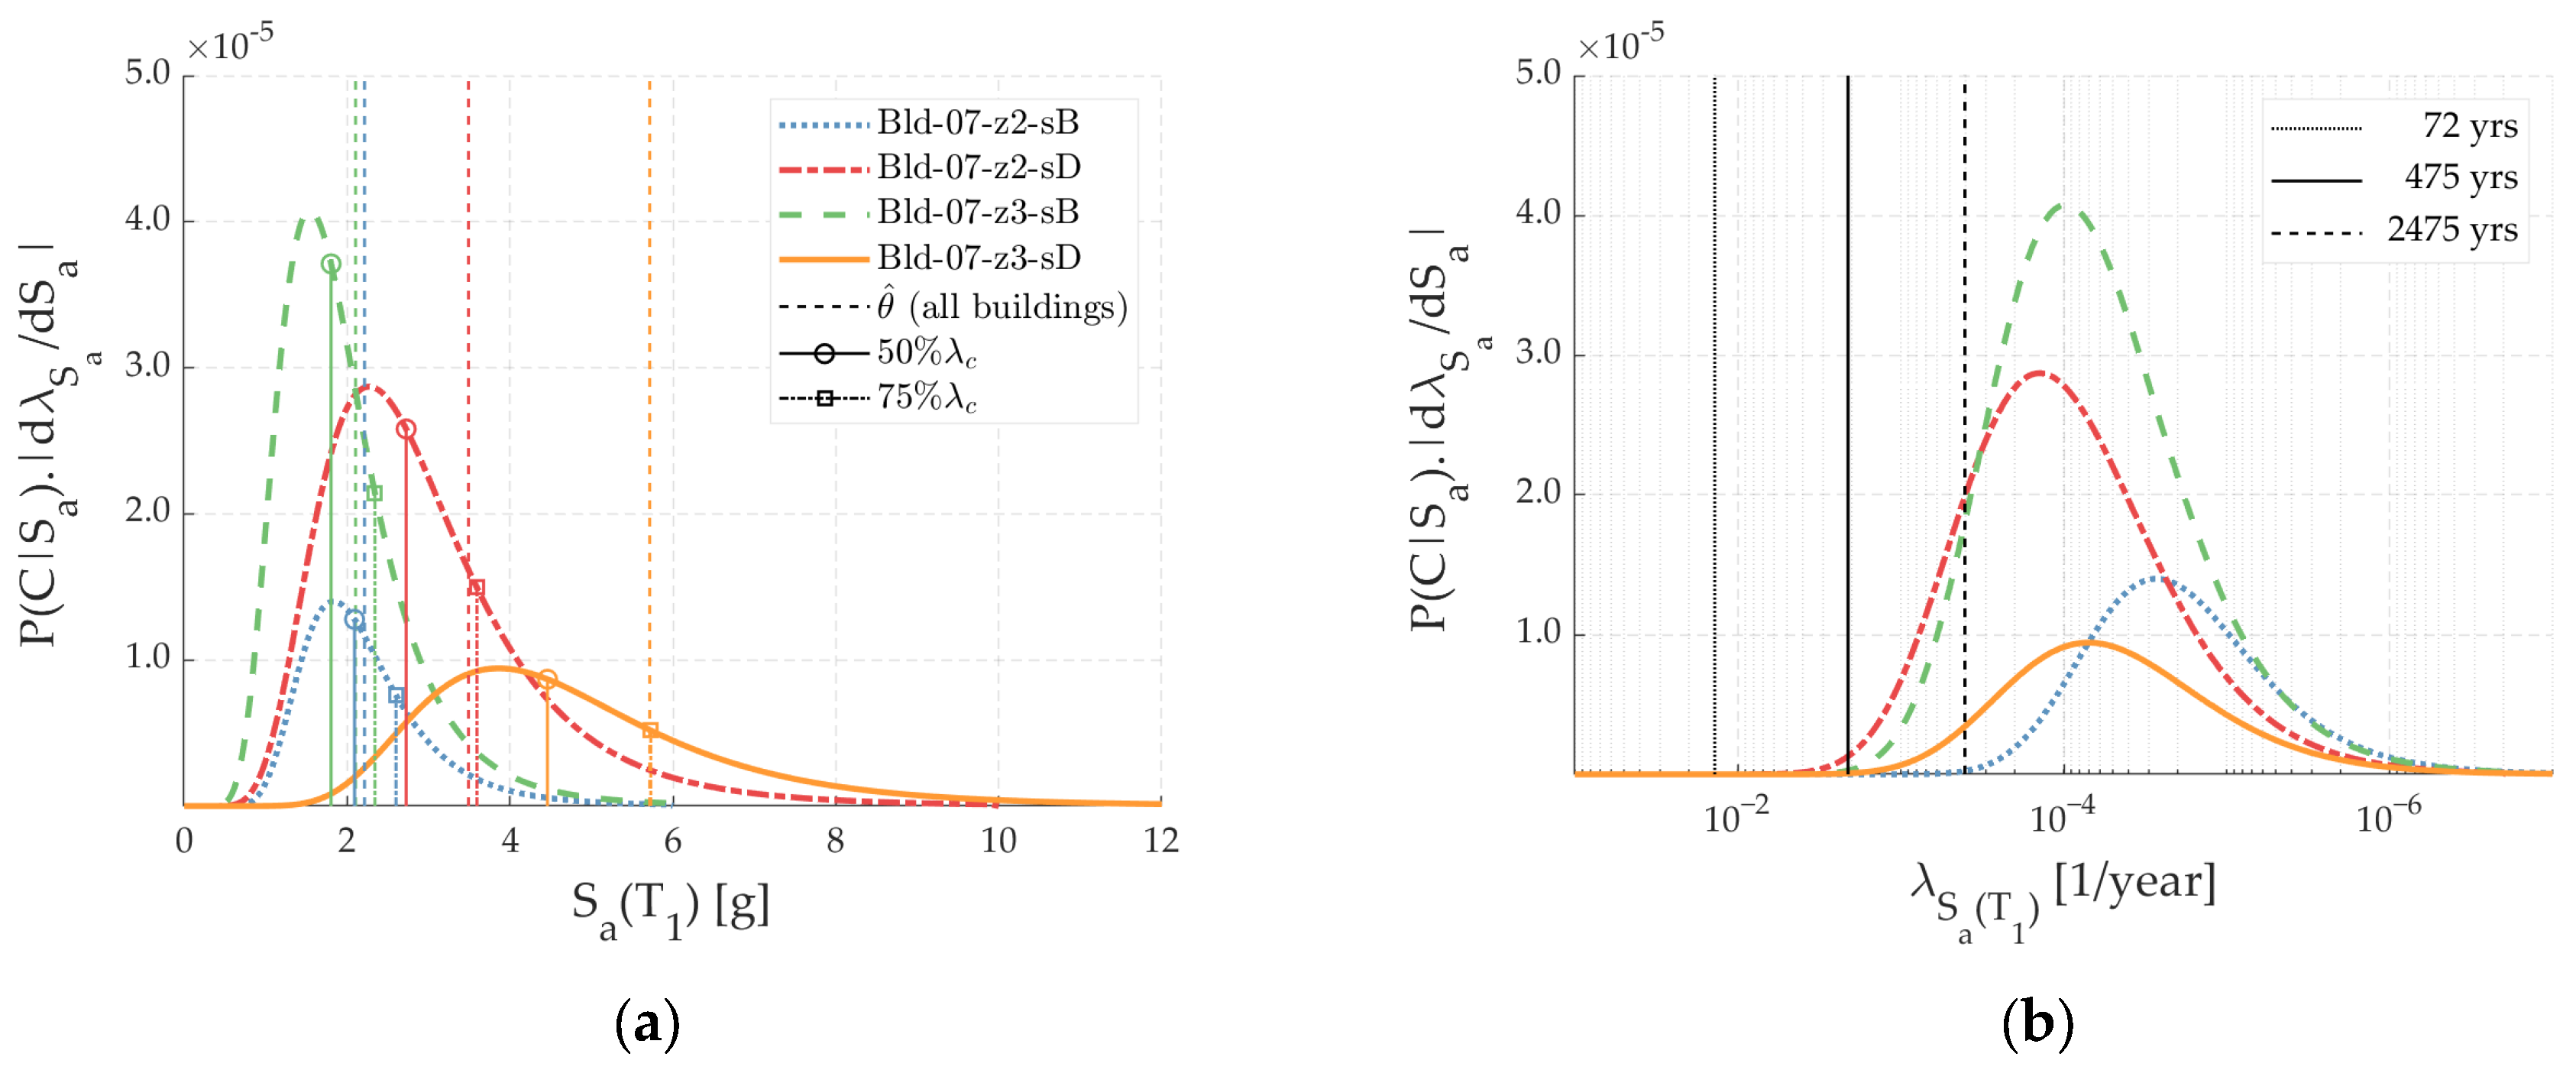
5.3. Deaggregation Values of λc

The deaggregation curves of λc based on the Sa(T1) intensity values are shown in Figure 16a, and it can be observed that the areas below the curves for archetypes Bld-07-z2-sD and Bld-07-z3-sB are significantly greater than those for archetypes Bld-07-z2-sB and Bld-07-z3-sD, which was expected because these areas represent the values of λc that were summarized in Table 6. Moreover, the deaggregation curve of archetype Bld-07-z3-sB is located more to the left, which indicates that the contribution of small Sa(T1) values to λc was greater for this archetype building than for the remaining buildings. Consequently, archetype Bld-07-z3-sB was more susceptible (in terms of collapse during its lifetime) to small/medium Sa(T1) intensities. In contrast, the deaggregation curve of archetype Bld-07-z3-sD is located more to the right, which indicates that the contribution of high Sa(T1) values to λc was greater for this archetype building than for the remaining buildings. Consequently, archetype Bld-07-z3-sD was more susceptible (in terms of collapse during its lifetime) to high Sa(T1) intensities. Figure 16a also shows three sets of lines that indicate the values of θ ^ , values of Sa(T1) at 50% of λc, and values of Sa(T1) at 75% of λc.
It is worth mentioning that the values of θ ^ were always higher than the Sa(T1) intensity values at 50% of λc but were always smaller than the Sa(T1) intensity values at 75% of λc. For instance, for archetype Bld-07-z2-sD, θ ^ = 3.49 g was 28% higher than the Sa(T1) value at 50% of λc (= 2.73 g), whereas for archetype Bld-07-z3-sB, θ ^ = 2.10 g was 17% higher than the Sa(T1) value at 50% of λc (= 1.80 g). Although the precise characterization of the collapse fragility functions is necessary for the entire range of the Sa(T1) intensity values, these observations indicate that this characterization is needed more at Sa(T1) intensities smaller than θ ^ because these Sa(T1) values contribute the most to λc (and, as a result, also to Pc(50)), which is in agreement with previous studies [22,38].
As shown previously, a direct comparison of the collapse fragility functions for the different archetype buildings (with different soil types and fundamental periods) may be misleading, and this reflection can be extended to the assessment of the λc deaggregation curves for different archetype buildings. The deaggregation curves of λc as a function of the corresponding λSa(T1) values are shown in Figure 16b, where vertical lines indicate the previously defined λSa(T1) hazard levels. At the SLE level, each archetype building presents small (almost negligible) values of deaggregated λc and this is in agreement with the observed seismic performance of Chilean RC dual wall-frame buildings in recent earthquakes. Regarding the DBE level, apart from archetype Bld-07-z2-sD, the remaining archetype buildings exhibited negligible values of deaggregated λc, whereas at the MCE level, only the archetype Bld-07-z2-sB showed negligible values of deaggregated λc. As seen in Figure 16b, the deaggregation curves of archetypes Bld-07-z2-sD and Bld-07-z3-sB are located more to the left, which shows that the influence of high λSa(T1) values on λc was greater for these archetype buildings than for the remaining ones, indicating that the former archetype buildings were more susceptible (in terms of collapse during their lifetime) to more frequent ground motions (small and medium intensities). It can also be observed that, again, the influence of the seismic zone and soil type on the deaggregated λc curves is unclear. For example, at λSa(T1) = 10−4, the area under the deaggregation curve is 42.1% of λc for archetype Bld-z2-sD but only 25.7% of λc for archetype Bld-z3-sD (see Table 6). On the other hand, at λSa(T1) = 10−4, the area under the deaggregation curve is 5.4% of λc for archetype Bld-z2-sB but 32.6% of λc for archetype Bld-z3-sB (see Table 6). Therefore, it cannot be concluded that archetype buildings located in a high seismicity zone are less susceptible to collapse during their lifetime (e.g., 50 years) to more recurrent ground motions than those in a moderate seismicity zone. As a summary, Figure 17 shows a bar plot, where the λc and Pc(50) values are plotted for the four archetype buildings.

6. Summary and Closing Remarks

This paper assesses the seismic collapse performance of a group of four mid-rise RC dual wall-frame archetype Chilean office buildings subjected to Chilean subduction ground motions. To the best of the authors’ knowledge, quantitative characterizations of the seismic collapse performance are absent from the literature. The archetype buildings (representative of Chilean mid-rise office buildings) are code-conforming buildings that meet the minimum requirements imposed by current Chilean seismic design codes, including the amendments introduced after the Mw 8.8 2010 Chilean earthquake. This group of archetype buildings is characterized by two site locations (i.e., a high seismic zone and a moderate seismic zone, which are denoted as seismic zones 3 and 2, respectively), two soil types (B and D, where the latter is less stiff than the former), and one building height (i.e., 7 stories). The archetype buildings use the naming convention of Bld-07-zX-sY, where X is the seismic zone (i.e., 2 or 3) and Y is the soil type (i.e., B or D). The assessment of the collapse performance was obtained by implementing the latest advances in PBEE proposed by the PEER Center, following the well-established FEMA P-58 methodology. The seismic collapse assessment was evaluated through 3D nonlinear finite-element models subjected to IDAs using 44 carefully chosen and scaled Chilean subduction ground-motion records. The collapse performance of the archetype buildings was characterized by the estimation of (1) the collapse fragility functions; (2) the probability of collapse at the Maximum Considered Earthquake (MCE) intensity, P(C|Sa(T1)MCE); (3) the collapse margin ratio, CMR; (4) the mean annual frequency of collapse, λc; (5) the probability of collapse in 50 years, Pc(50); and (6) the deaggregation of λc. In summary, the following conclusions can be drawn:
  • The lognormal distribution is an adequate representation of the collapse fragility function of the archetype buildings since each collapse fragility function passed the Kolmogorov–Smirnov and Lilliefors goodness-of-fit tests, both at a 5% significance level. Other distribution functions can be tested in further studies.
  • The estimated median collapse ( θ ^ ) and logarithmic dispersion ( β ^ ) values were 2.21 g, 3.49 g, 2.10 g, and 5.72 g, and 0.28, 0.40, 0.35, and 0.36, for archetype buildings Bld-07-z2-sB, Bld-07-z2-sD, Bld-07-z3-sB, and Bld-07-z3-sD, respectively.
  • The analysis and comparison of the collapse fragilities based on λSa(T1) (as an alternative to Sa(T1)) generated meaningful information since adequate direct comparisons of the conditional collapse probability can be obtained at different hazard levels such as the SLE, 50%—50 years; DBE, 10%—50 years; and MCE, 2%—50 years. Specifically, all archetype buildings had a negligible collapse probability at the SLE and DBE levels. At the MCE level, the archetype buildings Bld-07-z2-sD and Bld-07-z3-sB had non-negligible collapse probabilities (2.78% and 1.58%, respectively). However, all these MCE collapse probabilities were smaller than the 10% target defined in ASCE 7-22. Consequently, current Chilean seismic design standards seem to provide adequate levels of collapse prevention, which is in agreement with the observed performance of modern RC buildings in recent earthquakes.
  • The calculated values of the CMR (i.e., θ ^ divided by the MCE intensity) ranged from 2.1 to 2.7, with a mean of 2.3. This mean value was higher (i.e., lower collapse risk) than the values stated in previous studies on RC frame buildings designed using US seismic codes and subjected to crustal ground motions. No clear influence of the seismic zone and soil type on the CMR was identified.
  • The estimated values of λc and Pc(50) were 2.17 × 10⁻⁵, 7.24 × 10⁻⁵, 6.31 × 10⁻⁵, and 3.56 × 10⁻⁵, and 0.11%, 0.36%, 0.31%, and 0.18% for archetypes Bld-07-z2-sB, Bld-07-z2-sD, Bld-07-z3-sB, and Bld-07-z3-sD, respectively. The values of Pc(50) largely fulfilled the maximum 1% target collapse probability in 50 years stated by ASCE 7-22, indicating, once more, the adequate level of collapse prevention provided by current Chilean seismic design standards.
  • Non-negligible differences were found between the values of Pc(50) for the different archetype buildings but no clear influence of the seismic zone and soil type on Pc(50) was observed. Although Chilean seismic design codes are mostly prescriptive and do not include explicit PBEE design targets, the collapse risk should nevertheless be more uniform, suggesting that current Chilean seismic design codes (particularly the design spectra) might require a revision.
  • Lastly, the deaggregation of λc (as a function of λSa(T1), which allows adequate direct comparisons between the deaggregation functions) showed that the values of θ ^ were always higher than the Sa(T1) values at 50% of λc. In other words, in terms of the collapse risk, the contribution of the Sa(T1) values at the Sa(T1) < θ ^ range was greater than that of the Sa(T1) values at the Sa(T1) > θ ^ range. This observation means that, contrary to intuition, the accurate characterization of collapse fragilities is more important at the Sa(T1) < θ ^ range than at the Sa(T1) > θ ^ range.
In summary, although current Chilean seismic design codes for buildings appear to provide a satisfactory collapse prevention level for mid-rise RC dual wall-frame buildings, the results indicate that the collapse risk is not uniform. This lack of uniformity may indicate that a more thorough calibration of the current Chilean seismic design code is necessary. These results should be used with caution, as further research is required to evaluate the effects of different construction materials, structural systems, plan layouts, or building heights (i.e., low- and high-rise buildings) on the collapse capacity.

Author Contributions

Conceptualization, M.F.G., G.A.-L., D.L.-G. and P.F.P.; methodology, M.F.G., G.A.-L., D.L.-G. and P.F.P.; software, M.F.G. and P.F.P.; validation, M.F.G., G.A.-L., D.L.-G. and P.F.P.; formal analysis, M.F.G., G.A.-L., D.L.-G. and P.F.P.; investigation, M.F.G., G.A.-L., D.L.-G. and P.F.P.; resources, G.A.-L. and D.L.-G.; data curation, M.F.G.; writing—original draft preparation, M.F.G., G.A.-L. and D.L.-G.; writing—review and editing, G.A.-L. and D.L.-G.; visualization, M.F.G.; supervision, G.A.-L., D.L.-G. and P.F.P.; project administration, G.A.-L.; funding acquisition, G.A.-L. All authors have read and agreed to the published version of the manuscript.

Funding

This research was funded by ANID Doctorado Nacional 2018 Folio 21181157, FONDECYT de Iniciación—Grant 11191194, and the Research Center for Integrated Disaster Risk Management (CIGIDEN) ANID FONDAP 1522A0005. The APC was funded by FONDECYT de Iniciación—Grant 11191194.

Data Availability Statement

The data that support the findings of this study are available from the corresponding authors, [G.A.-L.; D.L.-G.], upon reasonable request.

Acknowledgments

Valuable comments on the Chilean seismic design practice were provided by Ian Watt (VMB Structural Engineering) and Mario Lafontaine (Rene Lagos Engineers). The strong motion database was provided by the SIBER-RISK (Simulation-Based Earthquake Risk and Resilience of Interdependent Systems and Networks) project.

Conflicts of Interest

The authors declare no conflict of interest. The funders had no role in the design of the study; in the collection, analyses, or interpretation of data; in the writing of the manuscript, or in the decision to publish the results.

References

  1. Ruiz, S.; Madariaga, R. Historical and recent large megathrust earthquakes in Chile. Tectonophysics 2018, 733, 37–56. [Google Scholar] [CrossRef]
  2. Massone, L.M.; Bonelli, P.; Lagos, R. Seismic design and construction practices for RC structural wall buildings. Earthq. Spectra 2012, 28, S245–S256. [Google Scholar] [CrossRef]
  3. EERI. The Mw 8.8 Chile Earthquake of 27 February 2010; Earthquake Engineering Research Institute: Oakland, CA, USA, 2010. [Google Scholar]
  4. Zareian, F.; Krawinkler, H. Assessment of probability of collapse and design for collapse safety. Earthq. Eng. Struct. Dyn. 2007, 36, 1901–1914. [Google Scholar] [CrossRef]
  5. Tena-Colunga, A.; Sanchez-Ballinas, D. The collapse of Alvaro Obregon 286 building in Mexico City during the September 19, 2017 earthquake. A case study. J. Build. Eng. 2022, 49, 104060. [Google Scholar] [CrossRef]
  6. EERI. Mw 8.2 Iquique, Chile Earthquake and Tsunami: Preliminary Reconnaissance Observations; Earthquake Engineering Research Institute: Oakland, CA, USA, 2014. [Google Scholar]
  7. GEER. Geotechnical Reconnaissance of the 2015 M8.3 Illapel, Chile Earthquake; Geotechnical Extreme Events Reconnaissance (GEER) Association, Report No. GEER-043; GEER, 2015. [Google Scholar]
  8. INN. Norma Chilena Oficial NCh433 Of. 1996 Mod. 2009 Diseño Sismico de Edificios; Instituto Nacional de Normalizacion: Santiago, Chile, 2009. (In Spanish) [Google Scholar]
  9. MINVU. DS 61 Diseño Sismico de Edificios; Ministerio de Vivienda y Urbanismo: Santiago, Chile, 2011. (In Spanish) [Google Scholar]
  10. ASCE. Minimum Design Loads and Associated Criteria for Buildings and Other Structures ASCE/SEI 7-22; American Association of Civil Engineers: Reston, VA, USA, 2022. [Google Scholar]
  11. MINVU. DS 60 Requisitos de Diseño y Calculo Para el Hormigon Armado; Ministerio de Vivienda y Urbanismo: Santiago, Chile, 2011. (In Spanish) [Google Scholar]
  12. Lagos, R.; Lafontaine, M.; Bonelli, P.; Boroschek, R.; Guendelman, T.; Massone, L.; Saragoni, R.; Rojas, F.; Yañez, F. The quest for resilience: The Chilean practice of seismic design for reinforced concrete buildings. Earthq. Spectra 2021, 37, 26–45. [Google Scholar] [CrossRef]
  13. FEMA. Seismic Performance Assessment of Buildings FEMA P-58; Federal Emergency Management Agency: Hyattsville, MD, USA, 2018. [Google Scholar]
  14. Araya-Letelier, G.; Parra, P.F.; Lopez-Garcia, D.; Garcia-Valdes, A.; Candia, G.; Lagos, R. Collapse risk assessment of a Chilean dual wall-frame reinforced concrete office building. Eng. Struct. 2019, 183, 770–779. [Google Scholar] [CrossRef]
  15. Cando, M.A.; Hube, M.A.; Parra, P.F.; Arteta, C.A. Effect of stiffness on the seismic performance of code-conforming reinforced concrete shear wall buildings. Eng. Struct. 2020, 219, 110724. [Google Scholar] [CrossRef]
  16. FEMA. Quantification of Building Seismic Performance Factors FEMA P695; Federal Emergency Management Agency: Hyattsville, MD, USA, 2009. [Google Scholar]
  17. Gogus, A.; Wallace, J.W. Seismic safety evaluation of reinforced concrete walls through FEMA P695 methodology. J. Struct. Eng. 2015, 141, 04015002. [Google Scholar] [CrossRef]
  18. Arabzadeh, H.; Galal, K. Seismic collapse risk assessment and FRP retrofitting of RC coupled C-shaped core walls using the FEMA P695 methodology. J. Struct. Eng. 2017, 143, 04017096. [Google Scholar] [CrossRef]
  19. Dabaghi, M.; Saad, G.; Allhassania, N. Seismic collapse fragility analysis of reinforced concrete shear wall buildings. Earthq. Spectra 2019, 35, 383–404. [Google Scholar] [CrossRef]
  20. Terzic, V.; Kolozvari, K.; Saldana, D. Implications of modeling approaches on seismic performance of low- and mid-rise office and hospital shear wall buildings. Eng. Struct. 2019, 189, 129–146. [Google Scholar] [CrossRef]
  21. Marafi, N.A.; Ahmed, K.A.; Lehman, D.E.; Lowes, L.N. Variability in seismic collapse probabilities of solid- and coupled-wall buildings. J. Struct. Eng. 2019, 145, 04019047. [Google Scholar] [CrossRef]
  22. Raghunandan, M.; Liel, A.; Luco, N. Collapse risk of buildings in the Pacific northwest region due to subduction earthquakes. Earthq. Spectra 2015, 31, 2087–2115. [Google Scholar] [CrossRef]
  23. Chandramohan, R.; Baker, J.; Deierlein, G. Impact of hazard-consistent ground motion duration in structural collapse risk assessment. Earthq. Eng. Struct. Dyn. 2016, 45, 1357–1379. [Google Scholar] [CrossRef]
  24. Medalla, M.; Lopez-Garcia, D.; Zareian, F. Seismic characterization of steel special moment frames subjected to megathrust earthquakes. Earthq. Spectra 2020, 36, 2033–2057. [Google Scholar] [CrossRef]
  25. Marafi, N.A.; Makdisi, A.J.; Eberhard, M.O.; Berman, J.W. Impacts of an M9 Cascadia subduction zone earthquake and Seattle basin on performance of RC core wall buildings. J. Struct. Eng. 2020, 146, 04019201. [Google Scholar] [CrossRef]
  26. Vamvatsikos, D.; Cornell, C.A. Incremental dynamic analysis. Earthq. Eng. Struct. Dyn. 2002, 31, 491–514. [Google Scholar] [CrossRef]
  27. Monjardin-Quevedo, J.G.; Valenzuela-Beltran, F.; Reyes-Salazar, A.; Leal-Graciano, J.M.; Torres-Carrillo, X.G.; Gaxiola-Camacho, J.R. Probabilistic assessment of buildings subjected to multi-level earthquake loading based on the PBSD concept. Buildings 2022, 12, 1942. [Google Scholar] [CrossRef]
  28. Kostinakis, K.; Fontara, I.; Athanatopoulou, A. Scalar structure-specific ground motion intensity measures for assessing the seismic performance of structures: A review. J. Earthq. Eng. 2018, 22, 630–665. [Google Scholar] [CrossRef]
  29. Rong, X.; Yang, J.; Jun, L.; Zhang, Y.; Zheng, S.; Dong, L. Optimal ground motion intensity measure for seismic assessment of high-rise reinforced concrete structures. Case Stud. Constr. Mater. 2023, 18, e01678. [Google Scholar] [CrossRef]
  30. Shome, N. Probabilistic Seismic Demand Analysis of Nonlinear Structures. Ph.D. Thesis, Stanford University, Stanford, CA, USA, 1999. [Google Scholar]
  31. Ibarra, L.F.; Krawinkler, H. Global Collapse of Frame Structures under Seismic Excitations; Technical Report 152; John A. Blume Earthquake Engineering Center: Stanford, CA, USA, 2005. [Google Scholar]
  32. Eads, L.; Miranda, E.; Krawinkler, H.; Lignos, D. An efficient method for estimating the collapse risk of structures in seismic regions. Earthq. Eng. Struct. Dyn. 2013, 42, 25–41. [Google Scholar] [CrossRef]
  33. Baker, J.W. Efficient analytical fragility function fitting using dynamic structural analysis. Earthq. Spectra 2015, 31, 579–599. [Google Scholar] [CrossRef]
  34. Massey, F.J., Jr. The Kolmogorov-Smirnov test for goodness of fit. J. Am. Stat. Assoc. 1951, 46, 68–78. [Google Scholar] [CrossRef]
  35. Lilliefors, H. On the Kolmogorov-Smirnov test for normality with mean and variance unknown. J. Am. Stat. Assoc. 1967, 62, 399–402. [Google Scholar] [CrossRef]
  36. INE. Base de Datos de Permisos de Edificación; Instituto Nacional de Estadística: Santiago, Chile, 2020. (In Spanish) [Google Scholar]
  37. IBC. 2021 International Building Code; International Code Council: Country Club Hills, IL, USA, 2021. [Google Scholar]
  38. Araya-Letelier, G. Design of Building Structural Systems and Enhanced Partition Walls to Improve the Life Cycle Costs Associated with Risk of Earthquake Damage. Ph.D. Thesis, Stanford University, Stanford, CA, USA, 2014. [Google Scholar]
  39. Porcu, M.C.; Vielma Pérez, J.C.; Pais, G.; Osorio Bravo, D.; Vielma Quintero, J.C. Some issues in the seismic assessment of shear-wall buildings through code-compliant dynamic analyses. Buildings 2022, 12, 694. [Google Scholar] [CrossRef]
  40. CSI. ETABS v16 User’s Guide Manual; Computers & Structures: Berkeley, CA, USA, 2016. [Google Scholar]
  41. Akcelyan, S.; Lignos, D.G. Seismic Assessment and retrofit of pre-Northridge high rise steel moment resisting frame buildings with bilinear oil dampers. Buildings 2023, 13, 139. [Google Scholar] [CrossRef]
  42. ACI. Building Code Requirements for Structural Concrete and Commentary ACI 318-08; American Concrete Institute: Farmington Hills, MI, USA, 2008. [Google Scholar]
  43. CSI. PERFORM 3D 7.0.0 Manual; Computer & Structures: Berkeley, CA, USA, 2017. [Google Scholar]
  44. NIST. Nonlinear Structural Analysis for Seismic Design: A Guide for Practicing Engineers NIST GCR 10-917-5; National Institute of Standards and Technology: Gaithersburg, MD, USA, 2010. [Google Scholar]
  45. ATC. Modeling and Acceptance Criteria for Seismic Design and Analysis of Tall Buildings PEER/ATC 72-1; Applied Technology Council: Redwood City, CA, USA, 2010. [Google Scholar]
  46. NIST. Recommended Modeling Parameters and Acceptance Criteria for Nonlinear Analysis in Support of Seismic Evaluation, Retrofit, and Design NIST GCR 17-917-45; National Institute of Standards and Technology: Gaithersburg, MD, USA, 2017. [Google Scholar]
  47. NIST. Guidelines for Nonlinear Structural Analysis for Design of Buildings Part I—General, NIST GCR 17-917-46v1; National Institute of Standards and Technology: Gaithersburg, MD, USA, 2017. [Google Scholar]
  48. ACHISINA. Alternative Procedure for the Seismic Analysis and Design of Tall Buildings; Asociacion Chilena de Sismologia e Ingenieria Antisismica: Santiago, Chile, 2017. (In Spanish) [Google Scholar]
  49. TBI. Guidelines for Performance-Based Seismic Design of Tall Buildings; PEER Report 2017-06; Pacific Earthquake Engineering Research Center: Berkeley, CA, USA, 2017. [Google Scholar]
  50. LATBSDC. An Alternative Procedure for Seismic Analysis and Design of Tall Buildings Located in the Los Angeles Region; Los Angeles Tall Buildings Structural Design Council: Los Angeles, CA, USA, 2020. [Google Scholar]
  51. Ugalde, D.; Lopez-Garcia, D. Analysis of the seismic capacity of Chilean residential RC shear wall buildings. J. Build. Eng. 2020, 31, 101369. [Google Scholar] [CrossRef]
  52. Massone, L.M.; Bedecarratz, E.; Rojas, F.; Lafontaine, M. Nonlinear modeling of a damaged reinforced concrete building and design improvement behavior. J. Build. Eng. 2021, 41, 102766. [Google Scholar] [CrossRef]
  53. Lowes, L.N.; Lehman, D.E.; Baker, C. Recommendations for modeling the nonlinear response of slender reinforced concrete walls using PERFORM-3D. In Proceedings of the SEAOC Convention, Maui, HI, USA, 12–15 October 2016. [Google Scholar]
  54. Kolozvari, K.; Arteta, C.; Fischinger, M.; Gavridou, S.; Hube, M.; Isakovic, T.; Lowes, L.; Orakcal, K.; Vásquez, J.; Wallace, J. Comparative study of state-of-the-art macroscopic models for planar reinforced concrete walls. ACI Struct. J. 2018, 115, 1637–1657. [Google Scholar] [CrossRef]
  55. Coleman, J.; Spacone, E. Localization issues in force-based frame elements. J. Struct. Eng. 2001, 127, 1257–1265. [Google Scholar] [CrossRef]
  56. Dazio, A.; Beyer, K.; Bachmann, H. Quasi-static cyclic tests and plastic hinge analysis of RC structural walls. Eng. Struct. 2009, 31, 1556–1571. [Google Scholar] [CrossRef]
  57. Thomsen, J.H.; Wallace, J.W. Displacement-Based Design of Reinforced Concrete Structural Walls: An Experimental Investigation of Walls with Rectangular and T-Shaped Cross-Sections; Tech. Rep. No. CU/CEE-95/06; Department of Civil Engineering, Clarkson University: Postdam, NY, USA, 1995. [Google Scholar]
  58. Ugalde, D.; Parra, P.F.; Lopez-Garcia, D. Assessment of the seismic capacity of tall wall buildings using nonlinear finite element modeling. Bull. Earthq. Eng. 2019, 17, 6565–6589. [Google Scholar] [CrossRef]
  59. Paulay, T.; Priestley, M.J.N. Seismic Design of Reinforced Concrete and Masonry Buildings; Wiley: Hoboken, NJ, USA, 1992. [Google Scholar]
  60. Yang, T.Y.; Moehle, J.P.; Bozorgnia, Y.; Zareian, F.; Wallace, J.W. Performance assessment of tall concrete core-wall building designed using two alternative approaches. Earthq. Eng. Struct. Dyn. 2012, 45, 1515–1531. [Google Scholar] [CrossRef]
  61. Odabasi, O.; Kohrangi, M.; Bazzurro, P. Seismic collapse risk of reinforced concrete tall buildings in Istanbul. Bull. Earthq. Eng. 2021, 19, 6545–6571. [Google Scholar] [CrossRef]
  62. Kim, T.; Foutch, D.A. Application of FEMA methodology to RC shear wall buildings governed by flexure. Eng. Struct. 2007, 29, 2514–2522. [Google Scholar] [CrossRef]
  63. ASCE. Seismic Evaluation and Retrofit of Existing Buildings ASCE/SEI 41-17; American Association of Civil Engineers: Reston, VA, USA, 2017. [Google Scholar]
  64. Poulos, A.; Monsalve, M.; Zamora, N.; de la Llera, J.C. An updated recurrence model for Chilean subduction seismicity and statistical validation of its Poisson nature. Bull. Seismol. Soc. Am. 2019, 109, 66–74. [Google Scholar] [CrossRef]
  65. Montalva, G.A.; Bastías, N.; Rodriguez-Marek, A. Ground-motion prediction equation for the Chilean subduction zone. Bull. Seismol. Soc. Am. 2017, 107, 901–911. [Google Scholar] [CrossRef]
  66. Idini, B.; Rojas, F.; Ruiz, S.; Pasten, C. Ground motion prediction equations for the Chilean subduction zone. Bull. Earthq. Eng. 2017, 15, 1853–1880. [Google Scholar] [CrossRef]
  67. Candia, G.; Macedo, J.; Jaimes, M.A.; Magna-Verdugo, C. A new state-of-the-art platform for probabilistic and deterministic seismic hazard assessment. Seismol. Res. Lett. 2019, 90, 226–2275. [Google Scholar] [CrossRef]
  68. Baker, J.W. Conditional mean spectrum: Tool for ground motion selection. J. Struct. Eng. 2011, 137, 322–331. [Google Scholar] [CrossRef]
  69. Candia, G.; Poulos, A.; de la Llera, J.C.; Crempien, J.; Macedo, J. Correlations of spectral accelerations in the Chilean subduction zone. Earthq. Spectra 2020, 36, 788–805. [Google Scholar] [CrossRef]
  70. Lin, T.; Harmsen, S.C.; Baker, J.W.; Luco, N. Conditional spectrum computation incorporating multiple causal earthquakes and ground motion prediction models. Bull. Seismol. Soc. Am. 2013, 103, 1103–1116. [Google Scholar] [CrossRef]
  71. Castro, S.; Benavente, R.; Crempien, J.G.F.; Candia, G.; De la Llera, J.C. A consistently processed strong-motion database for Chilean earthquakes. Seismol. Res. Lett. 2022, 93, 2700–2718. [Google Scholar] [CrossRef]
  72. Baker, J.W.; Lee, C. An improved algorithm for selecting ground motions to match a conditional spectrum. J. Earthq. Eng. 2018, 22, 708–723. [Google Scholar] [CrossRef]
  73. NIST. Selecting and Scaling Earthquake Ground Motions for Performing Response-History Analyses NIST GCR 11-917-15; National Institute of Standards and Technology: Gaithersburg, MD, USA, 2011. [Google Scholar]
  74. Davalos, H.; Miranda, E. Evaluation of bias on the probability of collapse from amplitude scaling using spectral-shape-matched records. Earthq. Eng. Struct. Dyn. 2019, 48, 970–986. [Google Scholar] [CrossRef]
  75. Davalos, H.; Miranda, E. Evaluation of the scaling factor bias influence on the probability of collapse using Sa(T1) as the intensity measure. Earthq. Spectra 2019, 35, 679–702. [Google Scholar] [CrossRef]
Figure 1. Buildings damaged by the Mw 8.8 2010 Chilean earthquake: (a) O’Higgins office building; (b) Alto Rio residential building.
Buildings 13 00880 g001
Figure 2. (a) Chilean RC buildings 2002–2020: number of office buildings and number of stories. (b) Definition of high-rise building from IBC-2021 [37]. MR-Region = Metropolitan Region; V-Region = Valparaiso Region.
Buildings 13 00880 g002
Figure 3. Archetype buildings. (a) Typical floor plan view. (b) Underground floor plan view. (c) Lateral transverse view. (d) 3D view.
Buildings 13 00880 g003
Figure 4. Comparison of elastic NCh 433 and reduced design spectra (transverse direction). (a) Bld-07-z2-sB; (b) Bld-07-z2-sD; (c) Bld-07-z3-sB; (d) Bld-07-z3-sD. Note: in all subfigures, dashed lines and continuous lines represent the elastic NCh433 spectrum and reduced spectrum, respectively.
Buildings 13 00880 g004
Figure 5. Comparison of DBE-UHS and elastic NCh 433 spectra. (a) Bld-07-z2-sB; (b) Bld-07-z2-sD; (c) Bld-07-z3-sB; (d) Bld-07-z3-sD. Note: in all subfigures, dot lines and dashed lines represent the DBE-UHS spectrum and the elastic NCh433 spectrum, respectively.
Buildings 13 00880 g005
Figure 6. Perform-3D modeling. (a) 3D archetype; (b) shear-wall element; (c) frame element.
Buildings 13 00880 g006
Figure 7. Archetype Bld-07-z3-sD: material models for the shear walls. (a) Confined concrete. (b) Unconfined concrete. (c) Steel. (d) Wall shear. SBE = special boundary element; OBE = ordinary boundary element; h = story height; e = number of vertical shear-wall elements per story.
Buildings 13 00880 g007
Figure 8. Structural collapse criteria.
Buildings 13 00880 g008
Figure 9. Capacity curves (pushover). (a,b) Base shear vs. roof displacement. (c,d) Base-shear coefficient versus roof-drift ratio.
Buildings 13 00880 g009
Figure 10. Strains at the boundary elements of archetype Bld-07-z2-sB (pushover along the positive transverse direction) (a) at Vbmax (RDR ≈ 1.5%), and (b) at the first concrete crushing point R (RDR = 3.0%). (c) Schematic YULRX curve: color scale.
Buildings 13 00880 g010
Figure 11. Seismic hazard curves plotted as a function of (a) the annual probability of exceedance, λSa(T1), and (b) the return period, Tr.
Buildings 13 00880 g011
Figure 12. Ground-motion selection. (a) Bld-07-z2-sB; (b) Bld-07-z2-sD; (c) Bld-07-z3-sB; (d) Bld-07-z3-sD. Note: the 3rd, 4th, 5th and 6th series in the legend of subfigure (a) also apply for the other subfigures.
Buildings 13 00880 g012
Figure 13. Median values of Peak Story Drift Ratios (PSDR). (a) Bld-07-z2-sB; (b) Bld-07-z2-sD; (c) Bld-07-z3-sB; (d) Bld-07-z3-sD.
Buildings 13 00880 g013
Figure 14. IDA results: (a) Bld-07-z2-sB; (b) Bld-07-z2-sD; (c) Bld-07-z3-sB; (d) Bld-07-z3-sD. Collapse simulation results and estimated collapse fragility functions: (e) Bld-07-z2-sB; (f) Bld-07-z2-sD; (g) Bld-07-z3-sB; (h) Bld-07-z3-sD. Note: the 1st, 2nd and 4th series in the legend of subfigure (a) also apply for subfigures (bd); and the 2nd, 3rd and 4th series in the legend of subfigure (e) also apply for subfigures (fh).
Buildings 13 00880 g014aBuildings 13 00880 g014b
Figure 15. Collapse fragility curves plotted as a function of (a) Sa(T1); (b) λSa(T1).
Buildings 13 00880 g015
Figure 16. Deaggregation of λc plotted as a function of (a) Sa(T1); (b) λSa(T1).
Buildings 13 00880 g016
Figure 17. Bar graph of λc and Pc(50).
Buildings 13 00880 g017
Table 1. Design parameters.
ArchetypeTransverse DirectionLongitudinal DirectionCmin
T (s)R*ReffC (%)T (s)R*ReffC (%)(%)
Bld-07-z2-sB0.9238.66.55.00.4656.26.26.05.0
Bld-07-z2-sD0.8356.16.17.00.4263.73.711.26.0
Bld-07-z3-sB0.9138.66.56.70.4646.26.28.16.7
Bld-07-z3-sD0.6735.95.99.80.3573.63.615.78.0
T = fundamental period; R* = response modification factor; Reff = effective response modification factor; C = normalized base-shear demand.
Table 2. Member cross-sections.
ArchetypeCore WallsBeamsColumns
FlangesWebs(b × h)(b × h)
ltll us3–s2°s3°–s7°
Bld-07-z2-sB4.20.3516.00.250.6 × 0.50.7 × 0.70.6 × 0.6
Bld-07-z2-sD4.20.4516.00.300.6 × 0.50.7 × 0.70.6 × 0.6
Bld-07-z3-sB4.20.3516.00.250.6 × 0.50.7 × 0.70.6 × 0.6
Bld-07-z3-sD4.20.5516.00.400.7 × 0.61.0 × 1.00.8 × 0.8
l = length; t = thickness; b = width; h = height; us3 = third underground story; s2° = second story; s3° = third story; s7° = top story. Note: all dimensions are in meters.
Table 3. Summary of pushover analyses.
ArchetypeVdesVdes/WVmax+Vmax+/W+Vmax−Vmax−/W
(tonf)(%)(tonf)(%)(tonf)(%)
Bld-07-z2-sB3484.7152420.44.4128317.23.7
Bld-07-z2-sD82610.7203626.32.5203826.32.5
Bld-07-z3-sB4646.2182724.43.9149520.03.2
Bld-07-z3-sD123115.1291835.72.4314938.52.6
Table 4. Summary of IM = Sa(T1).
ArchetypeSa(T1)SLE (g)Sa(T1)DBE (g)Sa(T1)MCE (g)Sa(T1)des,red (g)Sa(T1)des,e (g)P(%) in 50 yTr (y)
Bld-07-z2-sB0.160.410.810.0400.26124180
Bld-07-z2-sD0.340.861.630.1550.9438600
Bld-07-z3-sB0.190.520.990.0540.34822200
Bld-07-z3-sD0.551.312.360.2331.3779530
P(%) in 50 y = probability of exceedance in 50 years (as a percentage); Tr = mean return period.
Table 5. Summary of collapse fragility analysis.
Archetype θ ^ β ^ K–S LillieforsP(C|Sa(T1)MCE) CMR
(g) Test?Test?(%)
Bld-07-z2-sB2.210.28PassPass0.022.7
Bld-07-z2-sD3.490.40PassPass2.782.1
Bld-07-z3-sB2.100.35PassPass1.582.1
Bld-07-z3-sD5.720.36PassPass0.662.4
Table 6. Summary of values of λc and Pc(50).
Archetypeλc (1/Year)Pc(50) (%)λcSa(T1) = 10−4)/λc (%)
Bld-07-z2-sB2.17 × 10−50.115.4
Bld-07-z2-sD7.24 × 10−50.3642.1
Bld-07-z3-sB6.31 × 10−50.3132.6
Bld-07-z3-sD3.56 × 10−50.1825.7
Disclaimer/Publisher’s Note: The statements, opinions and data contained in all publications are solely those of the individual author(s) and contributor(s) and not of MDPI and/or the editor(s). MDPI and/or the editor(s) disclaim responsibility for any injury to people or property resulting from any ideas, methods, instructions or products referred to in the content.

