
Analyze Differences in Carbon Emissions from Traditional and Prefabricated Buildings Combining the Life Cycle


Abstract
:1. Introduction
2. Research Method
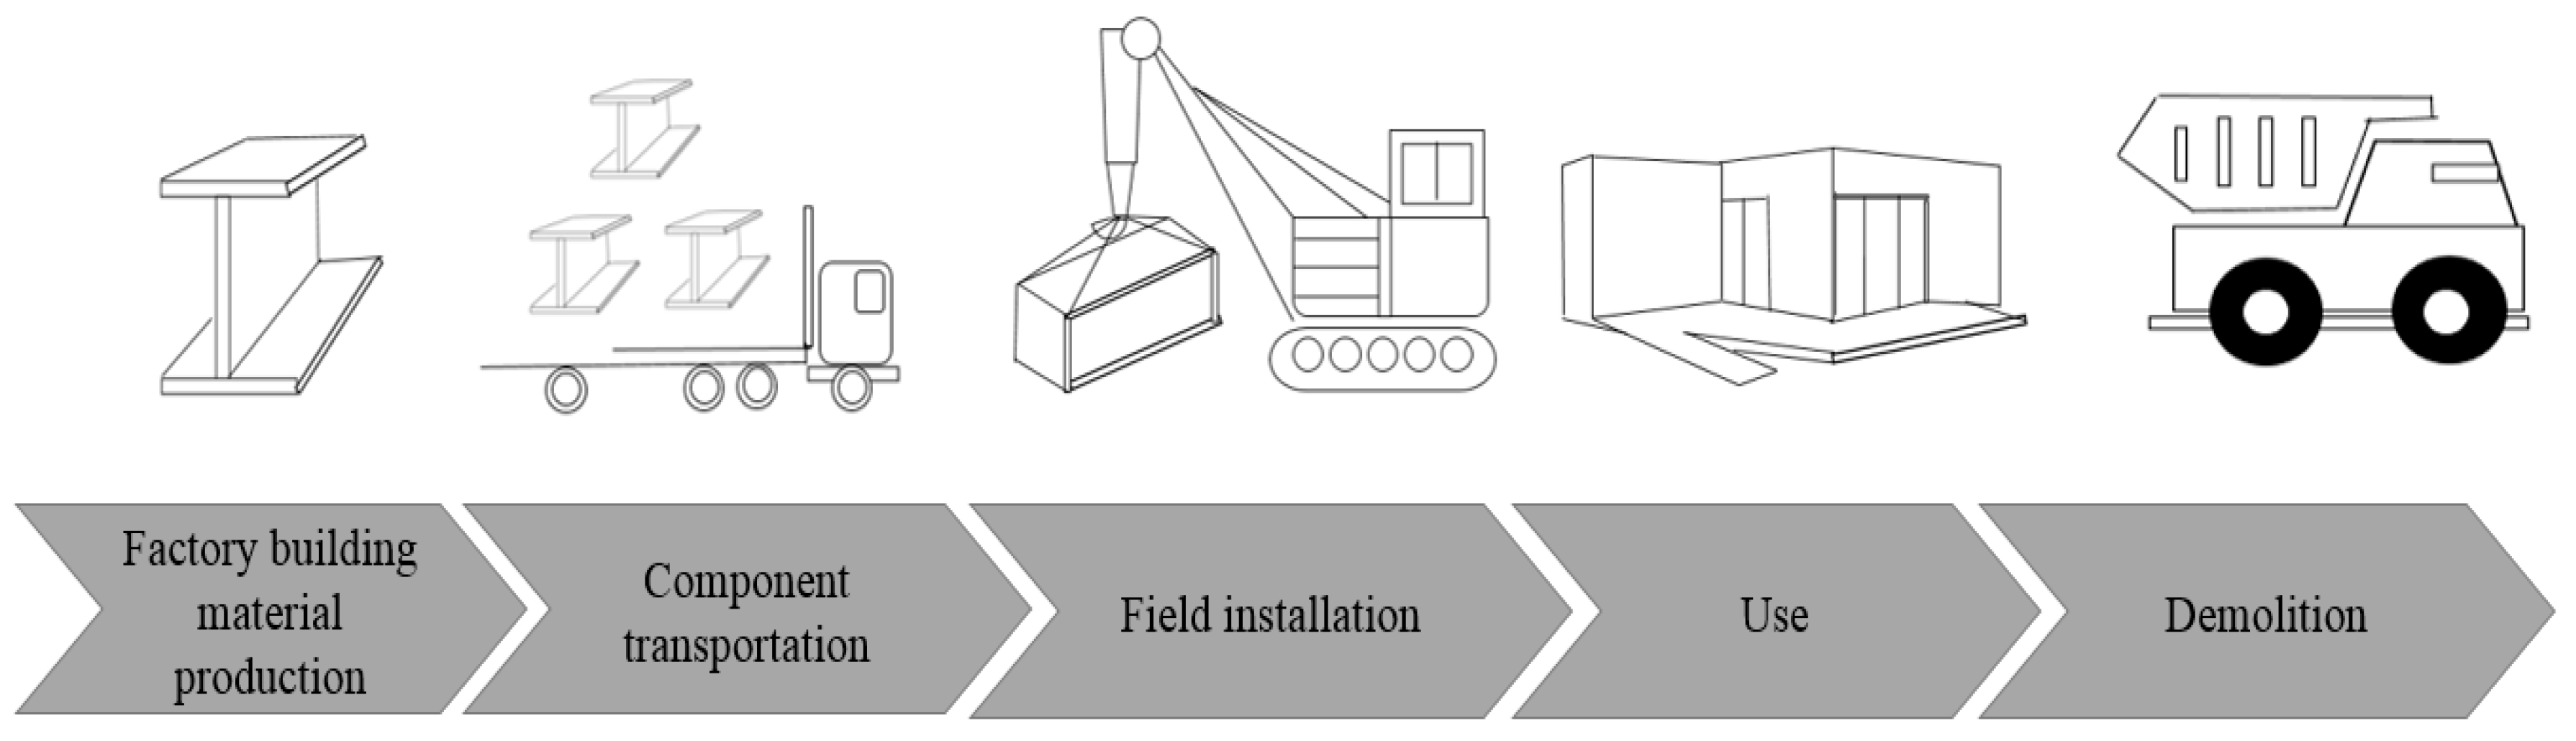
- Factory building materials production
- Component transportation
- Field installation
- Use
- Demolition
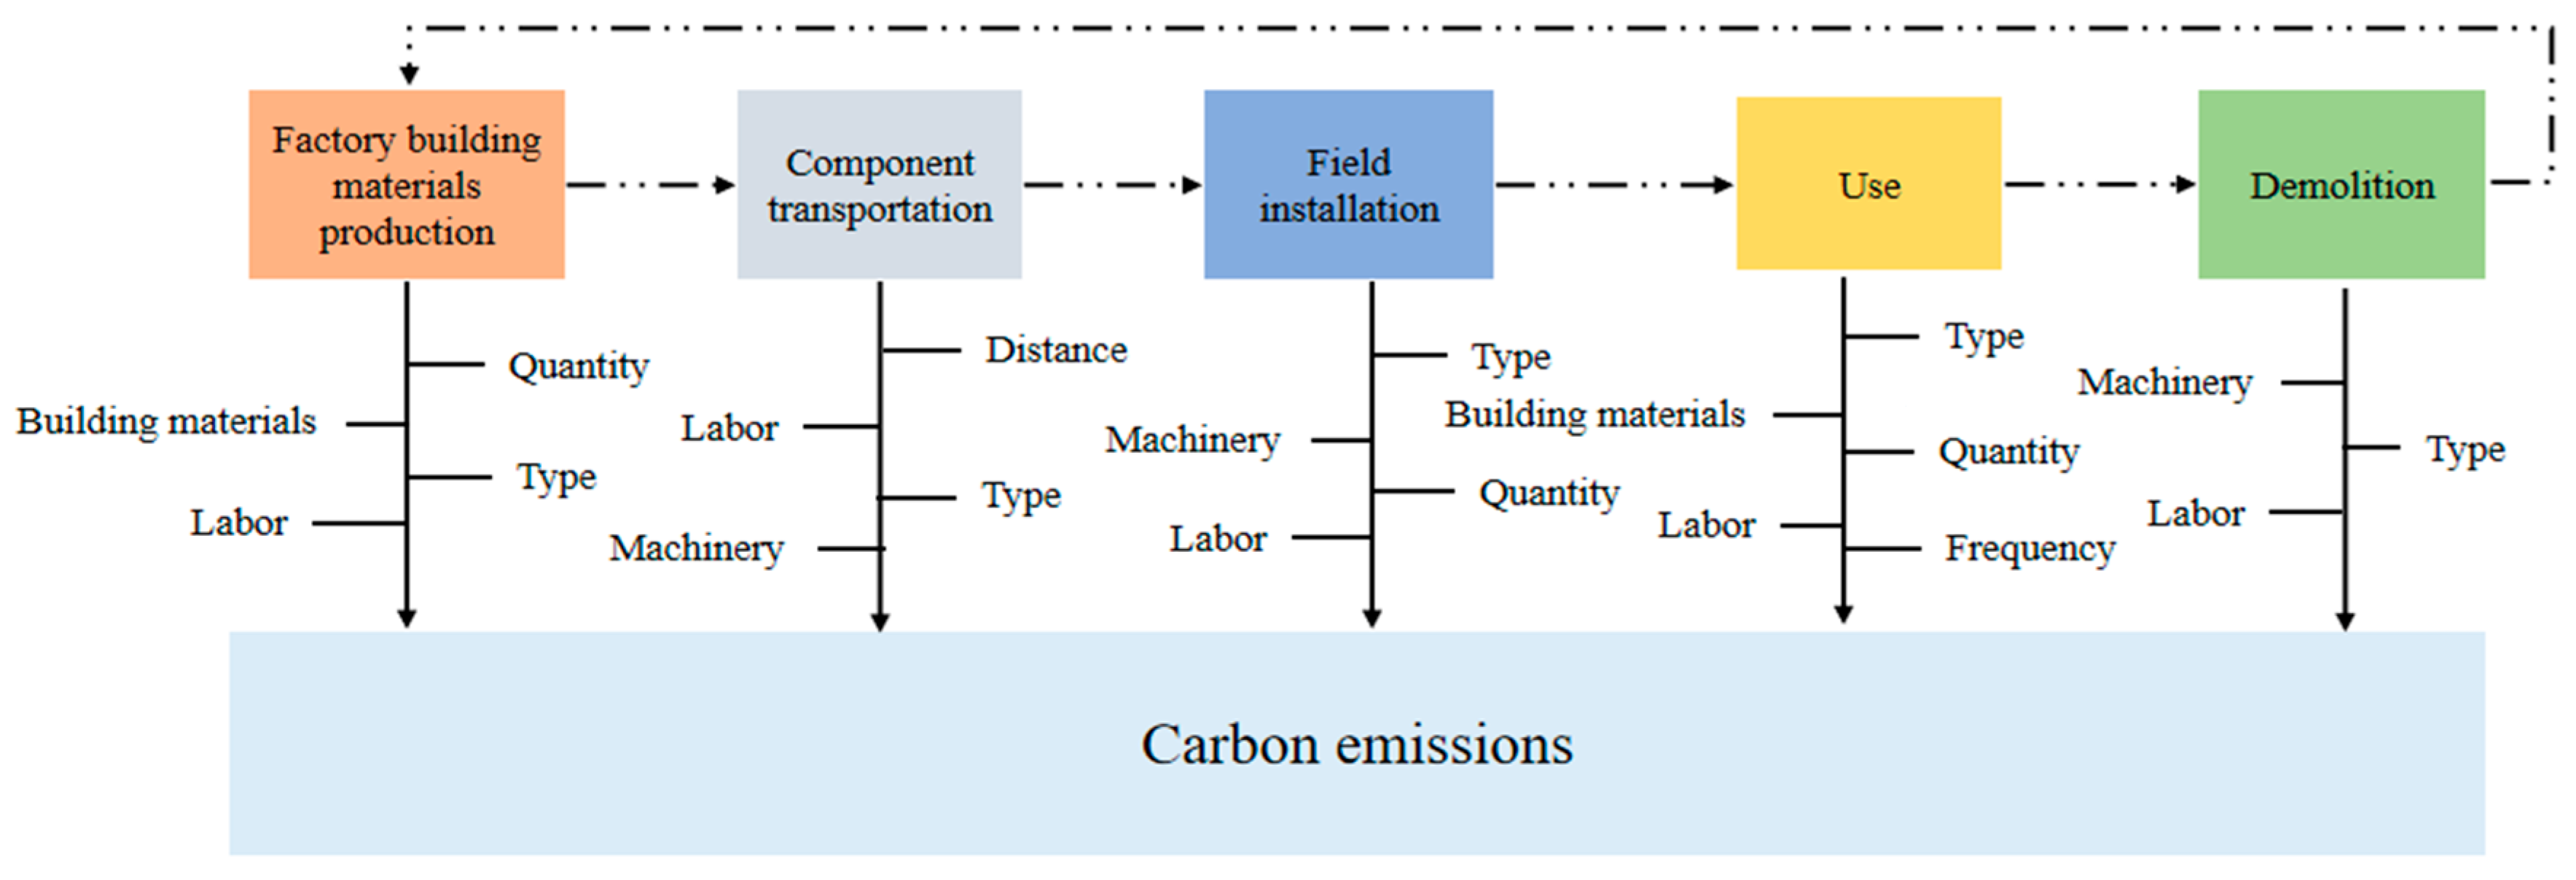
2.1. Carbon Emissions Model
2.2. Analysis of Carbon Emission Sources at Each Stage
3. Differences in Carbon Emissions
4. Case Analysis
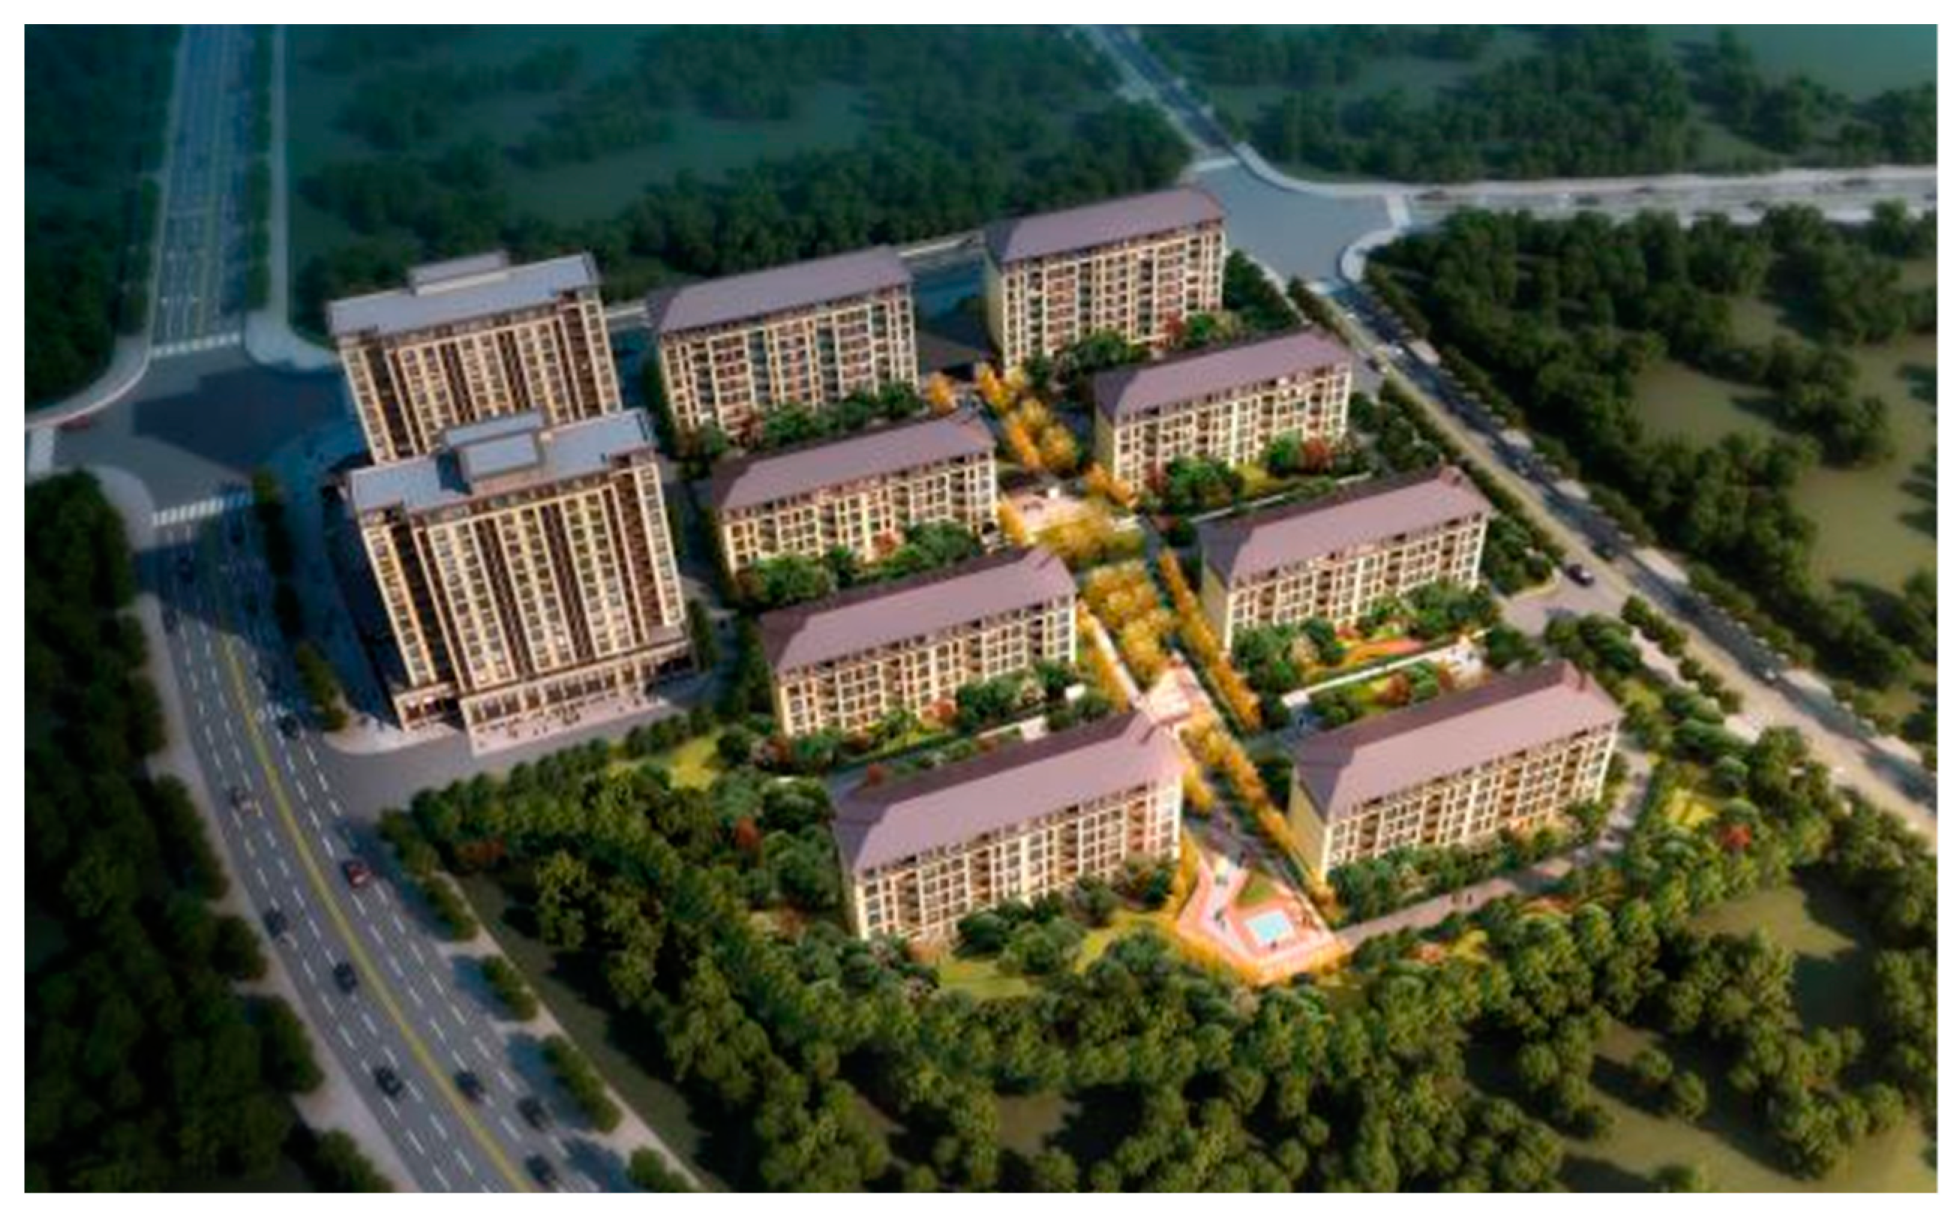
4.1. Project Background
4.2. Project Analysis
5. Discussion
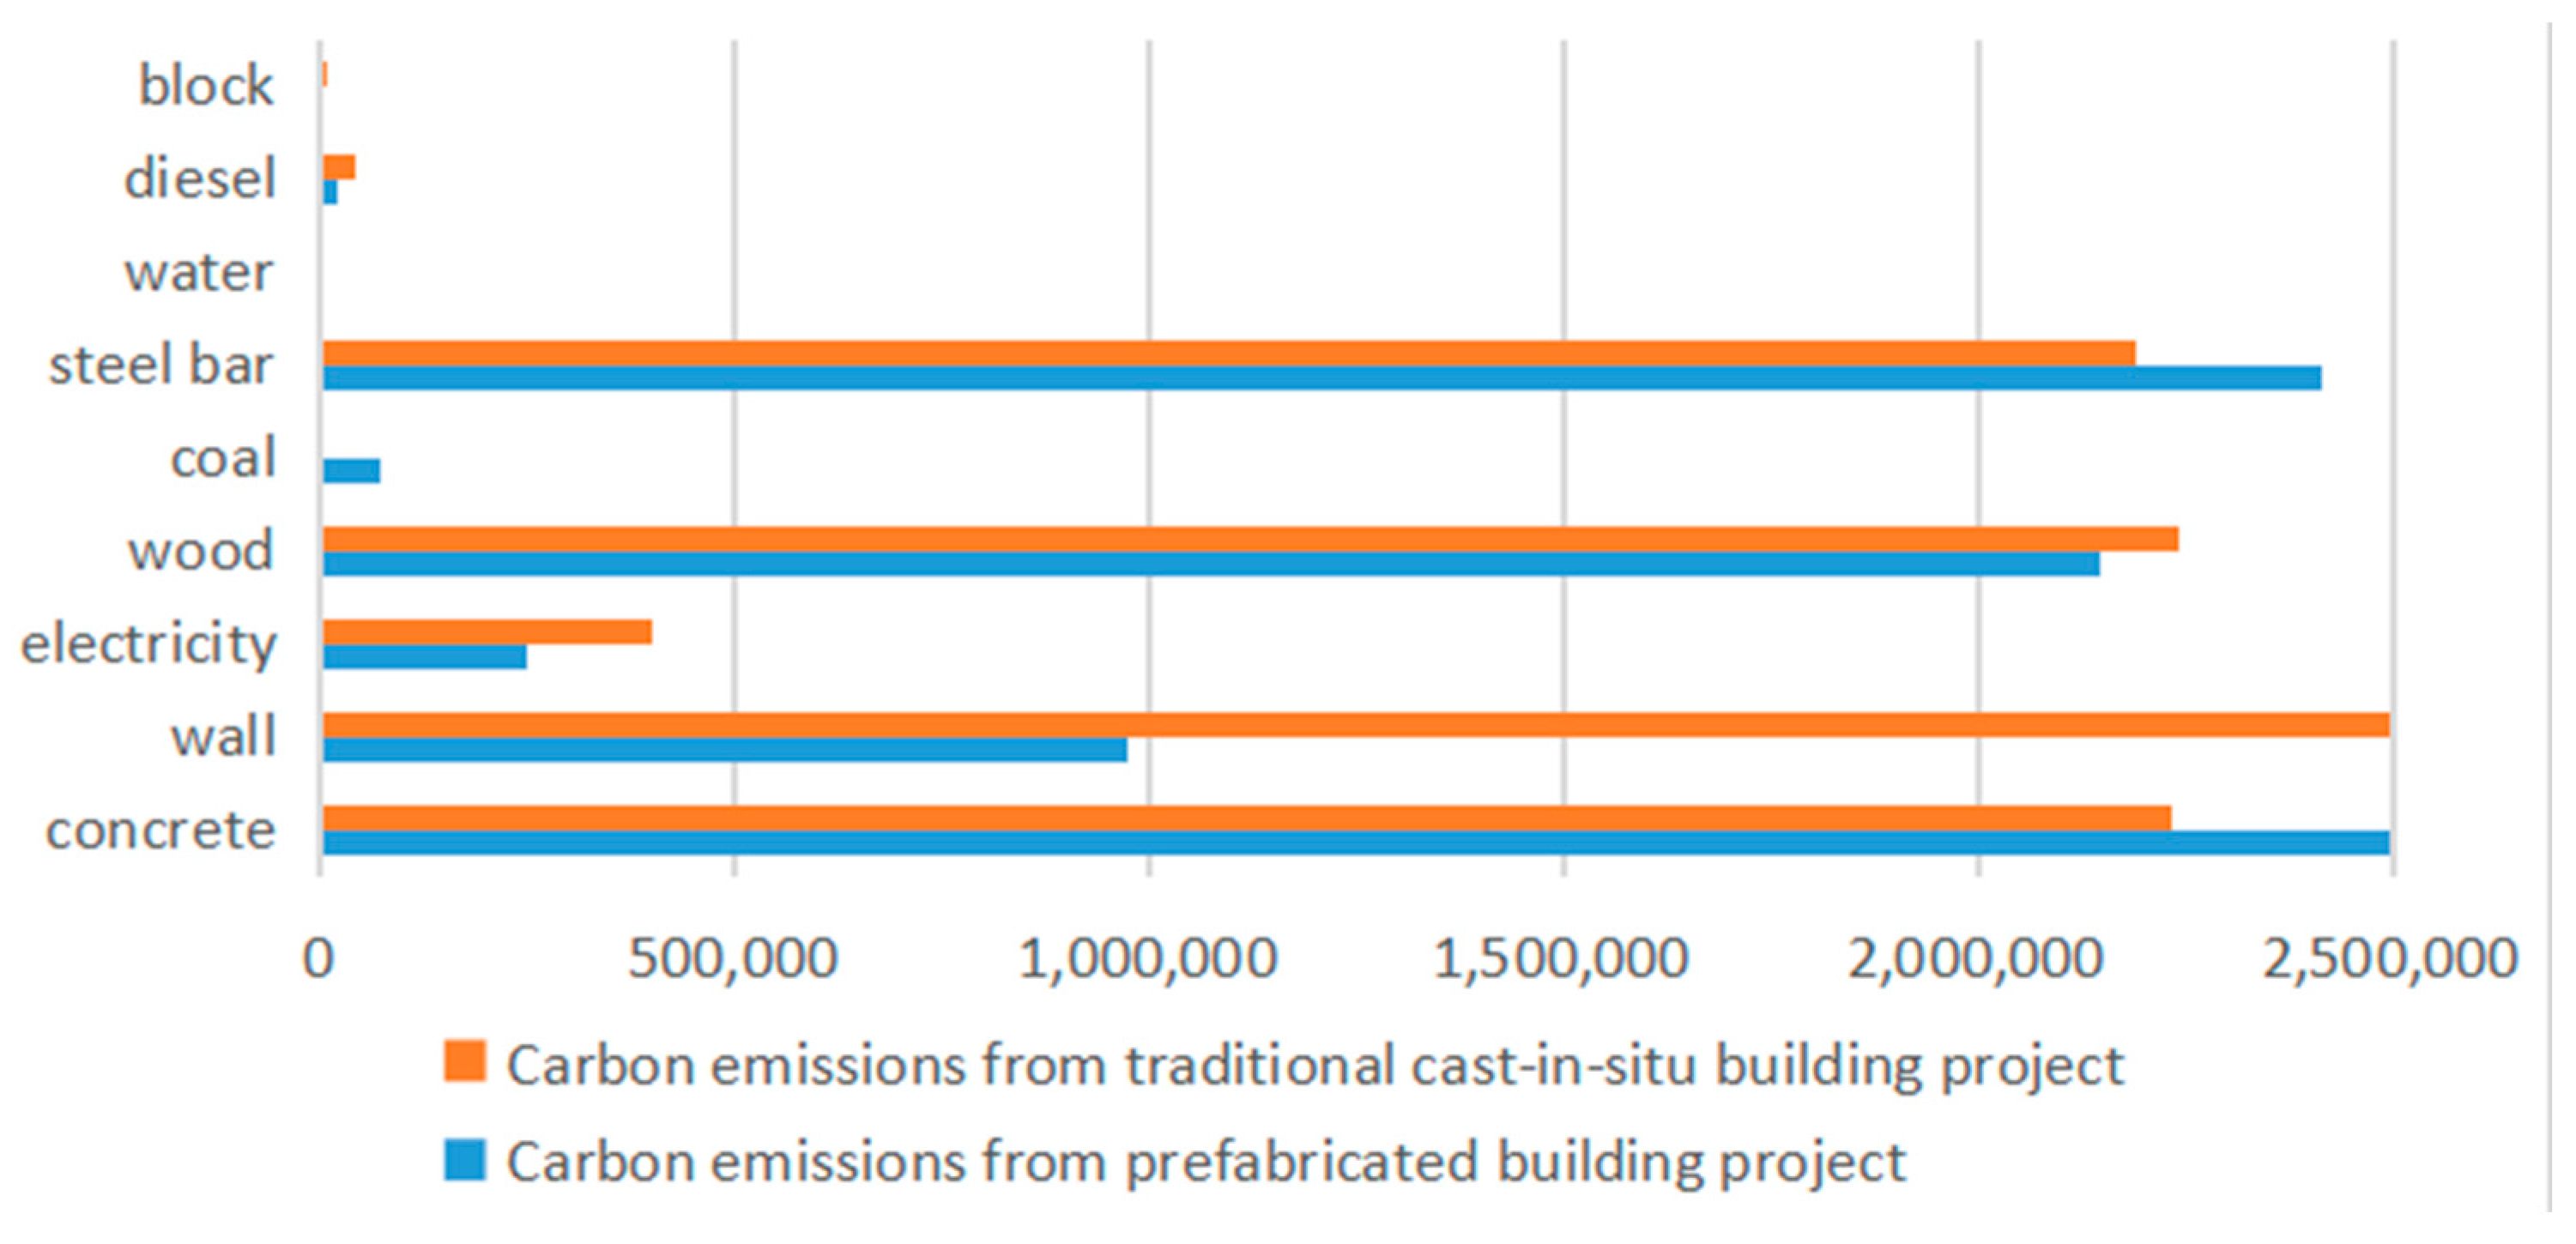
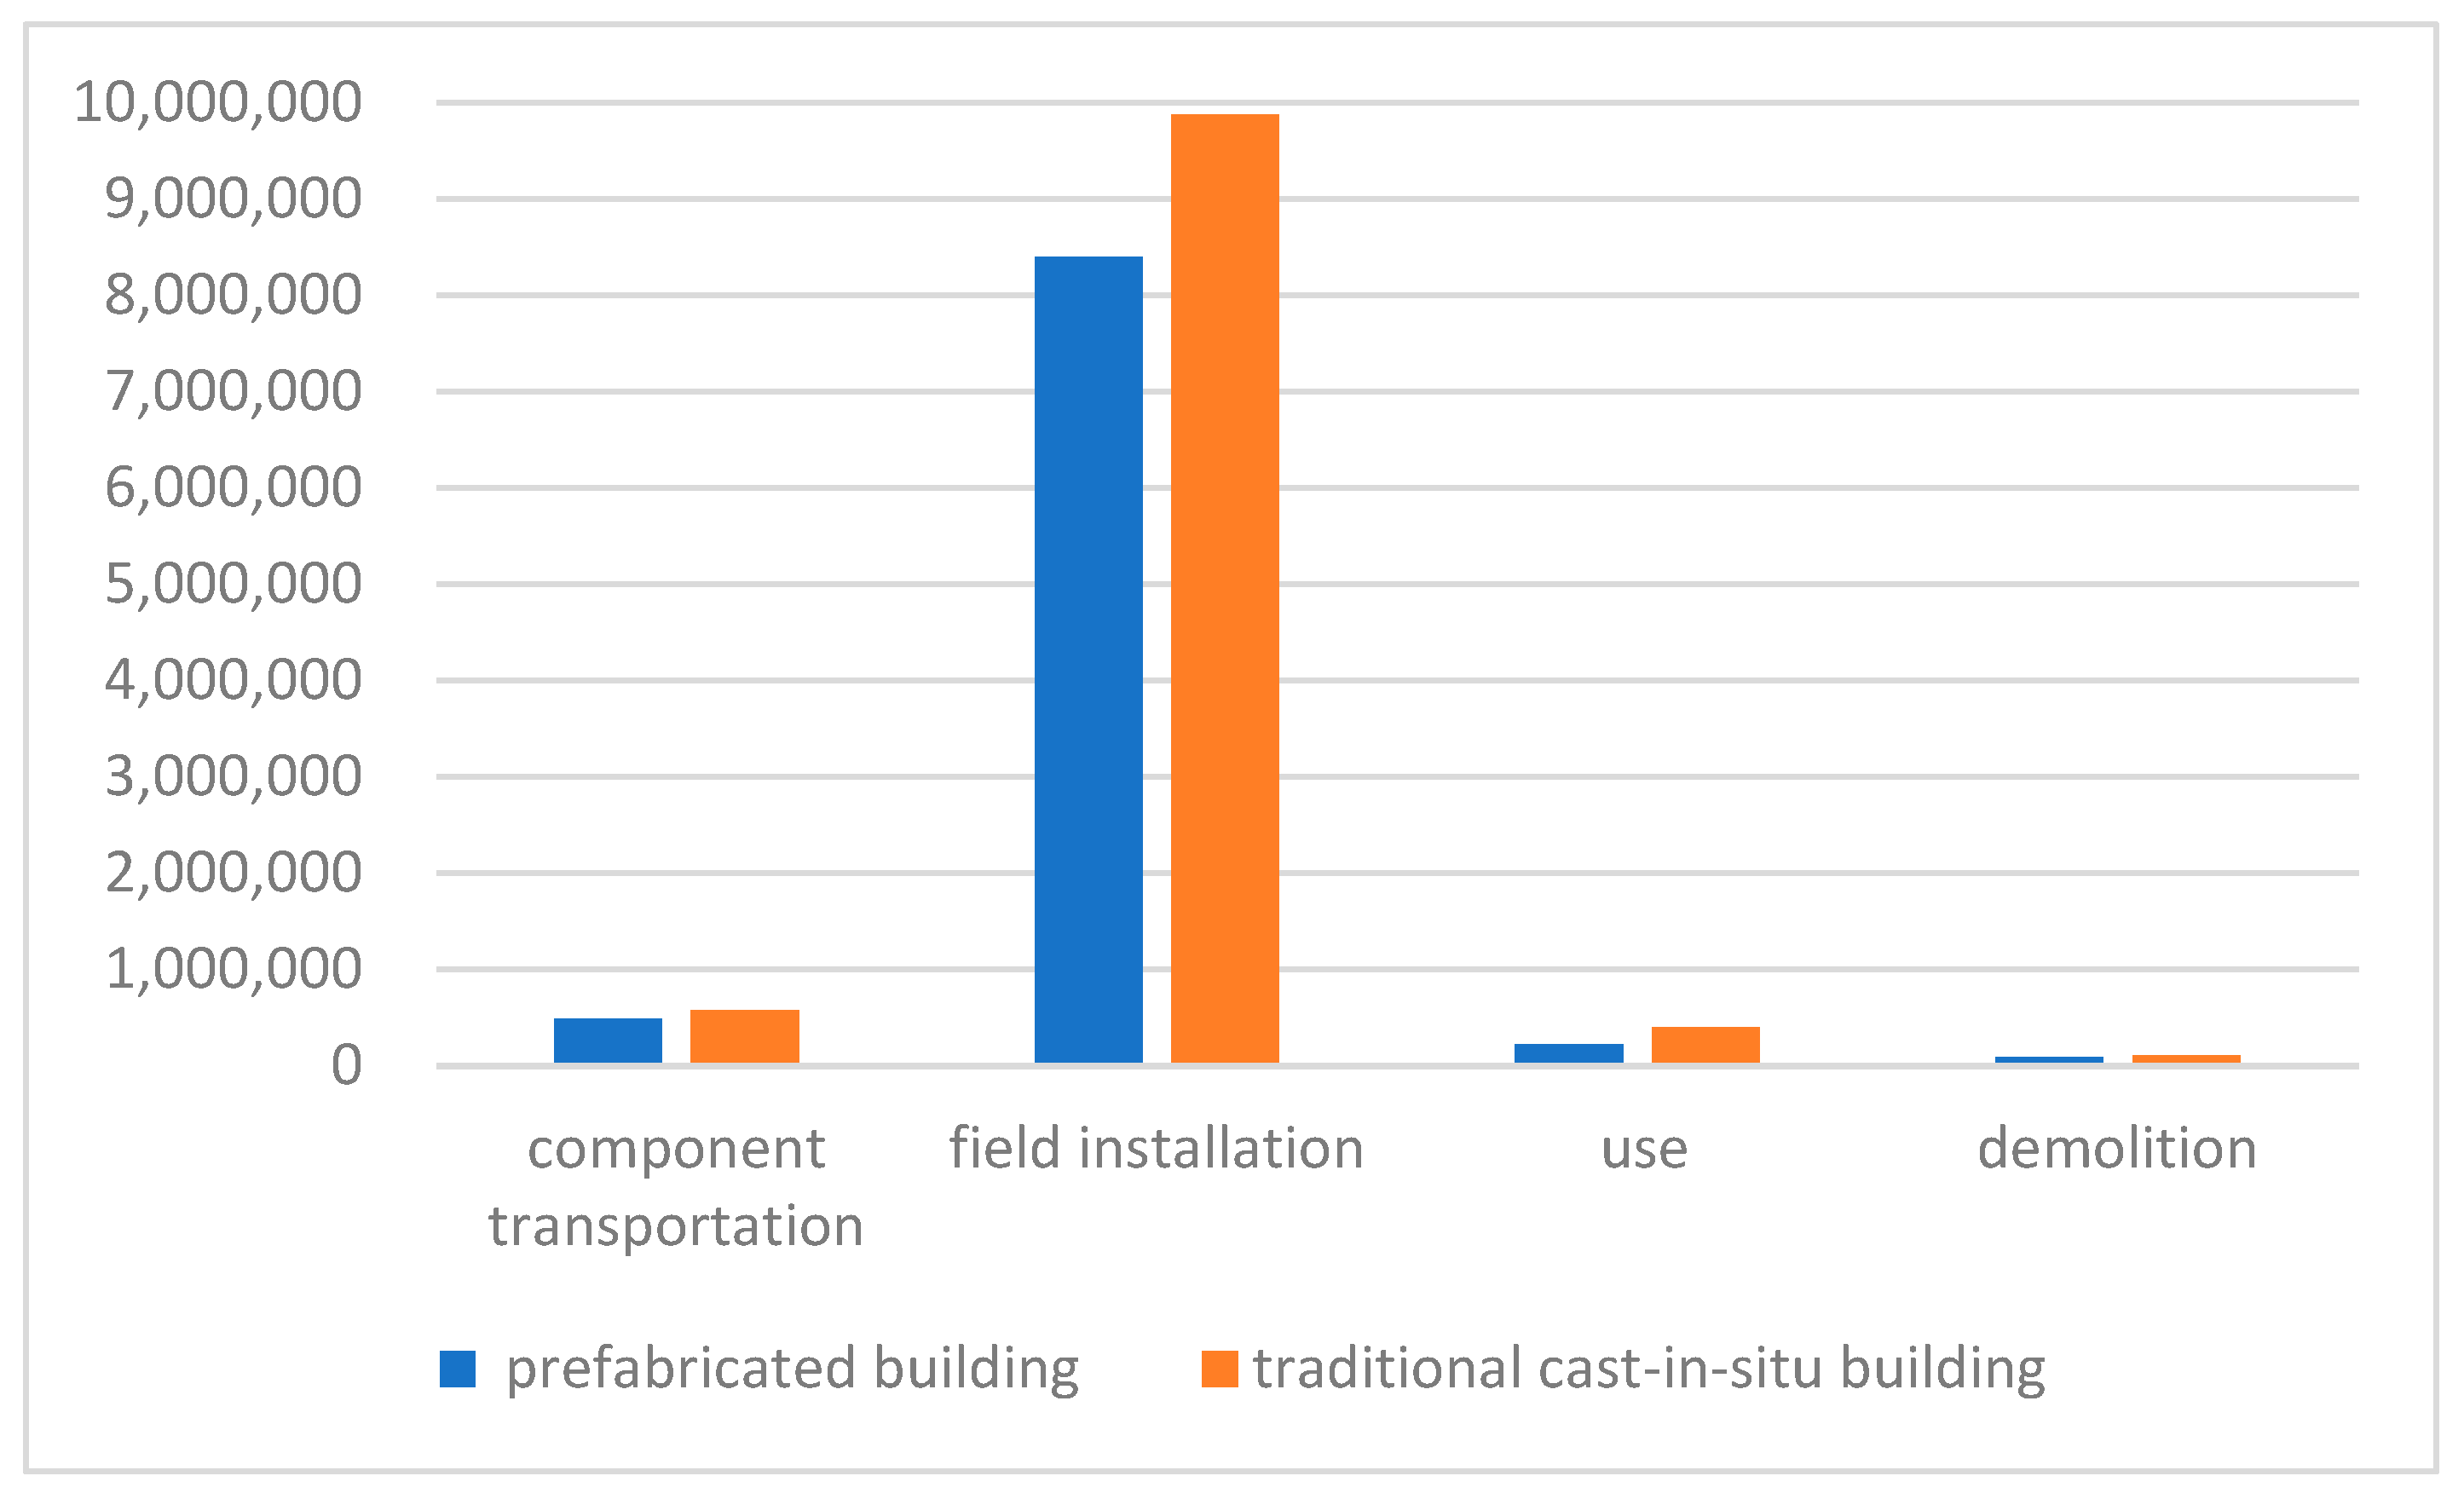
5.1. Analyze the Carbon Emissions Produced at Each Stage
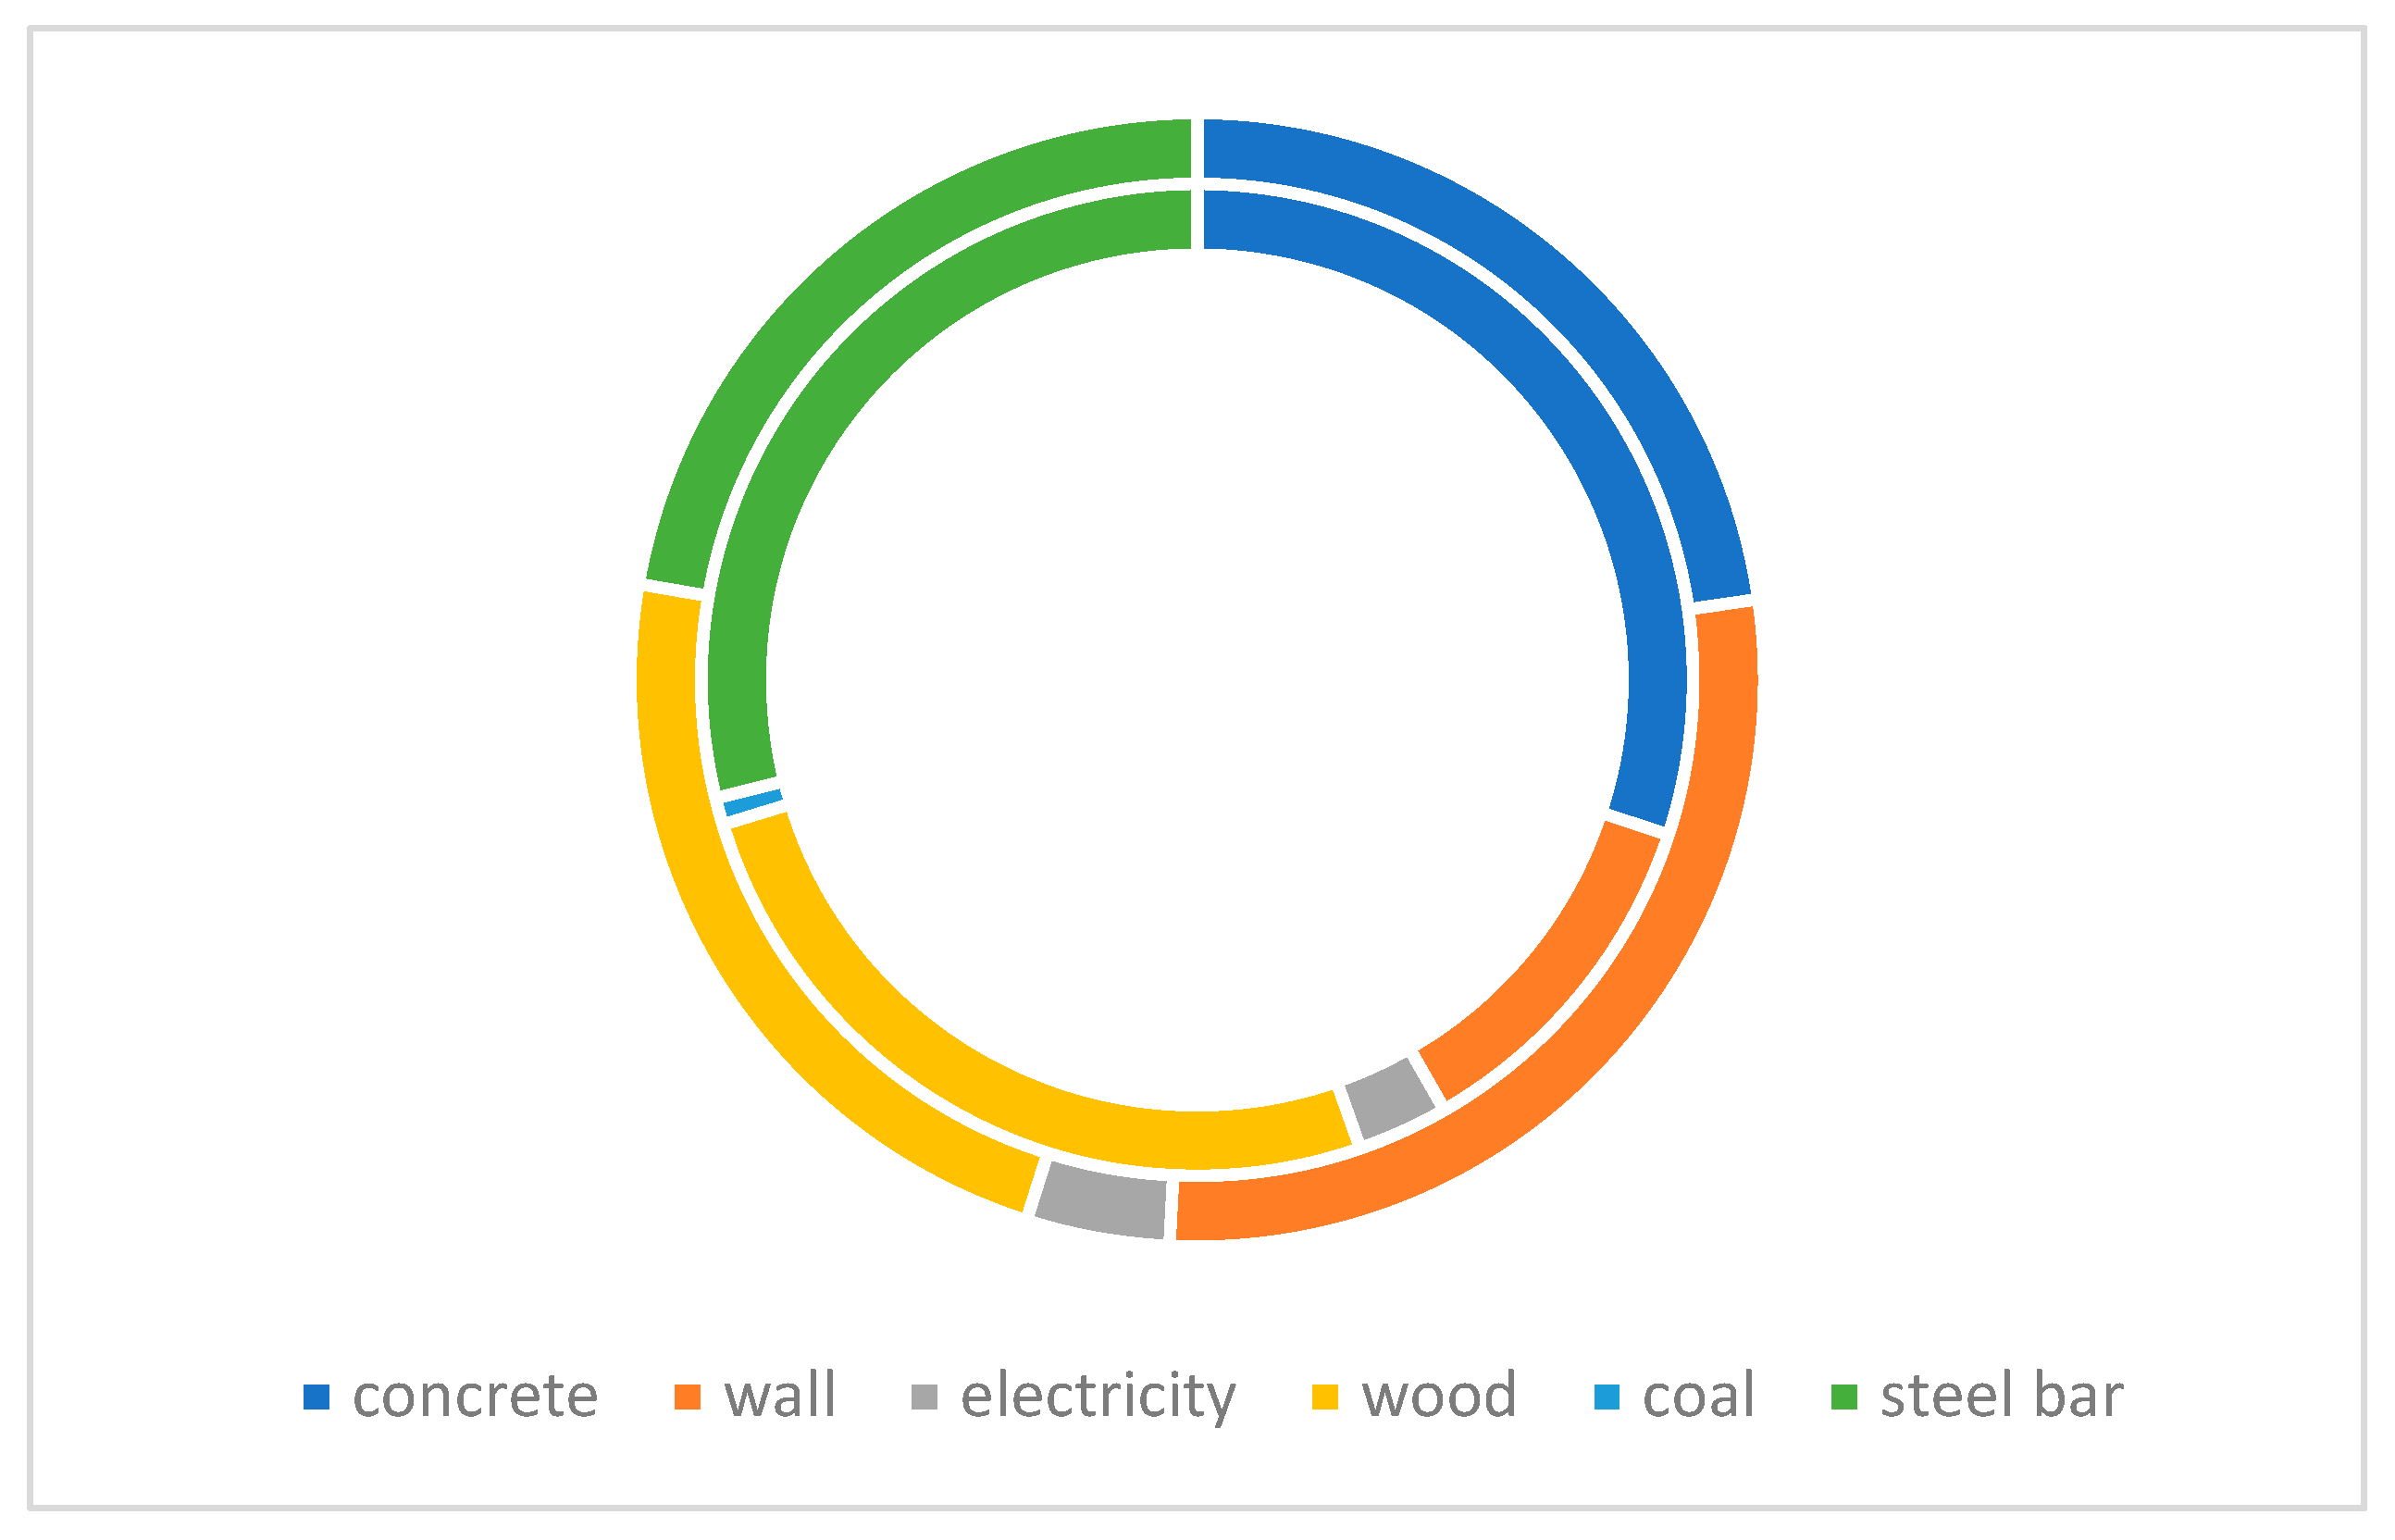
5.2. Analysis of the Influence of Building Materials on Carbon Emissions
5.3. Emissions Reduction Recommendations
6. Conclusions
Author Contributions
Funding
Data Availability Statement
Acknowledgments
Conflicts of Interest
Acronyms
| IPCC | Intergovernmental Panel on Climate Change |
| LCA | Life Cycle Assessment |
| ISO | International Standardization Organization |
| PPR | Polypropylene-Random |
| PVC | Polyvinylchlorid |
| CNY | Renminbi Chinese Yuan |
References
- Wang, Z.; Hong, T.; Li, H.; Ann Piette, M. Predicting city-scale daily electricity consumption using data-driven models. Adv. Appl. Energy 2021, 2, 100025. [Google Scholar] [CrossRef]
- United Nations Environment Programme. 2020 Global Status Report for Buildings and Construction: Towards a Zero-Emission, Efficient and Resilient Buildings and Construction Sector; Global Alliance for Buildings and Construction: Nairobi, Kenya, 2022. [Google Scholar]
- UN Environment (UNE); International Energy Agency (IEA). Towards a Zero-Emission, Efficient, and Resilient Buildings and Construction Sector; Global Status Report 2017; UN Environment (UNE): Nairobi, Kenya; International Energy Agency (IEA): Paris, France, 2017. [Google Scholar]
- Zhang, Y.; He, C.Q.; Tang, B.J.; Wei, Y.M. China’s energy consumption in the building sector: A life cycle approach. Energy Build. 2015, 94, 240–251. [Google Scholar] [CrossRef]
- Wu, X.; Peng, B.; Lin, B. A dynamic life cycle carbon emission assessment on green and non-green buildings in China. Energy Build. 2017, 149, 272–281. [Google Scholar] [CrossRef]
- Intergovernmental Panel on Climate Change (IPCC). Climate Change 2014: Mitigation of Climate Change. Contribution of Working Group III to the Fifth Assessment Report of the Intergovernmental Panel on Climate Change; Edenhofer, O., Pichs-Madruga, R., Sokona, Y., Farahani, E., Kadner, S., Seyboth, K., Adler, A., Baum, I., Brunner, S., Eickemeier, P., et al., Eds.; Cambridge University Press: Cambridge, UK; New York, NY, USA, 2014. [Google Scholar]
- Tam, V.W.; Tam, C.M.; Zeng, S.X.; Ng, W.C. Towards adoption of prefabrication in construction. Build. Environ. 2007, 42, 3642–3654. [Google Scholar] [CrossRef] [Green Version]
- Zhong, R.Y.; Peng, Y.; Xue, F.; Fang, J.; Zou, W.; Luo, H.; Huang, G.Q. Prefabricated construction enabled by the Internet-of-Things. Autom. Constr. 2017, 76, 9–70. [Google Scholar]
- Dong, Y.H.; Jaillon, L.; Chu, P.; Poon, C.S. Comparing carbon emissions of precast and cast-in-situ construction methods—A case study of high-rise private building. Constr. Build. Mater. 2015, 99, 39–53. [Google Scholar] [CrossRef]
- Ji, Y.; Li, K.; Liu, G.; Shrestha, A.; Jing, J. Comparing greenhouse gas emissions of precast in-situ and conventional construction methods. J. Clean. Prod. 2018, 173, 124–134. [Google Scholar] [CrossRef]
- Sandanayake, M.; Luo, W.; Zhang, G. Direct and indirect impact assessment in off-site construction—A case study in China. Sustain. Cities Soc. 2020, 48, 101520. [Google Scholar] [CrossRef]
- Du, Q.; Bao, T.; Li, Y.; Huang, Y.; Shao, L. Impact of prefabrication technology on the cradle-to-site CO2 emissions of residential buildings. Clean Technol. Environ. Policy 2019, 21, 1499–1514. [Google Scholar] [CrossRef]
- Cao, X.; Li, X.; Zhu, Y.; Zhang, Z. A comparative study of environmental performance between prefabricated and traditional residential buildings in China. J. Clean. Prod. 2015, 109, 131–143. [Google Scholar] [CrossRef]
- Liu, M.; Jia, S.; Liu, X. Evaluation of mitigation potential of GHG emissions from the construction of prefabricated subway station. J. Clean. Prod. 2019, 236, 117700. [Google Scholar] [CrossRef]
- Mao, C.; Shen, Q.; Shen, L.; Tang, L. Comparative study of greenhouse gas emissions between off-site prefabrication and conventional construction methods: Two case studies of residential projects. Energy Build. 2013, 66, 165–176. [Google Scholar] [CrossRef] [Green Version]
- Finnveden, G.; Hauschild, M.Z.; Ekvall, T.; Guinee, J.; Heijungs, R.; Hellweg, S.; Suh, S. Recent developments in Life Cycle Assessment. J. Environ. Manag. 2009, 91, 1–21. [Google Scholar] [CrossRef] [PubMed]
- Bonamente, E.; Merico, M.C.; Rinaldi, S.; Pignatta, G.; Pisello, A.L.; Cotana, F.; Nicolini, A. Environmental Impact of Industrial Prefabricated Buildings: Carbon and Energy Footprint Analysis Based on an LCA Approach. Energy Procedia 2014, 61, 2841–2844. [Google Scholar] [CrossRef] [Green Version]
- Achenbach, H.; Wenker, J.L.; Rüter, S. Life cycle assessment of product- and construction stage of prefabricated timber houses: A sector representative approach for Germany according to EN 15804, EN 15978 and EN 16485. Eur. J. Wood WoodProd. 2018, 76, 711–729. [Google Scholar] [CrossRef]
- Liu, G.; Gu, T.; Xu, P.; Hong, J.; Shrestha, A.; Martek, I. A production line-based carbon emission assessment model for prefabricated components in China. J. Clean. Prod. 2019, 209, 30–39. [Google Scholar] [CrossRef]
- Ding, Z.; Liu, S.; Luo, L.; Liao, L. A building information modeling-based carbon emission measurement system for prefabricated residential buildings during the materialization phase. J. Clean. Prod. 2020, 264, 121728. [Google Scholar]
- Aye, L.; Ngo, T.; Crawford, R.H.; Gammampila, R.; Mendis, P. Life cycle greenhouse gas emissions and energy analysis of prefabricated reusable building modules. Energy Build. 2012, 47, 159–168. [Google Scholar]
- Bonamente, E.; Cotana, F. Carbon and Energy Footprints of Prefabricated Industrial Buildings: A Systematic Life Cycle Assessment Analysis. Energies 2015, 8, 12685–12701. [Google Scholar] [CrossRef] [Green Version]
- Wang, H.; Zhang, Y.; Gao, W.; Kuroki, S. Life Cycle Environmental and Cost Performance of Prefabricated Buildings. Sustainability 2020, 12, 2609. [Google Scholar] [CrossRef] [Green Version]
- The State Council of the People’s Republic of China (SCC). Some Opinions of the CPC Central Committee and the State Council on Further Strengthening the Management of Urban Planning and Construction; The State Council of the People’s Republic of China (SCC): Beijing, China, 2016.
- Chang, Y.; Li, X.; Masanet, E.; Zhang, L.; Huang, Z.; Ries, R. Unlocking the green opportunity for prefabricated buildings and construction in China. Resour. Conserv. Recycl. 2018, 139, 259–261. [Google Scholar] [CrossRef]
- Sun, J. Autoclaved Aerated Concrete Block Prefabricated Multi-Storey Building Technology. J. World Archit. 2022, 2, 1–4. [Google Scholar] [CrossRef]
- Chen, H.; Chen, W. Potential impacts of coal substitution policy on regional air pollutants and carbon emission reductions for China’s building sector during the 13th Five-Year Plan period. Energy Policy 2019, 131, 281–294. [Google Scholar] [CrossRef]
- Geng, A.; Zhang, H.; Yang, H. Greenhouse gas reduction and cost efficiency of using wood flooring as an alternative to ceramic tile: A case study in China. J. Clean. Prod. 2017, 166, 438–448. [Google Scholar] [CrossRef]


| Type | Carbon Emission Factor | Prefabricated Building Project | Carbon Emissions from Prefabricated Building Project (kg) | Traditional Cast-in-Situ Building Project | Carbon Emissions from Traditional Cast-in-Situ Building Project (kg) |
|---|---|---|---|---|---|
| concrete | 321.3 kgCO2eq/m3 | 7837.3982 | 2,518,156.052 | 6949.3405 | 2,232,823.103 |
| steel bar | 2617 kg CO2eq/t | 922.8561014 | 2,415,114.417 | 836.506101 | 2,189,136.466 |
| block | 0.4826 kgCO2q/m3 | 946.5242 | 456.7925789 | 8130.4023 | 3923.73215 |
| wood | 33.1 kgCO2eq/m3 | 64,831.04143 | 2,145,907.471 | 67,783.9406 | 2,243,648.434 |
| wall | 334.8 kgCO2eq/m3 | 2911.34 | 974,716.632 | 8228.3 | 2,754,834.84 |
| water | 0.1891 kgCO2eq/m3 | 1422.12 | 268.922892 | 3047.4 | 576.26334 |
| diesel | 3.67 kgCO2q/kg | 5688.48 | 20,876.7216 | 11,783.28 | 43,244.6376 |
| electricity | 0.97 kgCO2eq/kw·h | 257,810.04 | 250,075.7388 | 414,446.4 | 402,013.008 |
| coal | 2.89 kgCO2eq/kg | 25,395 | 73,391.55 | 0 | 0 |
| Total | 8,398,964.299 | 9,870,200.484 |
| Material | Carbon Emission Factor | Prefabricated Building Project | Carbon Emissions from Prefabricated Building Project(kg) | Traditional Cast-in-Situ Building Project | Carbon Emissions from Traditional Cast-in-Situ Building Project (kg) |
|---|---|---|---|---|---|
| concrete block | 0.4826 kgCO2eq/m3 | 40 | 19.304 | 70 | 33.782 |
| Fine aggregate concrete | 298.7 kgCO2eq/m3 | 40 | 11,948 | 60 | 17,922 |
| Structural concrete pouring | 321.3 kgCO2eq/m3 | 100 | 32,130 | 200 | 64,260 |
| plain cement slurry | 321.3 kgCO2eq/m2 | 110 | 35,343 | 250 | 80,325 |
| polymer mortar | 2.556 kgCO2eq/m2 | 60 | 153.36 | 180 | 460.08 |
| cement mortar | 469.4 kgCO2eq/m3 | 110 | 51,634 | 250 | 117,350 |
| putty | 5.394 kgCO2eq/m2 | 110 | 593.34 | 250 | 1348.5 |
| Insulation bonding adhesive, protective layer rubber slurry, alkali-resistant grid cloth | 3 kgCO2eq/m2 | 50 | 150 | 180 | 540 |
| tap water PPR pipe | 0.5 kgCO2eq/m | 160 | 80 | 320 | 160 |
| wire PVC pipe | 1 kgCO2eq/m | 170 | 170 | 360 | 360 |
| plastic wire groove | 0.7 kgCO2eq/m | 160 | 112 | 320 | 224 |
| coal | 2.89 kgCO2eq/kg | 31,896.12 | 92,179.7868 | 38,803.56 | 112,142.2884 |
| Total | 224,512.7908 | 395,125.6504 |
Disclaimer/Publisher’s Note: The statements, opinions and data contained in all publications are solely those of the individual author(s) and contributor(s) and not of MDPI and/or the editor(s). MDPI and/or the editor(s) disclaim responsibility for any injury to people or property resulting from any ideas, methods, instructions or products referred to in the content. |
© 2023 by the authors. Licensee MDPI, Basel, Switzerland. This article is an open access article distributed under the terms and conditions of the Creative Commons Attribution (CC BY) license (https://creativecommons.org/licenses/by/4.0/).
Share and Cite
Zhou, F.; Ning, Y.; Guo, X.; Guo, S. Analyze Differences in Carbon Emissions from Traditional and Prefabricated Buildings Combining the Life Cycle. Buildings 2023, 13, 874. https://doi.org/10.3390/buildings13040874
Zhou F, Ning Y, Guo X, Guo S. Analyze Differences in Carbon Emissions from Traditional and Prefabricated Buildings Combining the Life Cycle. Buildings. 2023; 13(4):874. https://doi.org/10.3390/buildings13040874
Chicago/Turabian StyleZhou, Fang, Yibo Ning, Xinran Guo, and Sandang Guo. 2023. "Analyze Differences in Carbon Emissions from Traditional and Prefabricated Buildings Combining the Life Cycle" Buildings 13, no. 4: 874. https://doi.org/10.3390/buildings13040874