Article

Evaluation of Optimal Mechanical Ventilation Strategies for Schools for Reducing Risks of Airborne Viral Infection

1
Architecture Department, Faculty of Architecture and Planning, King Abdulaziz University, Jeddah 21589, Saudi Arabia
2
Department of Architectural Engineering, Faculty of Engineering-Rabigh Branch, King Abdulaziz University, Jeddah 21589, Saudi Arabia
3
Building Systems Program, Civil, Environmental, and Architectural Engineering Department, Collage of Engineering and Applied Science, University of Colorado Boulder, Boulder, CO 80309, USA
4
Planning Department, Faculty of Architecture and Planning, King Abdulaziz University, Jeddah 21589, Saudi Arabia
*
Author to whom correspondence should be addressed.
Buildings 2023, 13(4), 871; https://doi.org/10.3390/buildings13040871
Submission received: 18 February 2023 / Revised: 11 March 2023 / Accepted: 24 March 2023 / Published: 26 March 2023
(This article belongs to the Special Issue Advances in the Indoor Environments and Respiratory Health)

Abstract

:
Ventilation systems are one of the most effective strategies to reduce the risk of viral infection transmission in buildings. However, insufficient ventilation rates in crowded spaces, such as schools, would lead to high risks of infection transmission. On the other hand, excessive ventilation rates might significantly increase cooling energy consumption. Therefore, energy-efficient control methods, such as Demand Control Ventilation systems (DCV), are typically considered to maintain acceptable indoor air quality. However, it is unclear if the DCV-based controls can supply adequate ventilation rates to minimize the probability of infection (POI) in indoor spaces. This paper investigates the benefits of optimized ventilation strategies, including conventional mechanical systems (MV) and DCV, in reducing the POI and cooling energy consumption through a detailed sensitivity analysis. The study also evaluates the impact of the ventilation rate, social distancing, and number of infectors on the performance of the ventilation systems. A coupling approach of a calibrated energy model of a school building in Jeddah, KSA, with a validated Wells–Riley model is implemented. Based on the findings of this study, proper adjustment of the DCV set point is necessary to supply adequate ventilation rates and reduce POI levels. Moreover, optimal values of 2 ACH for ventilation rate and 2 m for social distance are recommended to deliver acceptable POI levels, cooling energy use, and indoor CO2 concentration for the school building. Finally, this study confirms that increasing the ventilation rate is more effective than increasing social distancing in reducing the POI levels. However, this POI reduction is achieved at the cost of a higher increase in the cooling energy.

1. Introduction

The recent global spread of the highly infectious coronavirus disease COVID-19 has encouraged the research community to focus on investigating transmission mechanisms of such respiratory infections while proposing effective strategies to reduce the spread of viruses and maintain healthy indoor environments. Recent reported studies have proposed and evaluated several methods to reduce or eliminate any virus concentration in buildings including ventilation systems, high-efficiency filtration, ultraviolet irradiation, air ionization, chemical disinfection, non-thermal plasma, and filter-based air cleaners [1,2]. These studies concluded that a combination of several methods is recommended for an effective reduction in viral concentration. However, ventilation systems are considered one of the most effective strategies to dilute airborne viral respiratory particles, and insufficient ventilation in crowded spaces, such as schools, would lead to high infection transmissions [3]. Strong correlations have been established between poor ventilations and COVID-19 transmissions within buildings [4]. Specifically, the World Health Organization (WHO) indicates that proper ventilation design and operation are critical to improve indoor air quality and reduce infection risks [5]. Even though ASHRAE 62.1 does not cover ventilation requirements for indoor environments subject to high virus concentrations, it is worth noting that ASHRAE 170-2017 [6] offers a set of recommendations for healthcare facilities to prevent airborne infections including a total air change per hour ranging between 6 and 12 ACH.
Recently, the Wells–Riley model has been used extensively to predict the probability of viral infections for indoor spaces and identify ventilation strategies to reduce airborne viral infections. This model uses the quanta emission rate to evaluate the risk of respiratory infections. The term quanta for the Wells–Riley model refers to a hypothetical dose of infectious particles that is able to infect 63% of susceptible hosts [7]. The original model assumes a steady-state quanta generation rate by infected occupants, and relies on a sink term that dilutes the quanta concentration to represent the ventilation rate [8]. Thus, and according to the Wells–Riley model, an increase in ventilation rate would exponentially minimize the probability of viral infection in a confined space. Aganovic et al. [8] applied the Wells–Riley model with calibrated quanta emission rates for SARS-CoV-2 to establish a simplified correlation that can be used to estimate the ventilation rate for a specific quanta emission rate needed to control infection risk in indoor spaces. Dai and Zhao [9] evaluated the interactions between ventilation rates and the infection probability levels using the Wells–Riley model to estimate thresholds for the quantum COVID-19 generation rates through regression analysis.
Since its original development by Riley et al. [10] in 1978, the Wells–Riley model went through a series of adjustments to overcome some of its limitations. For instance, Gammaitoni and Nucci [11] modified the Wells–Riley model by replacing the steady-state variable of the quanta concentration with a transient term to account for the rate of change in quanta concentration with time. In addition, Aganovic et al. [8] developed a novel modified version of the Wells–Riley model to predict the infection transmission as a function of relative humidity to account for the effects associated with the evaporation of respiratory droplets on the gravitational settling and the biological decay of the virus. Later, Sun and Zhai [12] modified the Wells–Riley model to investigate the influence of social distancing and ventilation type on the probability of infection in buildings. More recently, Sha et al. [13] introduced a modified version of the Wells–Riley model by combining dilution ventilation rate and ventilative cooling to evaluate the impact of mechanical ventilation systems on viral transmissions for high-rise buildings. Furthermore, as the original Wells–Riley model is unable to accurately represent the non-uniform virus concentration, due to the well-mixed indoor air assumption, Tang et al. [14] utilized spatiotemporal and instantaneous CO2 measurements to adjust the Wells–Riley model to account for the uneven distribution of viral aerosols. A recent modified version of the Wells–Riley model, proposed by Li and Tang [15], combines the effect of airborne path and close contact route when predicting the probability of infection risk of COVID-19.
Several reported studies pointed out that CO2 concentration could be used as a tracer gas to estimate the airborne viral concentration and the corresponding probability of infection in buildings [16,17]. Therefore, the indoor CO2 concentration produced by occupants has been widely used as an infection risk proxy to evaluate indoor ventilation systems [18,19]. Hence, some studies suggested integrating CO2 concentration into the Wells–Riley model. In particular, Rudnick and Milton [20] suggested a modified non-steady-state Wells–Riley model by introducing CO2 concentration to determine the rebreathed fraction and predict the risk of infection transmission in buildings. Cammarata et al. [21] evaluated a comprehensive set of scenarios using the modified Wells–Riley model [20] and estimated the dynamic quanta of infection through CO2 concentration produced by occupants’ exhalation. Moreover, Peng and Jimenez [22] developed an analytical model using a CO2-based risk proxy derived specifically for COVID-19 to predict the probability of infection per ppm of excess CO2 inhaled within different indoor environments. A recent study by Stabile et al. [23] proposed virus and exhaled CO2 balance equations and simulated typical school scenarios to evaluate the required ventilation rate for mechanical ventilation systems and acceptable airing procedures for naturally ventilated schools. However, the study stated that “Adopting a CO2 concentration threshold as a possible proxy for virus transmission can be misrepresentative” and concluded that the CO2 concentration exhaled by occupants and the quanta concentration of viruses might show significant differences in behavioral trends [22].
Demand Control Ventilation (DCV) is another effective method to dynamically adjust ventilation rates according to actual ventilation demands based on CO2 concentration levels. Therefore, DCV is considered an energy-efficient control strategy to maintain acceptable indoor air quality. However, it is not clear if DCV-based controls can supply sufficient ventilation rates to minimize the probability of infection risk in indoor spaces. Some studies indicated that the energy savings obtained by the CO2-based DCV could be achieved at the cost of limiting ventilation rates when a higher ventilation is needed especially during airborne pandemic conditions [24]. Thus, other studies suggested turning off CO2-based ventilation systems to enhance ventilation performance during high-infection-risk periods [25,26]. Although CO2 was proposed as a proxy for viral infection risk, CO2 concentration is not necessarily a good indicator of an airborne viral infection risk; thus, the exposure to high CO2 concentration levels does not mean a higher possibility of being infected by a virus, and vice versa [26]. Instead, viral emission level could be a more effective indicator for ventilation demand systems to overcome infection risks; however, demand control ventilation methods operating based on viral quanta concentration typically require precise and detailed information on virus sources within the building, which is practically very difficult to measure and collect [27,28]. Therefore, developing optimized CO2-based DCV controls is needed to prevent viral infection risks while reducing cooling energy demands. In fact, there are several studies that have attempted to improve the effectiveness of DCV to limit the spread of viral infection in buildings. For instance, Wang et al. [29] presented a smart ventilation control approach with two DCV modes selected based on an occupancy density threshold. The two DCV modes consist of (i) a conventional DCV mode, and (ii) an anti-infection DCV mode in which the ventilation rate is determined based on the probability of infection risk using the Wells–Riley model. In the study, the occupancy density is determined using an advanced occupant detection algorithm through video frames from surveillance cameras [28]. The proposed control strategy provides an accurate estimation approach for the occupancy density and the potential number of infectors to determine the ventilation rate required to reduce infection risk transmission. However, the high cost of implementation of such advanced control strategies could limit its application. On the other hand, Li and Cai [30] proposed another novel, yet practical, CO2-based DCV system to reduce viral infection risk in buildings while minimizing energy use. The results of this study show that the suggested control strategy could effectively limit the spread of COVID-19 within indoor environments while obtaining 30% to 50% energy savings compared to the conventional ventilation systems with constant ventilation rates.
As outlined previously, a number of studies have investigated the effects of ventilation rates delivered by mechanical ventilation systems on the probability of infection in buildings. However, there are limited studies that have evaluated the energy efficiency impacts of reducing infection risks by increasing ventilation rates. Ma et al. [31] evaluated the potential of liquid desiccant technologies coupled with mechanical ventilation systems to efficiently prevent virus transmission risks. However, the study did not predict the infection probability and used a steady-state model to predict the energy use of the HVAC system. In addition, Schibuola and Tambani [32] proposed an autonomous high-efficiency ventilation unit combined with a thermal recovery system to maintain a healthy indoor environment for a school. Specifically, the system is designed and operated to deliver adequate ventilation rates with the main objective to reduce infection risks while minimizing energy consumption. The study predicted the infection risks by estimating the average quanta concentration for the indoor environment. The study reported that the proposed system can provide 60% to 72% energy savings compared to conventional systems. Moreover, Sha et al. [13] investigated the performance of a ventilation control strategy where dilution ventilation and ventilative cooling are considered to reduce COVID-19 transmission while minimizing the cooling energy consumption. The infection probability levels were estimated using a modified Wells–Riley model. The study reported up to 54% energy savings when using the proposed ventilation control approach. It is worth mentioning that most of the reported studies that have investigated the performance of mechanical ventilation systems, including DCV, were carried out for cold, moderate, and warm climates. Only limited analyses have been performed for harsh hot climates such as Saudi Arabia’s climate [33]. Therefore, this study focuses on evaluating the impact of mechanical ventilation rates on cooling energy use under the extreme hot summer conditions of Jeddah, KSA. Specifically, a summer design day (22 July) is selected to perform the analysis for a school in Jeddah to account for the maximum peak cooling demand and its impact on the mechanical ventilation performance.
It is worth noting that only a few studies utilized a detailed multizone simulation tool along with the Wells–Riley model to evaluate the risks of infection transmission while accounting for the indoor and outdoor conditions. For example, Yan et al. [34] proposed a modeling approach for estimating the risks of SARS-CoV-2 transmission in a mechanically ventilated multizone building using a multizone simulation tool (CONTAM) coupled with the Wells–Riley model. Alaidroos et al. [35] analyzed the probability of infection of a naturally ventilated historical building by coupling the Airflow-Network model in EnergyPlus with the Wells–Riley model to predict the effects of outdoor conditions, including wind speed and wind direction, on the ventilation rates and eventually on reducing the probability levels of viral infection. Additionally, Fageha and Alaidroos [36] used a co-simulation approach using EnergyPlus and Matlab to optimize natural ventilation performance in educational buildings to minimize the infection probability while preventing draught risk.
As demonstrated in the literature review, while several studies have suggested improving the mechanical ventilation to reduce the probability of infection in buildings, only few reported analyses have investigated the impacts of minimizing infection risks on the energy demand of the HVAC systems. Moreover, studies that have explored the impacts of preventing viral transmissions on the energy usage of HVAC systems have mainly considered control strategies such as DCV strategies, new control schemes, or supplemental systems such as liquid desiccant technologies and thermal recovery systems. There are no systematic analyses reported to optimize conventional mechanical ventilation systems with the objective to minimize infection risks while moderating cooling energy use. Additionally, while the Wells–Riley model has been widely used in predicting the infection probability in buildings, only limited studies have used the Wells–Riley model to evaluate the infection probability when integrated with a whole-building energy simulation environment. Hence, coupling the Wells–Riley model with a detailed building energy simulation tool can allow comprehensive evaluations of indoor infection risks with respect to indoor and outdoor building conditions. To address the noted research gap, this study investigates the benefits of optimized conventional mechanical ventilation systems to minimize both infection probability levels and cooling energy consumption through detailed sensitivity analyses to evaluate the impacts of several parameters such as ventilation rate, social distancing, and number of infectors. Furthermore, the study compares the performance of the mechanical ventilation systems and CO2-based DCV controls to assess their abilities to reduce the infection risks while lowering their air conditioning energy demands. In particular, the study utilizes an integrated modeling approach using whole-building energy simulation coupled with Wells–Riley modeling to predict the probability of infection risks and the cooling energy consumption based on a calibrated energy model for a school building located in Jeddah, KSA.

2. Materials and Methods

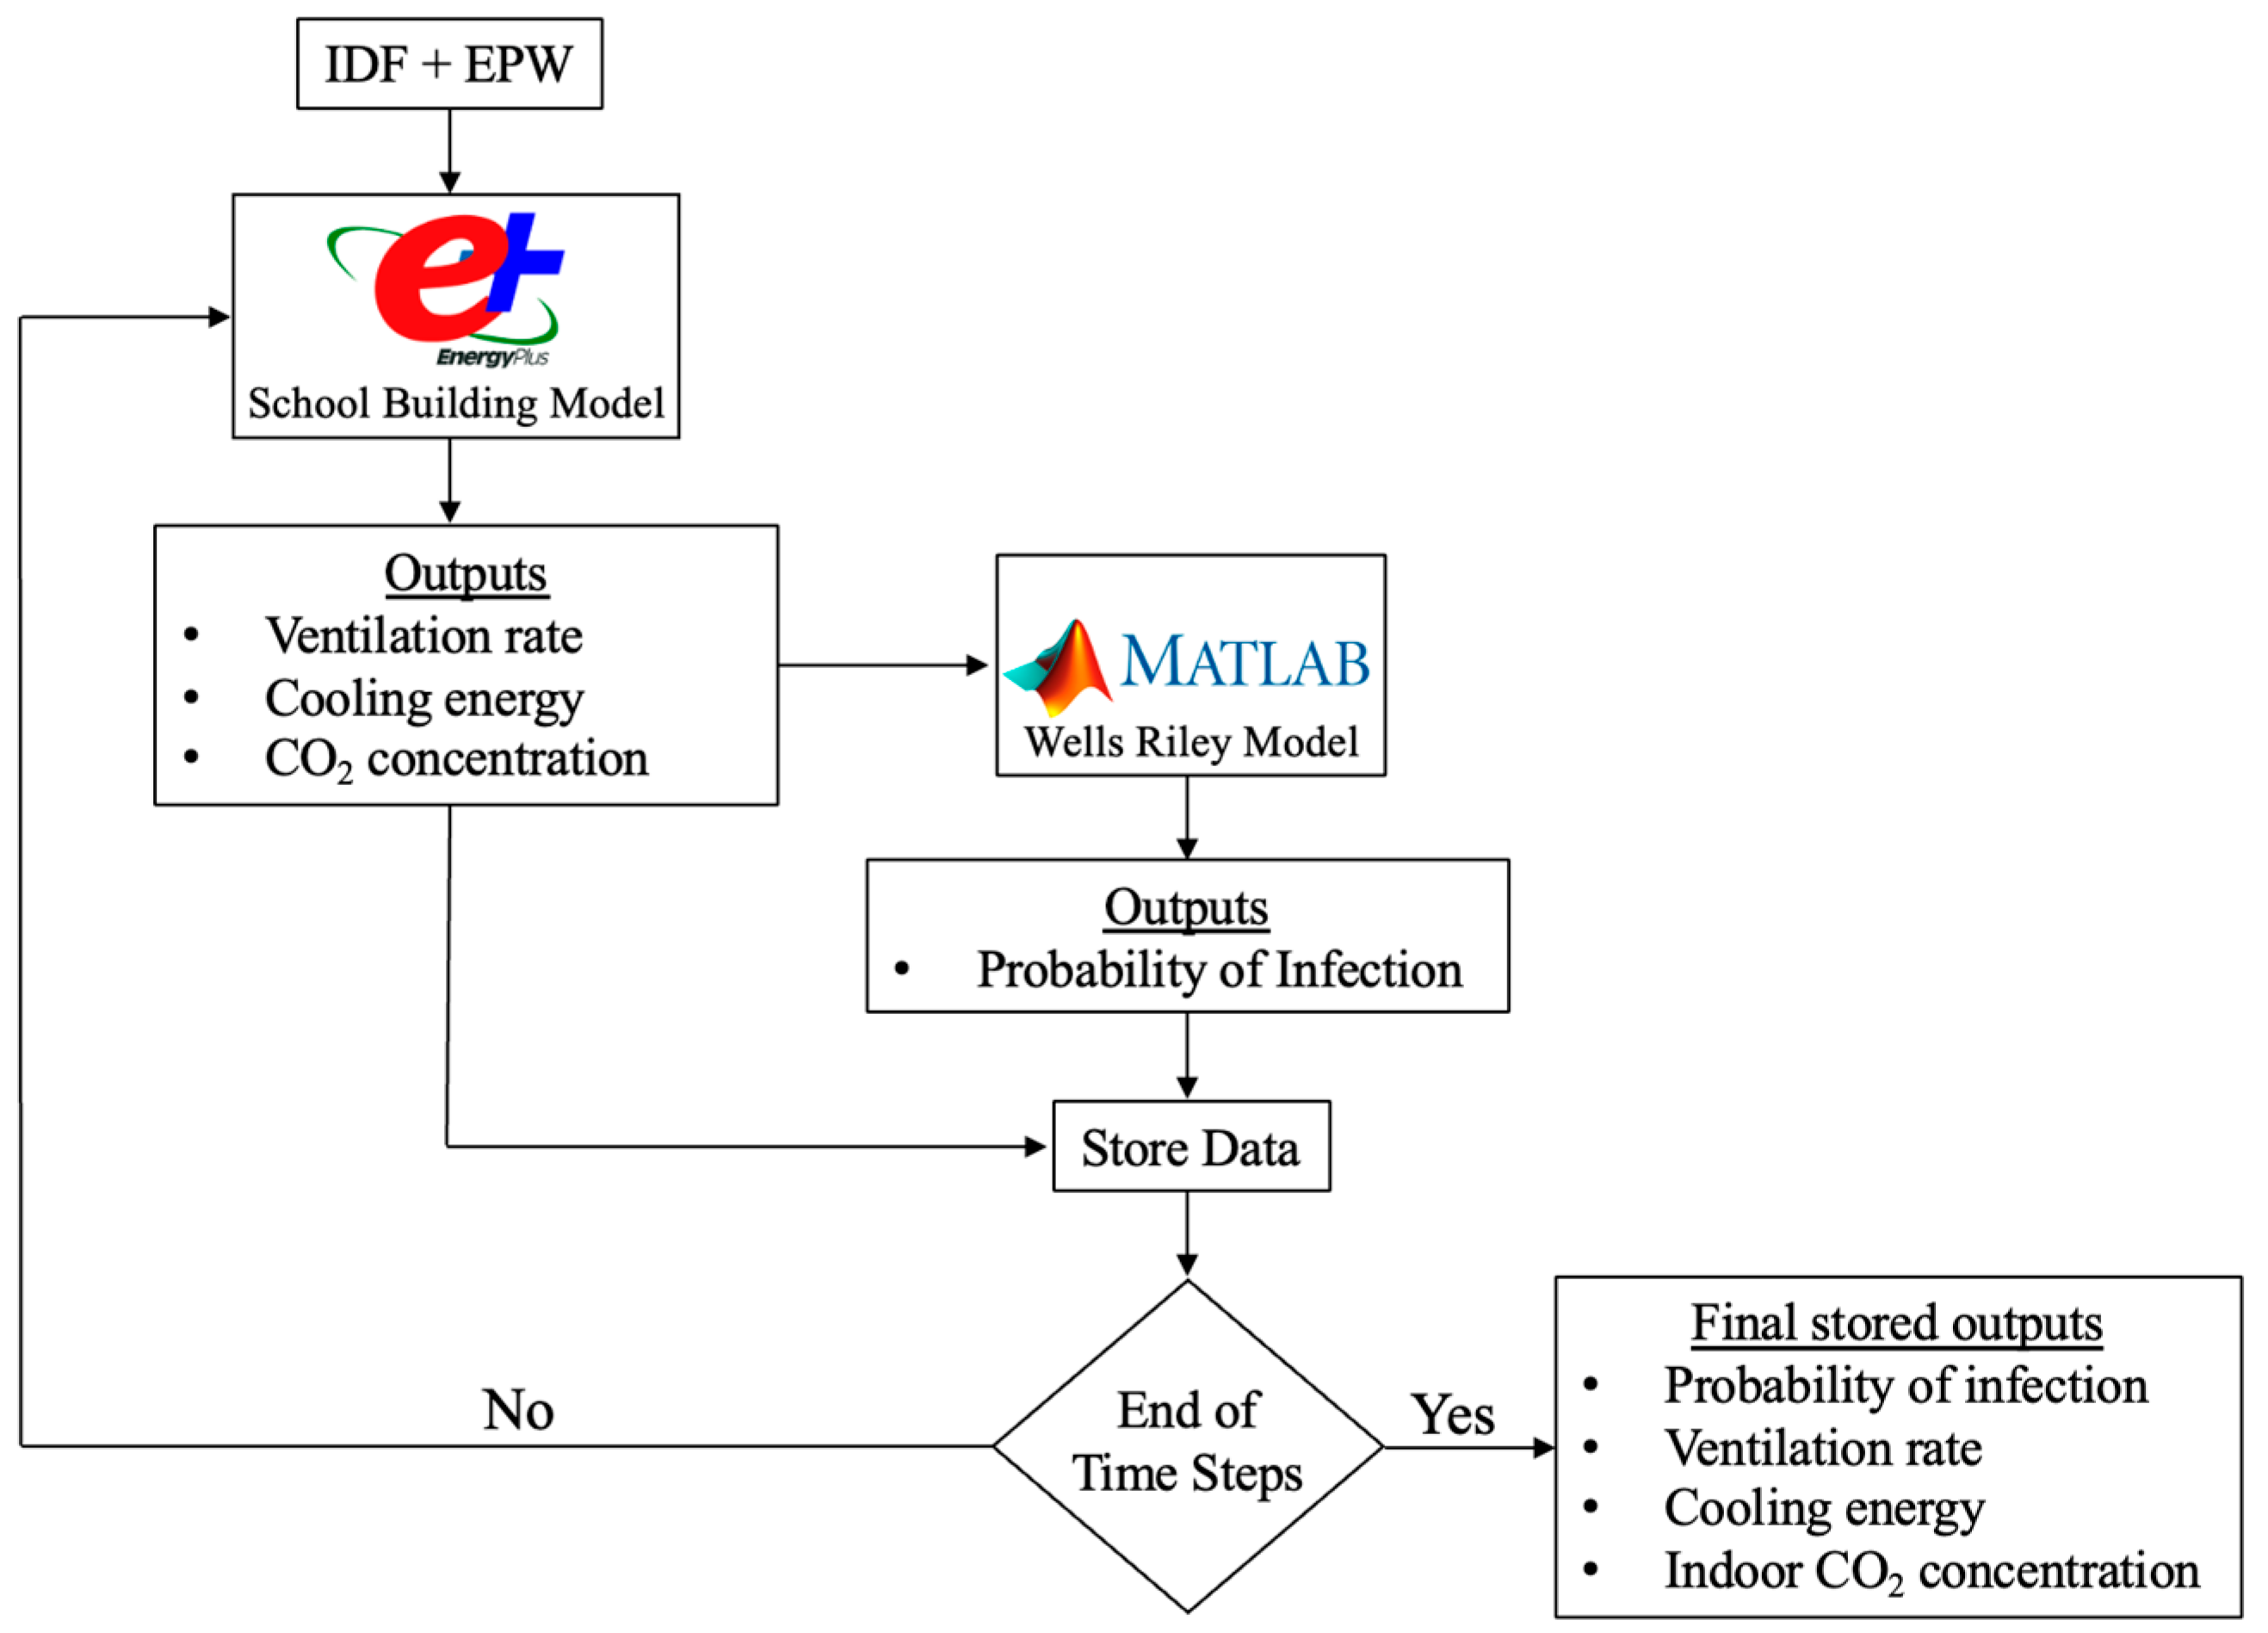
2.1. Analysis Methods

An existing school building that holds around 300 students located in Jeddah, KSA is selected to investigate the ability of the conventional mechanical ventilation (MV) and the demand control ventilation (DCV) to reduce the spread of viral infection in schools. A 3-D rendering of the building energy model and sample of the floorplan of the school building is shown in Figure 1. Specifically, the performance of MV and DCV is evaluated in terms of probability of infection, indoor CO2 concentration, and cooling energy consumption. The analysis is performed using a calibrated energy model of the school building developed and documented in a previous study [33] using EnergyPlus. As shown in Figure 2, comparisons of the monthly energy consumption between the simulation results and the utility bills data are presented before and after calibration. The calibrated model is adjusted to match real operational patterns based on detailed schedules of occupancy availability, HVAC operations, and lighting usage collected from the school management. As illustrated in Figure 2, the model predictions match well with the utility data with only 3% in monthly differences. Table 1 summarizes the main characteristics of the school building energy model. According to the construction regulations of school buildings enforced by the ministry of municipal and rural affairs in the Kingdom of Saudi Arabia [37], school buildings have to comply with the minimum ventilation requirements set by the Saudi Building Code (SBC 501) [38]. Specifically, the code states that the minimum ventilation rates for schools should be 0.6 L/s·m2, while the occupancy density for classrooms is recommended to be 0.25/m2. As indicated in Table 1, the R-value of the exterior wall and roof is estimated to be 2.86 m2K/W and 1.99 m2K/W, respectively, while the U-value of the windows is found to be 1.96 W/m2K. According to the facility management, 100% of the occupants are typically present in the school from 7 a.m. until 2 p.m. and only around 15% of the occupants remain until 4 p.m. during weekdays.
To investigate the effect of ventilation rates on the probability of infection risk using a detailed multizone simulation environment, the Wells–Riley model is coded in Matlab and coupled with the calibrated EnergyPlus model as illustrated in Figure 3. During each time step, the ventilation rate of the MV is used by EnergyPlus to compute the cooling energy use and indoor CO2 concentration, while, on the other hand, the Matlab code estimates the probability of infection for each time step using the same ventilation rate. This coupling approach ensures the evaluation of the indoor risk of infection transmission while accounting for time variations in indoor and outdoor environmental conditions. The coupled simulation environment is set to produce the following simulation outputs at each time step for further analysis: ventilation rate (ACH), probability of infection (POI), CO2 concentration, and cooling energy use. It is worth noting that the conventional mechanical ventilation system is typically set to deliver a continuously constant amount of outdoor air regardless of the occupancy level. On the other hand, the amount of fresh outdoor air supplied by the demand control ventilation system is adjusted based on indoor CO2 concentration level, which is used as a proxy to represent the occupancy density. Specifically, the indoor air quality procedure (IAQP) method defined by ASHRAE 62.1 is applied to operate the DCV system. For proper operation of the DCV system, the CO2 set point is set to 1000 ppm, which represents the maximum allowable indoor CO2 concentration recommended by ASHRAE Standard 62.1 [39]. In addition, 500 ppm of average outdoor CO2 concentration is assumed according to ASHRAE Standard 62.1 [39]. To simulate the DCV system in EnergyPlus, the minimum outdoor airflow rate is set to zero used for periods with no or very low indoor CO2 concentrations, while the maximum outdoor fresh air rate is set based on the auto-sized ventilation rate needed to maintain the specified indoor CO2 set point during high occupancy periods. Alaidroos et al. [33] outlined the DCV modeling approach utilized by the EnergyPlus simulation tool and validated the indoor CO2 concentration predicted by EnergyPlus for the school model used in this study, as depicted in Figure 4. To validate the predictions of indoor CO2 concentration, CO2 sensors are used to monitor and record the CO2 concentrations of a classroom during twenty-four hours. Observed data such as ventilation rates and occupancy availability are then used to compare the time variations in the measurements and simulation predictions, as shown in Figure 4. The comparison shows good agreement between the measured and predicted CO2 concentrations with a coefficient of variation of 8.4%.

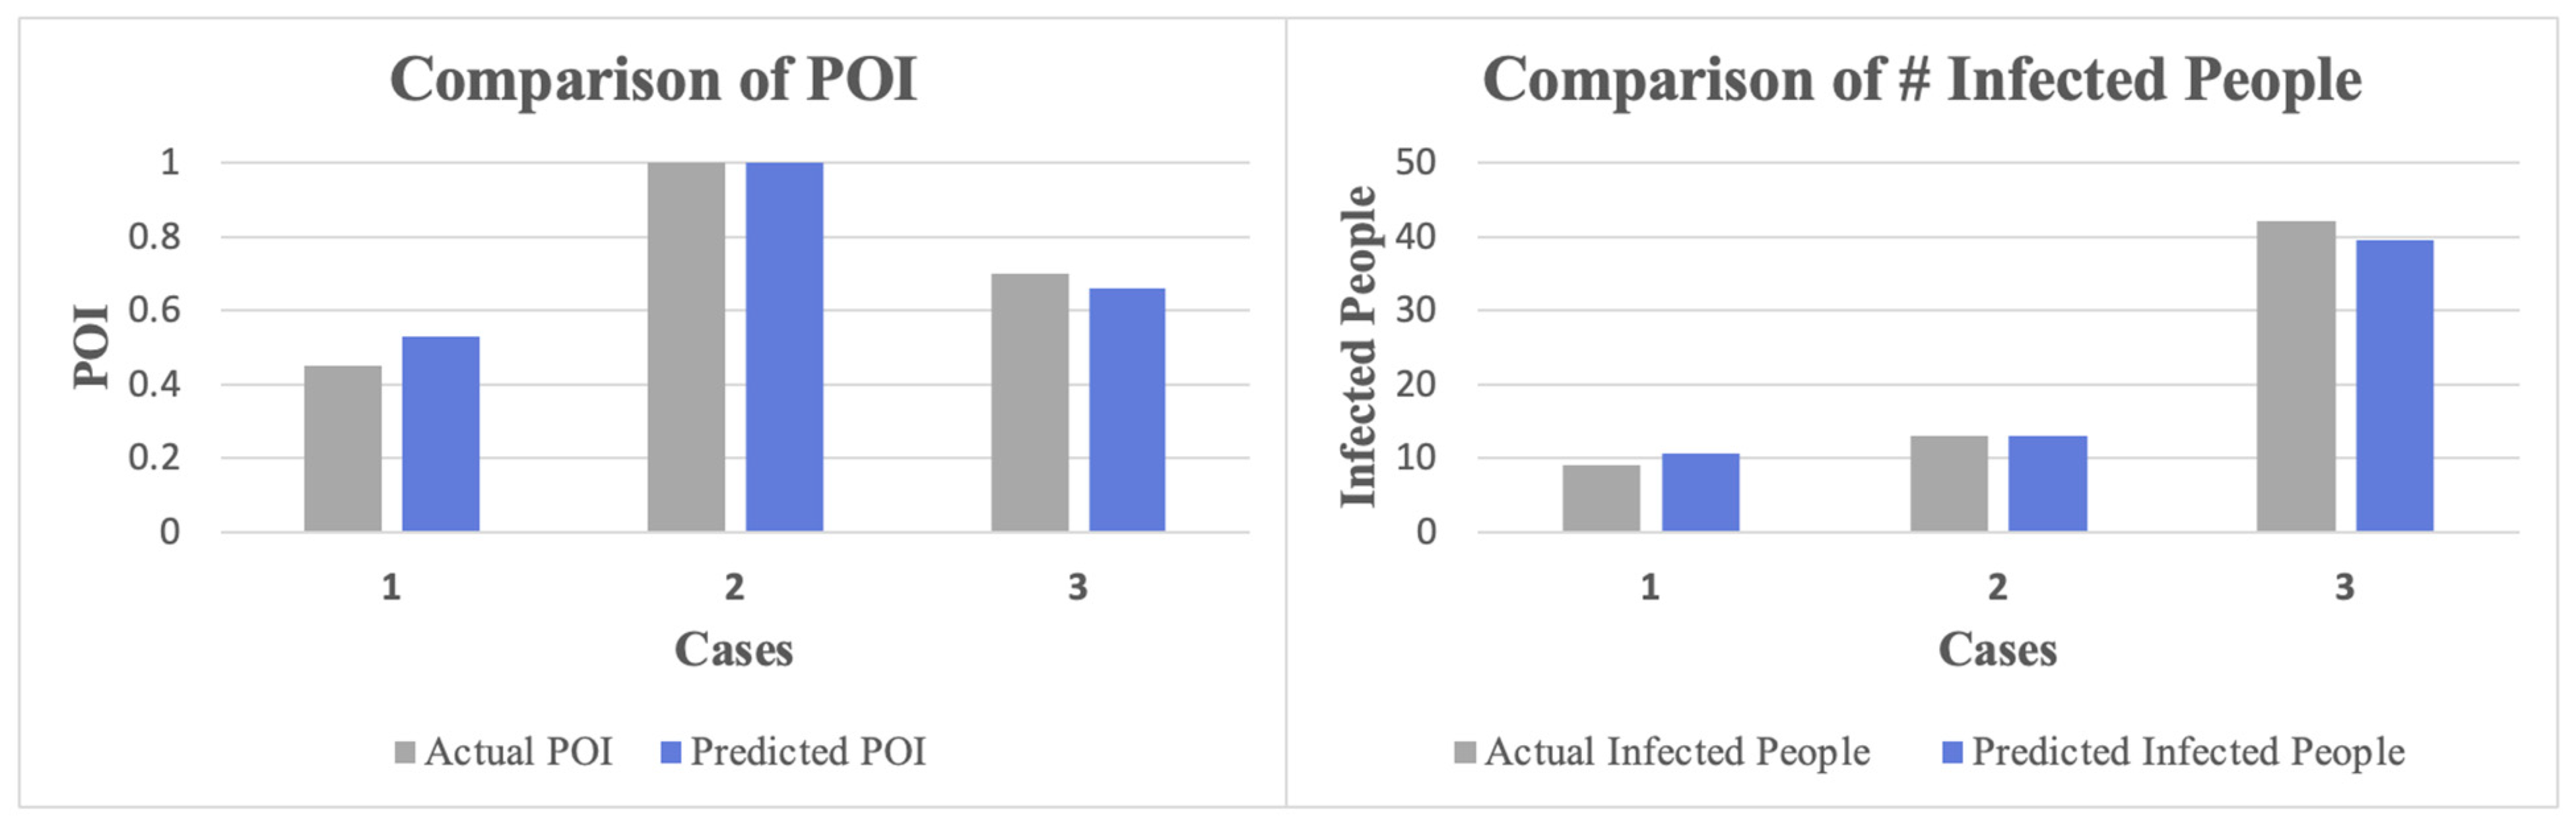
2.2. The Wells–Riley Model

In this study, the Wells–Riley equation [10] is used to estimate the probability of infection as shown in Equation (1):
P i = 1 e Iqpt Vn
where Pi is the probability of infection transmission, I is the number of persons (i.e., infection source), q is the quantum generation rate produced by an infector, p is the respiratory ventilation rate of each susceptible, t is the exposure time, V is the volume of the enclosed space, and n is the air change rate of the ventilation system. For the analysis conducted in this study, 48 (quanta/h) is used to represent the value of quantum generation rate for COVID-19 [9]. Furthermore, it is assumed that there is only one infection source in the simulated zone, while the value of the respiratory ventilation rate has been estimated as 0.3 m3/h representing light indoor activity performed by the occupants in the classrooms [9]. The exposure time is assumed to be seven hours to account for the classroom period from early morning when the students enter the school until recess at 2:00 pm.
The Wells–Riley model is validated in this study by comparing the simulation predictions to actual COVID-19 cases reported in the literature [3,40,41]. Table 2 summarizes the reported actual COVID-19 cases used for the validation analysis. The same values of the actual cases shown in Table 2 are used as input for the Wells–Riley model to predict the probability of infection (POI). Figure 5 compares predicted values of POI and the number of infected people against the actual reported data. As indicated in Figure 5, acceptable agreement between the predictions and actual reported data is observed with an average difference of 6.9%.
As described earlier, the intent of this study is to determine the optimum operational strategies suitable for the conventional mechanical ventilation (MV) systems to minimize the risk of infection transmission while reducing air conditioning energy consumption. Additionally, the performance of the MV systems is compared to that of the demand control ventilation systems. Specifically, the following analysis approach is utilized for this study:
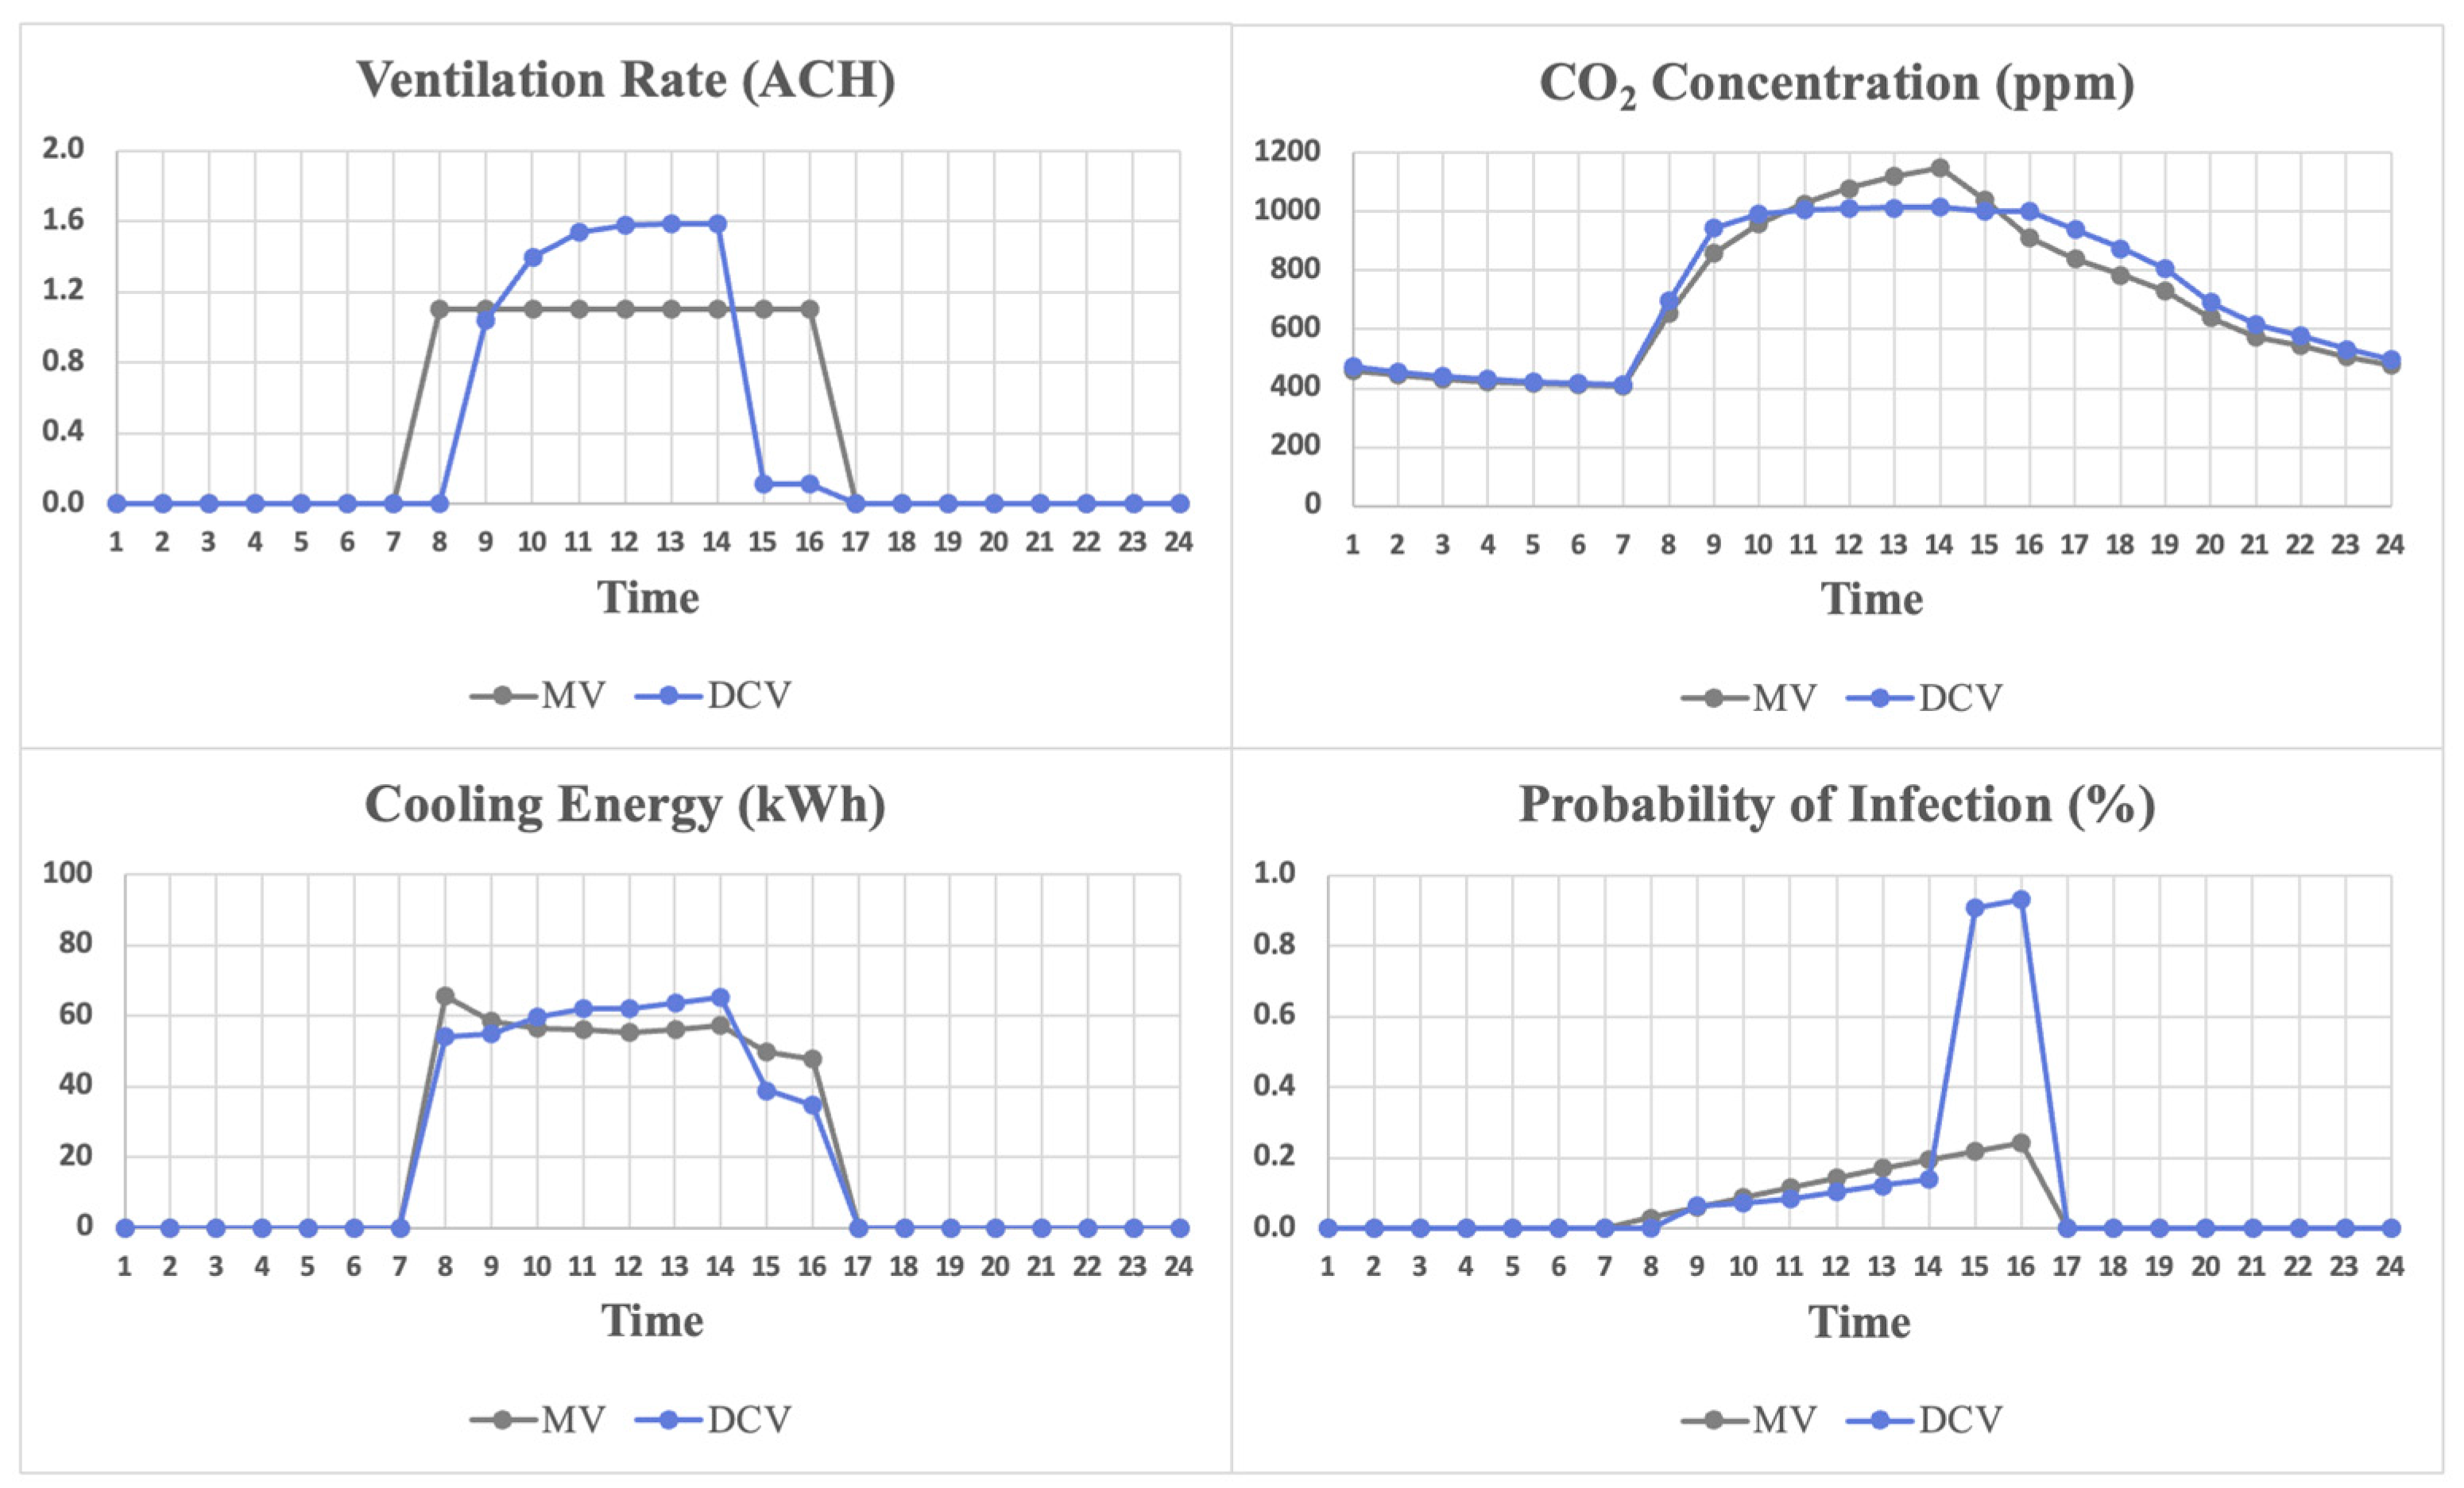
  • Compare the performance of MV and demand control ventilation (DCV) systems using hourly simulations for a summer day (22 July) using the following as metrics: POI, CO2 concentration, and cooling energy use.
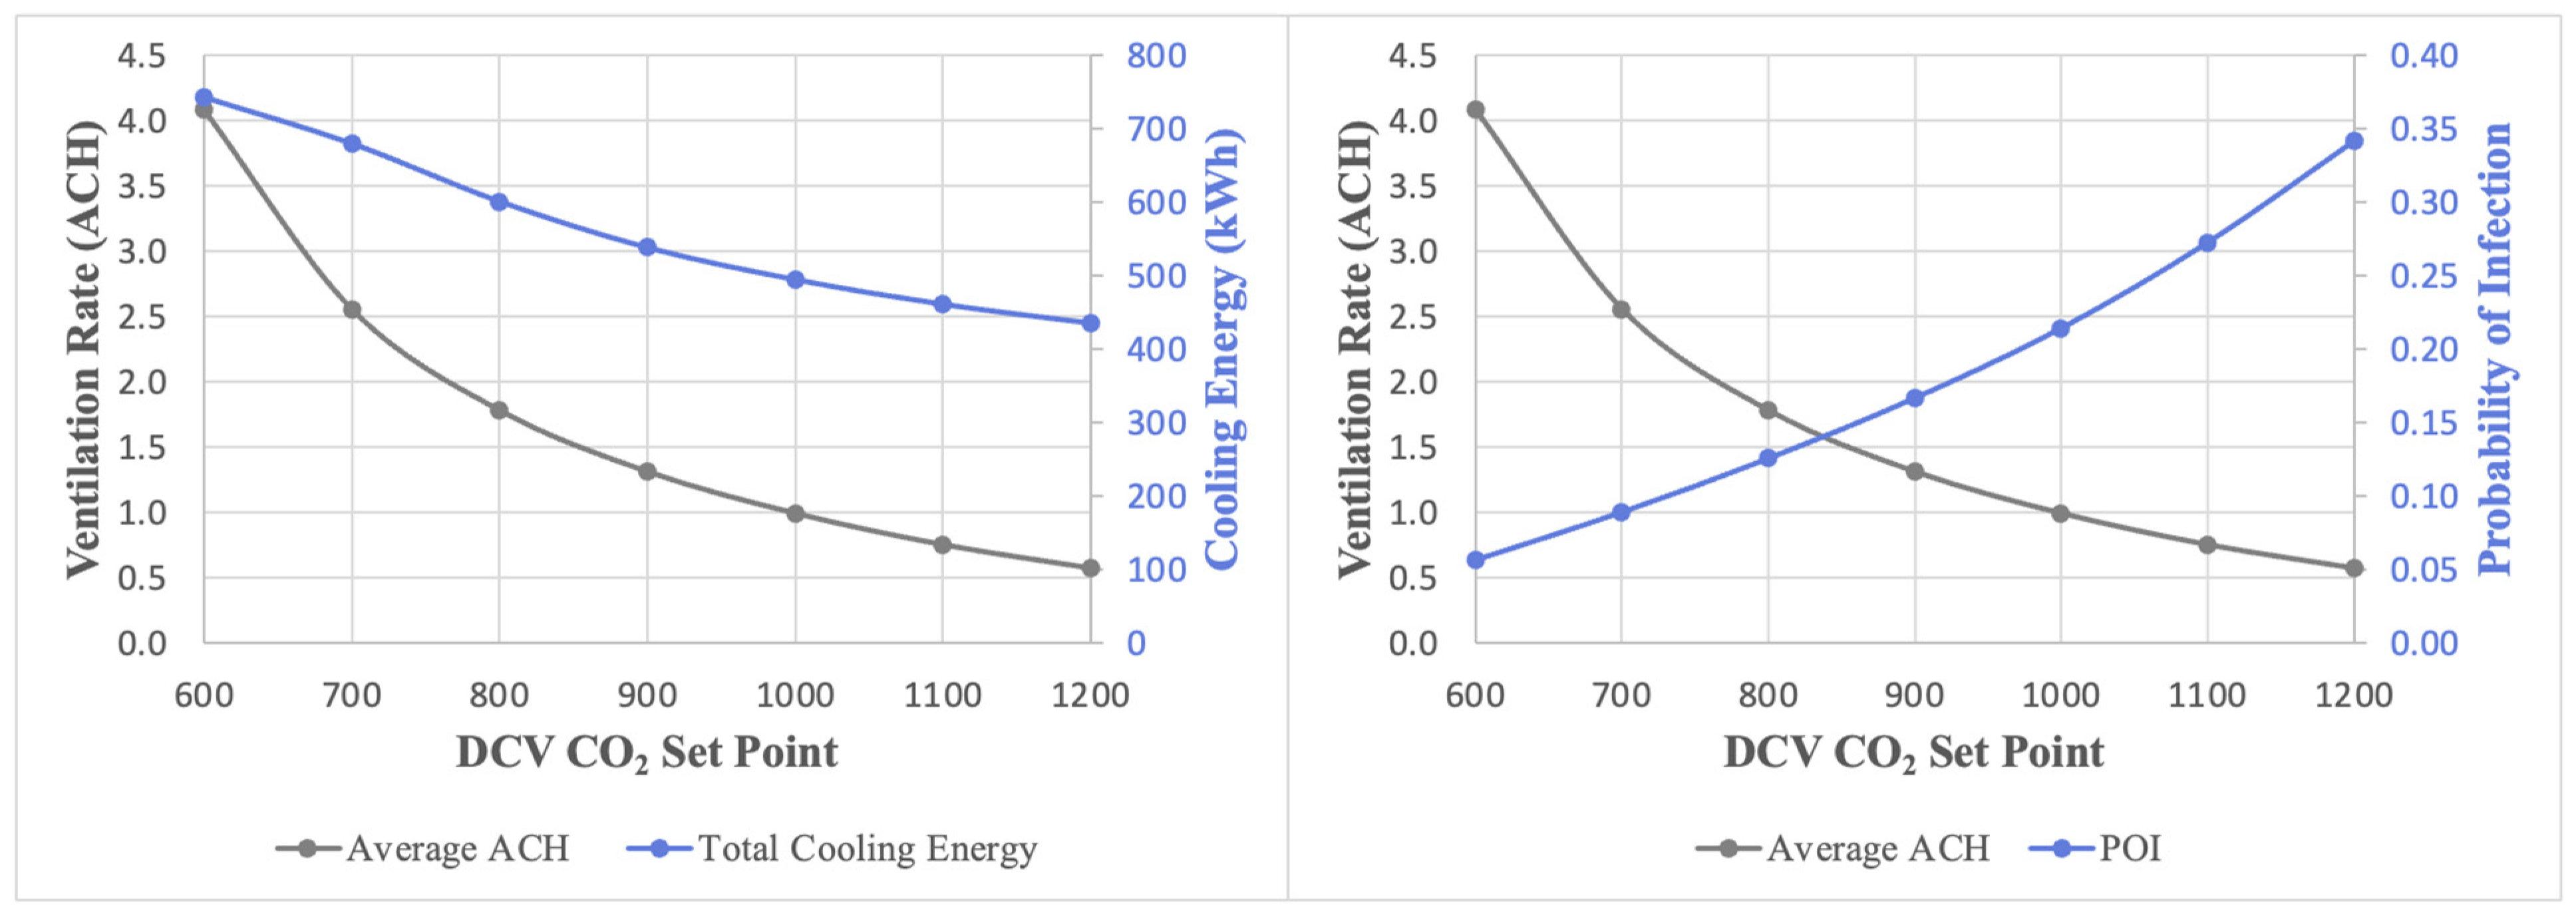
  • Adjust the DCV set point (CO2 set point in ppm) and assess its effect on the probability of infection and cooling energy use.
  • Perform a series of sensitivity analyses to determine the impacts of social distancing on the performance of MV and DCV including POI, indoor CO2 concentration, and cooling energy use.
  • Establish any correlation between social distancing, number of infectors, and the resulting POI for MV.
  • Assess variations in POI and cooling energy use for a range of ventilation rates and social distances for MV.

3. Results and Discussion

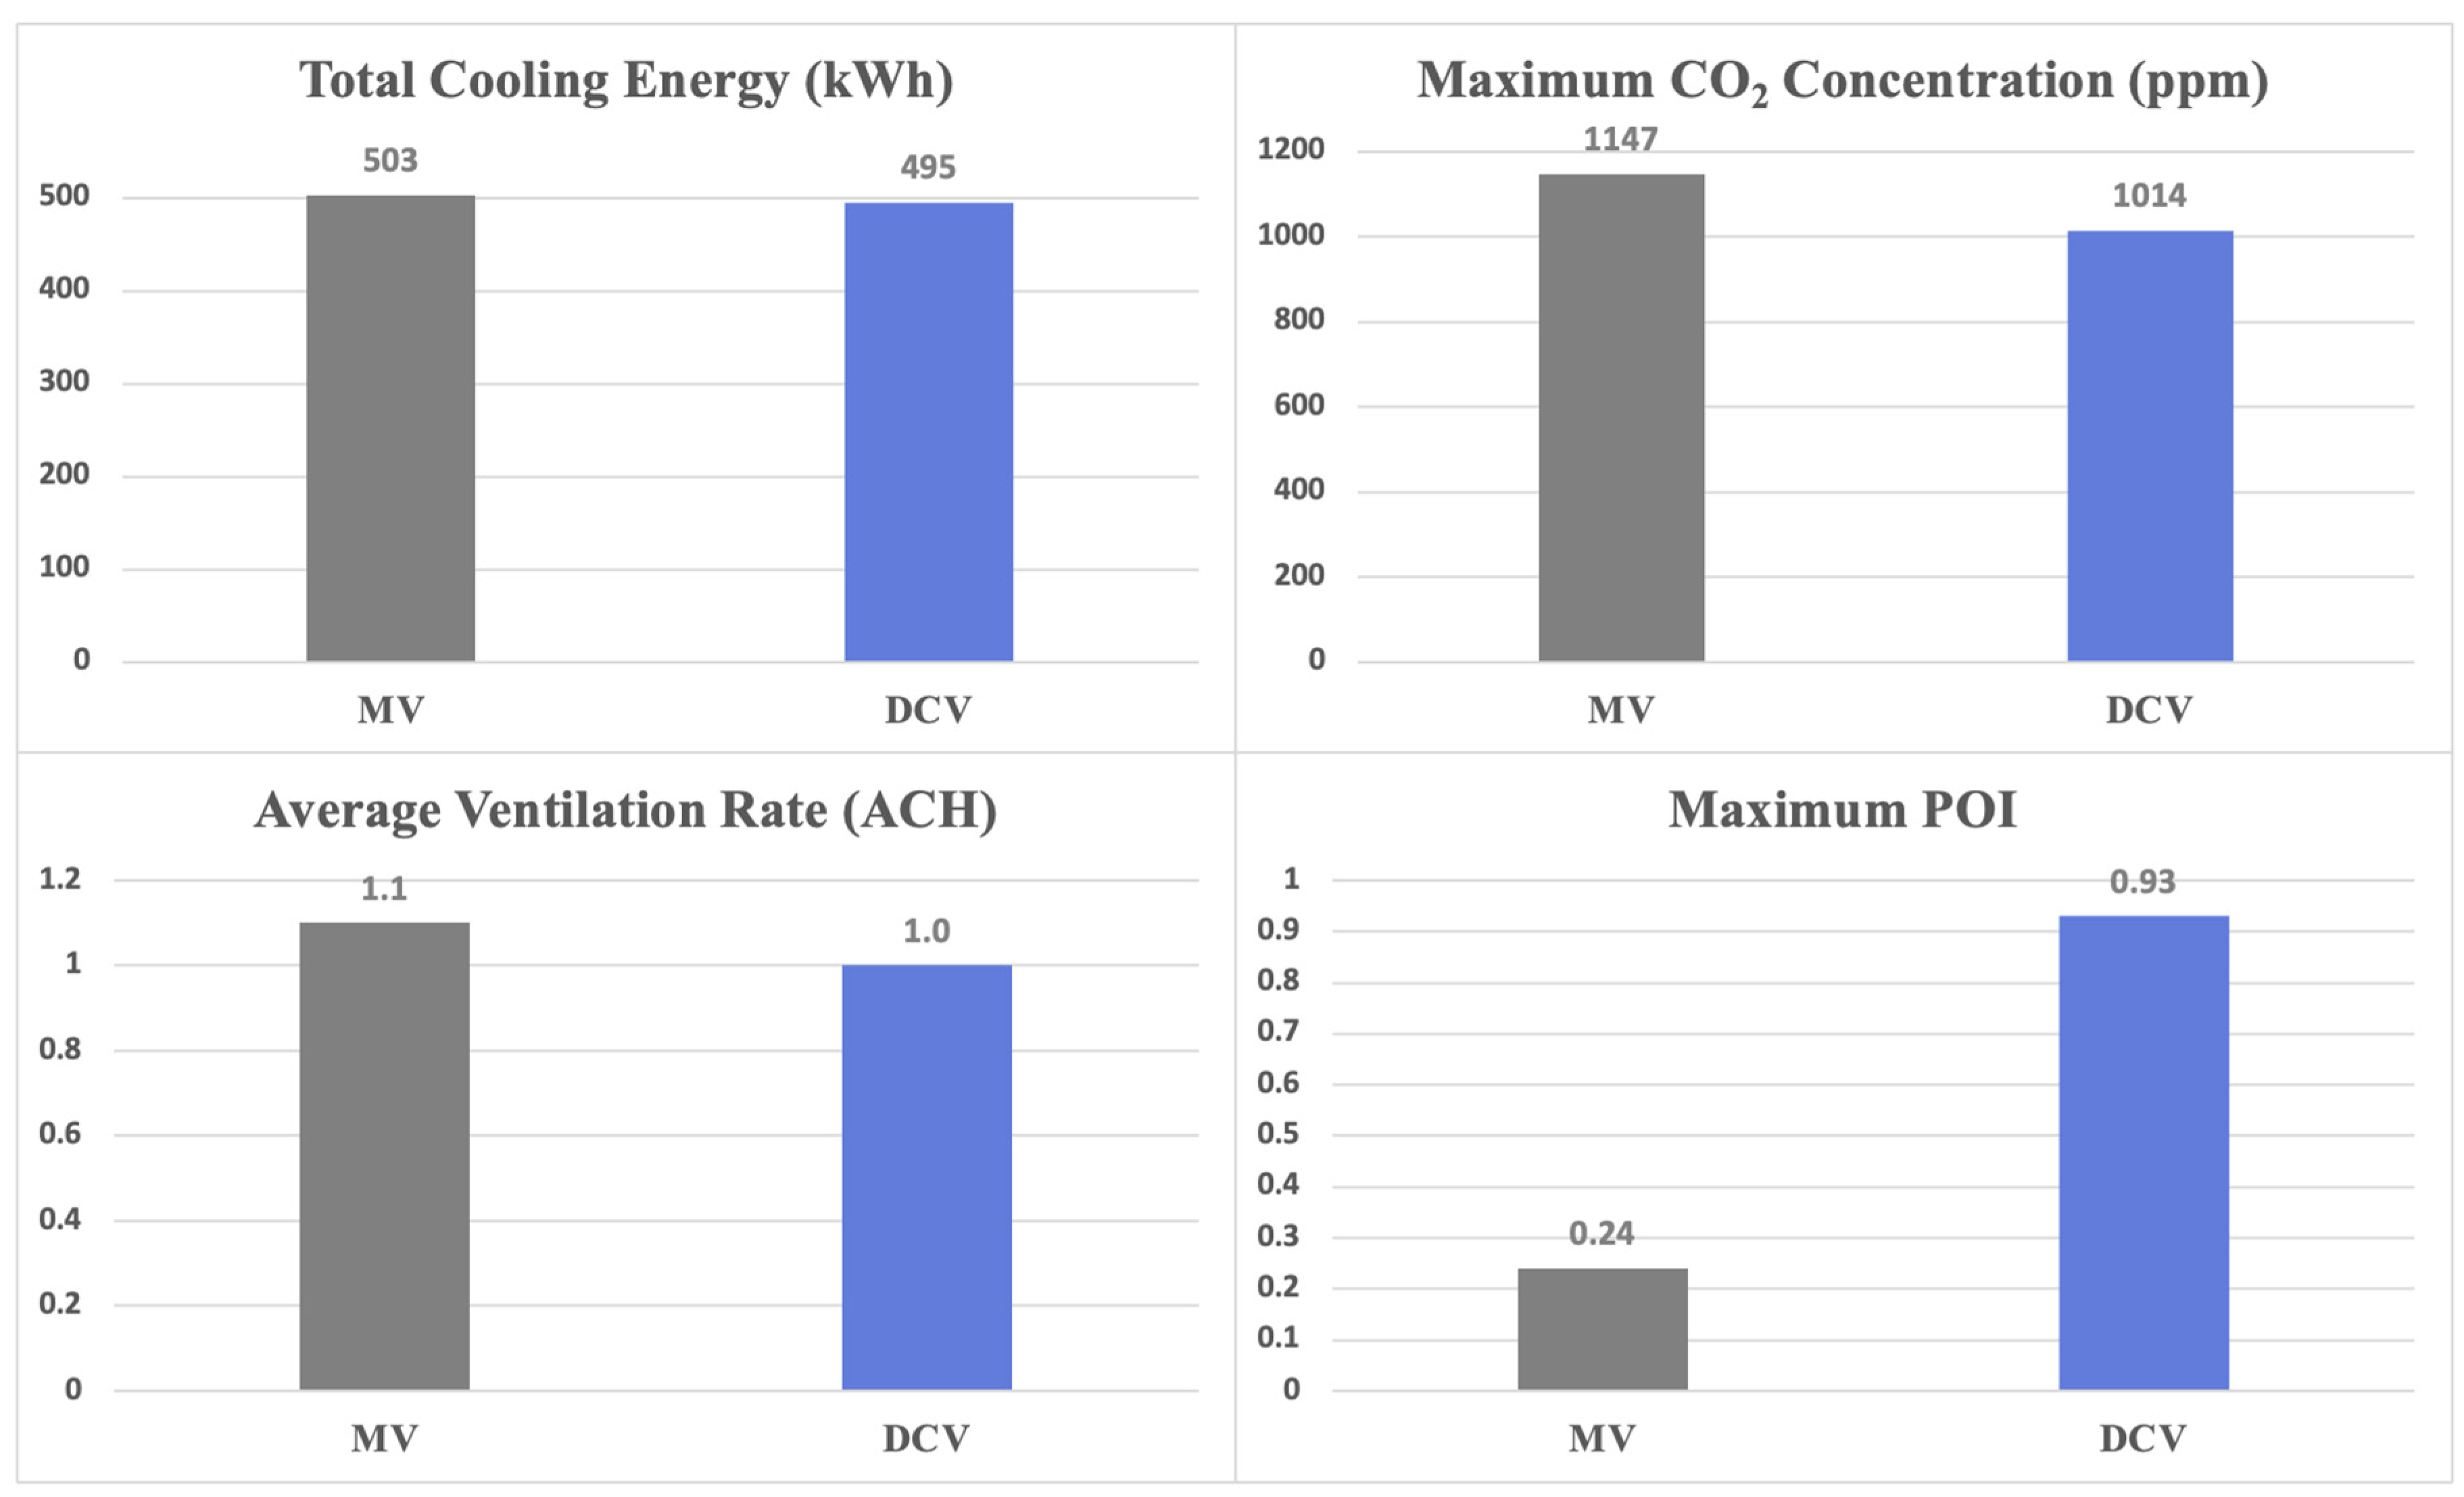
3.1. Performance Comparison for MV and DCV

The performance of MV and DCV systems is explored for a summer design day (22 July) in Jeddah. In this analysis, hourly simulation results are presented to provide better insights on any differences in performance between the two systems. As shown in Figure 6, the required ventilation rate for DCV exceeds that for MV during peak occupancy hours to maintain the indoor CO2 concentration below the allowable limit (i.e., 1000 ppm). This increase in ventilation rate by the DCV results in a slight increase in cooling energy use until 2:00 p.m. due to the peak occupancy level within the school. As a response to the occupancy density decrease after 2:00 p.m., the ventilation rate and the cooling energy use for the DCV are reduced. However, the lower ventilation rates supplied by the DCV by the end of the day leads to a significant increase in POI reaching up to 0.93 compared to a much lower POI of 0.24 achieved by MV during the same period. This initial comparative analysis leads to the following questions:
  • Will DCV be able to prevent high POI while still maintaining low cooling energy consumption compared to the conventional MV if the CO2 set points are adjusted?
  • Will MV be able to outperform DCV considering cooling energy use and indoor air quality (i.e., CO2 concentration and infection risk) when optimized?
Daily performance indicators for MV and DCV during 22 July are presented in Figure 7. The considered indicators include cooling energy use, maximum indoor CO2 concentration, and maximum probability of infection. As illustrated in Figure 7, even though the maximum CO2 concentration of MV is higher than that of DCV, the difference of 133 ppm in CO2 concentrations is not significant, with the maximum indoor CO2 concentration of 1147 ppm for MV still within acceptable ranges. On the other hand, the difference in maximum POI between MV and DCV is significant as shown in Figure 7. The simulation results presented so far are specific to one infector (i.e., one sick person) using a typical occupancy density of 0.5 people/m2. If social distancing is applied, implying a lower occupancy density, how would the performance of both MV and DCV be affected?

3.2. DCV Set Point Analysis

Before investigating the impacts of the number of infectors, occupancy density, and social distancing on the performance of MV and DCV, optimal CO2 settings that deliver an acceptable POI with a minimal cooling energy consumption for DCV are determined. A sensitivity analysis is carried out using CO2 set points specific to DCV ranging between 600 ppm and 1200 ppm to assess for one day (i.e., 22 July) the average ventilation rate during occupied hours, the maximum POI level, and the total cooling energy use. The results of the sensitivity analysis are summarized in Figure 8. Lower CO2 set points require higher ventilation rates resulting in a higher cooling energy use but lower POI as depicted in Figure 8. Due to the conflicting effects on cooling energy use and POI associated with the variation in DCV ventilation rate, the POI instead of cooling energy use is considered for operating DCV as occupants’ health is more critical than energy efficiency. Using the results outlined in Figure 8, a set point of 600 ppm is selected for DCV to deliver an average ventilation rate of 4.1 ACH during occupied hours, resulting in a POI of 0.057 and cooling energy use of 743 kWh/day. On the other hand, the results of Figure 8 indicate that lowering the CO2 set point from 1000 ppm to 600 ppm would increase the cooling energy use by 50%.
The DCV performance presented in Figure 8 confirms that a significant increase in cooling energy use would result when low POI levels need to be maintained. To fairly compare the performance indicators of MV and DCV, a detailed sensitivity analysis of MV is carried out to determine MV optimized design settings.

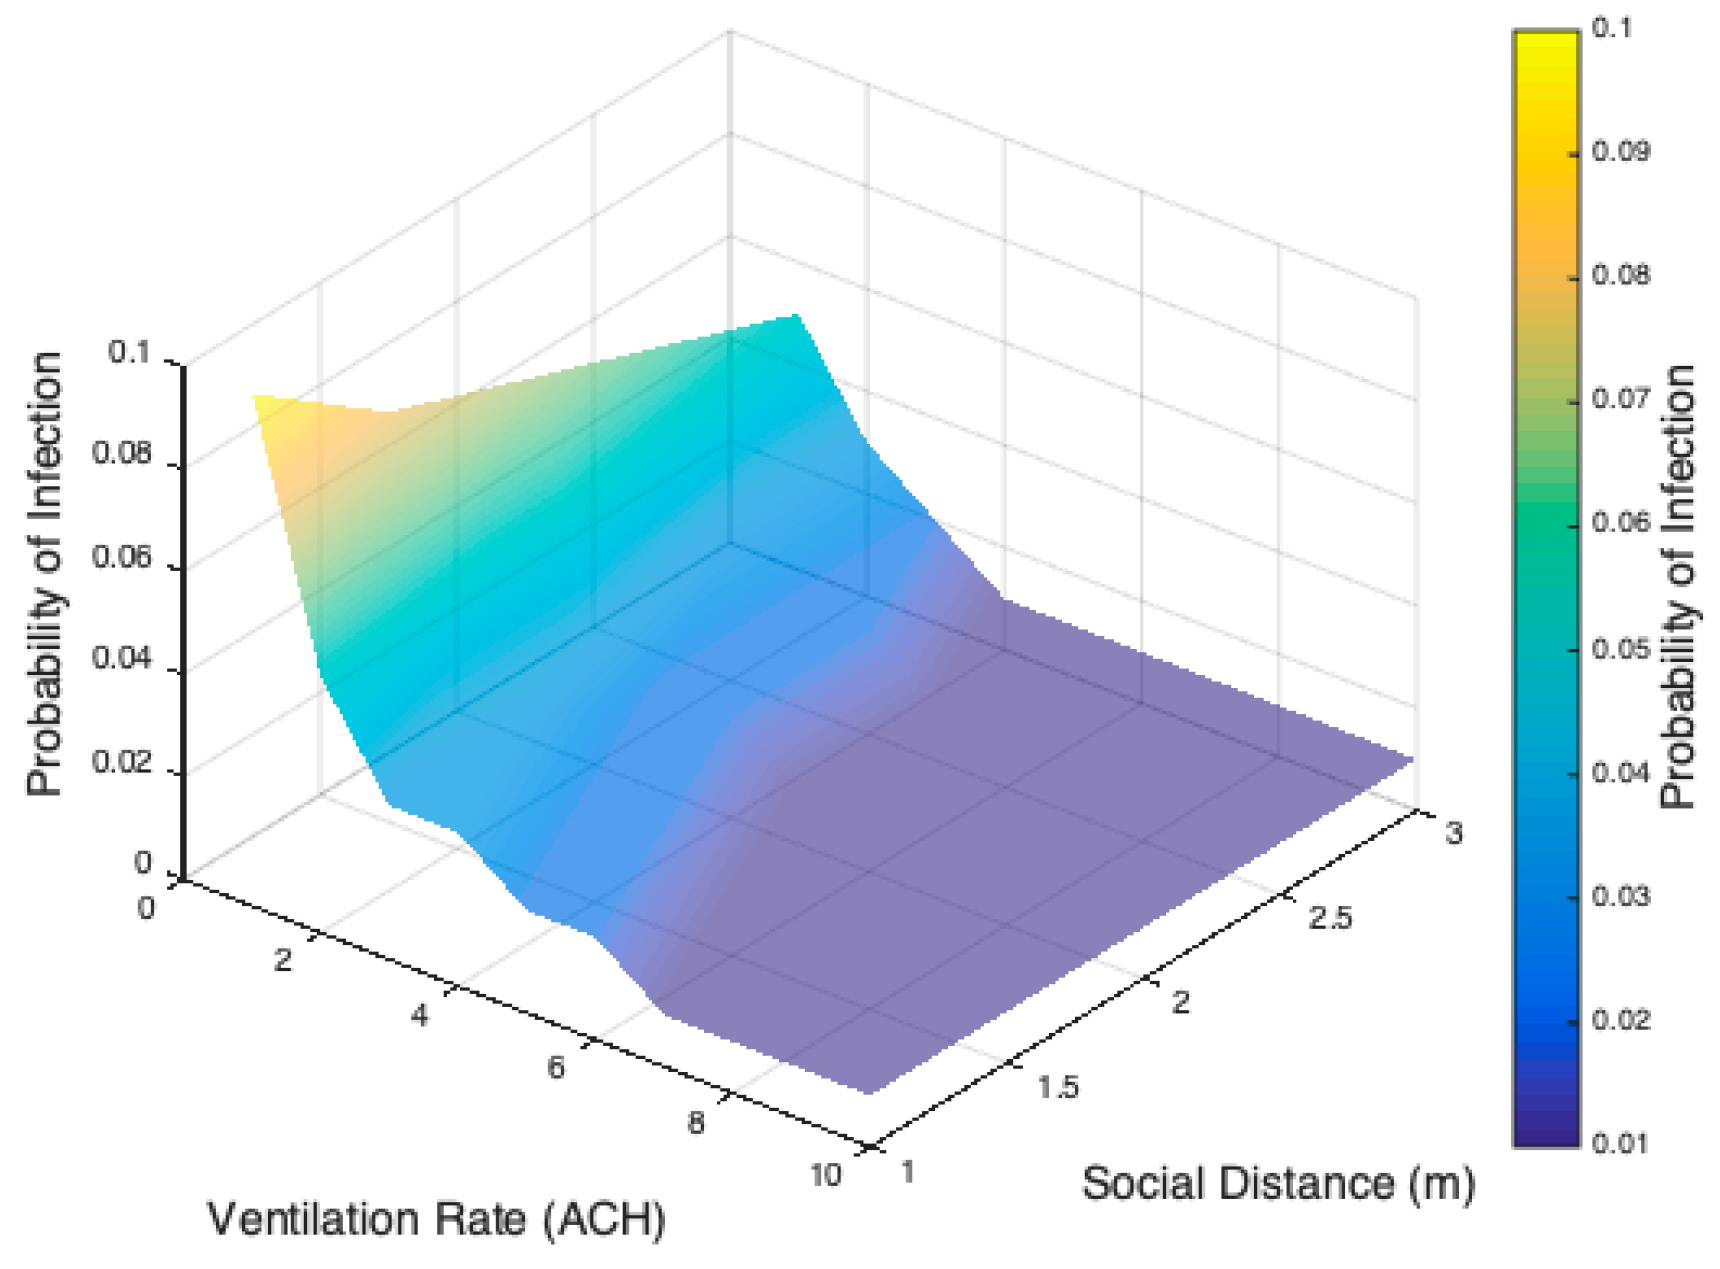
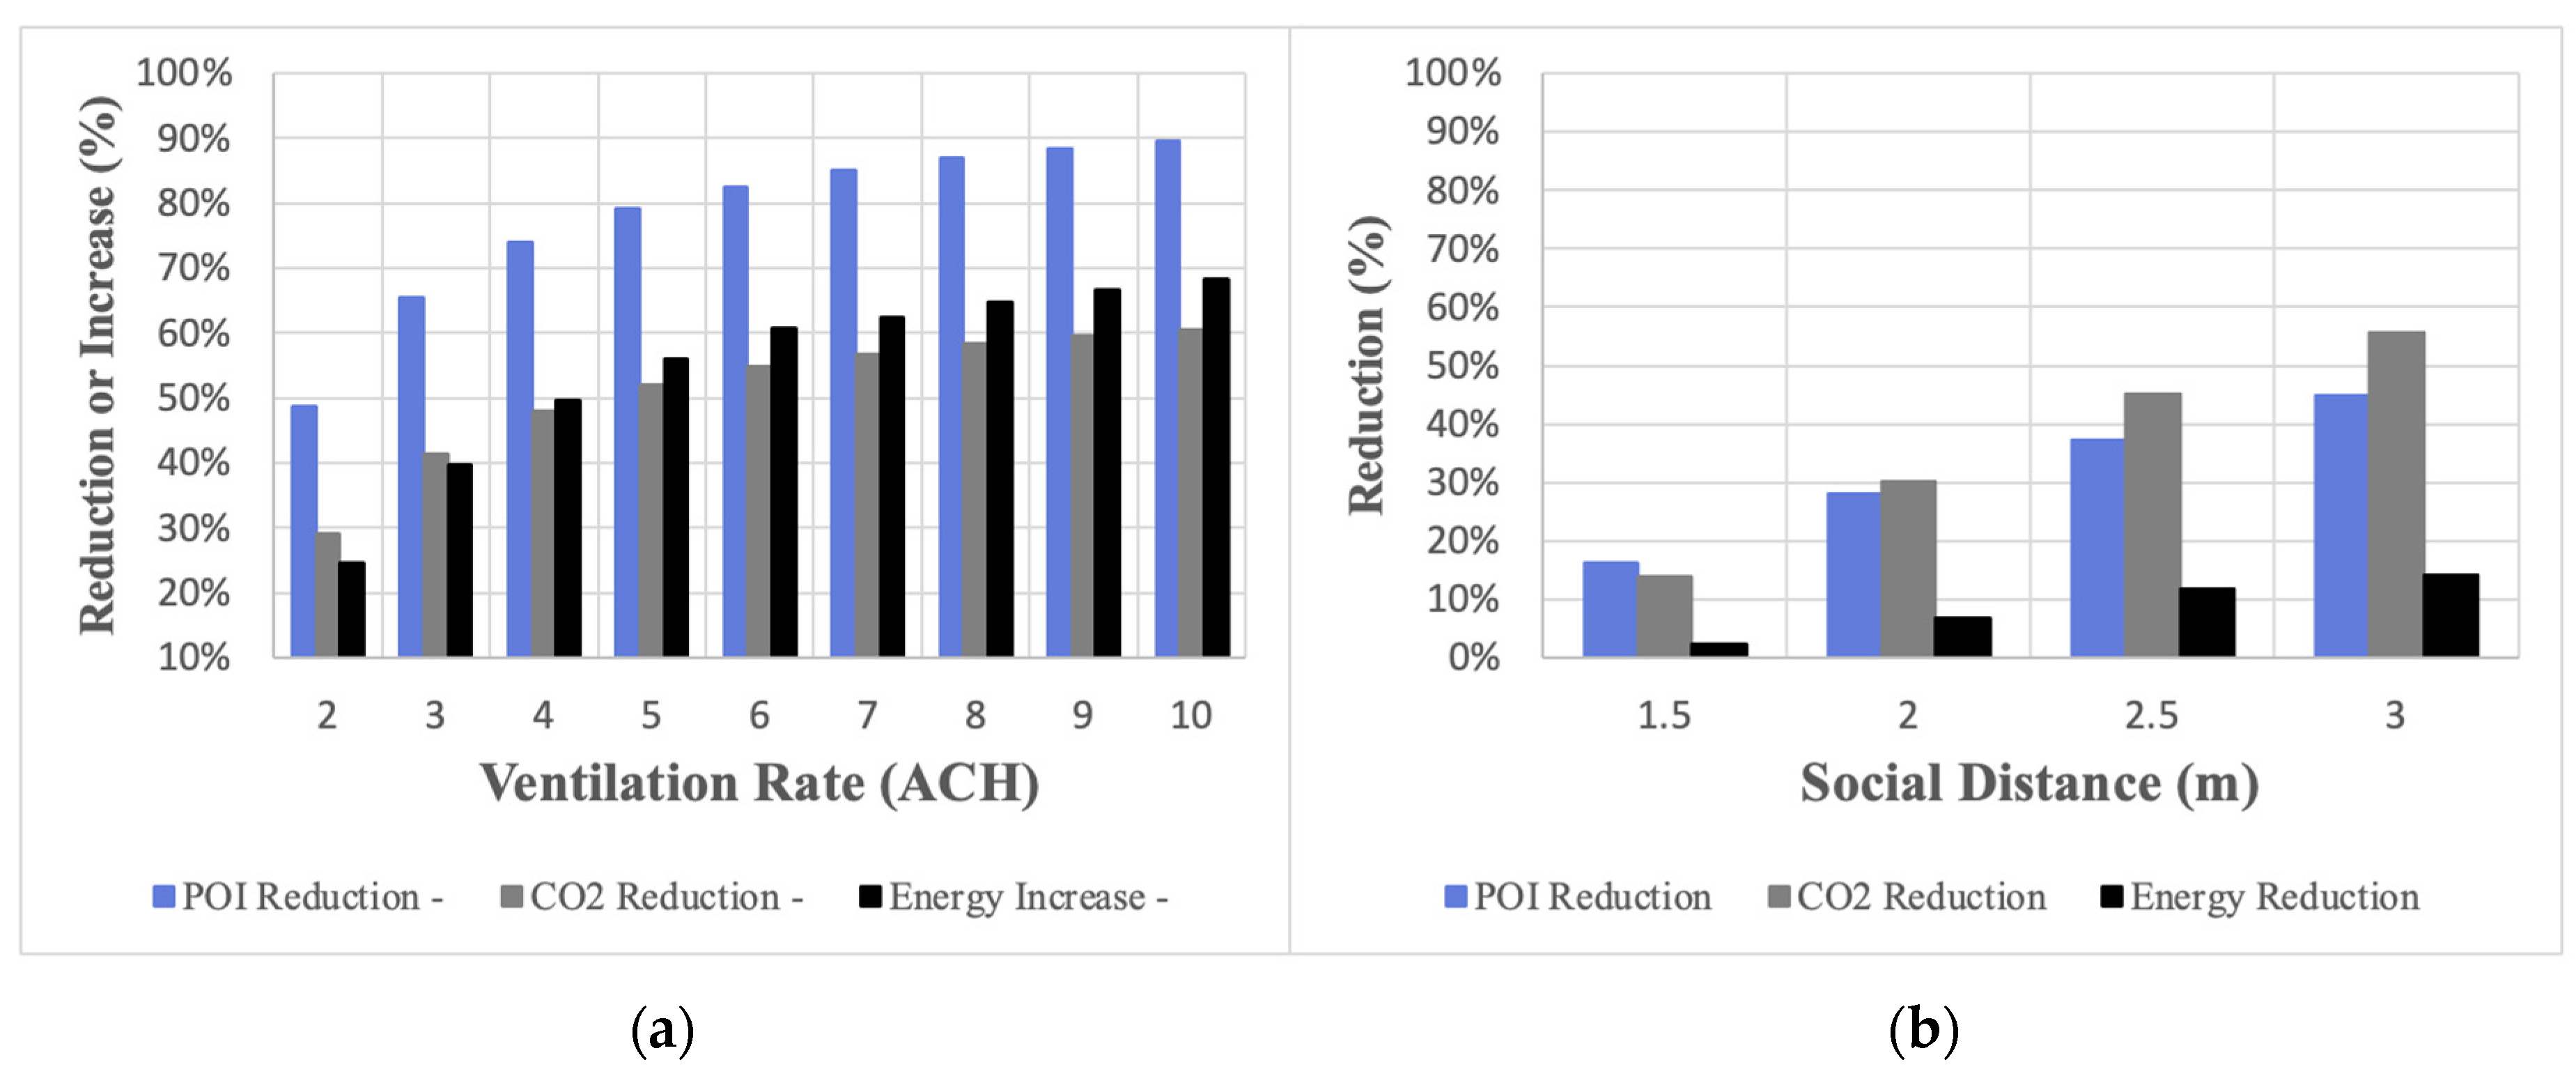
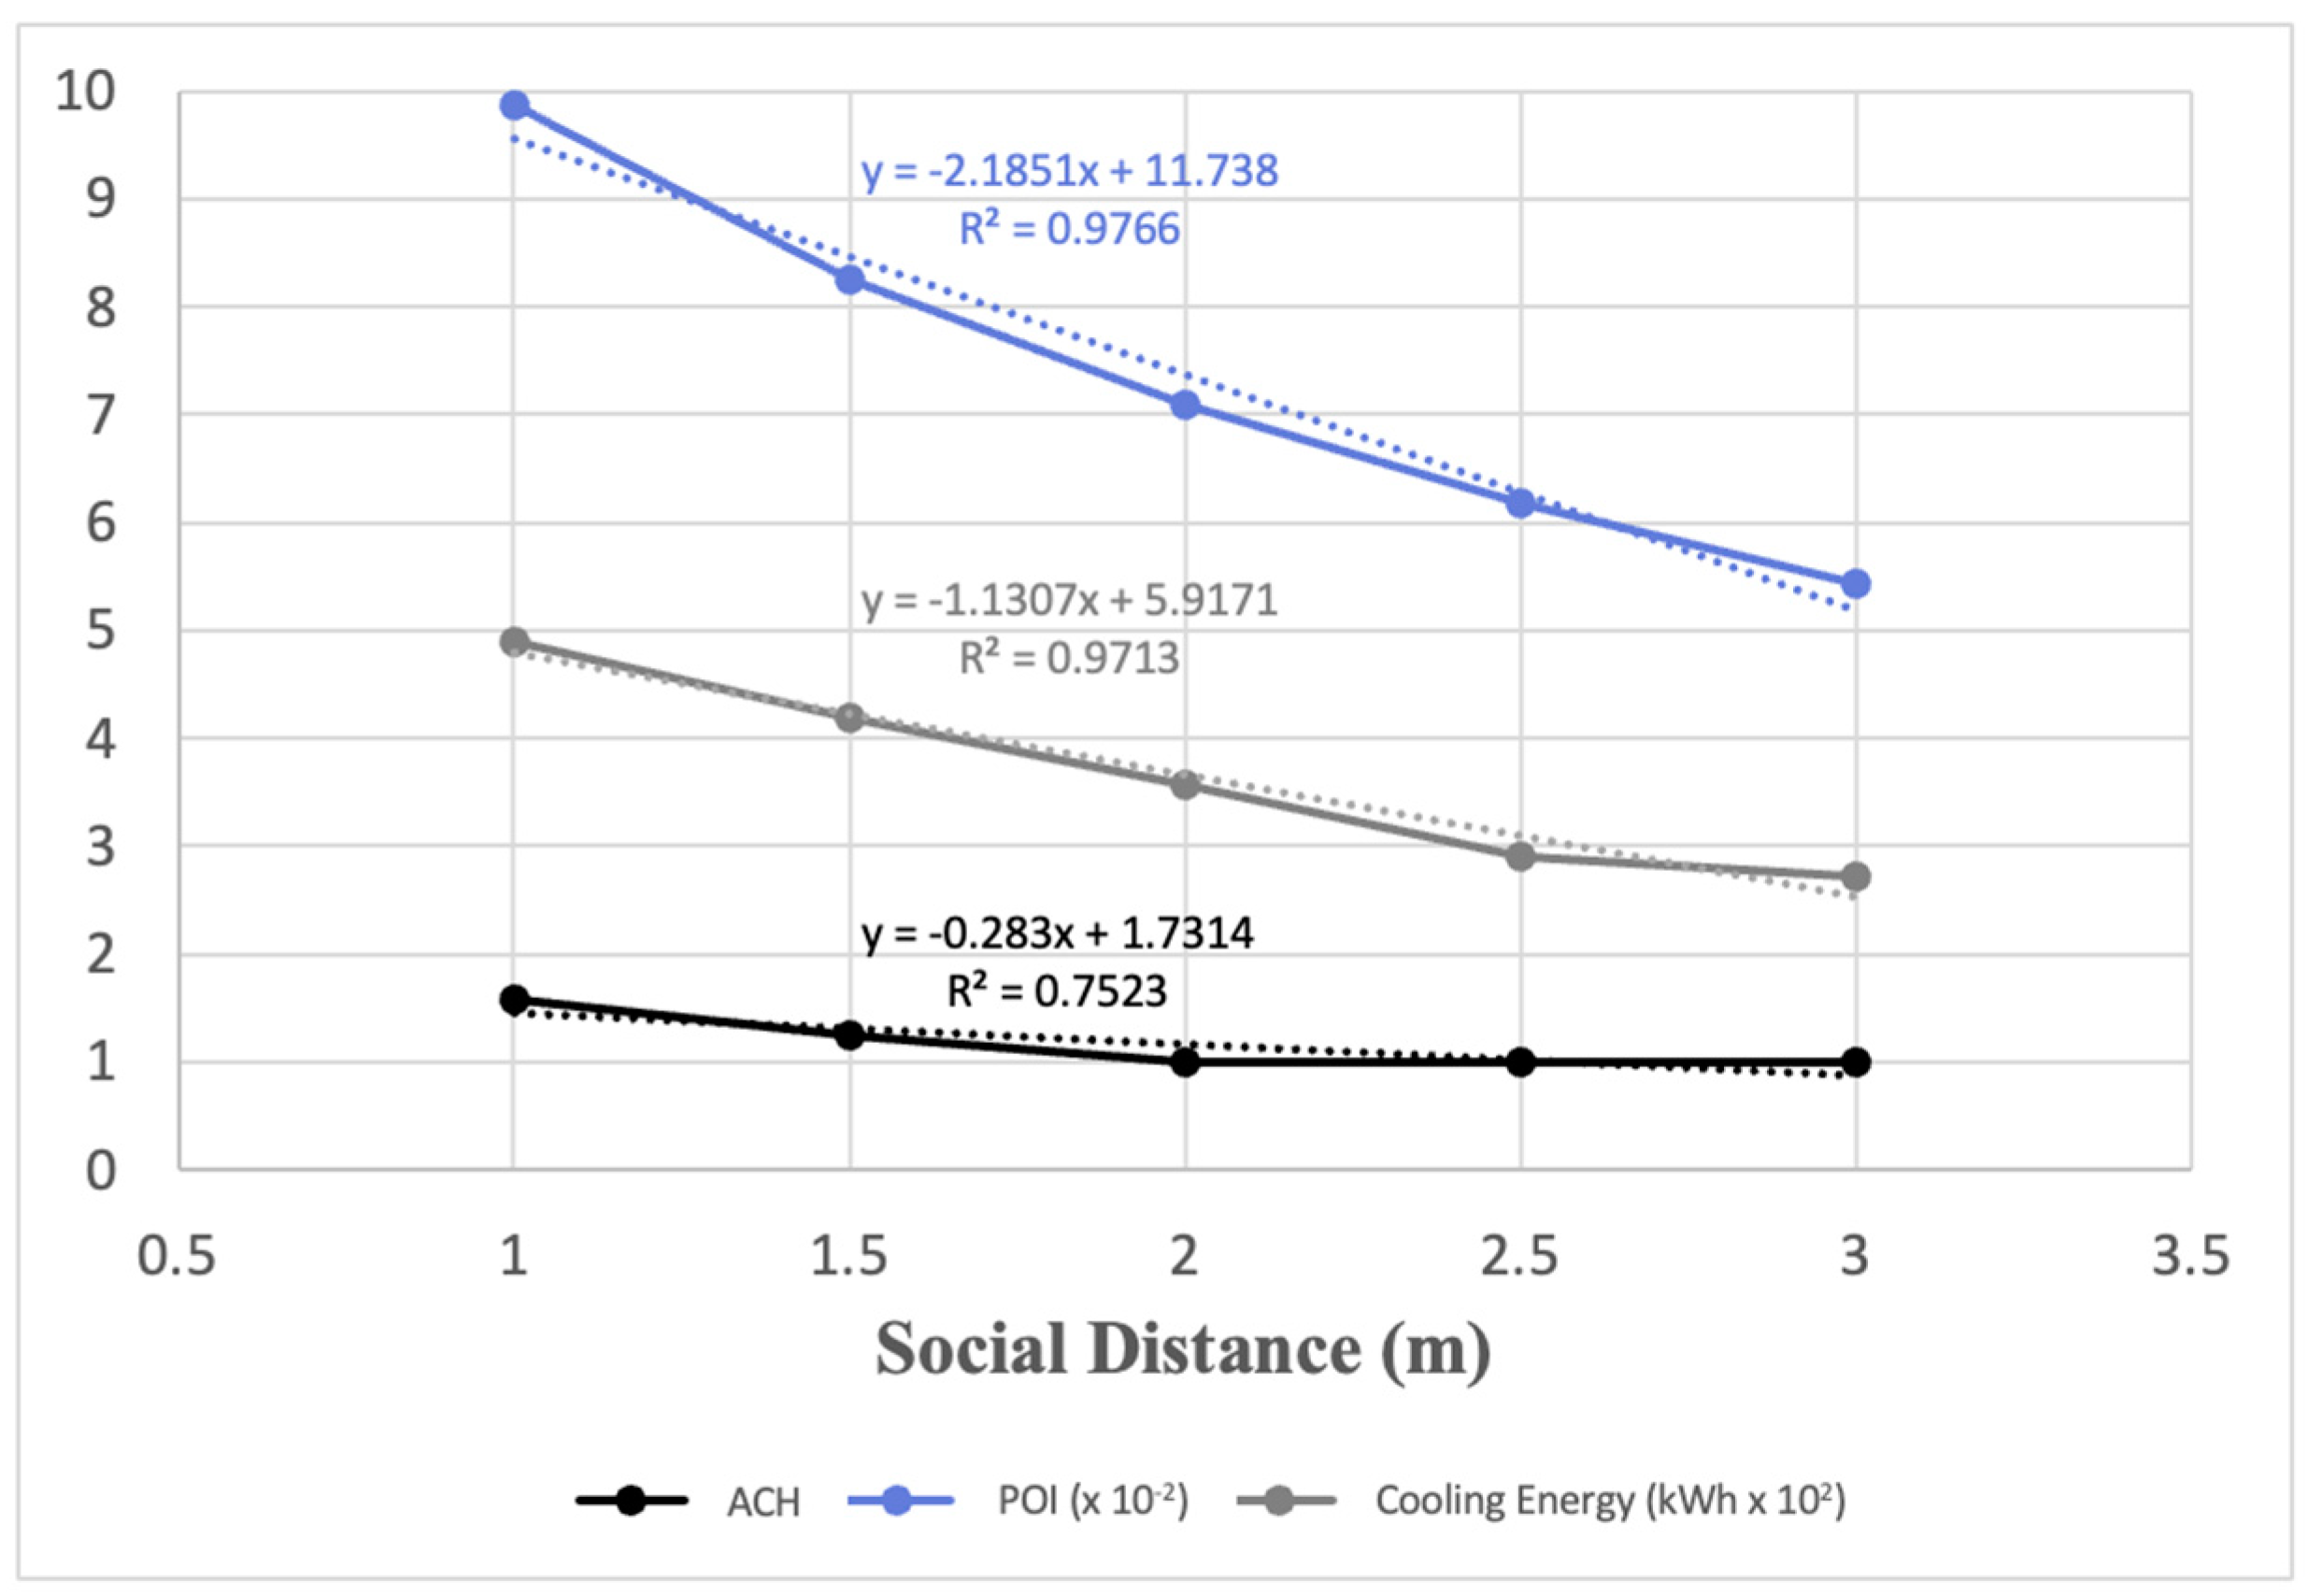
3.3. Sensitivity Analysis of MV

Two variables are varied to optimize the MV performance including (i) ventilation rate, varied from 1 to 10 ACH with an increment of 1 ACH; (ii) social distance in classrooms, varied from 1 to 3 m with a 0.5 m increment. To account for the influence of social distance, Sun and Zhai [12] presented a modified version of the Wells–Riley model by introducing a social distance index Pd as a cumulative probability estimated as a function of distance (d) and obtained using a regression analysis as expressed by Equation (2):
P d = 18.19 · l n d + 43.276 100
The social distance index (Pd) is introduced to the Wells–Riley equation as follows:
P i = 1 e P d Iqpt Vn
Figure 9, Figure 10 and Figure 11 summarize the results of the sensitivity analysis during 22 July showing the impacts of MV ventilation rate and social distance on, respectively, POI, cooling energy, and indoor CO2 concentration. It is worth noting that larger social distances lead to lower occupancy densities. For instance, based on the dimensions of the classrooms, a social distance of 1 m results in an occupancy density of 0.5 people/m2, while a social distance of 2 m reflects an occupancy density of 0.29 people/m2, which is a reduction of about 43% in number of students within the classrooms. In general, the results of Figure 8, Figure 9 and Figure 10 confirm that the impacts of ventilation rate are more significant than those of social distancing, especially on the POI and CO2 concentration. For example, increasing the social distance from 1 m to 2 m reduces the POI by 28%, CO2 concentration by 30%, and cooling energy use by 7%. On the other hand, increasing the ventilation rate from 1 ACH (i.e., close to ASHRAE 62.1 recommendation) to 2 ACH decreases the POI by 49% and CO2 concentration by 29%. However, the same ACH increase results in an increase in cooling energy use by 25%.
Comparing the performance indicators achieved by DCV to those obtained by MV operating with a constant ventilation rate of 2 ACH and a social distance of 1 m, DCV results in almost the same POI (i.e., 0.057) as that of MV (with POI of 0.051) with a 600 ppm set point but supplies an average ventilation rate of 4 ACH. With this ventilation rate, MV consumes 617 kWh/day in cooling energy use while DCV requires 743 kWh/day. Therefore, it can be concluded that MV is more energy-efficient than DCV when performances related to the infection transmission risks are considered. In addition, a closer look at the relative reduction in POI when increasing the ventilation rate of MV reveals a diminishing rate-of-return pattern with a substantial POI reduction obtained when increasing the ventilation rate up to 4 ACH and a minimal POI reduction achieved for ventilation rates higher than 4 ACH. On the other hand, cooling energy use is significantly increased as higher ventilation rates are supplied. The percentage changes in POI, CO2 concentration, and cooling energy use when varying ventilation rates and social distances are shown in Figure 12.
The impacts of ventilation rate shown in Figure 12 assumes a 1 m social distance (refer to Figure 12a) and the required ASHRAE ventilation rate (i.e., about 1 ACH) for the analyzed school (refer to Figure 12b). Combined optimized values of both ventilation rate and social distance could achieve acceptable values of POI, CO2 concentration, and cooling energy use. It is difficult to determine specific optimal values for the ventilation rate and the social distance without specifying the optimization objective function and associated constraints. Based on the sensitivity analysis results of Figure 9, Figure 10 and Figure 11, a moderate ventilation rate could be selected with an acceptable social distance to obtain the lowest POI with a minimal cooling energy consumption and acceptable indoor CO2 concentrations (i.e., within the maximum level of 1000 ppm). In this case, the following optimal MV settings are recommended: ventilation rate of 2 ACH and a social distance of 2 m to obtain a POI of 0.036, cooling energy use of 583 kWh/day, and indoor CO2 concentration of 700 ppm. These MV settings achieve a POI at 3.6% while ensuring a lower cooling energy use when compared to both ASHRAE 62.1 recommendations and DCV.

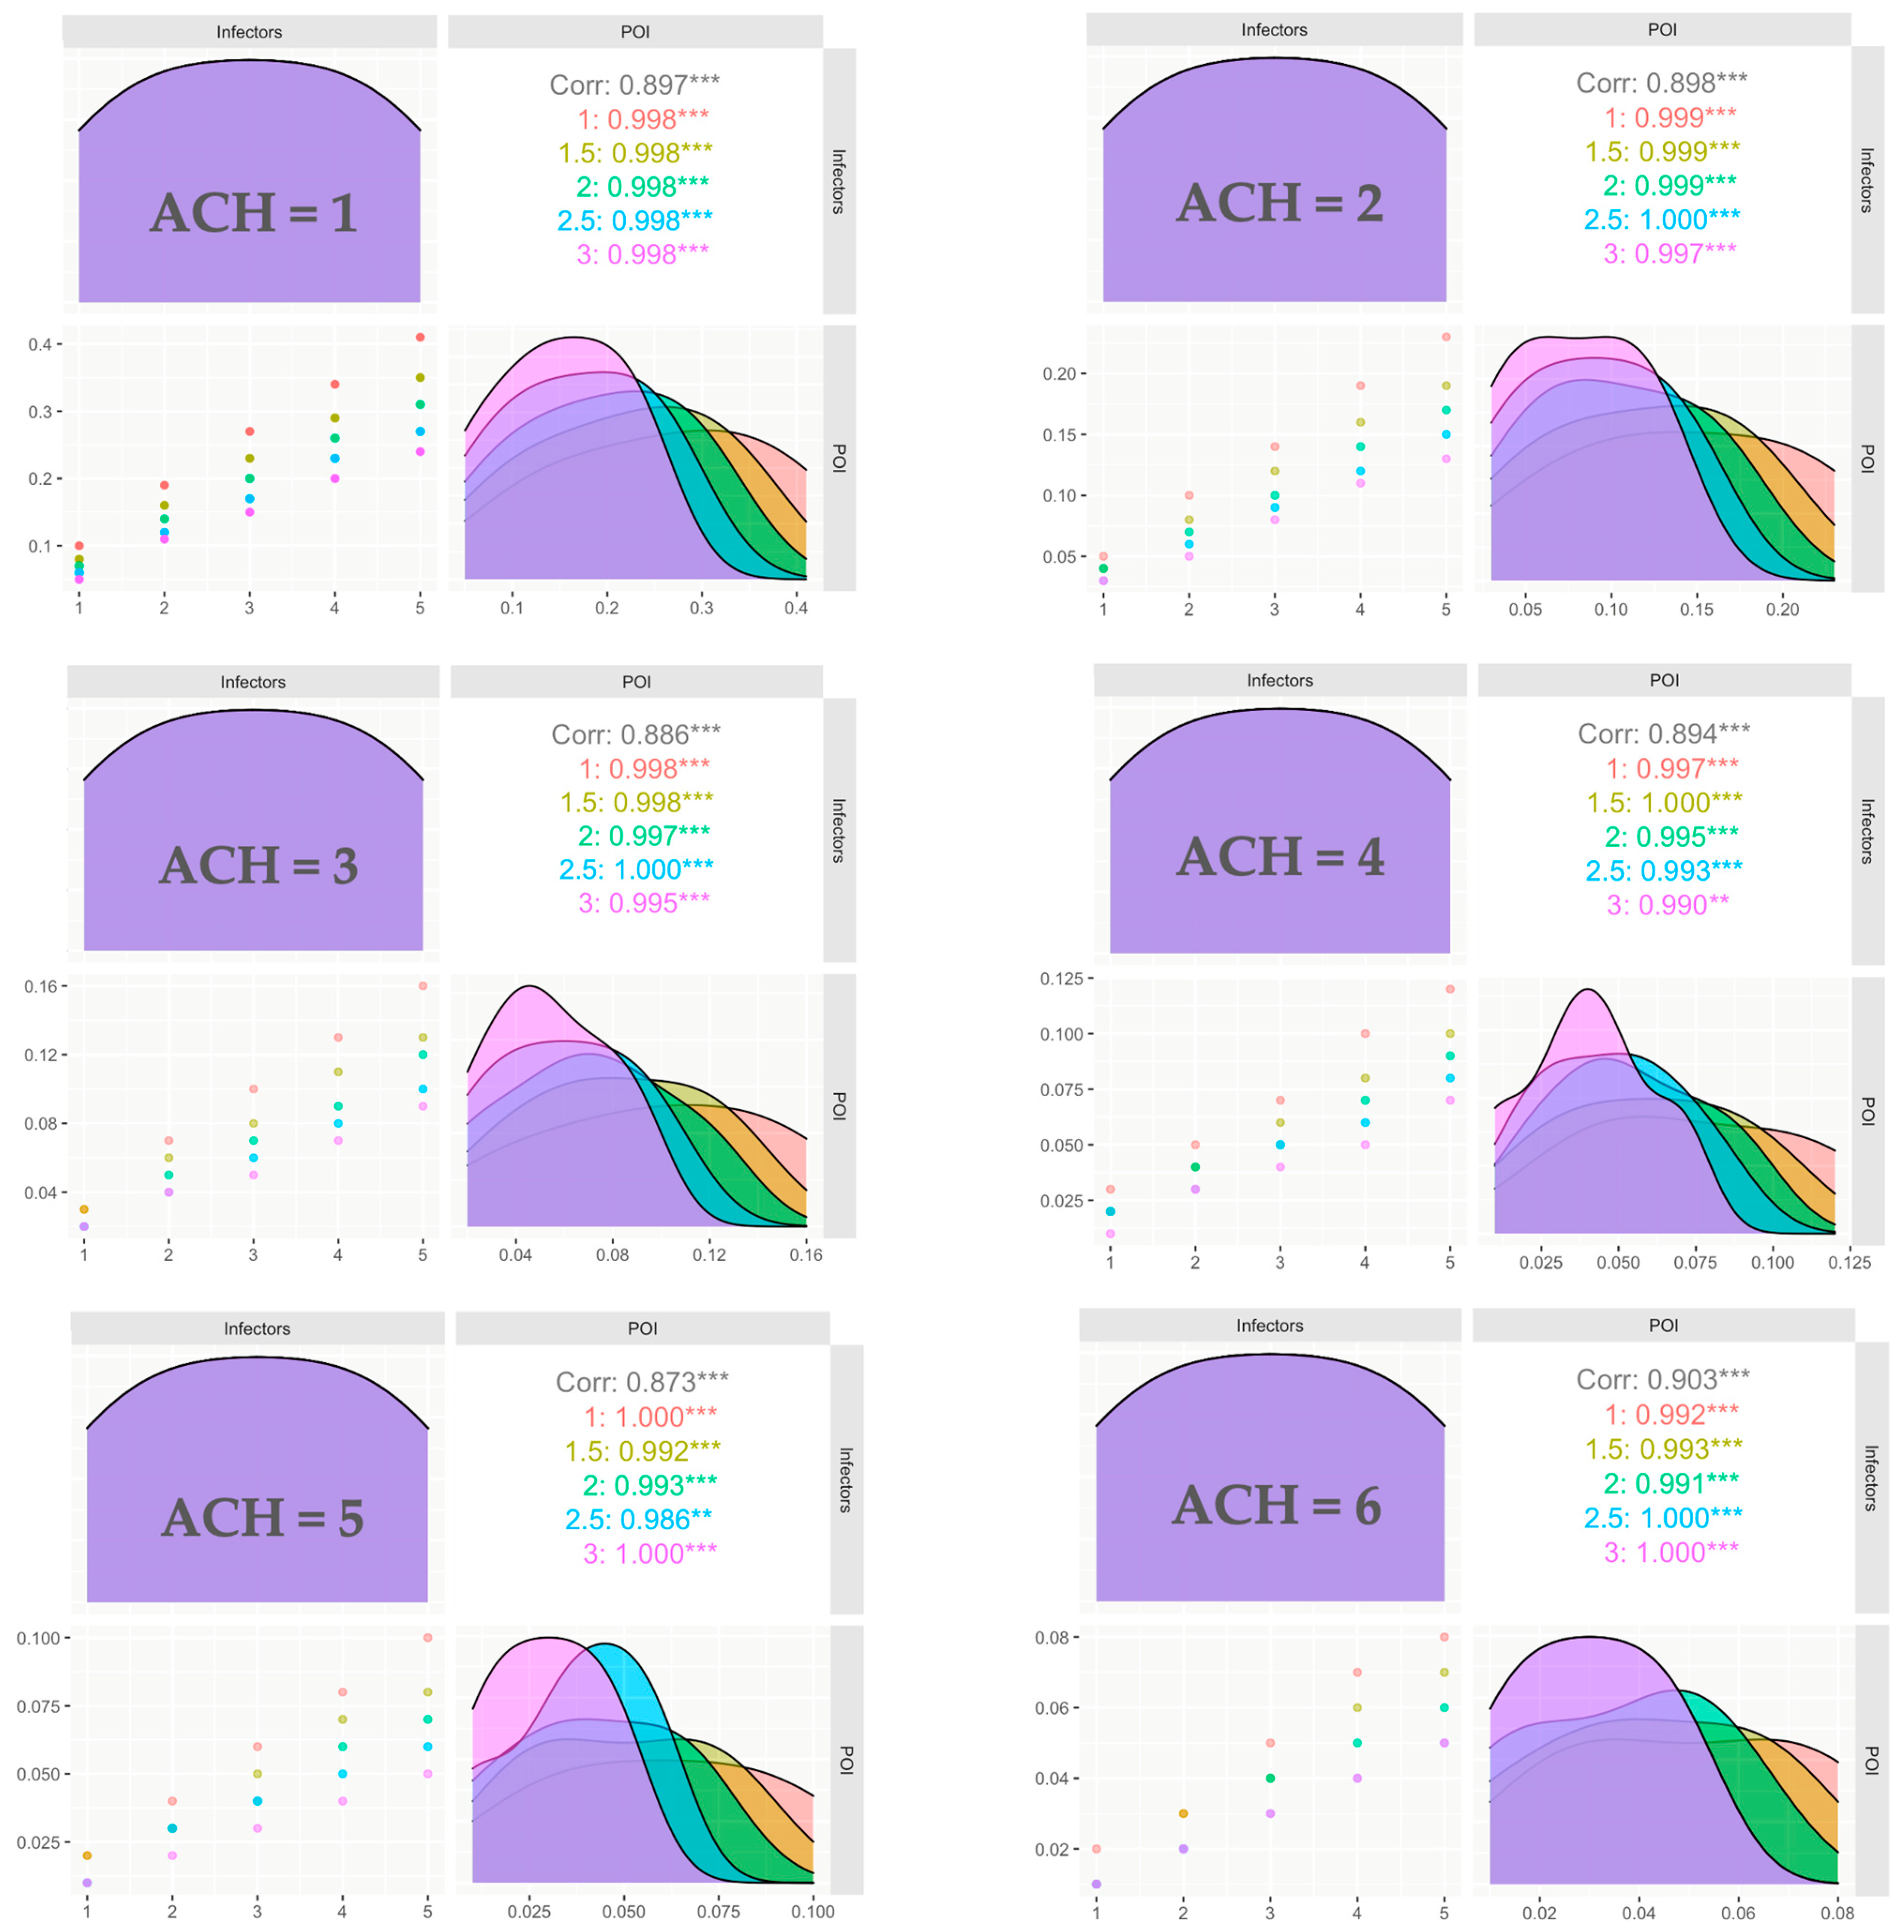
3.4. Impact of the Number of Infectors

A comprehensive sensitivity analysis is performed to investigate the interactive impacts of the number of infectors, ventilation rate, and social distance on the probability of infection and cooling energy use for the MV system. Specifically, the number of infectors is varied from 1 to 5; the ventilation rate is changed from 1 to 10 ACH; the social distance is gradually increased from 1 to 3 m. A comprehensive simulation analysis is performed to account for all the combinations of the three parameters. The results of the interactive impacts of these three parameters are shown in Figure 13, including six sections representing the results obtained for six ventilation rates (ranging from 1 ACH to 6 ACH). For each ventilation rate, the impacts of the number of infectors and POI levels are shown for five different social distances indicated by five different colors in Figure 13. Specifically, the subsection on the upper right and the subsection on the lower left of each section in Figure 13 depict the correlation between the POI and the number of infectors for each social distance value (each coded with a different color). Hence, valuable insights can be gleaned from the lower-left scatter plots for each ventilation rate. The results show a linear correlation between POI levels and the number of infectors as well as the social distances.
The results of Figure 13 indicate that increasing the number of infectors (i.e., number of infected persons) results in an increase in POI. However, the double effect of both ventilation rate and social distancing has a significant influence on controlling the POI as the results of Figure 13 suggest. As shown in Figure 13, when five infectors are present in the school with a 1 ACH ventilation rate and a social distance of 1 m, it results in a POI of 0.41, meaning that about 41% of the occupants would be infected by the end of the day. On the other hand, the POI is lowered to 0.036 (about 91% reduction in POI) when increasing the ventilation rate to 10 ACH and the social distance to 2 m for five infectors. It is worth noting that when applying the optimal ventilation rate and social distance recommended earlier (i.e., ventilation rate = 2 ACH and social distance = 2 m), the POI is decreased to 0.168, which is about a 59% reduction when compared to the worse case conditions (i.e., five infectors with 1 ACH ventilation rate and 1 m social distance). When the number of infectors is lower than five (between one and four), the POI is reduced to a range between 0.036 and 0.137 if the optimal ventilation rate and social distance are considered.

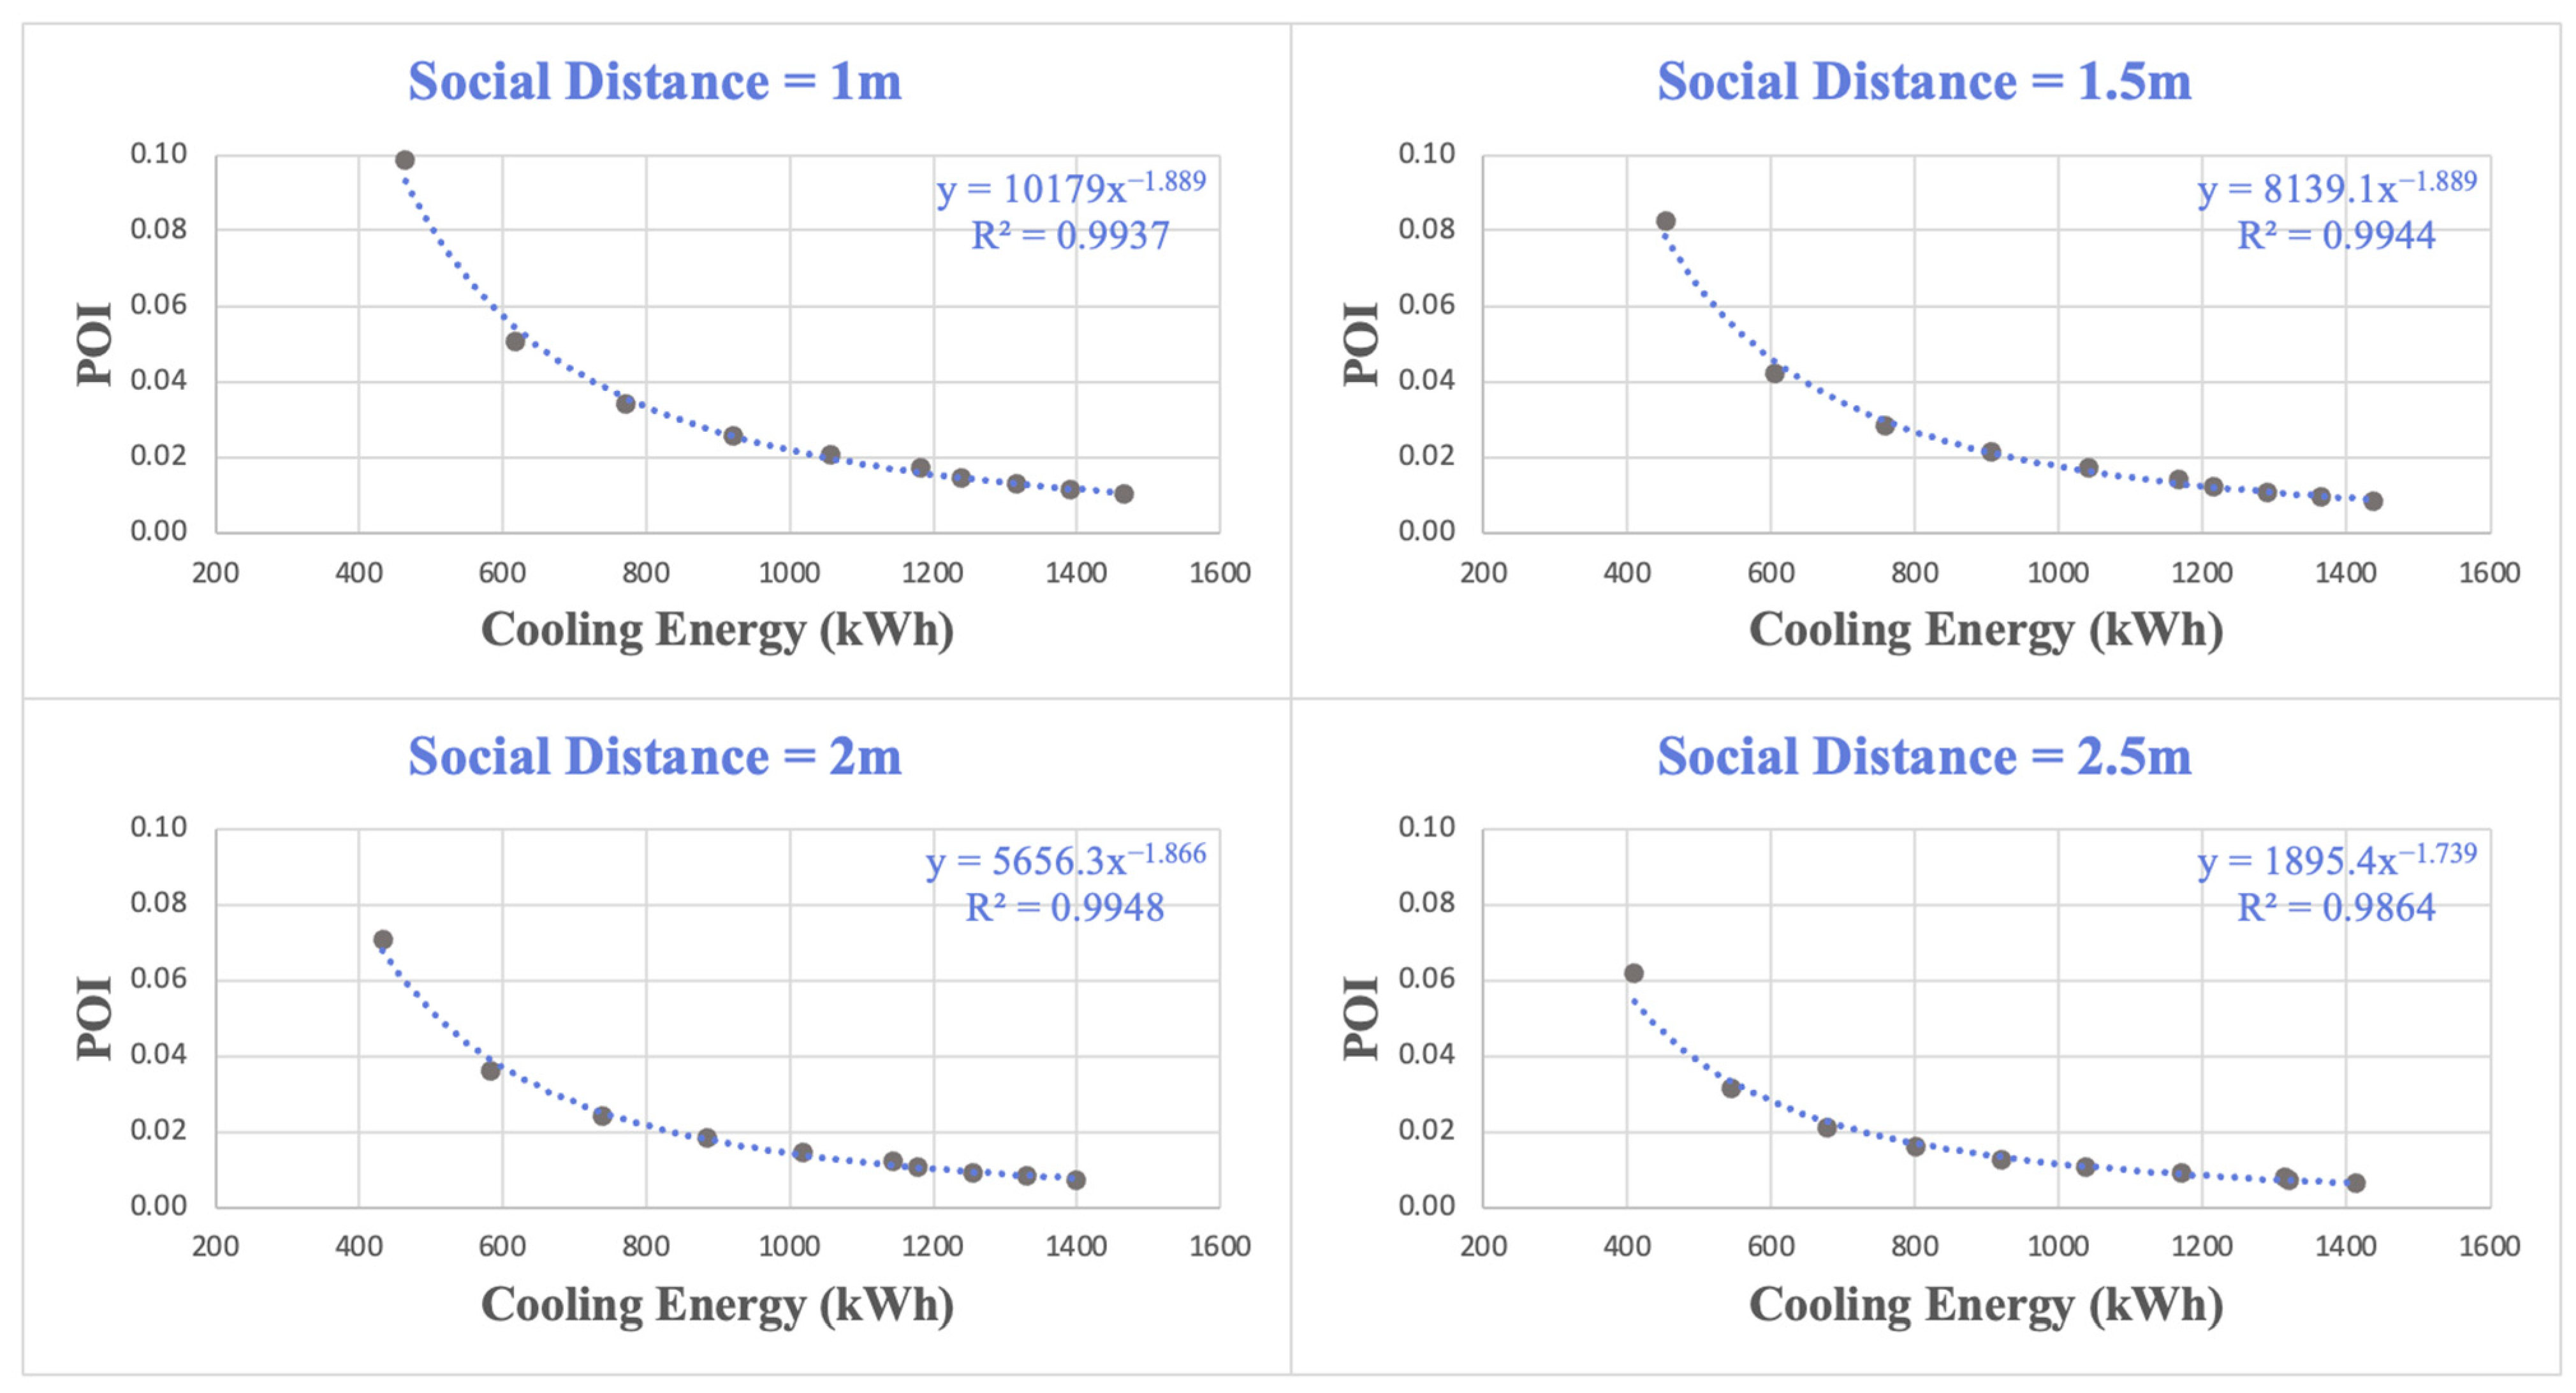
3.5. Correlation of POI and Cooling Energy

An exponential decay correlation exists between cooling energy demand and POI level where a significant decrease in POI can be achieved with a large increase in cooling energy use due to the increase in supplied ventilation rate. However, the impact of POI on cooling energy use is reduced when social distancing is increased. The correlations between POI, cooling energy use, and social distance, depicted in Figure 14, confirm that a high cooling energy consumption is required to control infection transmission in buildings. However, optimum ventilation rates and social distances could be considered to operate MV systems to maintain acceptable POI levels.
Figure 15 illustrates the effects of social distancing on the performance of the DCV system. In general, when the social distance is increased, the ventilation rate is lowered automatically due to the lower CO2 concentrations, which result in a lower cooling energy consumption. However, the ventilation rate is maintained at 1 ACH when the social distance exceeds 2 m to maintain the CO2 concentrations at acceptable levels. Furthermore, and as indicated in Figure 15, the POI level is decreased following the cooling energy use profile as the social distance increases. Yet, it is worth noting that the DCV system is delivering moderate ventilation rates compared to the MV system especially when a 1000 ppm set point is used for the DCV, as is the case in Figure 15. Thus, a lower cooling energy consumption is needed for DCV when compared to that required by the MV system when high ventilation rates are considered. Therefore, the MV system is capable of lowering the POI level compared to the DCV system even for a social distancing of 2.5 m.

4. Conclusions

A detailed review of the literature revealed a limited number of studies evaluating the energy efficiency of optimized ventilation systems to minimize infection risks in buildings including schools. This study evaluated the ability of optimized strategies for conventional mechanical ventilation (MV) and demand control ventilation (DCV) systems in reducing the probability of infection and cooling energy use for a prototypical school building in Jeddah, KSA. The main findings of the study include:
  • When considering the risk of infection transmission, optimized MV could be more energy-efficient than the DCV system according to the findings of this study.
  • Without adjusting its CO2 setting, the DCV system supplies low ventilation rates, resulting in significant POI increases within the school. However, adjusting the DCV set point from 1000 ppm to 600 ppm results in a significant POI reduction from 0.93 to 0.057, with a 50% increase in the total cooling energy needs.
  • MV can reduce the POI to 0.051 when operating with a higher ventilation rate of 2 ACH, double the required rate by the ASHRAE standard 60.2 for schools. The DCV can lower the POI to 0.057 when operating with a 600 ppm set point and delivering a ventilation rate of 4 ACH. In this case, MV consumes 617 kWh/day while DCV needs 743 kWh/day.
  • An optimal ventilation rate of 2 ACH and social distance of 2 m are recommended to deliver acceptable levels of POI, cooling energy use, and indoor CO2 concentration. These optimal settings would limit the POI to 0.036 while achieving the lowest cooling energy use of 583 kWh/day for the school.
  • Increasing the ventilation rate is more effective in reducing the POI than increasing the social distancing. However, the reduction in POI occurs with an increase in cooling energy use when the ventilation rate is increased. For instance, increasing the social distance from 1 m to 2 m would lower the POI by 28%, while reducing the cooling energy need by 7%. On the other hand, increasing the ventilation rate from 1 ACH to 2 ACH would lower the POI by 49%, while increasing the cooling energy demand by 25%.
  • The POI remains between 0.036 and 0.13 when operating with a 2 ACH ventilation rate and 2 m social distancing even if the number of infectors is increased from 1 to 5.
Even though the optimized conventional MV system could deliver a better performance, the adjustment of its settings allows the DCV system to provide similar POI performance. Thus, dynamic settings of the DCV set point to minimize infection risks is worth investigating as part of future studies. Moreover, dynamic controls such as model predictive controls (MPCs) could be suitable to operate both MV and DCV when considering several control variables such as ventilation rates and social distances. Finally, optimal combinations of effective methods and technologies, such as ventilation rates, ultraviolet irradiation, and air filtrations, to prevent viral infection in buildings could be assessed in future research.

Author Contributions

Conceptualization: A.A. (Alaa Alaidroos); methodology: A.A. (Alaa Alaidroos) and M.K.; software and analyses: A.A. (Alaa Alaidroos); investigation: A.A. (Ayad Almaimani), E.Q. and A.T.; resources and data collection: A.A. (Ayad Almaimani), E.Q. and A.T.; literature review: A.A. (Alaa Alaidroos); writing and draft preparation: A.A. (Alaa Alaidroos); review and editing: M.K. All authors have read and agreed to the published version of the manuscript.

Funding

This project was funded by the Deanship of Scientific Research (DSR), King Abdulaziz University, Jeddah, Saudi Arabia, under Grant No. (KEP-1-135-41).

Institutional Review Board Statement

Not applicable.

Informed Consent Statement

Not applicable.

Data Availability Statement

Data is available upon request.

Acknowledgments

The project was funded by the Deanship of Scientific Research (DSR), King Abdulaziz University, Jeddah, Saudi Arabia under grant no. (KEP-1-135-41). The authors, therefore, acknowledge with thanks DSR technical and financial support.

Conflicts of Interest

The authors declare no conflict of interest.

References

  1. Berry, G.; Parsons, A.; Morgan, M.; Rickert, J.; Cho, H. A review of methods to reduce the probability of the airborne spread of COVID-19 in ventilation systems and enclosed spaces. Environ. Res. 2022, 203, 111765. [Google Scholar] [CrossRef]
  2. Schumacher, S.; Banda Sanchez, A.; Caspari, A.; Staack, K.; Asbach, C. Testing Filter-Based Air Cleaners with Surrogate Particles for Viruses and Exhaled Droplets. Atmosphere 2022, 13, 1538. [Google Scholar] [CrossRef]
  3. Miller, S.L.; Nazaroff, W.W.; Jimenez, J.L.; Boerstra, A.; Buonanno, G.; Dancer, S.J.; Kurnitski, J.; Marr, L.C.; Morawska, L.; Noakes, C. Transmission of SARS-CoV-2 by inhalation of respiratory aerosol in the Skagit Valley Chorale superspreading event. Indoor Air 2021, 31, 314–323. [Google Scholar] [CrossRef]
  4. Bisag, A.; Isabelli, P.; Laurita, R.; Bucci, C.; Capelli, F.; Dirani, G.; Gherardi, M.; Laghi, G.; Paglianti, A.; Sambri, V.; et al. Cold atmospheric plasma inactivation of aerosolized microdroplets containing bacteria and purified SARS-CoV-2 RNA to contrast airborne indoor transmission. Plasma Process. Polym. 2020, 17, 2000154. [Google Scholar] [CrossRef]
  5. World Health Organization. Infection Prevention and Control during Health Care When COVID-19 Is Suspected; World Health Organization: Geneva, Switzerland, 2020. [Google Scholar]
  6. ASHRAE ANSI/ASHRAE Standard 170-2017; Ventilation of Health Care Facilities. American Society of Heating, Refrigerating and Air-Conditioning Engineers, Inc.: Atlanta, GA, USA, 2017.
  7. Chen, C.Y.; Chen, P.H.; Chen, J.K.; Su, T.C. Recommendations for ventilation of indoor spaces to reduce COVID-19 transmission. J. Formos. Med. Assoc. 2021, 120, 2055–2060. [Google Scholar] [CrossRef]
  8. Aganovic, A.; Bi, Y.; Cao, G.; Drangsholt, F.; Kurnitski, J.; Wargocki, P. Estimating the impact of indoor relative humidity on SARS-CoV-2 airborne transmission risk using a new modification of the Wells-Riley model. Build. Environ. 2021, 205, 108278. [Google Scholar] [CrossRef]
  9. Dai, H.; Zhao, B. Association of infected probability of COVID-19 with ventilation rates in confined spaces: A Wells-Riley equation based investigation. Build. Simul. 2020, 13, 1321–1327. [Google Scholar] [CrossRef]
  10. Riley, E.; Murphy, G.; Riley, R. Airborne spread of measles in a suburban elementary school. Am. J. Epidemiol. 1978, 107, 421–432. [Google Scholar] [CrossRef] [PubMed]
  11. Gammaitoni, L.; Nucci, M.C. Using a mathematical model to evaluate the efficacy of TB control measures. Emerg. Infect. Dis. 1997, 3, 335–342. [Google Scholar] [CrossRef] [PubMed] [Green Version]
  12. Sun, C.; Zhai, Z. The efficacy of social distance and ventilation effectiveness in preventing COVID-19 transmission. Sustain. Cities Soc. 2020, 62, 102390. [Google Scholar] [CrossRef] [PubMed]
  13. Sha, H.; Zhang, X.; Qi, D. Optimal control of high-rise building mechanical ventilation system for achieving low risk of COVID-19 transmission and ventilative cooling. Sustain. Cities Soc. 2021, 74, 103256. [Google Scholar] [CrossRef]
  14. Tang, H.; Pan, Z.; Li, C. Tempo-spatial infection risk assessment of airborne virus via CO2 concentration field monitoring in built environment. Build. Environ. 2022, 217, 109067. [Google Scholar] [CrossRef]
  15. Li, C.; Tang, H. Study on ventilation rates and assessment of infection risks of COVID-19 in an outpatient building. J. Build. Eng. 2021, 42, 103090. [Google Scholar] [CrossRef]
  16. Ai, Z.; Mak, C.; Gao, N.; Niu, J. Tracergasisasuitablesurrogateofexhaleddroplet nuclei for studying airborne transmission in the built environment. Build. Simul. 2020, 13, 489–496. [Google Scholar] [CrossRef] [PubMed] [Green Version]
  17. Lu, Y.; Li, Y.; Lin, M.; Liu, L.; Lin, B.; Zhou, H.; Lin, J.; Xu, H. Environmentalmonitoring and infection control of fever clinics in general hospitals during COVID-19 pandemic. Chin. Sci. Bull. 2020, 66, 475–485. [Google Scholar] [CrossRef]
  18. Kappelt, N.; Russell, H.S.; Kwiatkowski, S.; Afshari, A.; Johnson, M.S. Correlation of respiratory aerosols and metabolic carbon dioxide. Sustainability 2021, 13, 2203. [Google Scholar] [CrossRef]
  19. Schade, W.; Reimer, V.; Seipenbusch, M.; Willer, U. Experimental investigation of aerosol and CO2 dispersion for evaluation of COVID-19 infection risk in a concert hall. Int. J. Environ. Res. Public Health 2021, 18, 3037. [Google Scholar] [CrossRef] [PubMed]
  20. Rudnick, S.N.; Milton, D.K. Risk of indoor airborne infection transmission estimated from carbon dioxide concentration. Indoor Air 2003, 13, 237–245. [Google Scholar] [CrossRef]
  21. Cammarata, A.; Cammarata, G. Dynamic assessment of the risk of airborne viral infection. Indoor Air 2021, 31, 1759–1775. [Google Scholar] [CrossRef] [PubMed]
  22. Peng, Z.; Jimenez, J.L. Exhaled CO2 as a COVID-19 Infection Risk Proxy for Different Indoor Environments and Activities. Environ. Sci. Technol. Lett. 2021, 8, 392–397. [Google Scholar] [CrossRef]
  23. Stabile, L.; Pacitto, A.; Mikszewski, A.; Morawska, L.; Buonanno, G. Ventilation procedures to minimize the airborne transmission of viruses in classrooms. Build. Environ. 2021, 202, 108042. [Google Scholar] [CrossRef]
  24. Nair, A.N.; Anand, P.; George, A.; Mondal, N. A review of strategies and their effectiveness in reducing indoor airborne transmission and improving indoor air quality. Environ. Res. 2022, 213, 113579. [Google Scholar] [CrossRef]
  25. Afshari, A.; Hultmark, G.; Nielsen, P.V.; Maccarini, A. Ventilation System Design and the Coronavirus (COVID-19). Front. Built Environ. 2021, 7, 662489. [Google Scholar] [CrossRef]
  26. Eykelbosh, A. Indoor CO2 Sensors for COVID-19 Risk Mitigation: Current Guidance and Limitations; National Collaborating Centre for Environmental Health: Vancouver, BC, Canada, 2021; pp. 1–16. [Google Scholar]
  27. Yun, H.; Yang, J.; Seo, J.H.; Sohn, J.R. Methodology for sampling and detection of airborne coronavirus including SARS-CoV-2. Indoor Built Environ. 2022, 31, 1234–1241. [Google Scholar] [CrossRef]
  28. Bhardwaj, J.; Hong, S.; Jang, J.; Han, C.H.; Lee, J.; Jang, J. Recent advancements in the measurement of pathogenic airborne viruses. J. Hazard. Mater. 2021, 420, 126574. [Google Scholar] [CrossRef]
  29. Wang, J.; Huang, J.; Feng, Z.; Cao, S.J.; Haghighat, F. Occupant-density-detection based energy efficient ventilation system: Prevention of infection transmission. Energy Build. 2021, 240, 110883. [Google Scholar] [CrossRef] [PubMed]
  30. Li, B.; Cai, W. A novel CO2-based demand-controlled ventilation strategy to limit the spread of COVID-19 in the indoor environment. Build. Environ. 2022, 219, 109232. [Google Scholar] [CrossRef]
  31. Giampieri, A.; Ma, Z.; Ling-Chin, J.; Roskilly, A.P.; Smallbone, A.J. An overview of solutions for airborne viral transmission reduction related to HVAC systems including liquid desiccant air-scrubbing. Energy 2022, 244, 122709. [Google Scholar] [CrossRef]
  32. Schibuola, L.; Tambani, C. High energy efficiency ventilation to limit COVID-19 contagion in school environments. Energy Build. 2021, 240, 110882. [Google Scholar] [CrossRef] [PubMed]
  33. Alaidroos, A.; Almaimani, A.; Krarti, M.; Dahlan, A.; Maddah, R. Evaluation of the performance of demand control ventilation system for school buildings located in the hot climate of Saudi Arabia. Build. Simul. 2021, 15, 1067–1082. [Google Scholar] [CrossRef]
  34. Yan, S.; Wang, L.L.; Birnkrant, M.J.; Zhai, J.; Miller, S.L. Evaluating SARS-CoV-2 airborne quanta transmission and exposure risk in a mechanically ventilated multizone office building. Build. Environ. 2022, 219, 109184. [Google Scholar] [CrossRef] [PubMed]
  35. Alaidroos, A.; Almaimani, A.; Baik, A.; Al-Amodi, M.; Rahaman, K.R. Are historical buildings more adaptive to minimize the risks of airborne transmission of viruses and public health? A study of the hazzazi house in Jeddah (Saudi Arabia). Int. J. Environ. Res. Public Health 2021, 18, 3601. [Google Scholar] [CrossRef] [PubMed]
  36. Fageha, M.K.; Alaidroos, A. Performance Optimization of Natural Ventilation in Classrooms to Minimize the Probability of Viral Infection and Reduce Draught Risk. Sustainability 2022, 14, 4966. [Google Scholar] [CrossRef]
  37. Ministry of Municipal and Rural Affairs—KSA School’s Construction Requirements in KSA. 2019. Available online: http://tbc.sa:88/Etemad/municipalstipulations.pdf (accessed on 23 June 2021).
  38. Saudi Mechanical Code (SBC 501); Saudi Building Code National Committee: 2018, Riyadh, Kingdom of Saudi Arabia. Available online: https://da74f184-7160-42c1-9ed7-8f3b0ea674e6.filesusr.com/ugd/4069ce_936b663780c64fa7bf0e7e0ac4cc5d7f.pdf?index=true (accessed on 15 February 2023).
  39. ASHRAE Standard 62.1-2019; Ventilation for Acceptable Indoor Air Quality. American Society of Heating, Refrigerating and Air-Conditioning Engineers, Inc.: Atlanta, GA, USA, 2019.
  40. Li, Y.; Qian, H.; Hang, J.; Chen, X.; Cheng, P.; Ling, H.; Wang, S.; Liang, P.; Li, J.; Xiao, S.; et al. Probable airborne transmission of SARS-CoV-2 in a poorly ventilated restaurant. Build. Environ. 2021, 196, 107788. [Google Scholar] [CrossRef] [PubMed]
  41. Hijnen, D.; GeurtsvanKessel, C.; Marzano, A.V.; Eyerich, K.; Gim nez-Arnau, A.M.; Joly, P.; Vestergaard, C.; Sticherling, M.; Schmidt, E.; Lee, V.J. SARS-CoV-2 transmission from presymptomatic meeting attendee, Germany. Emerg. Infect. Dis. 2020, 26, 1935–1937. [Google Scholar] [CrossRef]
Figure 1. 3-D renderings of the prototypical school building energy model including a floorplan layout developed using DesignBuilder.
Buildings 13 00871 g001
Figure 2. Monthly energy consumption before and after calibration of the modeled school in Jeddah, KSA.
Buildings 13 00871 g002
Figure 3. Schematic diagram of the co-simulation approach using EnergyPlus whole-building energy analysis coupled with Matlab’s script of the Wells–Riley model.
Buildings 13 00871 g003
Figure 4. Validation of the time variation in the indoor CO2 concentration for the analyzed school.
Buildings 13 00871 g004
Figure 5. Comparison of Wells–Riley model predictions against actual data of reported COVID-19 cases.
Buildings 13 00871 g005
Figure 6. Hourly variations in ACH, CO2 concentration, cooling energy use, and POI for both MV and DCV during 22 July.
Buildings 13 00871 g006
Figure 7. Daily performance indicators of cooling energy use, CO2 concentration, and POI for MV and DCV specific to 22 July.
Buildings 13 00871 g007
Figure 8. Impacts of DCV CO2 set point on POI and cooling energy for 22 July.
Buildings 13 00871 g008
Figure 9. Impacts of MV ventilation rate and social distance on POI for 22 July.
Buildings 13 00871 g009
Figure 10. Impacts of MV ventilation rate and social distance on the cooling energy use for 22 July.
Buildings 13 00871 g010
Figure 11. Impacts of MV ventilation rate and social distance on the indoor CO2 concentration for 22 July.
Buildings 13 00871 g011
Figure 12. Percentage of change in POI, CO2 concentration, and cooling energy due to change in (a) ventilation rate and (b) social distance for 22 July.
Buildings 13 00871 g012
Figure 13. Impacts of the number of infectors, ventilation rate, and social distance on the probability of infection.
Buildings 13 00871 g013
Figure 14. Correlations between POI and cooling energy for a range of ventilation rates and social distances using one infector case for MV system.
Buildings 13 00871 g014
Figure 15. Variations in POI, cooling energy, and ventilation rate with the social distance for the one infector case using DCV system.
Buildings 13 00871 g015
Table 1. Main characteristics of the building energy model for the school.
Number of Floors2
Gross Floor Area3123 m2
Wall Construction2 cm plaster outside + 20 cm concrete hollow block + 5 cm expanded polystyrene + 2 cm plaster inside
Roof Construction1 cm built-up roofing + 20 cm concrete roof slab + 5 cm expanded polystyrene + 1.5 cm plaster inside
Window-to-Wall Ratio20%
Glazing TypeDouble Clear with PVC framing
Air Infiltration0.7 ACH
Number of Students per Area in classrooms0.5/m2
Lighting Power Density5 W/m2
Equipment Power Density4.7 W/m2
HVAC SystemDX Packaged Air Handling Unit
Cooling Set Point23 °C
Ventilation SystemMechanical ventilation with fixed outdoor air fraction (15%)
Energy Efficiency Ratio (EER)8.5
Table 2. Summary of the reported data of the COVID-19 actual cases [3,40,41].
CaseCase DatePlace TypeTotal OccupantsPrimary Infected CasesSecondary Infected CasesV (m3)n
(ACH)
t
(h)
p (m3/h)q (quanta/h)
124 January 2020Restaurant21191270.61.251.142.1
220 February 2020Meeting room141≥111890.29.51.142.1
310 March 2020Choir hall61133–538100.35–1.052.51.1195.5
Disclaimer/Publisher’s Note: The statements, opinions and data contained in all publications are solely those of the individual author(s) and contributor(s) and not of MDPI and/or the editor(s). MDPI and/or the editor(s) disclaim responsibility for any injury to people or property resulting from any ideas, methods, instructions or products referred to in the content.

