Article

Research on Light Comfort of Waiting Hall of High-Speed Railway Station in Cold Region Based on Interpretable Machine Learning

1
Heilongjiang Cold Region Architectural Survey and Design Co., Ltd., Qing Bin Road, Nan Gang District, Harbin 150080, China
2
School of Landscape Architecture, Northeast Forestry University, No. 26, He Xing Road, Xiang Fang District, Harbin 150040, China
*
Authors to whom correspondence should be addressed.
Buildings 2023, 13(4), 1105; https://doi.org/10.3390/buildings13041105
Submission received: 28 January 2023 / Revised: 8 April 2023 / Accepted: 19 April 2023 / Published: 21 April 2023
(This article belongs to the Special Issue Sustainable Architecture and Healthy Indoor Environment)

Abstract

:
Upon the need for sustainability and natural lighting performance simulation for high-speed railway station waiting halls in cold regions, a new prediction method was proposed for the quantitative analysis of their natural lighting performance in the early design stage. Taking the waiting hall of Harbin West Railway Station as the prototype, the authors explore the optimization design of green performance-oriented waiting halls in this paper. To maximize daylight and minimize visual discomfort, and with the help of Rhinoceros and Grasshopper and Ladybug, and Honeybee platform simulation programs, spatial elements such as building orientation, shape and windowing were simulated through optimizing target sDA, UDI and DGPexceed, respectively, based on natural lighting performance. Additionally, a dataset covering several light environment influencing factors was constructed by parametric simulations to develop a gradient boosted regression tree (GBRT) model. The results showed that the model was valid; that is, the coefficient of determination between the predicted value and the target one exceeds 0.980 without overfitting, indicating that the interpretability analysis based on the GBRT prediction model can be used to fully explore the contribution of related design parameters of the waiting hall to the indoor light environment indexes, and to facilitate more efficient lighting design in the early design stage without detailed analysis. In addition, the GBRT prediction model can be used to replace the traditional one as the effective basis for decision support. To conclude, the skylight ratio played a significant role in UDI, while the section aspect ratio (SAR) and plan aspect ratio (PAR) served as the key design parameters for sDA and DGPexceed, respectively. At the same time, the building orientation had the least degree of influence on the natural lighting of the waiting hall.

1. Introduction

As transportation hubs connecting various cities, high-speed railway stations play an increasingly vital role in the social and economic life of China [1]. The waiting hall is the core space of the high-speed railway station [2], where passengers stay for a long time; therefore, passengers have increasingly high requirements for the quality of the light environment in the waiting hall [3], and it is urgently needed to build a healthy and comfortable area [1,4]. People’s needs are multi-level from low to high, and with reference to Maslow’s hierarchy of needs model, people will naturally pursue and aspire to higher comfort and health needs after satisfying their survival needs and safety needs [5]. It has been highlighted that the use of sunlight in buildings not only reduces lighting energy consumption, but also helps to improve the comfort of building occupants [6]. In addition, many studies have shown that bringing sunlight into indoor spaces can improve visual quality and reduce a range of symptoms, such as depression and seasonal affective disorder (SAD) [7,8]. Daylight is considered an indispensable factor in the design of waiting halls. Natural light shows the importance of keeping the physiological and psychological balance of the building users [9]. Muñoz-González et al., found sunshine affects people’s circadian rhythm, and the lack of natural lighting in the home office can easily lead to headaches, fatigue and inattention [10]. In recent years, many experts have studied and discussed the light environment of architectural spaces under different conditions and environments, but scholars have paid more attention to the comfort of the indoor light environment of residential buildings [11] and office buildings [12], while less attention has been paid to the built environment of the waiting hall, which are more open and have a higher crowd density. In addition, most of the relevant research results focus on the indoor thermal environment of waiting halls [13] and ignore the research on the light environment. With the popularization of the concept of green health, the lighting of the waiting hall is valued by passengers. As mentioned above, an appropriate indoor daylighting design can greatly reduce the energy consumption of artificial lighting, and facilitate early achievement of the dual goals of carbon peaking and carbon neutrality.
In order to guide the lighting design more effectively, the accuracy of the lighting simulation technology has raised higher requirements. The natural illuminance and color rendering provided by sunlight is hard to replace with artificial light sources, and the sunlight quality and energy-saving effect are better than artificial lighting [14]. However, the condition of the natural light environment is constantly changing. In order to accurately evaluate the real condition of the daylight environment at the initial stage of scheme design, designers need to use lighting simulation technology to simulate and predict the condition of natural light [15]. Natural light is dynamic and it is difficult to control its dynamic changes; it changes with geography, time and weather conditions, which increases the difficulty and accuracy of computer simulation [16]. With the high-speed advancement of science and technology, daylighting simulation technology has been significantly developed, and natural daylighting simulation technology has changed from static daylighting simulation to dynamic daylighting simulation. The traditional static daylighting simulation method can only simulate a single sky condition, while the dynamic daylighting simulation technology makes up for the shortcomings of the static daylighting simulation method. By optimizing and upgrading the more advanced core algorithm, dynamic sky conditions can be predicted. In addition, the accuracy of daylighting simulation analysis technology is improving. By integrating the information on sky meteorology, geographical location and environmental conditions, the research on the accuracy of the skylight climate model has made great progress, which can greatly improve the accuracy of waiting hall lighting simulation. Ruiz proposed a new daylight dynamic indicator, partial daylight autonomy (DAp), which was verified under real sky conditions. This method can accurately quantify the accurate switching time and energy consumption of seasonal space electric lighting [17]. Susa-Páez made use of useful daylight illuminance to simulate the dynamic lighting of the atrium and adjacent space to assess the lighting potential of the vertical central atrium, which contributes to improving the light comfort of the building’s users [18].
Although the above research can improve the precision of lighting design, the current environmental simulation tools have professional barriers, and there is a lack of reliable interfaces among various environmental simulation and evaluation tools. A large amount of environmental simulation analysis software is time-consuming and inefficient, and cannot provide effective support for the performance-driven design process. Therefore, it is vital to improve the efficiency of the corresponding lighting simulation tools and the friendliness of tool operation, and increase the research on the universal plug-in interface and platform. e Silva introduced a parametric design method to measure the energy performance of buildings; all simulations and optimizations were accomplished on a single platform, using Grasshopper and its plug-ins Ladybug, Honeybee and Galapagos, compared with the traditional method, and it not only improves the accuracy of simulation but also saves time [19]. Kamel set up a parameterized workflow for evaluating outdoor thermal comfort. Compared with other current methods, this workflow has considerable universality through Ladybug and Honeybee, and Butterfly plug-ins on the grasshopper interface, and can be used for parameterized research on indoor and outdoor environments [20]. The above study shows that the natural light performance simulation tool developed based on the parametric simulation platform can significantly simplify the modeling process and improve the efficiency of natural light performance simulation.
In addition, in order to assess the natural lighting performance of the waiting hall in a timely manner, an efficient and accurate prediction method needs to be found. Traditional forecasting methods use software such as EnergyPlus V9.0.1, DesignBuilder 7.0, Ecotect 2021, etc., which require input parameters involving a large number of detailed descriptions of space and skin, building structure, equipment, operation mode, etc., and lots of information is difficult to obtain in the early design stages. The limitations of traditional forecasting models make it difficult to predict the physical environment of buildings efficiently [21,22,23], while machine learning makes up for the shortcomings of traditional tools in terms of efficiency and accuracy. In order to quickly obtain energy-related feedback in the early design stage, Hygh developed a multivariate linear regression model based on a dataset of 27 design parameters. It was found that it is very consistent with the simulation results and becomes an effective decision support tool for designers [24]. Turhan used artificial neural networks to forecast the thermal load of existing design parameters. The results show that under the given conditions, the prediction results of the artificial neural network were highly consistent with those of the building energy simulation tool, with a prediction success rate of 0.977 [25]. However, there are limitations when traditional machine learning algorithms try to learn and predict the light environment of the waiting hall. Traditional machine learning is not good at dealing with nonlinear problems. Aiming at tackling this problem, this paper proposes a gradient boosting regression tree (GBRT) prediction model [26], which has high prediction accuracy and efficiency in dealing with high-dimensional nonlinear problems, as an interpretable machine learning theory can make the model transparent, allowing designers to understand the decision-making process and build trust between people and the model. On this basis, by introducing explainability into the dynamic light environment prediction in waiting halls, the interpretation of inductive preferences of the model is added to the harvest regression model, and the different contributions of design factors to light environment metrics are summarized [27].
Reasonable natural lighting design is of great significance to the waiting hall. Based on the regional characteristics of cold regions, this paper puts forward a digital design process for the light environment of waiting halls in cold regions under the background of flourishing “performance-driven” design thinking [28], combined with the simulation technology of green building performance [29] and the parametric design method [30]. This paper aims to achieve the following objectives: (1) To construct a parametric design process to remedy the problems of the insufficient consideration of spatial parameters and long optimization time of existing simulation methods. (2) To conduct a parametric simulation of design parameters affecting the waiting hall, so as to construct a sample dataset affecting the lighting performance of the waiting hall. (3) The GBRT prediction model constructed by the sample dataset helps designers to make rapid predictions of lighting performance in early design stages, and then obtains the ranking of each design parameter on the lighting performance of the waiting hall, and derives the key parameters contributing to the indoor light environment. (4) To provide design suggestions for the light environment in the waiting halls to provide decision support for sustainable architectural lighting design.

2. Case Study

2.1. Study Area

After investigating the basic profile of more than 20 waiting halls, this study found that the basic form of a waiting hall is mostly rectangular with high efficiency in use, simple in shape and without too many changes in body shape, which is conducive to an energy-saving design. In the design of the waiting hall profile, the arch shape with a high middle and low sides is adopted, which can better resist snow load and effectively avoid the accumulation of snow in the skylight position. In the design of the skylight of the waiting hall, it mostly adopts the decentralized strip skylight to obtain a good lighting effect. As a typical waiting hall representative with the above characteristics, Harbin West Station was taken as the key research object to explore the law of lighting design in cold regions. As shown in Figure 1, Harbin West Station is located in Harbin, the capital of Heilongjiang Province, which is an important central city in Northeast China. The light environment in the waiting hall was investigated by measurement and recording methods. The recorded contents include the size, shape, position, plane shape and proportion of the lighting openings in the waiting hall, etc.

2.2. Design Objectives

In this paper, the constructed daylighting analysis model considered spatial daylight autonomy (sDA), useful daylight illuminance (UDI) and daylight glare probability (DGP) as the main indices to assess daylighting comfort, as follows:

2.2.1. Daylight Autonomy (DA) and sDA (Spatial Daylight Autonomy)

Nowadays, the dynamic daylighting metric appears to make up for the deficiency of DF. The dynamic daylight metric (DA) can effectively quantify natural light and is widely used in many countries. This metric is signified as a percentage of the occupied hours throughout the year that a given point in an indoor space is above a specified illuminance level, according to the study by Reinhart and Walkenhorst in 2001 [31].
DA takes various sky types, geographical positions, building orientations and the comfort of building users into consideration as a whole, which can more accurately express the ability of the waiting hall to effectively utilize natural light [31]. However, DA has some limitations and does not take into account the visual discomfort caused by high illumination in the horizontal plane.
sDA is the spatial natural light satisfaction rate, which describes the annual adequacy of daylight levels in the indoor environment and is defined as the percentage of calculated points with DA values exceeding a given percentage of all calculated points. It is calculated by evaluating the DA in each point of the spatial grid over the analysis area and then filtering out the grids with DA values exceeding a given reference value and finding their number as a percentage of the total number of grids. sDA is widely used in many countries because it can provide magnitude and area coverage information, which allows for a more accurate assessment of the light environment in the waiting hall [32].

2.2.2. Useful Daylight Illuminance (UDI)

Apart from DA, there are other dynamic lighting indicators to describe the lighting performance of the waiting hall. Introducing natural light into buildings is conducive to saving energy consumption and meeting the physiological and psychological needs of building users. However, if the indoor illumination is too high or too low it can affect the visual comfort of passengers [33]. Based on this, useful daylight illuminance was put forward by Nabil and Mardaljevic in 2005 [34]. It is explained as the occupied time throughout the year in which the daylight level is useful for the passengers [18]. Nabil and Mardaljevic subdivided useful daylight illuminance into three intervals: values below 100 lx are considered under-illuminated, and when they are above 2000 lx, it means that the illumination is too bright, and the range of 100 and 2000 lx is the most useful range [14].

2.2.3. Daylight Glare Probability (DGP)

Excessive daylight illuminance will affect the daylighting comfort of the waiting hall. In order to evaluate glare, the daylight glare probability was proposed by Wienold and Christoffersen in 2006 [7]. It is defined as the percentage of people bothered by the level of discomfort glare [34]. It takes into account the luminance gradient within the visual field, the position of glare sources, as well as the visual contrast [7]. The main criteria for judging glare performance are daylight glare probability (DGP) and the daylight glare index (DGI), both of which can be used to evaluate uncomfortable glare; however, in comparison with DGI, some studies have shown that DGP has higher accuracy and applicability [14]. The degrees of glare are as follows [35]: DGP < 0.35 is “imperceptible”, 0.35 < DGP < 0.40 is ”perceptible” and 0.40 < DGP < 0.45 is “disturbing”, while higher than 0.45 is deemed “intolerable”. The DGP equation is as follows [33]:
D G P = 5.87 · 10 5 E v + 0.0918 · log 10 1 + i = 1 n L s i 2 ω s i E v 1.87 P i 2 + 0.16
where Ev is the total vertical eye illuminance, Ls·i is the luminance of the source, ωs·i is the solid angle of the source, and P is the position index.
In order to understand the frequency of exceeding the minimum glare threshold, this paper proposes the evaluation index DGPexceed. DGPexceed is defined as the number of hours throughout the year that the DGP is above a defined threshold at the analysis point, where DGPexceed is reported one analysis point along the central axis of the space. Using 0.35 as the standard value for the calculation to avoid perceptible glare perception as much as possible, the value of DGPexceed is the number of hours in the year that are greater than 0.35.

3. Methodology

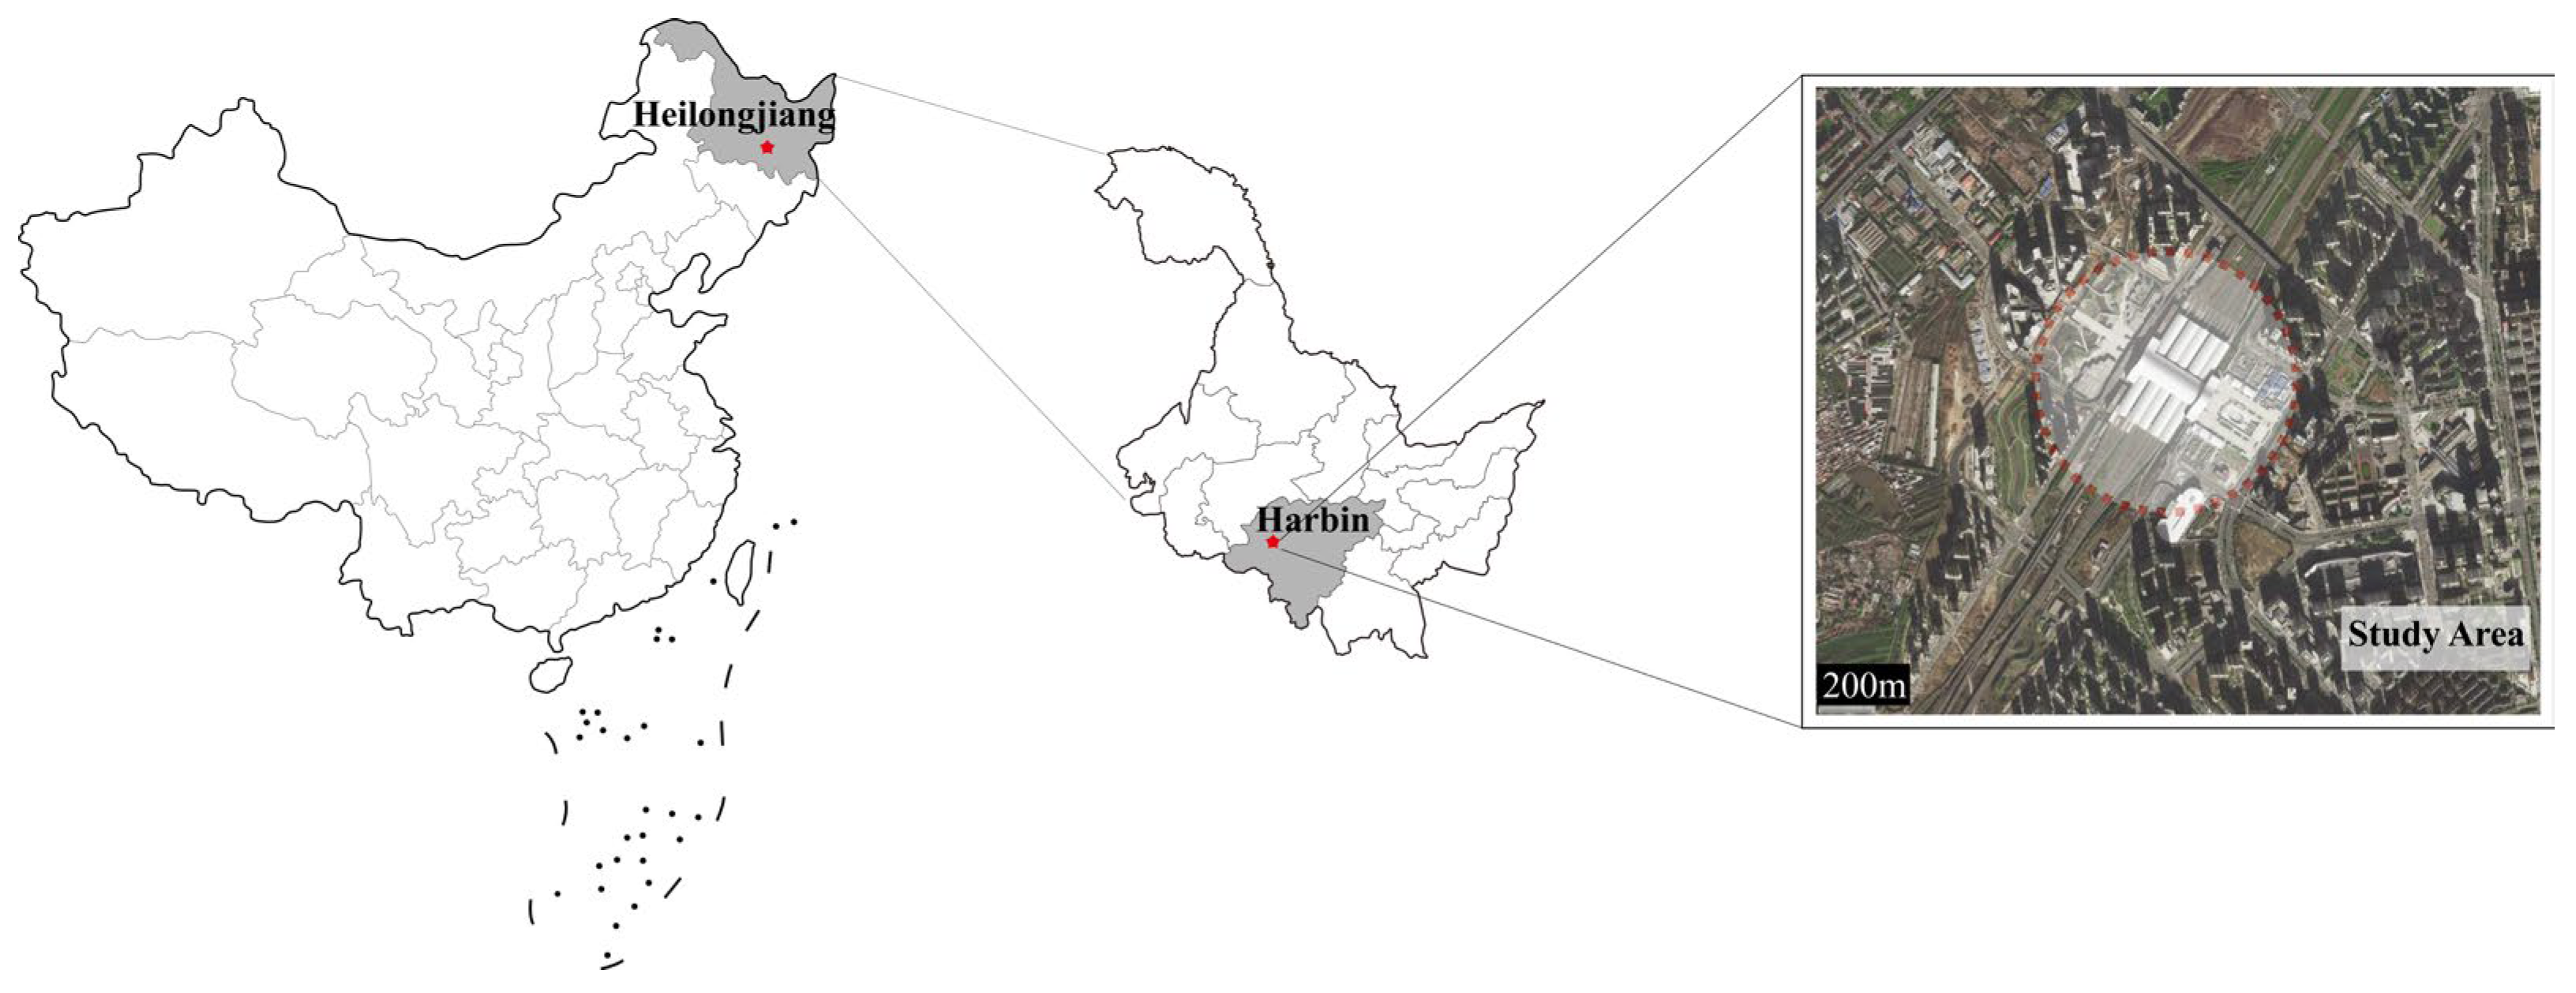
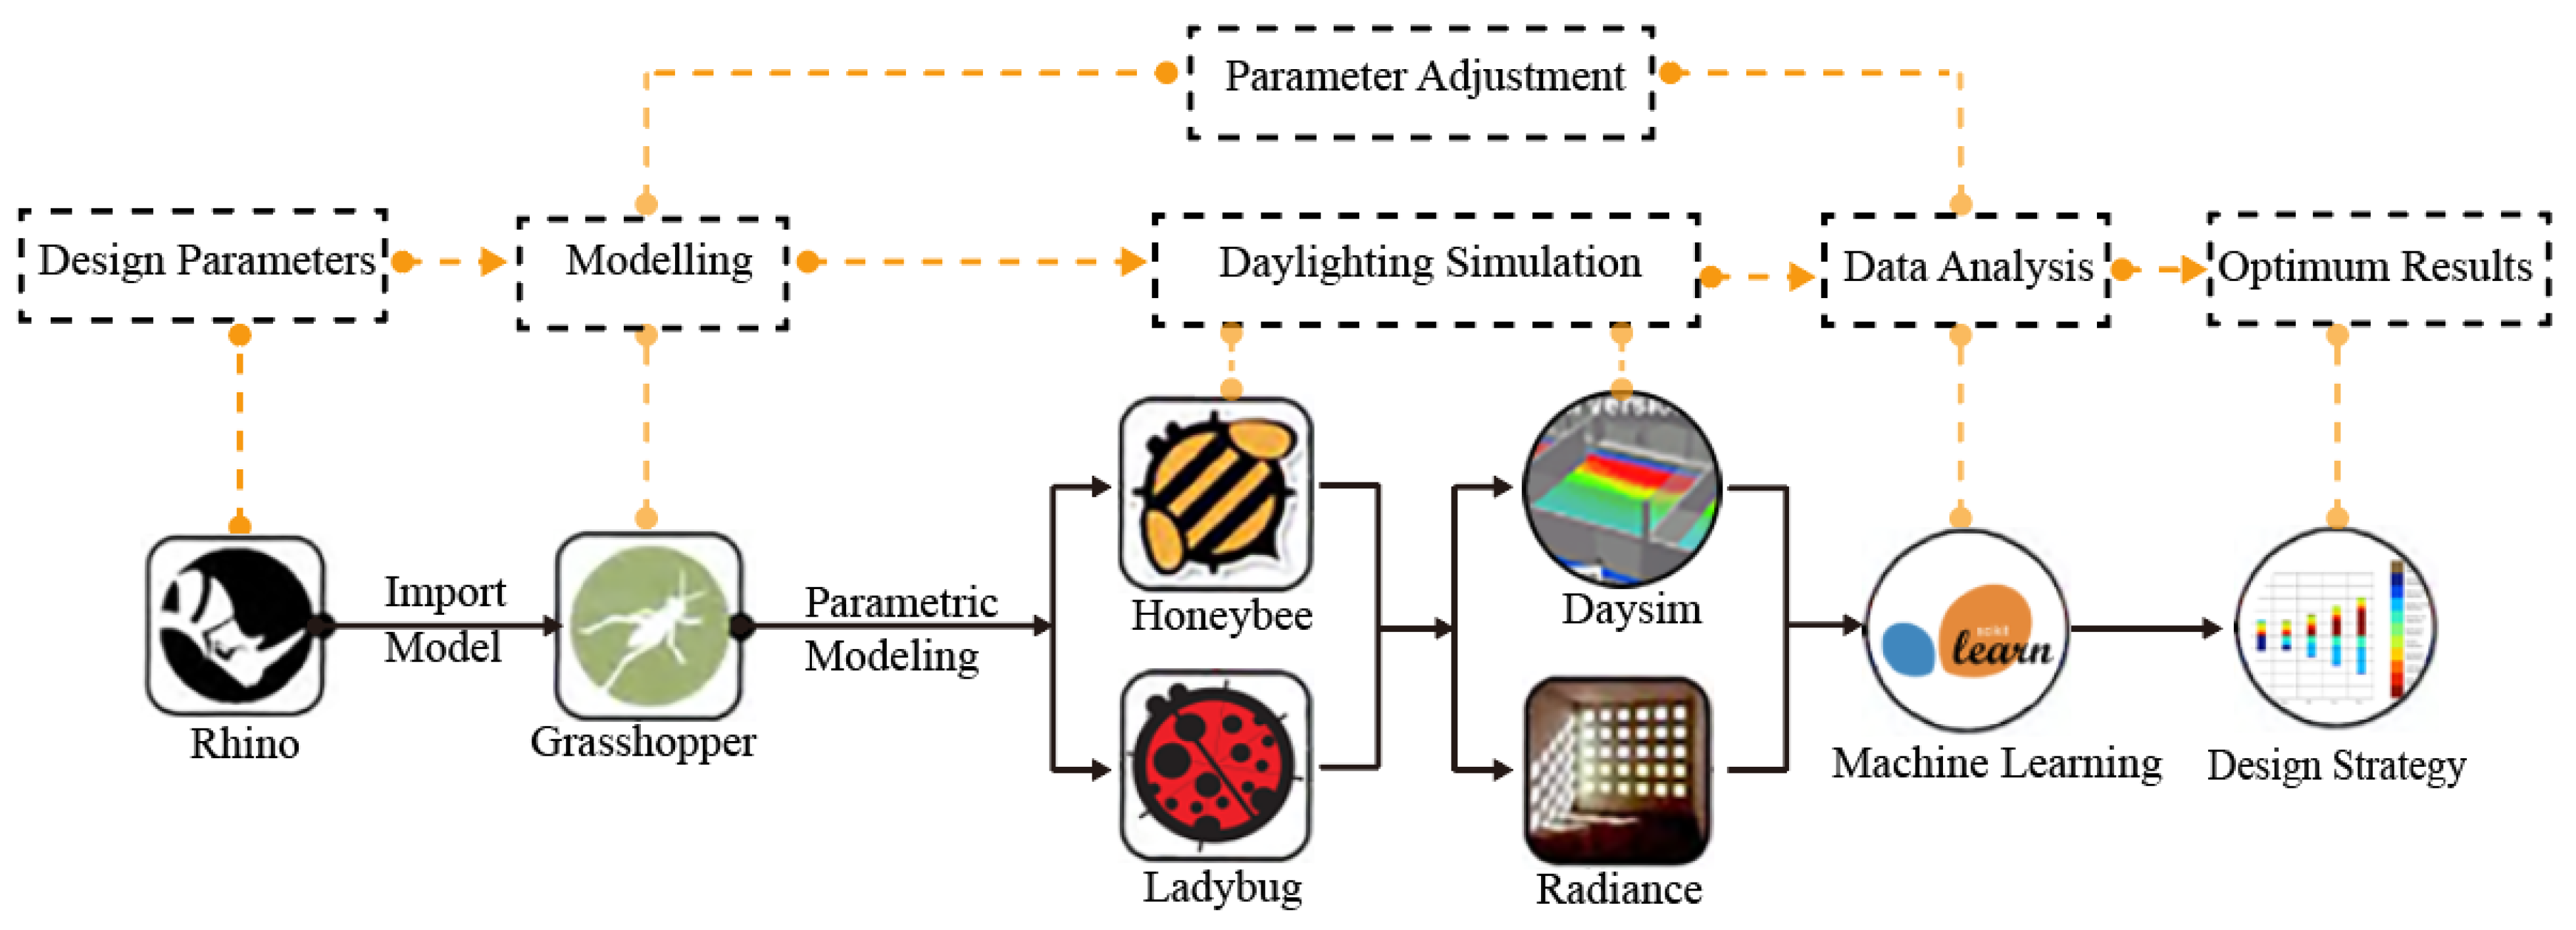
This paper takes the waiting hall of Harbin West Station as a research case, and firstly elaborates the digital design process of the waiting hall light environment, as shown in Figure 2, and then starts the case study of the design strategy of the waiting hall light environment based on the natural lighting performance.
The flow of this research includes three steps:
Step 1: Determine the parameter range of building forms and window openings, build a parametric model of the waiting hall, integrate architectural and environmental information.
Step 2: The relationship between space and performance is constructed, and the waiting hall light environment is simulated based on a parametric model, and a sample database of a large number of cases is established.
Step 3: The GBRT model is established and validated based on a large number of sample data, and the degree of influence of each design parameter on the light environment is explored through interpretability analysis and the light environment design strategy is obtained.
These steps are described in detail in the following subsections.

3.1. Building and Environmental Information Integration

Building and environment information integration is the first subprocess of the digital design of the waiting hall light environment. Based on the design objectives, design conditions and design parameters, this subprocess applies to build information modeling technology, parametric programming technology and building performance simulation technology to integrate building information, environmental information and building performance indexes based on the characteristics of the cold regional environment and design conditions. Firstly, the study starts with the integration of architectural and environmental information, applies the digital design strategy under the consideration of natural lighting performance, selects architectural geometric information such as building orientation, building height, section aspect ratio, plan aspect ratio and skylight ratio as design parameters, and then combines the results of sampling survey of design parameters; the numerical constraints of design parameters are shown in Table 1.
Meanwhile, sDA, UDI and DGP
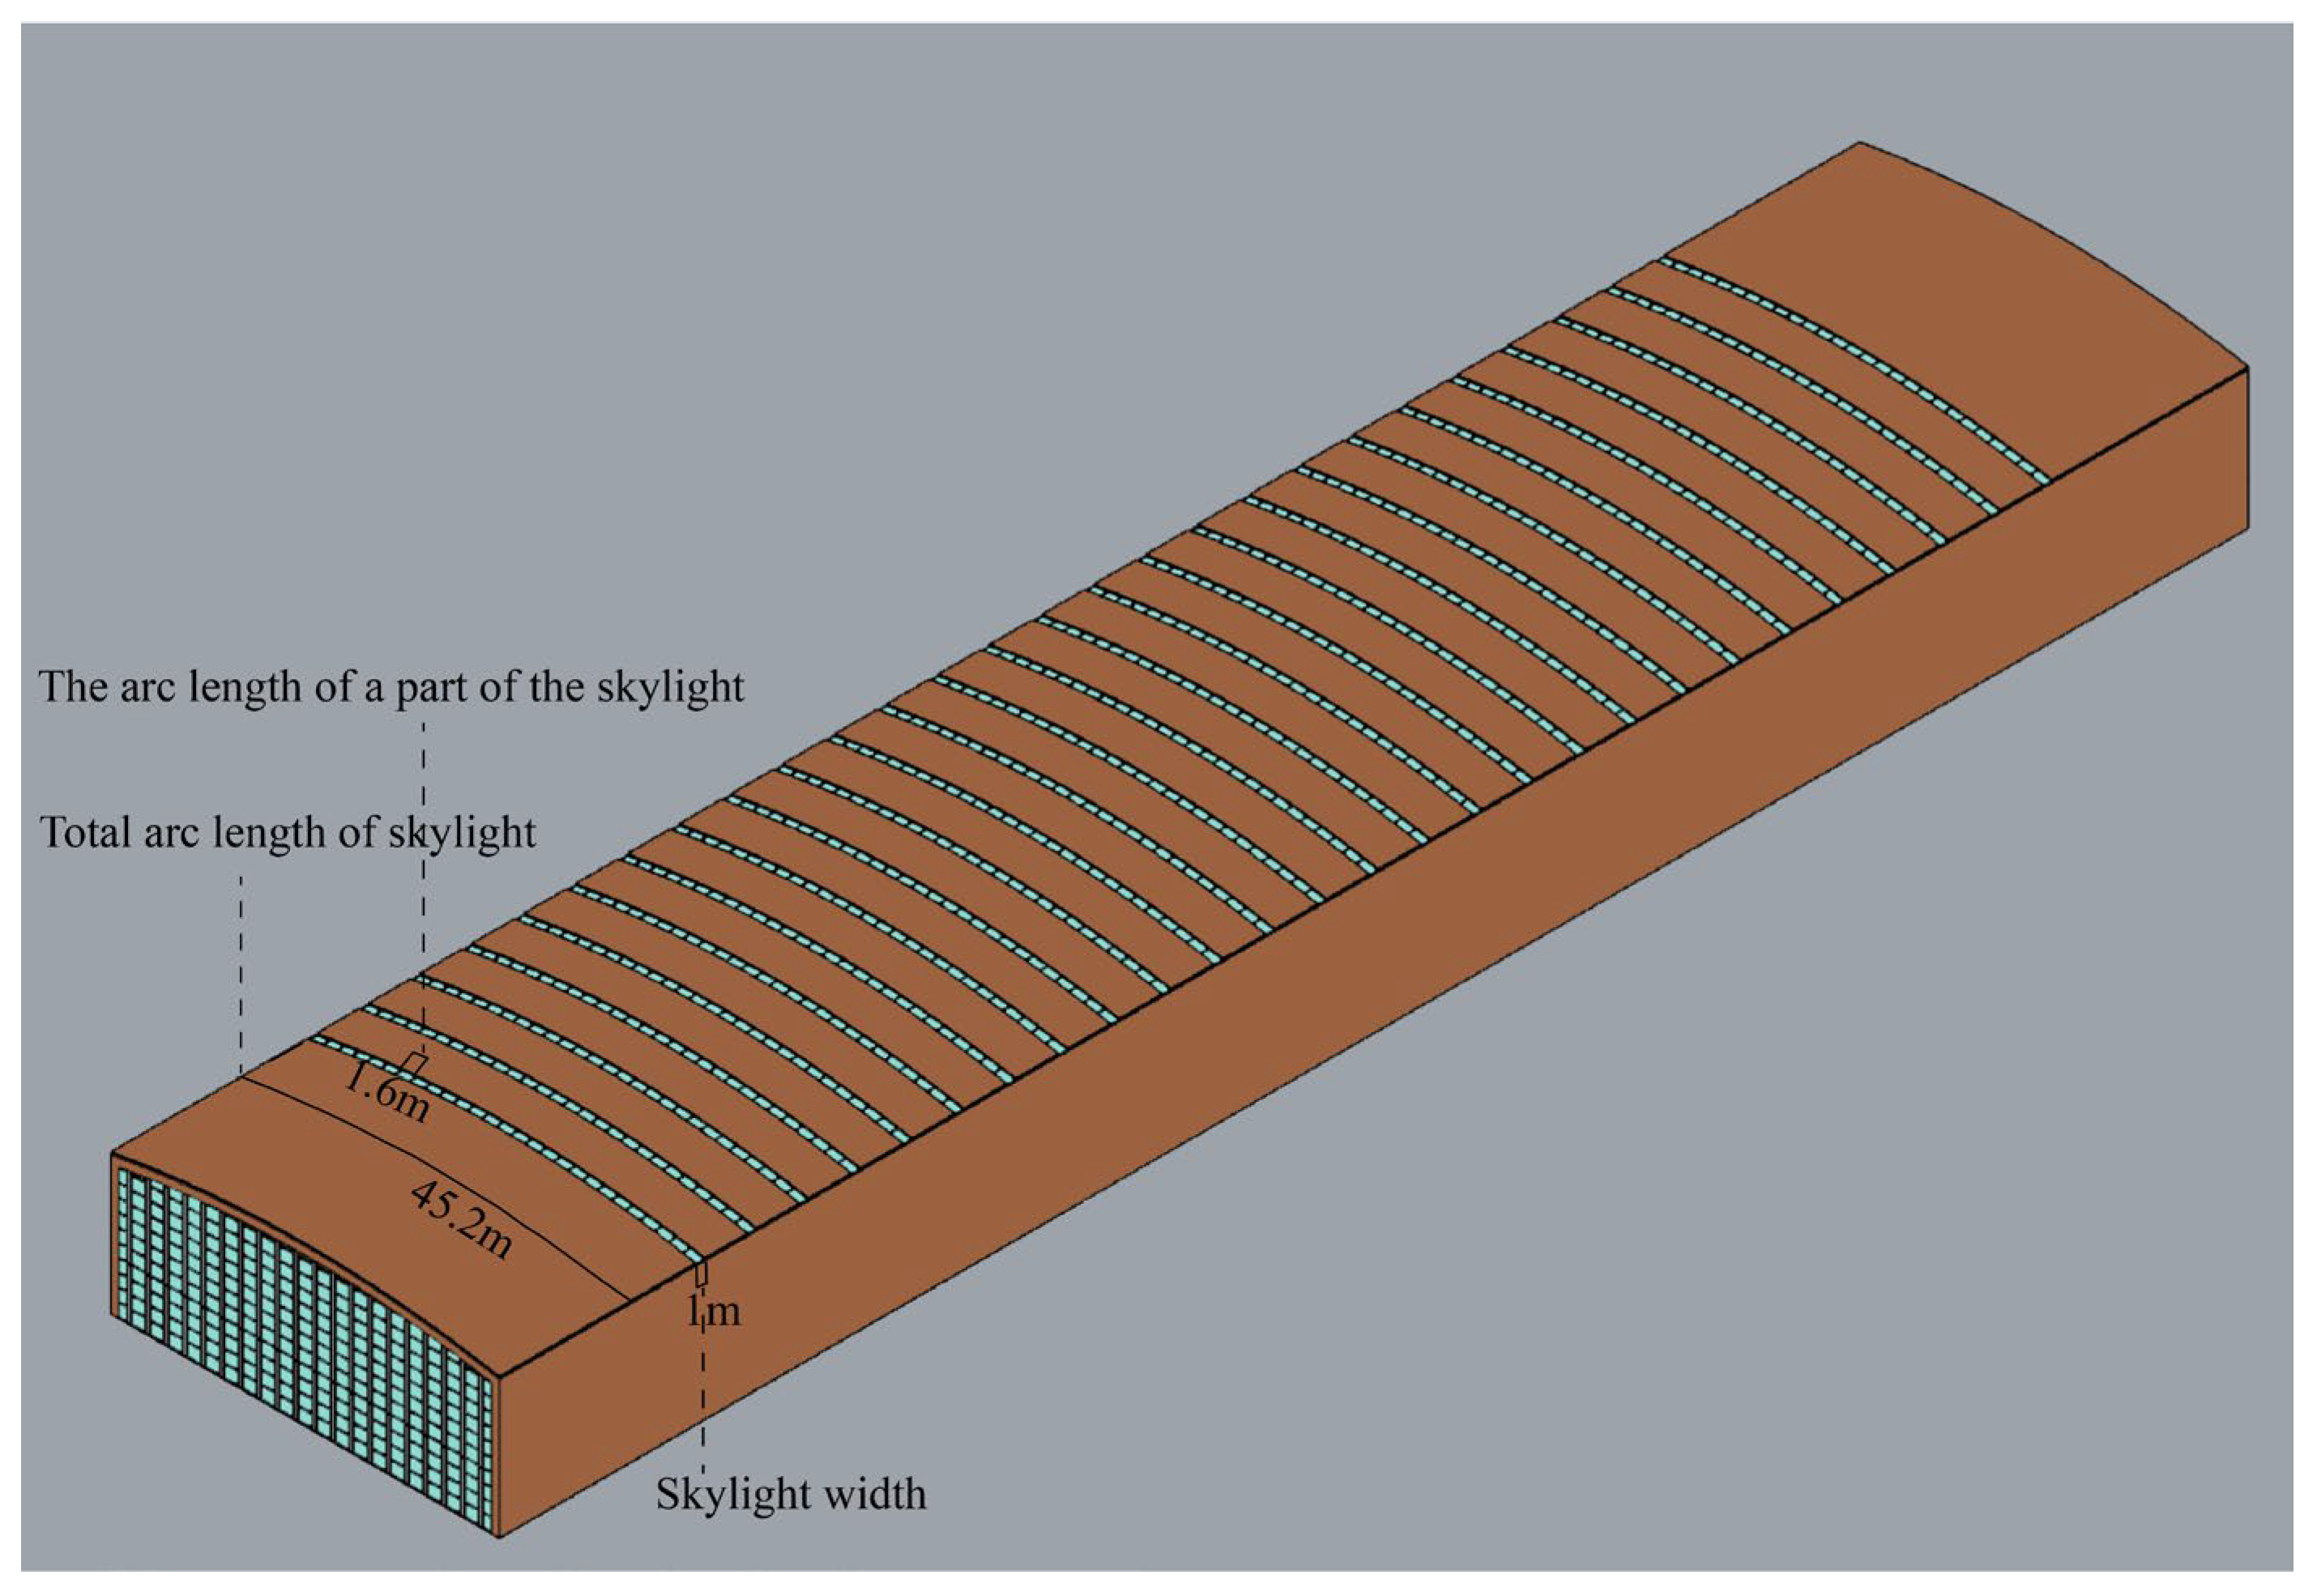
exceed are taken as the optimization design objectives. The building environment information model is used to orderly overlay the building information of material and structure, geometry of the waiting hall. The initial model of the waiting hall established has a rectangular plan format. The length of east–west and north–south directions are 318 m and 68 m, respectively, the section form is curved, and the height of the waiting hall is 18 m. Regarding the variation in the building height, the sidewalls are adjusted, while the roof shape remains the same. According to the research and literature, the widely used strip skylight is adopted, 28 strip skylights are evenly distributed, the width of each skylight is 1.0 m and the ratio of skylight is 0.15. For the change in skylight area, the width of skylight is mainly adjusted while maintaining the layout form of skylight. In order to create a more realistic light environment in the waiting hall, the strip skylight is divided by 26 grids across the skylight opening, and the width of each grid is 50 mm, which divides the strip skylight into 27 parts, with the arc length of each part being 1.6 m, and the layout form of the skylight is described in detail by axonometric drawings. In addition, the thickness of the roof was set to 300 mm after reviewing the literature. Meanwhile, two side windows are set on the east and west sides of the waiting hall; because the depth of the waiting hall is large, it mainly relies on the skylight. Since the waiting hall is deeper and mainly relies on the skylight for lighting, the east and west side windows are set to constant values. In order to obtain more accurate natural lighting prediction accuracy, the optical properties of various materials in the waiting hall are set, including the reflection ratios of walls, ceilings, floors and the transmittance of window glass. The reflectance of white wall and ceiling in the waiting hall is 0.805, the reflectance of beige ground is 0.500 and the transmittance of skylight and side windows are 0.69. The constructed parametric model is shown in Figure 3.
To construct a multi-level building information parameter network, it is necessary to compound the information of corresponding module orientation, shape, window opening design elements and their subdecision variables. The first type of decision variable consists of building orientation design parameters. In this paper, taking the cold city of Harbin as an example, according to field research, the experimentally selected building orientation value range is set as −30~30°, and the modulus of the parameters is set as 5°. The second type of decision variable consists of three parameters that affect the design of the building shape: height, section aspect ratio, plan aspect ratio of the waiting hall. After reviewing the literature and actual research, the range of the plan aspect ratio is 1.0~6.0, and the modulus of the parameter is 0.5 based on the time of optimization calculation. The value range and modulus of building height and section aspect ratio are shown in Table 2. The third category of decision variables is to optimize the design parameter consisting of skylight ratio, which is set from 0.1 to 0.3, and the modulus of the parameter is 0.05, so as to ensure the optimal ratio of skylight openings. The three types of decision variables are integrated. The parametric model facilitates the architects to adjust the morphology of the waiting hall at a later stage and avoid the time wastage caused by repetitive modeling.

3.2. Construction of Relationship between Space and Performance

The subprocess of space–performance mapping relationship construction is the second subprocess of the digital design of the waiting hall, in which the designer starts from the two aspects of building performance design objectives and building space design parameters, and applies building performance simulation technology to construct the mapping relationship between building space and building performance objectives.
The design objectives of the natural lighting performance simulation are sDA, UDI and DGPexceed. The Honeybee and Ladybug digital technology platform was used to simulate the natural lighting performance of the waiting hall, and the simulation data were imported into the storage module to form a callable database. The process was divided into three parts: the pre-collection of simulation data, the verification of software simulation accuracy and the simulation of three natural lighting performance indicators.

3.2.1. Pre-Collection of Simulation Data

After establishing the parametric morphological model, relevant parameters need to be set to overlay the building environment information such as meteorological data, geographic location, sky model, material optical properties and operation time in an orderly manner to prepare for the performance simulation of natural lighting in the waiting hall.
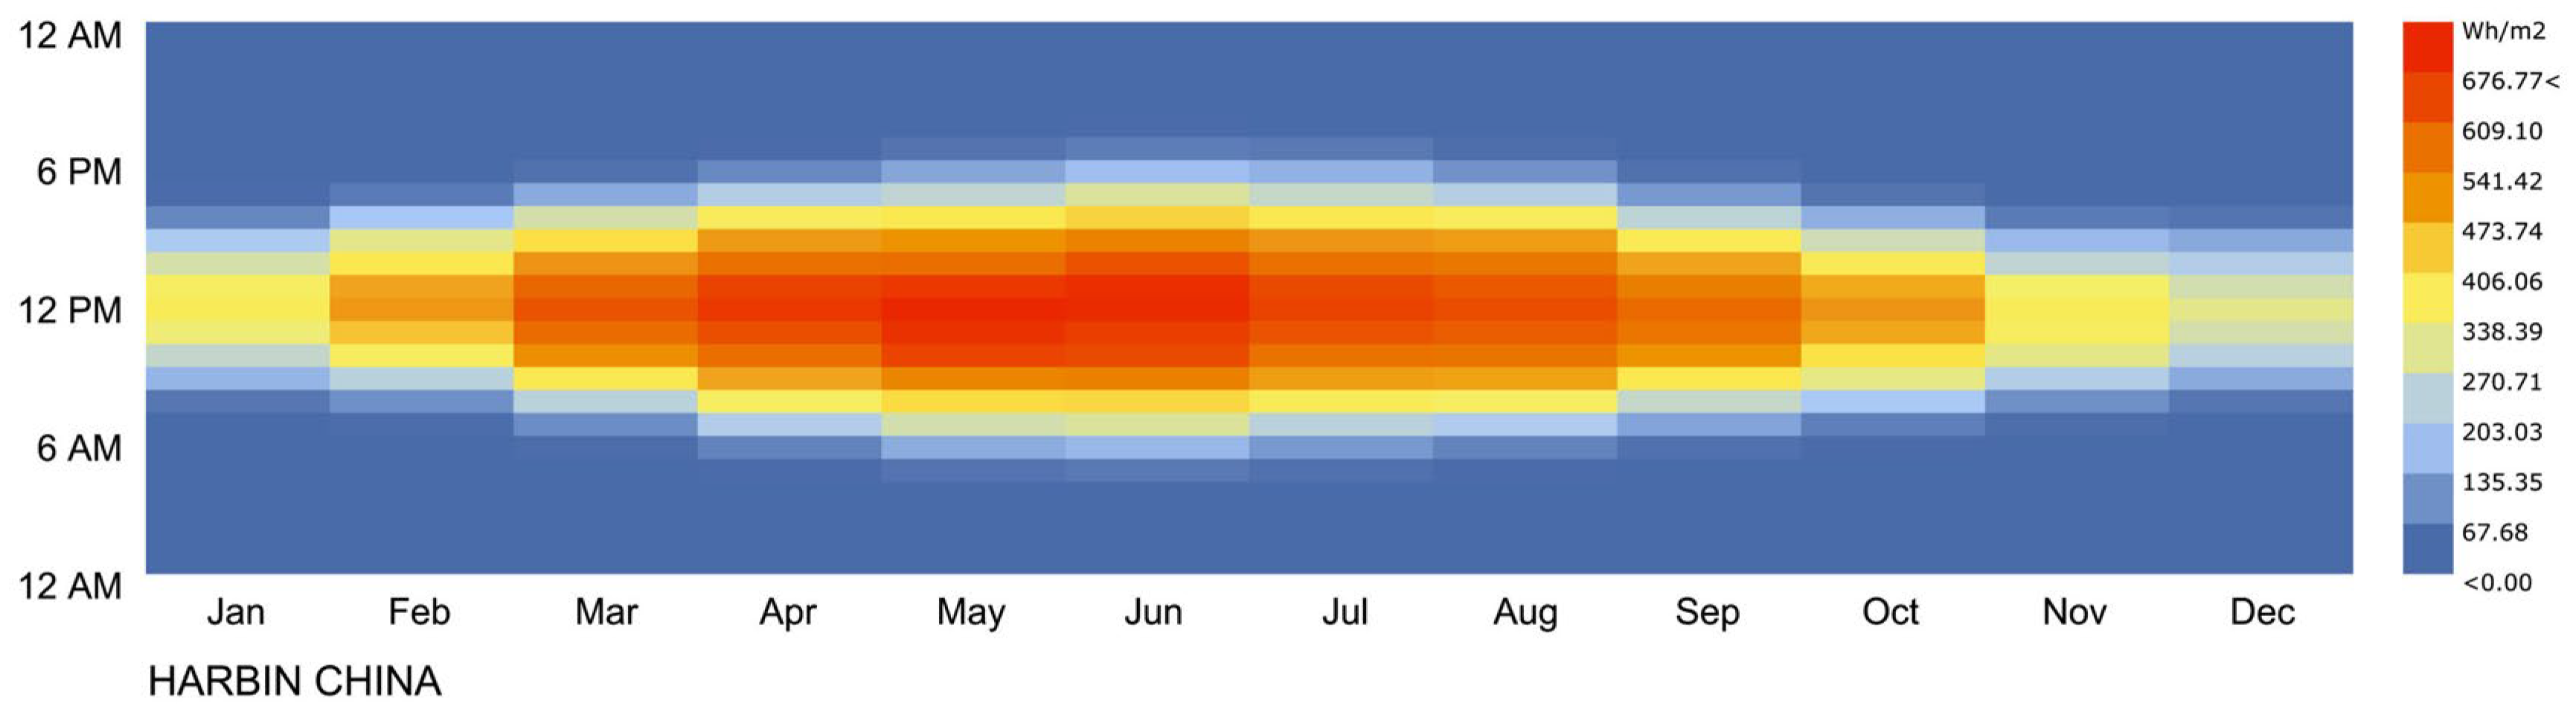
First of all, the simulation data are collected in advance, which can be divided into building sky model, giving material structure properties and setting environmental parameters. The building case is located in Harbin, a typical cold city, with an average annual sunshine time of 4.4 h and a short winter sunshine time. As can be seen from Figure 4, the monthly average sunshine radiation in Harbin reaches the maximum value in June, then gradually decreases, and reaches the minimum value in winter. In view of the distinct regional climate characteristics in cold regions, this study started from the actual observation, corrected the Perez sky model by using the measured data and generated a sky model reflecting the real sky state in Harbin, namely the modified Perez sky model, which improved the accuracy of reflecting the local light climate environment. The sky brightness distribution is obtained by calculating the sky clearness index and sky brightness index from the measured sky radiation values. The Perez sky model based on the photoclimatic characteristics of the cold region is obtained by replacing the radiation values in the database with the sky brightness distribution calculated based on the measured data, and thus correcting the Perez sky used in the dynamic lighting simulation process. The replacement of radiation values in the database with measured values is intended for comparison with specific summer and winter measurements. The six days of measured solar radiation data were imported into the Harbin weather data package, changing only the solar radiation values for these six simultaneous days, and not for the rest of the year’s weather data. Then, based on the measured optical properties such as reflectivity and transmittance of building materials in the waiting hall, the designer created the optical property dataset of commonly used materials in the waiting hall. The designer can call the optical property data of different materials according to the needs, and build an adaptive correlation relationship with the parameters of the waiting hall, so as to avoid the repeated modeling caused by the adjustment scheme and reduce the time consumption of simulation experiments. In this paper, according to the optical properties of the waiting hall and indoor materials needed for natural lighting performance simulation and the data requirements of the sky model, the data of the waiting hall and environment in cold regions are imported into simulation software such as Ladybug 1.6 and Radiance 5.4a, and the simulation software are used to calculate the natural lighting performance index.

3.2.2. Test Verification of Software Simulation Accuracy

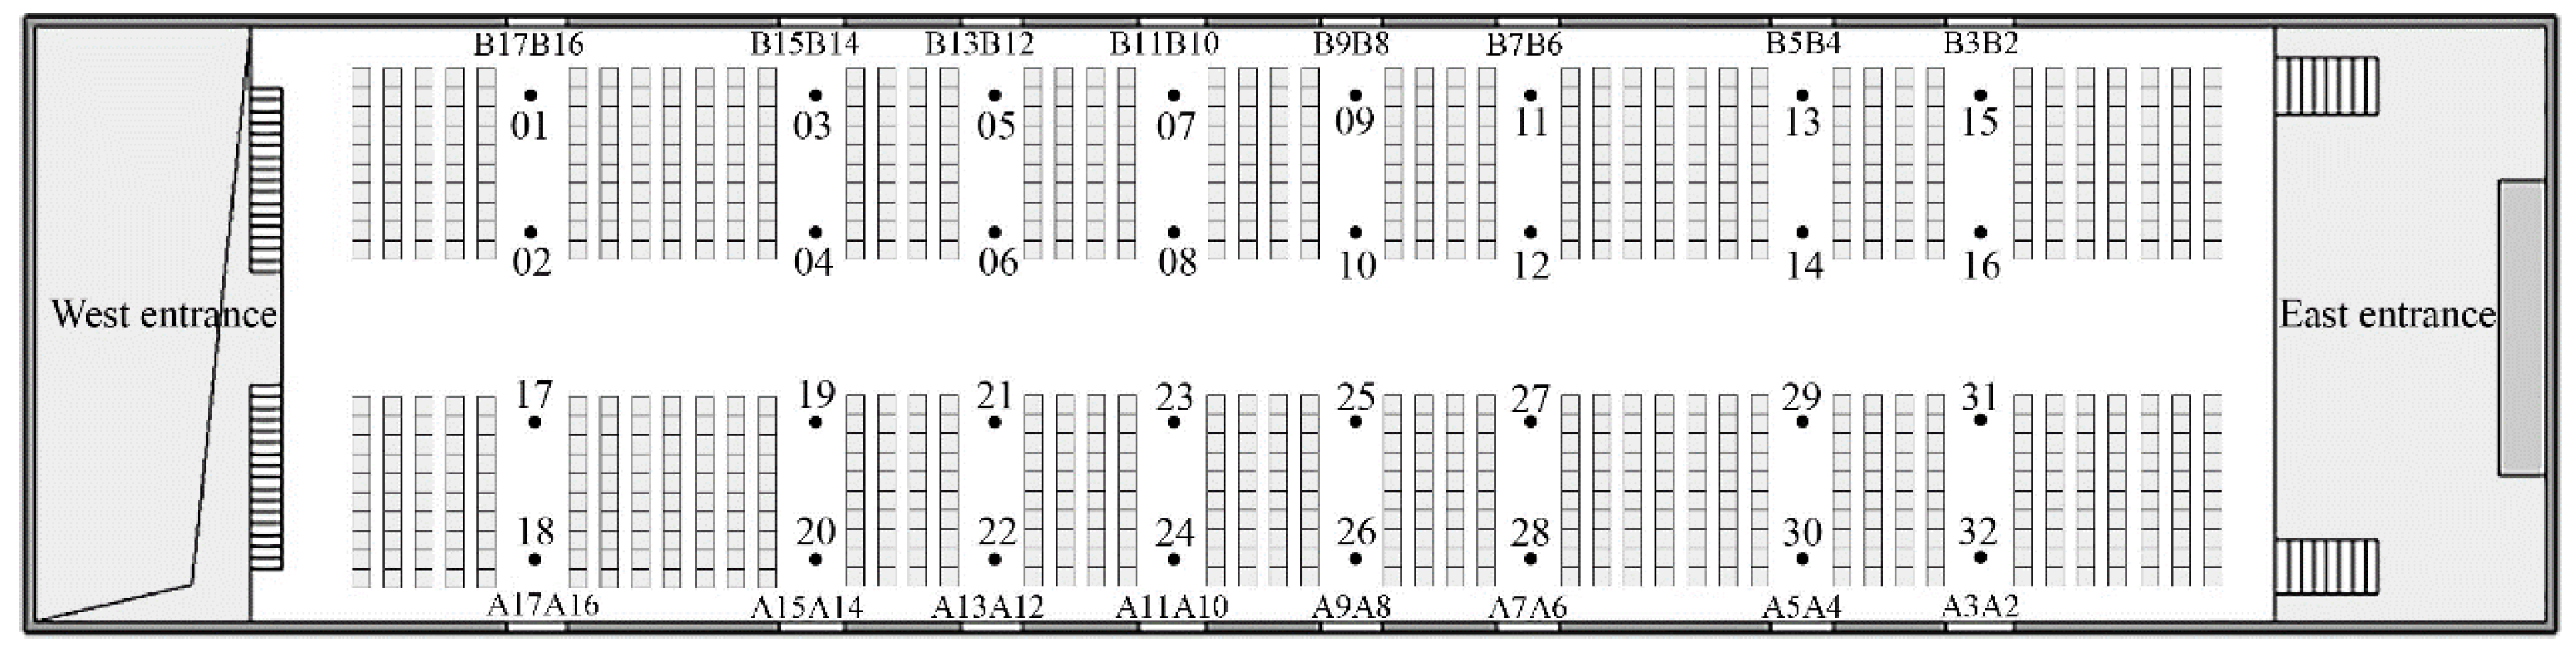
In the simulation of natural lighting performance, it is necessary to verify the accuracy and reliability of software simulation. The light environment of the waiting hall in Harbin West Railway Station was measured on the spot. The height of the test was 0.75 m, and 32 measuring points were selected. The testing time was from 1 August to 3 August 2019 and from 11 December to 13 December 2019, and the measuring time was from 8:00 to 17:00. During the actual measurement, all the artificial lighting devices in the waiting hall were turned off and only had natural lighting. The distribution of measurement points is shown in Figure 5.
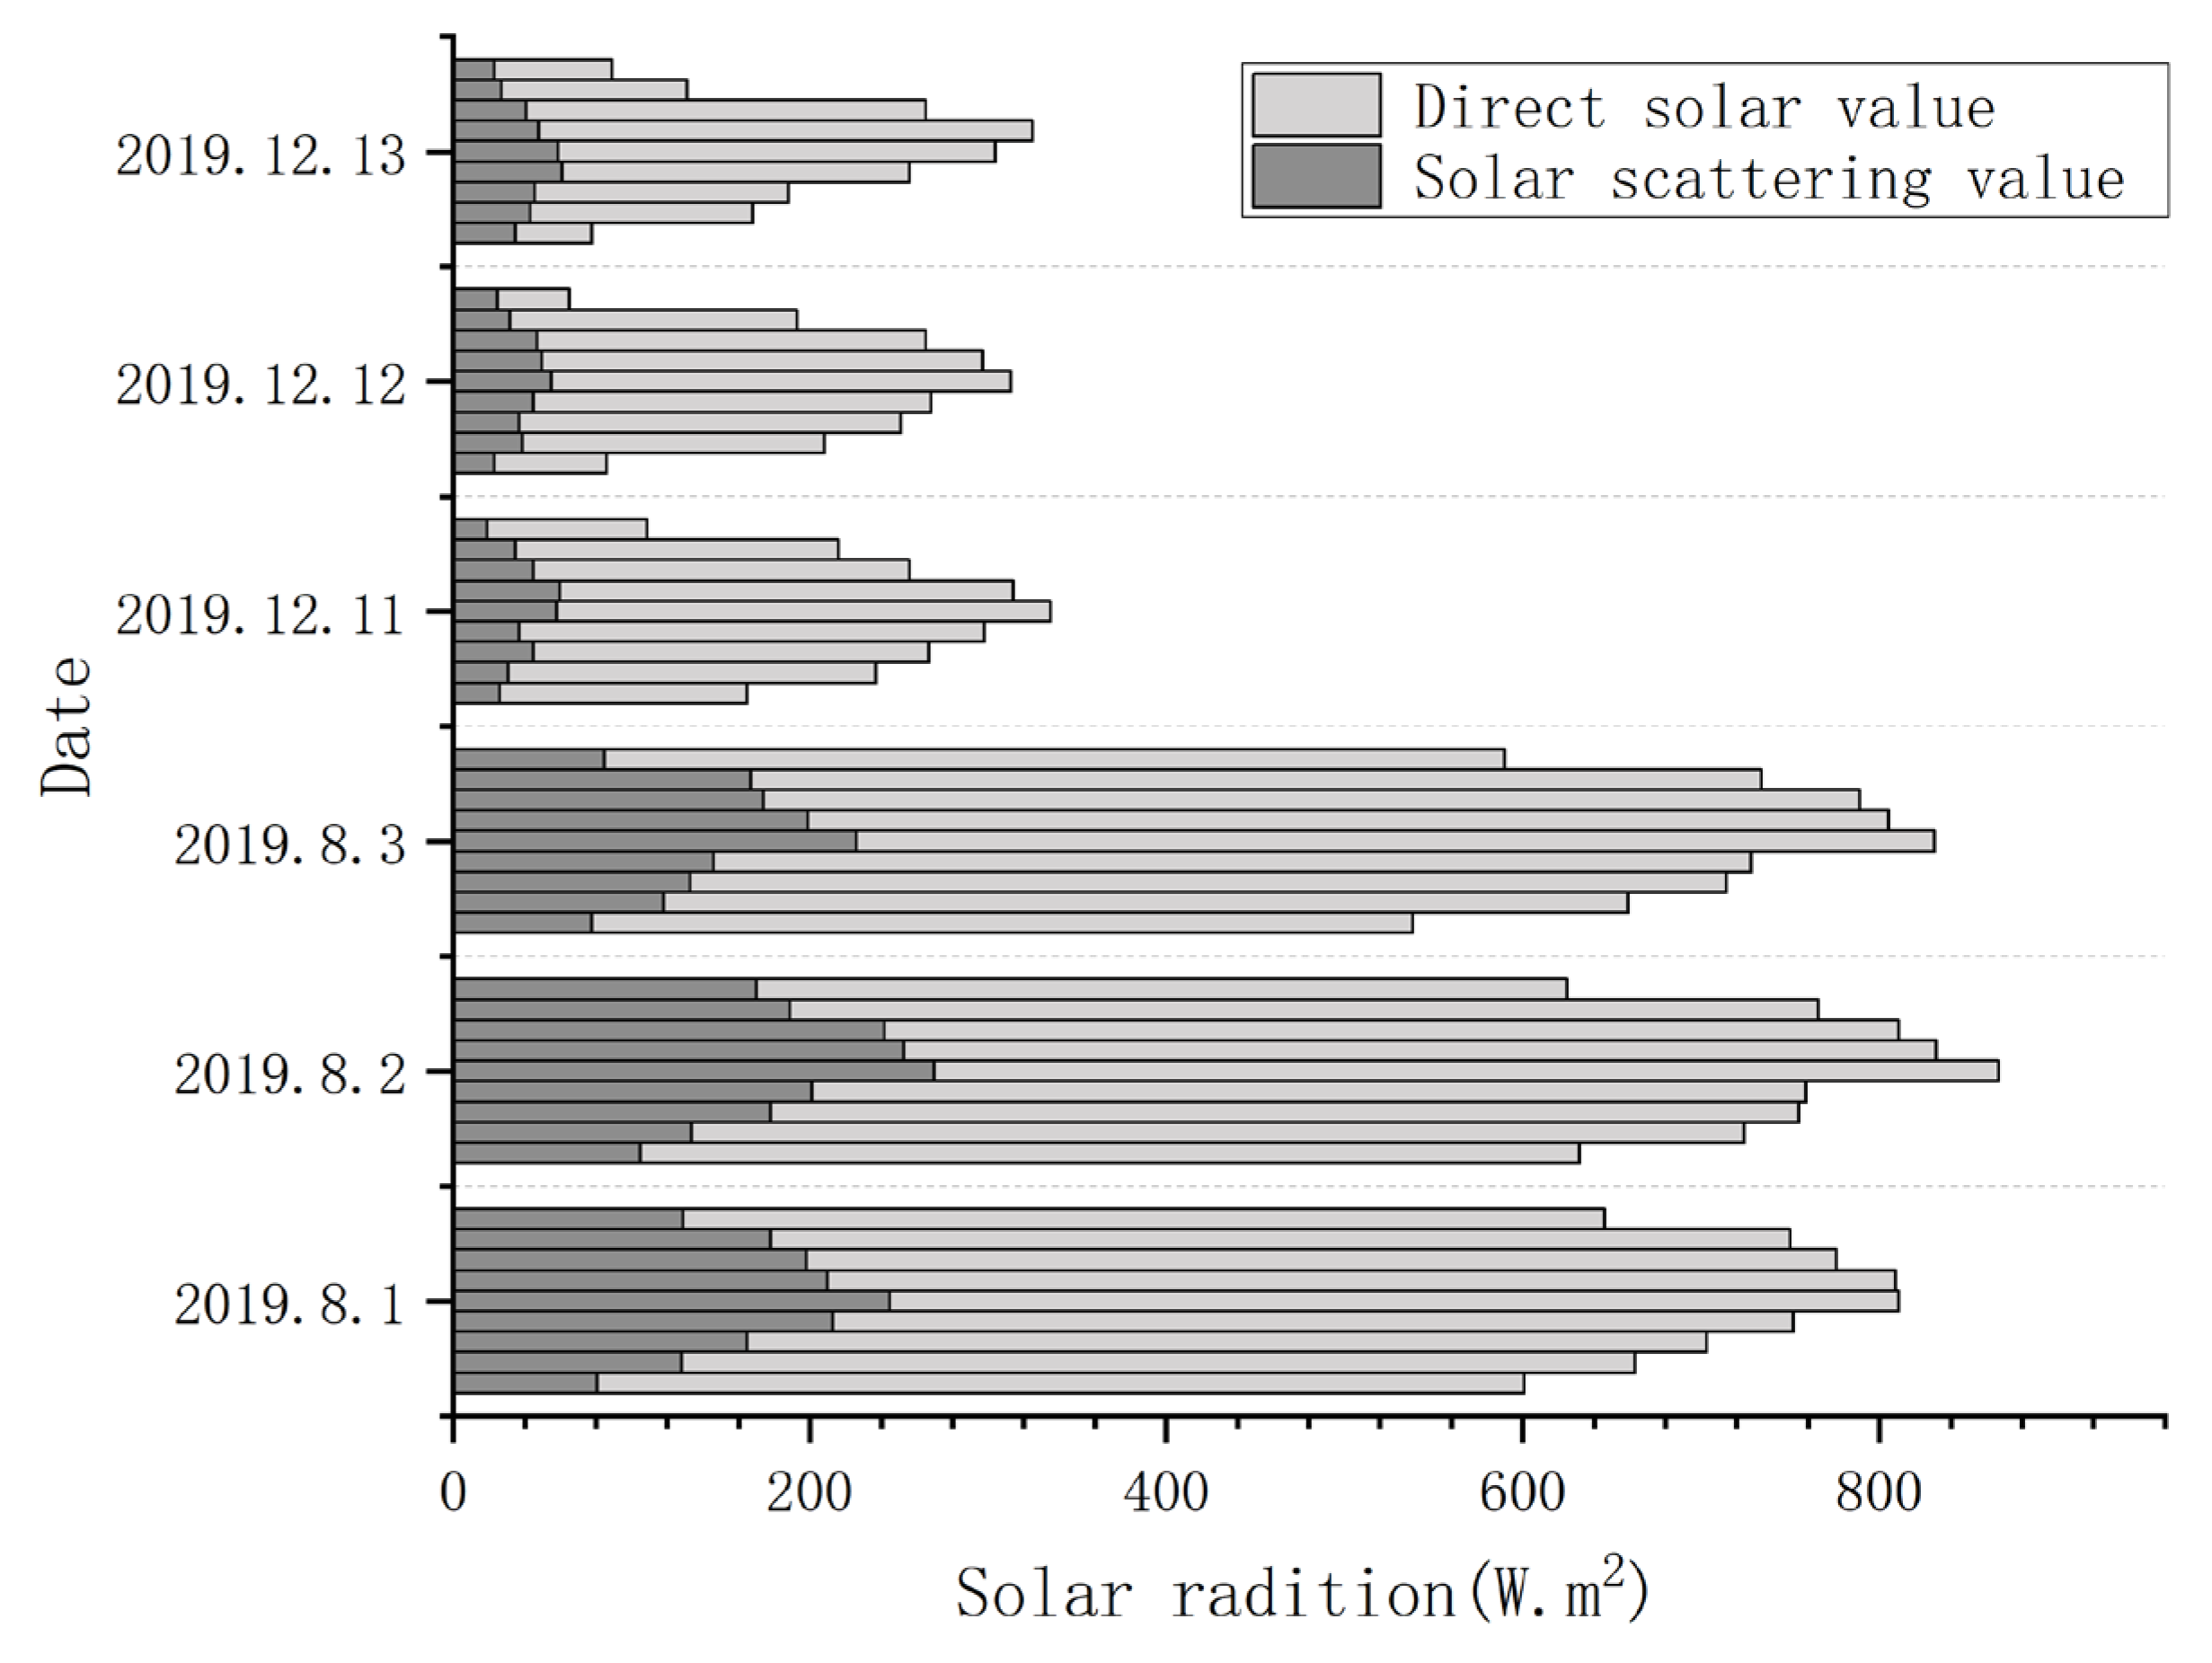
In order to obtain the Perez sky model based on local photoclimatic characteristics, the outdoor sky radiation value was measured at the same time as the indoor illuminance during the actual measurement, and the observation site was located in the East Square of Harbin West Station. Sky conditions during the measurement period included cloudy skies and sunny and cloudy weather conditions. The weather conditions during the measurement included cloudy, clear and cloudy. The measurement meets the relevant requirements of “Light Measurement Methods” (GB/T 5699-2013). The experiments were conducted in two seasons, summer and winter, and the test time points were from 8:00 to 17:00. The solar radiation at the measurement points was recorded once every 1 h, and the arithmetic mean of all measured values at each measurement point was used as the final result for analysis. Figure 6 shows the measured outdoor radiation values.
The simulated and measured values were imported into SPSS 25 software, and the Pearson correlation between 576 groups of simulated and measured data was analyzed. The analysis results show that the correlation coefficient between simulated and measured data of natural lighting illuminance is 0.987, which is highly correlated. The significant p-value is 0.000, less than 0.01, which is highly statistically significant. It can be seen that there is a very significant correlation between the measured data and the simulated data. In addition, root mean square error was introduced to verify the accuracy of the data. According to the calculation results, root mean square error is 68.3, which belongs to the allowable error range. Therefore, software such as Ladybug and Honeybee are more accurate in the parametric simulation of natural lighting performance in the waiting hall.

3.2.3. Simulation of Natural Lighting Performance Index

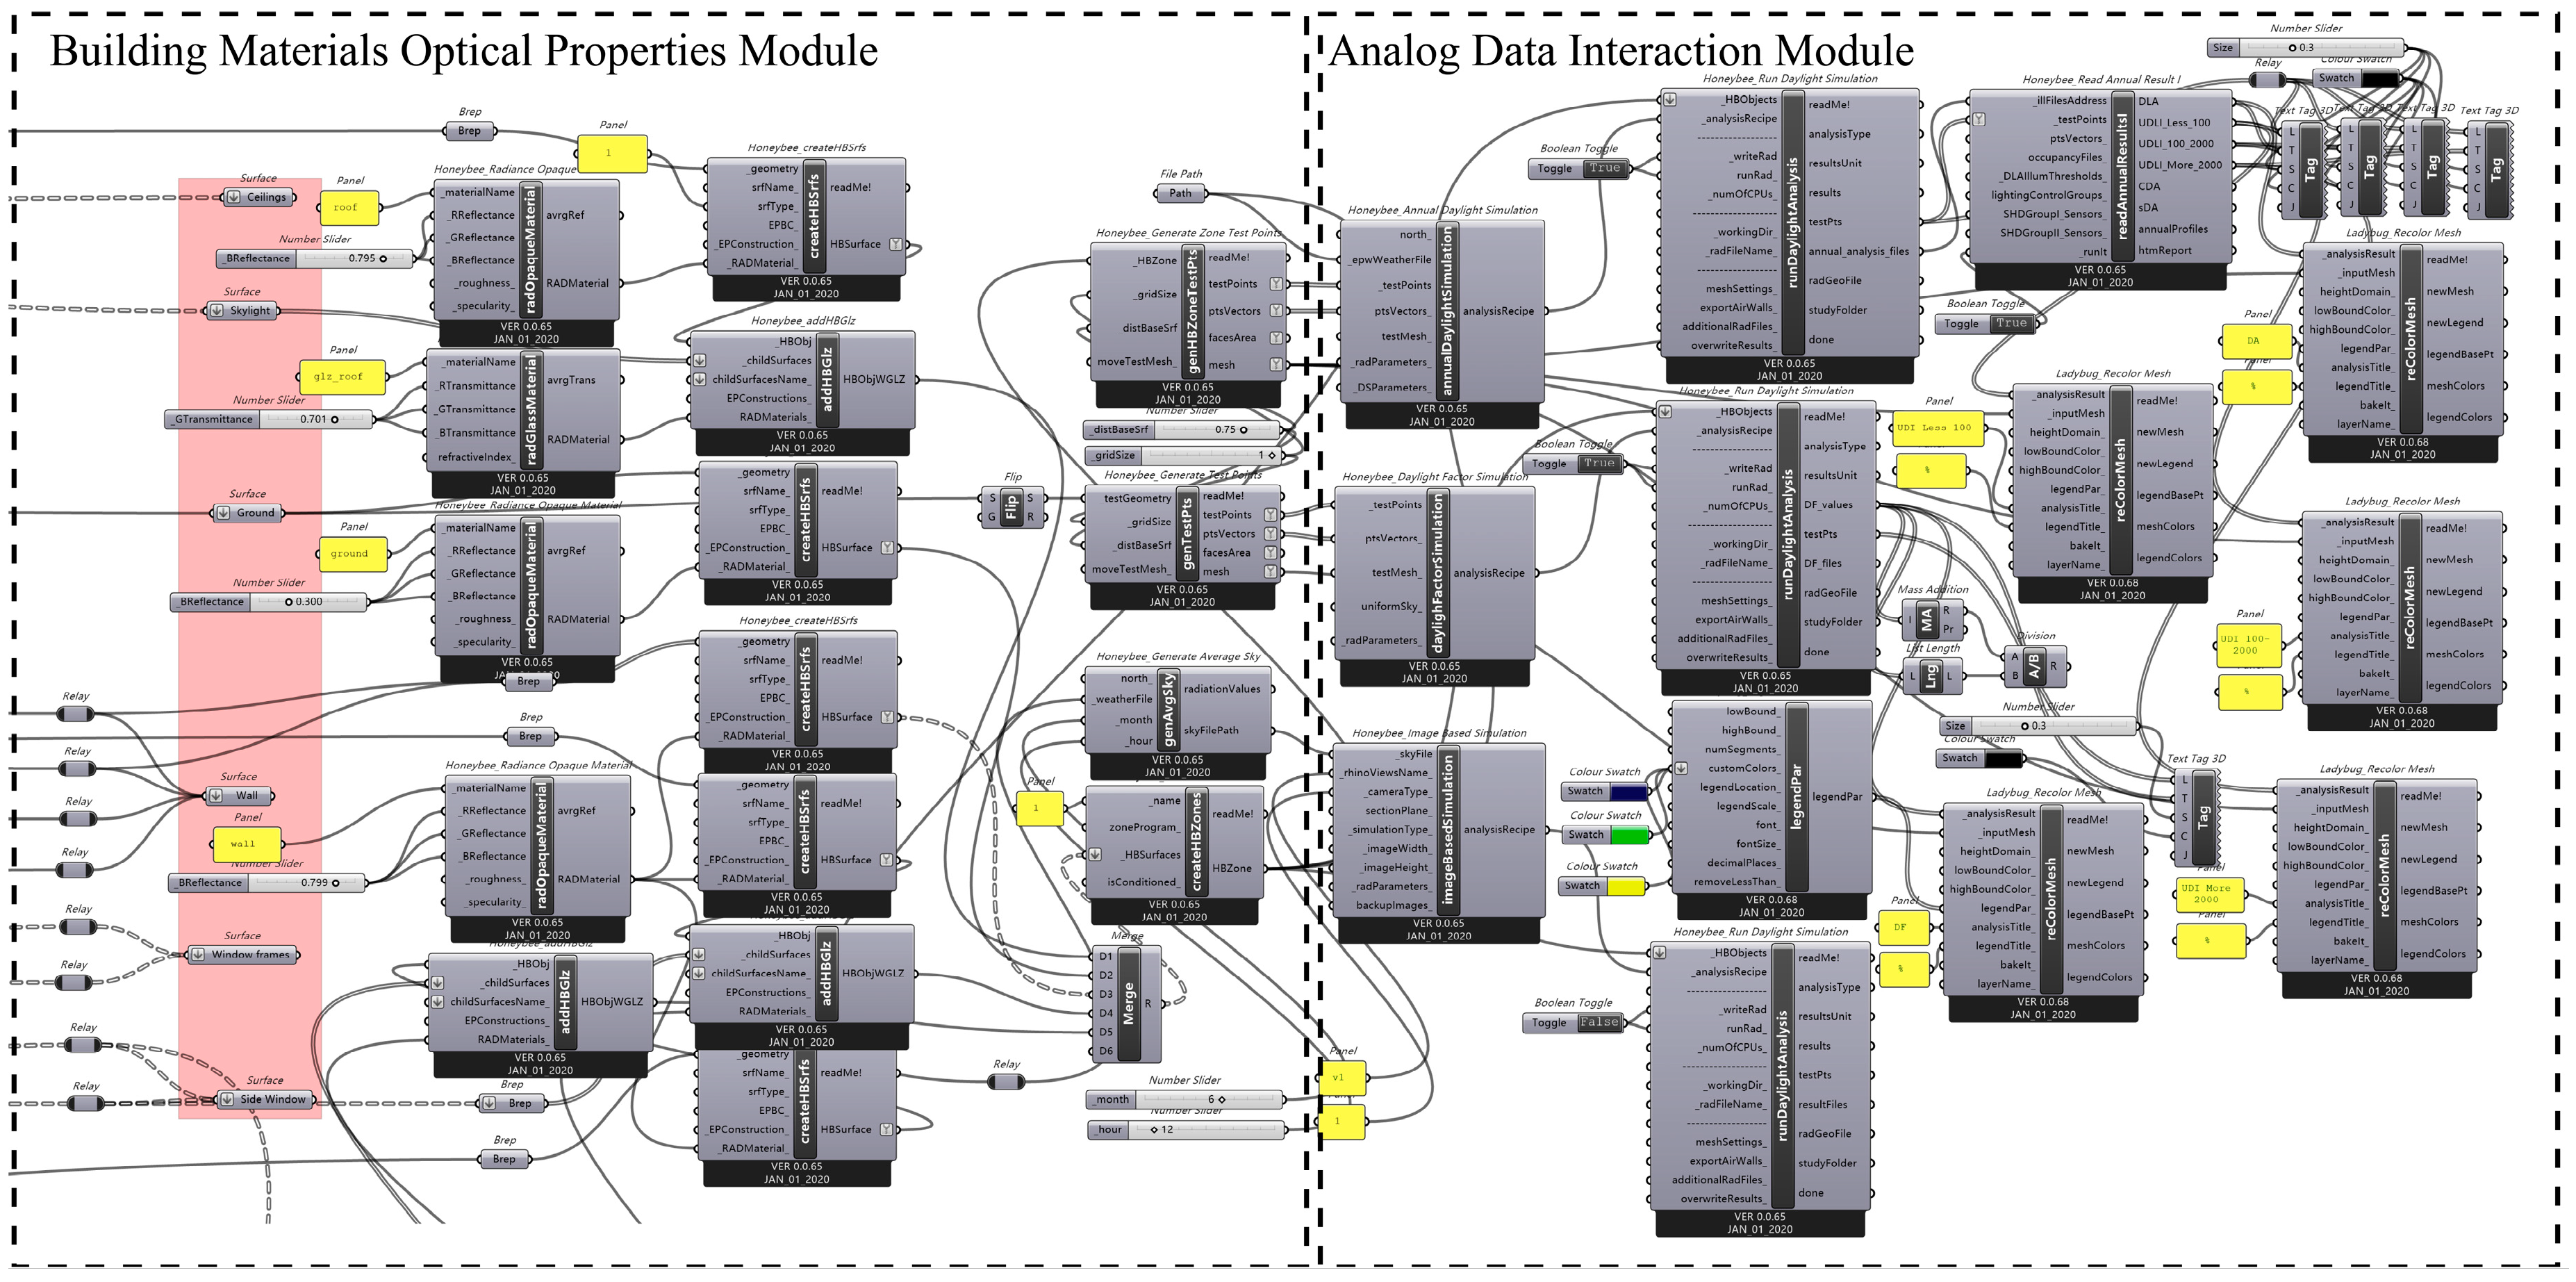
After completing the parametric geometric model construction, material parameter input, environment parameter setting and weather data and sky model input, the information of building and environment is input into the calculation engines such as Radiance and Daysim to construct the mapping relationship between design parameters and performance of the waiting hall, and the calculated performance index data are fed back to the designer through parametric simulation leveling; thus, this guides the design of natural lighting in the waiting hall. The reliability and accuracy of Radiance and Daysim have been verified in existing domestic and international studies to ensure the authenticity and reliability of the data. However, they have the deficiency of not being able to interact directly with the user. The performance simulation data interaction module of the software can be invoked in Grasshopper to link them and provide feedback to the designer through visualization. According to the above-mentioned link to build the sky model and other links for the preliminary preparation of simulation data, the Honeybee year-round sunlight simulation method was applied to simulate the natural lighting performance of the waiting hall. In the sDA and UDI simulations, the floor slab of the waiting hall was selected as the test grid surface for the natural lighting performance study, with a measurement point height of 0.75 m and a simulated grid distance of 1 m. In the DGPexceed simulations, the test point of DGPexceed was selected on the central axis of the waiting hall, and the measurement point was 3000 mm from the nearest wall. The viewpoint was adjusted to face the distant side windows to obtain a wider field of view. The difference between light and dark in this area is large, and it is easy to generate glare. The simulation procedure flow is shown in Figure 7.

3.3. Gradient Boosted Regression Trees (GBRT) Principle and Model Construction

There are many design parameters affecting the light environment of the waiting hall, and designers predict the natural lighting level of the waiting hall in the pre-program, mostly using traditional prediction models; but these have shortcomings of a low accuracy and being time-consuming, and so, in order to make up for these shortcomings, GBRT prediction model was proposed in combination with parametric design. Firstly, we used the advantages of high accuracy and easy adjustment of parametric simulation to batch simulate the design parameters and construct the dataset of design parameters and lighting indexes; then we used the dataset to train the GBRT prediction model and verify the accuracy of the constructed GBRT prediction model; and finally, we used the GBRT prediction model to predict the lighting level of the waiting hall. The interpretability analysis of the GBRT prediction model can link the contribution of each design parameter to the indoor light environment. When a lighting index does not meet the indoor lighting demand, the designer can focus on adjusting the design parameters with a higher degree of influence while eliminating the design parameters with lower relevance, which greatly improves the design efficiency while ensuring a higher design accuracy.

3.3.1. Principle of Model Computation

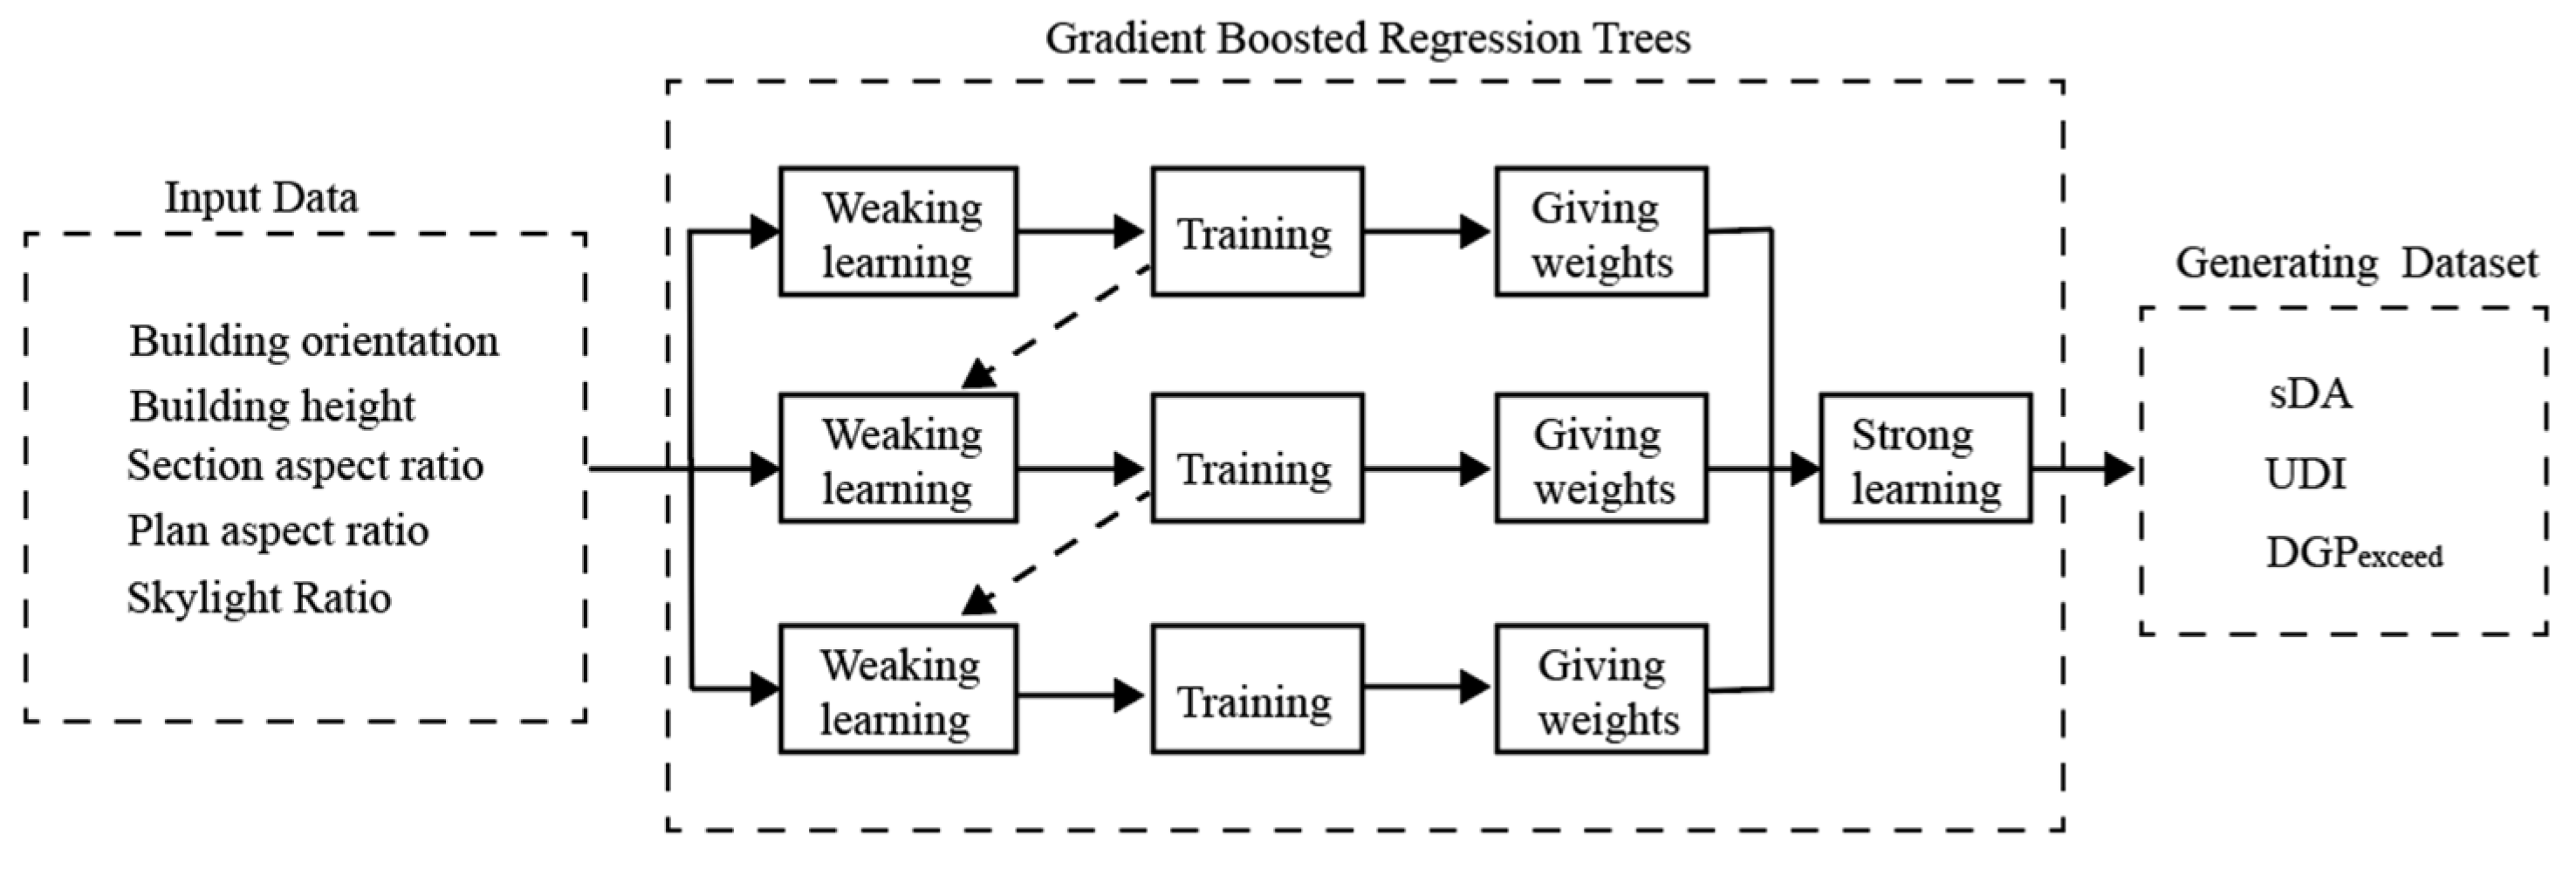
The gradient boosting regression tree is derived from the integrated learning boosting algorithm and has upgraded it [26]. The basic principle is to construct M different base learners through several iterations to generate strong learners to achieve the final combination. The base learner of the GBRT model is a regression tree, which divides the feature space into different regions and gives each region its corresponding value, and then obtains the predicted value by dividing the data into different regions. Unlike the traditional boosting algorithm, each iteration of GBRT is designed to reduce the residuals of the previous model and to build the base learner in the direction of the gradient of residual reduction. The workflow of the GBRT model is shown in Figure 8.
The main process of GBRT modeling is as follows:
Training samples for the input model, T = {(x1, y1), (x2, y2), …, (xn, yn)}, loss function L(y, f(x)), used to calculate the difference between the target value and the calculated value.
Step 1, initialize the weak learner:
f 0 x = a r g min c i = 1 N L y i , c
where f0(x) is a tree with only one root node, L(yi, c) is the loss function, c is the constant that minimizes the loss function.
Step 2, for the number of iterations, m = 1,2…, M
(a)
For i = 1, 2, …, N, calculate the negative gradient value of the loss function and use it as an estimate of the residuals:
r m i = L y , f x i f x i f x = f m 1 x
(b)
rmi fits a regression tree to obtain the leaf node region Rmj. Predictions are made for the leaf node region of the decision tree to fit an approximation of the residuals.
(c)
For j = 1, 2, …, J, linear search is used to estimate the values in the range of leaf nodes and minimize the loss function. The optimal fitted values are obtained as follows:
c m = a r g min c i = 1 n L y i , f m 1 x i + c
  • (d) Updating learners.
f m x = f m 1 x + j = 1 J c m j I x R m j
Step 3: After the iteration, it forms the GBRT strong learner, which can be expressed as:
f x = f M x = m = 1 M j = 1 J c m j I x R m j

3.3.2. Model Creation and Validation

In this study, based on Rhino and Grasshopper’s parametric modeling, five influencing factors, such as building orientation, building height, section aspect ratio, plan aspect ratio and skylight ratio, which affect the natural lighting performance of waiting halls in cold regions, are selected as the input variables of GBRT model, namely Xi = {x1, x2, …, x5}. Taking the lighting evaluation index as the output variable of the model, namely yi, in this paper, the light environment was simulated using Ladybug and Honeybee components in the parametric platform, and 100 sets of simulated data were obtained to form a complete dataset. The data feature set was divided into training and test sets in the ratio of 7:3. Among them, 70 sets of data constitute the training dataset and the remaining 30 sets of data constitute the test set. The part of the constructed dataset is shown in Table 2. Parameter selection and construction of prediction models were performed on the training set, and prediction and evaluation were performed on the test set. Before calculation GS, grid search (GS) was used to adjust the design parameters, and the Z-Score algorithm was used to standardize all the data.
The coefficient of determination (R2), root mean square error (RMSE) were chosen as the evaluation indices of the model to assess its accuracy with the following expressions:
R 2 = 1 i = 1 n y i y ^ i 2 i = 1 n y i y i 2
R M S E = 1 n i = 1 n y i y ^ i 2

4. Results

This study is based on Rhino and Grasshopper for parametric modeling, and uses a control variable approach to study the light environment of the waiting hall; the following design parameters were investigated: building orientation, building height, section aspect ratio, plan aspect ratio and skylight ratio, The correlation of different design parameters with the lighting evaluation indexes sDA, UDI and DGPexceed is analyzed to support the designers’ design decisions.

4.1. Waiting Hall Design Parameters Simulation

4.1.1. Simulation Analysis of Building Orientation

The design parameters of the building orientation were studied, and the range of the building orientation was controlled from −30° to 30°, the step size of the orientation design parameter was set to 5°, and the model of the waiting hall was rotated by using the control variable experiment method, keeping the other design parameters unchanged; the effects of different building orientation changes on the performance of the lighting evaluation indexes sDA, UDI and DGPexceed were studied on the parameterized simulation platform.
As shown in Figure 9, the building orientation shows little correlation with sDA and UDI. Only DGPexceed is significantly correlated with building orientation. During the change in the building orientation parameter from −30° to 30°, sDA, UDI and DGPexceed all show periodic changes, and the change in orientation shows similar effects on sDA and UDI performance targets. sDA grows rapidly from −30° to 0°, and then decreases; the reason for this phenomenon is that when the orientation is 0°, more natural light enters the waiting hall, which improves the quality of the natural light environment. sDA decreases significantly at −30°. The building orientation reaches the maximum at 0°, which obviously improves the satisfaction rate of natural lighting. UDI100–2000 reflects the number of hours within the effective illumination range throughout the year. UDI100–2000 at 0° reached the maximum value. With the change in building orientation, the value of DGPexceed is lower in the range of 0~10°, and the passengers in the waiting hall are not easily disturbed by the glare.

4.1.2. Simulation Analysis of Building Height

In this section, by sampling the morphological parameters of the waiting hall scheme, the height range of the waiting hall was controlled within 15~21 m, and the simulation step was set to 1 m. While keeping the other design parameters unchanged, the effects of the changes under different building heights on the performance of lighting evaluation indexes were calculated on the parametric simulation platform.
As shown in Figure 10, the building height is significantly correlated with sDA, UDI and DGPexceed. Increasing the building height leads to an increase in the values of sDA and DGPexceed, while UDI100–2000 values show the opposite trend, which gradually decrease with the increase in the building height. The sDA and DGPexceed increase by 1.6% and 47.14%, respectively, while UDI decreases by 2.4% when the building height is 21 m compared to 15 m. It was found that the building height in the range of 17~21 m significantly improves the sDA value and enhances the ability to effectively use natural light in the building space, and the values of UDI100~2000 are all greater than 80%, maintaining a good proportion of effective natural lighting, while attention should be paid to the occurrence of the glare phenomenon in the waiting hall.

4.1.3. Simulation Analysis of the Section Aspect Ratio of Waiting Hall

In this section, keeping other design parameters unchanged, the section aspect ratio of the waiting hall (SAR) is taken as the independent variable in the experiment. The range of SAR was determined to be within 0.2~0.5, and the step size of the simulation experiment was set to 0.05. The influence degree of different SARs on sDA, UDI and DGPexceed was studied, so as to summarize the natural lighting design strategy of SAR in cold regions.
As can be seen from Figure 11, SAR is significantly correlated with sDA and DGPexceed. Only UDI is not significantly correlated with SAR. With the increase in SAR, sDA shows a gradual decreasing trend, sDA changes less in the range of 0.1~0.40 and sDA remains at a high level. After sDA exceeds 0.4, it starts to decline rapidly. UDI and DGP show a trend of increasing at first and then decreasing. When SAR takes the value in the range of 0.3~0.4, the highest proportion of data of the effective illumination on the working surface throughout the year is found. SAR is positively correlated with DGPexceed. SAR increases slowly in the range of 0.1~0.4, and the value of DGPexceed increases rapidly when it exceeds 0.4, increasing the probability of uncomfortable glare occurrence.

4.1.4. Simulation Analysis of Plan Aspect Ratio of Waiting Hall

In this section, the design parameters of the plan aspect ratio of the waiting hall (PAR) are taken as variables for research. Through actual investigation and reference, PAR was set within 1.0~6.0, and the step size of the simulation experiment was set to 0.5. We calculated the influence degree of PAR in different waiting halls on sDA, UDI and DGPexceed.
From Figure 12, it is clear that PAR is significantly correlated with sDA, UDI and DGPexceed. sDA and DGPexceed show a decreasing trend as PAR increases, while UDI shows an increasing and then decreasing trend. The change in PAR has a great influence on sDA, and sDA decreases slowly in the range of 1.0~4.5 and starts to decrease rapidly when the sDA exceeds 4.5, which reduces the satisfaction rate of natural lighting. The UDI100–2000 value gradually increases with PAR in the range of 1.0 to 4.5, and increasing the value of PAR in this range helps to substantially increase the proportion of data with effective illumination on the working surface throughout the year. There are significant differences in glare degree in different PARs. With the increase in PAR, the DGPexceed value gradually decreases. DGPexceed decreases rapidly in the range of 1.0–3.0 and slows down when it exceeds 3.0, and the value of DGPexceed stays at a low level.

4.1.5. Simulation Analysis of Skylight Ratio

In this section, the skylight ratio (SR) is investigated, For this variable, five different values were researched: 0.1, 0.15, 0.2, 0.25 and 0.3. Each parameter was studied by controlling only a single variable for simulation. We calculated the influence degree of the skylight ratio in different waiting halls on lighting evaluation indexes sDA and UDI.
It can be seen from Figure 13 that sDA and UDI are significantly correlated with SR. With the increase in SR, the values of sDA show an increasing trend, while the effective natural lighting percentage shows a decreasing trend. With the increase in SR, sDA increases significantly in the range of 0.1 to 0.15, but the growth rate starts to slow down after exceeding 0.15, and increasing the value of SR has less effect on the utilization rate of natural lighting and the possibility of saving artificial lighting. UDI100–2000 values in the value range of 0.1~0.2 decrease significantly, and then UDI100–2000 values tend to stabilize.

4.2. Explainable Analysis of GBRT Machine Learning Models

Explainable analysis can be used to determine the most important design parameters affecting the light environment of the waiting hall, and designers can quickly quantify the light performance at the early design stage and improve the efficiency of optimizing the light performance of the waiting hall. In order to introduce interpretability into waiting hall light environment prediction, correlation analysis and multiple linear regression equations [24,36] are mostly used to derive the key contributing parameters to the indoor light environment. Although multiple linear regression equations can rank the sensitivity of key parameters of the indoor light environment, they do not consider the nonlinear and complex relationship between explanatory variables and prediction targets, and are prone to multiple covariance. In this paper, we adopt the GBRT algorithm, the basic principle of which is to construct M different base learners by multiple iterations to generate strong learners to achieve the final combination. GBRT has strong predictive power and can fully utilize the feature information of all image elements in the whole study area.
Before constructing the GBRT model, correlation analysis of the design parameters of the waiting hall is required, and after eliminating the design parameter variables with a low degree of influence, the design parameters with significant correlation are input into the GBRT model for further analysis (Table 3). The input dataset was trained separately using Python language based on the scikit-learn machine learning tool, and the importance of each attribute was obtained by using the feature importance command in the model.
As shown in Table 4, the R2 of each evaluation index of GBRT is higher than 0.98, which indicates that the GBRT model can accurately explain the light environment variation in the waiting hall due to its unparalleled advantage in dealing with complex nonlinear relationships. In addition, the minimum RMSE of the GBRT model is 0.93%, which indicates that the prediction error of the GBRT model is relatively small and the simulated values are highly consistent with the predicted values.

4.3. Influence of Waiting Hall Design Parameters on Light Environment Distribution

The GBRT model is more accurate in dealing with the relationship between the waiting hall design parameters and the light environment evaluation indexes, so the interpretability analysis of the GBRT model is selected to evaluate the contribution of the waiting hall design parameters to the indoor light environment indexes. Figure 14 shows the importance ranking of the waiting hall design parameters.
It was found that SR has the most important influence on UDI. In addition, SAR and PAR have important effects on sDA and DGPexceed, respectively. Compared with other design parameters, the building orientation has the least influence on the lighting of the waiting hall. By investigating the influence of the design parameters on the indoor light environment, designers can explore the contribution of each design parameter to the indoor light environment in the pre-programming stage, so as to carry out the lighting design more efficiently.
This paper illustrates the data visualization technology for the waiting hall of Harbin West Station as an example, which allows the designer to obtain intuitive and fast feedback on the lighting performance in the process of solution advancement and decision making, and to select the best design solution from it by comparing reference models. As shown in Table 5, this paper generates DA, UDI and DGP data analysis color maps based on the Rhinoceros and Grasshopper platform, so that architects can analyze the lighting problems in the waiting hall and propose corresponding design strategies based on the data color maps of lighting evaluation indexes.

5. Discussion

Based on the regional environmental characteristics of short sunshine time and a harsh climate in cold regions, the digital design strategy of a waiting hall in cold regions is summarized based on the design parameters of orientation, shape and window opening.

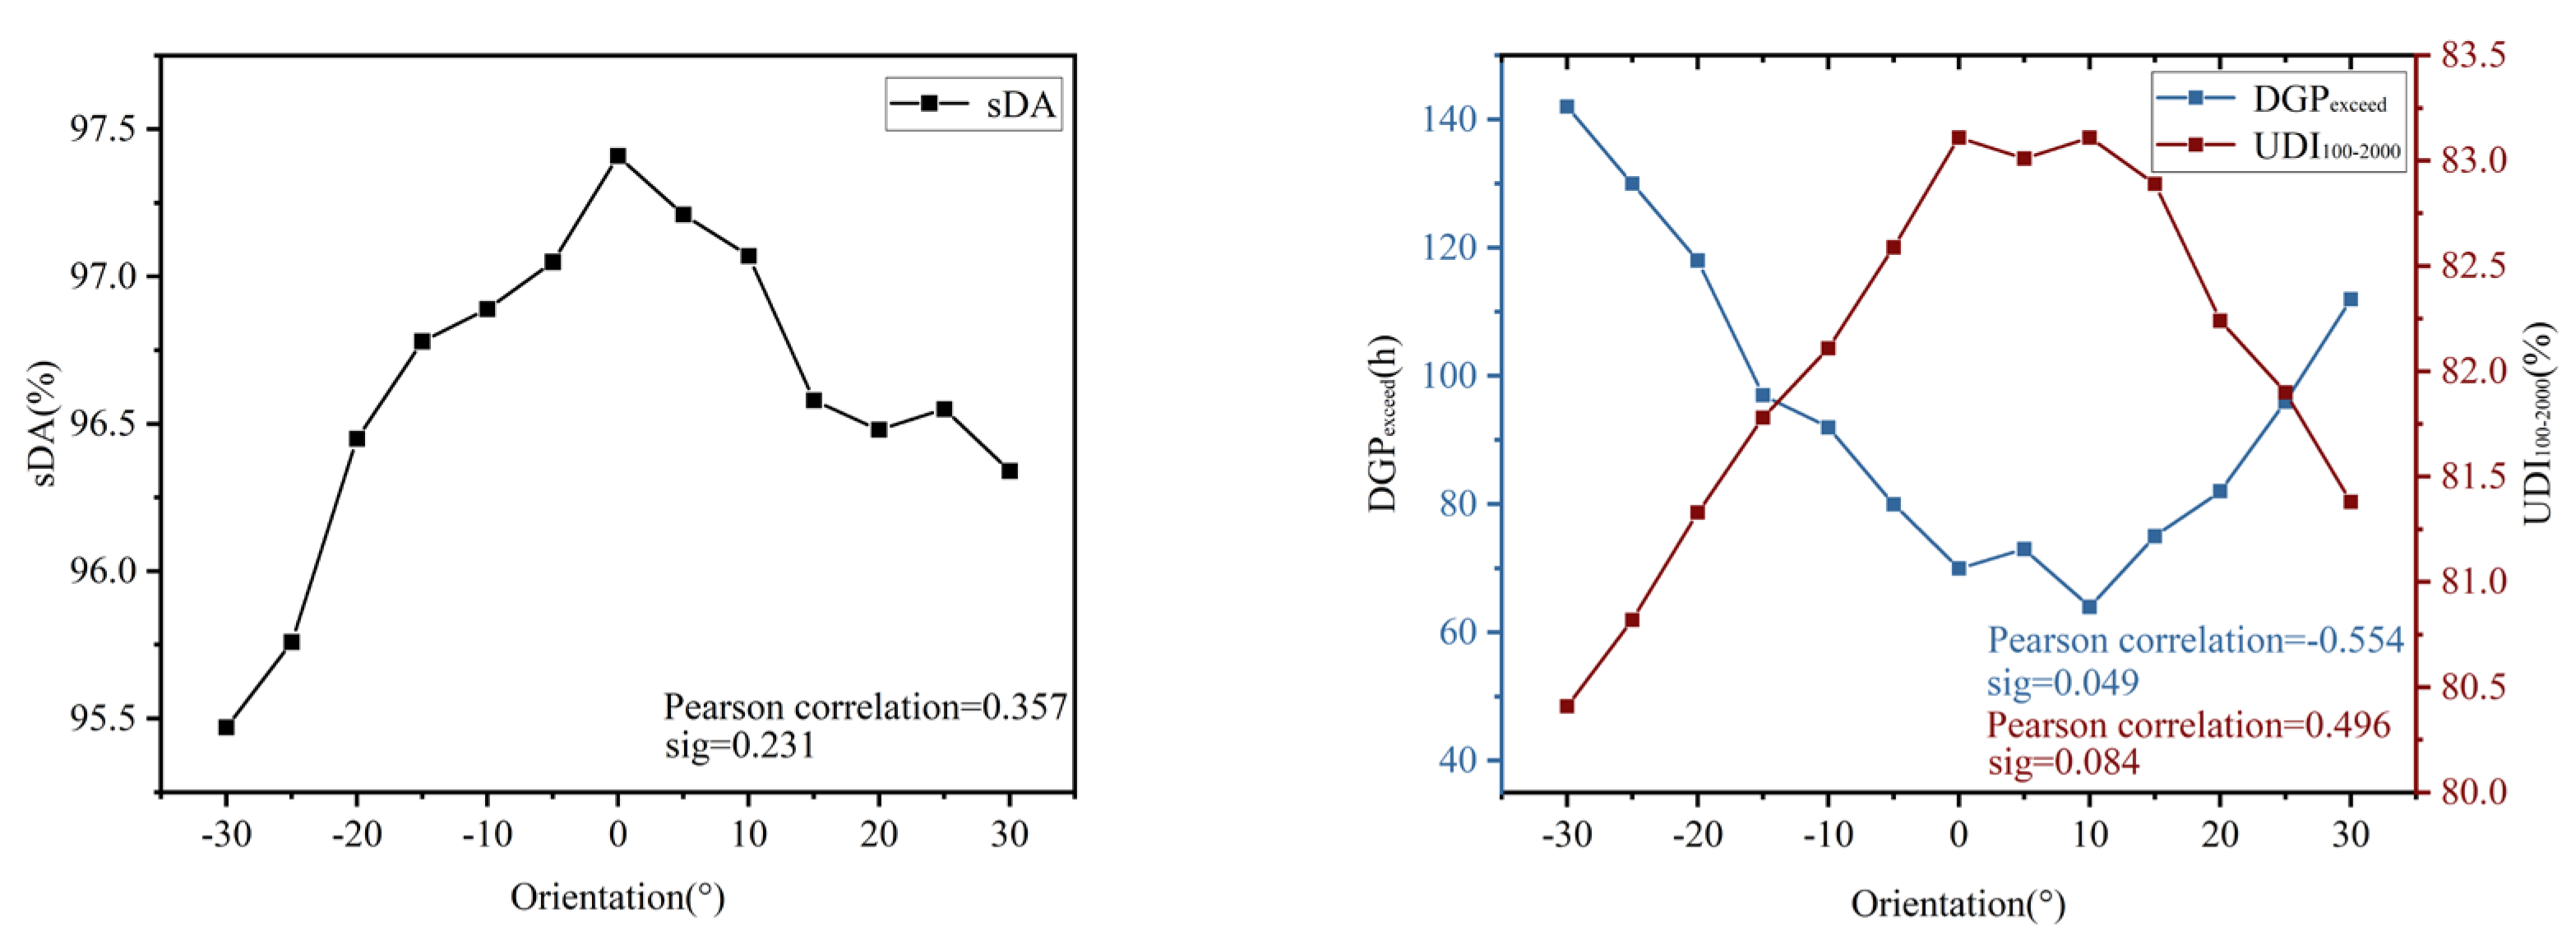
5.1. Design Strategy of Orientation Parameters

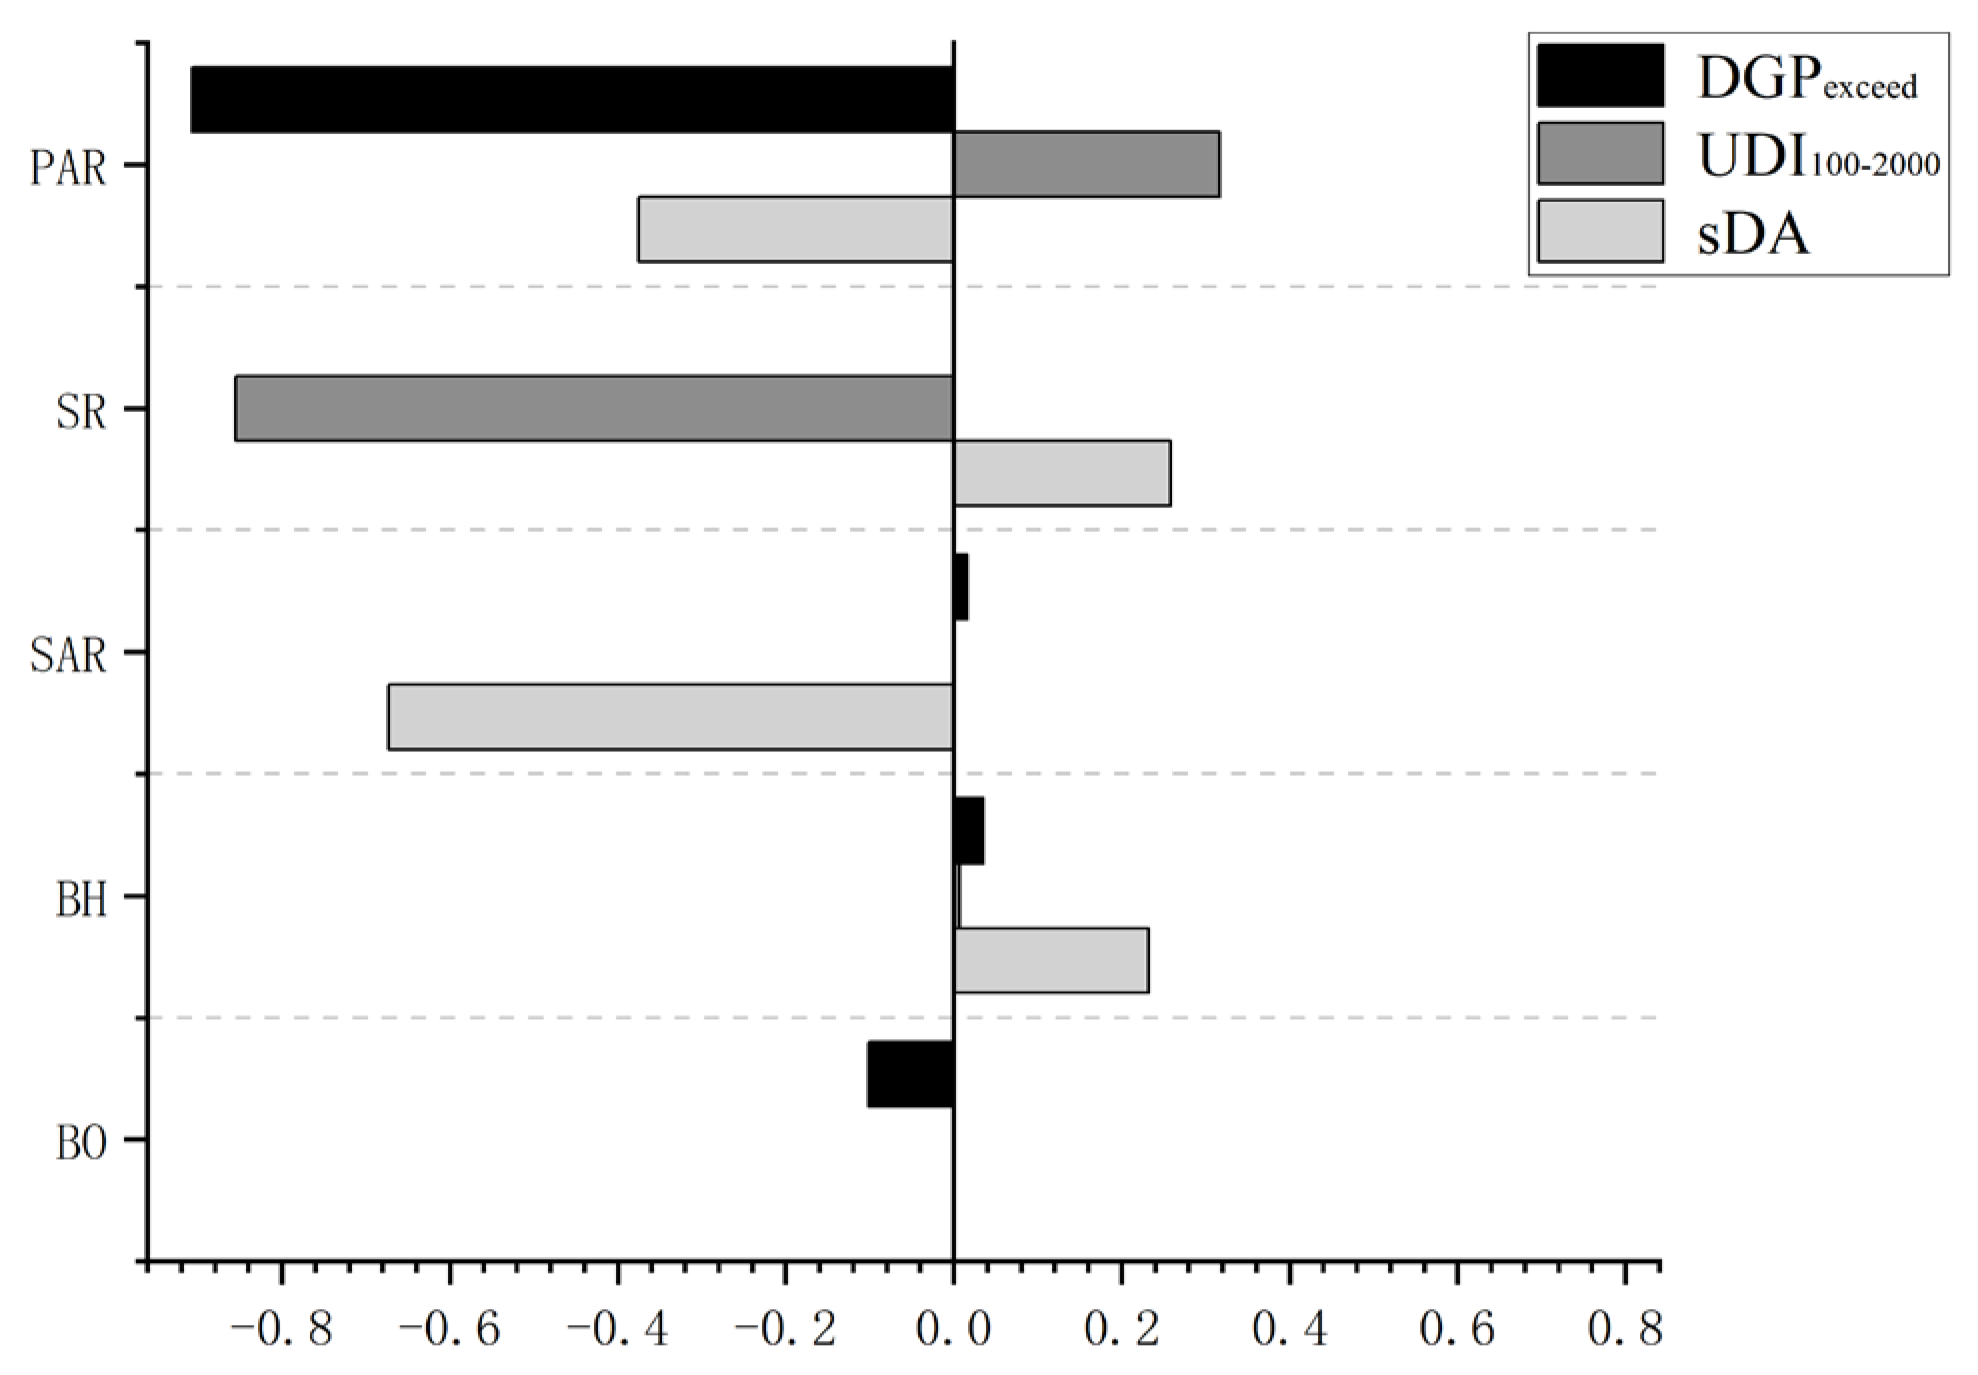
The building orientation and the light environment of the waiting hall influence each other, so as to explore the inherent law of building orientation and lighting performance, and thus realize a sustainable building design. With the change in building orientation, the amount of sunshine radiation received by the waiting hall gradually changes. sDA and UDI are at a minimum when the building orientation is −30°, and reach the maximum when the building orientation is 0°. The probability of uncomfortable glare is lowest when the building is oriented in the range of 0~10°.
To sum up, the change in building orientation has a great influence on the lighting evaluation indexes sDA, UDI and DGPexceed. Better indoor natural lighting performance can be achieved when the building orientation is 0°, which is conducive to improving the utilization rate of natural lighting and reducing energy consumption. In addition, according to the importance ranking of the GBRT model, the building orientation has little influence on the lighting performance of the waiting hall compared to other design parameters.

5.2. Design Strategy of Shape Parameters

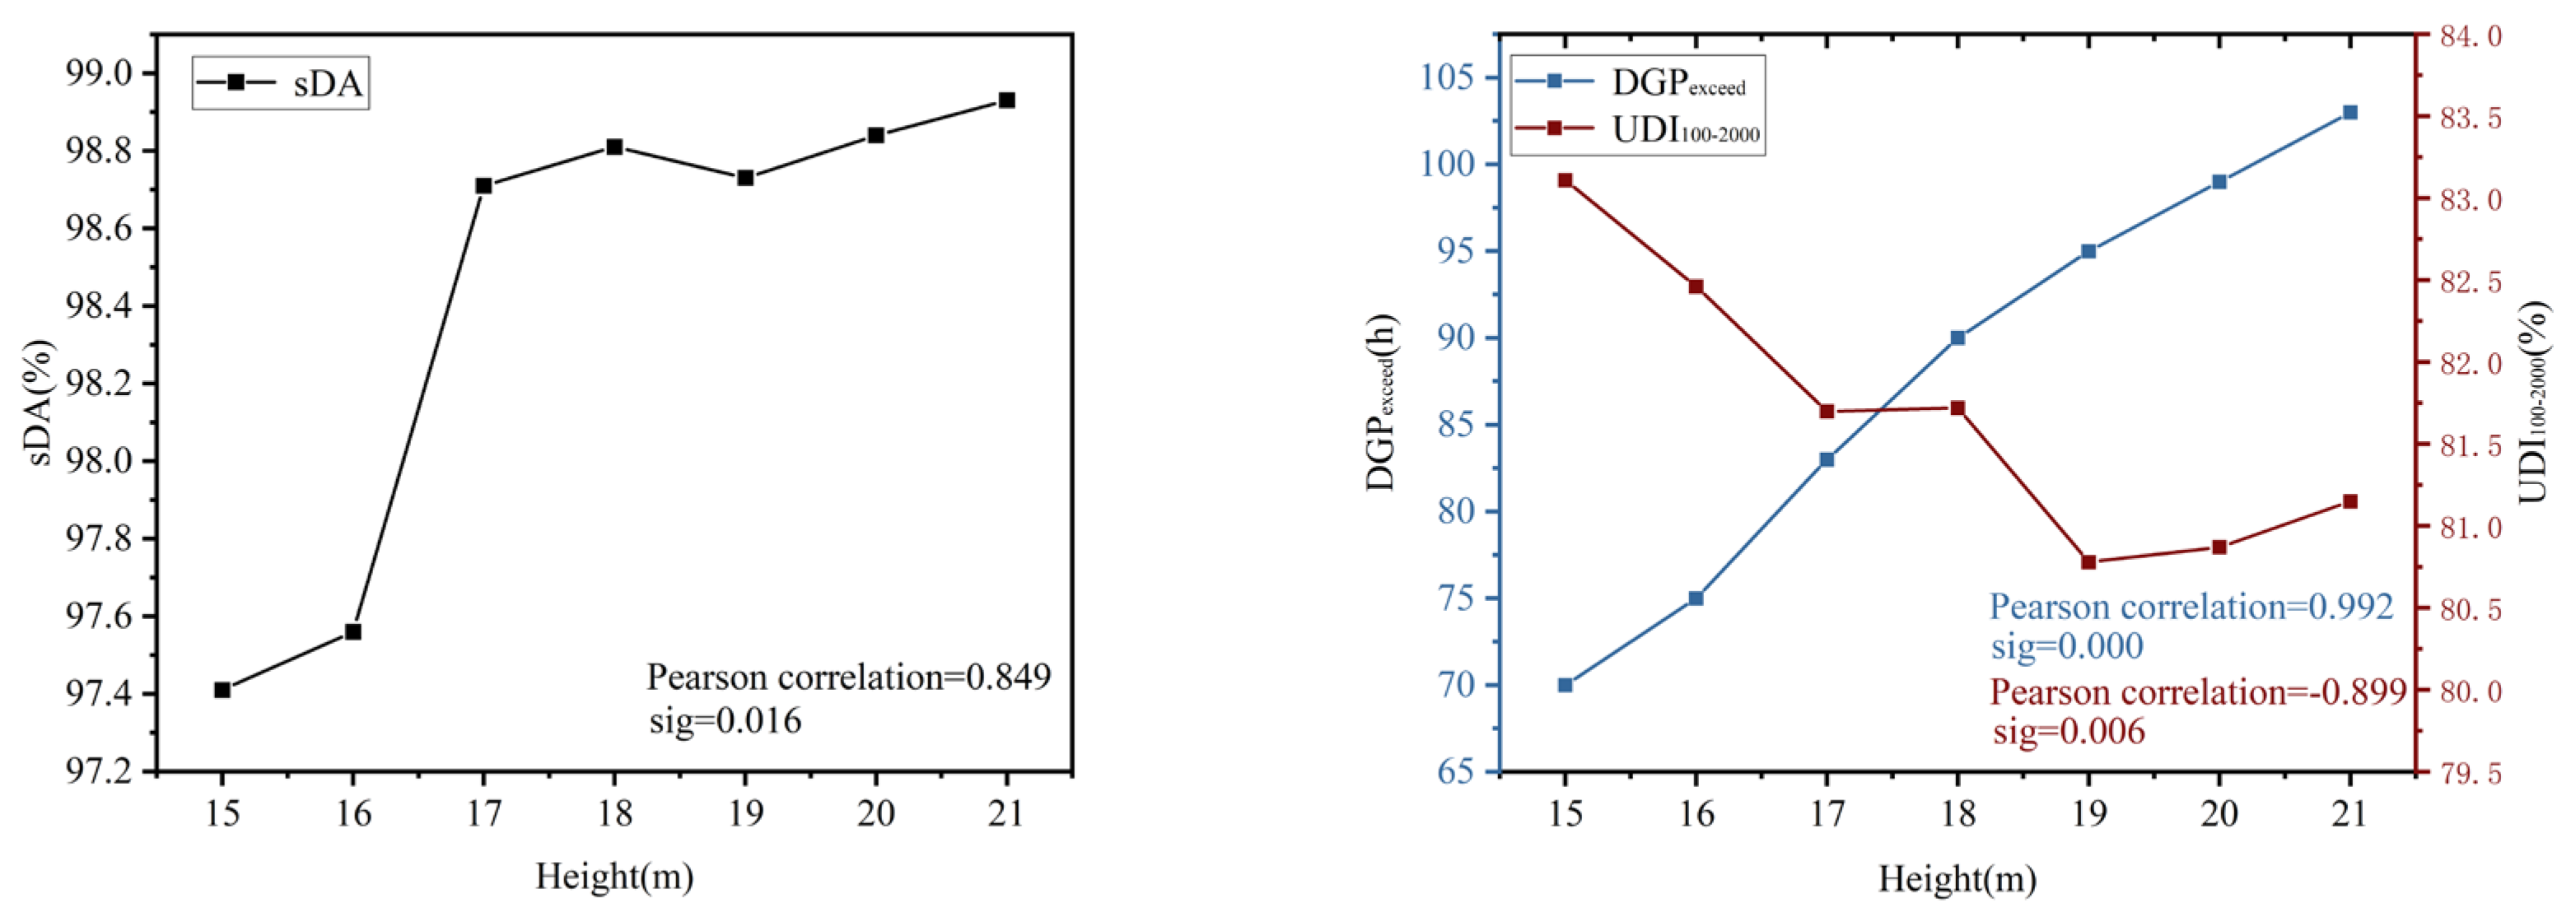
In the design of the vertical dimension, the building height is an important factor affecting the natural lighting of the waiting hall. The waiting hall is a large space; if the building height is too low, it will cause a sense of depression. However, too high a building height will produce uneven illumination, so the building height needs to be chosen within a reasonable range under the premise of meeting the indoor light comfort. The building height has a great influence on sDA; the increase in building height helps to make full use of natural lighting. UDI100–2000 shows the opposite trend to that of sDA. The value of UDI100–2000 shows a slow decline with the increase in the building height and then tends to bottleneck. It was found that the building height in the range of 17~21 m can significantly improve the ability to use natural light and the lighting energy-saving potential while ensuring a suitable proportion of natural light in the range of 100 to 2000 lx effective illuminance data on the working surface throughout the year. However, attention should be paid to the occurrence of uncomfortable glare when designing the lighting of waiting halls.
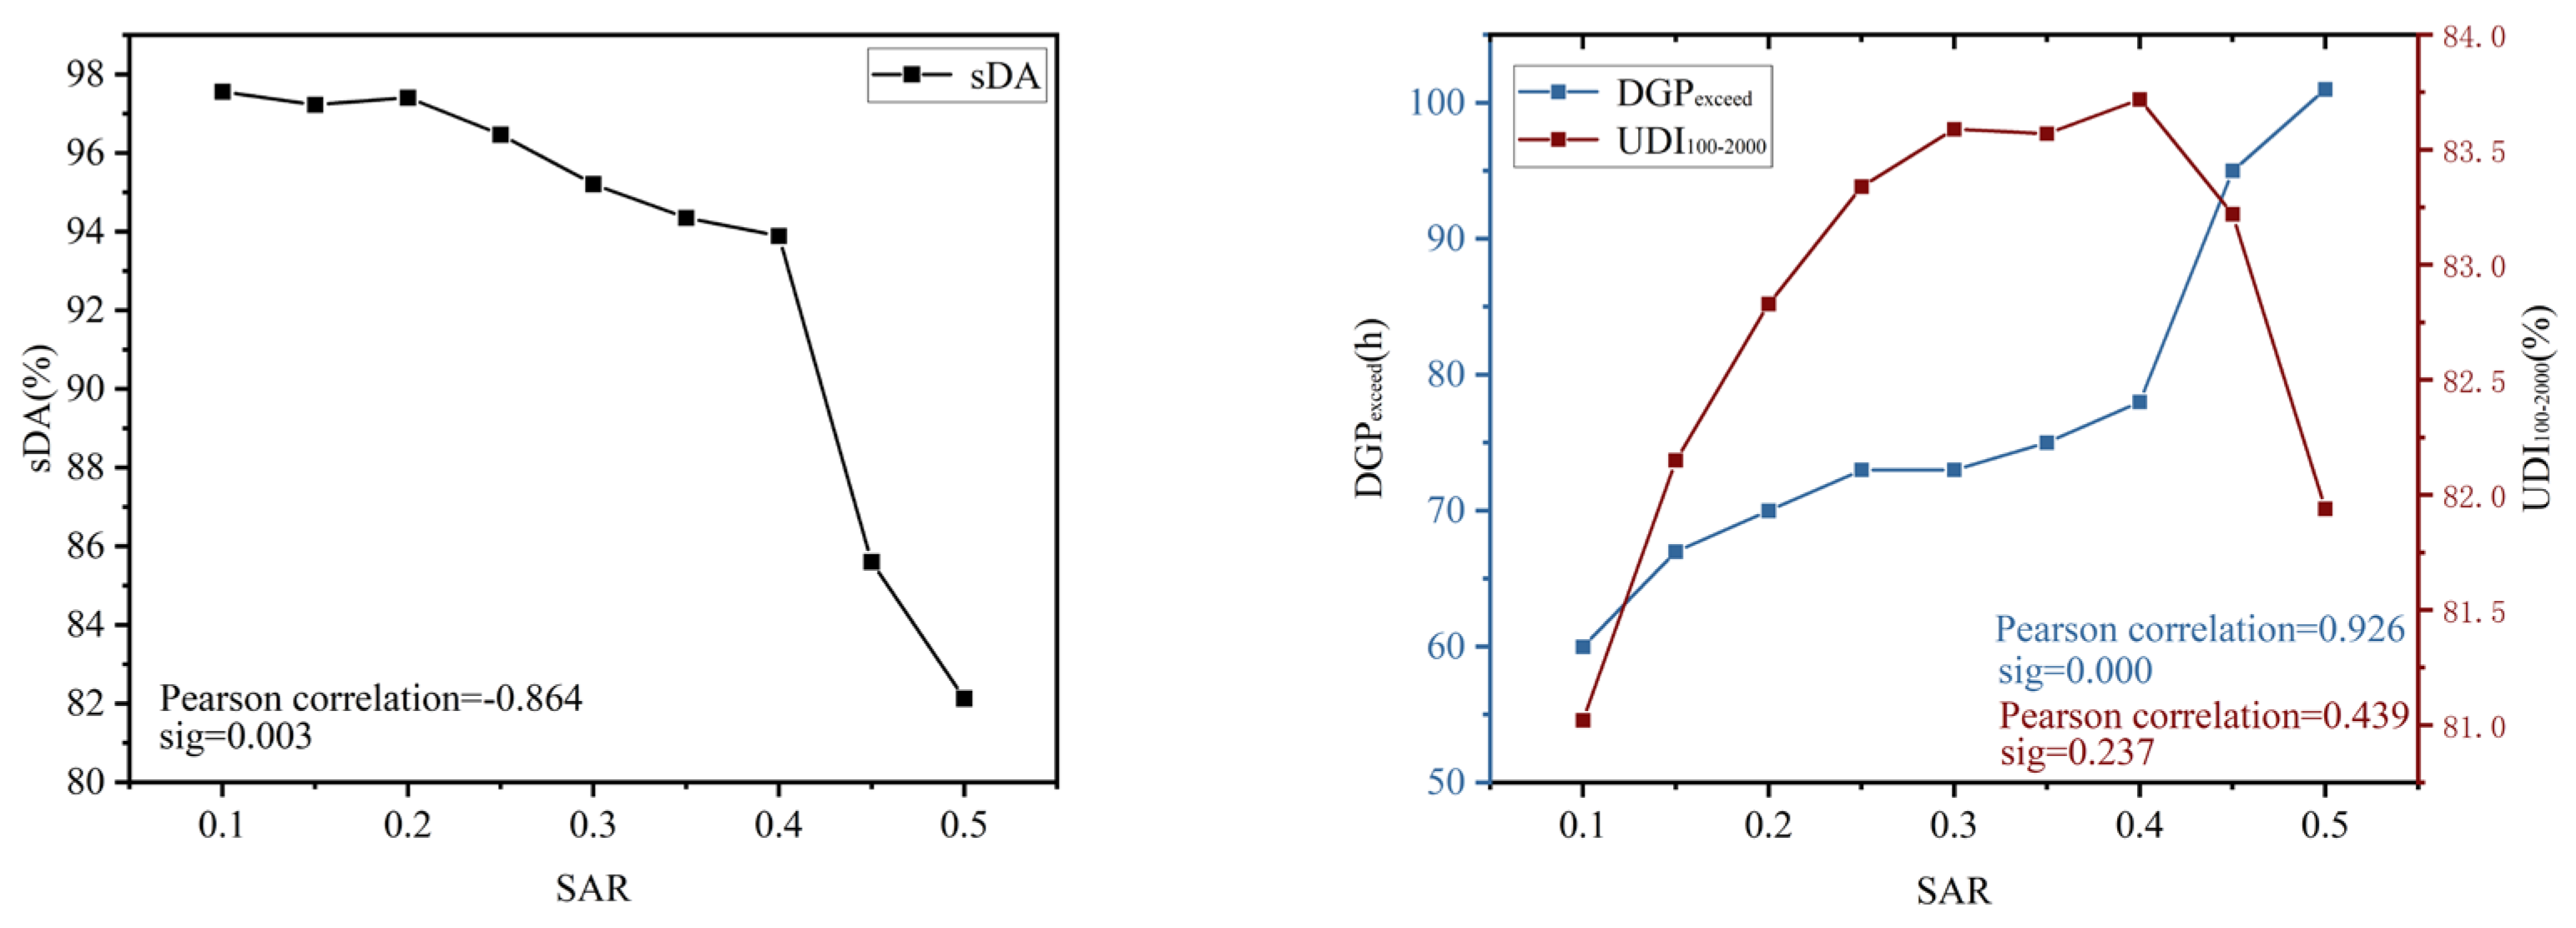
The effect on sDA, UDI and DGPexceed is large. The sDA was negatively correlated with SAR. The results showed that sDA was maintained at higher light levels when the SAR was in the range of 0.1~0.4, which was conducive to improving the average natural light performance of the overall waiting hall. UDI shows a trend of increasing at first and then decreasing. When the value of UDI100–2000 is significantly increased between 0.1 and 0.3, the value of SAR in the range of 0.3~0.4 greatly increases the proportion of data with effective illumination on the working surface throughout the year, while the probability of uncomfortable glare is smaller. In addition, SAR was found to have the most important effect on sDA compared to other architectural design parameters.
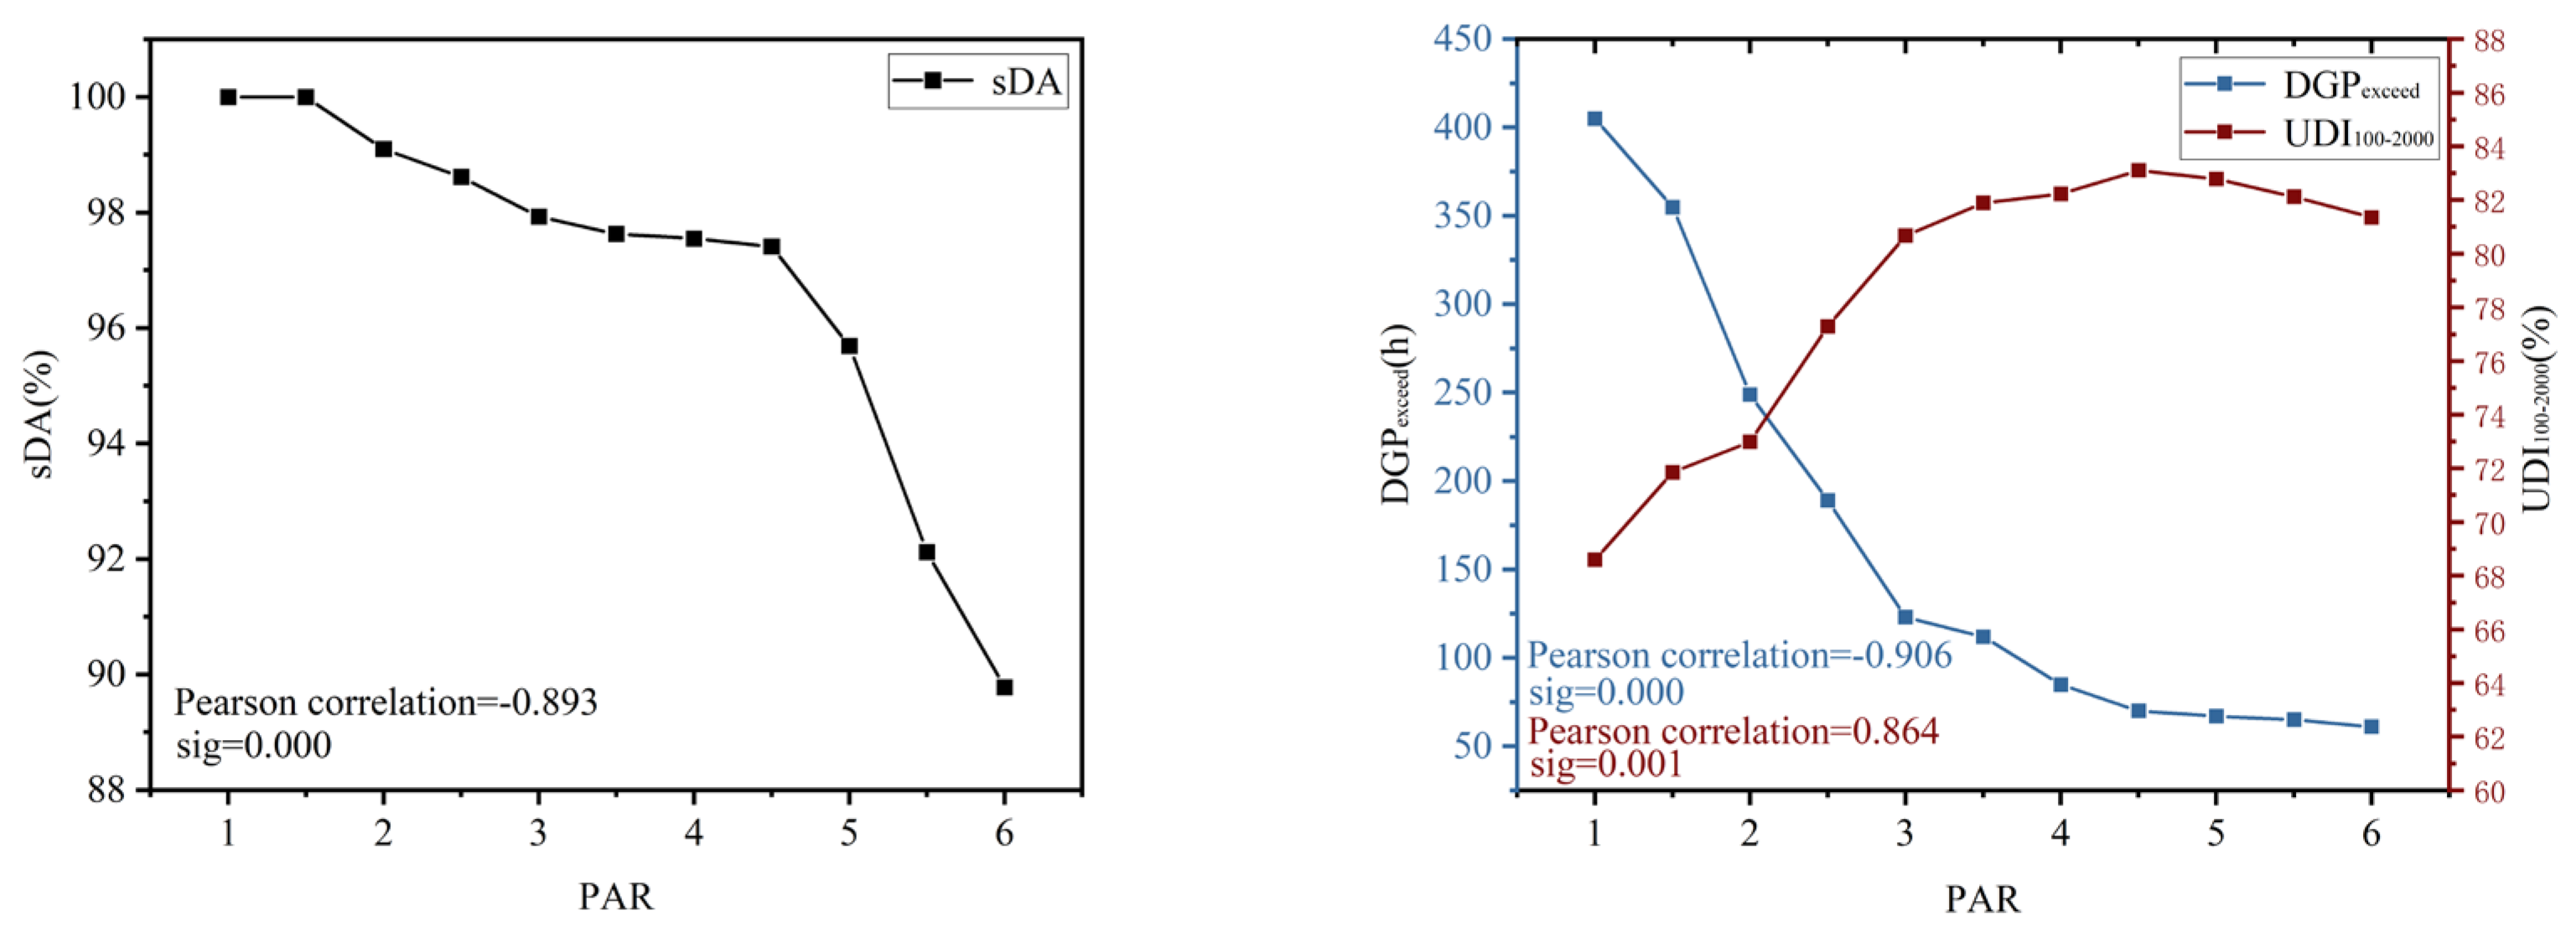
Based on the constraints of the cold climate and geographical environment, the main plan is mostly in the form of a regular rectangle; therefore, in the plan design of the waiting hall, attention should be paid to the control of the plan aspect ratio, and an inappropriate ratio will easily lead to the increase in energy consumption. PAR has a significant impact on sDA as sDA shows a slow decreasing trend with the growth of PAR, while UDI100–2000 shows the opposite trend: with the increase in PAR, the UDI100–2000 value gradually increases. When the value of PAR is 4.5, it can greatly increase the proportion of effective lighting data on the working surface throughout the year while reducing the occurrence of glare in the waiting hall. According to the importance ranking of the GBRT model, PAR has a significant impact on DGPexceed.

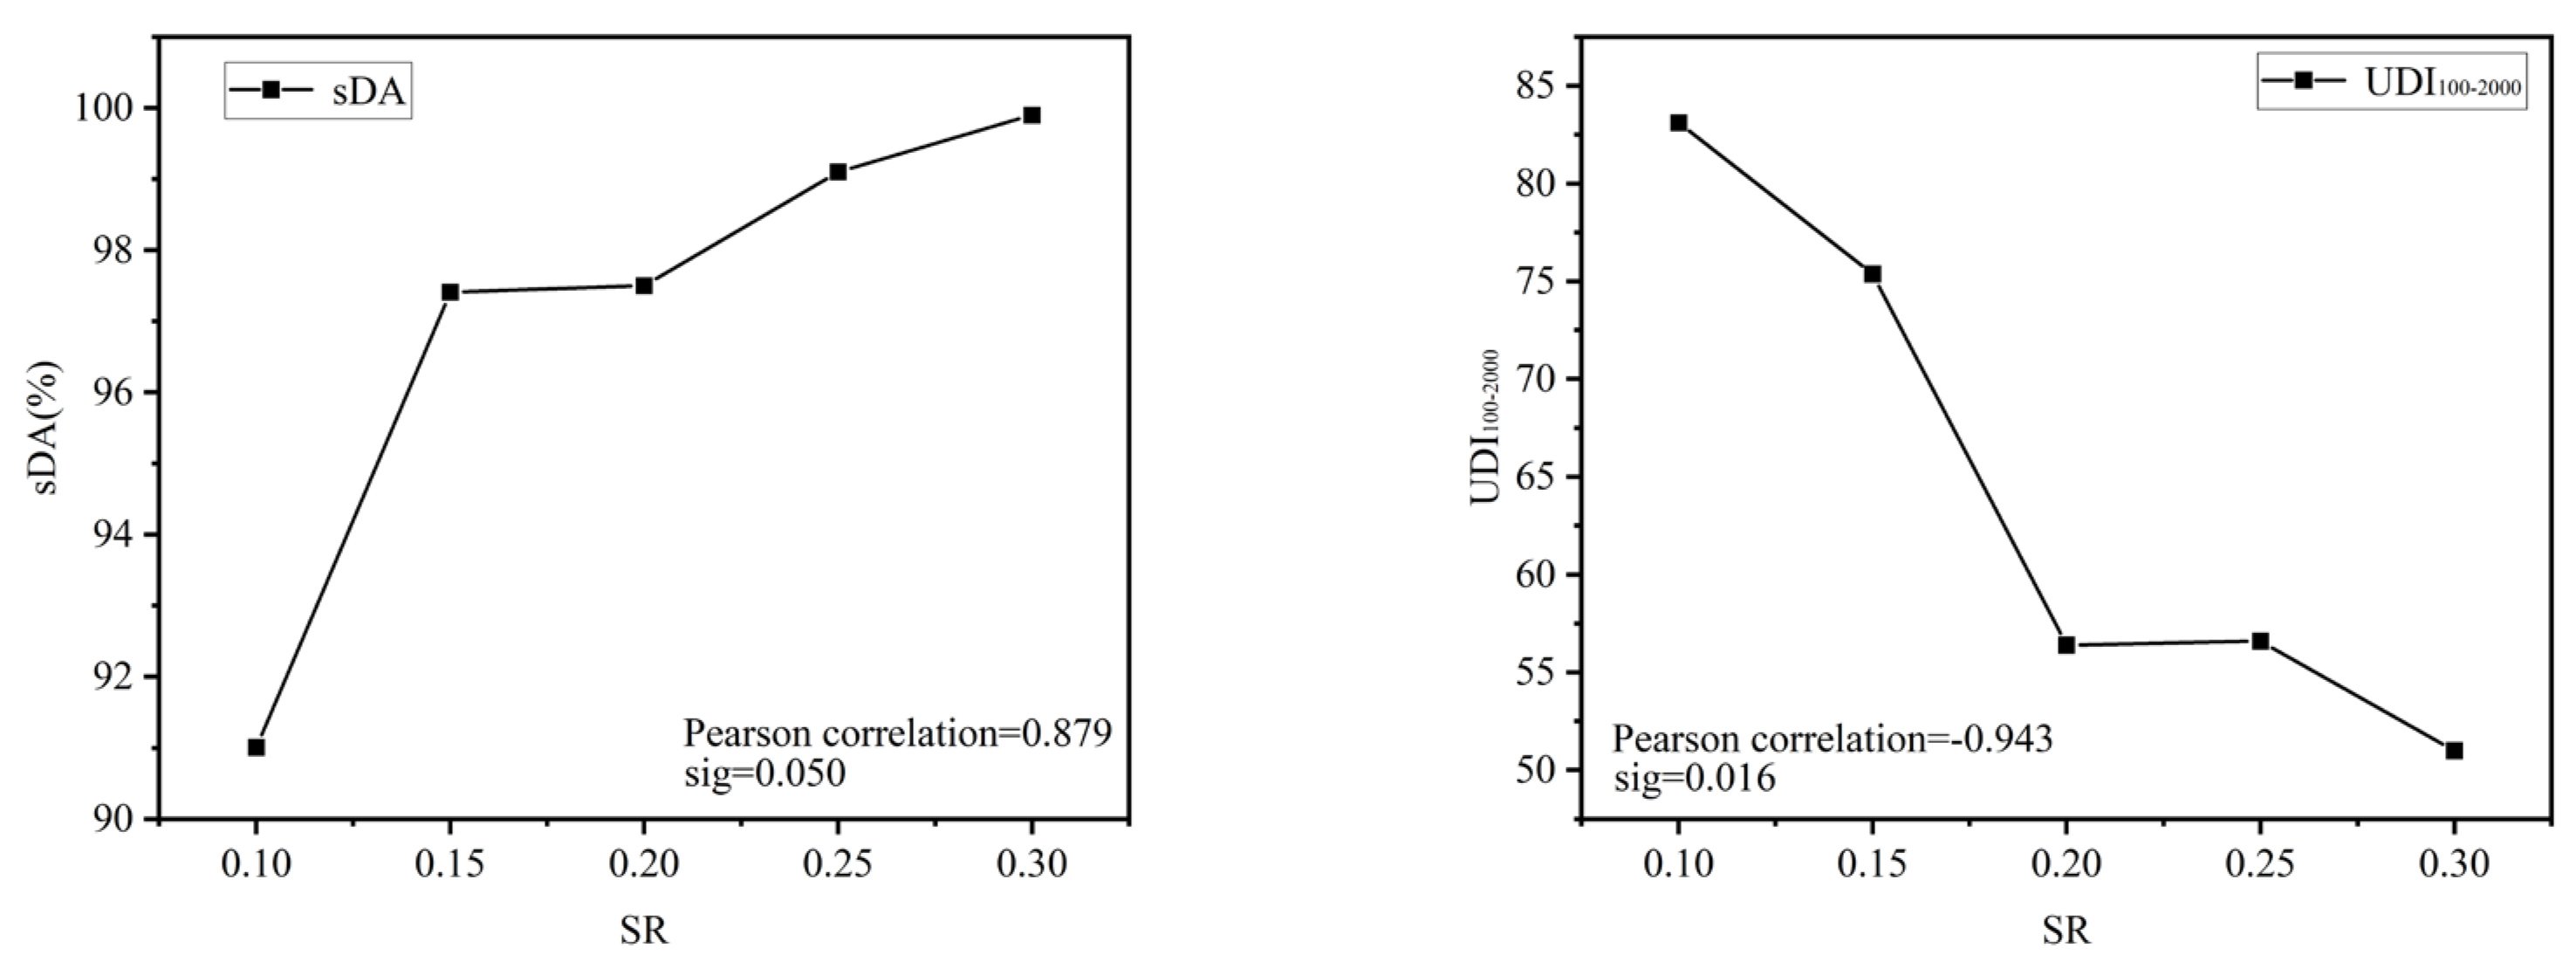
5.3. Design Strategy of Window Parameters

The increase in the skylight ratio triggers the increase in sDA. With the increase in the skylight ratio, the probability of meeting the minimum illumination of the visual requirements on the working surface throughout the year can be significantly increased, and the data of the effective illumination on the working surface throughout the year can also be improved to some extent. At the same time, the probability of uncomfortable glare increases with the increase in the skylight ratio. Therefore, appropriate shading facilities should be used to reduce the occurrence of glare. At the same time, compared with other design parameters, the skylight design parameters have the greatest influence on UDI. Designers can choose the appropriate skylight ratio to meet the requirements of modeling and creative ideas.

6. Conclusions

Based on the environment and conditions of cold regions, and the problem of poor decision making in the design of natural lighting of the local high-speed railway station waiting halls in the past, as well as the development tendency of the parametric design of buildings, the author put forward a design strategy of natural lighting of the waiting hall in cold regions by directing its natural lighting design with green building simulation technology and the GBRT prediction model.
The main findings of the study include:
(1)
The simulation process of natural lighting in the waiting hall of the cold high-speed railway station was established. By coupling building and environment information, the relationship between the design parameters and performance simulation of the waiting hall was constructed, and the integrated process from the parameterized model establishment, parameter setting to outcome analysis, was realized, which compensates for the cracks in data transmission and circulation and the lack of time delay. Based on the parametric design platform, the collaborative operation and linkage among simulation engines such as Radiance and Daysim effectively improved the efficiency of the parametric performance simulation, provided a rich dataset for developing the GBRT model through parametric simulation, further promoted the exploration of the influence of key parameters on the indoor light environment and enhanced the decision-making capacity of performance-driven design.
(2)
A GBRT prediction model for natural lighting in the waiting halls of high-speed railway stations in cold regions was constructed. First, the model has better accuracy, robustness and generalization ability compared with the traditional one. In addition, the relationship between design parameters and lighting indicators is mostly nonlinear, and the growth rate or decline rate of lighting indicators tends to level off as the values of the design parameters increase, so the GBRT prediction model has unparalleled superiority in dealing with nonlinear problems. Second, it can be used to replace the traditional lighting simulation model as an effective decision support tool and make up for the length of time and low efficiency of the traditional one. Third, its importance ranking can be used to identify the key parameters of the light environment and assist to explore their influence in the pre-design stage. The results showed that SR, SAR and PAR played an important role for UDI, sDA and DGPexceed, respectively, and the building orientation had the least influence. The priority of sustainable building design can be laid on the key design parameters in the future.
(3)
The natural lighting design strategy was proposed. The visualization technology was used to make a comprehensive decision on the design of natural lighting, and the visualization indexes such as sDA, UDI and DGPexceed were generated simultaneously to give real-time and intuitive feedback and facilitate rapid adjustment and modification. Moreover, through summarizing the law of different design parameters and design objectives, investigating the restrictive relationship between the three evaluation indexes and exploring the light environment problems, more outcomes were drawn for the natural lighting design and the reduction in unnecessary energy waste. The results showed that the best lighting can be achieved at the building orientation of 0°; the building height had a negative correlation with UDI, while it had a positive correlation with sDA and DGPexceed; a good lighting effect can be ensured with the building height in the range of 17~21 m; and the best lighting effect was achieved when the SAR was in the range of 0.3~0.4. SAR was negatively correlated with sDA, while it was positively correlated with DGPexceed in the range of 0.1~0.3, which decreases when SAR exceeds 0.4; PAR had a positive correlation with UDI, while it had a negative correlation with sDA and DGPexceed; when PAR was 4.5, the percentage of data for effective illumination on the working surface throughout the year reached its highest value; SR had a positive correlation with sDA, while it had a negative correlation with UDI. sDA increased rapidly in the range of 0.1~0.15 and slowed down when exceeding 0.15; and the SR value of 0.15 can significantly improve the lighting performance of the waiting hall.
Future research can be conducted from two aspects as follows. First, research can focus on the natural light environment difference of waiting halls in different climatic zones in China. The research area of this paper lies in a single climate zone, and the characteristics of the waiting hall light environment under different climate zones still deserve further exploration in the future. Second, this paper mainly focuses on the natural light environment. In the future, the natural light environment and artificial lighting can be combined to improve the prediction of the lighting level and energy-saving potential.

Author Contributions

Conceptualization, F.X.; methodology, F.X.; software, F.X.; validation, H.S.; formal analysis, F.X.; investigation, F.X. and H.S.; resources, F.X. and H.S.; data curation, H.S. and H.Z.; writing—original draft preparation, F.X.; writing—review and editing, F.X.; visualization, F.X. and H.Z.; supervision, H.S. and H.Z.; project administration, H.S.; funding acquisition, H.S. All authors have read and agreed to the published version of the manuscript.

Funding

This research was funded by the Opening Fund of Key Laboratory of Interactive Media Design and Equipment Service Innovation, Ministry of Culture and Tourism (2020+11).

Data Availability Statement

The data used to support the findings of this study are included within the article.

Acknowledgments

The authors would like to thank Haihong Song and Huina Zhang from Northeast Forestry University for their assistance in data collection and data curation. The authors also would like to acknowledge the financial support from a research grant provided by the Opening Fund of Key Laboratory of Interactive Media Design and Equipment Service Innovation, Ministry of Culture and Tourism (2020+11).

Conflicts of Interest

The authors declare no conflict of interest.

Abbreviations

The following abbreviations are used in this manuscript:
DADaylight autonomy
sDASpatial daylight autonomy
UDIUseful daylight illuminance
DGPDaylight glare probability
DGPexceedThe number of hours throughout the year when the DGP is above a defined threshold at the analysis point
GBRTGradient boosted regression trees
SVRSupport vector regression
MLRMultivariate linear regression
ANNArtificial neural networks
RMSERoot mean squared error
BOBuilding orientation
BHBuilding height
SARSection aspect ratio
PARPlan aspect ratio
SRSkylight ratio

References

  1. Huang, Y.; Wang, Y. How does high-speed railway affect green innovation efficiency? A perspective of innovation factor mobility. J. Clean. Prod. 2020, 265, 121623. [Google Scholar] [CrossRef]
  2. Huang, W.; Jiang, J. Research on acoustic environment impact of high-speed railway station waiting hall based on image simulation technology. Alex. Eng. J. 2022, 61, 2971–2981. [Google Scholar] [CrossRef]
  3. Heo, J.; Kozaki, M.; Koga, T.; Hirate, K.; Kim, H.B. Lighting techniques considering the safety and comfort of the elderly in the railway station space. Displays 2022, 74, 102292. [Google Scholar] [CrossRef]
  4. Du, X. Investigation of indoor environment comfort in large high-speed railway stations in Northern China. Indoor Built Environ. 2020, 29, 54–66. [Google Scholar] [CrossRef]
  5. Zhao, D.X.; He, B.J.; Johnson, C.; Mou, B. Social problems of green buildings: From the humanistic needs to social acceptance. Renew. Sustain. Energy Rev. 2015, 51, 1594–1609. [Google Scholar] [CrossRef]
  6. Yun, G.; Yoon, K.C.; Kim, K.S. The influence of shading control strategies on the visual comfort and energy demand of office buildings. Energy Build. 2014, 84, 70–85. [Google Scholar] [CrossRef]
  7. Tabadkani, A.; Shoubi, M.V.; Soflaei, F.; Banihashemi, S. Integrated parametric design of adaptive facades for user’s visual comfort. Autom. Constr. 2019, 106, 102857. [Google Scholar] [CrossRef]
  8. Sapia, C. Daylighting in buildings: Developments of sunlight addressing by optical fiber. Sol. Energy 2013, 89, 113–121. [Google Scholar] [CrossRef]
  9. Paroncini, M.; Calcagni, B.; Corvaro, F. Monitoring of a light-pipe system. Sol. Energy 2007, 81, 1180–1186. [Google Scholar] [CrossRef]
  10. Muñoz-González, C.; Ruiz-Jaramillo, J.; Cuerdo-Vilches, T.; Joyanes-Díaz, M.D.; Montiel Vega, L.; Cano-Martos, V.; Navas-Martín, M.Á. Natural lighting in historic houses during times of pandemic. The case of housing in the Mediterranean climate. Int. J. Environ. Res. Public Health 2021, 18, 7264. [Google Scholar] [CrossRef]
  11. Li, D.H.; Wong, S.L.; Tsang, C.L.; Cheung, G.H. A study of the daylighting performance and energy use in heavily obstructed residential buildings via computer simulation techniques. Energy Build. 2006, 38, 1343–1348. [Google Scholar] [CrossRef]
  12. Turan, I.; Chegut, A.; Fink, D.; Reinhart, C. The value of daylight in office spaces. Build. Environ. 2020, 168, 106503. [Google Scholar] [CrossRef]
  13. Deb, C.; Ramachandraiah, A. Evaluation of thermal comfort in a rail terminal location in India. Build. Environ. 2010, 45, 2571–2580. [Google Scholar] [CrossRef]
  14. Michael, A.; Heracleous, C. Assessment of natural lighting performance and visual comfort of educational architecture in Southern Europe: The case of typical educational school premises in Cyprus. Energy Build. 2017, 140, 443–457. [Google Scholar] [CrossRef]
  15. Iommi, M. The natural light in the Italian rationalist architecture of Ex GIL of Mario Ridolfi in Macerata. The virtual reconstruction and the daylight analysis of the original building. Energy Build. 2016, 113, 30–38. [Google Scholar] [CrossRef]
  16. Huang, X.; Zhu, S. Optimization of daylighting pattern of museum sculpture exhibition hall. Sustainability 2021, 13, 1918. [Google Scholar] [CrossRef]
  17. Ruiz, A.; Campano, M.Á.; Acosta, I.; Luque, Ó. Partial daylight autonomy (DAp): A new lighting dynamic metric to optimize the Design of Windows for seasonal use spaces. Appl. Sci. 2021, 11, 8228. [Google Scholar] [CrossRef]
  18. Susa-Páez, A.; Piderit-Moreno, M.B. Geometric Optimization of Atriums with Natural Lighting Potential for Detached High-Rise Buildings. Sustainability 2020, 12, 6651. [Google Scholar] [CrossRef]
  19. e Silva, A.C.P.S.; Calili, R.F. New building simulation method to measure the impact of window-integrated organic photovoltaic cells on energy demand. Energy Build. 2021, 252, 111490. [Google Scholar] [CrossRef]
  20. Kamel, T.M. A new comprehensive workflow for modelling outdoor thermal comfort in Egypt. Sol. Energy 2021, 225, 162–172. [Google Scholar] [CrossRef]
  21. Queiroz, N.; Westphal, F.S.; Pereira, F.O.R. A performance-based design validation study on EnergyPlus for daylighting analysis. Build. Environ. 2020, 183, 107088. [Google Scholar] [CrossRef]
  22. Fasi, M.A.; Budaiwi, I.M. Energy performance of windows in office buildings considering daylight integration and visual comfort in hot climates. Energy Build. 2015, 108, 307–316. [Google Scholar] [CrossRef]
  23. Yang, L.; He, B.J.; Ye, M. Application research of ECOTECT in residential estate planning. Energy Build. 2014, 72, 195–202. [Google Scholar] [CrossRef]
  24. Hygh, J.S.; DeCarolis, J.F.; Hill, D.B.; Ranjithan, S.R. Multivariate regression as an energy assessment tool in early building design. Build. Environ. 2012, 57, 165–175. [Google Scholar] [CrossRef]
  25. Turhan, C.; Kazanasmaz, T.; Uygun, I.E.; Ekmen, K.E.; Akkurt, G.G. Comparative study of a building energy performance software (KEP-IYTE-ESS) and ANN-based building heat load estimation. Energy Build. 2014, 85, 115–125. [Google Scholar] [CrossRef]
  26. Cui, P.; Dai, C.; Zhang, J.; Li, T. Assessing the Effects of Urban Morphology Parameters on PM2. 5 Distribution in Northeast China Based on Gradient Boosted Regression Trees Method. Sustainability 2022, 14, 2618. [Google Scholar] [CrossRef]
  27. Persson, C.; Bacher, P.; Shiga, T.; Madsen, H. Multi-site solar power forecasting using gradient boosted regression trees. Sol. Energy 2017, 150, 423–436. [Google Scholar] [CrossRef]
  28. Shi, X.; Yang, W. Performance-driven architectural design and optimization technique from a perspective of architects. Autom. Constr. 2013, 32, 125–135. [Google Scholar] [CrossRef]
  29. Karimi, K.; Farrokhzad, M.; Roshan, G.; Aghdasi, M. Evaluation of effects of a green wall as a sustainable approach on reducing energy use in temperate and humid areas. Energy Build. 2022, 262, 112014. [Google Scholar] [CrossRef]
  30. Jalali, Z.; Noorzai, E.; Heidari, S. Design and optimization of form and facade of an office building using the genetic algorithm. Sci. Technol. Built Environ. 2020, 26, 128–140. [Google Scholar] [CrossRef]
  31. Bian, Y.; Ma, Y. Analysis of daylight metrics of side-lit room in Canton, south China: A comparison between daylight autonomy and daylight factor. Energy Build. 2017, 138, 347–354. [Google Scholar] [CrossRef]
  32. Xue, Y.; Liu, W. A Study on Parametric Design Method for Optimization of Daylight in Commercial Building’s Atrium in Cold Regions. Sustainability 2022, 14, 7667. [Google Scholar] [CrossRef]
  33. Sun, Y.; Liu, D.; Flor, J.F.; Shank, K.; Baig, H.; Wilson, R.; Liu, H.; Sundaram, S.; Mallick, T.K.; Wu, Y. Analysis of the daylight performance of window integrated photovoltaics systems. Renew. Energy 2020, 145, 153–163. [Google Scholar] [CrossRef]
  34. Bakmohammadi, P.; Noorzai, E. Optimization of the design of the primary school classrooms in terms of energy and daylight performance considering occupants’ thermal and visual comfort. Energy Rep. 2020, 6, 1590–1607. [Google Scholar] [CrossRef]
  35. Wienold, J.; Christoffersen, J. Evaluation methods and development of a new glare prediction model for daylight environments with the use of CCD cameras. Energy Build. 2006, 38, 743–757. [Google Scholar] [CrossRef]
  36. Ayoub, M. A multivariate regression to predict daylighting and energy consumption of residential buildings within hybrid settlements in hot-desert climates. Indoor Built Environ. 2019, 28, 848–866. [Google Scholar] [CrossRef]
Figure 1. The location of the study area.
Buildings 13 01105 g001
Figure 2. Flow chart of digital design of the light environment in waiting hall in cold regions.
Buildings 13 01105 g002
Figure 3. Parametric model of waiting hall of Harbin West Station.
Buildings 13 01105 g003
Figure 4. Solar radiation analysis diagram.
Buildings 13 01105 g004
Figure 5. Layout of measuring points.
Buildings 13 01105 g005
Figure 6. Solar radiation actual measurement data.
Buildings 13 01105 g006
Figure 7. Flow chart of the parametric simulation program of optical environment.
Buildings 13 01105 g007
Figure 8. Workflow of GBRT model.
Buildings 13 01105 g008
Figure 9. Analysis of building orientation simulation results.
Buildings 13 01105 g009
Figure 10. Analysis of building height simulation results.
Buildings 13 01105 g010
Figure 11. Analysis of section aspect ratio simulation results.
Buildings 13 01105 g011
Figure 12. Analysis of plan aspect ratio simulation results.
Buildings 13 01105 g012
Figure 13. Analysis of skylight ratio simulation results.
Buildings 13 01105 g013
Figure 14. Waiting hall design parameters in order of importance.
Buildings 13 01105 g014
Table 1. Constraints of design parameters of light environment in waiting hall.
Classification of Design ElementsParameter NameNumerical ConstraintModuleUnit
orientationBO−30~305degree
shapeBH15~211meter
SAR0.2~0.50.05-
PAR1.0~6.00.5-
windowSR0.1~0.30.05-
Table 2. Selected samples of the dataset.
Serial NumberBOBHSARPARSRsDAUDIDGPexceed
10160.24.50.1597.56%82.46%75
20180.24.50.1598.81%81.72%90
30150.230.1597.93%80.68%123
410150.24.50.1597.07%83.11%64
5−30150.24.50.1595.47%80.41%142
Table 3. Correlation analysis of design parameters and lighting evaluation index.
Design ParametersDAUDIDGPexceed
PearsonSigPearsonSigPearsonSig
BO0.3570.2310.4960.084−0.554 *0.049
BH0.849 *0.016−0.899 *0.0060.992 *0.000
SAR−0.864 *0.0030.4390.2370.926 *0.000
PAR−0.893 *0.0000.864 *0.001−0.906 *0.000
SR0.879 *0.050−0.943 *0.016--
Note: * at the 0.05 level (two-tailed), correlation is significant.
Table 4. Prediction accuracy of GBRT model.
Evaluation MetricsRMSER2
sDA1.14%0.984
UDI1.58%0.981
DGPexceed0.93%0.988
Table 5. Visual analysis of natural lighting performance.
DA Data Analysis Color DiagramUDI Data Analysis Color Diagram
Buildings 13 01105 i001Buildings 13 01105 i002
DGP Data Analysis Color Diagram
Buildings 13 01105 i003
Disclaimer/Publisher’s Note: The statements, opinions and data contained in all publications are solely those of the individual author(s) and contributor(s) and not of MDPI and/or the editor(s). MDPI and/or the editor(s) disclaim responsibility for any injury to people or property resulting from any ideas, methods, instructions or products referred to in the content.

