Article

Analysis of Winter Environment Based on CFD Simulation: A Case Study of Long–Hu Sand Feng Shui Layout at Jiangxi Bailudong Academy Complex

School of Architecture and Design, Nanchang University, Nanchang 330031, China
*
Author to whom correspondence should be addressed.
Buildings 2023, 13(4), 1101; https://doi.org/10.3390/buildings13041101
Submission received: 27 March 2023 / Revised: 13 April 2023 / Accepted: 14 April 2023 / Published: 21 April 2023
(This article belongs to the Special Issue Research on Vernacular Architecture)

Abstract

:
In ancient Chinese architecture, Feng Shui was a prevalent practice used to enhance the built environment. This study utilized computer simulation techniques to assess the effectiveness of Long–Hu Sand layout Feng Shui in the Bailudong Academy complex in Jiangxi, China, compared to a layout without Feng Shui principles. Computational fluid dynamics (CFD) were employed to simulate the winter courtyard wind environment, and the resulting simulations were used to analyze the winter courtyard ventilation of both layouts. The findings indicate that the Feng Shui layout provided better wind speed and pressure ratios in the winter courtyard, which were more conducive to human comfort and helped prevent the infiltration of cold winter air. The area of ideal wind pressure difference between the front and back of the main house for indoor ventilation in winter was also larger in the Feng Shui layout compared to the non-Feng Shui layout, meeting the standard for wind environment evaluation. The study highlights the ecological wisdom of ancient Chinese people and confirms that optimizing Feng Shui improves the wind environment of the courtyard in winter. The practical implications of these results include improving comfort and sustainability in contemporary architecture and urban planning.

1. Introduction

In ancient China, the term “Feng Shui” referred to the practice of conducting surveys of terrain, geological and hydrological conditions, ecological and microclimatic environments [1], as well as cultural and environmental landscapes, before selecting auspicious locations and times for construction. During the Qing Dynasty, Xiong Qifan wrote in “Kan Yu Xie Mi” that “when mountains surround a place, wind cannot penetrate and qi gathers within. When the outer mountains are lacking or sparse, wind can enter and qi dissipates. Qi that gathers is warm, while qi that dissipates is cold.” Modern psychology suggests that humans seek a sense of security and inner peace that originates from the deepest part of their psyche [2]. This feeling of being surrounded by something protective is derived from the prenatal experience of being enclosed in the womb, surrounded by amniotic fluid. Therefore, as shown in the ideal Feng Shui diagram in Figure 1, when selecting a dwelling or designing a building, the concept of enclosing space should be adopted. This idea represents the essence of Feng Shui thinking. The emphasis on surrounding a place with Long Sand and Hu Sand, and having a mountain or screen behind, also known as “Le Sand” in Feng Shui, ultimately serves the purpose of creating enclosed space. Feng Shui was therefore a practical scientific and technological activity, and various dynasties (i.e., the government) appointed officials to specialize in this field. For example, the “Qing Code” stipulated that “when it comes to surveying Feng Shui for large construction projects, the Qintianjian [3] would dispatch a special official to observe yin and yang, determine orientation, evaluate auspiciousness and commence work, which is of utmost importance”.
Over thousands of years, the study of Feng Shui has continuously evolved and can be divided into two main categories: the School of Forms and the School of Compass. These two factions often compete, boasting and belittling each other, but most people believe that they should complement each other. The “Shan Fa Quan Shu” proposed the idea of “Mountains as the body (Form) and Principles as the application (Compass)”, aiming to complement each other. In these two schools of thought, the Form School became the mainstream and is also known as the Jiangxi School. It advocates the use of natural terrain, selection of suitable locations, and arrangement of appropriate buildings and tombs [4]. For example, Mak, M.Y et al. discussed the two categories of Feng Shui mentioned above. The Form School, based on physical features, is considered more scientific than the Compass School in analyzing the built environment. An ideal Feng Shui model is introduced, and architects in Sydney and Hong Kong are surveyed, revealing that their designs align with the model and ancient Feng Shui principles. This suggests that the principles of the Form School are still relevant and can guide modern design practices [5]. Indian scholars led by Kryžanowski, Š discussed the lack of a systematic declaration about Feng Shui in Western European architecture and the necessity for proper scientific evaluation of its recommendations. The researchers found certain similarities between the Feng Shui school of form, environmental psychology, and sustainable design principles. However, the concept of life energy or qi remains poorly researched. The greatest potential of Feng Shui for contemporary architecture lies in its philosophical and conceptual foundations, which can encourage architects to rethink spatial concepts and change established spatial paradigms [6].
Combining the theory of canyon winds, one can explain the principles of the “Form School” followed by ancient Chinese people in selecting the location and layout of houses and tombs. The theory of canyon winds considers wind as a significant factor that affects topography [7], forming natural landscapes such as canyons and valleys, and influencing climate and the environment [8,9]. Therefore, areas rich in canyon winds are considered ideal locations for building sites.
According to the principles of the Form School, locations that contain the qi of yin and yang and harbor Feng Shui are selected to create a comfortable living environment. The Feng Shui layout used in the study conducted at the Bailudong Academy in Jiangxi Province references the above-mentioned Feng Shui theory. Therefore, it can be argued that the theory of canyon winds has a certain influence on the ancient Chinese people’s choices of location and layout for houses and tombs.
Traditional Chinese Feng Shui architecture is a discipline with a long history, encompassing a wide range of cultural and philosophical meanings. Despite the efforts of many enthusiasts, specialized research in this field is still in its nascent stage, requiring more experts and scholars to join in using scientific methods to explore the characteristics of ancient Feng Shui layouts. Existing research mainly focuses on ancient residential villages, classical Chinese gardens, and ancient cities, providing important clues for understanding the characteristics and meanings of traditional Chinese Feng Shui architecture. Researchers typically employ a combination of field experiments and simulation calculations to explore the physical environment inside and outside ancient buildings, delving into their characteristics and impacts. For example, Zhou et al. explored the philosophy behind the selection of traditional village sites using Feng Shui principles. They investigated 62 nationally designated traditional villages in China, showcasing the ecological wisdom of ancient Chinese people in creating favorable living environments [10]. Guo et al. conducted a study on the Gong Wang Mansion, a historical site renowned for its Feng Shui layout. Using a computational fluid dynamics (CFD) simulation, they verified that the Feng Shui layout optimized the airflow environment in the courtyard during the summer, thus demonstrating the ecological concepts of ancient Chinese people in house layouts [11]. Baratta, N.C. et al. employ modern archaeoastronomy and archaeological geomorphology; their study explores and compares the cognitive and symbolic aspects of the three “sacred landscapes of power” in the Ming dynasty, which include the re-planning of Nanjing, the unfinished Phoenix New Capital, and the construction of Beijing as the new capital. The study highlights how the astronomical alignments and the directions of terrain and magnetic fields, which are related to the “Form” and “Compass” schools of traditional Feng Shui, play a role in the perception and symbolism of these landscapes. The objective of this investigation is to make a valuable contribution towards safeguarding and enhancing the paramount cultural legacy of China. [12]. Using satellite imagery and paleomagnetic data analysis, Giulio Magli conducted a general study of traditional Chinese “Feng Shui” and developed a simple yet rigorous method for determining whether magnetic compasses were used in the planning of such monuments [13]. Li Tang et al. conducted a quantitative study on the wind environment surrounding the traditional residential settlement of Shanggantang village in China. They evaluated the interactions between settlement site selection, layout, landscape, and the surrounding environment and summarized the experience of sustainable urban planning to guide the creation of a sustainable modern living environment suitable for human habitation for centuries to come [14].
The existing studies have uncovered some of the remarkable characteristics of ancient Chinese architecture and provided a basis for future exploration in this area. Nevertheless, these studies are not exhaustive, and additional thorough research and discussions led by specialists and scholars are necessary to fully comprehend and preserve this invaluable cultural legacy.
Currently, in the academic community, computational fluid dynamics (CFD) simulation has been widely applied to study the physical environment of buildings at different scales, including urban, community, building unit, and its interior areas. This technology can conduct quantitative analysis of airflow dynamics around buildings, identify potential airflow issues such as turbulence, backflow, and local low-pressure areas, and provide valuable information for designers to optimize building design and energy utilization efficiency. Additionally, CFD simulation can also simulate issues such as pollutant dispersion, smoke movement, and thermal radiation, providing a scientific basis for evaluating building safety and comfort [15,16,17]. Kaihua Hu et al. analyzed the relationship between residential building density and wind environment in China. Computer simulations showed a negative correlation between building density and outdoor wind speed ratio and a positive correlation between building density and mean age of air. The results provide guidance for improving the wind environment in high-density residential areas [18]. Sumei Liu et al. investigated the influence of buildings on urban wind flow using wind information and CFD simulations. The study showed that the details of surrounding buildings are crucial for predicting wind flow and that simulations should use detailed building structures within a radius of at least three times the length scale of the target building. The results of the study can serve as a practical guide for predicting airflow around urban buildings [19]. Jie Zhongd and colleagues evaluated the thermal comfort of a renovated architecture project in Huizhou, China and found that the summer thermal comfort was not ideal due to slow wind speed and poor ventilation. The indoor thermal environment was simulated using CFD simulation technology, and the results showed that increasing the size of the wind outlet (patio opening) and the absolute difference in surface wind pressure at the new opening and the wind pressure of the existing openings could improve ventilation efficiency [20]. In summary, CFD simulation technology has unique advantages in the study of building wind environment, so this article will also use CFD simulation technology to study the winter wind environment of the Bailudong Academy complex.
The goal of this study is to compare the differences between Feng Shui layouts and layouts without Feng Shui principles and to explore the impact of Feng Shui layouts based on the Form School on the wind environment in courtyards. As outdoor activities in ancient China were mostly held in courtyards during winter, courtyard ventilation during this season is particularly important in ancient Chinese buildings. Both CFD simulations and on-site experiments in this study were conducted during winter. The study aims to combine CFD simulations and winter field experiments at the Bailudong Academy complex to validate the ecological wisdom of the ancient Chinese in academy complex layout and to explore the impact of Feng Shui layouts on courtyard wind environments.

2. Materials and Methods

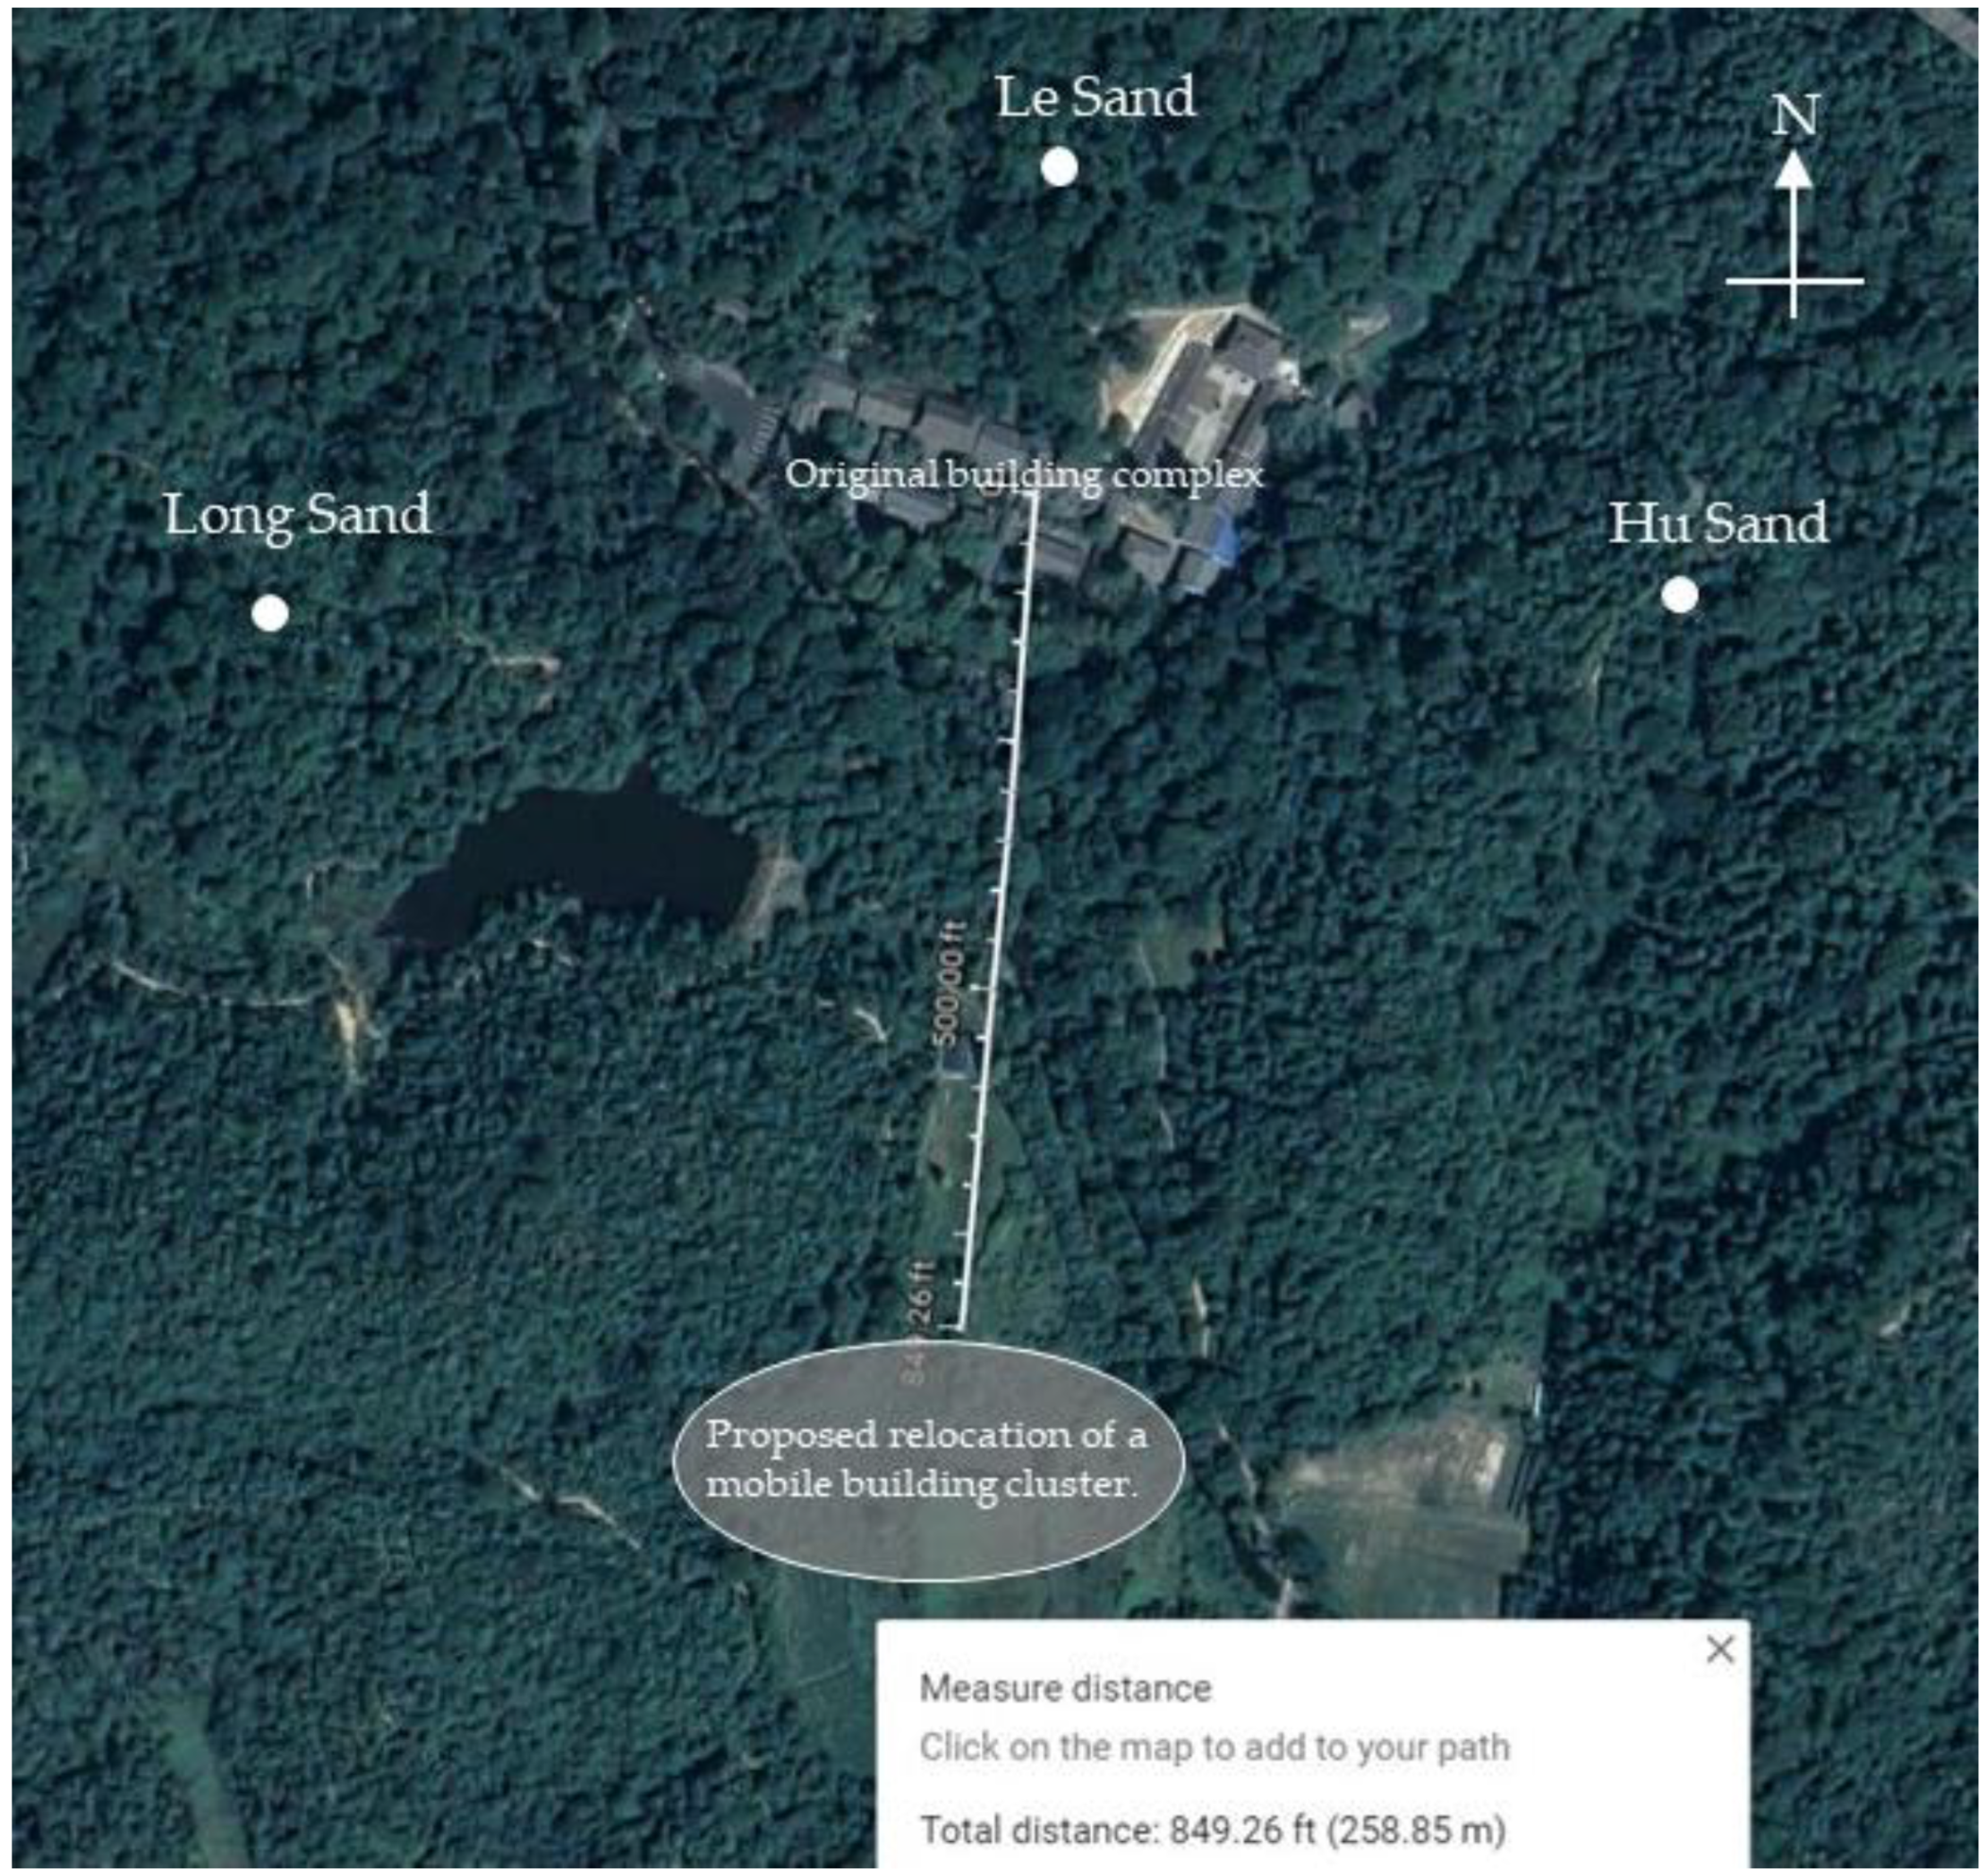
2.1. Research Objects: Bailudong Academy Complex Based on the Feng Shui Layout

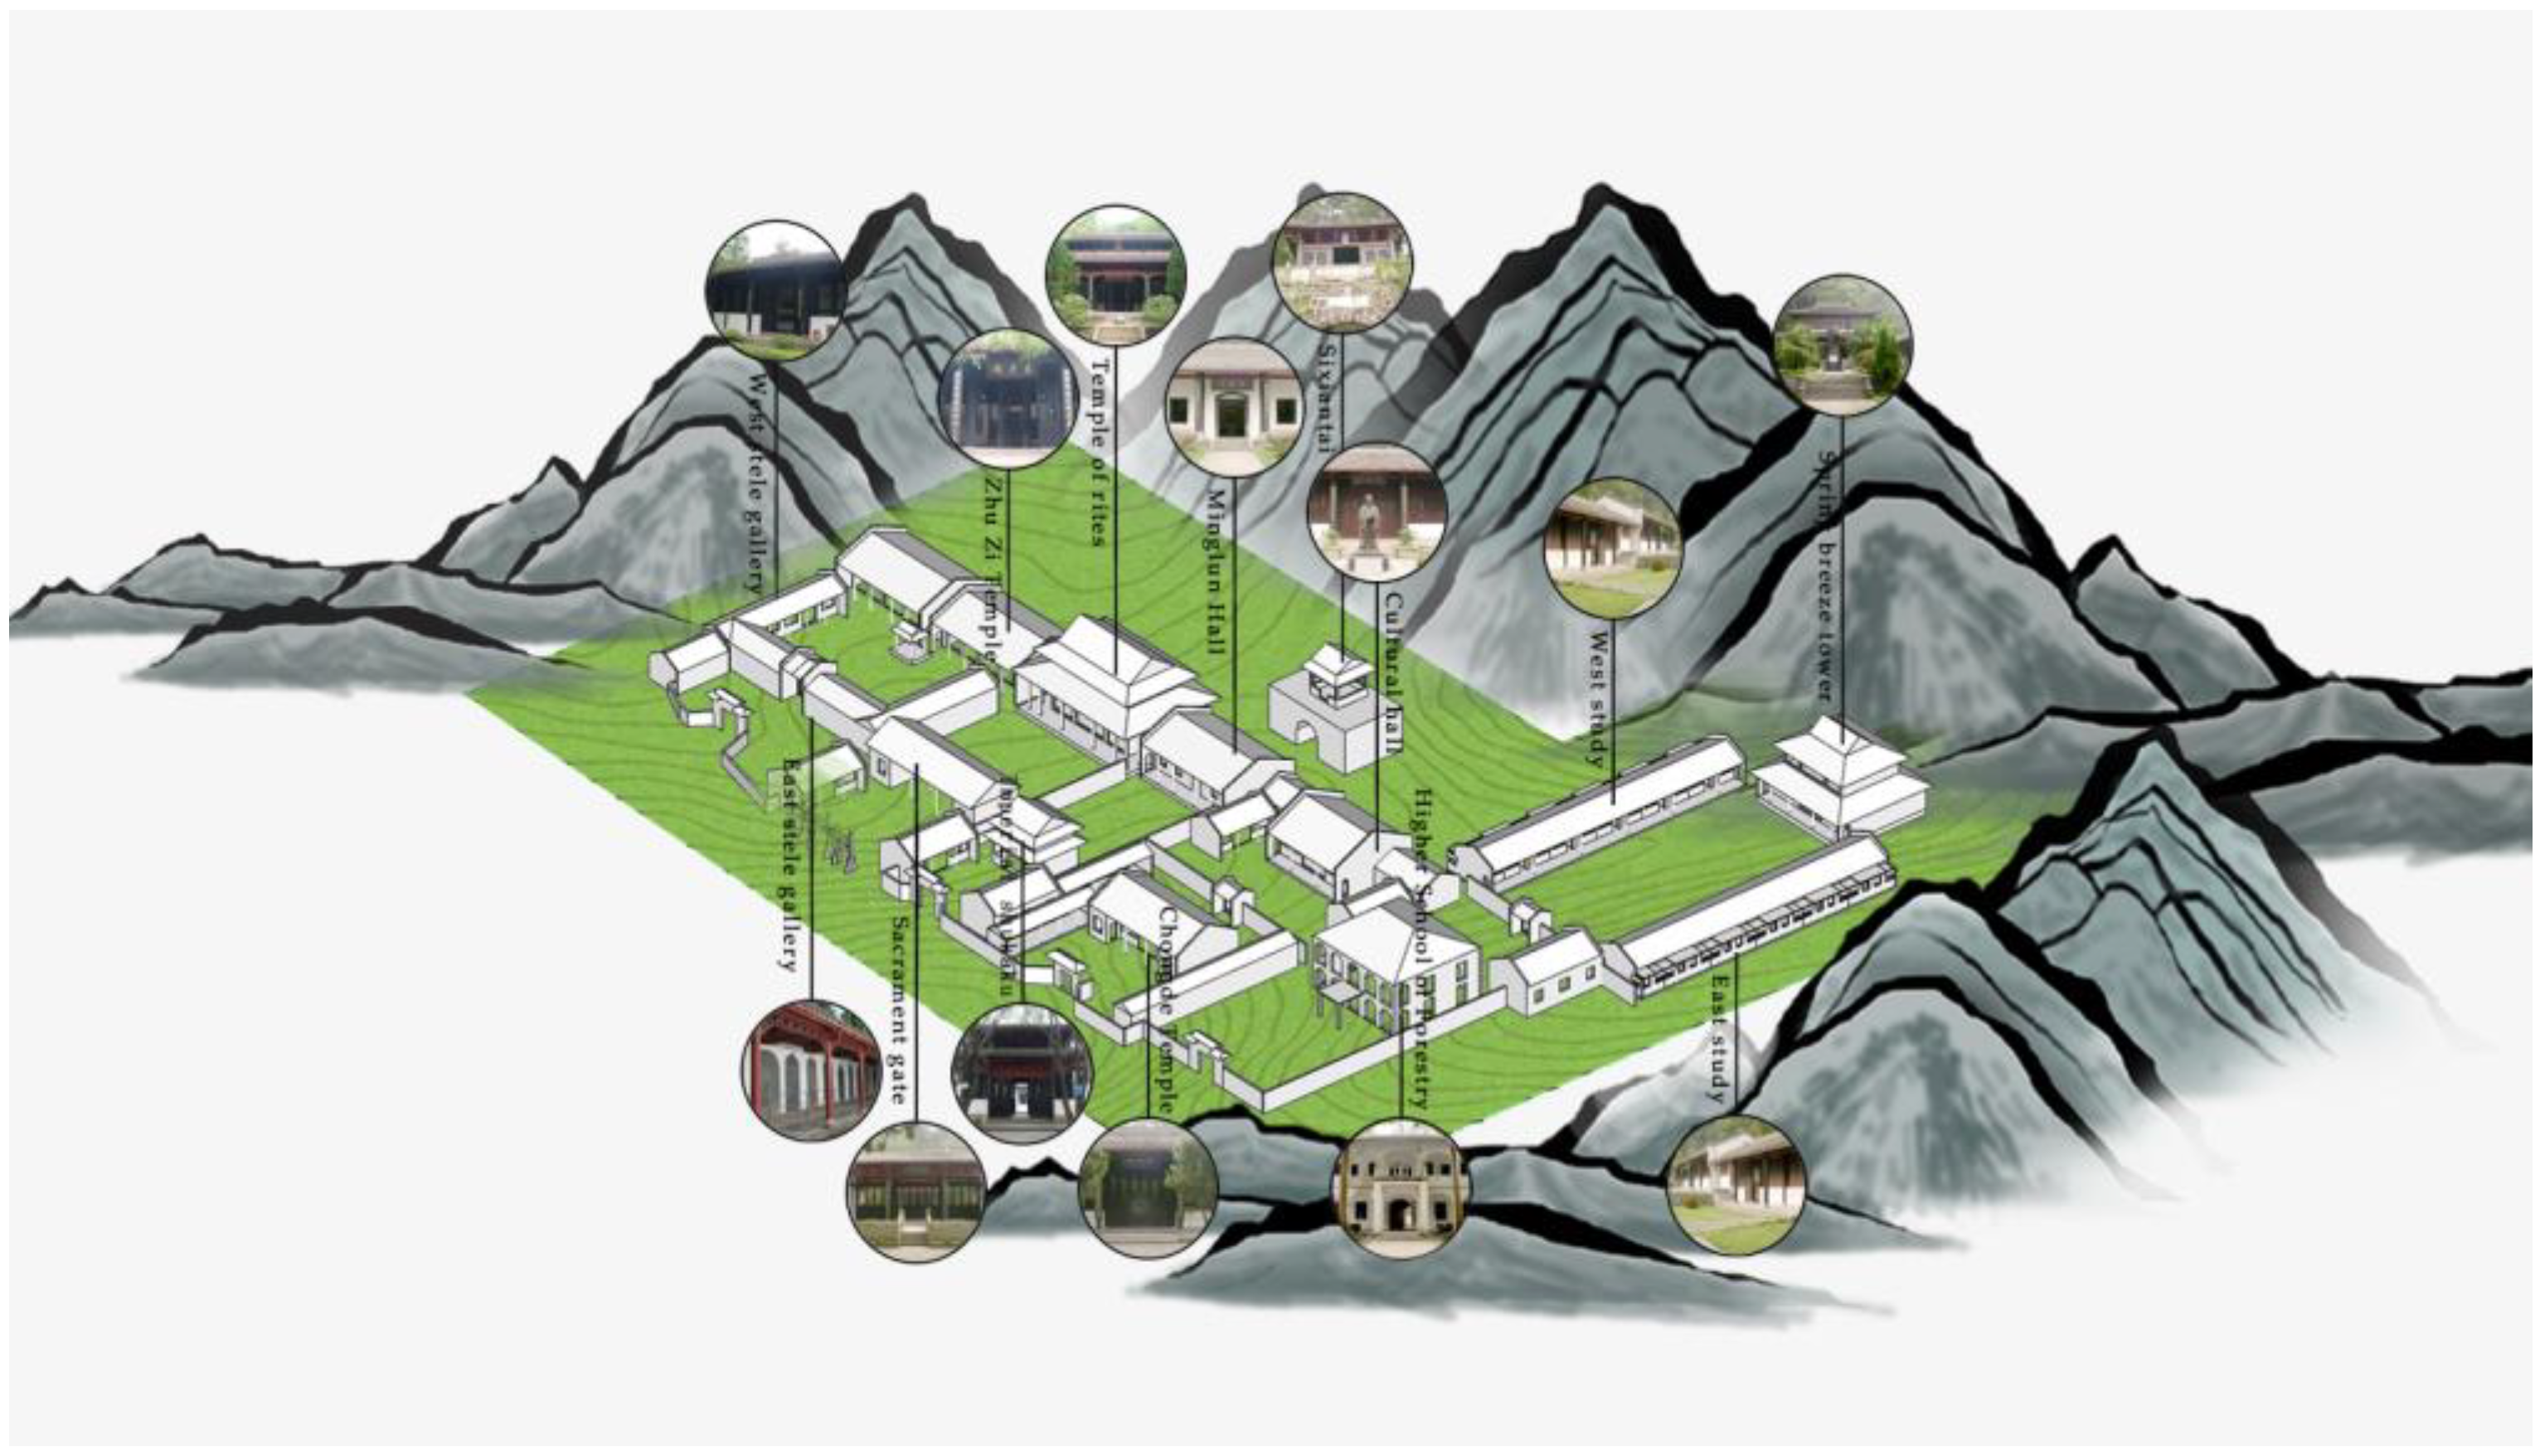
2.1.1. Bailudong Academy Complex

The Bailudong Academy complex is located at the southern foot of Wulao Peak in Lushan, Xingzi Country, Jiangxi Province (115°52′–116°8′ E, 29°26′–29°41′ N) (Figure 2) and is an ancient Chinese educational landmark with an elevation of approximately 260 m.
As shown in Figure 3, Jiangxi Province belongs to the third climatic zone in China [21], located south of the Yangtze River with a low latitude. It has a subtropical monsoon climate with abundant rainfall throughout the year and distinct seasonal variations, leading to complex and variable weather conditions. During the winter, cold air frequently affects the region, while the spring is characterized by convective weather. According to data provided by the local meteorological bureau, the average winter temperature in Lushan is about 3 °C, and the relative humidity is generally above 70%. Due to the influence of the northeast monsoon, the winter winds in Lushan are relatively strong, with an average speed of 2.5–4.1 m/s. Wind speeds may be lower in the valleys of Lushan, especially on the leeward side of the mountains. In addition, Lushan often experiences foggy and hazy weather during the winter, resulting in low visibility. These climatic characteristics can impact the winter wind environment of the architectural complex in Lushan.
The Bailudong Academy complex was established during the Tang Dynasty in the Zhenguan period (785–805 AD) and initially did not have the current scale and layout [22]. It officially became a school in the fourth year of the Southern Tang Dynasty’s Sheng-yuan era (940 AD) and reached its heyday during the sixth year of the Song Dynasty’s Chunxi era (1179) when Zhu Xi served as the magistrate of Nankang and restored the academy. Over the past thousand years, some of the buildings have been destroyed. Through restoration efforts from 1980 to 2016, the entire architectural complex has been restored to its original state.
The Bailudong Academy’s ancient architectural complex covers an area of about 13,000 square meters and consists of five courtyard groups (Figure 4), namely the Wenmiao group (1608 square meters), the Xianxian Academy group (1890 square meters), the Bailudong Academy group (1390 square meters), the Ziyang Academy group (2000 square meters), and the Yanbin Hotel group (4180 square meters), each of which has its unique features. The terrain gradually rises from south to north, and the architectural complex adopts a Long–Hu Sand layout.

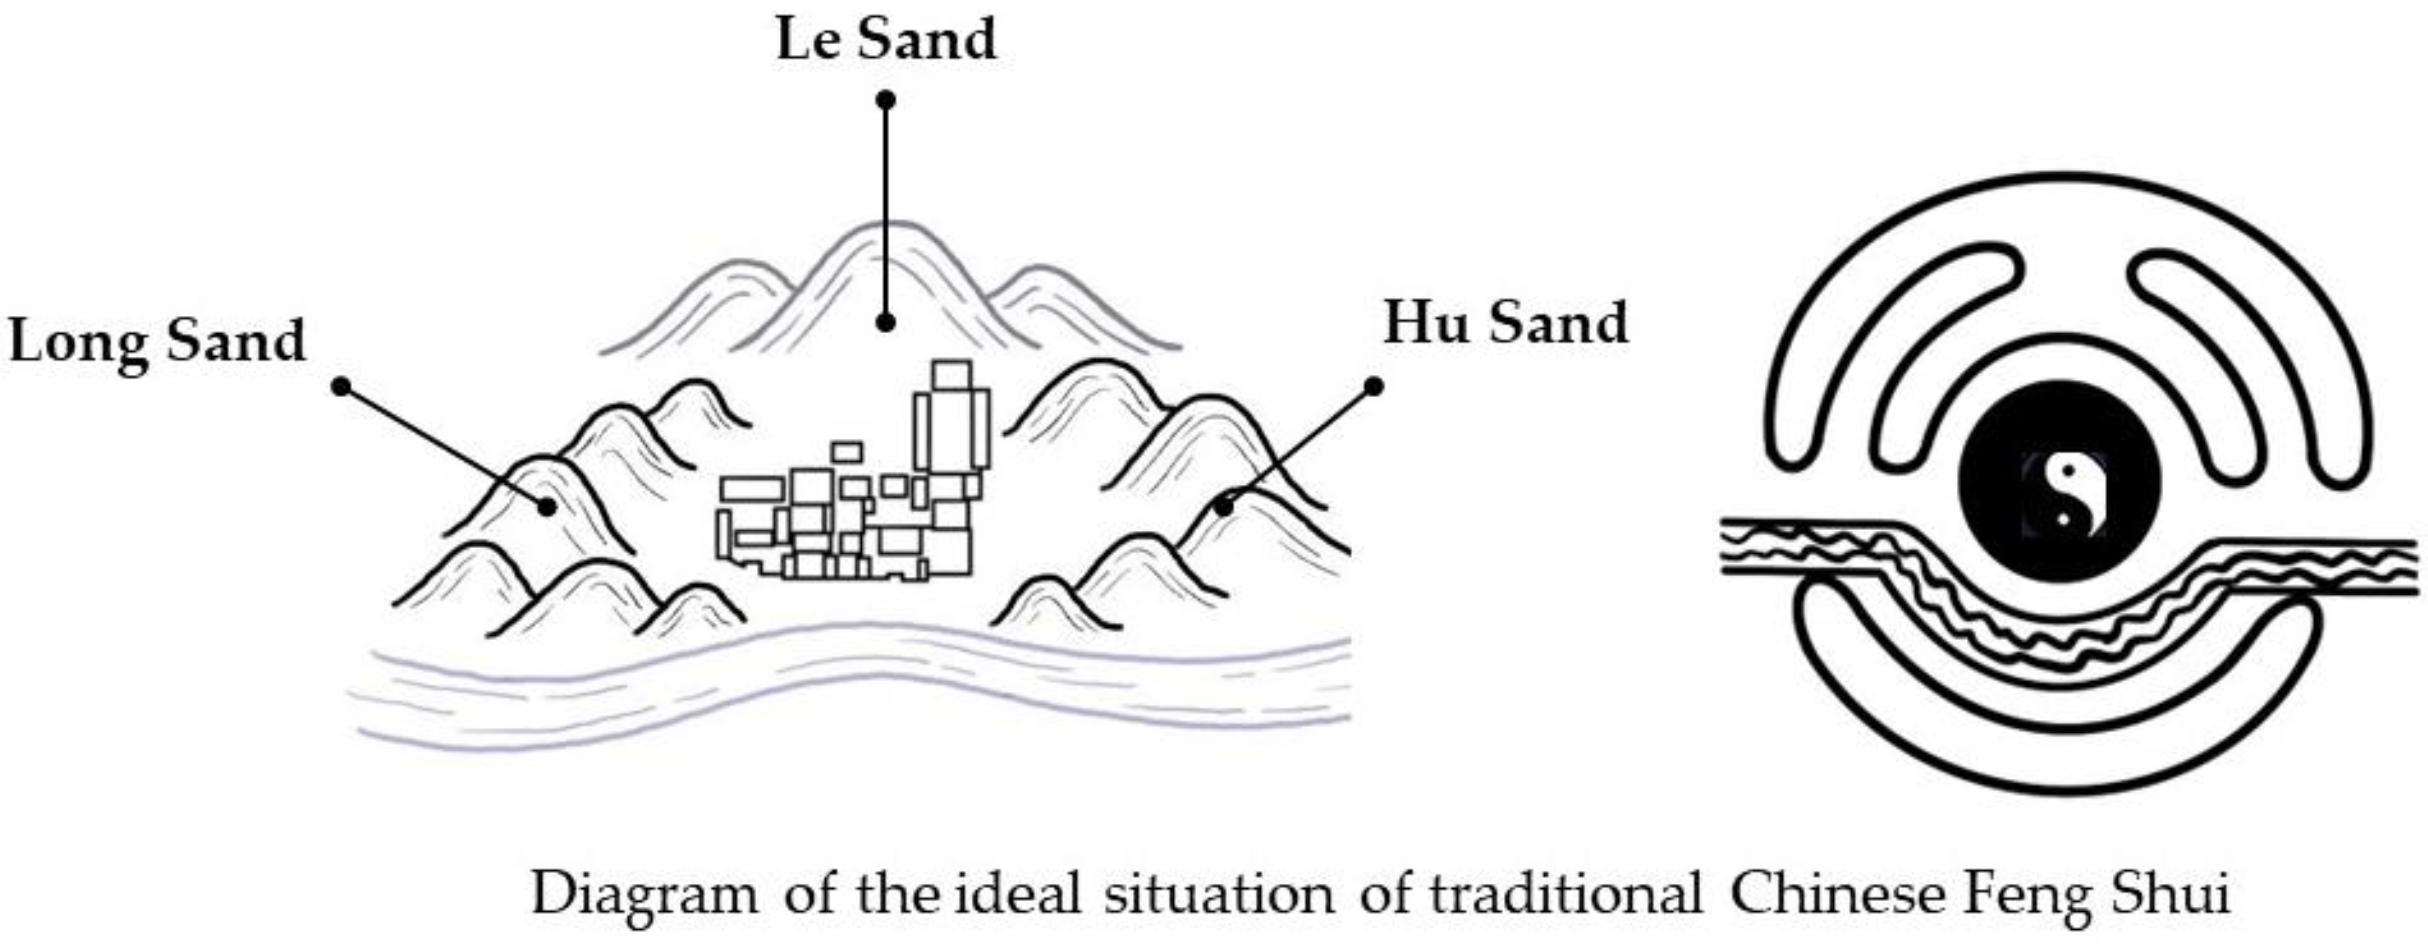
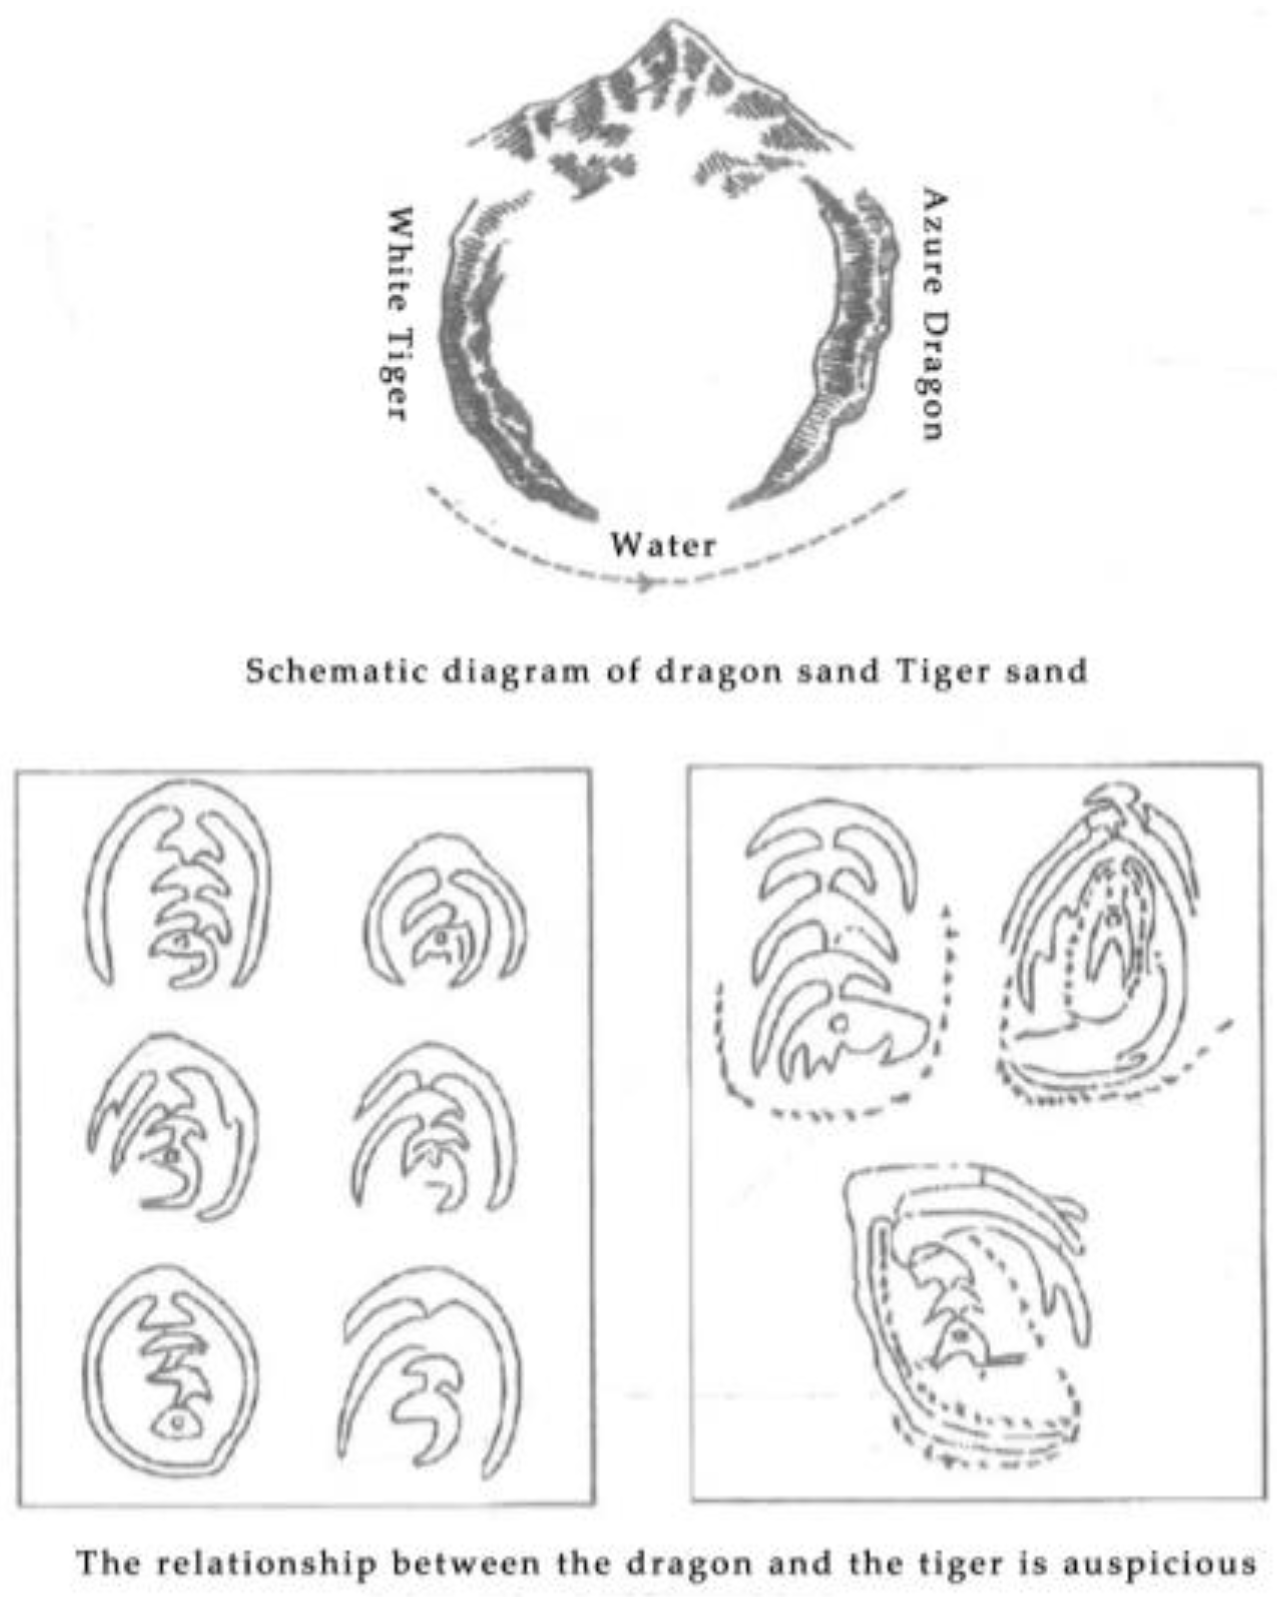
2.1.2. Feng Shui Layout of the Jiangxi Formal School

The architectural theory of Feng Shui of the Form School can be divided into two categories: the natural environment of the building, including terrain features such as the direction and trend of mountains, rivers, and streams, and the selection of the building site and its natural surroundings, as well as the form and layout of the building itself. The key principles of the theory are based on the “Five Geographic Elements,” which include finding the dragon, observing the sand, observing the water, pointing the cave, and observing the air, tasting the water, and identifying the soil and rocks. These five elements are considered the fundamental principles of Feng Shui. The scope of architectural Feng Shui of the Form School mainly involves four aspects: the outdoor environment of the building, the external form of the building, the internal form of the building, and the design scale and proportion of the building. This includes the presence of mountains behind the building, the presence of enclosures on the left and right sides, the presence of giant rocks blocking the way in front of the gate, or the presence of water flowing straight towards the building. The internal spatial design of the building also considers factors such as lighting and ventilation to ensure optimal functionality. The basic principles of architectural Feng Shui have remained relatively consistent throughout history.
The current study investigates the Long–Hu Sand pattern (Figure 5), which is a branch of the Form School of Feng Shui. Long–Hu Sand is primarily responsible for creating enclosed spaces, defining boundaries, and gathering wind and qi. Among the various sand patterns, Dragon Sand is located on the left side of the cavity and is also known as the upper sand, while Tiger Sand is situated on the right side and is referred to as the lower sand. These two sands play a critical role in the “air collection, wind blocking, and head structure” relationship, making them particularly essential to geomancers.
In “Xue Xin Fu Zheng Jie,” Menghao compared Long–Hu Sand to the two feet of “Mother Earth”. He stated that “the gathering cavity is like a human scrotum, and the dragon and tiger represent the two feet.” However, considering their actual position, it may be more comprehensive and accurate to regard them as the two legs of the earth. According to Feng Shui theory, the primary characteristics of Long–Hu Sand are their symmetrical placement on both sides of the mountain cavity, embracing each other like the winding of a green dragon and the taming of a white tiger. Various common Long–Hu Sand patterns are depicted in Figure 5. In Feng Shui, the most ideal and perfectly balanced pattern is the “Long–Hu Sand entity,” in which the Long–Hu Sands are symmetrically positioned and meet each other.

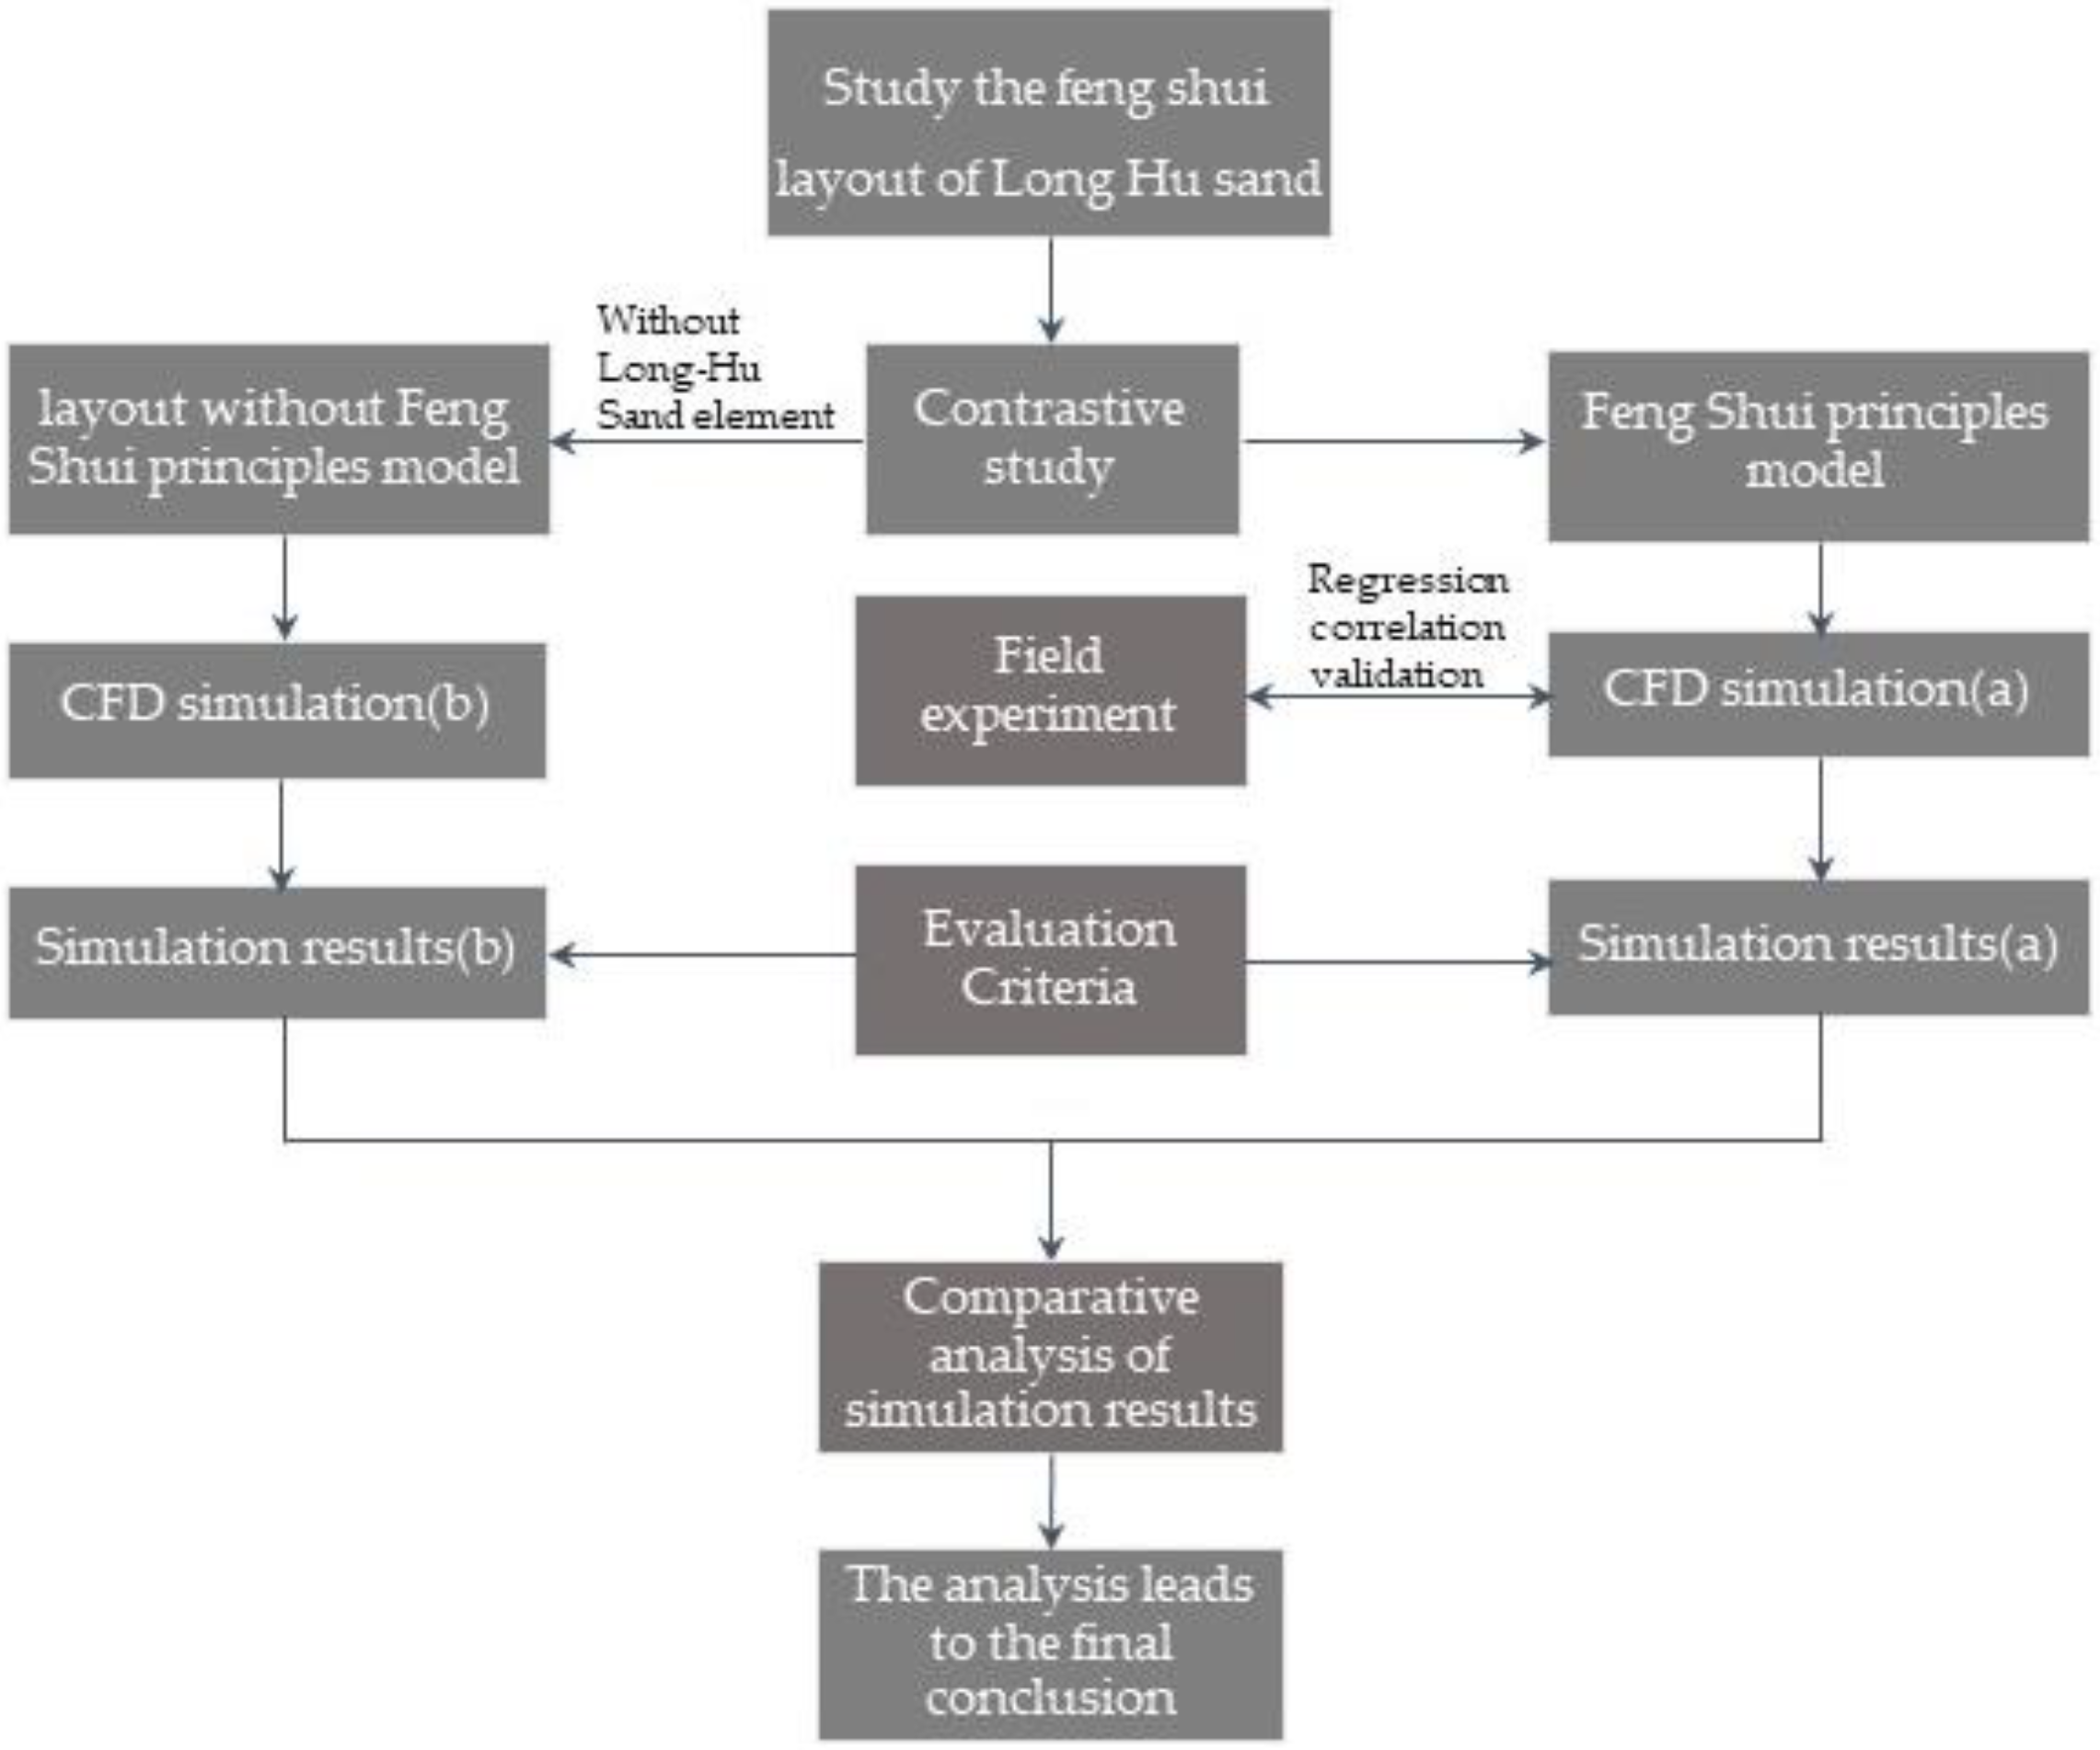
2.2. Research Methods

2.2.1. Contrastive Research Method

The focus of this study is on the Bailudong Academy, which exemplifies the typical Feng Shui pattern of the Chinese Mount Longhu. In addition, we proposed a layout pattern that does not follow the principles of Feng Shui, which we refer to as “Non-Feng Shui Layout.” We compared the courtyard performance of these two layouts under winter wind conditions. The non-Feng Shui layout is an improvement upon the original Feng Shui layout of Mount Long–Hu, as shown in Figure 6. The key difference between the two layouts is the elimination of Feng Shui elements by moving the Bailudong Academy building to a flat area approximately 849.26 feet (258.85 m) south of its original location. As a result, the Feng Shui pattern is eliminated.
To compare these two layouts, we used Sketchup software to create models based on the scientific principles of the Feng Shui and non-Feng Shui layouts. It is important to note that the comparison in this study was made between Feng Shui and non-Feng Shui layouts in the same geographic region with similar climatic characteristics and other factors. The only difference was the presence of Mount Long–Hu’s Feng Shui elements. We obtained on-site research data, including buildings and surrounding mountains, to ensure the accuracy of our models.
To meet the requirements of PHOENICS, detailed parts of Bailudong Academy, such as the support system between the column beams and colonnade, were omitted [23]. The focus was primarily on the courtyard relationships of the architectural complex. The model was then input into PHOENICS for CFD simulation calculations of both the Feng Shui layout and the layout without Feng Shui principles.

2.2.2. Field Experiment Method

The field tests conducted on 21 December 2022 aimed to investigate the coupling relationship between measured and simulated winter wind speeds in the Bailudong Academy complex. To obtain accurate wind speed measurements, a Kestrel 4500 handheld weather station from the United States was used as the measuring tool. The weather conditions during the field tests included cloudy skies, a northeast wind, temperatures ranging from 2 °C to 5 °C, and relative humidity ranging from 65% to 72%.
To ensure reliable results, the method of multiple people measuring multiple points simultaneously for a sufficient duration to obtain the average wind speed, as suggested by Guo, F. and Zhang, H et al. [24,25,26], was adopted. Six people simultaneously measured six different points in the same courtyard. Wind speed values were recorded every second for one minute, and the average value was taken as the measured wind speed at that time point. This method was repeated multiple times to obtain an accurate average value.
To cover a wide range of locations, the wind speeds were measured at 69 selected points in 12 groups within the Bailudong Academy complex (as shown in Figure 4). Each measurement value was the average wind speed at the selected point. The wind speed measurements were conducted from 8 a.m. to 5 p.m. to ensure that measurements were taken during different wind conditions and times of day. Overall, the field tests were conducted in a rigorous and systematic manner to obtain accurate and reliable wind speed measurements.

2.2.3. Research Framework

The research framework (Figure 7) employed mathematical analysis, comparative study, and field measurements to analyze the results of simulating the original layout and the two models of the Bailudong Academy complex, one with and one without Feng Shui characteristics. The CFD simulation results were used to represent the instantaneous wind speeds on site. Therefore, a coupling analysis was performed on the measured and simulated wind speeds to verify the reliability of the CFD simulation. The research framework of this study is shown in the figure below.

2.3. Evaluation Methods and CFD Simulation

2.3.1. Wind Environment Evaluation Methods in Winter

To ensure the scientific quality and practicality of the evaluation criteria, we referenced the Chinese green building evaluation system and previous research to develop the standards. The pursuit of sustainability and environmental friendliness in the green building standards shares many similarities with the concept of Feng Shui. The green building standards provide specific requirements and guidance for building design, making it a more scientific and systematic approach. Combining Feng Shui with green building can provide new ideas and solutions for sustainable development while preserving traditional cultural characteristics. Research has shown that integrating the design methods of green building standards and Feng Shui can improve energy efficiency, indoor environmental comfort, and the overall appearance of buildings [27,28]. This approach has a positive effect on the development of sustainable architecture. Therefore, this article explores the application value of combining Feng Shui concepts with green building standards in modern architectural design. In the evaluation of pedestrian wind environment, we adopted the data measured at 1.5 m [23,29] above ground level, which is a widely used standard in past research. In addition, we also considered the factor of wind pressure difference between the front and back of houses, which was established for better ventilation evaluation based on the Green Building Evaluation Criteria (GB/T 50378-2019, China) and the General Specification for Building Environment (GB 55016-2021, China). To prevent the infiltration of cold air during winter, it is recommended to ensure that the surface wind pressure difference between the windward and leeward sides of the building is not less than 0.5 Pa and not greater than 5 Pa.
When determining the proportion of the comfortable wind speed zone, low wind speed zone, and strong wind speed zone, we referred to the standards of Chen, L. [17] and Du, Y. as well as Ghasemi, Z et al. [30,31]. Finally, we comprehensively considered various factors and established four criteria for evaluating outdoor wind environments.
  • The ratio of the calm wind zone outdoors is the proportion of the area with wind speeds between 0 m/s and 0.5 m/s to the total evaluation area.
  • The ratio of comfortable outdoor wind speed zones in winter is the proportion of the area with wind speeds between 0.5 m/s and 2.0 m/s to the total evaluation area.
  • The ratio of strong outdoor wind speed zones in winter is the proportion of the area with wind speeds greater than 2.0 m/s to the total evaluation area.
  • The presence of vortexes or areas with high winds is also evaluated.
These evaluation criteria can provide guidance for the design and improvement of winter courtyards and help improve peoples’ perception of outdoor wind environment comfort [32] and quality of life [33].

2.3.2. Details of the PHOENICS-Based CFD Simulation

Understanding the wind environment around buildings is crucial for creating safe and comfortable living and working conditions for occupants in the field of building design and construction [34]. To achieve this goal, the use of computational fluid dynamics (CFD) software for numerical simulation has become a powerful tool for studying wind flow around buildings [35]. In this field, PHOENICS is a general CFD software developed by CHAM (Computational Fluid Dynamics International) for this purpose.
PHOENICS uses the finite volume method to solve equations for fluid flow, heat transfer, chemical reactions, and other phenomena [36], including the study of wind flow around buildings [37]. It also utilizes adaptive grid refinement technology to refine the computational mesh in complex or high-precision areas. This allows researchers to simulate the wind environment in different locations, such as residential communities, composite courtyards, and traditional villages. He, J. and Chen, Y. et al. investigated the relationship between spatial form and wind environment in the high-rise residential area of Heisha in Macao. Using the PHOENICS software, various wind fields were simulated to summarize the wind environment characteristics and propose corresponding control strategies, providing a theoretical and reference basis for urban construction and high-rise building planning [38]. Zhou, Z. and Deng, J. and their colleagues conducted a study selecting 62 traditional villages and using PHOENICS for CFD simulation to quantitatively analyze the wind and thermal environment of the villages based on wind direction and speed [10]. G Guo, P. and Ding, C et al. used the PHOENICS software to simulate the wind environment of the courtyard in the Prince Gong’s Mansion and compared and discussed the summer ventilation conditions of Feng Shui layout. The results showed that the PHOENICS software was suitable for simulating the courtyard wind environment in this study, and the Feng Shui layout optimized the courtyard wind environment in summer [11].
In summary, PHOENICS is suitable for outdoor wind environment simulation research, with accurate and reliable computation results. It plays an important role in improving the safety and comfort of the wind environment in buildings, providing detailed insights into the wind environment and enabling effective design of ventilation and cooling systems. Therefore, this study employs PHOENICS for CFD simulation. The CFD simulation settings and models are described below.
Model selection: The RNG k-ε turbulence model in PHOENICS software was used for simulation. The equations are shown in Equations (1) and (2).
( ρ k ) t + ( ρ k u i ) x i = x j ( α k η e f f k x j ) + G k + ρ ε
( ρ ε ) t + ( ρ ε v i ) x i = x j ( α ε η Δ f ε x j ) + C 1 s * ε k G k C 2 s ρ ε 2 k
wherein:
  • k represents turbulent kinetic energy;
  • ε represents turbulent dissipation rate.
In this study, we employed the PRESTOL discrete equations and the PHOENICS automatic PARSOL function setting to perform velocity–pressure coupled simulation. To enhance computational accuracy, we utilized a small-scale grid setting. The automatic convergence detection feature of PHOENICS ensured reasonable convergence of simulation results, achieving a convergence accuracy of 10−5 [39].
To set the grid of the simulation area, we divided it into a central area (fine grid), a mountainous area (medium grid), and a peripheral area without physical entities (coarse grid). The length, width, and height of the boundary were five times that of the model height, and the grid number was gradually increased based on software descriptions and researcher experience until the calculation error converged [40]. The grid sizes of different areas varied due to different computational accuracy requirements, as follows:
  • In the XY direction, the grid size of the central area of the study object was 1.5 m × 1.5 m, the grid size of the area surrounding the mountainous area was 3 m × 3 m, and the coarse grid size of the edge area without physical entities was 6 m × 6 m.
  • In the Z-axis direction, the grid size of the areas with and without buildings was set to 1 m and 3 m, respectively. An observation surface was added and the grid was densified at a height of 1.5 m to improve computational accuracy and simulation efficiency [41].
  • Along the wind inlet (Y and X axes), the grid segment size changed from coarse (6 m) to medium (3 m) to fine (1 m) and then back to coarse (6 m), depending on the required computational accuracy. The stretching ratio between the fine and coarse grid areas was 1.2, and the grid was contracted towards the building direction. There were total of 8.848 million grid segments (Figure 8).
We selected the winter average wind speed of 3.8 m/s (northeast wind) as the inflow boundary condition and set the boundary conditions based on the “Code for Design of Heating Ventilation and Air Conditioning of Civil Buildings” (GB50736-2012, China) and the on-site wind conditions of the Bailudong Academy architectural complex. The iteration number was set to 2500 [42], and due to the study object being located in a mountainous area, we chose the suburban ground roughness index [43].
Finally, we used CFD simulation in PHOENICS to extract the wind speed and pressure of two building models for analysis and comparison.

3. Results

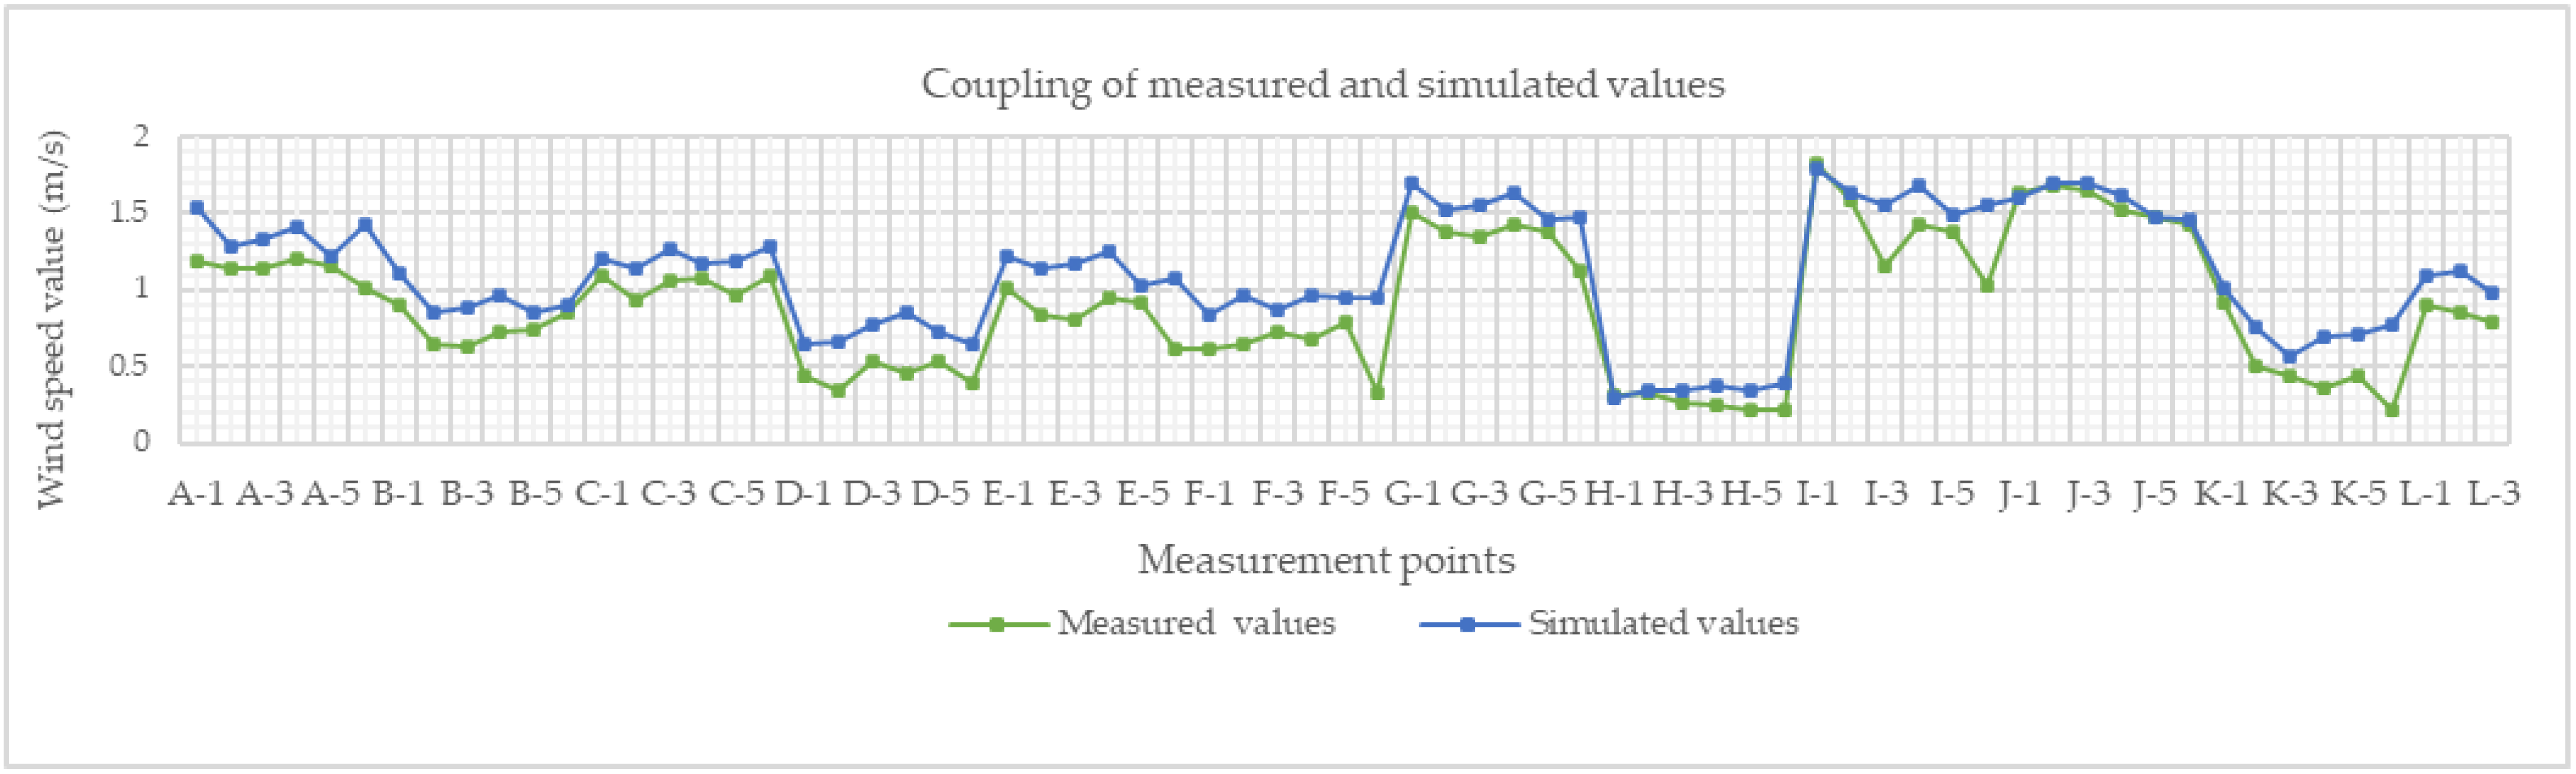
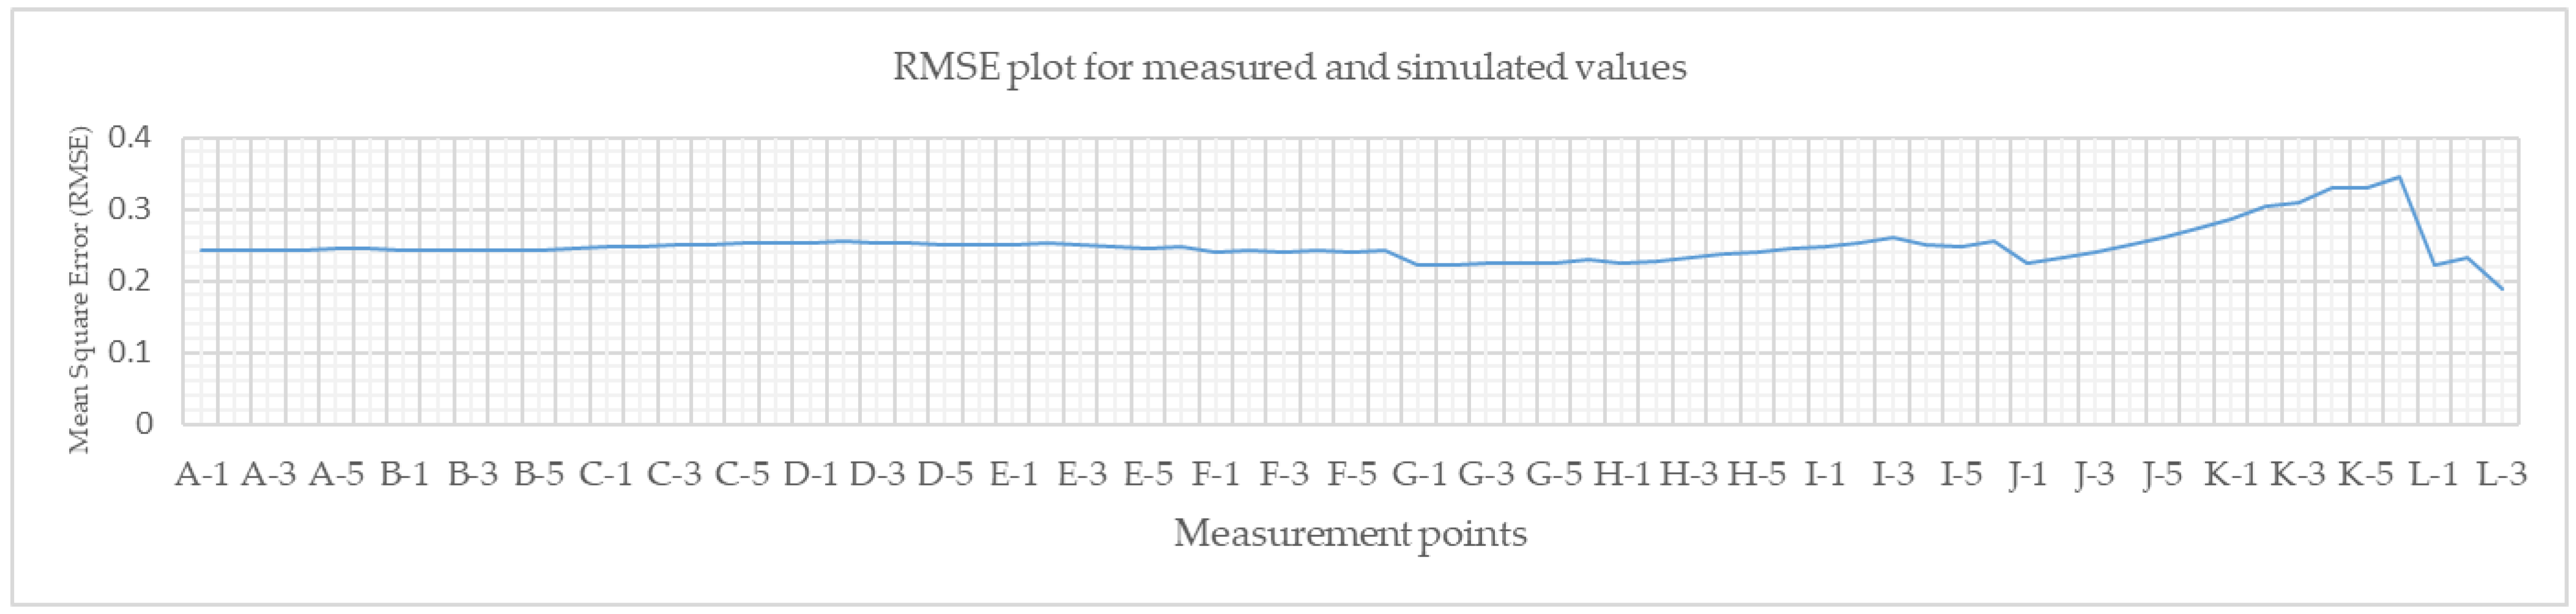
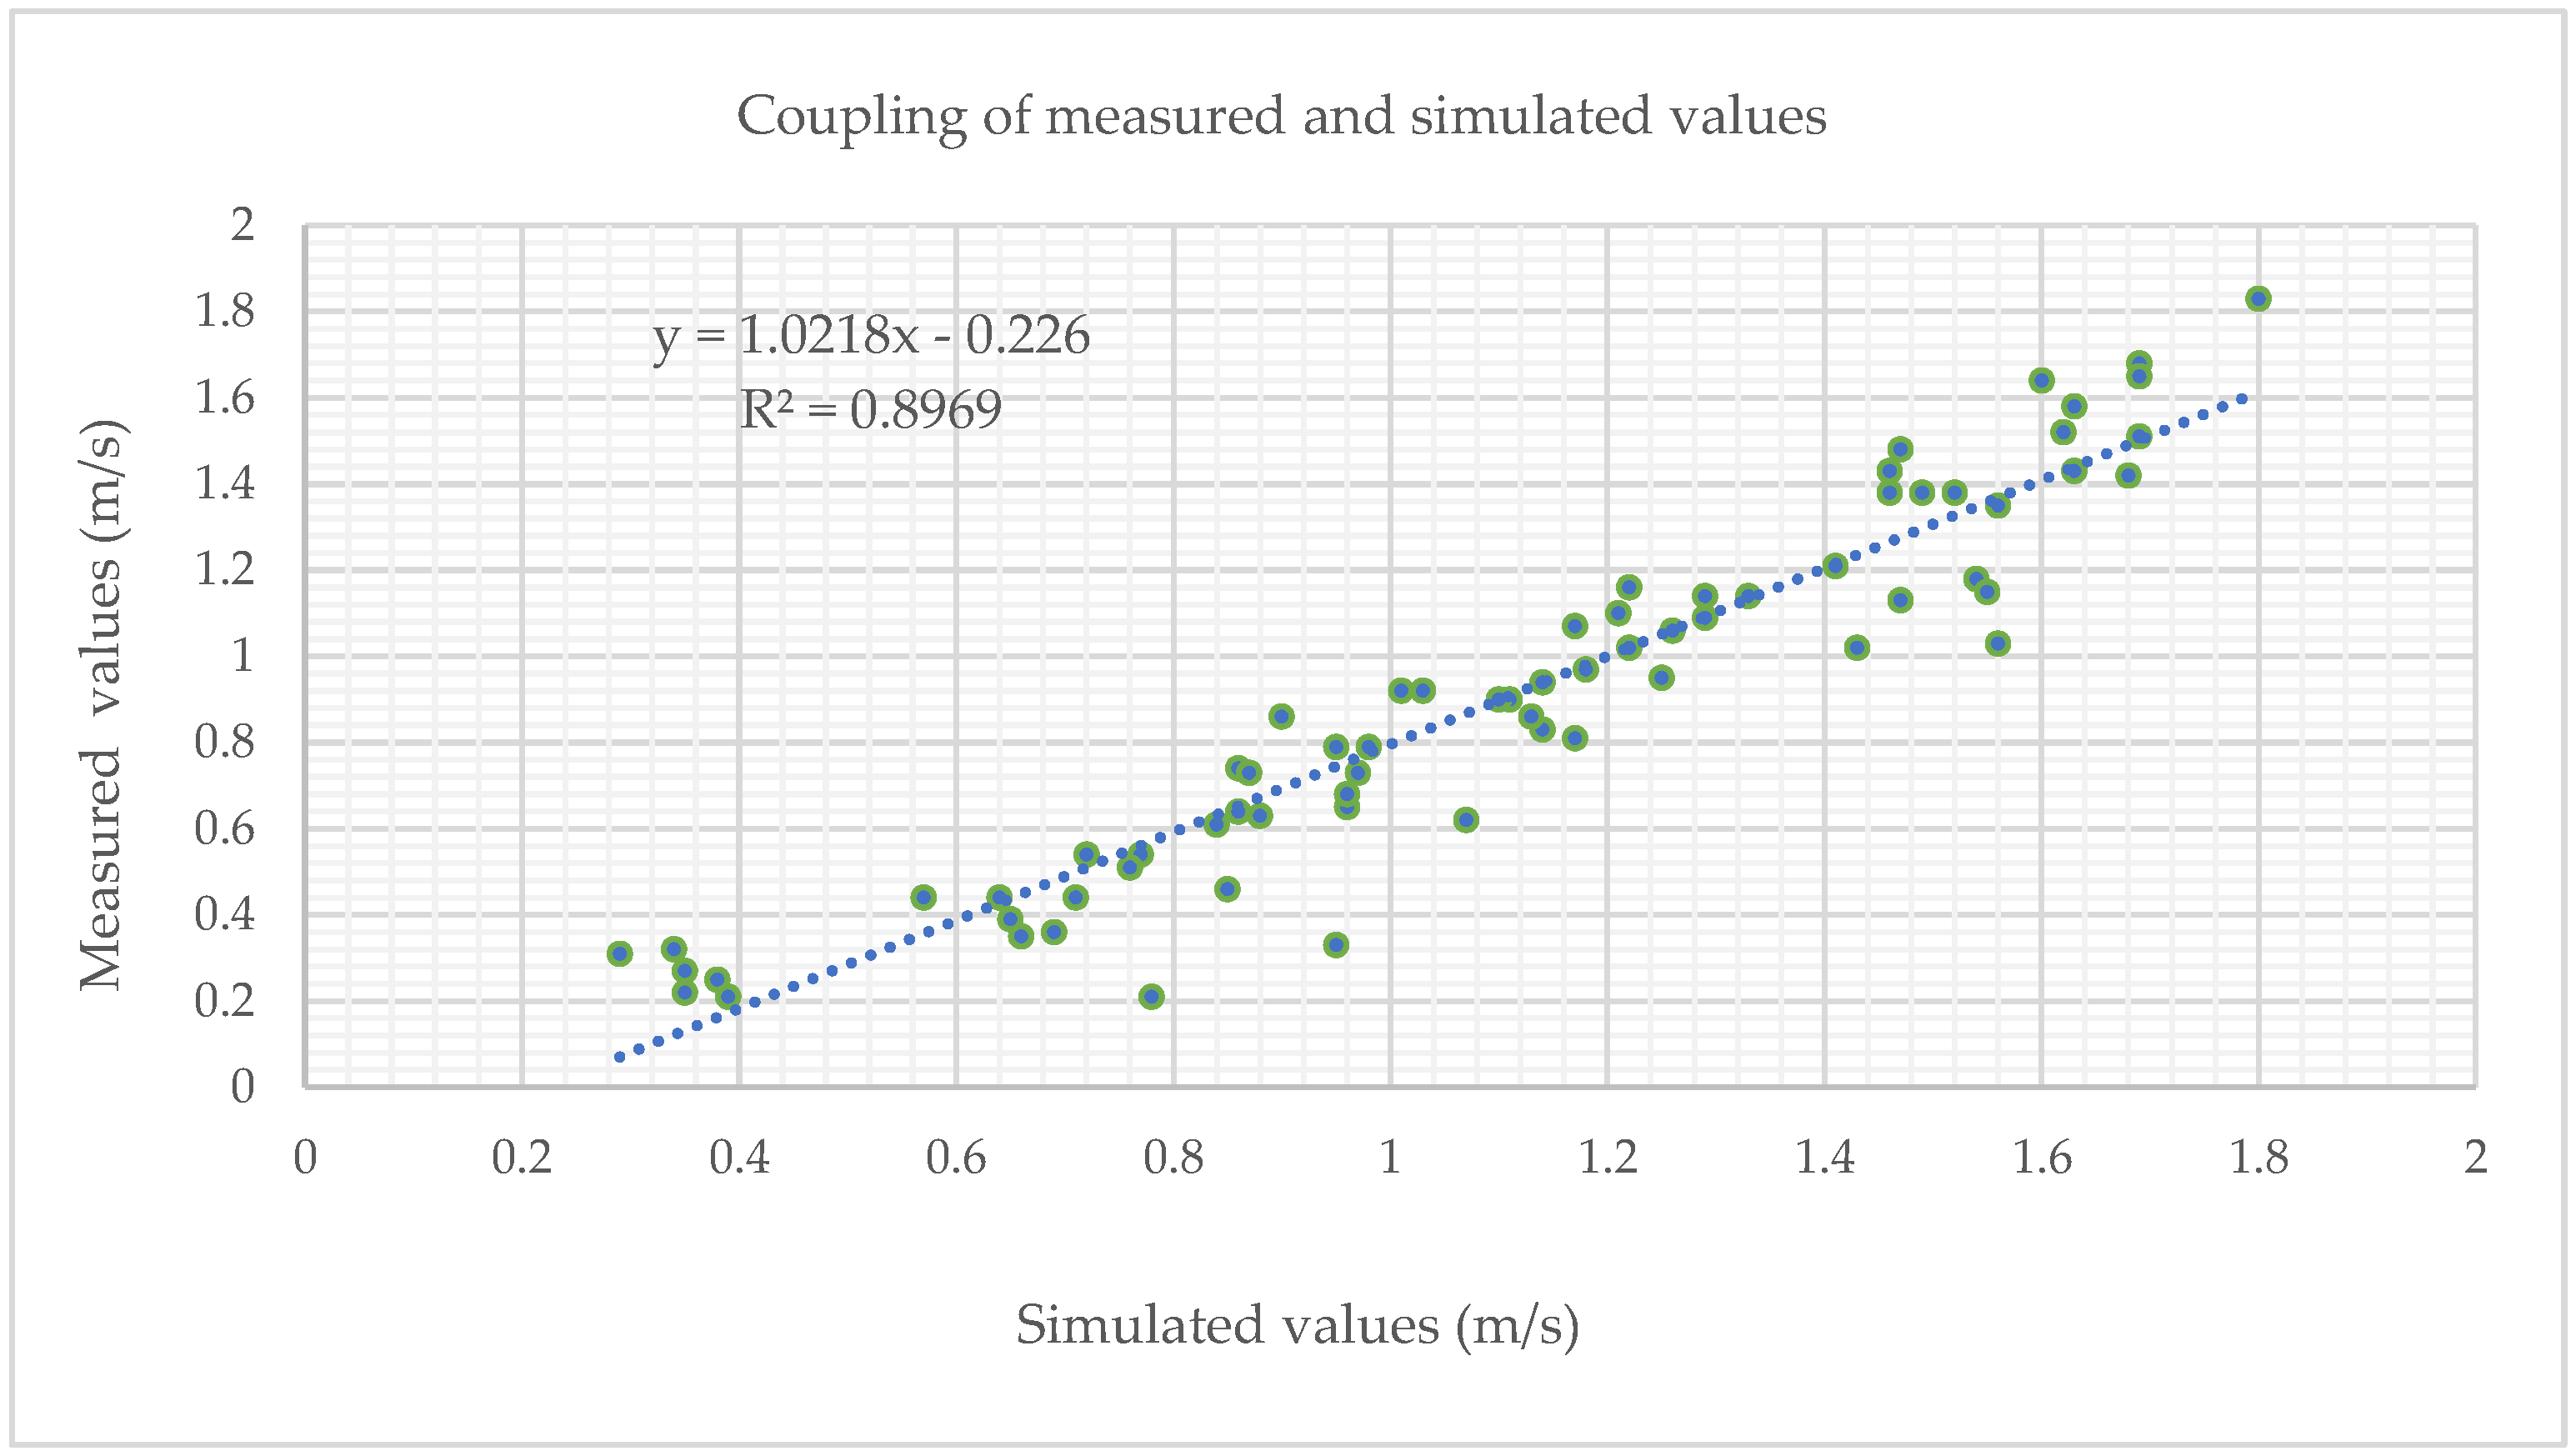
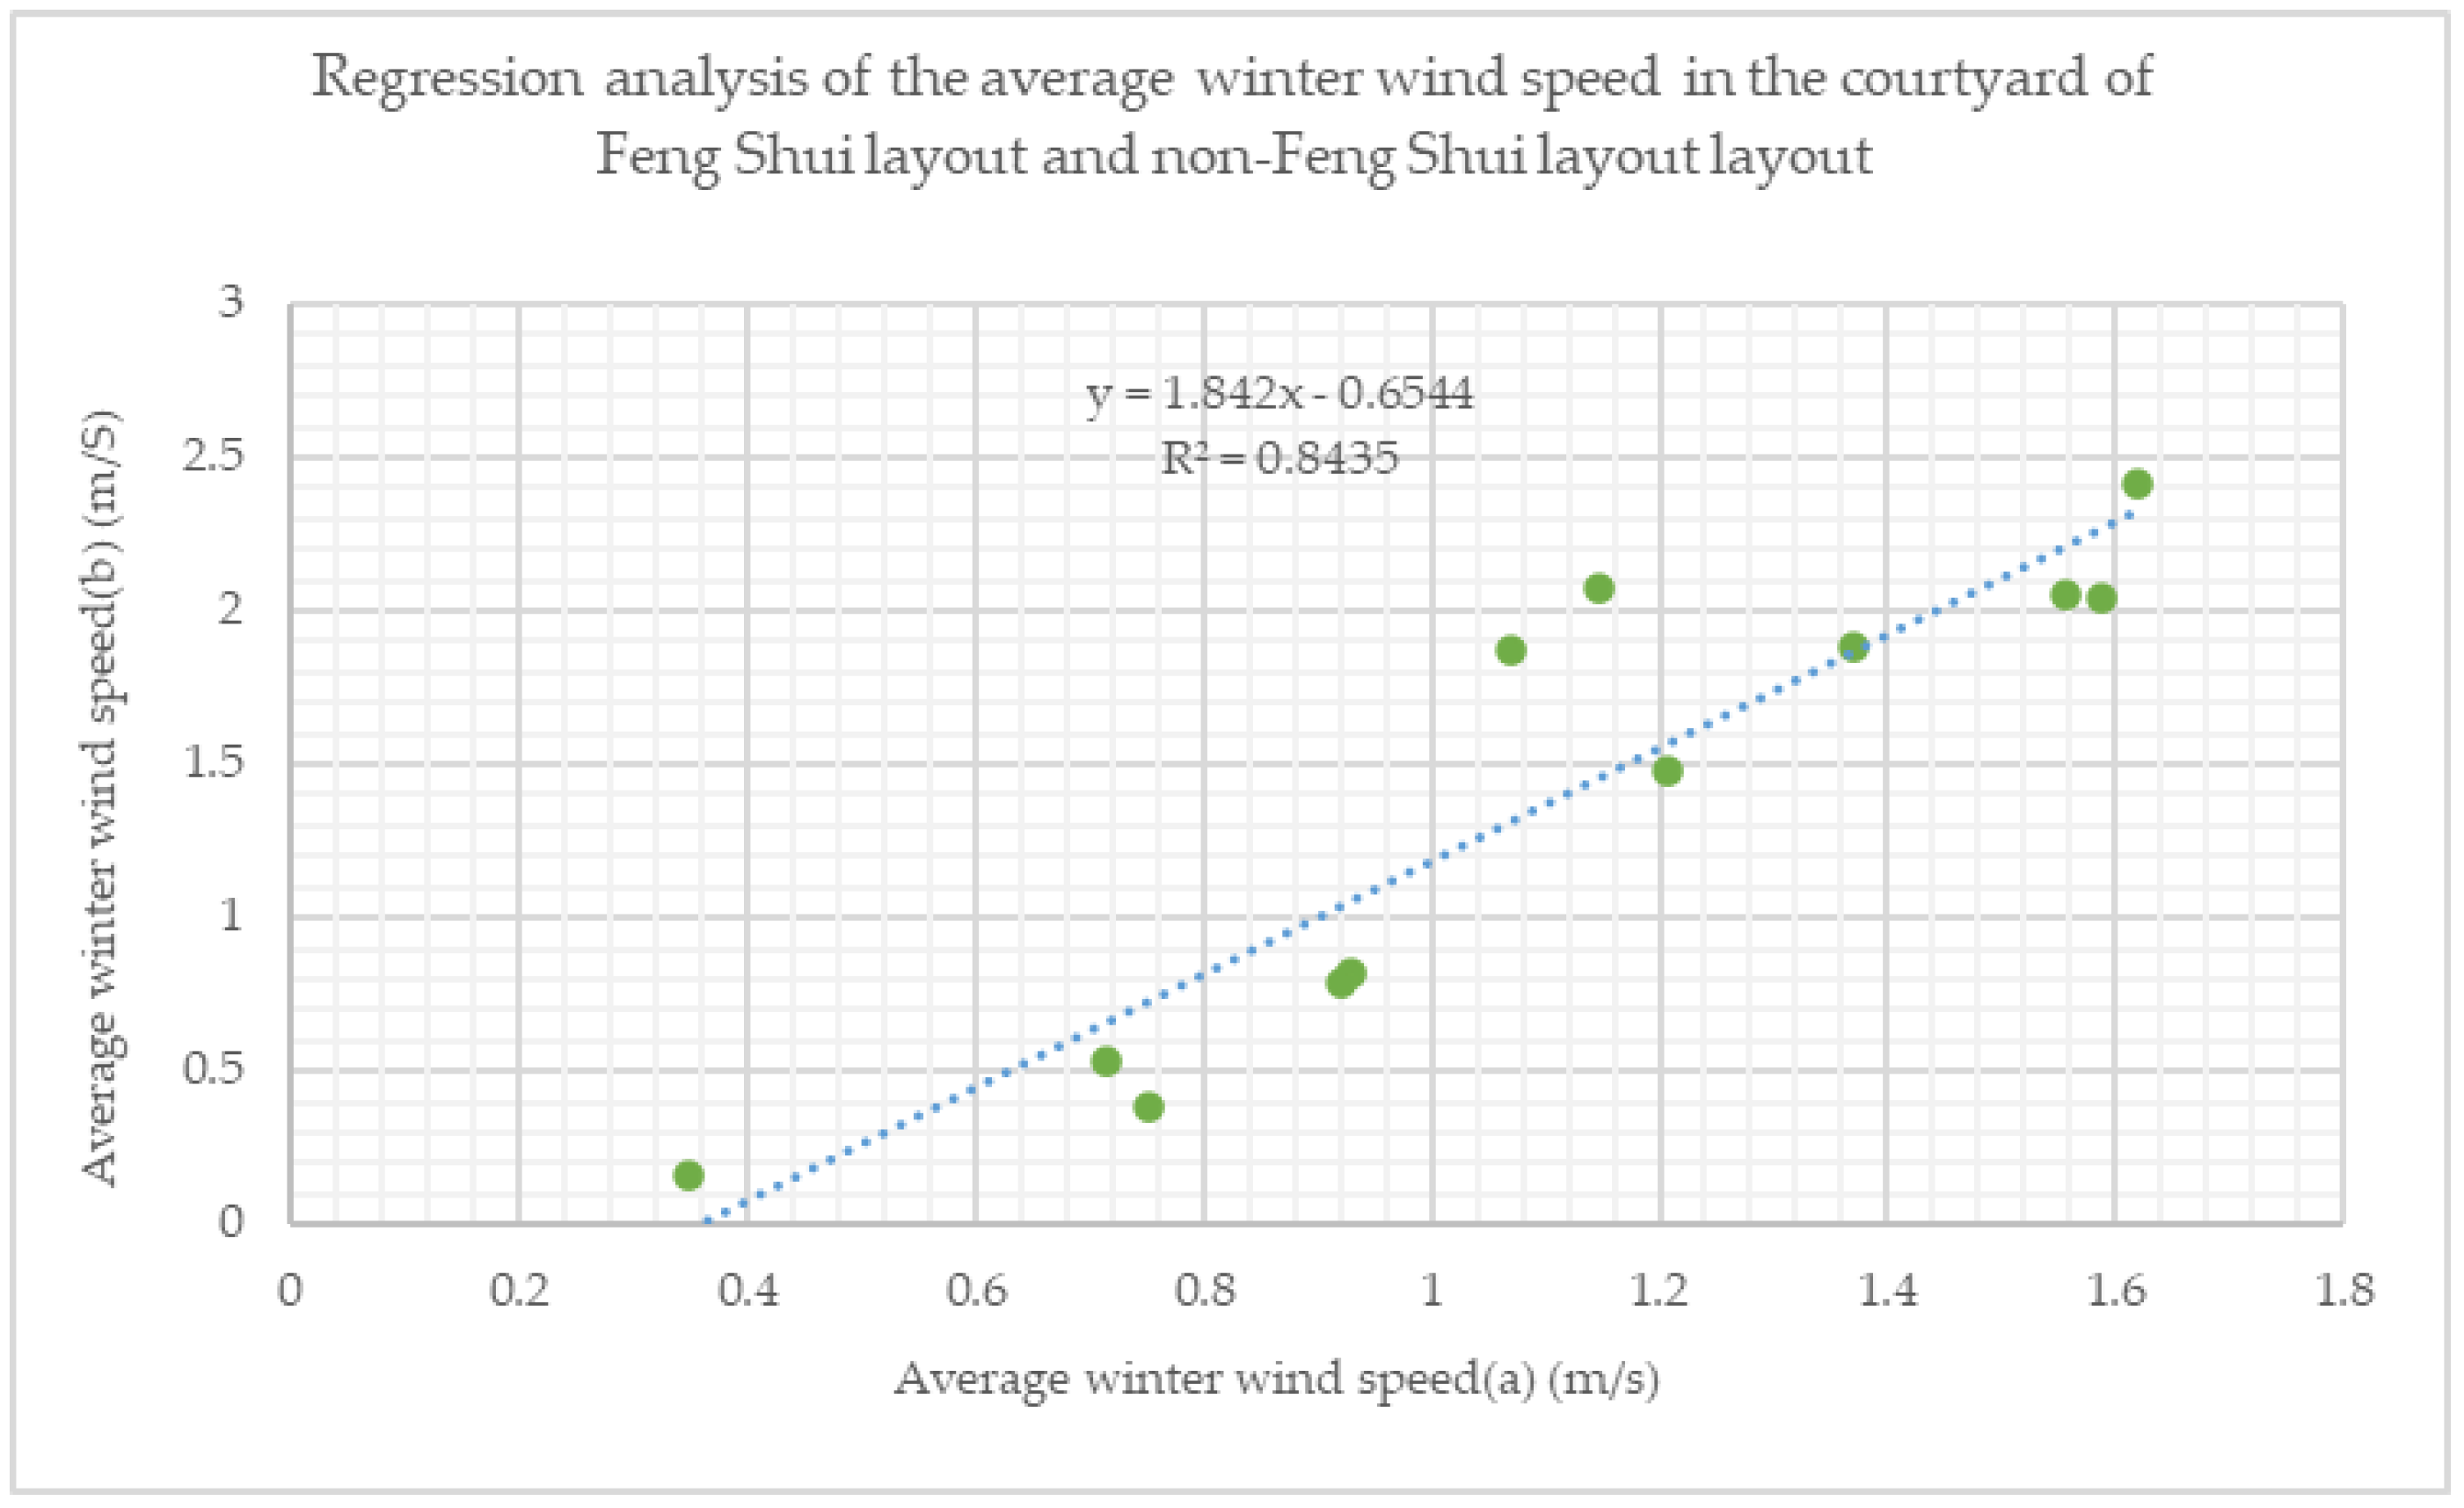
3.1. Coupling of Measured and Simulated Values

To combine CFD simulations with field experiments [44], we selected a specific point in the courtyard of the Bailudong Academy as the basis for our data. On a typical winter day, we obtained wind speed measurements from the field experiment at this specific point, while corresponding simulated values were obtained through CFD simulation. We then analyzed the measured and simulated values together. The courtyard that we studied consists of twelve areas, with six research points assigned to each of the eleven courtyards. Due to the smaller area in the rear courtyard of the Chongde Temple, only 3 research points were set up, for a total of 69 points. Our analysis of the measured and simulated values was based on these 69 points (Figure 9).
The measurement and simulation points are located in the same position and are identified on the plan of the Bailudong Academy as A-1-L-3, corresponding to the “Long–Hu Sand” Feng Shui layout investigated in this study. The specific values are shown in Figure 10.
In Figure 10, it is apparent that the maximum discrepancy between the simulated and measured wind speeds at point F-6 is 0.62 m per second. Among the three points (H-1, I-1, and J-1) where the measured wind speeds were greater than the simulated values, they were all located near the building’s air intake (the space between adjacent buildings) or entrance doors. In the case of the remaining 66 points, the simulated values were higher than the measured values.
To further analyze the relationship between the two variables in Figure 10, we employed Pearson [45] correlation analysis. As shown in Table 1, the simulated values and measured values exhibited a strong positive correlation with a correlation coefficient of 0.947.
Moreover, to ensure rigor, we also utilized Root Mean Square Error (RMSE) to verify the relationship between the simulated and measured values [46]. The results in Figure 11 indicated that the RMSE values for the measurement points ranged from 0.19 to 0.34, suggesting that the model is capable of accurately predicting the data.
A linear relationship exists between the measured and simulated values, as demonstrated by the numerical values in Figure 12, with a regression equation of y = 0.87x. The regression equation indicates that the measured value is 0.87 times the simulated value. The R2 value on the regression analysis chart is 0.8969.

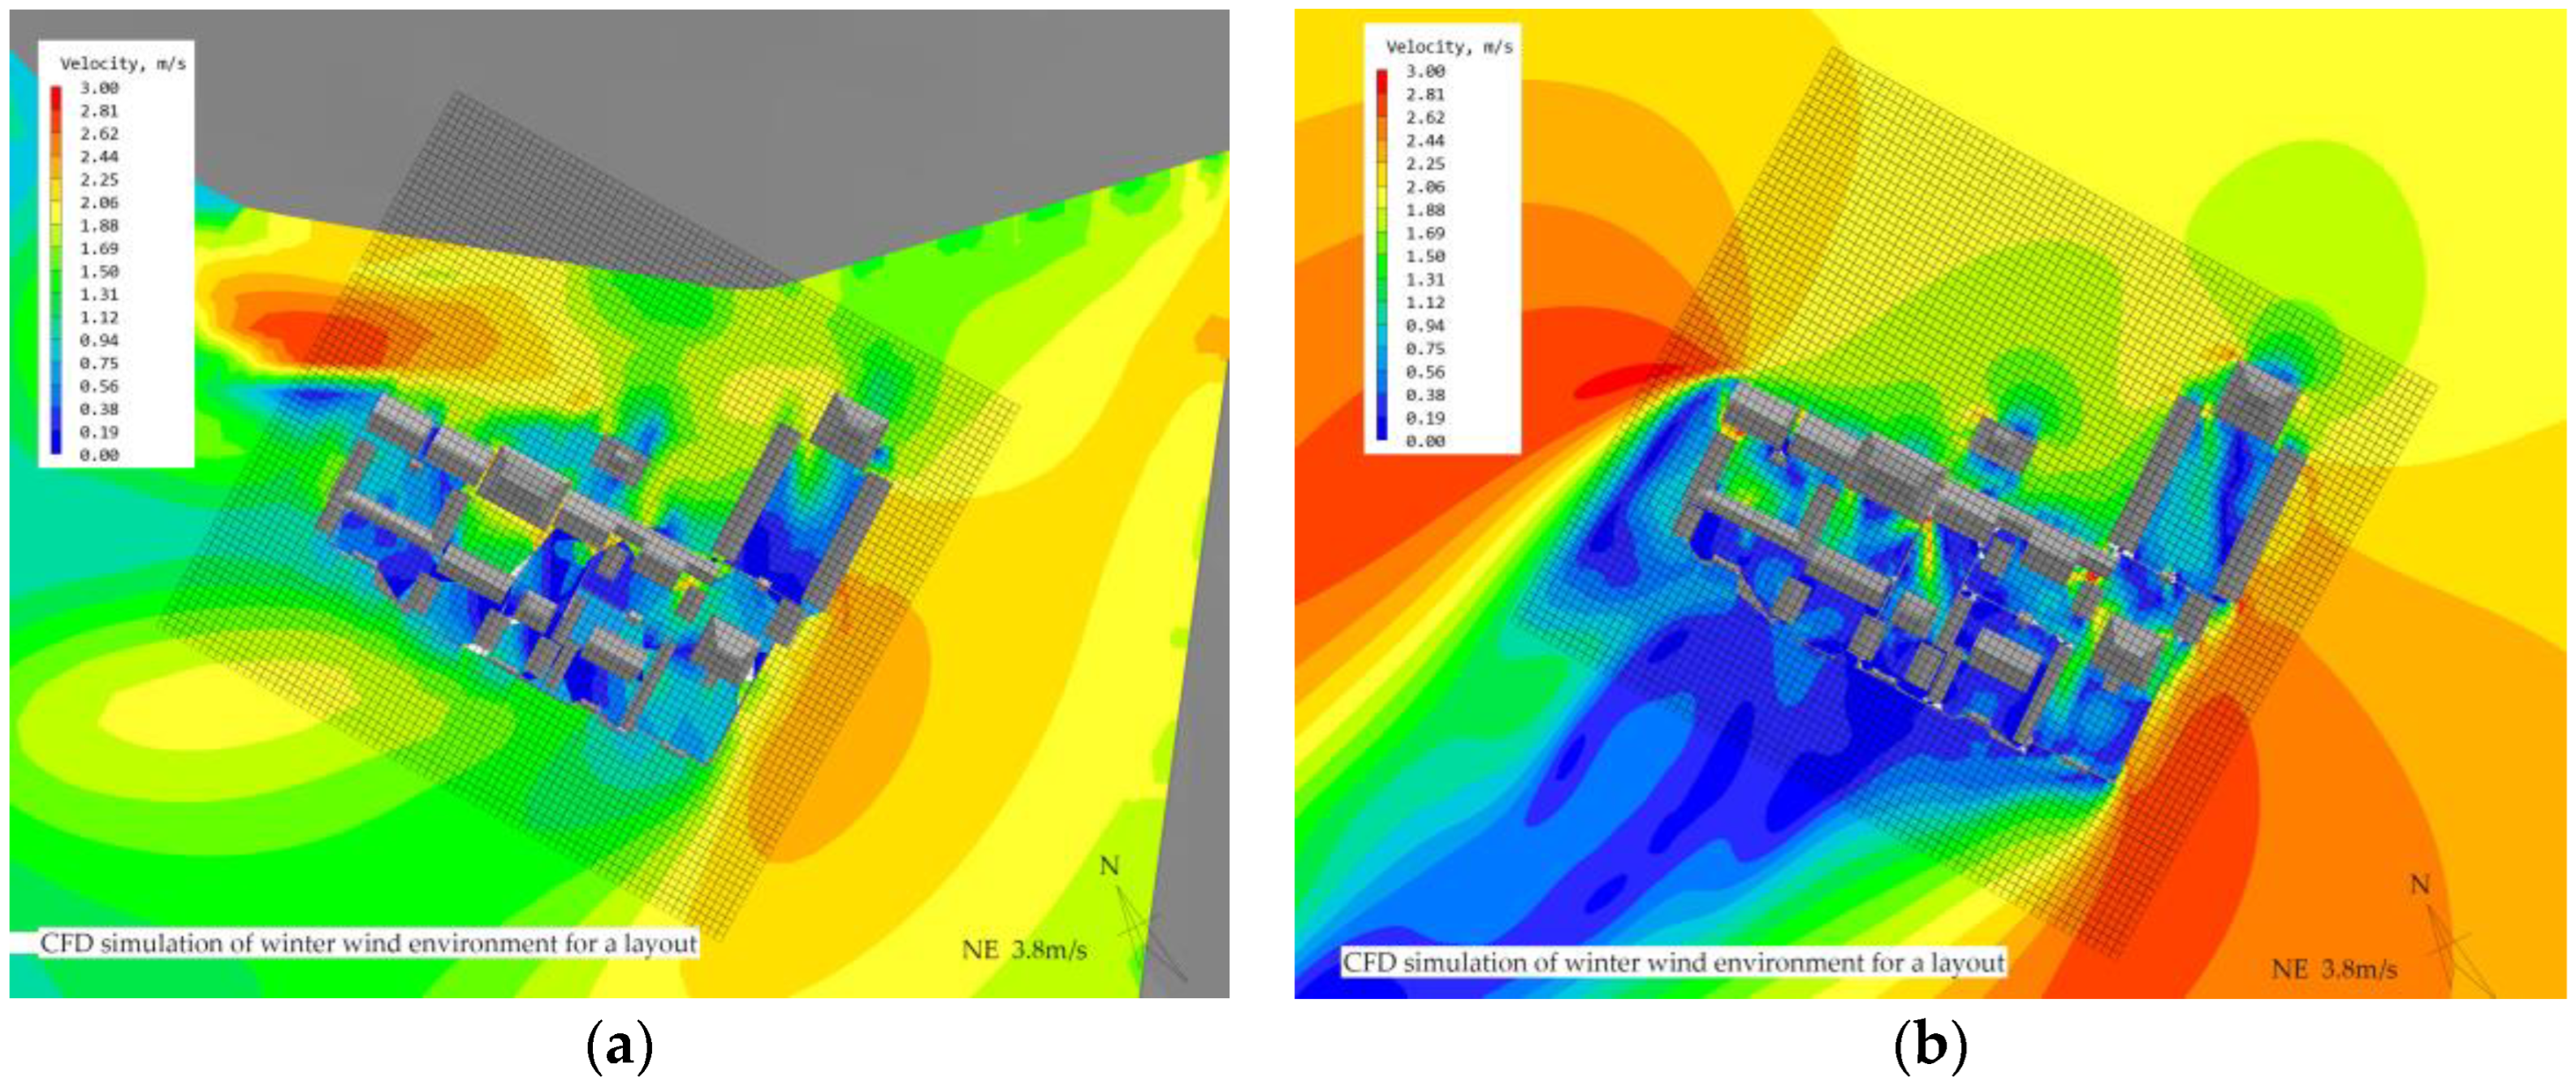
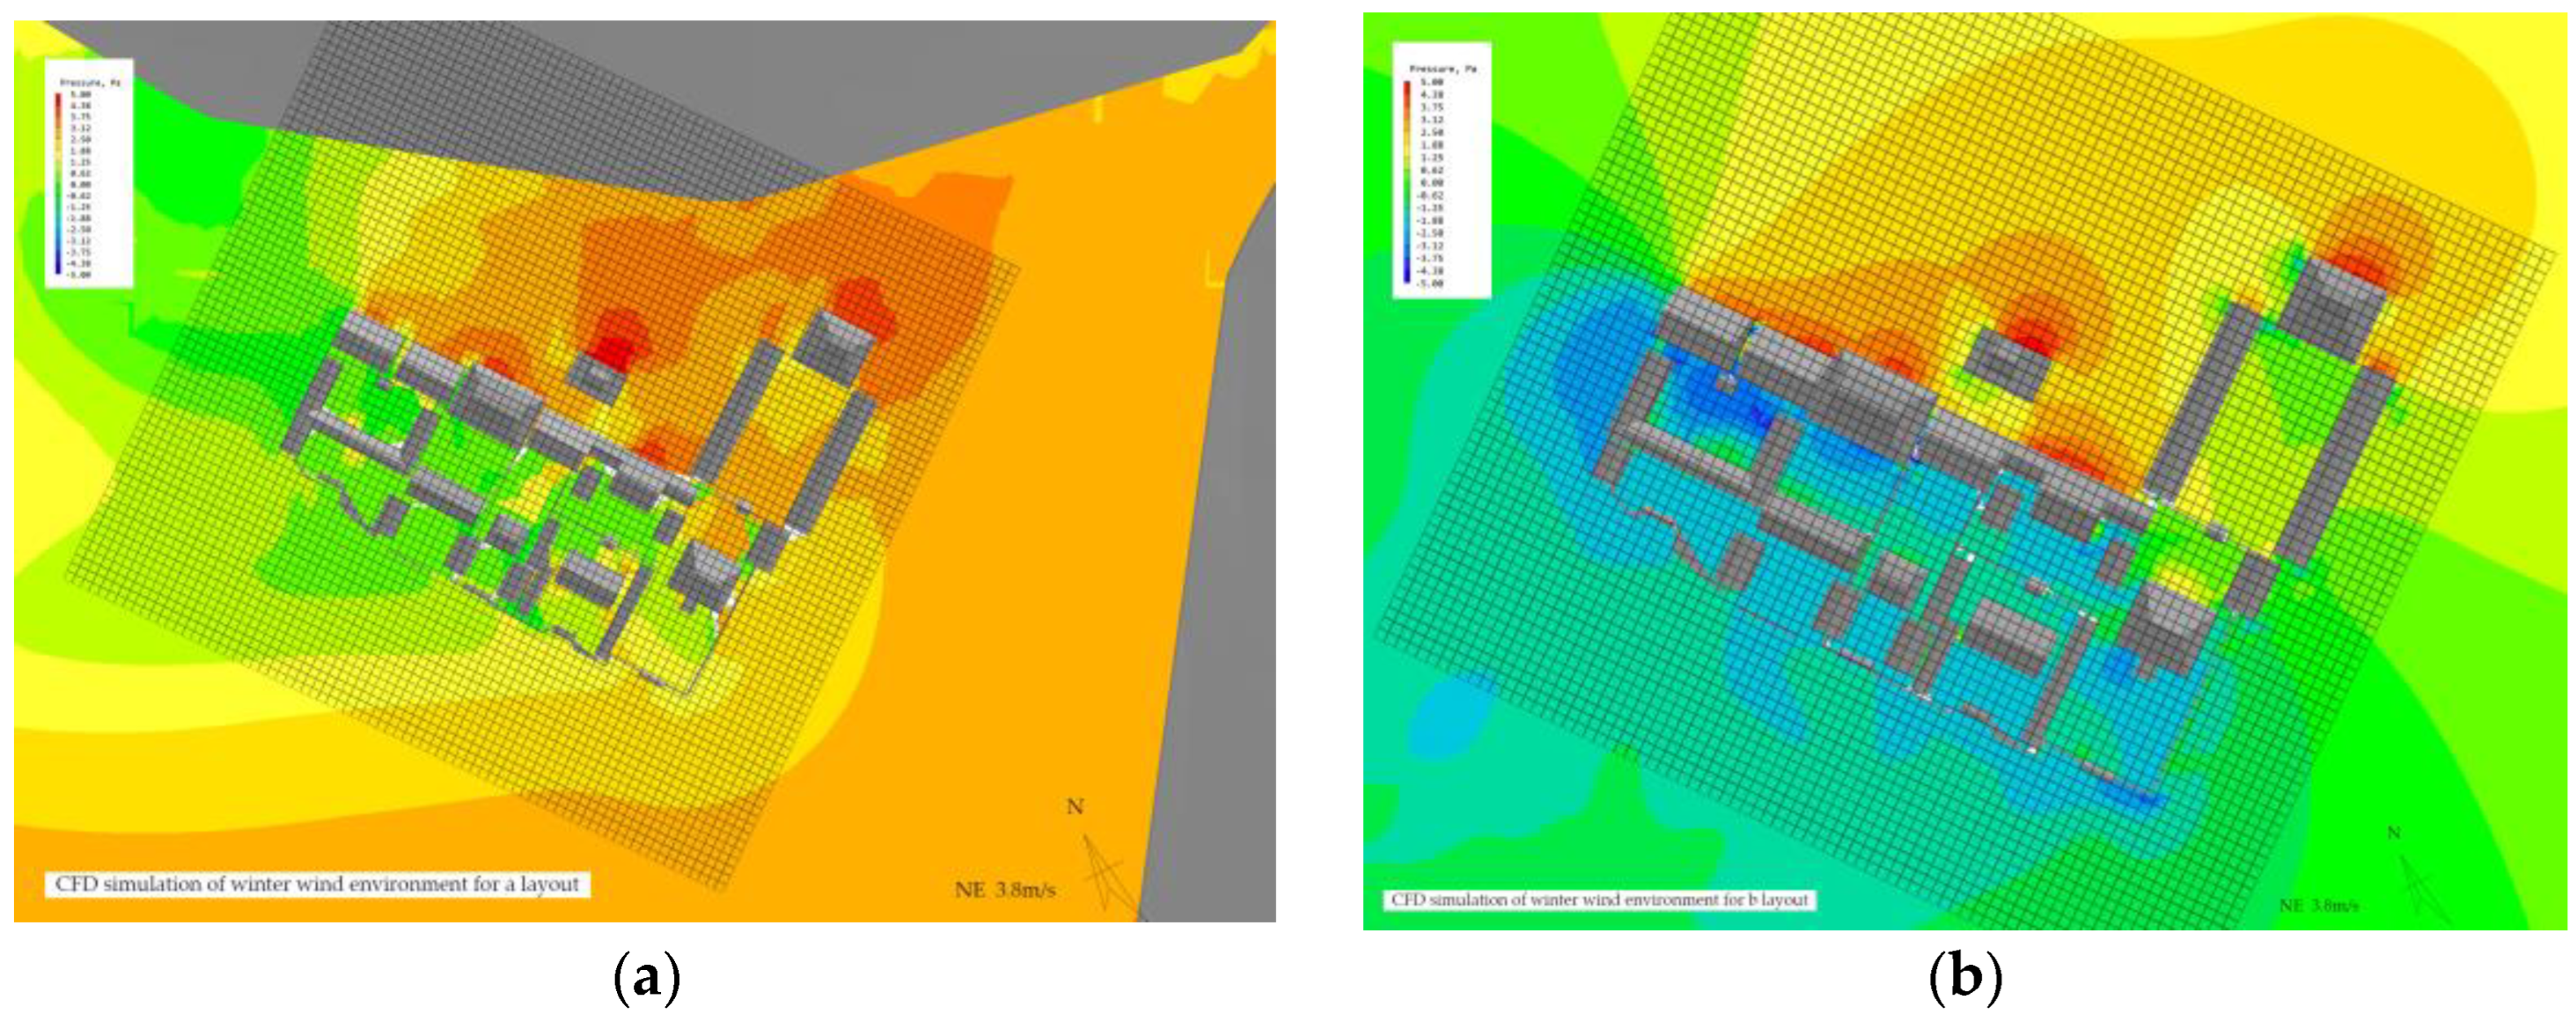
3.2. Feng Shui and Non-Feng Shui Layout CFD Simulation Cloud Map and Data

To investigate the effect of the Feng Shui layout on the architectural complex of the Bailudong Academy, the previous section proposed to use PHOENICS software to conduct CFD simulations of two models: one with a Feng Shui layout (simulation a) and the other without (simulation b) on an ideal plane. The wind speed and pressure distribution in the two models were obtained and related data were analyzed (see Figure 13 and Figure 14).
The maximum wind speeds in the courtyards of the two layouts were 1.83 m/s and 2.2 m/s, respectively. To compare the average wind speed of each courtyard, the percentage of the area occupied by different wind speeds was weighted, and the average wind speed was calculated. A line graph was plotted to show the comparison of the average wind speed of each courtyard (Figure 15, courtyard names are labeled according to Figure 9).
The results of the simulation suggest that the Feng Shui layout has a certain impact on the wind speed distribution in the architectural complex of the Bailudong Academy. The average wind speed in most courtyards with a Feng Shui layout is lower than that without a Feng Shui layout, indicating that the Feng Shui layout can effectively reduce wind speed in the courtyards.
Figure 15 illustrates a line graph that compares the average winter wind speeds in the courtyards with and without the Feng Shui layout. The Feng Shui layout demonstrates a more uniform and stable wind speed distribution compared to the non-Feng Shui layout.
Figure 16 shows a linear regression plot of the average wind speeds in the two layouts, indicating a linear relationship between the ratios of the comfortable wind speed zones, with a regression equation of y = 1.842x. The equation suggests that the comfortable wind speed zone ratio in the non-Feng Shui layout is 1.842 times that of the Feng Shui layout. The R2-value of 0.8435 indicates a good fit of the regression analysis.
To better evaluate the effectiveness of the two courtyard layouts’ winter wind environments, Figure 17 presents a line graph of the comfortable wind speed area for the Feng Shui and non-Feng Shui layouts. The plot clearly indicates that the comfortable area in the Feng Shui layout is larger than in the non-Feng Shui layout.
Figure 18 presents a regression analysis plot that compares the comfortable wind speed area ratios in the two layouts. The regression equation shows a linear relationship: y = 0.8316x, indicating that the comfortable wind speed zone ratio in the non-Feng Shui layout is 0.8316 times that of the Feng Shui layout. The R2-value of 0.8258 suggests a good fit of the regression analysis.

4. Discussion

4.1. Research on the Comparison between Experimental and Simulated Values

A comparative analysis was conducted, and the wind speeds of 69 points were measured and simulated and presented on a line graph (Figure 7). According to the weather forecast on the day of measurement, the average wind speed in the vicinity of the Bailudong Academy architectural complex ranged from 0.26 to 1.57 m/s. In the CFD simulation, a wind speed of 3.8 m/s was utilized as the inflow boundary condition. As a result, the wind speed of the inflow boundary condition in the CFD simulation was higher than the average wind speed on the day of measurement. Consequently, in the chart, most of the simulated values are greater than the measured values.
According to previous studies, a correlation coefficient (r-value) between 1 and 0.6 in regression analysis indicates a strong correlation, with a value closer to 1 indicating a stronger correlation [47]. The regression analysis graph shown in Figure 12 demonstrates an R2 value of 0.8969, indicating a good fit between the measured and simulated values [48]. It can be concluded that the simulated wind speed values by PHOENICS are consistent with the field measurement values. The combination of CED simulation and field experiment demonstrates the applicability of PHOENICS for courtyard wind environment simulation. This further proves the scientific validity of the CFD simulation data for wind layout with and without Feng Shui.

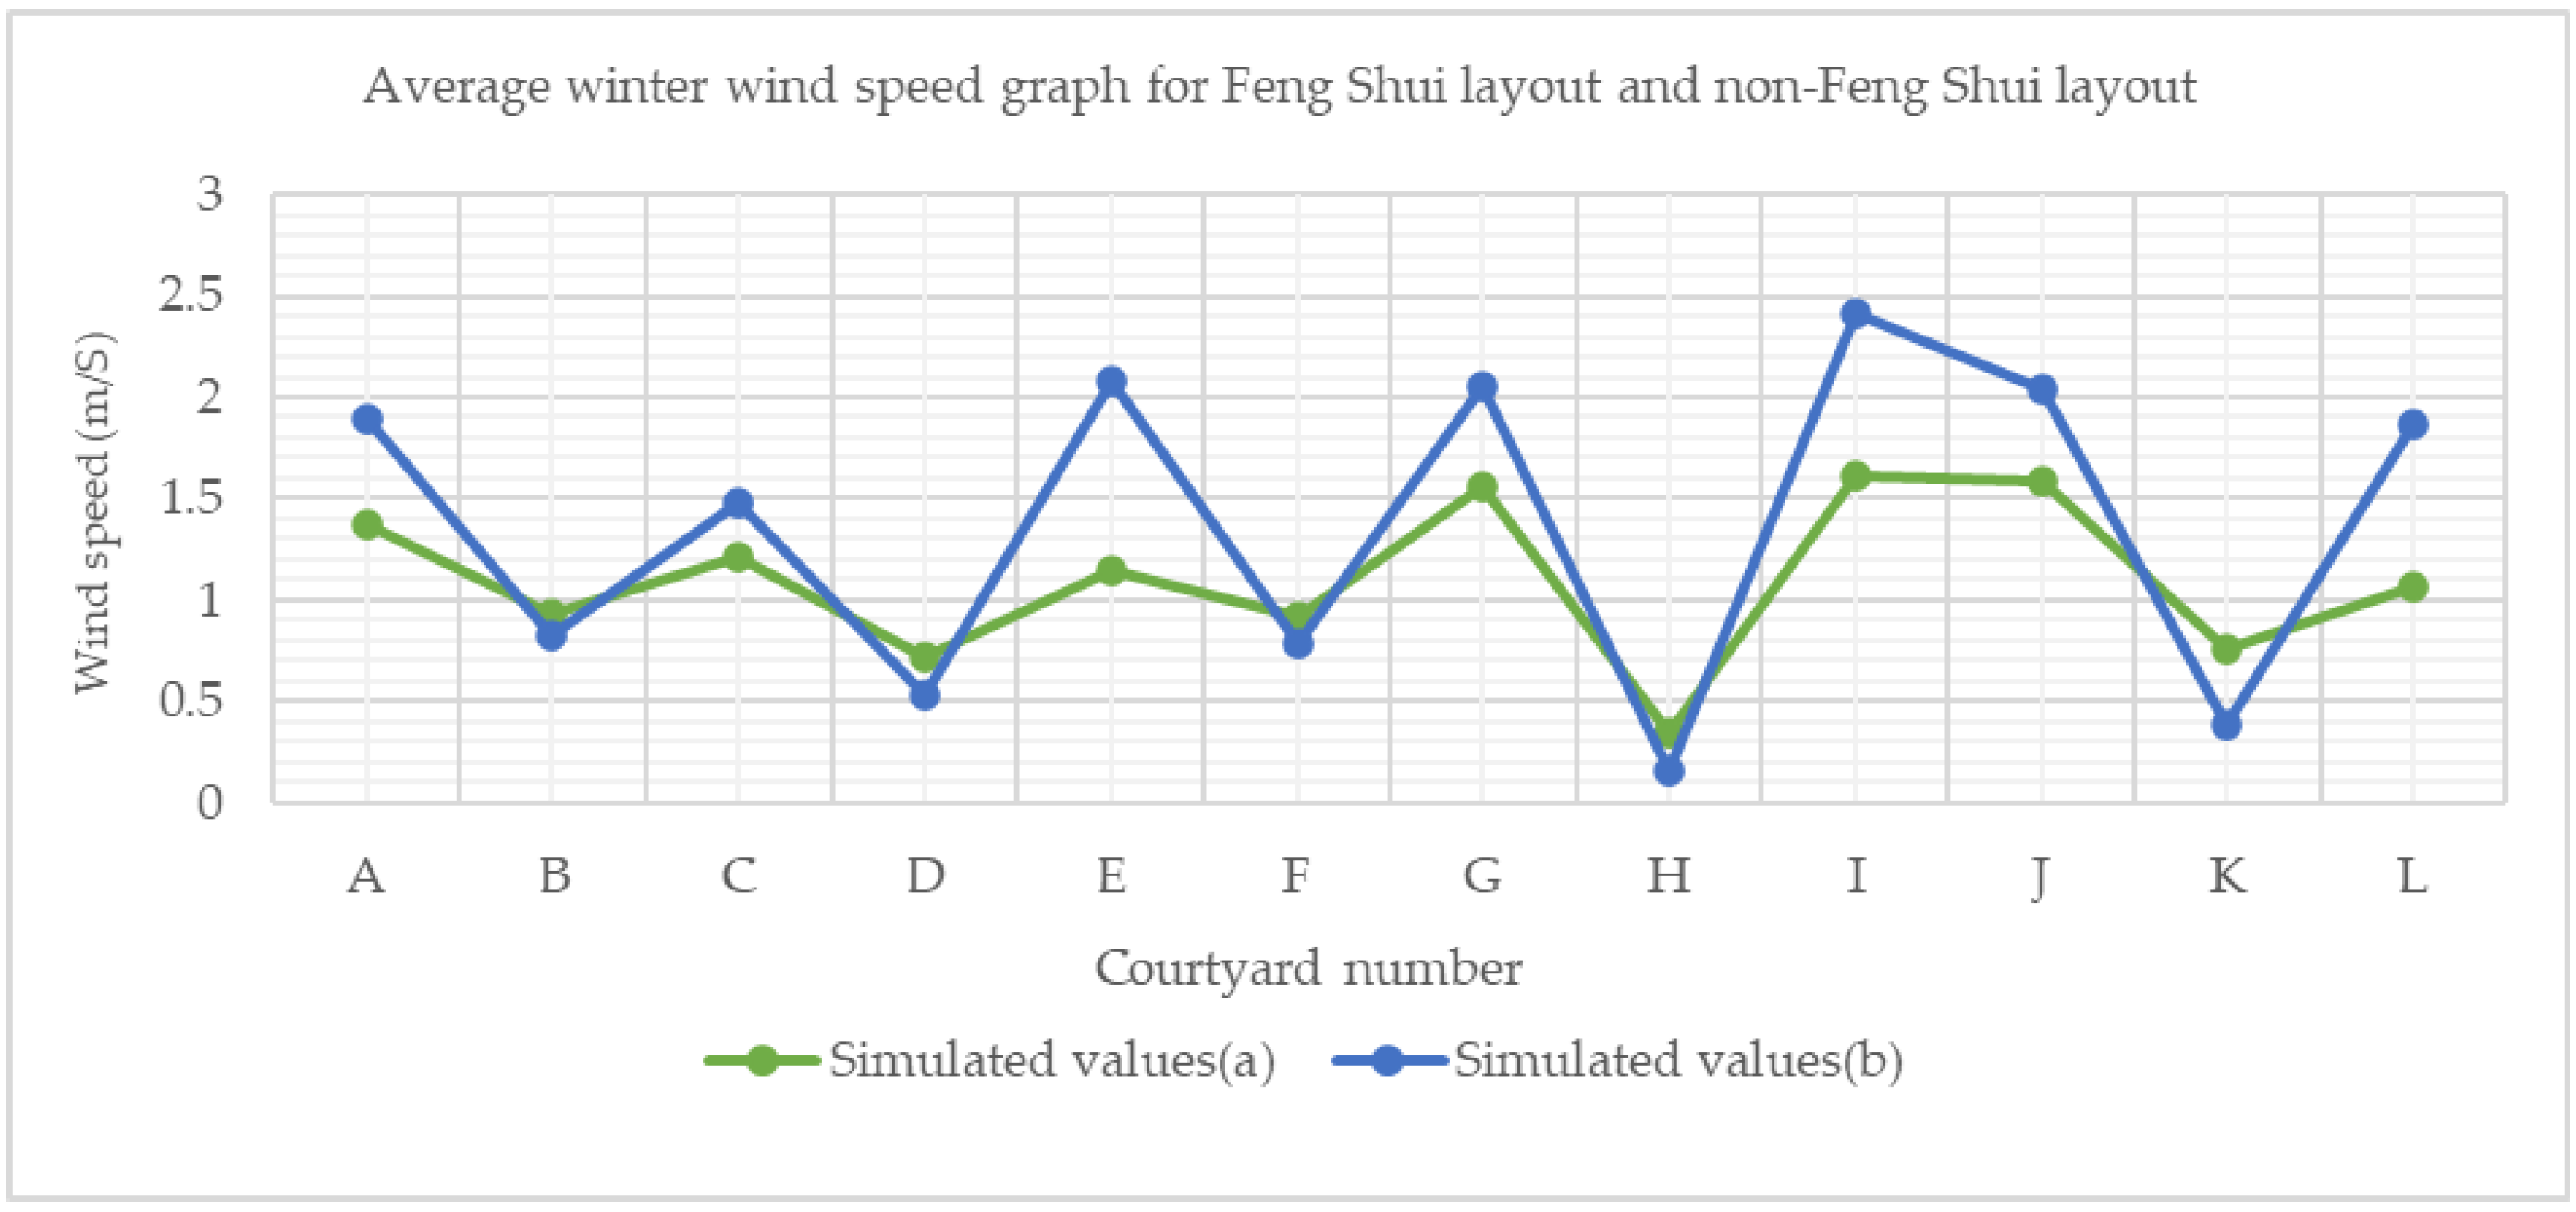
4.2. Research on Wind Speed in Courtyards with Different Layouts

Using the PHOENICS software, CFD simulations were conducted to obtain wind speed contour maps and comfort wind velocity profiles for both Feng Shui and non-Feng Shui courtyard layouts during the winter season (see Figure 13, Figure 14, Figure 15, Figure 16, Figure 17 and Figure 18).
(1) Through comparative studies, it was found that the average wind speed in Feng Shui courtyards during the winter season was lower than that of non-Feng Shui courtyards. The regression equation indicated that the average wind speed in each Feng Shui courtyard was 1.824 times lower than that of non-Feng Shui courtyards, with an R2 value of 0.843, indicating a good fit. The main reason for these results was the obstruction of the Qinglong and Baihu Mountains in Feng Shui layouts, which weakened the strong winter winds, while non-Feng Shui layouts lacked these obstructions, resulting in increased wind speeds within the courtyard.
(2) Through comparative studies, it was found that the proportion of the comfortable wind velocity zone in Feng Shui courtyards was higher than that in non-Feng Shui courtyards during the winter season. The highest proportion of the comfortable wind velocity zone was observed in courtyard C in the Feng Shui layout, with a proportion of 99%, while in non-Feng Shui layouts, it was observed in courtyard A with a proportion of 90%. The courtyards with the lowest proportion of the comfortable wind velocity zone were courtyards K, with proportions of 53% and 47%, respectively. According to Figure 18, there was a linear relationship between the proportion of the comfortable wind velocity zone and the two types of layouts, with a good fit. Based on the statistical data of all courtyards obtained from the simulation results, the proportion of the comfortable wind velocity zone in all Feng Shui courtyards was 87%, while in non-Feng Shui layouts, it was 71%. This indicated that Feng Shui layouts provided a larger comfortable wind velocity zone for winter users.
(3) After conducting a comparative study on the courtyard wind environment, it was found that the average wind speed in courtyards arranged according to Feng Shui gradually decreases from north to south, primarily due to the prevailing wind direction during winter. Therefore, in courtyards, the Feng Shui layout of a low-slung southern building and a towering northern building is conducive to ventilation during the winter. The average wind speed in courtyards located towards the north is higher than those located towards the south. The wind speed vector diagram shows that there are no obvious vortexes or windless areas in either type of courtyard layout, which meets the standards for wind environment evaluation. The wind speed in the courtyard gradually decreases from the center to the periphery.
In summary, the proportion of the comfortable wind speed zone in both types of courtyard layouts arranged according to Feng Shui is higher than that of non-Feng Shui layouts. Therefore, the layout of Feng Shui courtyards provides a more comfortable outdoor environment during winter, validating the preference of ancient Chinese people to consider a Feng Shui layout when constructing buildings.

4.3. Research on Wind Pressures in Courtyards with Different Layouts

Based on the wind pressure contour map obtained from the CFD simulation, the wind pressure threshold for the courtyard layout representing Feng Shui, as shown in Figure 14, ranges from −2.86 Pa to 2.81 Pa. The wind pressure distribution in each courtyard gradually decreases from the northeast to the southwest direction. The pressure difference between the front and back of the Temple of Rites (the tallest building in courtyard C, as shown in Figure 9) ranges from 0.65 Pa to 2.6 Pa, while the pressure difference among the main buildings in the courtyard is greater than 0.5 Pa but not higher than 5 Pa, which meets the evaluation criteria.
Figure 14 shows that the wind pressure threshold for the courtyards with the non-Feng Shui layout ranges from −3.00 Pa to 4.38 Pa. The lowest negative pressure around the Temple of Rites (the buildings in courtyard C, as shown in Figure 9) is −3.12 Pa. The negative wind pressure gradually increases to the positive pressure around the Yin’an Hall, and the southern courtyard D is completely under positive pressure. The pressure difference between the front and back of the main buildings in Springs Breeze Tower (the buildings in courtyard I, as shown in Figure 9) and Cultural Hall (the buildings in courtyard G, as shown in Figure 9) is greater than 5 Pa, while the pressure difference among the main buildings in the remaining courtyards is greater than 0.5 Pa but not higher than 5 Pa (accounting for 86.7% of all main buildings), which meets the evaluation criteria.
After a comprehensive analysis, it has been found that the difference in wind pressure between the front and back of the main house is superior in a Feng Shui layout compared to a non-Feng Shui layout, according to the wind environment evaluation criteria employed in this study.

4.4. Research on Wind Environment Data Based on Evaluation Criteria

Based on the simulation results mentioned above and the wind environment evaluation standards proposed in this study, a mathematical analysis was conducted to evaluate the wind environment of the Feng Shui layout and the non-Feng Shui layout. The results of the wind environment evaluation in winter for the Feng Shui layout and the non-Feng Shui layout are summarized in Table 2.
As shown in Table 2, the proportion of comfortable wind speed zone, average wind speed in each courtyard, and the difference in wind pressure between the front and back of the main house are all better in the Feng Shui layout than in the non-Feng Shui layout. These indicators represent the primary measures of the outdoor wind conditions, and the findings verify that the wind environment in the Feng Shui layout during winter is superior to that of the non-Feng Shui layout.

5. Conclusions

The object of this study is the Bailudong Academy architectural complex in Jiangxi Province, which adopts the Long–Hu Sand Feng Shui layout of the region. To investigate the wind environment of this complex, we proposed a non-Feng Shui layout model on an ideal flat ground. At the same time, we established an evaluation standard for the winter courtyard wind environment through data analysis. To conduct the study, we combined computational fluid dynamics (CFD) simulation with on-site experiments and selected PHOENICS for the research. By comparing the wind speed and pressure values between the winter Feng Shui and non-Feng Shui layouts, we used linear regression analysis to measure the wind speed values of 69 important points and simulation values. We draw the following conclusions:
  • Multiple validations, including Pearson correlation analysis, Root Mean Square Error (RMSE), and regression coupling results based on field measurements and numerical simulations using PHOENICS, indicate that PHOENICS is suitable for CFD simulations in this study, thus validating the reliability of the CFD simulation results.
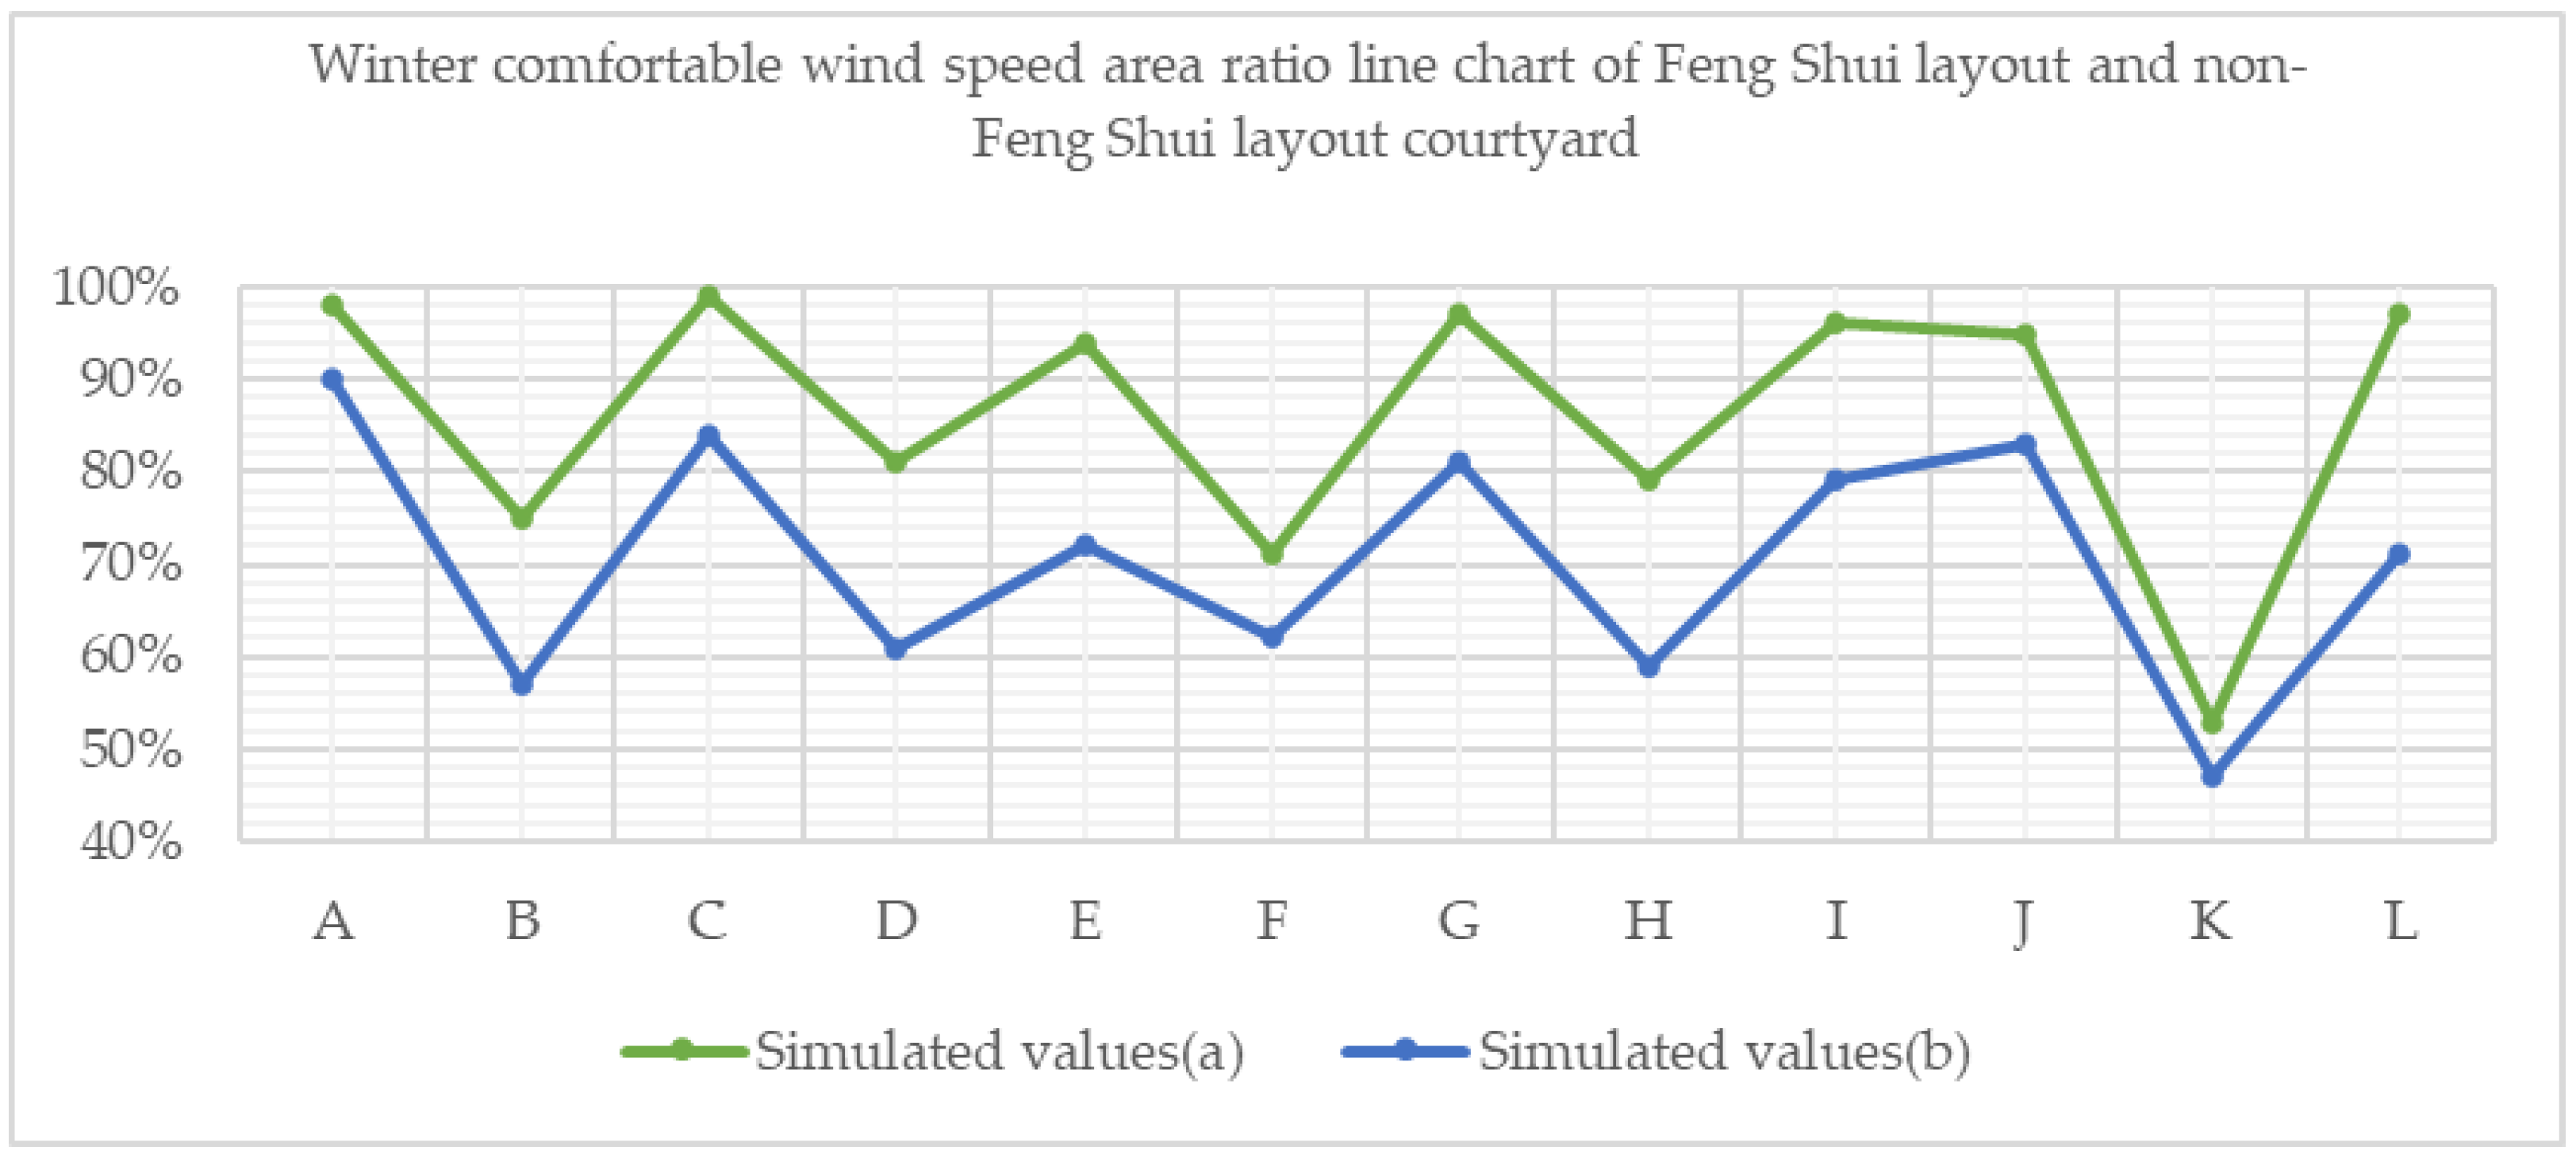
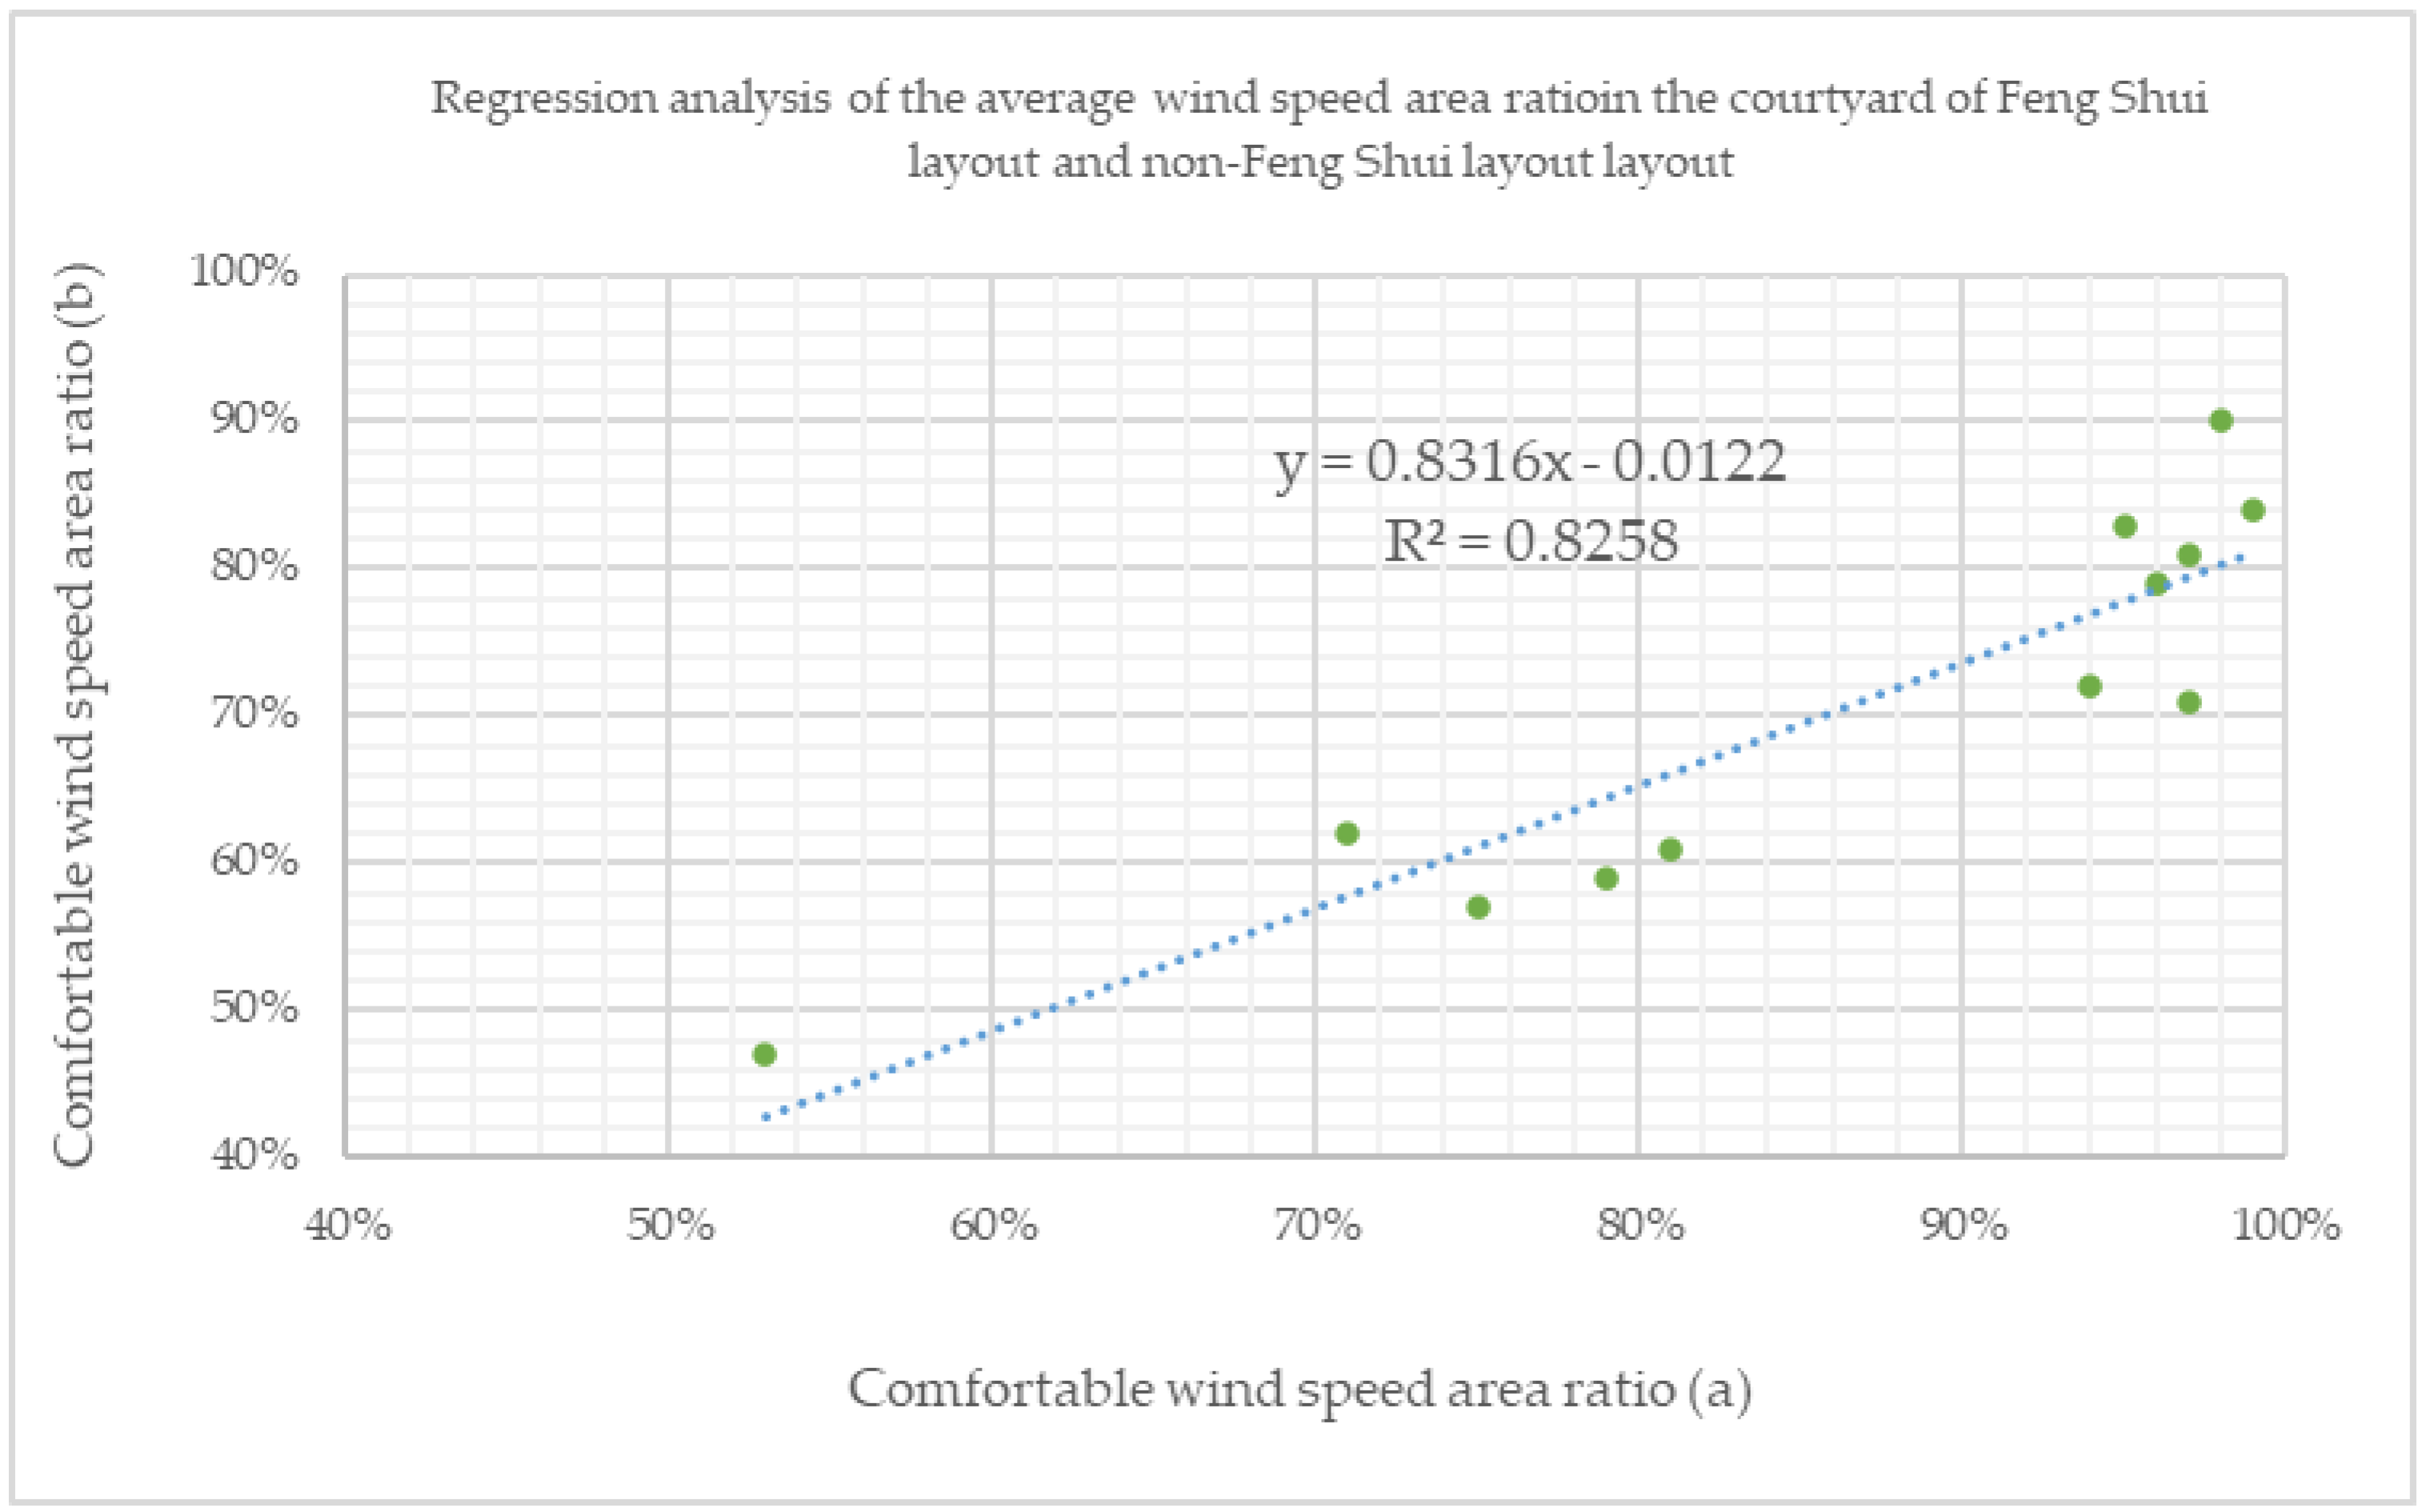
  • The results of the CFD simulation indicate that the wind speed in the non-Feng Shui courtyard is on average 1.842 times higher than in the Feng Shui layout. The Feng Shui layout has a lower average wind speed, which is beneficial for outdoor activities during winter. Moreover, the Long–Hu Sand Feng Shui layout provides a larger comfortable wind speed zone, which is 18% greater than that of the non-Feng Shui layout. Furthermore, the strong wind area in the non-Feng Shui layout is four times larger than that of the Feng Shui layout, which demonstrates the Feng Shui layout’s characteristic of “avoiding wind and gathering Qi”.
  • The study assessed the quality of winter indoor ventilation in the main house by examining whether the difference in wind pressure between the front and back of all houses was between 0.5 Pa and 5 Pa. The results showed that 87.6% of non-Feng Shui layout houses and the main house in the Feng Shui layout met the evaluation standard. Thus, the Feng Shui layout is more effective in optimizing winter indoor ventilation in the main house.
This study only considered the winter wind environment. In the future, we will compare the winter wind environment and other building environments of the courtyard and consider factors such as air age. The above results verify the advantages of the Feng Shui layout and showcase the ecological wisdom of ancient Chinese architecture.

Author Contributions

Conceptualization, Z.Z. and S.Z.; methodology, Z.Z., S.Z. and Y.P.; software, Z.Z. and S.Z.; validation, S.Z., Z.Z. and Y.P.; formal analysis, S.Z.; investigation, S.Z.; resources, Z.Z.; data curation, S.Z.; writing—original draft preparation, S.Z.; writing—review and editing, Z.Z., S.Z. and Y.P.; visualization, Y.P.; supervision, Z.Z.; project administration, Z.Z.; funding acquisition, Z.Z. All authors have read and agreed to the published version of the manuscript.

Funding

This research received no external funding.

Data Availability Statement

Not applicable.

Acknowledgments

During the process of collecting information and conducting on-site investigations on the Bailudong Academy architectural complex, the staff within provided immense assistance.

Conflicts of Interest

The authors declare no conflict of interest.

References

  1. Xu, Y.; Yang, X.; Feng, X.; Yan, P.; Shen, Y.; Li, X. Spatial Distribution and Site Selection Adaptation Mechanism of Traditional Villages along the Yellow River in Shanxi and Shaanxi. River Res. Appl. 2022, 1–13. [Google Scholar] [CrossRef]
  2. Morgan, P. Towards a Developmental Theory of Place Attachment. J. Environ. Psychol. 2010, 30, 11–22. [Google Scholar] [CrossRef]
  3. Bastias Saavedra, M. Norms beyond Empire: Law-Making and Local Normativities in Iberian Asia, 1500–1800; Max Planck Studies in Global Legal History of Lberian Worlds; Brill Nijhoff: Leiden, the Netherlands; Boston, MA, USA, 2022; ISBN 978-90-04-47282-2. [Google Scholar]
  4. Xing, C.; Xiaoqian, S. Study on Mountain Confucian Temple Spatial Layout and Landscape Environment: An Analytical Study of Confucian Temples in Southwest China during the 15th–19th Centuries. J. Asian Archit. Build. Eng. 2023, 1–17. [Google Scholar] [CrossRef]
  5. Mak, M.Y.; Ng, S.T. The Art and Science of Feng Shui—A Study on Architects’ Perception. Build. Environ. 2005, 40, 427–434. [Google Scholar] [CrossRef]
  6. Kryžanowski, Š. Feng Shui: A Comprehensive Review of Its Effectiveness Based on Evaluation Studies. Int. J. Adv. Sci. Res. Eng. 2021, 7, 61–71. [Google Scholar] [CrossRef]
  7. Georgakis, C.; Santamouris, M. On the Estimation of Wind Speed in Urban Canyons for Ventilation Purposes—Part 1: Coupling between the Undisturbed Wind Speed and the Canyon Wind. Build. Environ. 2008, 43, 1404–1410. [Google Scholar] [CrossRef]
  8. Miao, C.; Yu, S.; Zhang, Y.; Hu, Y.; He, X.; Chen, W. Assessing Outdoor Air Quality Vertically in an Urban Street Canyon and Its Response to Microclimatic Factors. J. Environ. Sci. 2023, 124, 923–932. [Google Scholar] [CrossRef]
  9. Hood, C. Comprehensive Evaluation of an Advanced Street Canyon Air Pollution Model. J. Air Waste Manag. Assoc. 2021, 71, 247–267. [Google Scholar] [CrossRef]
  10. Zhou, Z.; Deng, J.; Wang, P.; Zhou, C.; Xu, Y.; Jiang, W.; Ma, K. Physical Environment Study of Traditional Village Patterns in Jinxi County, Jiangxi Province Based on CFD Simulation. Processes 2022, 10, 2453. [Google Scholar] [CrossRef]
  11. Guo, P.; Ding, C.; Guo, Z.; Liu, T.; Lyu, T. Coupling CFD Simulation and Field Experiments in Summer to Prove Feng Shui Optimizes Courtyard Wind Environments: A Case Study of Prince Kung’s Mansion in Beijing. Buildings 2022, 12, 629. [Google Scholar] [CrossRef]
  12. Baratta, N.C.; Giambruno, M.; Magli, G.; Zhou, J. Chinese Cities as Sacred Landscapes: The Case of the Capitals of the Ming Dynasty. In Placemaking and Cultural Landscapes; Springer: Singapore, 2023; pp. 173–187. [Google Scholar]
  13. Magli, G. Astronomy and Feng Shui in the Projects of the Tang, Ming and Qing Royal Mausoleums: A Satellite Imagery Approach. Archaeol. Res. Asia 2019, 17, 98–108. [Google Scholar] [CrossRef]
  14. Tang, L.; Nikolopoulou, M.; Zhao, F.; Zhang, N. CFD Modeling of the Built Environment in Chinese Historic Settlements. Energy Build. 2012, 55, 601–606. [Google Scholar] [CrossRef]
  15. Qinglin, M.; Zhuolun, C. Simulation and Research on Indoor Environment Control Mode Basing on Thermal Comfort: A Case Study in the Aviation Building in Sanya Airport; Building Simulation: Beijing, China, 2007. [Google Scholar]
  16. van Druenen, T.; van Hooff, T.; Montazeri, H.; Blocken, B. CFD Evaluation of Building Geometry Modifications to Reduce Pedestrian-Level Wind Speed. Build. Environ. 2019, 163, 106293. [Google Scholar] [CrossRef]
  17. Chen, L. Integrated Impacts of Building Height and Upstream Building on Pedestrian Comfort around Ideal Lift-up Buildings in a Weak Wind Environment. Build. Environ. 2021, 200, 107963. [Google Scholar] [CrossRef]
  18. Hu, K.; Cheng, S.; Qian, Y. CFD Simulation Analysis of Building Density on Residential Wind Environment. J. Eng. Sci. Technol. Rev. 2018, 11, 35–43. [Google Scholar] [CrossRef]
  19. Liu, S.; Pan, W.; Zhao, X.; Zhang, H.; Cheng, X.; Long, Z.; Chen, Q. Influence of Surrounding Buildings on Wind Flow around a Building Predicted by CFD Simulations. Build. Environ. 2018, 140, 1–10. [Google Scholar] [CrossRef]
  20. Zhong, J.; Jia, S.; Liu, R. Improvement of Indoor Thermal Environment in Renovated Huizhou Architecture. IJHT 2019, 37, 633–640. [Google Scholar] [CrossRef]
  21. Cheng, Z.; Lei, N.; Bu, Z.; Sun, H.; Li, B. Investigations of Indoor Air Quality for Office Buildings in Different Climate Zones of China by Subjective Survey and Field Measurement. Build. Environ. 2022, 214, 108899. [Google Scholar] [CrossRef]
  22. Zhang, C. The Origin and Development of Library. In Proceedings of the Advances in Computer Science, Environment, Ecoinformatics, and Education: International Conference, Wuhan, China, 21 August 2011; Springer: Berlin/Heidelberg, Germany, 2011; Volume 2011, pp. 63–67. [Google Scholar]
  23. He, Y.; Tablada, A.; Wong, N.H. Effects of Non-Uniform and Orthogonal Breezeway Networks on Pedestrian Ventilation in Singapore’s High-Density Urban Environments. Urban Clim. 2018, 24, 460–484. [Google Scholar] [CrossRef]
  24. Guo, F.; Zhang, H.; Fan, Y.; Zhu, P.; Wang, S.; Lu, X.; Jin, Y. Detection and Evaluation of a Ventilation Path in a Mountainous City for a Sea Breeze: The Case of Dalian. Build. Environ. 2018, 145, 177–195. [Google Scholar] [CrossRef]
  25. Mora-Pérez, M.; Guillén-Guillamón, I.; López-Jiménez, P.A. Computational Analysis of Wind Interactions for Comparing Different Buildings Sites in Terms of Natural Ventilation. Adv. Eng. Softw. 2015, 88, 73–82. [Google Scholar] [CrossRef]
  26. Liu, J.; Niu, J.; Xia, Q. Combining Measured Thermal Parameters and Simulated Wind Velocity to Predict Outdoor Thermal Comfort. Build. Environ. 2016, 105, 185–197. [Google Scholar] [CrossRef]
  27. Chan, S. Greenery concerns of green building design and feng shui. J. Int. Sci. Publ. 2015, 9, 609–618. [Google Scholar]
  28. Chan, S. Green Building Design Related to Feng Shui Issues in Taiwan. J. Eng. Arch. 2015, 3, 19–27. [Google Scholar] [CrossRef]
  29. Du, Y.; Mak, C.M.; Kwok, K.; Tse, K.-T.; Lee, T.; Ai, Z.; Liu, J.; Niu, J. New Criteria for Assessing Low Wind Environment at Pedestrian Level in Hong Kong. Build. Environ. 2017, 123, 23–36. [Google Scholar] [CrossRef]
  30. Du, Y.; Mak, C.M.; Liu, J.; Xia, Q.; Niu, J.; Kwok, K.C.S. Effects of Lift-up Design on Pedestrian Level Wind Comfort in Different Building Configurations under Three Wind Directions. Build. Environ. 2017, 117, 84–99. [Google Scholar] [CrossRef]
  31. Ghasemi, Z.; Esfahani, M.A.; Bisadi, M. Promotion of Urban Environment by Consideration of Human Thermal & Wind Comfort: A Literature Review. Procedia-Soc. Behav. Sci. 2015, 201, 397–408. [Google Scholar] [CrossRef]
  32. Xiong, K.; He, B.-J. Wintertime Outdoor Thermal Sensations and Comfort in Cold-Humid Environments of Chongqing China. Sustain. Cities Soc. 2022, 87, 104203. [Google Scholar] [CrossRef]
  33. Feng, J.; Haddad, S.; Gao, K.; Garshasbi, S. Fighting Urban Climate Change—State of the Art of Mitigation Technologies. In Urban Climate Change and Heat Islands; Elsevier: Amsterdam, The Netherlands, 2023; pp. 227–296. [Google Scholar] [CrossRef]
  34. Li, Y.; Chen, L.; Yang, L. CFD Modelling and Analysis for Green Environment of Traditional Buildings. Energies 2023, 16, 1980. [Google Scholar] [CrossRef]
  35. Guo, F.; Zhu, P.; Wang, S.; Duan, D.; Jin, Y. Improving Natural Ventilation Performance in a High-Density Urban District: A Building Morphology Method. Procedia Eng. 2017, 205, 952–958. [Google Scholar] [CrossRef]
  36. Simisiroglou, N.; Karatsioris, M.; Nilsson, K.; Breton, S.P.; Ivanell, S. The Actuator Disc Concept in Phoenics. Energy Procedia 2016, 94, 269–277. [Google Scholar] [CrossRef]
  37. Guo, W.; Liu, X.; Yuan, X. A Case Study on Optimization of Building Design Based on CFD Simulation Technology of Wind Environment. Procedia Eng. 2015, 121, 225–231. [Google Scholar] [CrossRef]
  38. He, J.; Chen, Y.; Zheng, L.; Zheng, J. Research on Wind Environment and Morphological Effects of High-Rise Buildings in Macau: An Example from the New Reclamation Area around Areia Preta. Int. J. Environ. Res. Public Health 2023, 20, 4143. [Google Scholar] [CrossRef] [PubMed]
  39. Chu, C.-R.; Su, Z.-Y. Natural Ventilation Design for Underground Parking Garages. Build. Environ. 2023, 227, 109784. [Google Scholar] [CrossRef]
  40. Ying, X.; Qin, X.; Shen, L.; Yu, C.; Zhang, J. An Intelligent Planning Method to Optimize High-Density Residential Layouts Considering the Influence of Wind Environments. Heliyon 2023, 9, e13051. [Google Scholar] [CrossRef]
  41. Li, W.; Du, Z.; Wu, Z.; Yu, M. Ventilation and Noise in a Cognitive Day Care Centre: Environmental Quality Analysis and Design Optimization Study. Int. J. Environ. Sci. Technol. 2023, 20, 46. [Google Scholar] [CrossRef]
  42. Hu, D.; Li, Z.; Wang, H.; Xu, H.; Miao, C. Smoke Dispersion Test and Emergency Control Plan of Fire in Mine Roadway during Downward Ventilation. Sci. Rep. 2023, 13, 3683. [Google Scholar] [CrossRef] [PubMed]
  43. Chen, W.; Zhang, J.; Liu, S.; Liang, S.; Zhang, Y.; Fu, S. The Spatial Configuration of Buildings: A Vital Consideration Impossible to Ignore in Regulating Urban Land Surface Temperature? Evidence from 35 Chinese Cities. Sci. Total Environ. 2023, 865, 160946. [Google Scholar] [CrossRef]
  44. Shi, J.; Wang, H.; Wang, J. CFD Simulation Study on the Cooling Characteristics of Shading and Natural Ventilation in Greenhouse of a Botanical Garden in Shanghai. Sustainability 2023, 15, 3056. [Google Scholar] [CrossRef]
  45. de Wilde, P.; Martinez-Ortiz, C.; Pearson, D.; Beynon, I.; Beck, M.; Barlow, N. Building simulation approaches for the training of automated data analysis tools in building energy management. Adv. Eng. Inform. 2013, 27, 457–465. [Google Scholar] [CrossRef]
  46. Kent, M.G.; Altomonte, S.; Wilson, R.; Tregenza, P.R. Temporal effects on glare response from daylight. Build. Environ. 2017, 113, 49–64. [Google Scholar] [CrossRef]
  47. Chicco, D.; Warrens, M.J.; Jurman, G. The Coefficient of Determination R-Squared Is More Informative than SMAPE, MAE, MAPE, MSE and RMSE in Regression Analysis Evaluation. PeerJ Comput. Sci. 2021, 7, e623. [Google Scholar] [CrossRef] [PubMed]
  48. Zhang, X.; Gao, Y.; Tao, Q.; Min, Y.; Fan, J. Improving the Pedestrian-Level Wind Comfort by Lift-up Factors of Panel Residence Complex: Field-Measurement and CFD Simulation. Build. Environ. 2023, 229, 109947. [Google Scholar] [CrossRef]
Figure 1. Ancient Chinese architectural design concepts.
Buildings 13 01101 g001
Figure 2. Location map of the Bailudong Academy complex (Source: China National Geospatial Information Platform).
Buildings 13 01101 g002
Figure 3. Diagram of China’s climate zone map (Source: 30-year average 1 km monthly climate element dataset for China).
Buildings 13 01101 g003
Figure 4. Layout plan of the buildings in the Bailudong Academy complex.
Buildings 13 01101 g004
Figure 5. Diagram of the Long–Hu Sand Feng Shui pattern.
Buildings 13 01101 g005
Figure 6. Original Feng Shui building complex and relocated non-Feng Shui building complex location diagram (Source: Google Maps).
Buildings 13 01101 g006
Figure 7. Research framework.
Buildings 13 01101 g007
Figure 8. CFD mesh settings: (a) the non-Feng Shui layout; (b) the Feng Shui layout.
Buildings 13 01101 g008
Figure 9. Schematic diagram of the wind and environmental measurement points in the buildings of the Bailudong Academy.
Buildings 13 01101 g009
Figure 10. Line graph of the values of the measured and CFD simulated points. The data for the graph were obtained through CFD simulations.
Buildings 13 01101 g010
Figure 11. RMSE plot for measured and simulated values. The data for the graph were obtained through CFD simulations.
Buildings 13 01101 g011
Figure 12. Linear regression plot of the values of the measured points and CFD simulation points. The data for the graph were obtained through CFD simulations.
Buildings 13 01101 g012
Figure 13. CFD simulation wind speed contour maps. (a) Wind speed cloud of Feng Shui layout in winter; (b) wind speed cloud of no Feng Shui layout in winter. All data presented in the figures were obtained from the CFD simulations.
Buildings 13 01101 g013
Figure 14. CFD simulation wind pressure contour maps. (a) Wind pressure cloud of Feng Shui layout in winter; (b) wind pressure cloud of no Feng Shui layout in winter. The figures were obtained by CFD simulation. All data presented in the figures were obtained from the CFD simulations.
Buildings 13 01101 g014
Figure 15. The line graph depicts the average wind speeds of courtyards under Feng Shui and non-Feng Shui layouts. The data for the graph were obtained through CFD simulations.
Buildings 13 01101 g015
Figure 16. Linear regression graph of the average wind speed data for courtyards under Feng Shui and non-Feng Shui layouts. The data for the graph were obtained through CFD simulations.
Buildings 13 01101 g016
Figure 17. A line chart was created to compare the winter comfortable wind speed area ratio between the Feng Shui layout and non-Feng Shui layout courtyard. All data presented in the figures were obtained from the CFD simulations.
Buildings 13 01101 g017
Figure 18. Regression analysis of the average wind speed area ratio in the courtyard of Feng Shui layout and non-Feng Shui layout. The data for the graph were obtained through CFD simulations.
Buildings 13 01101 g018
Table 1. Pearson two-tailed analysis table of simulated and measured values.
Measured ValuesSimulated Values
Measured valuesPearson correlation10.947 **
Sig. (two-tailed) 0.000
Number of cases6969
Simulated valuesPearson correlation0.947 **1
Sig. (two-tailed)0.000
Number of cases6969
** Statistically significant correlation at the 0.01 level (two-tailed).
Table 2. Wind environment evaluation of Feng Shui and non-Fen Shui in winter.
Evaluation CriteriaSimulated Values (a)Simulated
Values (b)
Wind speedArea ratio of strong wind speed5%21%
Area ratio of comfortable wind speed89%71%
Area ratio of low wind speed6%8%
Have no vortex or large windless areas0%0%
Wind pressureThe wind pressure difference between the front and rear of all houses is greater than 0.5 Pa and less than 5 Pa.100%87.6%
Disclaimer/Publisher’s Note: The statements, opinions and data contained in all publications are solely those of the individual author(s) and contributor(s) and not of MDPI and/or the editor(s). MDPI and/or the editor(s) disclaim responsibility for any injury to people or property resulting from any ideas, methods, instructions or products referred to in the content.

