
Experimental Research on the Mechanical Properties of MURSP-Type Steel-Concrete Composite Beams in Negative-Moment Region

Abstract
:1. Introduction
2. Test Design
2.1. Test Specimens
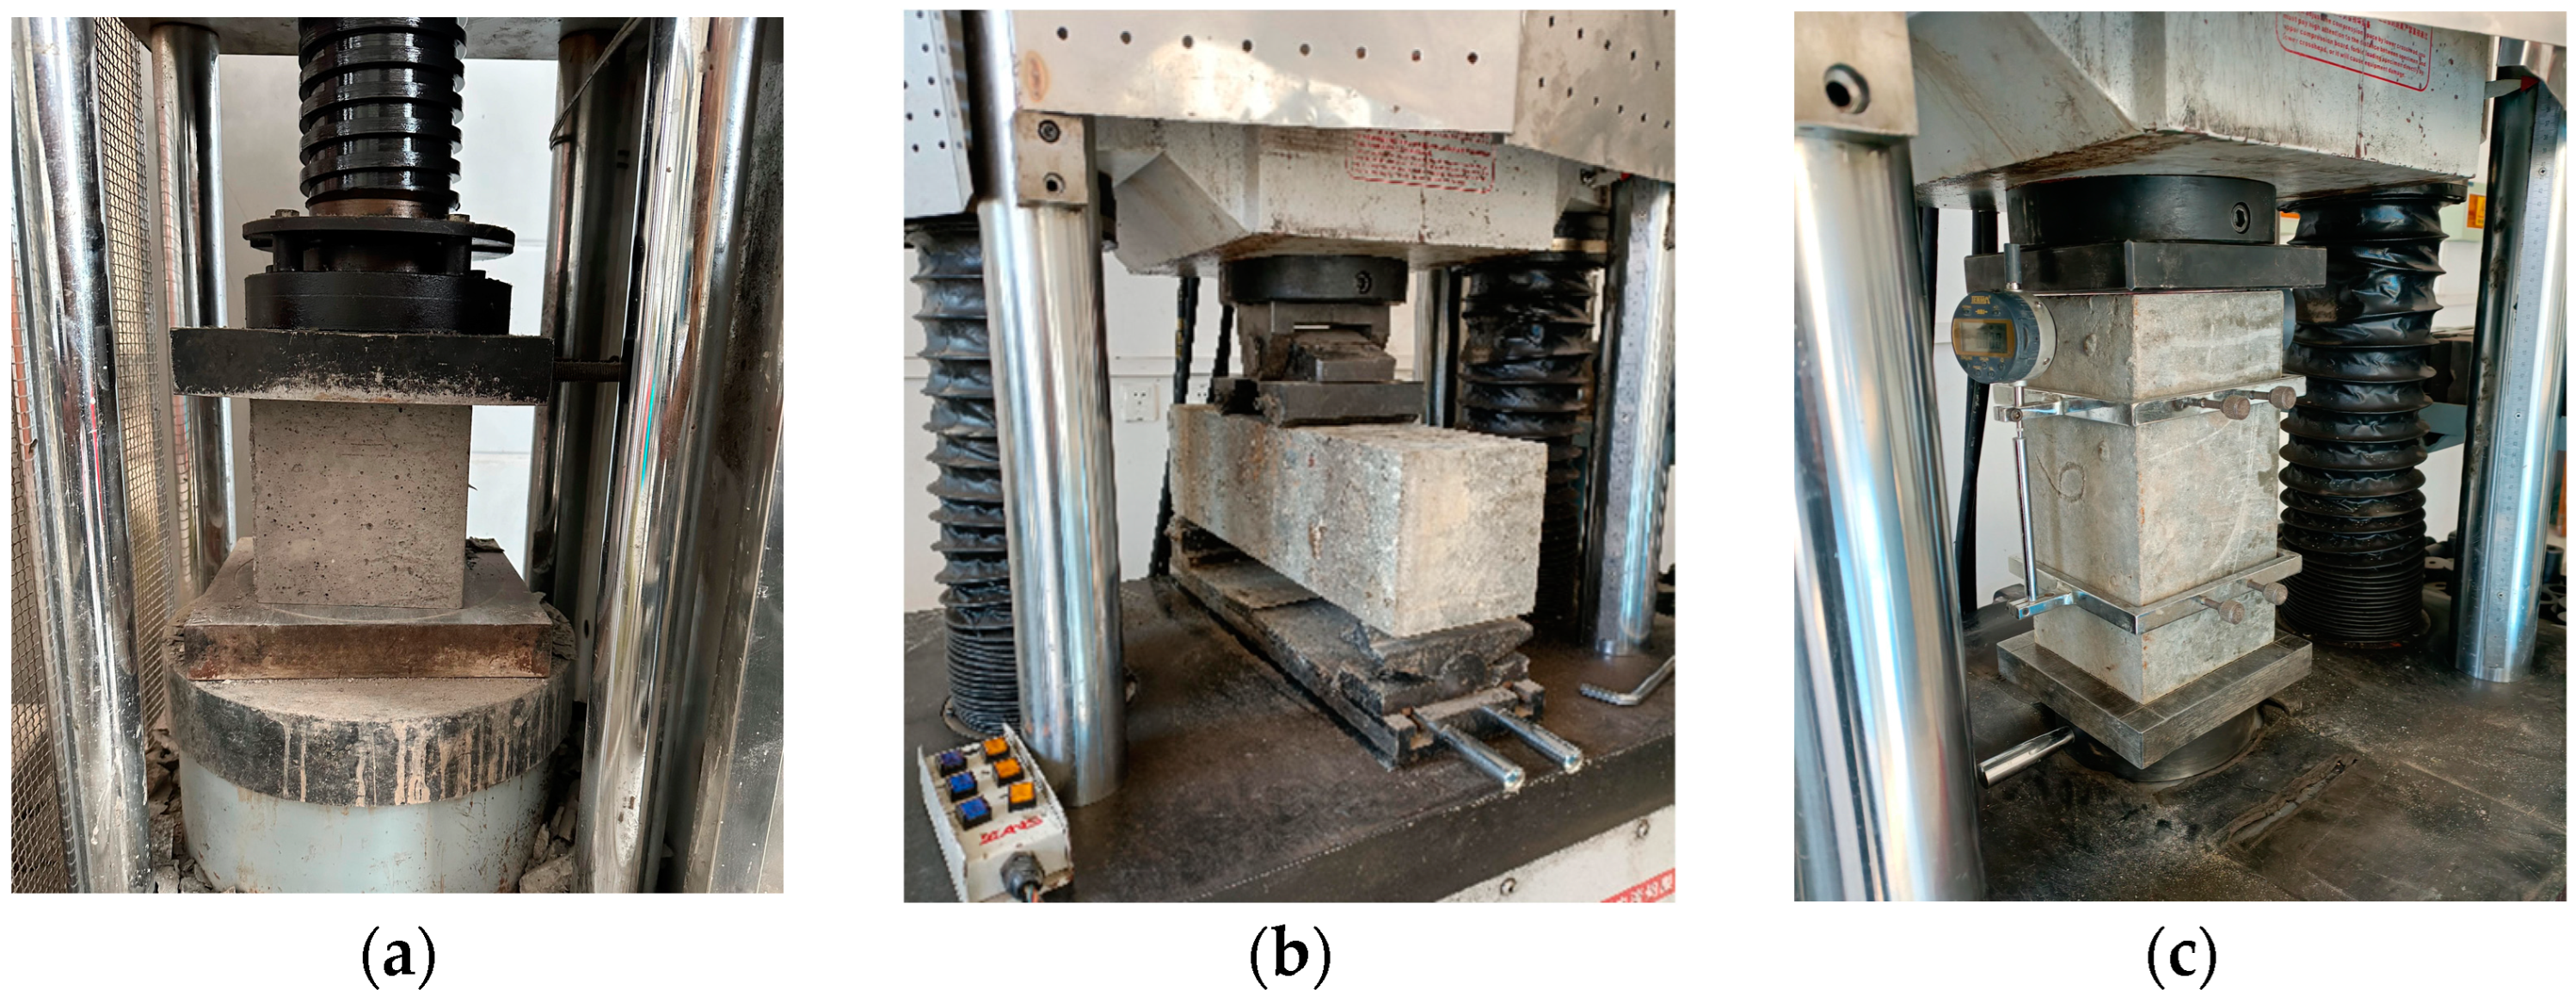
2.2. Material Properties
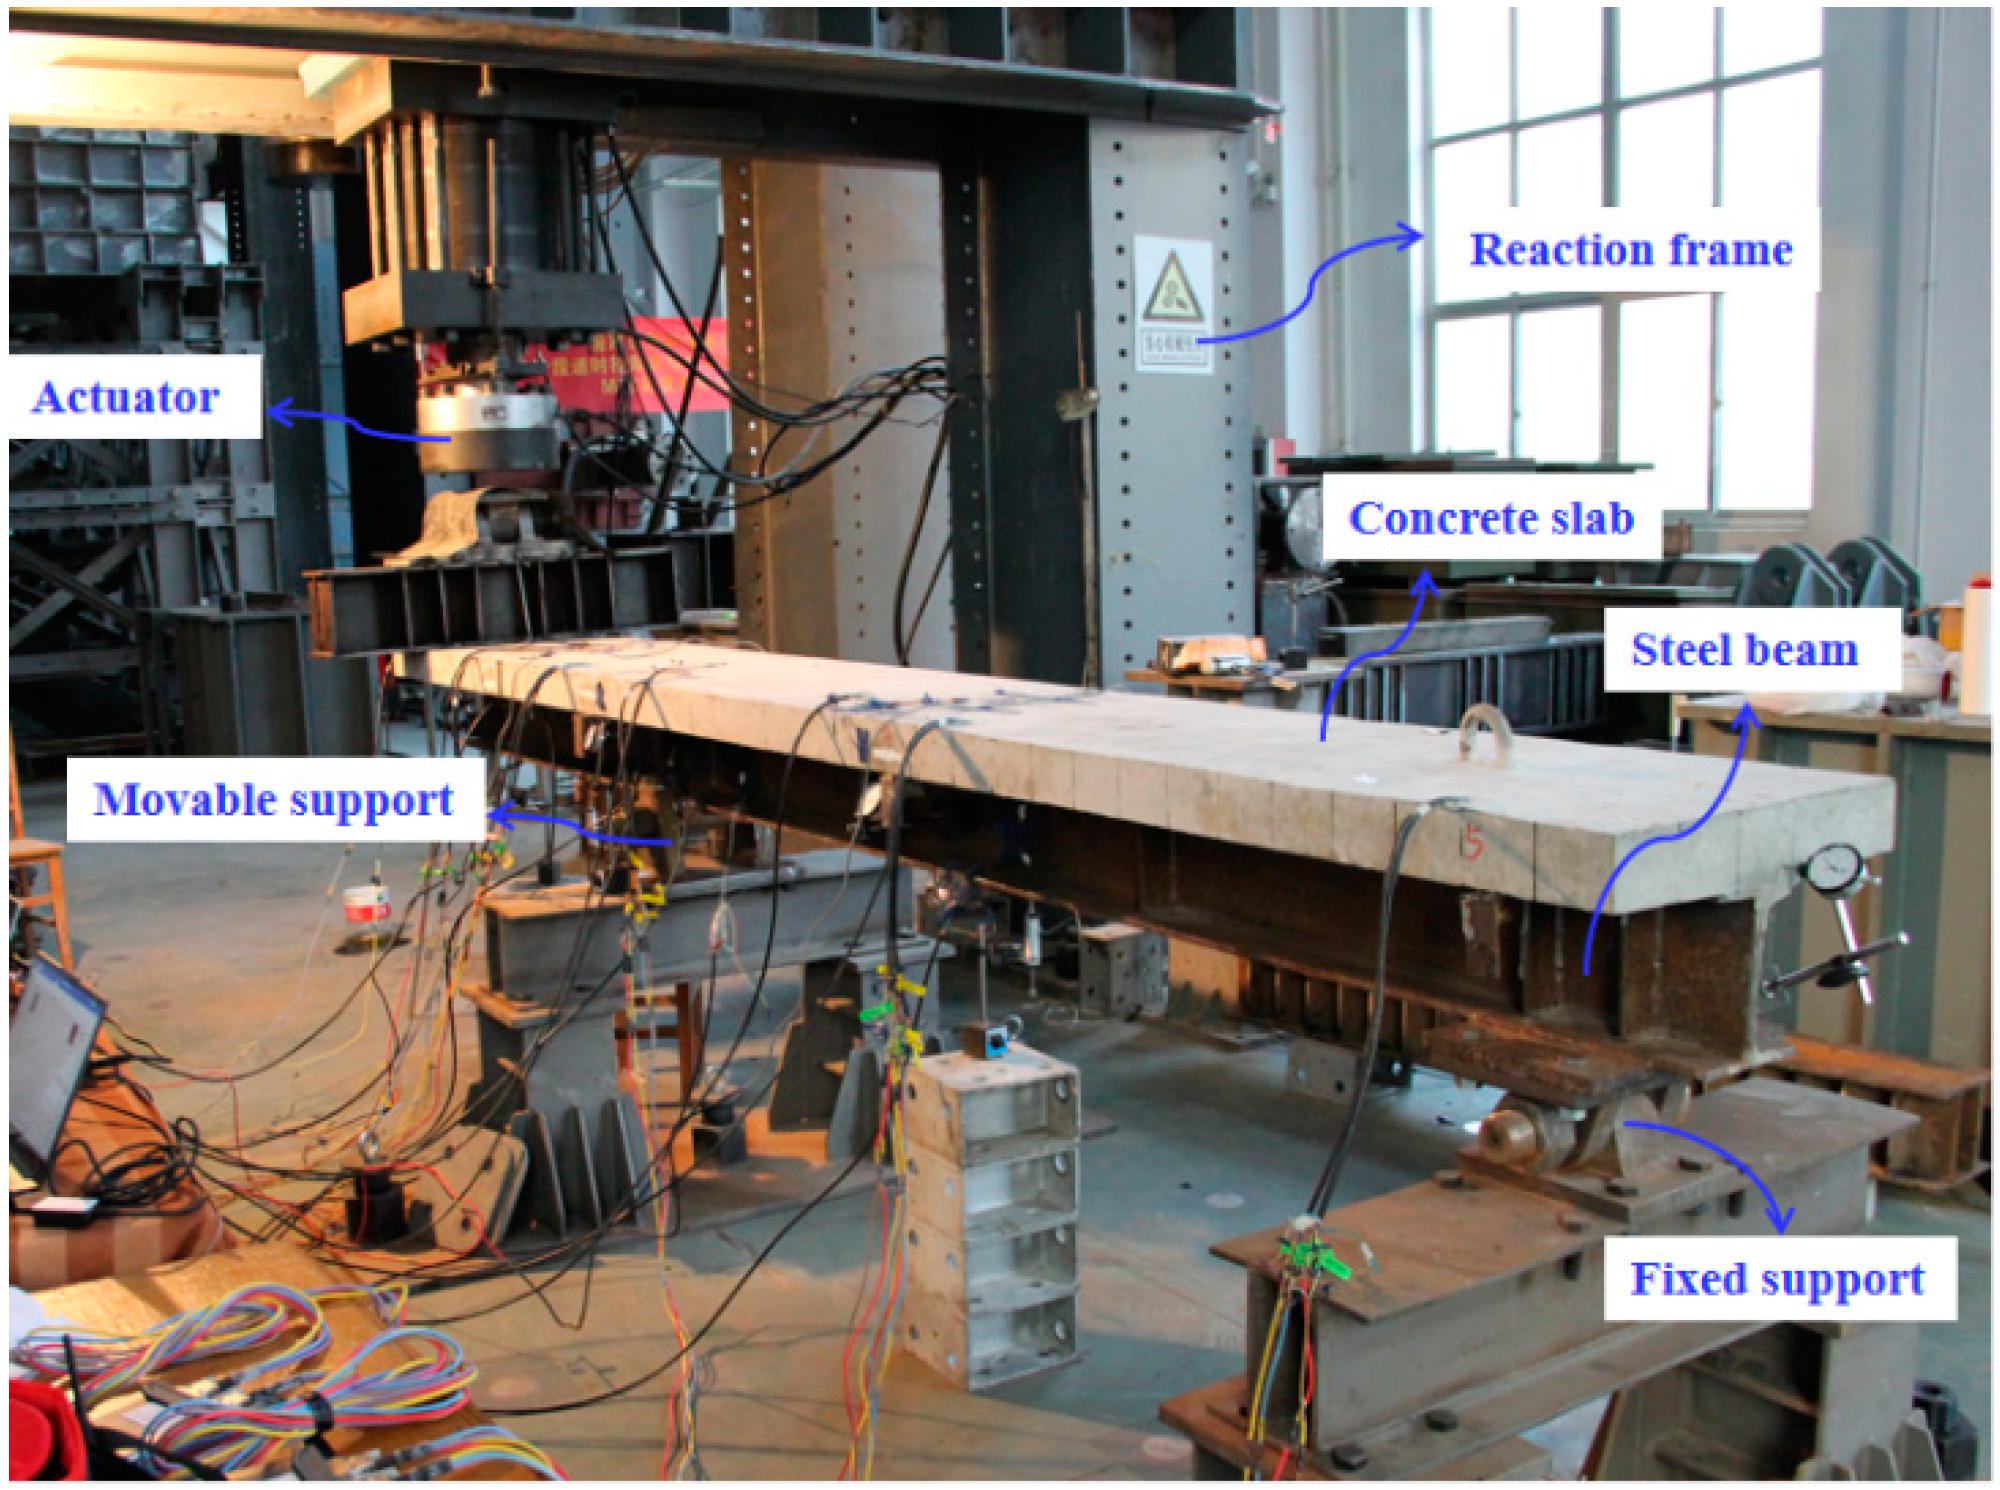
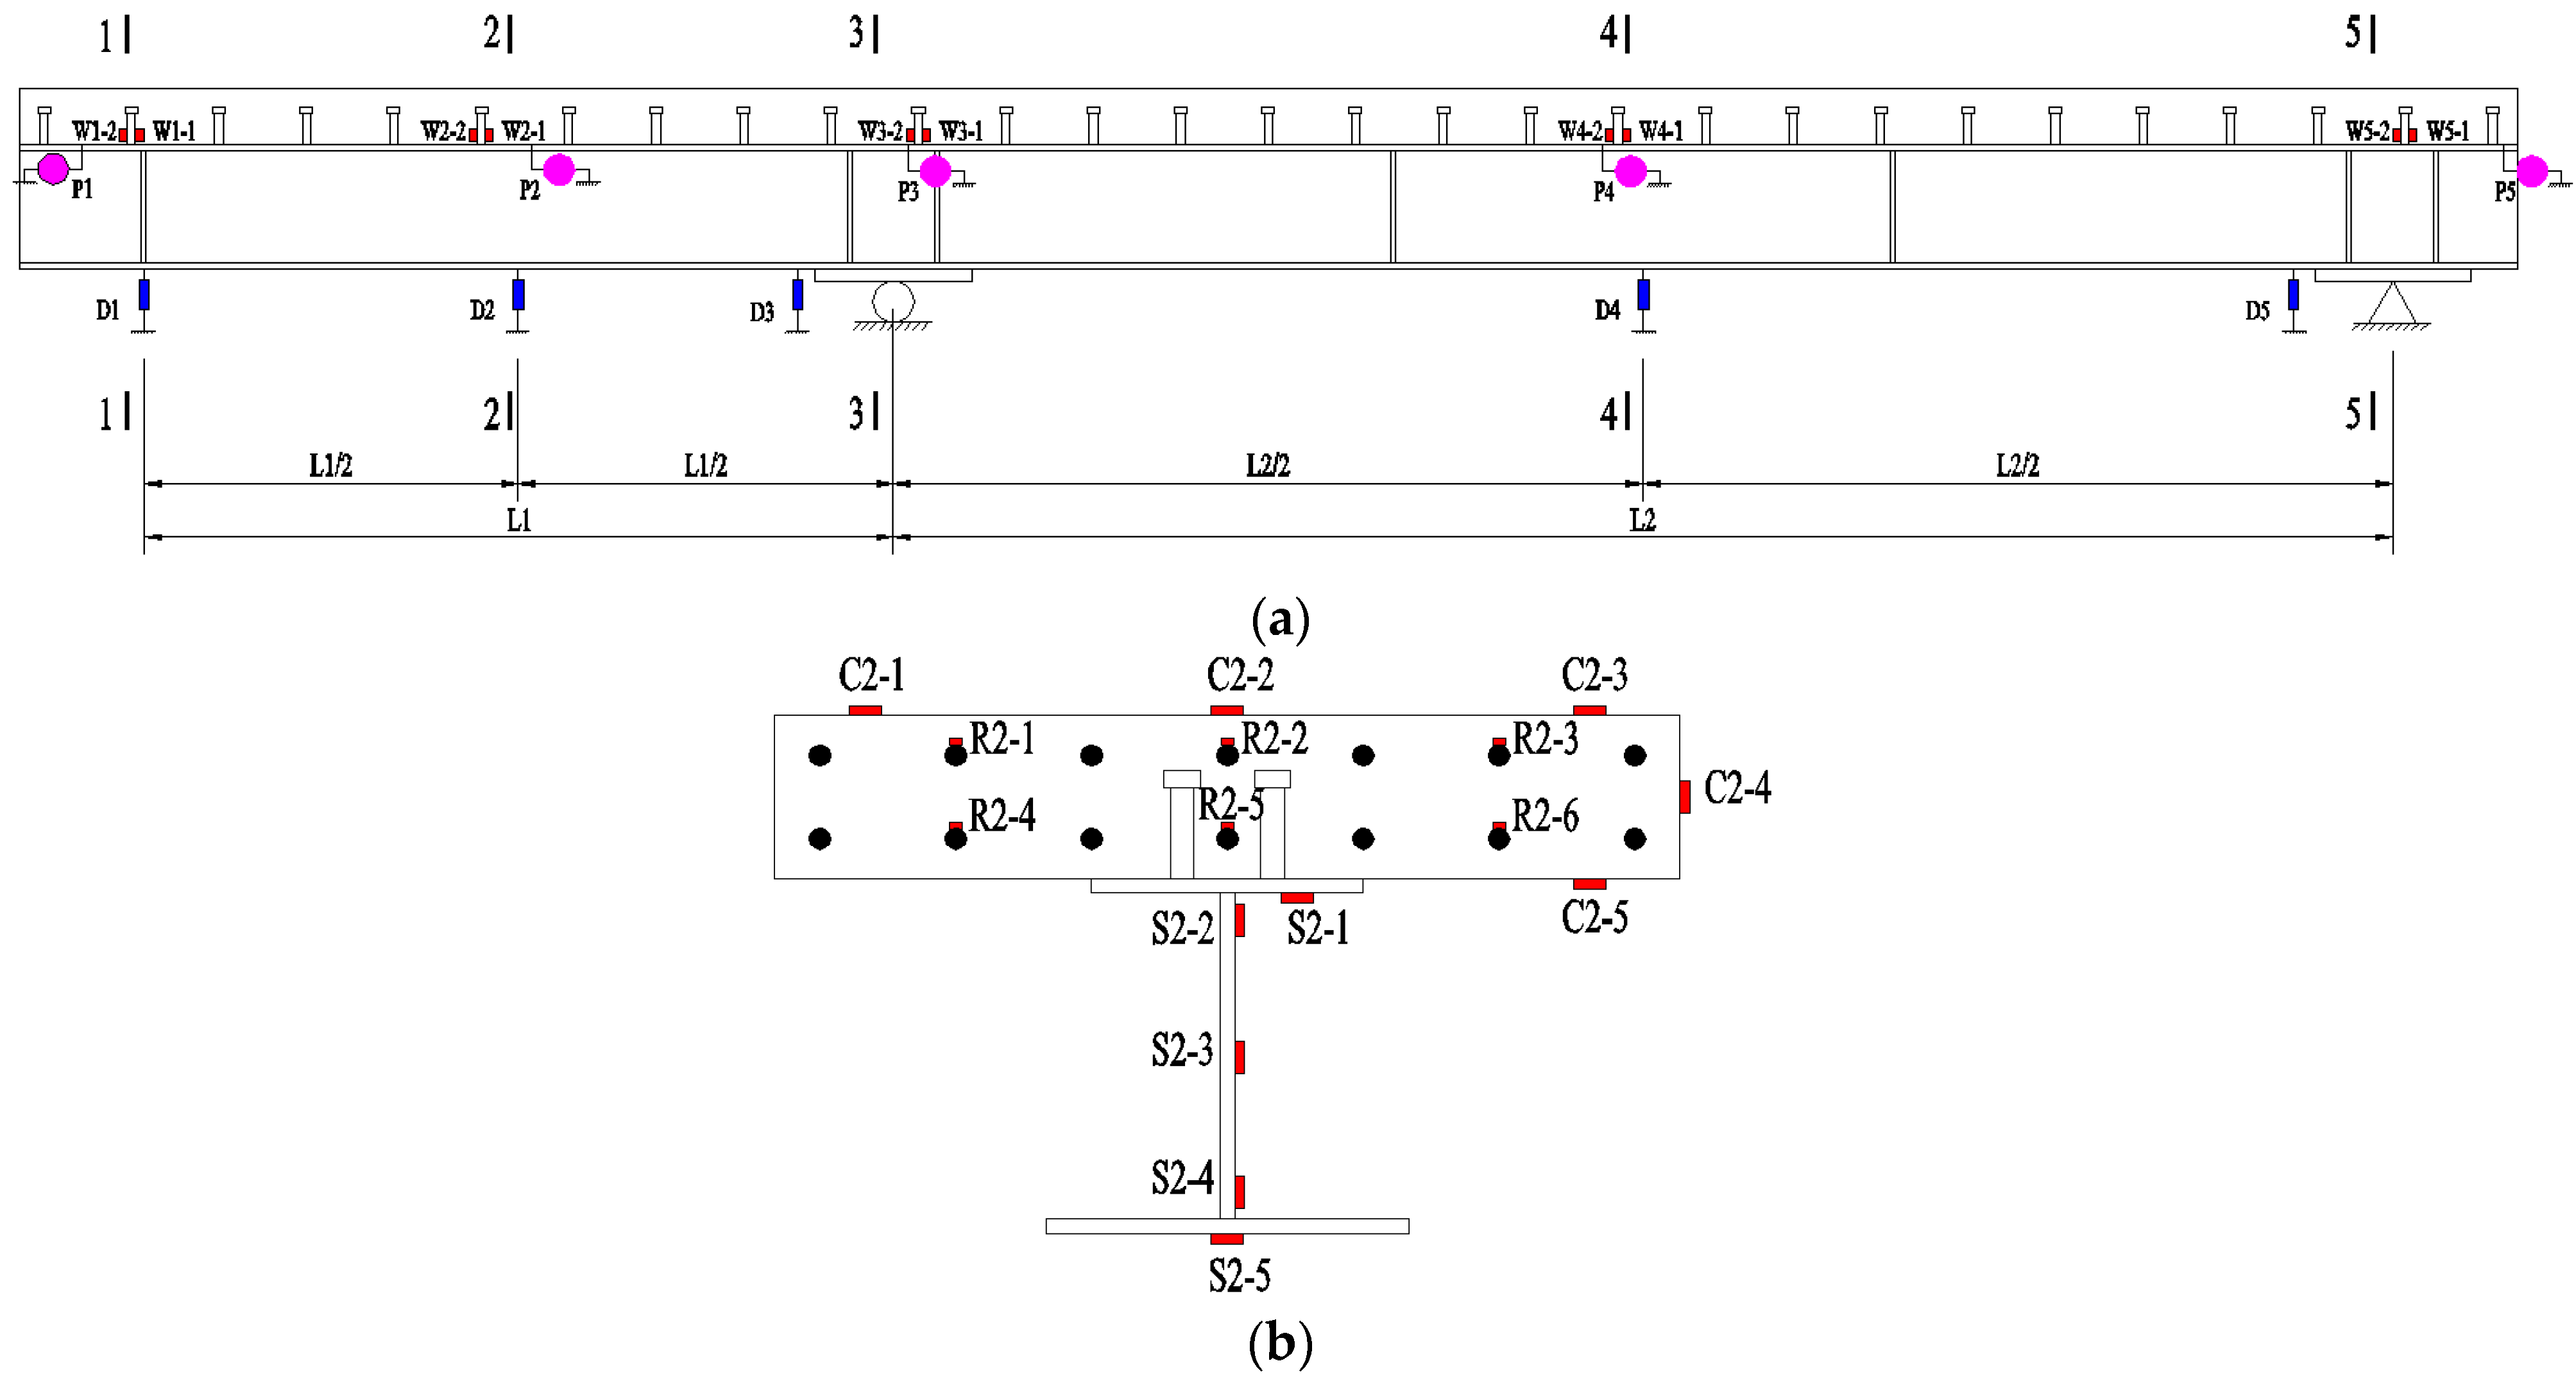
2.3. Loading Procedure
2.4. Test Procedure
3. Experimental Results and Theoretical Derivation
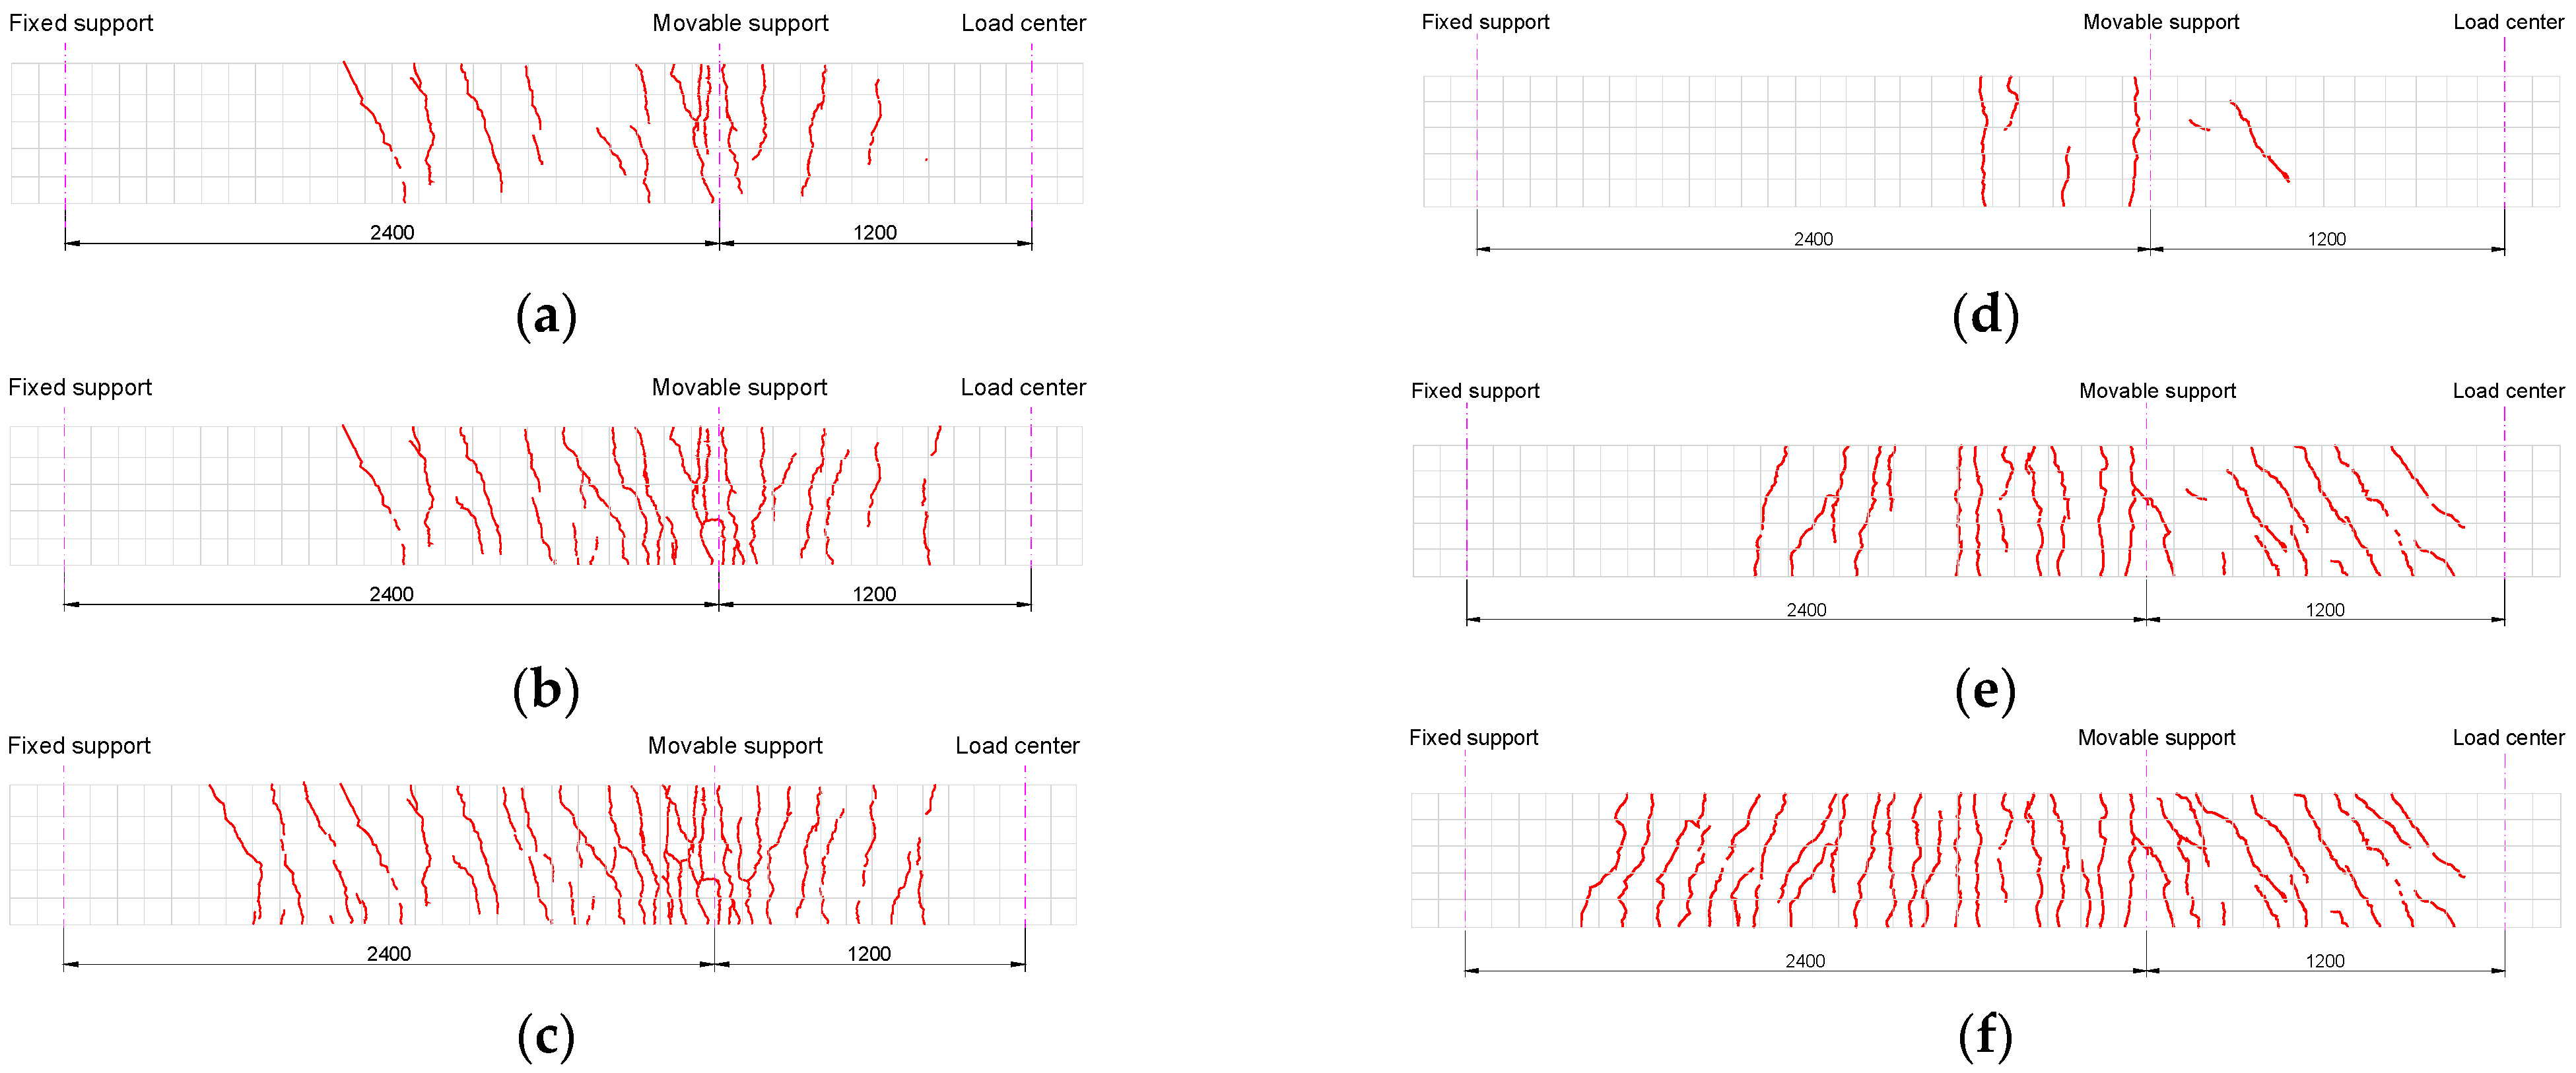
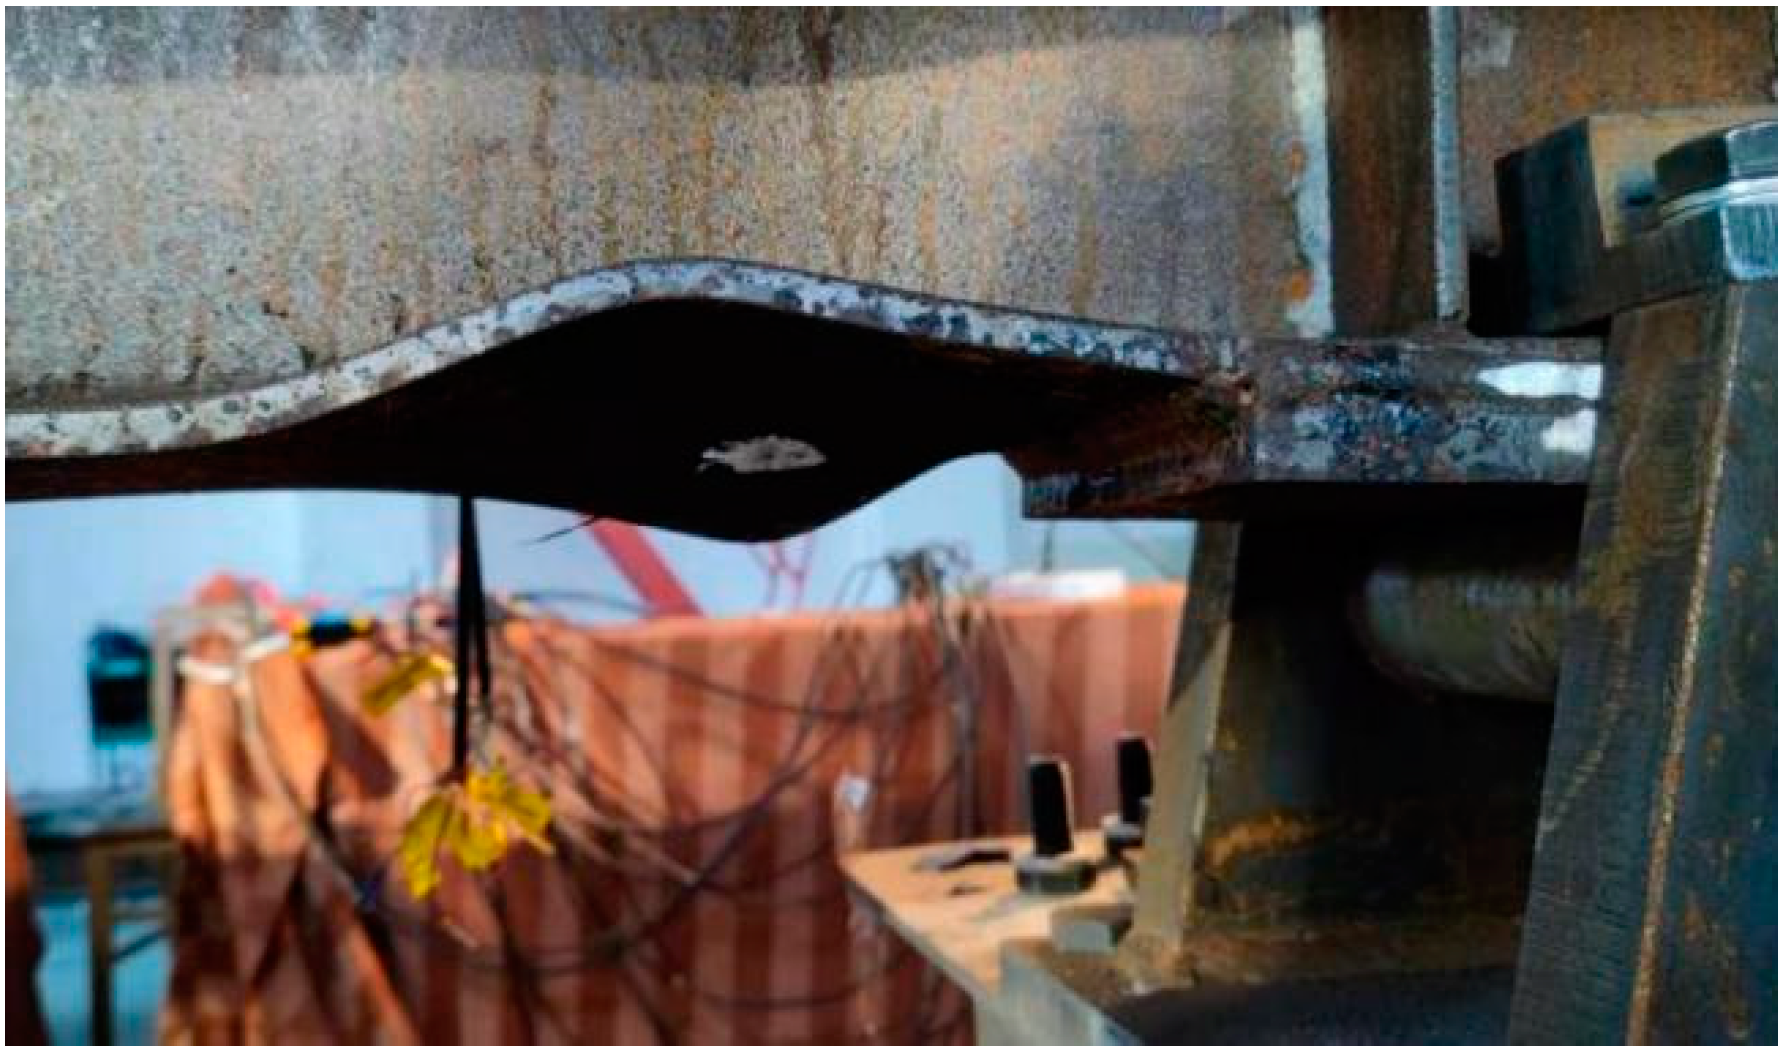
3.1. Test Phenomena
3.1.1. Test Phenomena of CSB-1
3.1.2. Test Phenomena of CSB-2
3.2. Crack Analysis
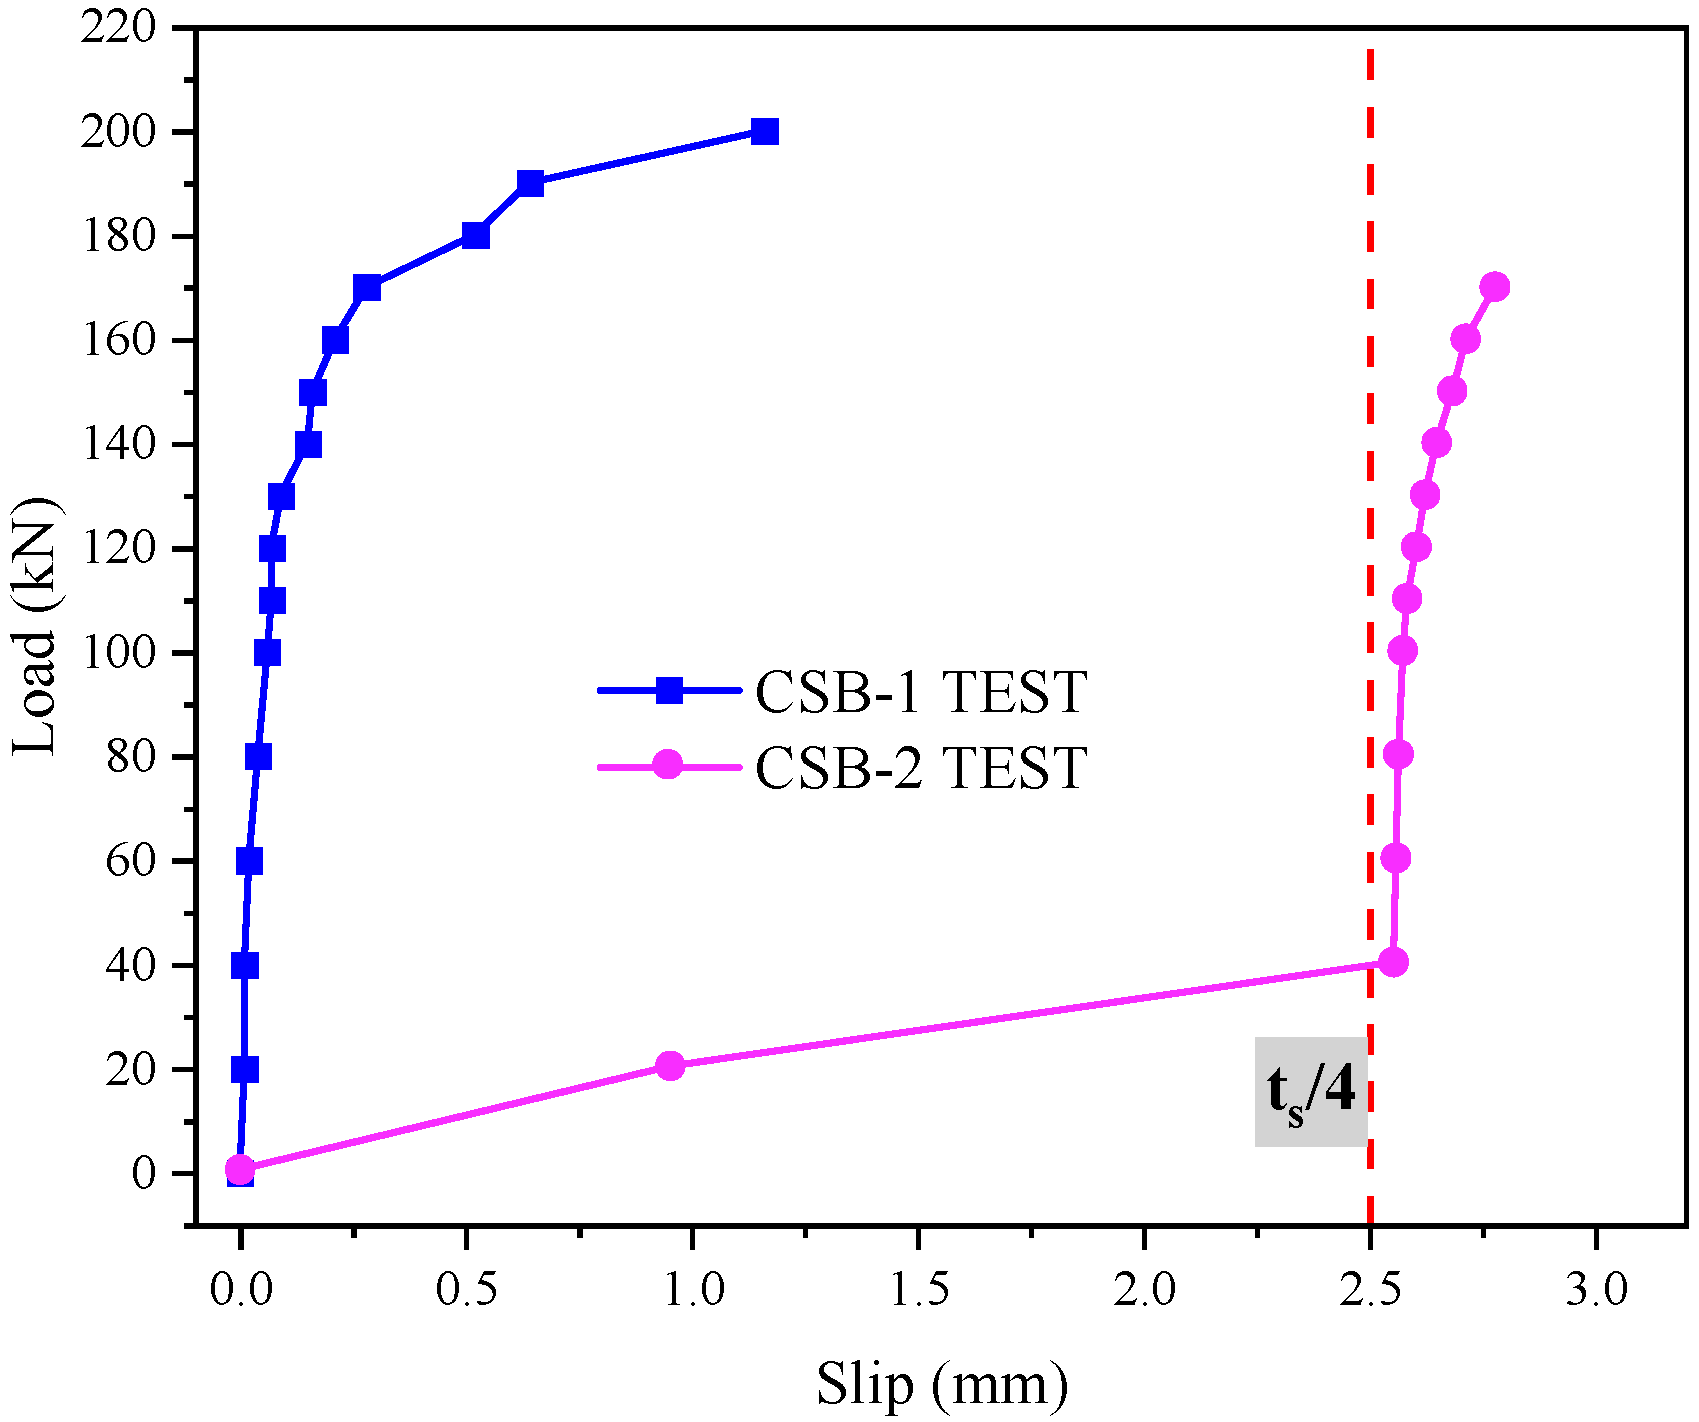
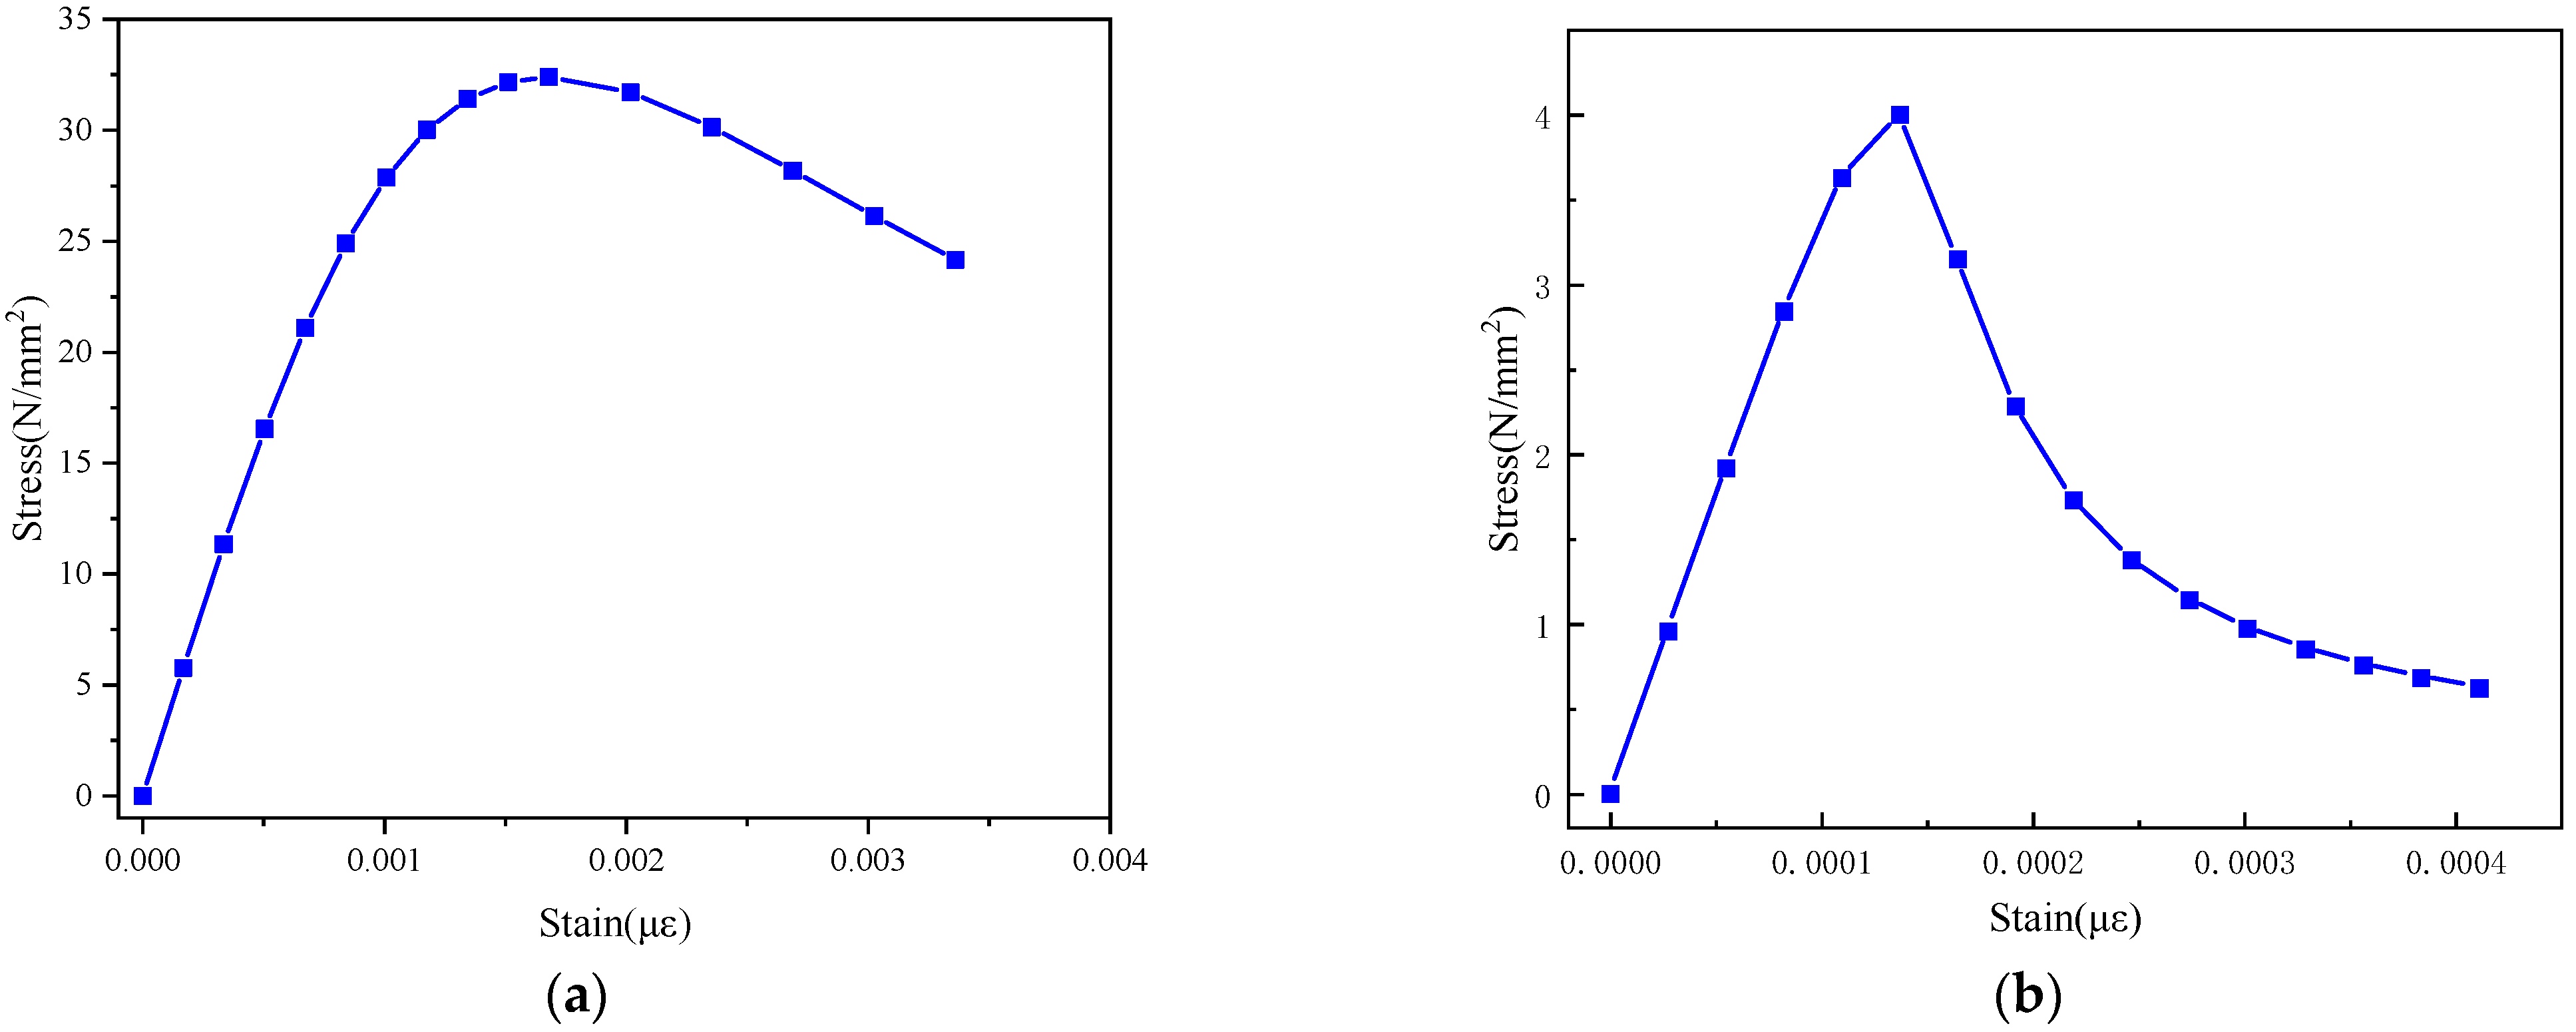
3.3. Interface Slip Analysis
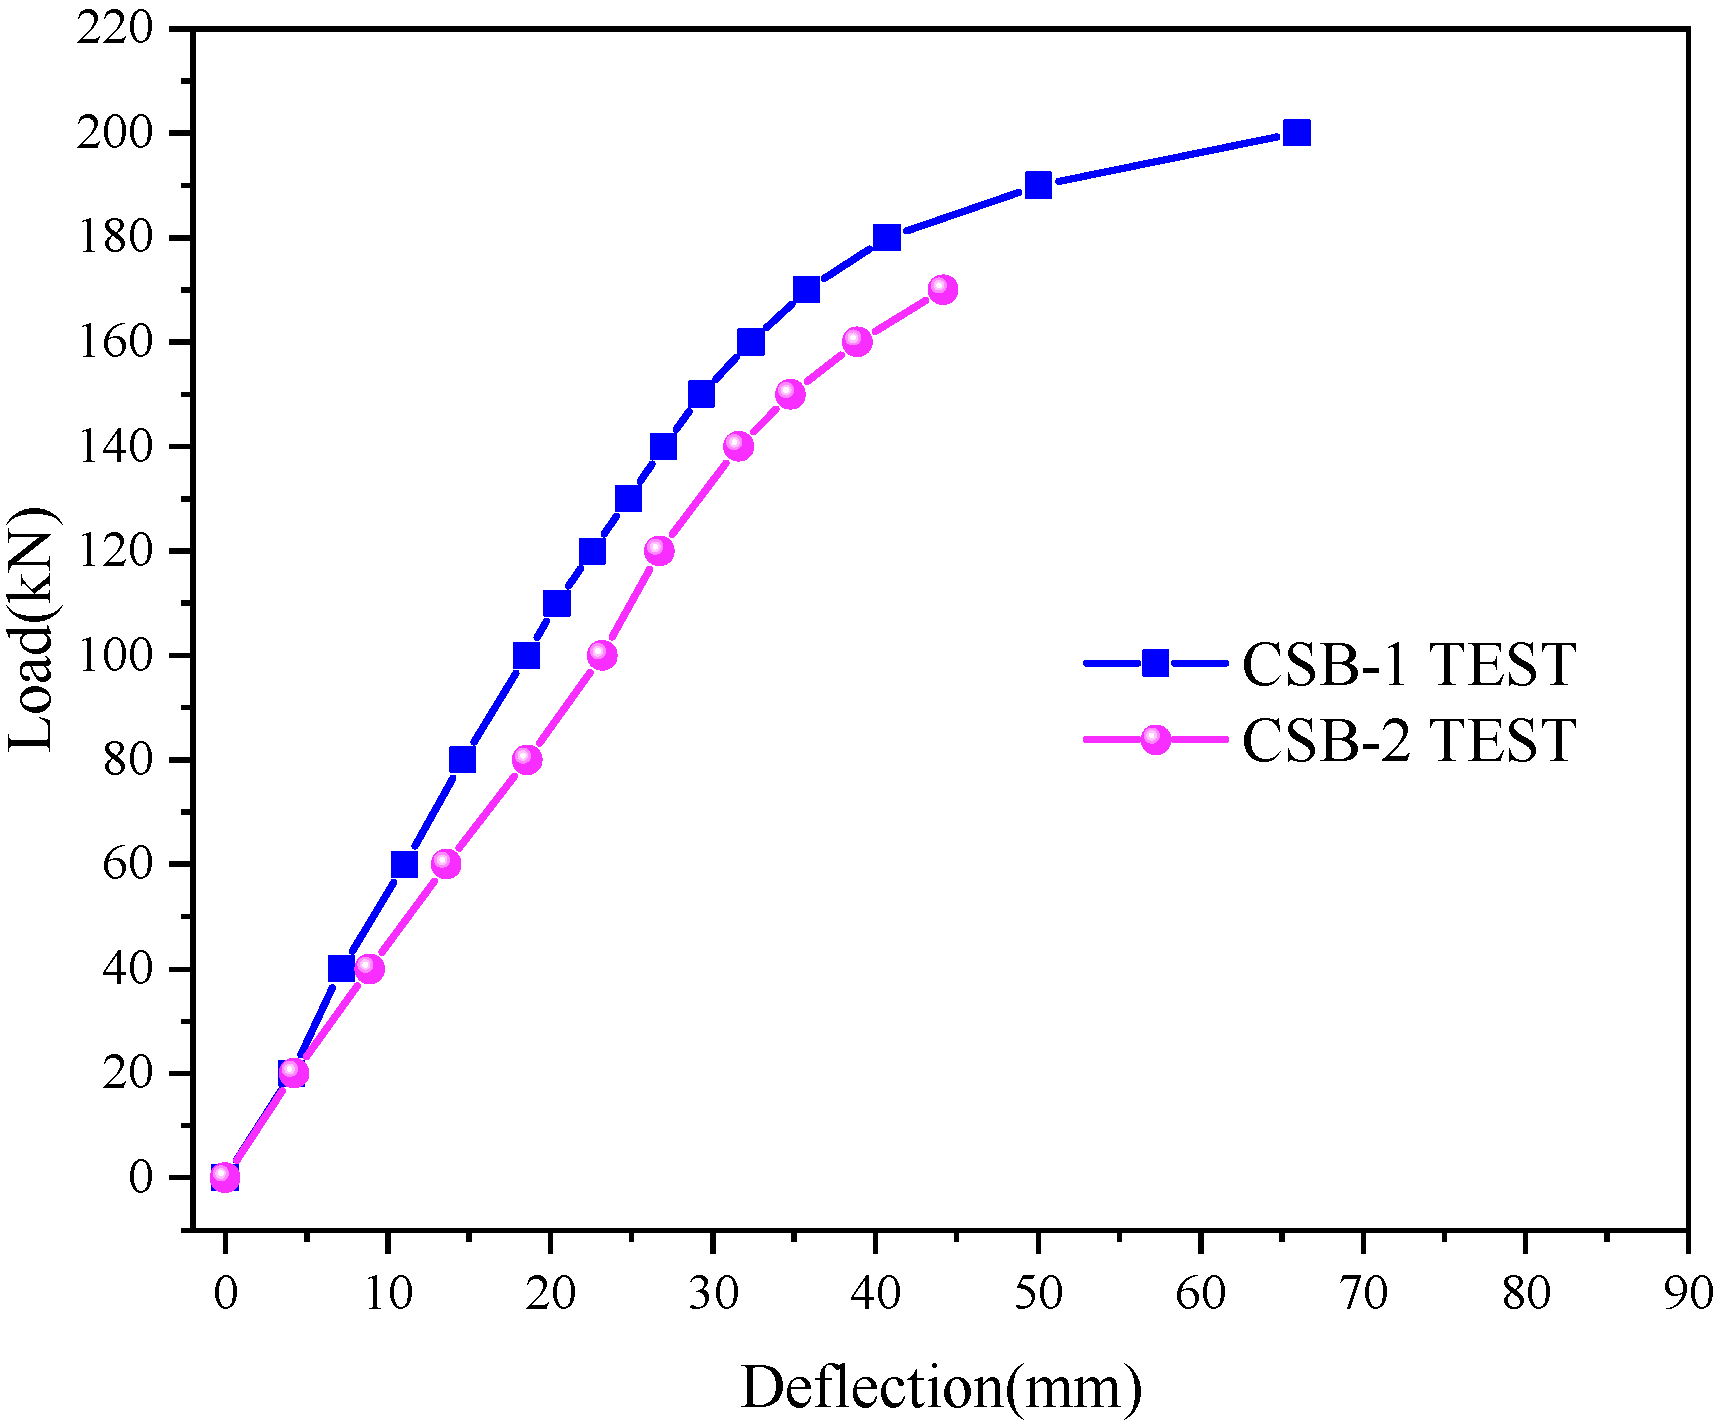
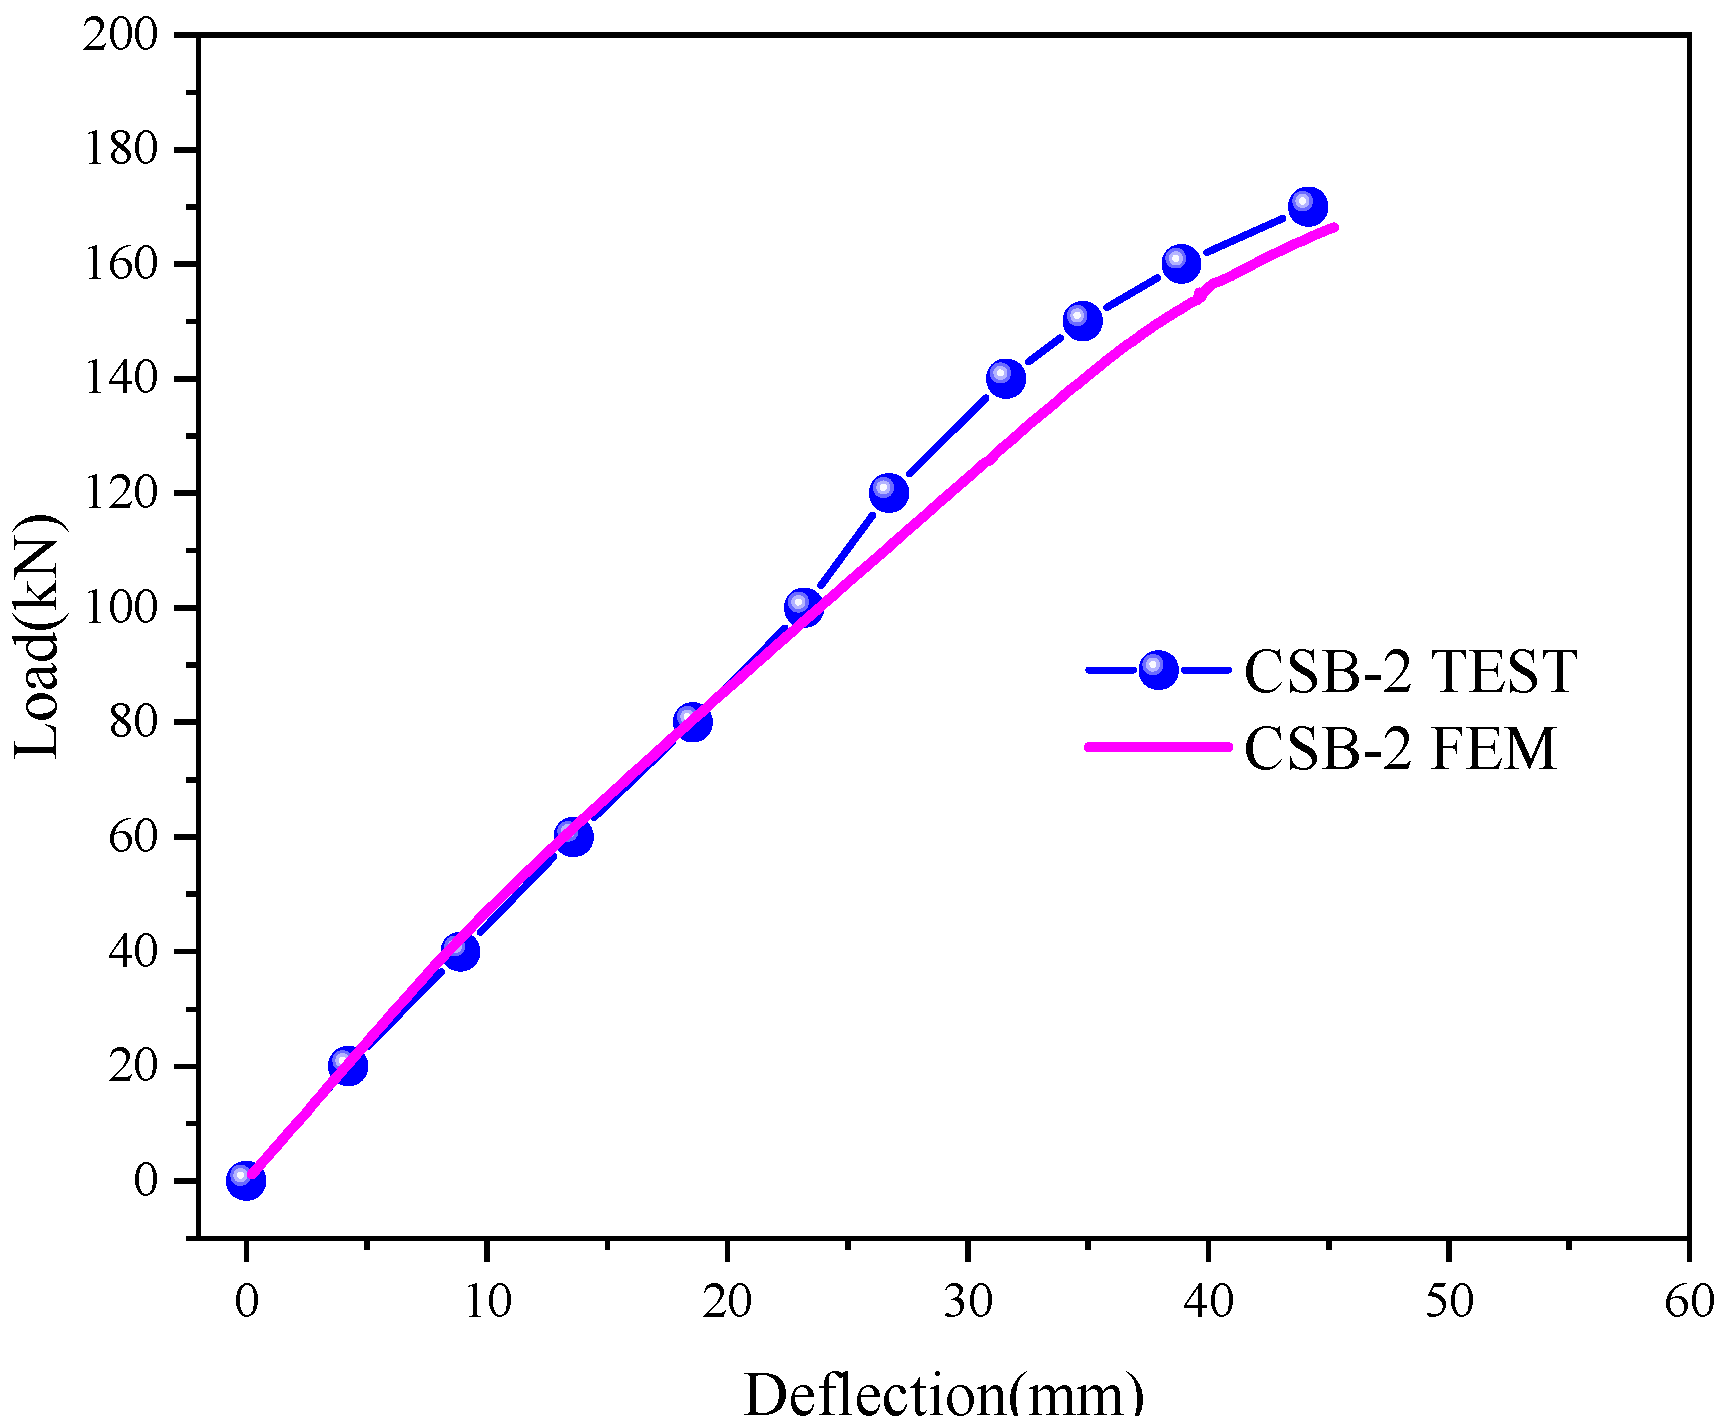
3.4. Load–Deflection Curves
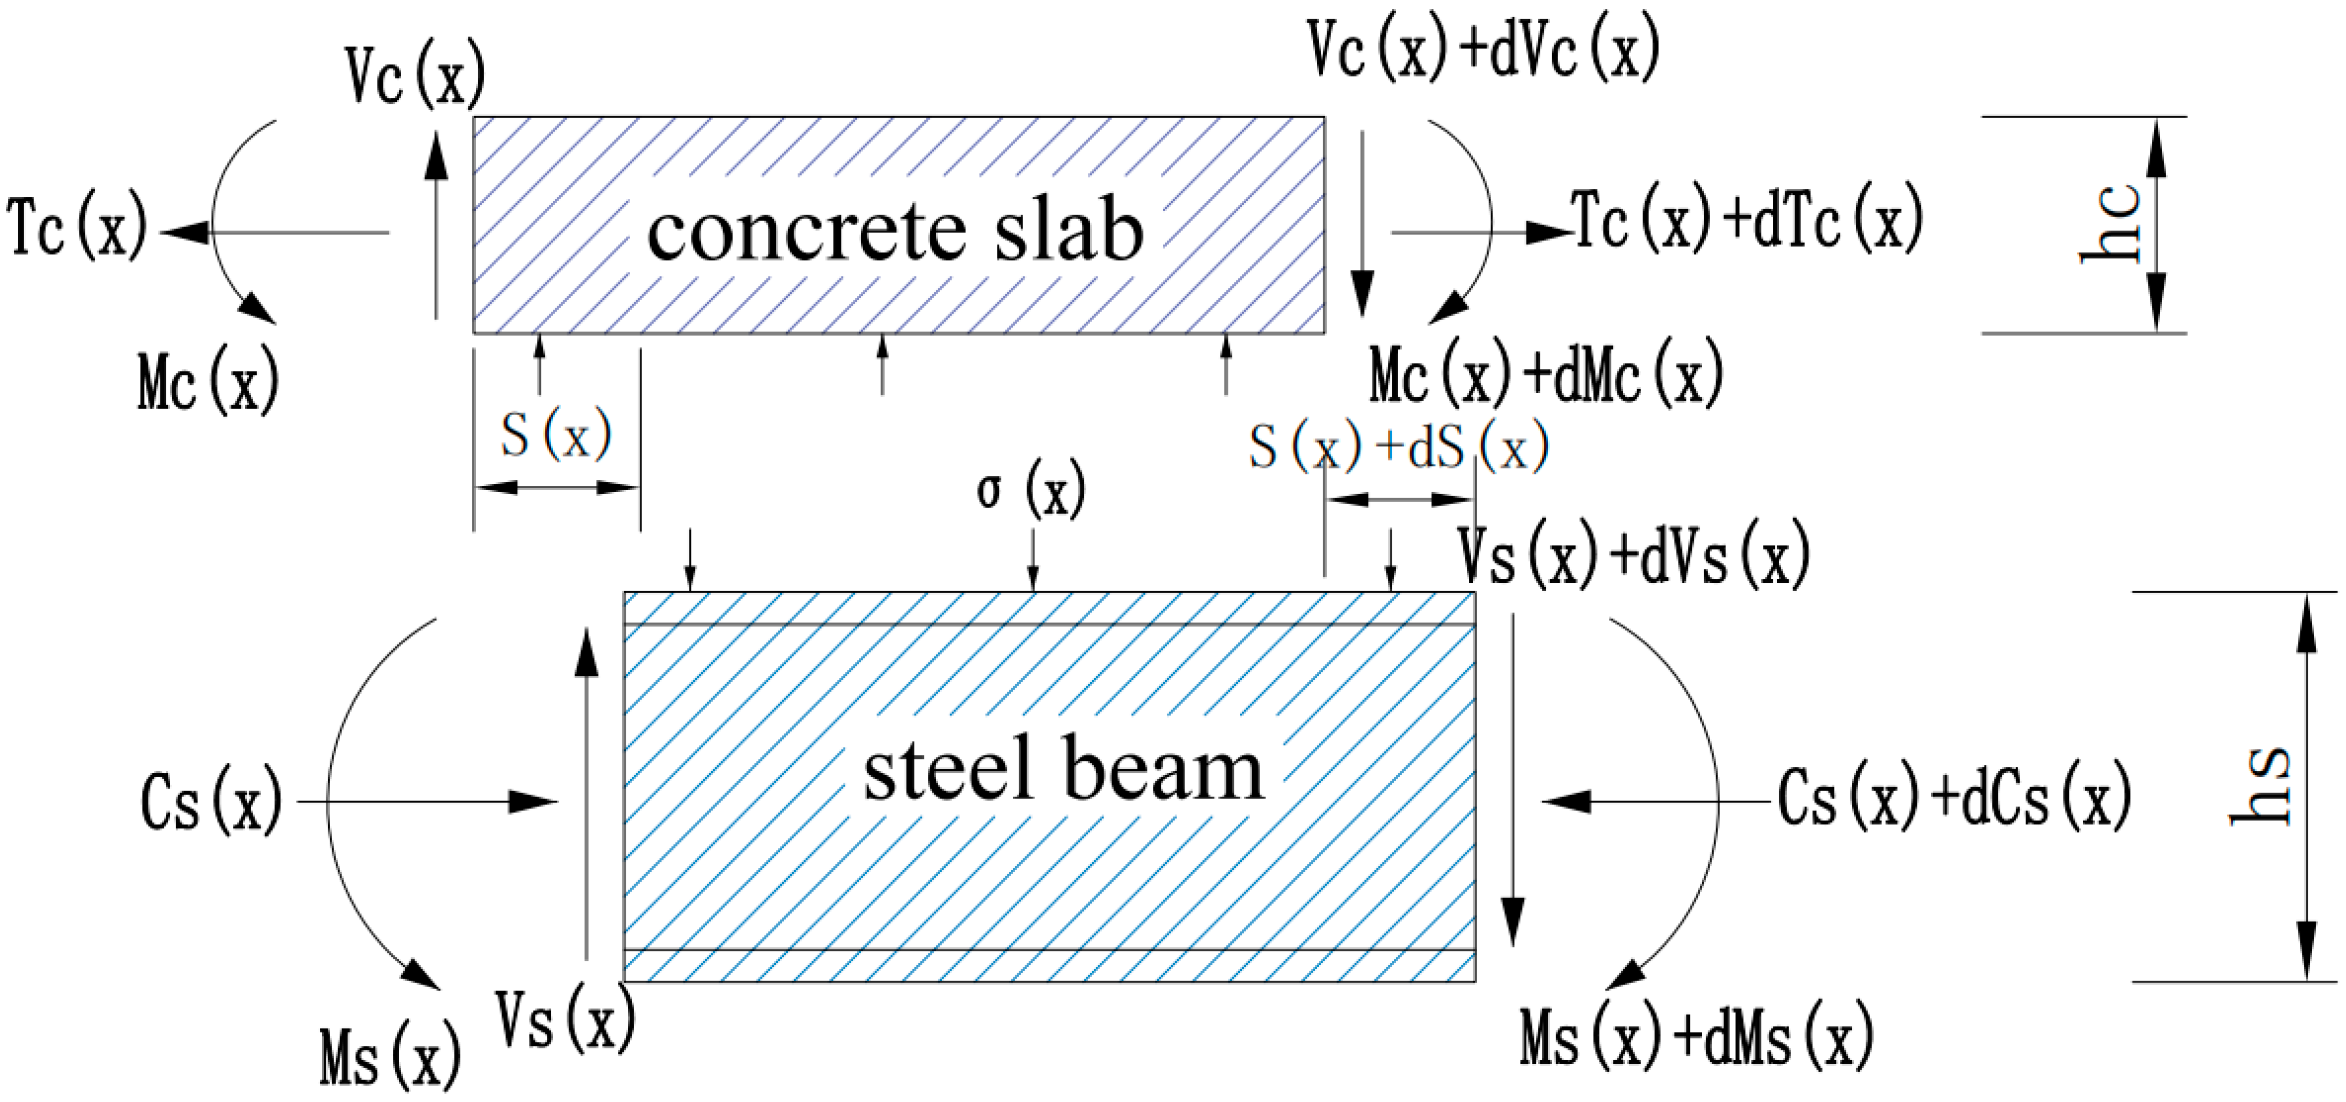
3.5. Theoretical Derivation
3.5.1. Cracking Moment of Concrete
- (1)
- The calculated values are in good agreement with the test values, indicating that the method proposed in this paper can accurately calculate the cracking moment in the negative moment region of the composite beam.
- (2)
- Compared with the composite beam with ordinary studs, the cracking moment of concrete can be improved by using MURSP connectors in the negative bending moment region.
3.5.2. Additional Deflection
4. Numerical Analyses
4.1. Analysis Step
- (1)
- Establish the solid models of steel beam, MURSP connectors, concrete slab and reinforcements according to the dimensions of the test beam.
- (2)
- Assign the material properties of steel beam, MURSP connectors, concrete slab and reinforcements, respectively.
- (3)
- Divide all solid models into finite elements.
- (4)
- Determine the contact between reinforcement and concrete, MURSP connectors and concrete, and concrete and steel beam.
- (5)
- Apply the load to the overhanging end of the overhanging beam and then calculate.
- (6)
- Compare the calculation results with the test results to verify the accuracy of the finite element model.
- (7)
- Analyze the mechanical properties of the MURSP connectors.
4.2. Finite Element Model
4.2.1. Element Types
4.2.2. Material Properties
4.2.3. Contact
4.2.4. Boundary Condition and Loading Application
4.3. Comparison of Calculation Results
4.3.1. Failure Mode
4.3.2. Load–Deflection Curves
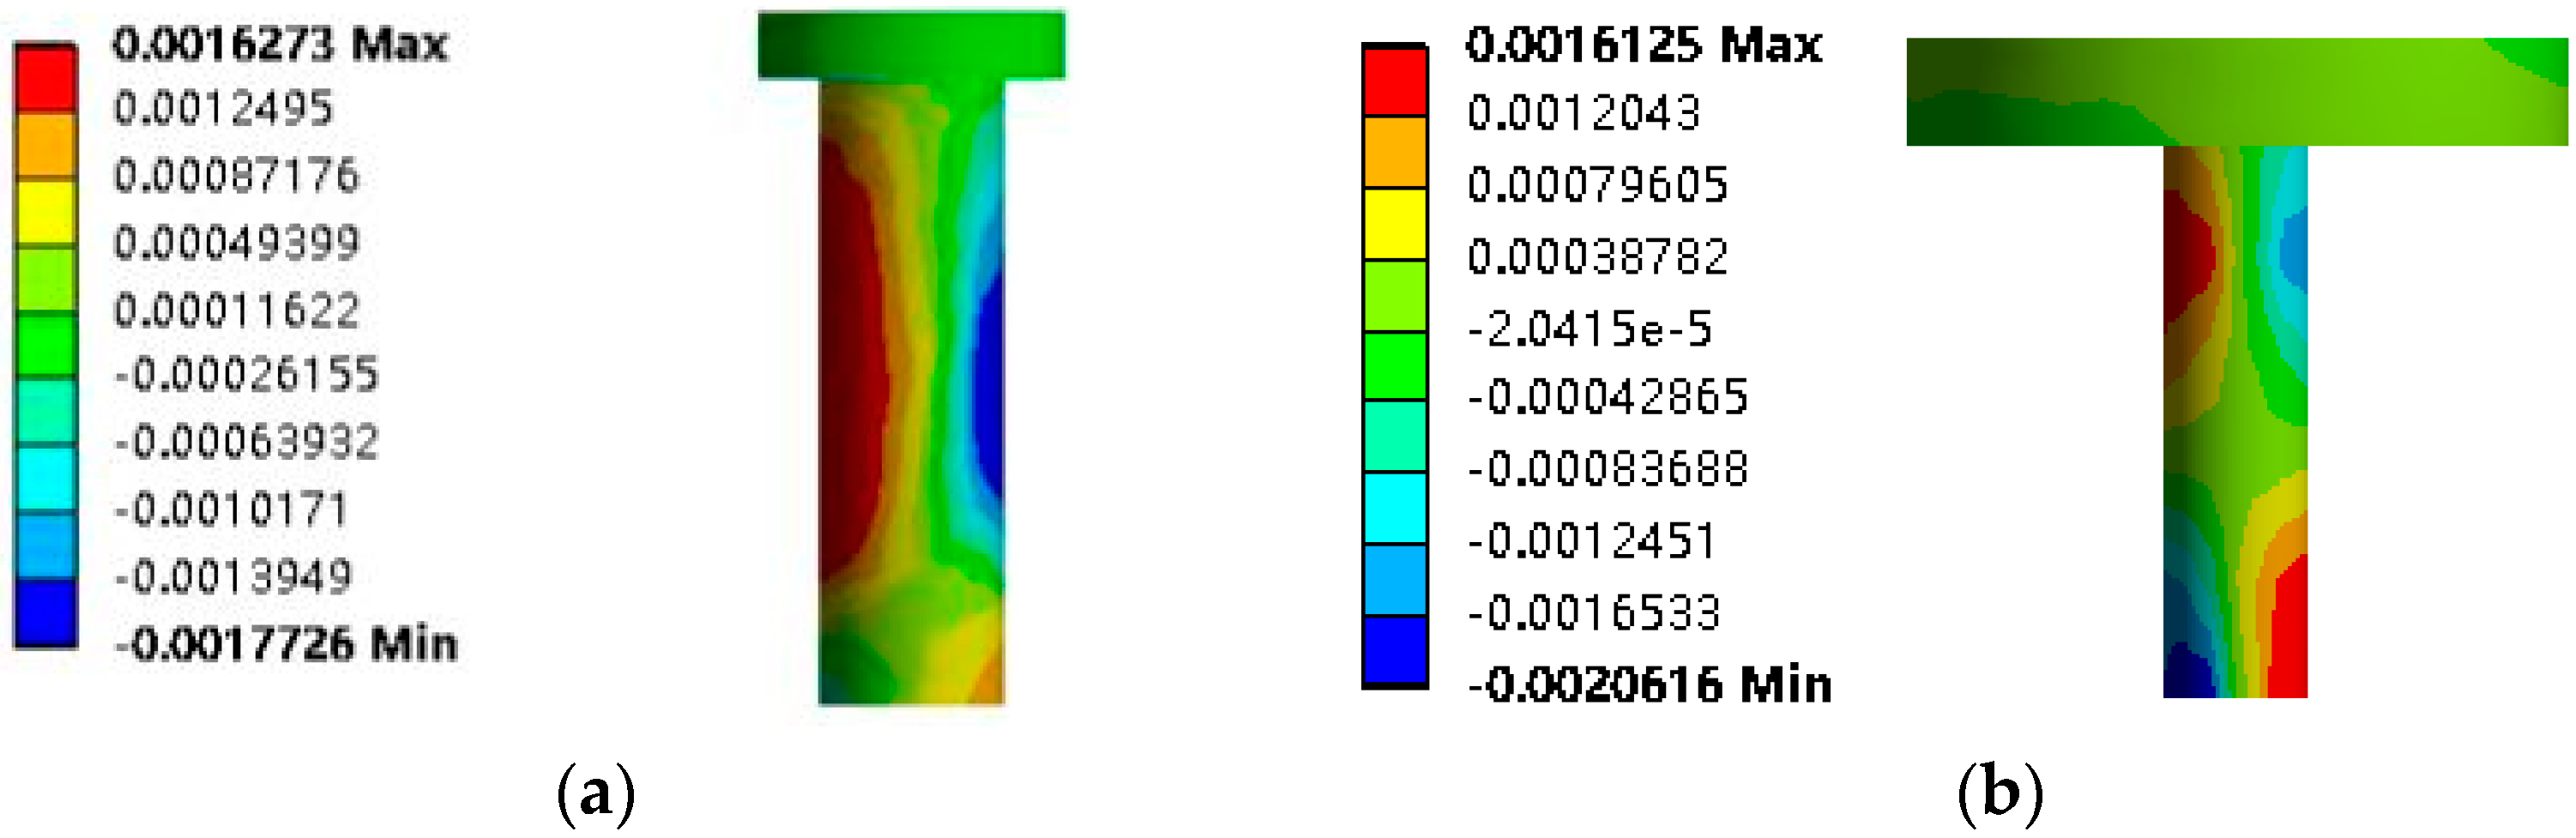
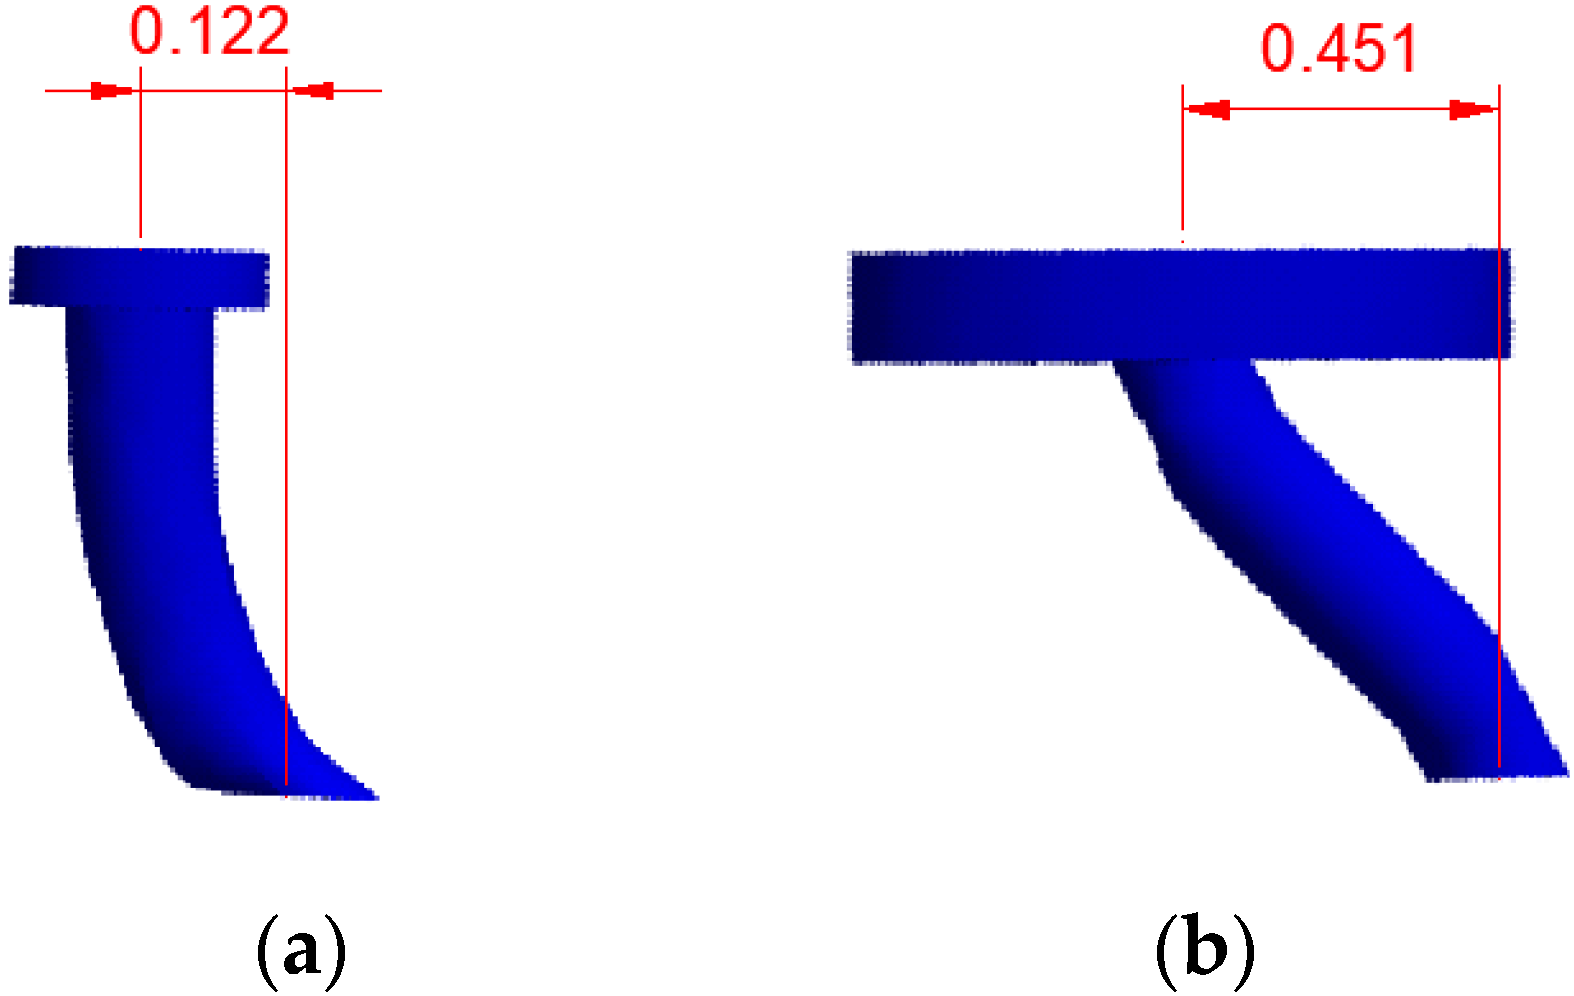
4.4. Mechanical Morphology Analysis of the Studs
5. Conclusions
- (1)
- The proposed composite beam with MURSP connectors could effectively release the tensile stress of concrete, thereby increasing the crack load.
- (2)
- Compared with composite beams with common studs, the slip composite beams with MURSP connectors increased significantly in the negative-bending moment region, and the slip mainly occurred in the early loading stage. The use of MURSP connectors weakened the bond between the steel beam and the concrete slab. During the loading process, the center axis appeared in the concrete slab of the composite overhanging beam with MURSP connectors, while the neutral axis did not appear in the concrete slab of the ordinary composite overhanging beam.
- (3)
- The overall flexural stiffness of the overhanging beam with MURSP connectors proposed in this paper was reduced by 3.08% compared with that of ordinary studs.
- (4)
- Accurate finite element models of the overhanging beams with ordinary studs and MURSP connectors were established while fully considering the nonlinearity of the materials and the contact relationships between the components, and the mechanical properties of the test beams were analyzed. The accuracy of the finite element models was proven by comparing the results.
- (5)
- The finite element analysis showed that the ordinary stud and the MURSP connector exhibited different stress and deformation states in the negative-moment region of the composite beams. The ordinary stud exhibited bending deformation, while the MURSP exhibited shear deformation. Under the same load, the displacement difference between the top and bottom of the latter was approximately 3.7 times that of the former.
6. Further Research
Author Contributions
Funding
Data Availability Statement
Conflicts of Interest
References
- Nie, J.-G.; Li, Y.-X.; Tao, M.-X.; Nie, X. Uplift-restricted and slip-permitted T-shape connectors. J. Bridge Eng. 2015, 20, 04014073. [Google Scholar] [CrossRef]
- Nie, X.; Nie, J.-G.; Tao, M.-X.; Fan, J.-S.; Zhang, Z.-X.; Tang, H.-Y. Study on steel-concrete continuous composite bridge connected by new type of steel-concrete connector without shear resistance. Harbin Gongye Daxue Xuebao (J. Harbin Inst. Technol.) 2012, 44, 95–100. [Google Scholar]
- Chen, Y.; Yan, Q.; Yu, X.; Jia, B.; Wu, Y.; Luo, Y. Experimental and Numerical Research on Uplift-Restricted and Slip-Permitted Screw-Shaped Connectors. Int. J. Steel Struct. 2022, 22, 225–239. [Google Scholar] [CrossRef]
- Wang, W.; Zhang, X.-D.; Zhou, X.-L.; Zhang, B.; Chen, J.; Li, C.-H. Experimental study on shear performance of an advanced bolted connection in steel-concrete composite beams. Case Stud. Constr. Mater. 2022, 16, e01037. [Google Scholar] [CrossRef]
- Nie, X.; Duan, L.; Tao, M.; Guo, Y. Experimental investigation on the behavior of the steel—Concrete composite frames with uplift-restricted and slip-permitted screw-type (URSP-S) connectors. Eng. Struct. 2022, 254, 113868. [Google Scholar] [CrossRef]
- Li, Z.; Ma, X.; Fan, J.; Nie, X. Overhanging Tests of Steel-Concrete Composite Girders with Different Connectors. J. Bridge Eng. 2019, 24, 04019098. [Google Scholar] [CrossRef]
- Duan, L.; Nie, X.; Ding, R.; Zhuang, L. Research on application of uplift-restricted slip-permitted (URSP) connectors in steel-concrete composite frames. Appl. Sci. 2019, 9, 2235. [Google Scholar] [CrossRef]
- Nie, J.; Tao, M.; Nie, X.; Fan, J. New technique and application of uplift-restricted and slip-permitted connection. China Civ. Eng. J. 2015, 4, 7–14. [Google Scholar]
- Nawar, M.T.; El-Zohairy, A.; Maaly, H.M.; Husain, M.; Salama, I.; Mousa, E. Prestressed Steel-Concrete Composite I-Beams with Single and Double Corrugated Web. Buildings 2023, 13, 647. [Google Scholar] [CrossRef]
- Sirimontree, S.; Thongchom, C.; Keawsawasvong, S.; Nuaklong, P.; Jongvivatsakul, P.; Dokduea, W.; Bui, L.V.H.; Farsangi, E.N. Experimental study on the behavior of steel—Concrete composite decks with different shear span-to-depth ratios. Buildings 2021, 11, 624. [Google Scholar] [CrossRef]
- Luo, B.; Ma, B. Experimental study of fatigue performance of steel-UHPC-NC composite beam in negative moment zone. Bridge Constr. 2021, 51, 58–65. [Google Scholar]
- Zhu, J.; Wang, X.; Ding, J. Experimental Study on the Flexural Behavior of Steel-UHPC Composite Beams with Waffle Slab in Negative Moment Regions. China J. Highw. Transp. 2021, 34, 234. [Google Scholar]
- Vasdravellis, G.; Uy, B.; Tan, E.; Kirkland, B. Behaviour and design of composite beams subjected to negative bending and compression. J. Constr. Steel Res. 2012, 79, 34–47. [Google Scholar] [CrossRef]
- Lin, W.; Yoda, T. Mechanical behaviour of composite girders subjected to hogging moment: Experimental study. J. Jpn. Soc. Civ. Eng. Ser. A1 (Struct. Eng. Earthq. Eng. (SE/EE)) 2011, 67, 583–596. [Google Scholar]
- Rossi, A.; de Souza, A.S.C.; Nicoletti, R.S.; Martins, C.H. Stability behavior of steel-concrete composite beams subjected to hogging moment. Thin-Walled Struct. 2021, 167, 108193. [Google Scholar] [CrossRef]
- Lou, T.; Karavasilis, T.L. Numerical assessment of the nonlinear behavior of continuous prestressed steel-concrete composite beams. Eng. Struct. 2019, 190, 116–127. [Google Scholar] [CrossRef]
- Zhu, Y.-J.; Wang, J.-J.; Nie, X.; Pan, X.-B.; Fan, J.-S. Structural performance of slabs in composite box girder considering compressive membrane action. Eng. Struct. 2020, 212, 110457. [Google Scholar] [CrossRef]
- Dezi, L.; Gara, F.; Leoni, G.; Tarantino, A.M. Time-dependent analysis of shear-lag effect in composite beams. J. Eng. Mech. 2001, 127, 71–79. [Google Scholar] [CrossRef]
- Ministry of Housing and Urban-Rural Development of the People’s Republic of China. Standard for Test Method of Concrete Physical and Mechanical Properties; China Architecture & Building Press: Beijing, China, 2019. [Google Scholar]
- Cao, W.; Bu, J.; Zhao, C.; Wang, X.; Zhang, L.; Zhang, J. Stiffness Calculation for Negative Moment Region of Steel-Concrete Composite Beams considering the Influence of Cracking and Interface Slip. Adv. Mater. Sci. Eng. 2022, 2022, 5171416. [Google Scholar] [CrossRef]
- Inspection and Quarantine of the People’s Republic of China. Metallic Materials-Tensile Testing-Method of Test at Ambient Temperature; Standards Press of China: Beijing, China, 2010. [Google Scholar]
- Inspection and Quarantine of the People’s Republic of China. Cheese Head Studs for Arc Stud Welding; Standards Press of China: Beijing, China, 2002. [Google Scholar]
- Inspection and Quarantine of the People’s Republic of China. Steels for Cold Heading and Cold Extruding; Standards Press of China: Beijing, China, 2015. [Google Scholar]
- Nie, X. Study on the Structural Behavior of Key Components in Steel-Concrete Composite Rigid Frame Bridge; Tsinghua University: Beijing, China, 2013. [Google Scholar]
- Han, S.W. Experimental Study on Steel-Concrete Composite Beam with UpliftRestricted and Slip-Permitted Connectors; Tsinghua University: Beijing, China, 2016. [Google Scholar]
- Ministry of Housing and Urban-Rural Development of the People’s Republic of China. Code for Design of Concrete Structures; China Architecture & Building Press: Beijing, China, 2010. [Google Scholar]
- Ignatova, A.; Sapozhnikov, S.B. Two-scale modeling of the mechanical behavior of a composite foam. Mech. Compos. Mater. 2015, 51, 655–660. [Google Scholar] [CrossRef]
- Kim, B.; Lee, S.B.; Lee, J.; Cho, S.; Park, H.; Yeom, S.; Park, S.H. A comparison among Neo-Hookean model, Mooney-Rivlin model, and Ogden model for chloroprene rubber. Int. J. Precis. Eng. Manuf. 2012, 13, 759–764. [Google Scholar] [CrossRef]
- Altheeb, A.; Alshaikh, I.M.H.; Abadel, A.; Nehdi, M.; Alghamdi, H. Effects of non-structural walls on mitigating the risk of progressive collapse of RC structures. Lat. Am. J. Solids Struct. 2022, 19, e440. [Google Scholar] [CrossRef]
- Alshaikh, I.M.H.; Abadel, A.A.; Sennah, K.; Nehdi, M.L.; Tuladhar, R.; Alamri, M. Progressive Collapse Resistance of RC Beam–Slab Substructures Made with Rubberized Concrete. Buildings 2022, 12, 1724. [Google Scholar]
- Alshaikh, I.M.; Abu Bakar, B.; Alwesabi, E.A.; Zeyad, A.M.; Magbool, H.M. Finite element analysis and experimental validation of progressive collapse of reinforced rubberized concrete frame. Structures 2021, 33, 2361–2373. [Google Scholar] [CrossRef]


| Component | Material | Elastic Modulus EC/MPa | Cube Compressive Strength fcu/MPa | Bending and Tensile Strength ft/MPa |
|---|---|---|---|---|
| Concrete | C50 | 4.113 × 10⁴ | 53.95 | 4.728 |
| Component | Material | Thickness or Diameter/mm | Yield Strength fy/MPa | Ultimate Tensile Strength fu/MPa | Elongation |
|---|---|---|---|---|---|
| Steel beam | Q355D | 10 | 415 | 536 | 30% |
| 8 | 441 | 571 | 25.5% | ||
| Steel bar | HRB400 | 10 | 451 | 668 | 21% |
| HPB300 | 6 | 334 | 478 | 25% |
| Number of the Test Beams | Test Value of Cracking Moment (kN·m) | Calculated Value of Cracking Moment (kN·m) | Percentage Difference |
|---|---|---|---|
| CSB-1 | 40.8 | 38.7 | 5.147% |
| CSB-2 | 57.6 | 49.33 | 14.41% |
| Size of the Elements | Concrete 28 mm Studs 14 mm | Concrete 24 mm Studs 12 mm | Concrete 20 Studs 10 mm |
|---|---|---|---|
| Deflection of the overhang/mm | 22.156 | 23.532 | 23.724 |
| Maximum strain of stud/(με) | 1.745 × 10⁻³ | 1.924 × 10⁻³ | 1.987 × 10⁻³ |
Disclaimer/Publisher’s Note: The statements, opinions and data contained in all publications are solely those of the individual author(s) and contributor(s) and not of MDPI and/or the editor(s). MDPI and/or the editor(s) disclaim responsibility for any injury to people or property resulting from any ideas, methods, instructions or products referred to in the content. |
© 2023 by the authors. Licensee MDPI, Basel, Switzerland. This article is an open access article distributed under the terms and conditions of the Creative Commons Attribution (CC BY) license (https://creativecommons.org/licenses/by/4.0/).
Share and Cite
Bu, J.; Cao, W.; Wang, X.; Zhang, L. Experimental Research on the Mechanical Properties of MURSP-Type Steel-Concrete Composite Beams in Negative-Moment Region. Buildings 2023, 13, 1095. https://doi.org/10.3390/buildings13041095
Bu J, Cao W, Wang X, Zhang L. Experimental Research on the Mechanical Properties of MURSP-Type Steel-Concrete Composite Beams in Negative-Moment Region. Buildings. 2023; 13(4):1095. https://doi.org/10.3390/buildings13041095
Chicago/Turabian StyleBu, Jianqing, Wenlong Cao, Xueyan Wang, and Lianpeng Zhang. 2023. "Experimental Research on the Mechanical Properties of MURSP-Type Steel-Concrete Composite Beams in Negative-Moment Region" Buildings 13, no. 4: 1095. https://doi.org/10.3390/buildings13041095