Article

Indoor Airflow Dynamics in Compartmentalized Pneumology Units Equipped with Variable-Thickness MERV-13 Filters

by
Camilo Gustavo Araújo Alves
1,*,
José Tadeu C. Junior
2,
Francisco Bernardino Da Silva Neto
3,
Gustavo R. Anjos
4,
Moisés Dantas Dos Santos
1 and
Gustavo Peixoto de Oliveira
1
1
TRIL Lab, Scientific Computing Department, Center of Informatics, Federal University of Paraíba, João Pessoa 58058-600, Brazil
2
Mechanical Engineering Department, FEI University Center, São Bernardo do Campo 09850-901, Brazil
3
Department of Infectious, Parasitic and Inflammatory Diseases, Center of Medical Sciences, Federal University of Paraíba, João Pessoa 58051-900, Brazil
4
Department of Mechanical Engineering, COPPE, Universidade Federal do Rio de Janeiro, Rio de Janeiro 21941-901, Brazil
*
Author to whom correspondence should be addressed.
Buildings 2023, 13(4), 1072; https://doi.org/10.3390/buildings13041072
Submission received: 1 March 2023 / Revised: 28 March 2023 / Accepted: 14 April 2023 / Published: 19 April 2023
(This article belongs to the Special Issue Computational Fluid Dynamics Modeling for Smart Buildings Design)

Abstract

:
Infection containment in the post-pandemic scenario became a top priority for healthcare engineering control staffers, especially in pneumology sectors, where the treatment of airborne infectious diseases is frequent. In Brazil, where COVID-19 left a long record of casualties, there is a lack of information on the influence of filtration systems on the maintenance of regulated operational conditions for indoor comfort in hospital environments. This paper has the following objectives: to study arrangements of filtering systems in hospital acclimatization ducts; to verify how filtering characteristics could compromise safety regulations for airflow in hospital environments; and to identify airflow stagnation points that might favor suspended viral concentrations and increase contamination risks. We used the computational fluid dynamics STAR-CCM+© software to perform numerical simulations of different cases of indoor airflow in a model corresponding to a sector of the Lauro Wanderley University Hospital (João Pessoa city, Brazil). We concluded that standards for maximum velocity are reachable despite thinner or thicker filters affecting the spread of the air. In this way, acclimatization systems are limited by a tradeoff between regulation and protection. Our findings are relevant to future technological development, interventions, safety strategies amidst contamination scenarios, and new filtration arrangements in hospital environments.

1. Introduction

Humankind still faces many sequela derived from the most severe health crisis in recent history. At the time of this paper being written, for instance, the number of deaths caused by the COVID-19 pandemic worldwide is around 6.7 million, and new waves of confirmed cases—so far above 664 million—fortunately seem to be milder (Source: WHO Coronavirus Dashboard. Available on https://covid19.who.int, accessed on 27 January 2023).
In the wake of this post-pandemic scenario, infection containment in community settings became a top priority [1]. According to the Center for Disease Control and Prevention (CDC), exposure to respiratory fluids laden with active SARS-CoV-2 virus is the predominant way people become infected [2]. Unfortunately, enclosed spaces are conducive to this form of propagation. Therein, people’s airways become vulnerable to droplet inhalation and suspended aerosol particles responsible for viral transmission, circumstances that demand tailored risk-reduction strategies.
When considering hospital environments as a type of construction partitioned into rooms, chambers, and halls, a few issues are of utmost concern for indoor engineering control and viral mitigation, such as highly infected patient transportation, medical staff displacement, and acclimatization setup [3,4]. Of particular interest is the operationalization of pneumology rooms, where prophylaxis and treatment of airborne infectious diseases are frequent procedures. Besides SARS-CoV-2 and the entire coronavirus family, other pathogenic agents such as influenza virus (seasonal influenza and influenza pandemics), Streptococcus pneumoniae (pneumonia), and M. tuberculosis (tuberculosis) disseminate throughout those rooms. Responsible for acute and chronic respiratory syndromes that sometimes can lead patients to death [5,6,7], their transmissibility potential in hospitals relates to several factors, such as ambient temperature, air velocity, air renewal rate, and humidity level [8,9,10,11]. It is known that the air circulation impelled by conditioning devices inside enclosed spaces may vary significantly as a function of these factors [3]. We simulated diverse flow characteristics resulting from changes in parameters through computational fluid dynamics (CFD) tools with approximating models that enabled a detailed understanding of how pathogen-loaded aerosol particles spread, thereby highlighting necessities for reviewing safety protocols in hospital environments [12,13,14].
CFD has become a powerful tool to support decision-making for health protocols. During the COVID-19 pandemic outbreak, for instance, papers focused on gaining knowledge about viral transport through air. Numerical simulations helped to unveil that aerosols laden with SARS-CoV-2 particles remain active and contagious when suspended inside environments with low air circulation for up to 60 min [15]. They also were helpful in revealing how air conditioning becomes a vector for spreading the COVID-19 pathogen, thus increasing the probability of indoor contagion among hospital occupants [16]. Other authors used CFD to compare ventilation techniques for air-conditioning systems and identify which promotes the lowest infection risk [17,18]. Before the latent need for measures that provide safer hospital care rooms against infectious agents, it was identified that CFD plays an indispensable role in enabling risk-free analyses for such environments.
Air quality control in hospitals and healthcare units requires proper standardization. Since professionals, patients with autoimmune diseases or undergoing specific treatments, and healthy individuals share the same place simultaneously, indoor acclimatization is essential to make it salutary for all and prevent people from becoming viral vectors [3,12]. To ensure the best indoor conditions, there are a couple of recommendations issued by internationally respected entities. The Society of Heating, Ventilation, Refrigeration, and Air-Conditioning Engineers (ASHRAE), for example, suggests at least three solutions implementable under individual or combined arrangements, depending on the local feasibility: air purification units, ultraviolet inactivation units, and filtration systems [19,20,21].
While many studies in the literature approach indoor air quality control, there is a lack of information on the influence of filtration systems on the maintenance of the recommended operating conditions for indoor comfort in hospital environments, especially in Brazil, where casualties due to COVID-19 were devastating. ASHRAE [20] identifies that the properties of the filtration devices (number of porous layers, permeability, fabrics orientation, etc.), the pressure drop from the blower to the room, as well as the thermal variations affect indoor climate control. In the case that air circulation conditions in the environment are unmet, stagnation loci and streamflow imbalances may favor infectious agents’ survival [10], thereby compromising treatments and the health of the occupants [3,22,23].
In Brazil, the National Health Surveillance Agency (ANVISA) is the governmental entity responsible for dispatching health protocols. Filtration devices are highly recommended by ANVISA either as part of the personal protection equipment used in all regions of the country (surgical masks with a PFF2 filter, respiratory protection equipment with a class P2 or P3 filter, and others) or as a component of refrigeration systems in healthcare units working as airway sealing inside ducts. Despite the constant effort to maintain the best indoor comfort, hospital engineering departments still have to cope with threats of contamination caused either by technical factors (mild particle arrestance at the filtration membranes, machinery unavailability, and under-dimensioning of equipment) or by secondary factors (managerial overlook, scarce financial resources for maintenance, limited technical personnel, poor health education due to social inequality, and so on) [10,22,24].
Filtration systems are the commonplace option adopted by public and private hospitals in Brazil to obey ANVISA’s regulations. While this kind of solution is viable for most healthcare managers, there is no broad knowledge base from computer flow simulations to say how updated the current Brazilian regulations are to ensure the best technical recommendations for indoor comfort in healthcare units. Considering this research gap, this paper’s objective is to analyze how different configurations of filtration systems may influence the maintenance of the appropriate indoor air quality according to current regulations provided by ANVISA. With the COVID-19 pandemic, urgent measures had to go through adaption, thus changing the so-existing protocols. However, we have few answers on how efficient such recommendations were in preventing viral transmission from the engineering viewpoint. To provide the best responses to future outbreaks or epidemiological events, we seek provisional subsidies for policymakers and ways to improve decision models in health.
That said, our primary goals in this research are the following. First, we aim to study arrangements of filtration systems in hospital acclimatization ducts. Second, we aim to verify how filtration characteristics could compromise the Brazilian safety regulations for airflow in hospital environments. Third, we aim to identify airflow stagnation points that might favor suspended viral concentrations and increase contamination risks.
Our study considers a simulation model that replicates the space of a pneumology care room located at the Lauro Wanderley University Hospital (HULW), João Pessoa city, Brazil (Figure 1).
HULW is a reference hospital in Paraíba State on several fronts of health sciences and was responsible for the treatment and recovery of thousands of patients infected by COVID-19. The Brazil Coronavirus Portal places Paraíba State as the 3rd out of 9 states belonging to the Northeastern region of Brazil, with 262 deaths per 100,000 inhabitants (Source: Ministry of Health’s Coronavirus Panel, https://covid.saude.gov.br. Data collected on 27 January 2023). HULW is also part of a large and complex network of more than 30 public hospitals and maternities linked to federal universities managed by the Brazilian Company of Hospital Services (EBSERH). In 2021 only, for example, the network managed approximately 294,000 hospitalizations, 5 million medical consultations, and 14 million medical examinations (Data collected from the 2021 EBSERH Integrated Report).
We used the STAR-CCM+© software [25] to run all the CFD simulations related to the filtration system and focused on the indoor airflow velocity profiles. Two fundamental outcomes stand out: first, the indoor airflow response from the air-conditioning convective force imposed by controlled conditions; second, multi-perspective analyses of the acclimatization process under consideration of the current Brazilian regulations for hospital environments [26,27,28,29]. This research is a first step towards refined health technologies since it can provide insights for engineering control actions in healthcare units or hospital settings worldwide.
The paper is organized as follows. Firstly, we introduce some background information on filter characteristics and the Brazilian regulatory framework. Secondly, we set forth the mathematical formulation and computational modeling aspects. Then, we present the results from the statistical, hydrodynamic, and numerical viewpoints. We close the paper with a few remarks and recommendations for future investigation.

2. Background

2.1. Filtration Systems for Indoor Environment

Filters for application in air-conditioning systems are classified according to their efficiency in capturing airborne particles [30]. ASHRAE’s system for filter classification relies on laboratory test procedures conducted on a standardized device. These procedures determine the minimum efficiency reporting value (MERV), which is measured on an ordered scale (Table 1).
For hospital environments, ASHRAE recommends filters whose minimum acceptable efficiency is equal to MERV-13 [20]. These are fine filters usually manufactured in fiberglass, which is the reason why we will adopt permeability values for this material in our numerical simulations [33], and comparable to F-7 filters in Brazil according to specifications issued by the Brazilian Association for Technical Standards (ABNT). F-7 filters have an average efficiency of higher than 80% for particles of 0.4   μ m [34].
While comparing ABNT/NBR 16101:2012 and ASHRAE 62.1 standards in relation to the HVAC filters’ efficiency, it is possible to identify categorical parities for only a few hospital environments, such as outpatient care rooms and pneumology procedure rooms. According to the ABNT/NBR 7256:2005 regulation, most Brazilian healthcare units need to make use of a serialized combination of filters of different categories to achieve air cleanliness and ensure low impurity rates (Table 2).

2.2. Brazilian Hospital Standards

In Brazil, the standard rules consider four levels of classification for healthcare environments [27]:
  • Level 0. Areas where the risk does not exceed that found in public and collective environments.
  • Level 1. Areas in which no health risks related to air quality have been found, but some authorities, organizations, or researchers suggest that some risks should be considered.
  • Level 2. Areas in which there is strong evidence of the risk of occurrence of health hazards related to air quality to their occupants or patients, who will use products manipulate in these areas based on well-delineated clinical or epidemiological experimental studies.
  • Level 3. Areas where there is strong evidence of a high risk of air quality-related health hazards to their occupants or patients, who will use products manipulated in these areas, under well-delineated experimental, clinical, or epidemiological studies.
According to the regulation ABNT/NBR 7256, some infectious agents may remain indefinitely suspended in the air, so their proliferation should be restrained by fine filters and high efficiency filters (HEPA). Coupling them into indoor outlets may ensure arrestance rates of microbial agents of approximately 99.9%. While this is a feasible measure, the regulation does not endorse the usage of chemicals or ultraviolet radiation, as they are less reliable than filter implantation.
The same regulation denotes pneumology wards as Level 1 on the risk scale, i.e., when the risk has not been officially verified, but it should be considered. Inside these environments, the recommended temperature should vary between 21 C and 24 C , whereas the relative humidity should be kept within 40% to 60%. In addition, ABNT/NBR 7256 suggests filters with classification above G-3, except when there exist imminent contamination risks by aerosol agents, a condition that enforces the application of fine filters [27].
Concerning the airflow in such environments, the minimum flow rate imposed by ABNT/NBR 16401-3 is 0.005   m 3 / h [29]. However, the ANVISA’s resolution n. 09 [26] determines that the maximum recommended value for air velocity operation at 1.5 m from the floor in regions influenced by the flow throughout is 0.25   m / s . Despite that, it is worth pointing out that ABNT/NBR 16401-2 recommends that the air velocity should be kept below 0.8   m / s . Otherwise, the ideal room temperature may be compromised [28].

3. Methodology

3.1. Mathematical Formulation

In this paper, we configured the STAR-CCM+© software to assess refrigeration and indoor air circulation performance. The CFD framework consists of discretizing equations for conservation principles through the finite volume method (FVM), namely mass, momentum, and energy, respectively, given by
Ω ρ ( v · n ) d S = 0
Ω ρ v ( v · n ) d S j F j = 0
Ω ρ ( q · n ) d S Ω ρ Q d V Ω ( σ v ) · n d S Ω ρ g · v d V = 0 ,
where Ω is the control volume, Ω is the control volume’s boundary, t is the time, ρ is the density, v is the velocity field, n is the unit vector normal to Ω , F j are body/surface forces, q is heat flux, Q is specific heat production, σ is the stress tensor, g is the gravity force, and E = e + v · v 2 is the total energy, which sums the specific internal energy e to the kinetic energy v · v 2 [35,36]. This way, we consider all simulations under a steady-state flow regime.
Additionally, we treat the filter domain as a porous medium. Hence, the particle arrestance bulk effect and pressure drop enforced by the filtering material is modeled by coupling Forchheimer’s equation [37]
P = μ v k + β 1 2 ρ v 2 ,
where the additional quantities appearing on it are: P , the pressure gradient; μ , the air viscosity; and β , the inertial coefficient [37]. The two terms on the right-hand side of Equation (4) encompass the viscous effects and inertial effects, in this order. In particular, the first term invokes Darcy’s law, which provides a reasonable approximation of the mass flow when the upstream and downstream pressure differences are small [38]. As a consequence, this model assumes that the mass flow is proportional to the pore resistance.

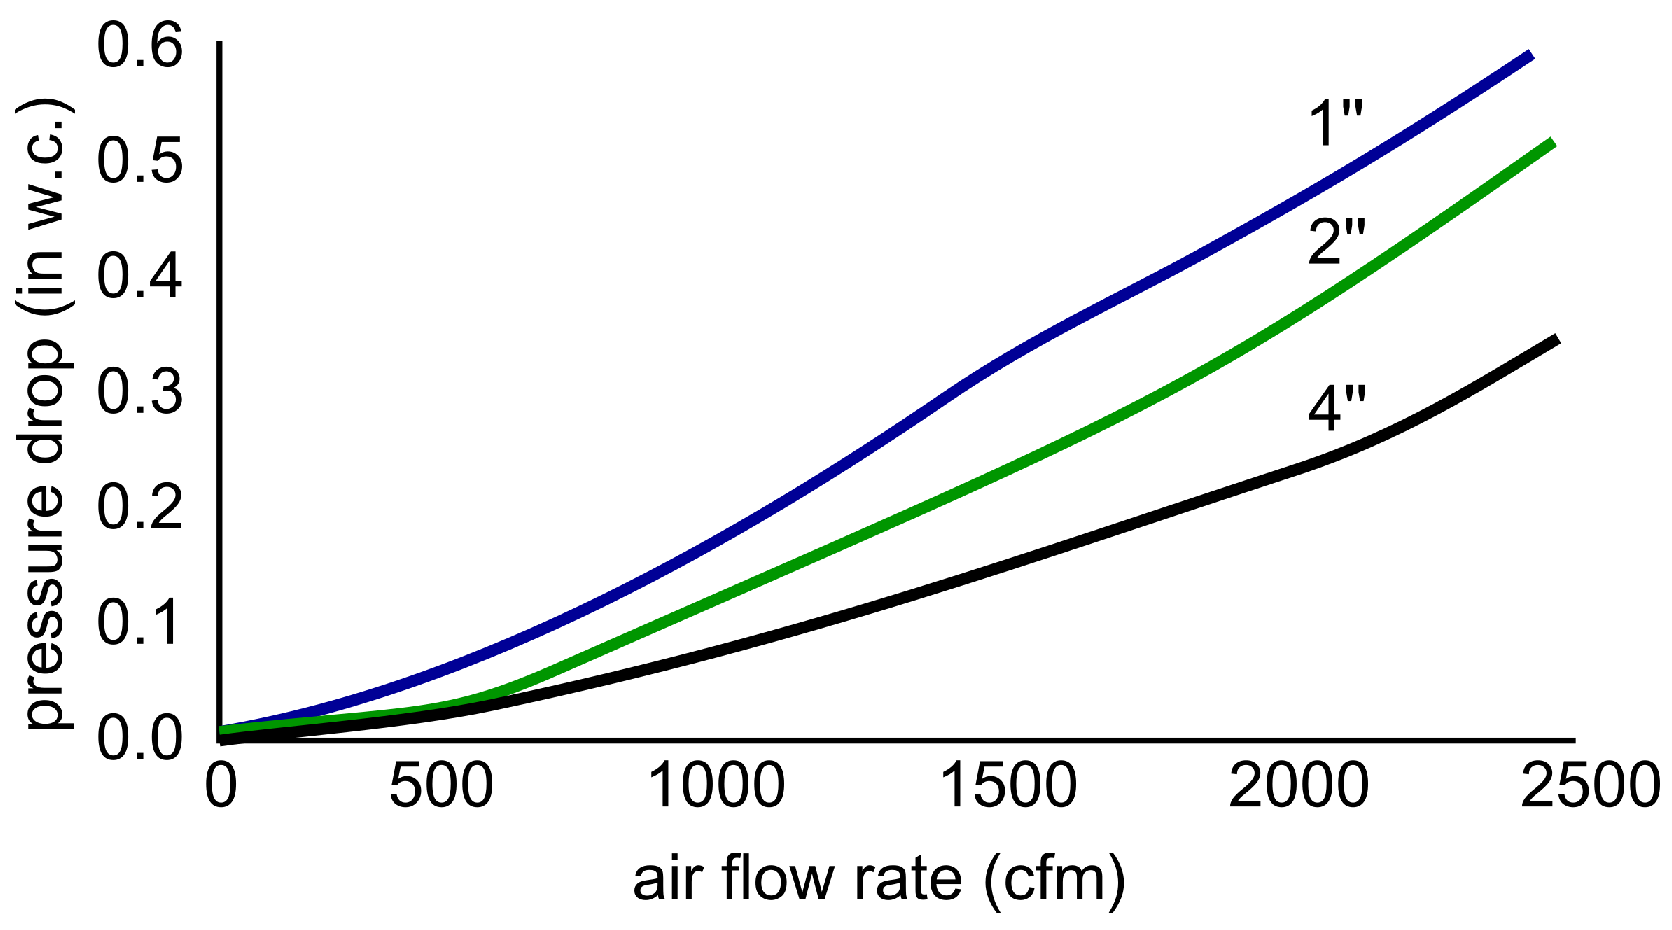
3.2. Filter Characterization

In this paper, the filter’s characteristics are equivalent to a DF13 MERV13 Pleated Filter by Dwyer, whose technical specifications are provided by the manufacturer. When considering MERV-13 filtration efficiency, the maximum operating temperature is 65.6   C . We will deal with filters of 1 inch (2.54 cm) and 2 inches (5.08 cm) thickness, which respond differently in terms of pressure drops (Figure 2).

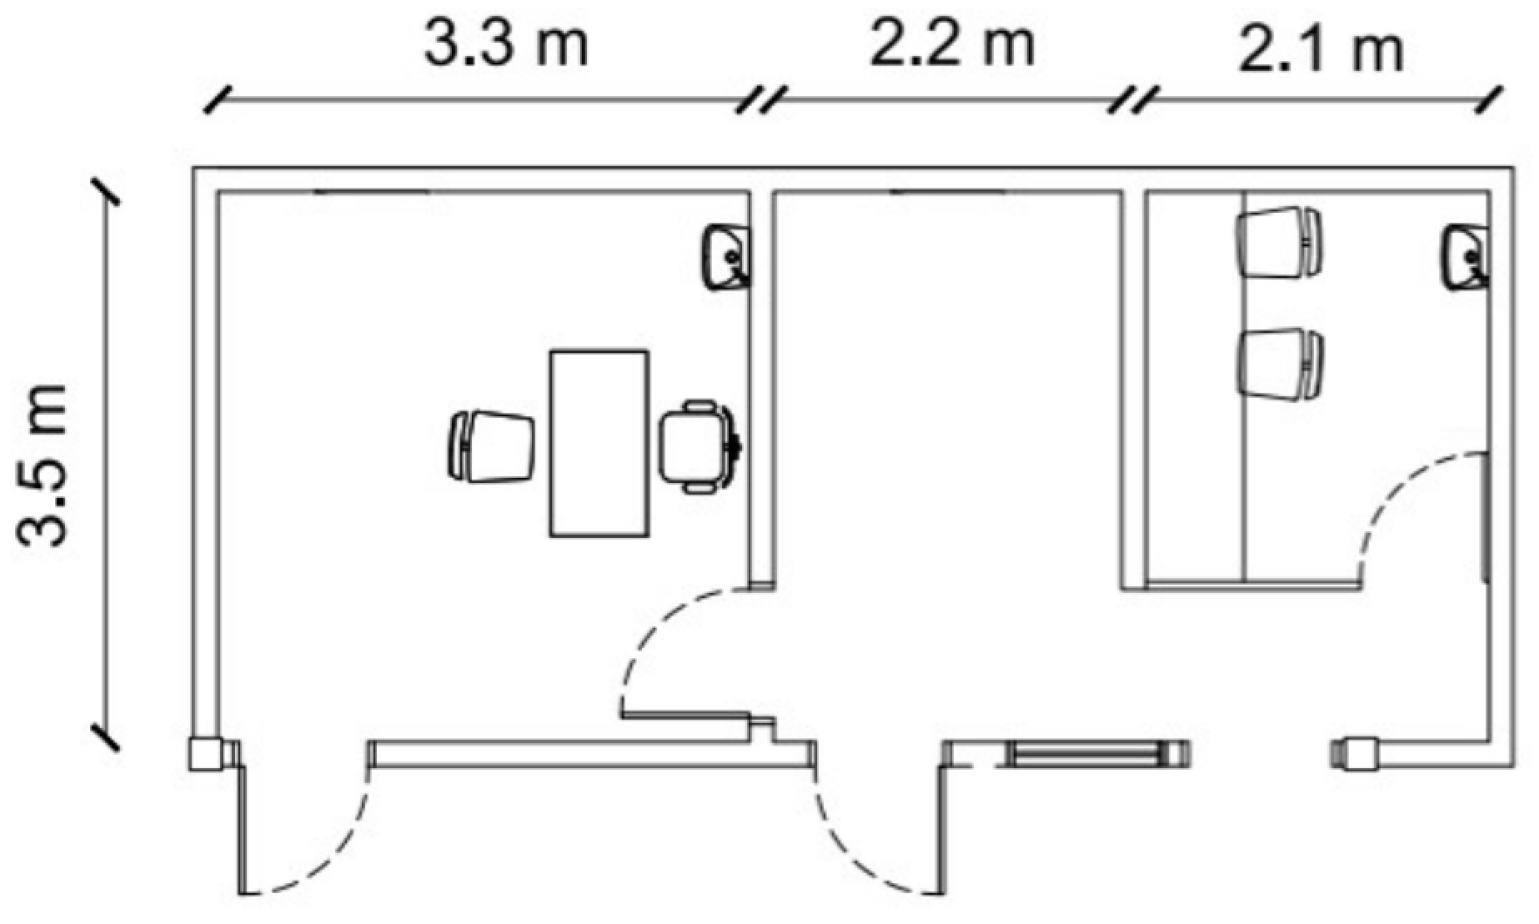
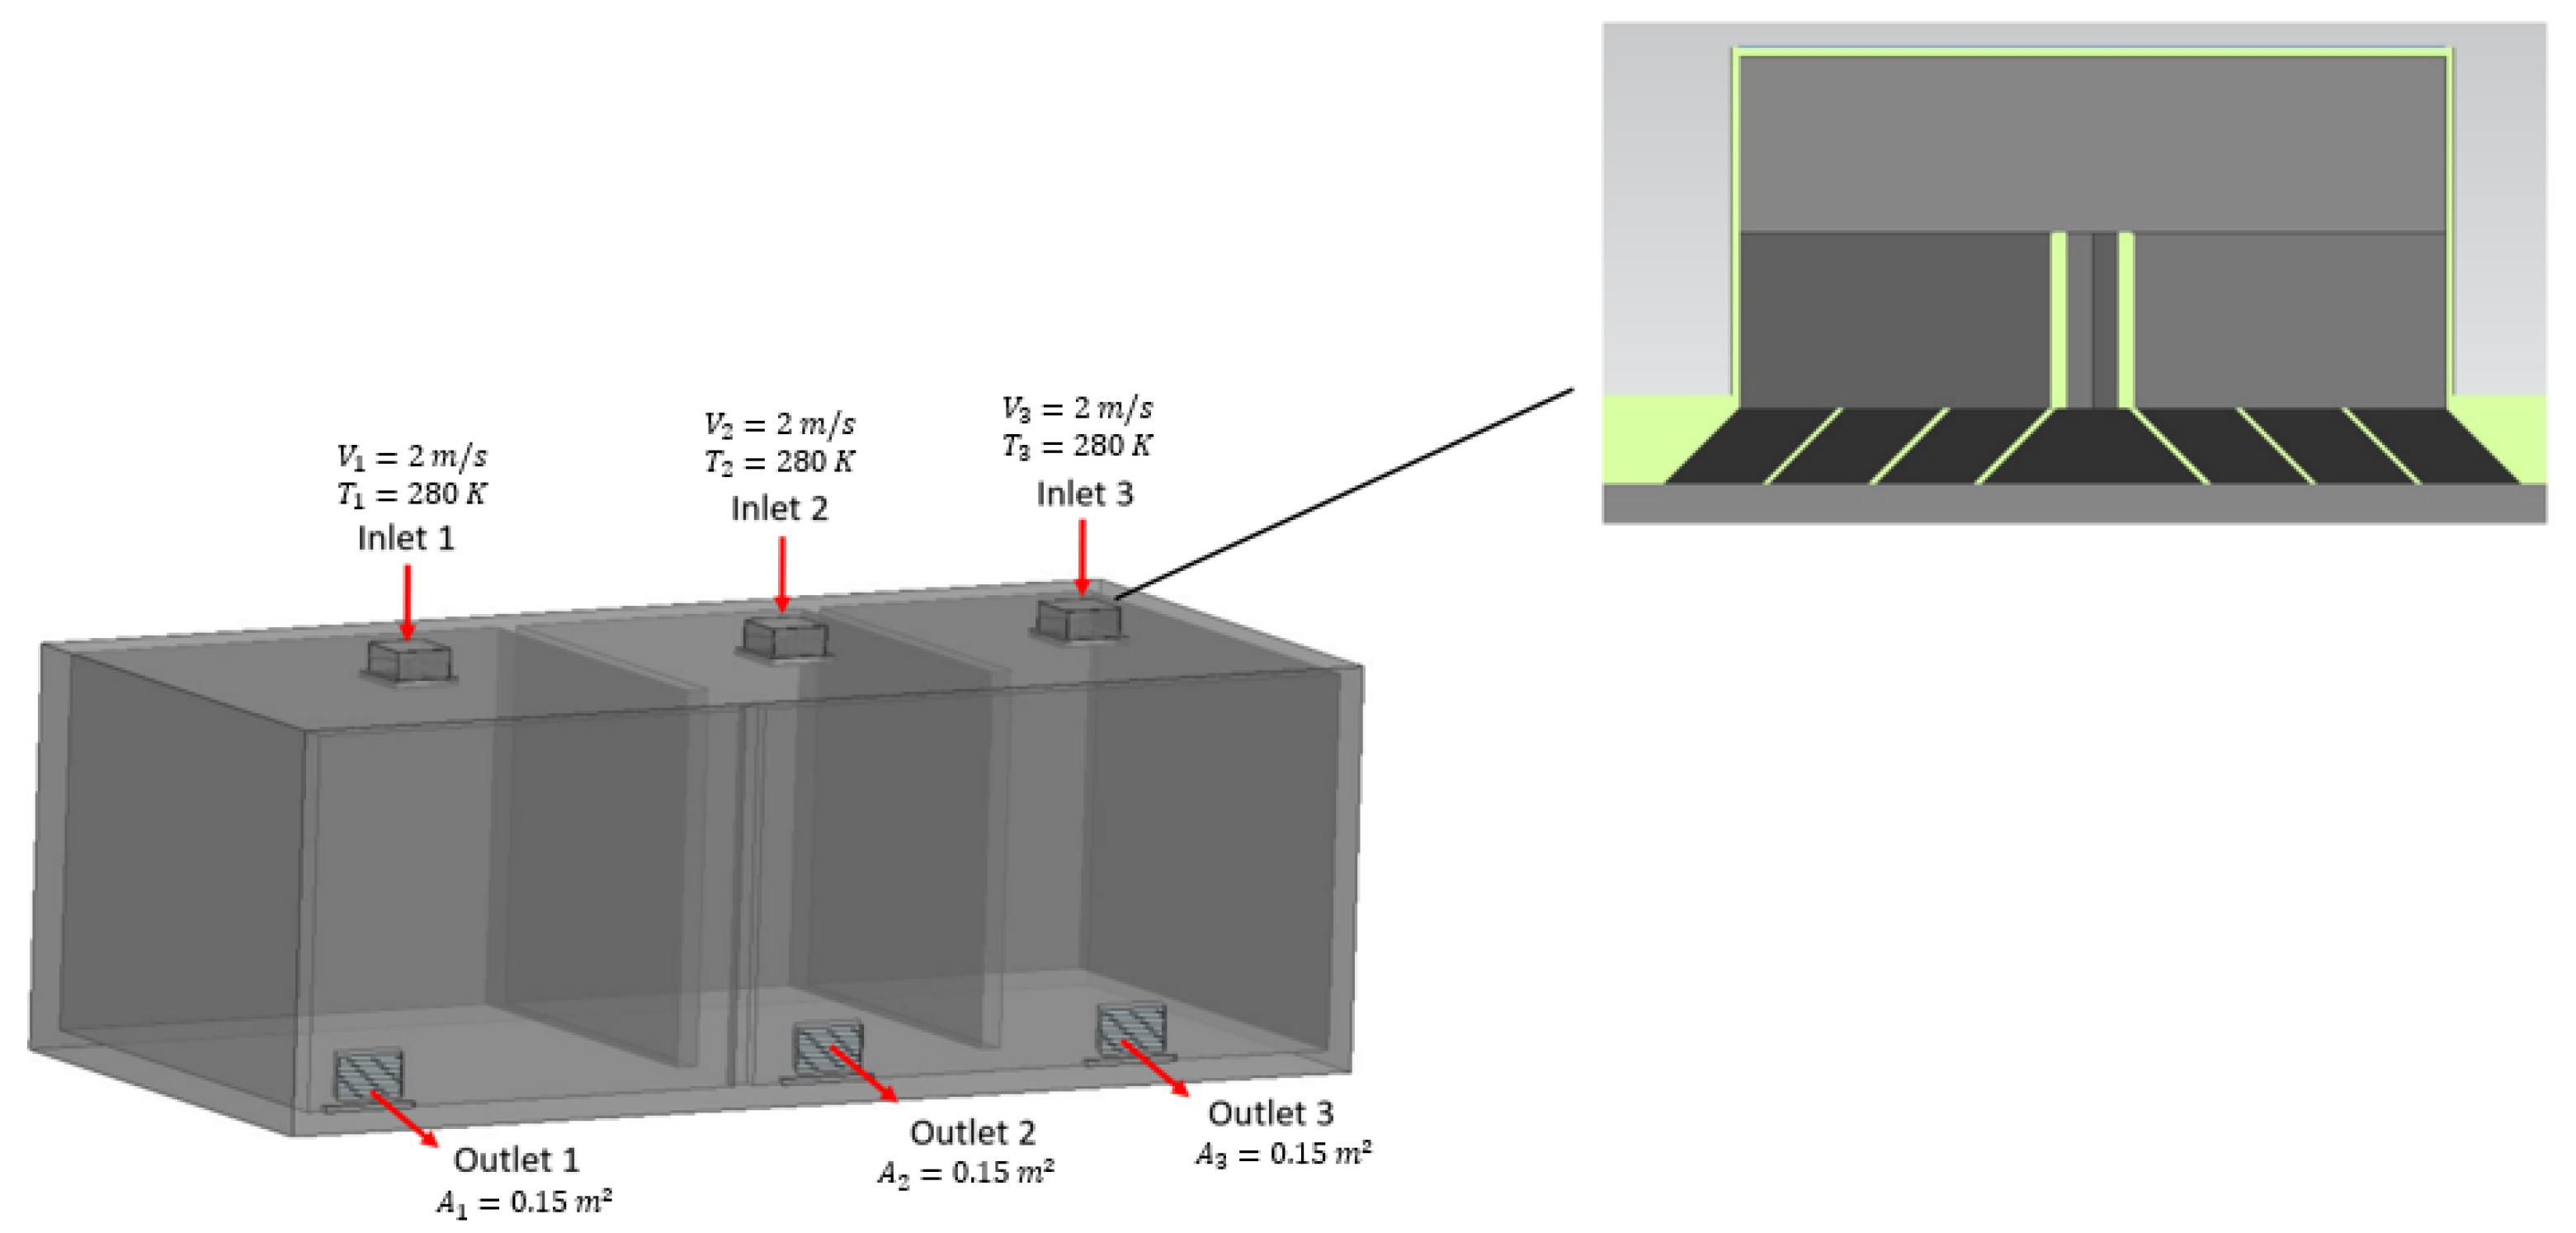
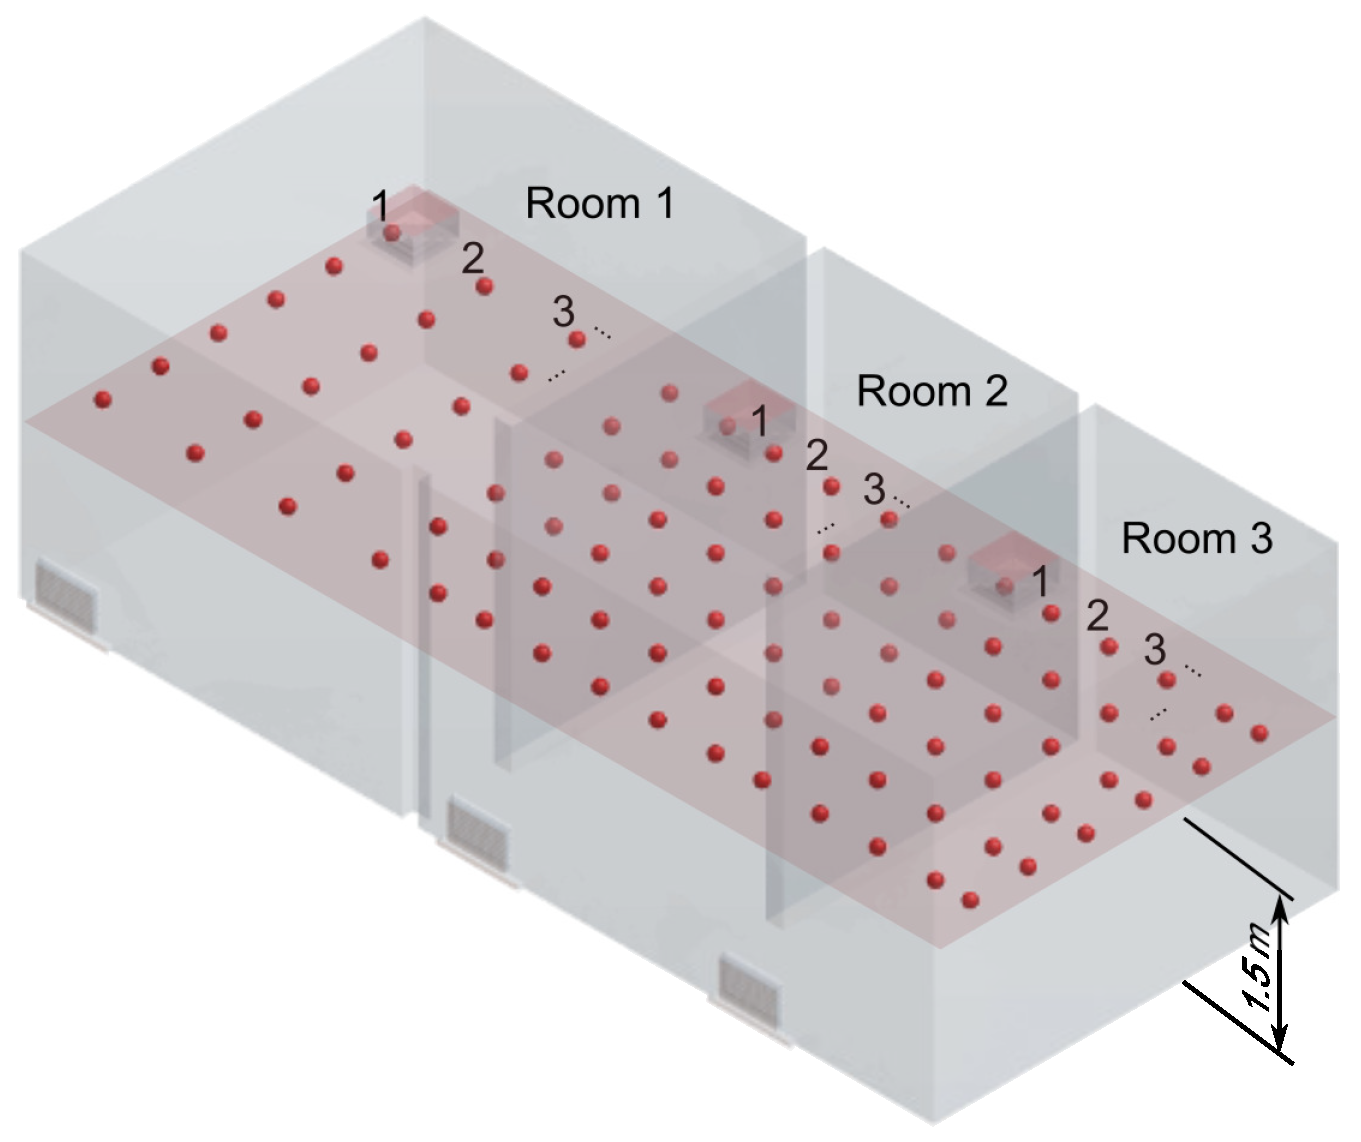
3.3. Problem Setting

The physical domain was formed by a clinical care room with dimensions of 7.6 × 3.5 × 2.5 [m] (total volume of 66.5 m3) divided into 3 smaller rooms (Figure 3). For each room, we assumed that the air-conditioning system is driven by ducts with a squared cross section, 200 m m length, and feeding inlet (intake grilles) located on the ceiling, besides outlets (exhaust grilles) at the bottom of the walls (Figure 4).
We will consider three scenarios regarding the coupling of the filtering mechanism to the rooms. The first scenario disregards the porous medium; the second includes the MERV13 1-inch filter; the third includes the MERV13 2-inches filter. For all scenarios, the fluid under study will be air with no particle-laden effect. The intake grille fins were rotated by 45 degrees in relation to the ceiling surface. Dirichlet (first-kind) boundary conditions (BCs) for pressure and velocity were imposed on the wall surfaces, intake grilles, and exhaust grilles. We assumed that the inlet velocity profile was uniform, i.e., with constant value. The rooms’ doors were considered to be closed, although the latter boundary components are outlet regions immersed into the doors’ surfaces for mass balance purposes. For the temperature field, we set Dirichlet BCs at the intake grilles and homogeneous Neumann BCs (second-kind) at the walls. The indoor temperature was initially set to 290 K in all rooms (Table 3).

3.4. Discretization Procedures

Our approach solves the discrete equations by using a FVM-SIMPLE algorithm [39]. All the numerical simulations were carried out by assuming an incompressible and steady-state flow on polyhedral meshes (Figure 5 and Figure 6).
The solver’s convergence thresholds for the airflow normalized residuals were fixed at 10 4 . Mesh-independence tests were performed for four meshes with different metrics (Table 4), whose results are presented in Section 4.3.
Cell quality describes the relative geometric distribution of cells. Flat cells generally have low cell quality, whereas cells with a quality of 1.0 are considered perfect. Skewness reflects whether the cells on either side of a face are formed in such a way as to permit the diffusion of quantities without these quantities becoming unbounded. A 0-degree angle skewness indicates a perfectly orthogonal mesh, and increasing robustness is ensured when angles are lesser than 85 degrees. As seen, all meshes complied with quality requirements.

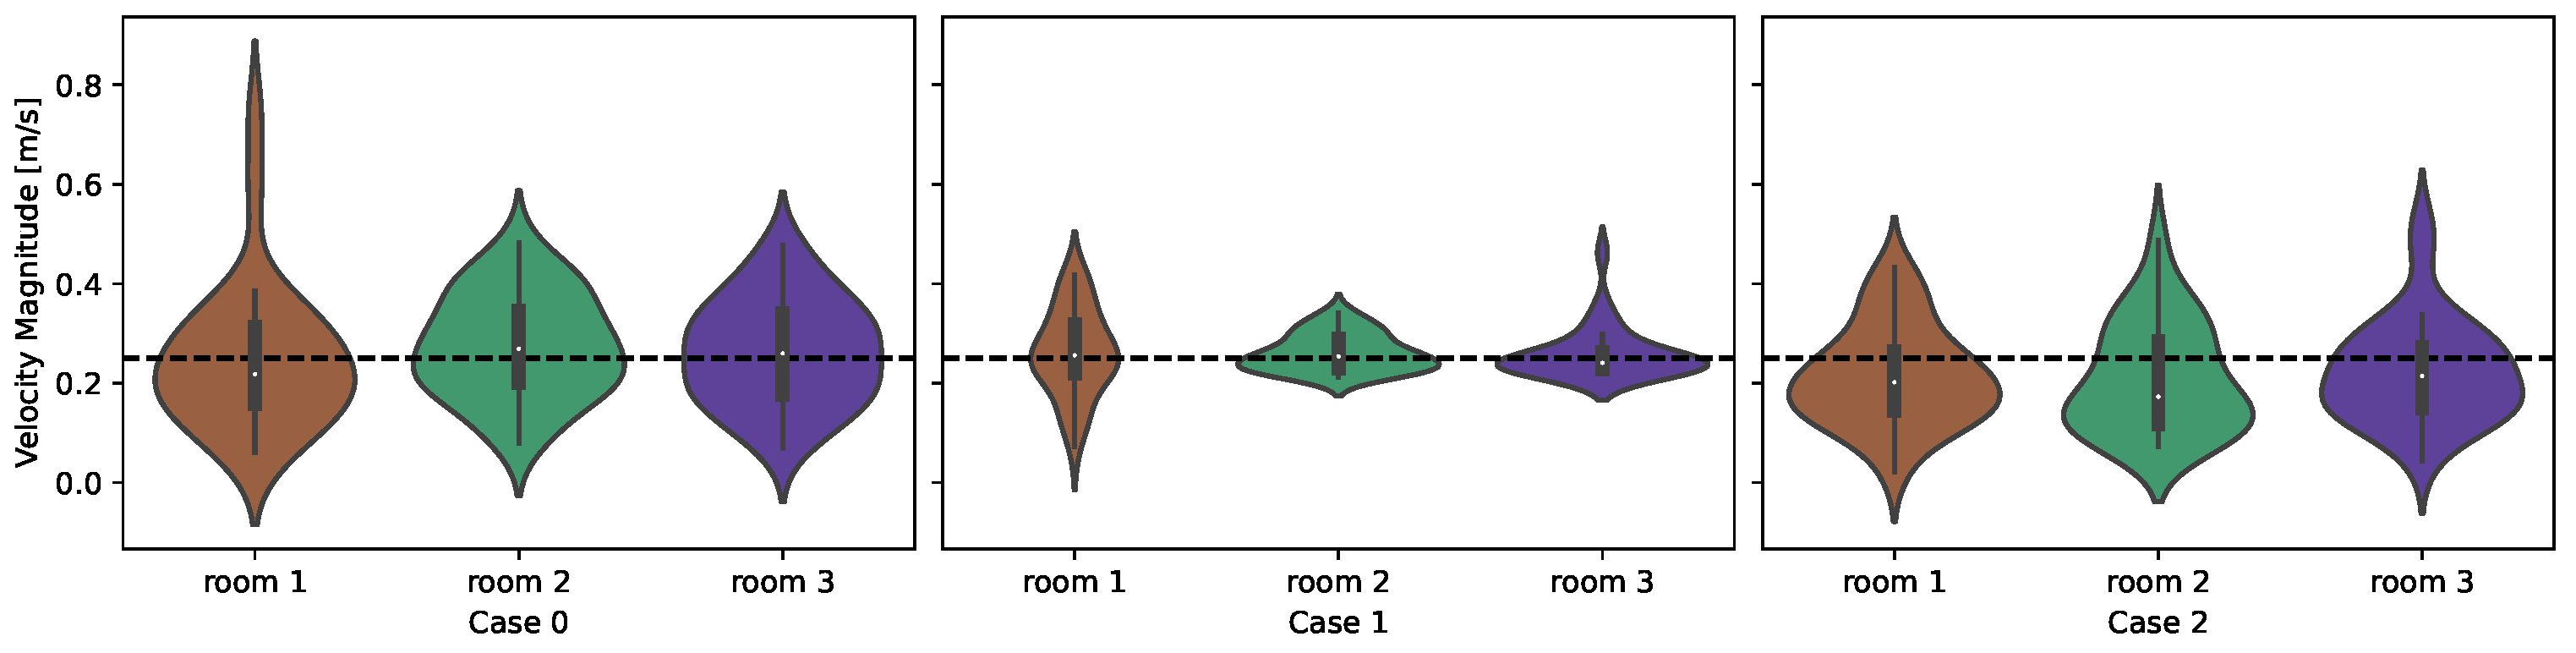
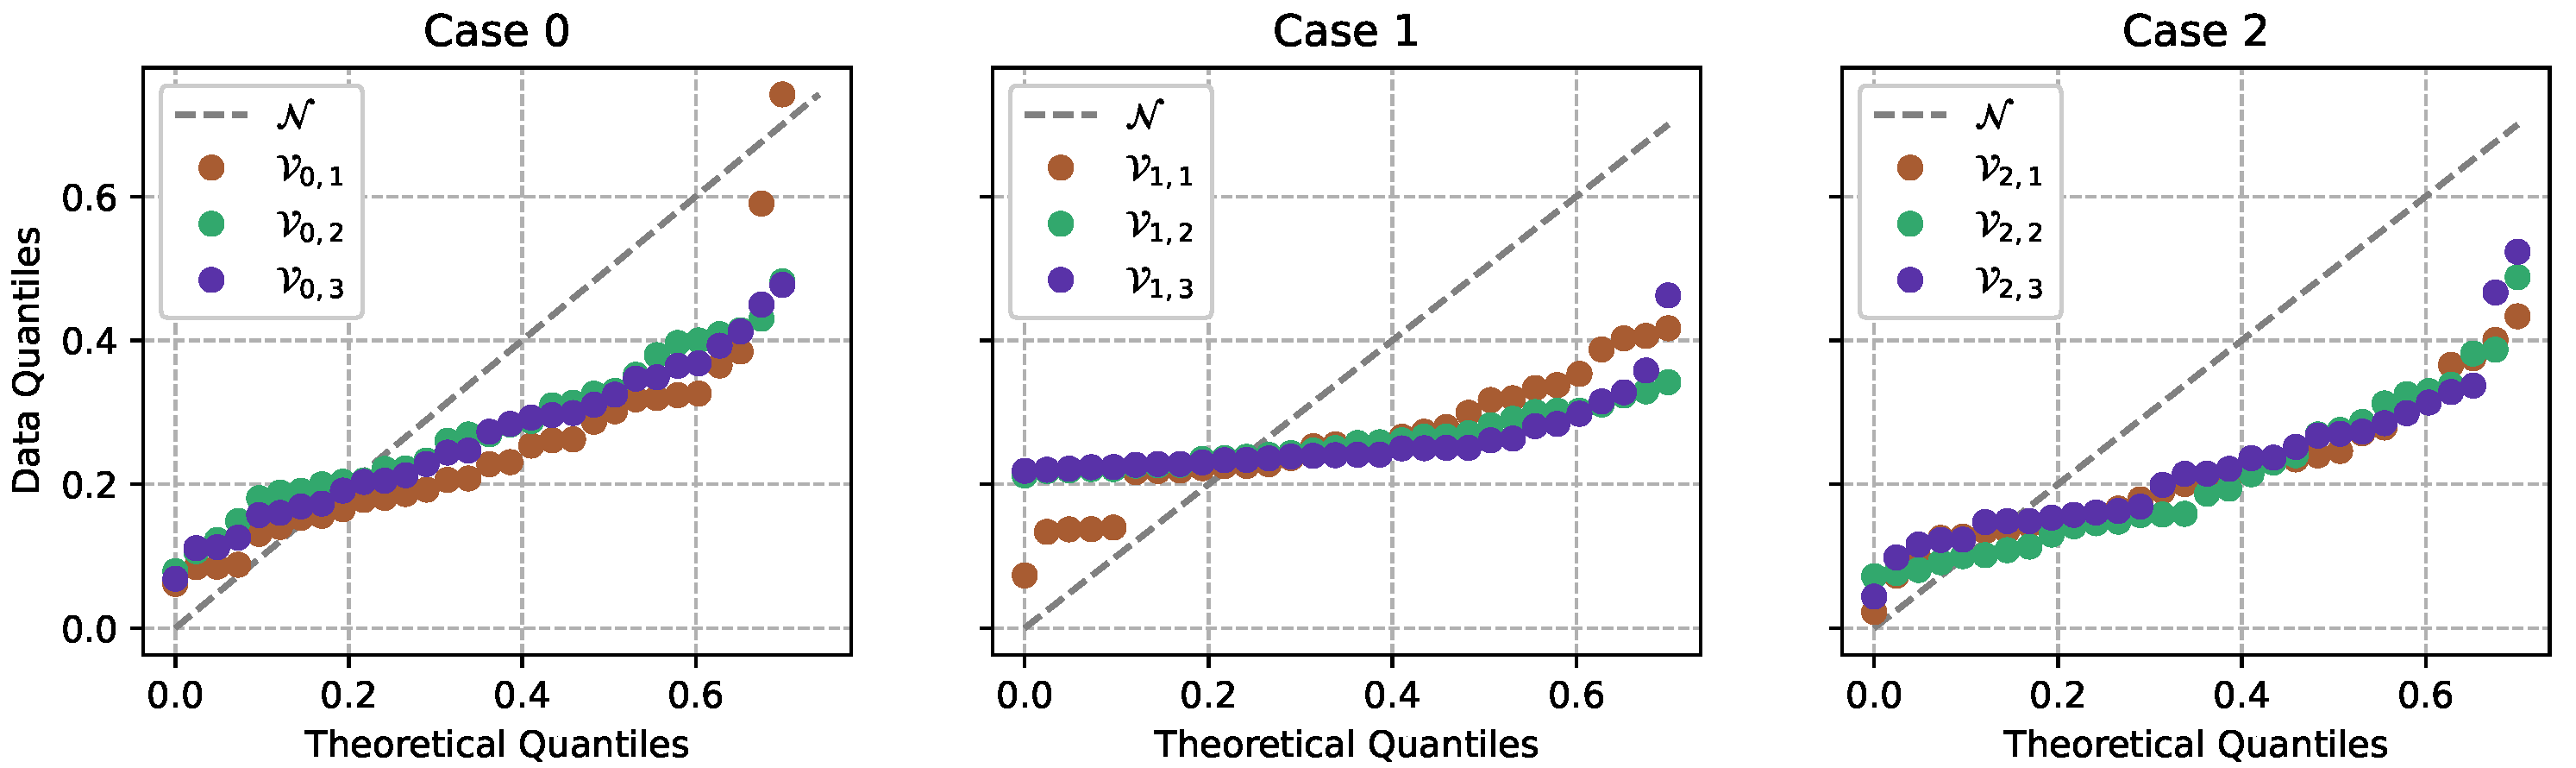
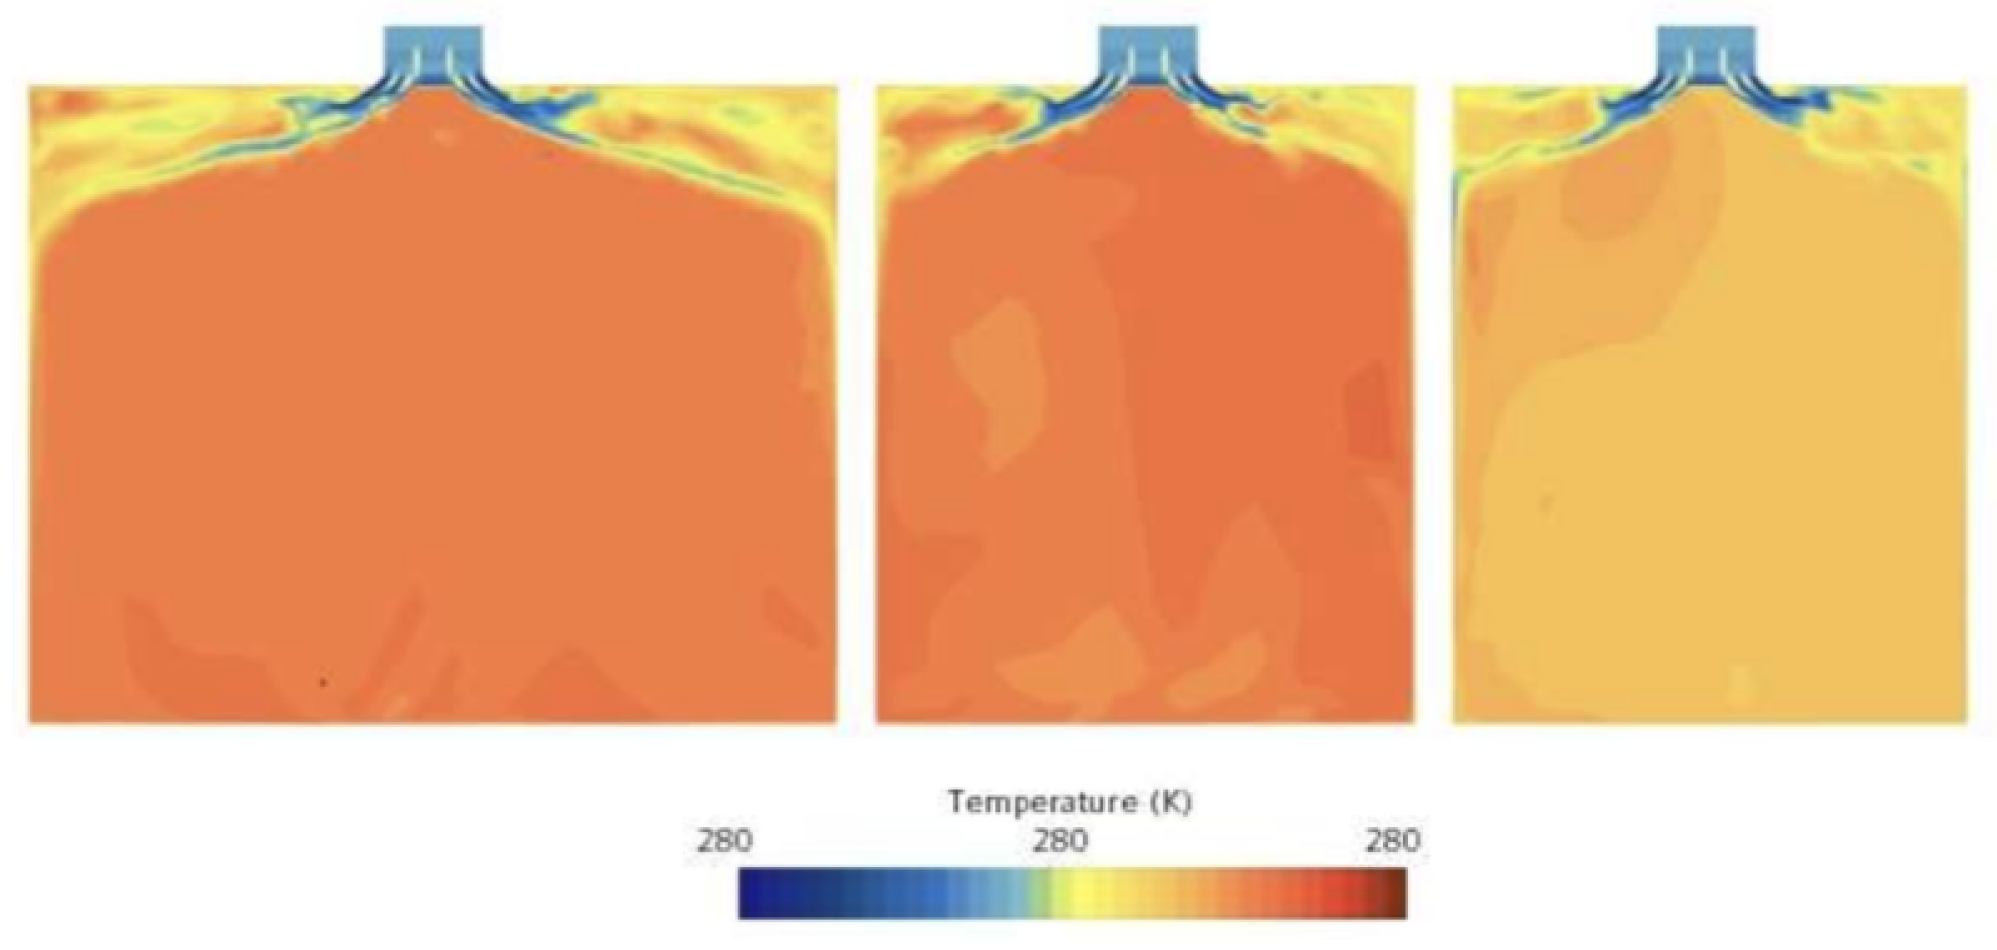
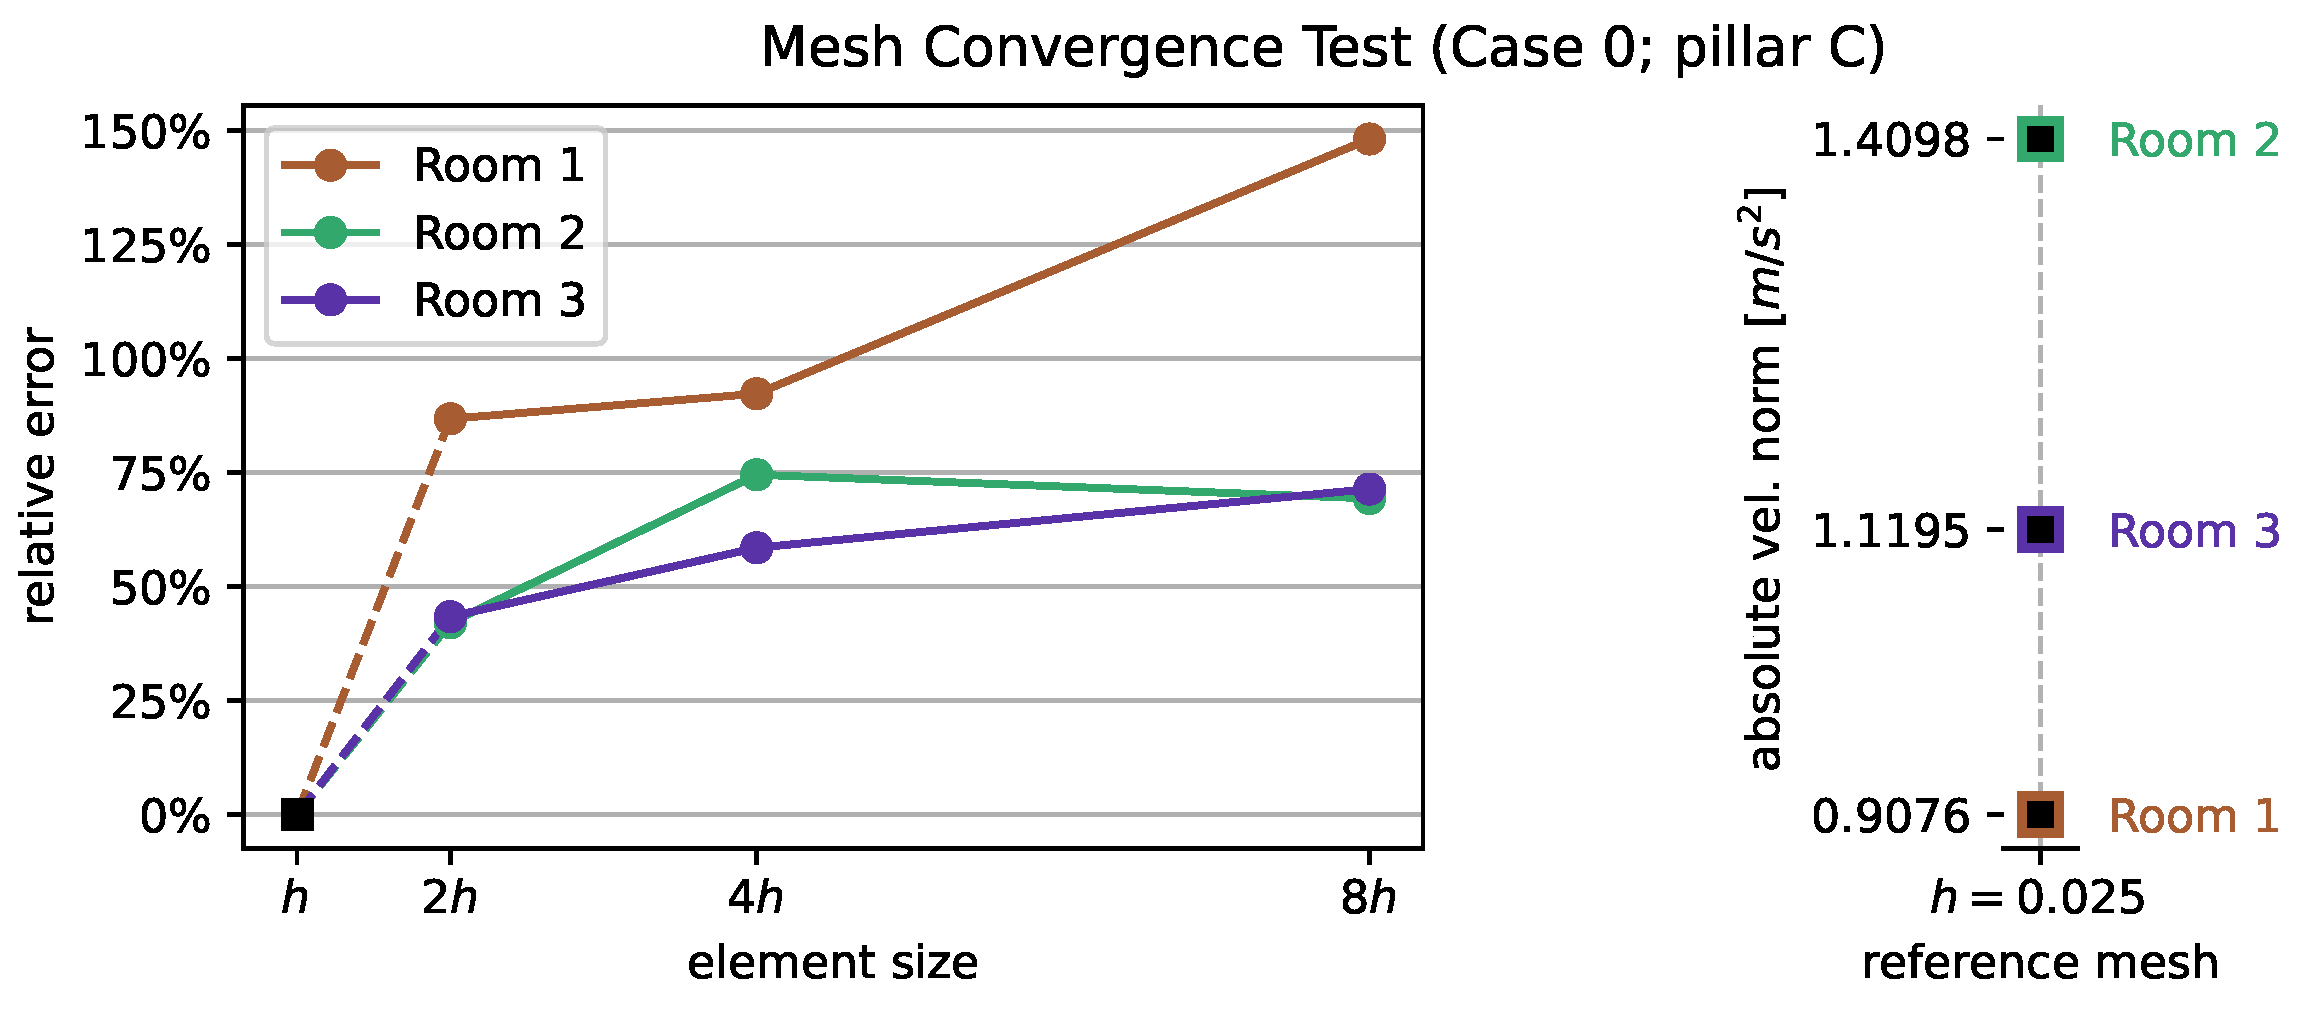
4. Results and Discussion

We will frame the simulation results in three sections that analyze them from the statistical, hydrodynamic, and numerical perspectives. The scenarios considered are the same as described in Section 3.3, namely
  • Case 0: no device;
  • Case 1: 1-inch device;
  • Case 2: 2-inch device.

4.1. Statistical Analysis

Given that a complete survey of the 3D flow characteristics in the environment is impracticable, we took only a few dozen probe points over the simulation domain. In particular, our sampling procedure covers all the areas spanned by the horizontal plane at a fixed height of 1.5 m from the floor (Figure 7). Each room has the same quantity of points evenly spaced over the planar directions and numbered from the top corner (as shown in the paper) downwards, although the rooms’ extensions differ from one to another.
The velocity magnitude distribution is quite similar in a case-by-case analysis, but their density has pronounced variations per room (Figure 8).
For Case 0, the velocity magnitude at the sampled height shows a high concentration within the range [0.1, 0.4], behavior seemingly equivalent to what one observes for Case 2. Tighter kurtoses stand out in Case 1, especially for rooms 2 and 3. However, the average values computed for this case have the best approximation of the 0.25 m/s adequacy limit imposed by the Brazilian regulatory agency. Thinning extensions observed for Case 0/Room 1 and Case 1/Room 3, for instance, indicate the presence of abnormal velocities that can be considered outliers or numerical “artifacts” inherent to the discretization process.
A deeper investigation mediated by Q–Q plots of the probed velocity show that all the distributions are asymmetric and deviate from the normality (Figure 9). We denote by N the normal distribution and V c , r the distributions obtained from the collected data points at Room r of Case c. The distributions are similar when the ensemble per Case is analyzed and clash with the normality. By achieving coherence with the density plot, the profiles for Case 1 concentrate most around the first quartile. Slightly widened profiles for the other cases admit an extended velocity interval.
Up to this point, the simulations suggest that the absence of a filtration device (Case 0) allows the flow field to approach the expected regulatory limit. However, this condition also hits against the need to assure a safer environment. Since it couples with a thicker filtration device, Case 2 is more severe as to particle retention. On the other hand, the inlet airflow is also prevented. This pushes down the indoor average velocity (see the position of the white dots in Figure 8), so that the flow moves away from the desired condition.
Case 1 seemingly produces the best tradeoff between indoor comfort and viral containment since the recommended condition by ANVISA maintains strictly on average at the same time that ensures some protective degree for the environment. The reason why the interquartile range reduces from Room 1 to Room 3 (see Figure 8) in this case might be associated with the physical dimensions of the rooms, which decrease in this order and impact the indoor flow circulation.

4.2. Hydrodynamic Analysis

The hydrodynamic features considered here resort to the velocity field inside the pneumology ward. We analyzed the airflow through pillars and planes placed at the room’s central positions. First, to make the data volume manageable, we collected velocity information for all three components over nine vertical pillars placed only in Room 1 (Figure 10).
Each pillar contained 20 sampling points evenly spaced on a straight floor–ceiling line, thus covering the 2.5 m room’s height. They were placed according to the usual cardinal directions and displaced from the central pillar (C) radially by around 0.85 m. Second, we selected horizontal and vertical planes to capture the air dynamics and understand how viral particles could propagate in the healthcare unit under scrutiny.
The velocity magnitudes along the pillars were plotted in groups of 3 tone-varying curves (one curve per case) indicated by oriented markers (Figure 11). It can be verified that the airflow is highly disturbed in all cases, and no particular pattern was detected. Of special interest are the dashed reference lines plotted at the abscissa 0.25 m/s featuring the recommended regulatory limit for indoor air velocity, and at the ordinate 1.5 m, highlighting the reference height for velocity probing. Around this ordinate, low-velocity spreading is expected.
When one looks at these reference lines, we can identify subtle asymmetries to the left in a few curves, such as in the S (south) and SE (southwest) and to the right in the E (east) and NE (northeast) ones. Apparent overshooting behaviors occur at the curves W (west), S (south), E (east), N (north), and C (center) to the plot interval, which was limited at right near 0.60 m/s, but the phenomenon’s underlying reason is spurious and characterizes outlier points.
Moving ahead to scan the velocity contours over the medial planes (Figure 12) at a given instant, we came across large velocity gradient areas in the vertical and horizontal directions. Beyond the one-dimensional analysis, where pattern recognition is hazier and unclear, through 2D plots, we can perceive additional features that allow us to draw interpretations regarding the inlet flow coning, near-wall boundary layers, and recirculation zones. We stress that the maximum velocity value occurs at the fins, and the visuals provided consider the velocity range scaled around that maximum, here set to 0.5 m/s.
The inlet flow discharges air into the rooms at maximum velocity and forms a diverging coning effect that expands towards the walls. For Case 0, the directrix is unaffected and tilts under perfect alignment with the grille fins. For Cases 1 and 2, the directrix smoothly bends and outlines a convex-shaped surface that encloses a high-velocity mass at the upper region of the rooms. We can detect that the thicker filtration device (Case 2) provokes an even more rounded directrix in Room 1. In the other rooms, this effect does not propagate, probably because of the reduction of the compartment. This is in narrow correlation with experimental observations of air-conditioning systems. The so-called Coanda effect, along with the attached jet momentum, leads the air over the ceiling surface [40].
In all cases, the formation of thinner or thicker near-wall boundary layers (short or long jet throws) that may detach at intermediary points or extend up to the floor is remarkable. On the right block of screenshots (horizontal cut plane at the height of 1.5 m from the ground), spots of larger velocity magnitudes locate at the four sides, which ooze out to the neighbor rooms from the open passages.
Based on the contours, it turns out that in the simulations for Case 2 (thicker filtration device), low-velocity regions appear in greater density than others whose range is 0.0029–0.251 m/s. This fact justifies an increased resistance to flow motivated by the filtration device’s thickness. As opposed, the highest velocities are observed for Case 0 (free of the filtration device) because the airflow entering into the compartments is less subject to pressure drops.
For completeness, we provided a single screenshot of the temperature field inside each room for Case 0 (Figure 13). Given the modeling setup and thermal conditions, the temperature varied less than 1 K for this scenario and all others without a clear relevant event. As expected, the indoor temperature cooled down as cold air was injected into the room, so that the practically isothermal state was only imbalanced near the ceiling, at the influence zone of the inlets.

4.3. Numerical Analysis

In this part, our objective is to present sufficient information concerning mesh convergence tests and verification steps to comply with the necessary requirements of numerical analysis. CFD simulations are susceptible to inaccuracies mainly caused by discretization procedures that inevitably affect the solution from the pre- to post-processing steps. There is no prior analytical solution for the flow field variables or a specific model that considers the porous media layer effect over jet impingement. Hence, we should use a numerical solution obtained from a highly refined mesh as a benchmark for coarser meshes. Since Star-CCM+ is a software with a solid background in solving the base flow equations invoked in this paper, we bypassed further actions at the code level.
By taking h as the average mesh element size for the benchmark solution, we solved the flow field for three other coarser meshes, producing increasing h by factors of 2, 4, and 8. At last, we computed the relative error from the benchmark solution to verify the error’s numerical convergence (Figure 14).
To measure the percentage relative error ϵ , we used the expression:
ϵ = | | v v r e f | | 2 | | v r e f | | 2 100 % ,
where v is the array corresponding to the velocity magnitude collected from the sampling points over the central pillar (C) placed at Room 1 for each mesh, the subscript r e f indicates the reference solution, and | | · | | 2 denotes the usual L 2 norm. Additionally, for brevity and sufficiency, the error analysis is provided only for Case 0.
The test shows that as h increases, ϵ also increases, implying that coarser grids relatively enforce a deviation from the reference solution (black square mark in Figure 14). Inversely, we find that more refined meshes tend to decrease the error towards the reference solution, even though this occurs via a non-monotonic decay, thus indicating that the simulations should produce proper results. The high percentages are apparent since they depend on absolute values in each room. Such values are displayed in the dot plot. We emphasize that they correspond to norms computed for the velocity computational arrays at nodes along the pillars and should not be confused with the absolute value for the velocity field in the entire room.
To the best of the authors’ knowledge, this paper is primal regarding indoor acclimatization for a university hospital in Brazil’s northeastern region focused on better practices for engineering control. CFD direct numerical simulations can subside architectural changes and improve the designs of healthcare units with reduced costs. A few points to discuss concerning modeling aspects, response to regulations, and open challenges are below.
The simulations have shown that the flow field in compartmentalized environments is irregular, and small disturbances naturally evolve according to the inlet air conditions. On the one hand, the traditional conservation equations can explain the transport mechanisms in such environments, as with their kinematic and convective nature. It is noticeable that the air-conditioning system stirs the flow field and drags it to any open compartment or passage. In realistic operations, it would be hard to stop viral propagation across rooms without imposing physical barriers, insulation mechanisms, or filtration devices. As we specifically investigated how fine filters can do this job, Case 0 shows that the airflow is free to move around when no filter is in place. Removing filters from high-risk units is an incompatible choice, even though they allow better airing. On the other hand, we stress that the steady-state flow regime is limited to describing dynamic changes in constituents of contaminated air, such as contagious or pathogenic substances.
Given the non-uniformity of the velocity profiles and their oscillatory behavior locally, the regulatory imposition for maximum velocity can be reached overall under the insurmountable tradeoff between regulation and protection. Through Cases 1 and 2, we verified that thinner or thicker filters affect the velocity spreading. How strict this tradeoff should be is a question deprived of an immediate answer. The simulations suggest that indoor comfort when the regulatory standard is of concern correlates somewhat to particle arrestance efficiency. While Case 1 (thinner filter) shows a higher velocity density around the regulatory average, Case 2 (thicker filter) shows a lag of distribution and underestimates the regulatory limit.

5. Conclusions

This paper discussed the indoor airflow conditions in a public Brazilian healthcare unit from a statistically quantitative viewpoint and a numerically qualitative viewpoint. We found that the regulatory limit imposed nationwide for the velocity field can be reached when usual acclimatization devices are under operation. However, a balance between filter protection and thermal comfort should be taken into consideration (Case 1), especially the serialized mounting of filters with different categories. Regarding the possibility of flow stagnation, no concern arose from the simulations since the irregular flow spreading minimizes regions where aerosol may rest in the air. Even so, scheduled cleaning routines should occur to eliminate the chances of viral particles surviving on indoor surfaces.
Using filters under the proposed conditions can meet national standards and enable a safer environment. A caveat to underscore is the observation of device power systems and machinery so that it can generate the potential difference necessary for the propagation of the airflow inwards.
In future research, a few topics should be addressed. We can cite, for instance: the improvement of the porous media model and validation criteria for jet–pore interfaces; the adoption of multi-material meshing and domain decomposition strategies; multiphysics coupling to investigate temperature and chemical effects; and flow analysis of other compartments and hospital units.

Author Contributions

Conceptualization, C.G.A.A., G.R.A. and G.P.d.O.; methodology, C.G.A.A.; software, C.G.A.A. and J.T.C.J.; validation, C.G.A.A.; formal analysis, C.G.A.A.; investigation, C.G.A.A.; resources, C.G.A.A., F.B.D.S.N. and G.P.d.O.; data curation, C.G.A.A.; writing—original draft preparation, C.G.A.A.; writing—review and editing, F.B.D.S.N., G.R.A., M.D.D.S. and G.P.d.O.; visualization, C.G.A.A. and G.P.d.O.; supervision, G.P.d.O.; project administration, G.P.d.O.; funding acquisition, G.P.d.O. and M.D.D.S. All authors have read and agreed to the published version of the manuscript.

Funding

This study was financed in part by the Brazilian Government Coordenação de Aperfeiçoamento de Pessoal de Nível Superior—Brasil (CAPES)—Finance Code 001, and by the Paraíba State Research Foundation (FAPESQ), grant n. 2021/3125.

Institutional Review Board Statement

The study was conducted according to the guidelines of the Declaration of Helsinki, and approved by the Committee of Ethics in Research of the Center of Medical Sciences at the Federal University of Paraíba (protocol code CAAE No. 38036620.5.0000.8069—Plataforma Brasil, date of approval: 26 September 2020).

Informed Consent Statement

Not applicable.

Acknowledgments

G.P.O. thanks Daniel Chalhub (State University of Rio de Janeiro, Brazil) for the scientific cooperation under the project InovUERJ INOVA2020 (GESAR/COVID-19).

Conflicts of Interest

The authors declare no conflict of interest.

References

  1. Chakraborty, I.; Maity, P. COVID-19 outbreak: Migration, effects on society, global environment and prevention. Sci. Total Environ. 2020, 728, 138882. [Google Scholar] [CrossRef]
  2. CDC. Scientific Brief: SARS-CoV-2 Transmission. 2021. Available online: https://www.cdc.gov/coronavirus/2019-ncov/science/science-briefs/sars-cov-2-transmission.html (accessed on 10 February 2022).
  3. Alrebi, O.F.; Obeidat, B.; Abdallah, I.A.; Darwish, E.F.; Amhamed, A. Airflow dynamics in an emergency department: A CFD simulation study to analyse COVID-19 dispersion. Alex. Eng. J. 2022, 61, 3435–3445. [Google Scholar] [CrossRef]
  4. Ding, J.; Yu, C.W.; Cao, S.J. HVAC systems for environmental control to minimize the COVID-19 infection. Indoor Built Environ. 2020, 29, 1195–1201. [Google Scholar] [CrossRef]
  5. Liu, Y.; Ning, Z.; Chen, Y.; Guo, M.; Liu, Y.; Gali, N.K.; Sun, L.; Duan, Y.; Cai, J.; Westerdah, D.; et al. Aerodynamic analysis of SARS-CoV-2 in two Wuhan hospitals. Nature 2020, 582, 557–560. [Google Scholar] [CrossRef]
  6. Machado, A.A. Infecção pelo vírus Influenza A (H1N1) de origem suína: Como reconhecer, diagnosticar e prevenir. J. Bras. Pneumol. 2009, 35, 464–469. [Google Scholar] [CrossRef] [PubMed]
  7. Schwartzmann, P.V.; Volpe, G.J.; Vilar, F.C.; Moriguti, J.C. Pneumonia comunitária e pneumonia hospitalar em adultos. Medicina (Ribeirão Preto) 2010, 43, 238–248. [Google Scholar] [CrossRef]
  8. Eslami, H.; Jalili, M. The role of environmental factors to transmission of SARS-CoV-2 (COVID-19). AMB Express 2020, 10, 92. [Google Scholar] [CrossRef]
  9. Kwon, T.; Gaudreault, N.N.; Richt, J.A. Environmental stability of SARS-CoV-2 on different types of surfaces under indoor and seasonal climate conditions. Pathogens 2021, 10, 227. [Google Scholar] [CrossRef]
  10. Stadnytskyi, V.; Bax, C.E.; Bax, A.; Anfinrud, P. The airborne lifetime of small speech droplets and their potential importance in SARS-CoV-2 transmission. Proc. Natl. Acad. Sci. USA 2020, 117, 11875–11877. [Google Scholar] [CrossRef]
  11. Wang, J.; Tang, K.; Feng, K.; Lv, W. High Temperature and High Humidity Reduce the Transmission of COVID-19. BMJ Open 2020, 3551767, 2020b. Available online: https://www.researchgate.net/publication/339873481_High_Temperature_and_High_Humidity_Reduce_the_Transmission_of_COVID-19 (accessed on 3 February 2023). [CrossRef]
  12. Satheesan, M.K.; Mui, K.W.; Wong, L.T. A numerical study of ventilation strategies for infection risk mitigation in general inpatient wards. In Proceedings of the Building Simulation, Loughborough, UK, 21–22 September 2020; Springer: Berlin/Heidelberg, Germany, 2020; pp. 1–10. [Google Scholar]
  13. Bourouiba, L. The fluid dynamics of disease transmission. Annu. Rev. Fluid Mech. 2020, 53, 473–508. [Google Scholar] [CrossRef]
  14. Löhner, R.; Antil, H.; Idelsohn, S.; Oñate, E. Detailed simulation of viral propagation in the built environment. Comput. Mech. 2020, 66, 1093–1107. [Google Scholar] [CrossRef] [PubMed]
  15. Vuorinen, V.; Aarnio, M.; Alava, M.; Alopaeus, V.; Atanasova, N.; Auvinen, M.; Balasubramanian, N.; Bordbar, H.; Erästö, P.; Grande, R.; et al. Modelling aerosol transport and virus exposure with numerical simulations in relation to SARS-CoV-2 transmission by inhalation indoors. Saf. Sci. 2020, 130, 104866. [Google Scholar] [CrossRef] [PubMed]
  16. Al-Baghdadi, M.A.S. CFD analysis of spread COVID-19 with air conditioning systems. Int. J. Energy Environ. 2021, 12, 63–73. [Google Scholar]
  17. Barbosa, B.P.P.; de Carvalho Lobo Brum, N. Ventilation mode performance against airborne respiratory infections in small office spaces: Limits and rational improvements for COVID-19. J. Braz. Soc. Mech. Sci. Eng. 2021, 43, 316. [Google Scholar] [CrossRef]
  18. Ren, C.; Zhu, H.C.; Cao, S.J. Ventilation Strategies for Mitigation of Infection Disease Transmission in an Indoor Environment: A Case Study in Office. Buildings 2022, 12, 180. [Google Scholar] [CrossRef]
  19. Zhang, J.; Huntley, D.; Fox, A.; Gerhardt, B.; Vatine, A.; Cherne, J. Study of viral filtration performance of residential HVAC filters. ASHRAE J. 2020, 62, 26–32. [Google Scholar]
  20. ASHRAE. Filtration/Disinfection. 2021. Available online: https://www.ashrae.org/technical-resources/filtration-disinfection (accessed on 10 February 2022).
  21. Mousavi, E.S.; Kananizadeh, N.; Martinello, R.A.; Sherman, J.D. COVID-19 outbreak and hospital air quality: A systematic review of evidence on air filtration and recirculation. Environ. Sci. Technol. 2020, 55, 4134–4147. [Google Scholar] [CrossRef] [PubMed]
  22. ANVISA. COVID-19: Tudo Sobre Máscaras Faciais de Proteção. 2020. Available online: https://www.gov.br/anvisa/pt-br/assuntos/noticias-anvisa/2020/covid-19-tudo-sobre-mascaras-faciais-de-protecao (accessed on 10 February 2022).
  23. Chia, P.Y.; Coleman, K.K.; Tan, Y.K.; Ong, S.W.X.; Gum, M.; Lau, S.K.; Lim, X.F.; Lim, A.S.; Sutjipto, S.; Lee, P.H.; et al. Detection of air and surface contamination by SARS-CoV-2 in hospital rooms of infected patients. Nat. Commun. 2020, 11, 2800. [Google Scholar] [CrossRef]
  24. López-Rebollar, B.M.; Posadas-Bejarano, A.; García-Pulido, D.; Torres-Maya, A.; Díaz-Delgado, C. Proposal of a Mask and Its Performance Analysis with CFD for an Enhanced Aerodynamic Geometry That Facilitates Filtering and Breathing against COVID-19. Fluids 2021, 6, 408. [Google Scholar] [CrossRef]
  25. Siemens Digital Industries Software. Simcenter STAR-CCM+ User Guide, version 2021.1. In Adaptive Mesh Refinement for Overset Meshes; Siemens: Berlin, Germany, 2021; pp. 3067–3070. [Google Scholar]
  26. ANVISA. Resolução n. 9, de 16 de Janeiro de 2003; Technical Report; Ministério da Saúde: Brasília, Brazil, 2003.
  27. ABNT. NBR-7256, Tratamento de ar em Estabelecimento Assistenciais de Saúde (EAS): Requisitos Para Projetos e Execução das Instalações; Associação Brasileira de Normas técnicas: Rio de Janeiro, Brazil, 2005. [Google Scholar]
  28. ABNT. Instalação de Ar-Condicionado—Sistemas Centrais e Unitários—Parte 2: Parâmetros de Conforto Térmico; Technical Report; Brazilian Technical Standards Association: Rio de Janeiro, Brazil, 2008. [Google Scholar]
  29. ABNT. Instalação de Ar-Condicionado—Sistemas Centrais e Unitários—Parte 3: Qualidade do Ar Interior; Technical Report; Brazilian Technical Standards Association: Rio de Janeiro, Brazil, 2008. [Google Scholar]
  30. NC. Specification for Filters, Air (HVAC). 2017. Available online: https://files.nc.gov/ncdoa/pandc/Documents/BidAttachments/s4130-1.pdf (accessed on 10 February 2022).
  31. ASHRAE. Handbook—Heating, Ventilating and Air Conditioning Systems; American Society of Heating, Refrigerating and Air Conditioning Engineers: New York, NY, USA, 2008. [Google Scholar]
  32. ANSI/ASHRAE Standard 52.2-2017; Method of Testing General Ventilation Air-Cleaning Devices for Removal Efficiency by Particle Size. ASHRAE: New York, NY, USA, 2017.
  33. Ma, Y.; Hu, X.; Wu, D. The permeability of glass fiber mat and its influence on the filling time of RTM process. In Proceedings of the Eleventh International Conference on Composite Materials, Gold Coast, QLD, Australia, 14–18 July 1997; pp. 14–18. [Google Scholar]
  34. ABNT. NBR-16101, Filtros para Partículas em Suspensão no ar—Terminação da Eficiência para Filtros Grossos; Médios e Finos: São Paulo, Brazil, 2012. [Google Scholar]
  35. Date, A.W. Introduction to Computational Fluid Dynamics; Cambridge University Press: Cambridge, UK, 2005. [Google Scholar]
  36. Mase, G.T.; Smelser, R.E.; Mase, G.E. Continuum Mechanics for Engineers; CRC Press: Boca Raton, FL, USA, 2009. [Google Scholar]
  37. Zhong, W.; Ji, X.; Li, C.; Fang, J.; Liu, F. Determination of permeability and inertial coefficients of sintered metal porous media using an isothermal chamber. Appl. Sci. 2018, 8, 1670. [Google Scholar] [CrossRef]
  38. Belforte, G.; Raparelli, T.; Viktorov, V.; Trivella, A. Permeability and inertial coefficients of porous media for air bearing feeding systems. J. Tribol. 2007, 124, 705–711. [Google Scholar] [CrossRef]
  39. Malalasekera, W.; Versteeg, H. An Introduction to Computational Fluid Dynamics: The Finite Volume Method; Prentice Hall: Harlow, UK, 2007; p. 1995. [Google Scholar]
  40. Wang, S.K.; Wang, S.K. Handbook of Air Conditioning and Refrigeration; McGraw-Hill: New York, NY, USA, 2000; Volume 49. [Google Scholar]
Figure 1. Approximate location of the Lauro Wanderley University Hospital at the Federal University of Paraíba (HULW/UFPB) in scale-amplified view. Source: prepared by the authors.
Buildings 13 01072 g001
Figure 2. Pressure drop as a function of the air flow rate over the filter domain for three different filter thickness, namely 1 inch (2.54 cm), 2 inches (5.08 cm), and 4 inches (10.16 cm). Source: prepared by the authors with adaption from Dwyer©.
Buildings 13 01072 g002
Figure 3. 2D design of the clinical care room under study located at Lauro Wanderley University Hospital at the Federal University of Paraíba (HULW/UFPB). Source: prepared by the authors.
Buildings 13 01072 g003
Figure 4. 3D view of the simulation domain added by inlets and outlets. The air inlet duct (ceiling diffuser) is shown in detail from the vertical cross section whose grilles conduct the flow at 45 degrees. Source: prepared by the authors.
Buildings 13 01072 g004
Figure 5. Example of polyhedral mesh with adaptive refinement used for simulations (detailed lateral view).
Buildings 13 01072 g005
Figure 6. Example of polyhedral mesh with adaptive refinement used for simulations (cross-sectional view).
Buildings 13 01072 g006
Figure 7. Horizontal plane crossing the rooms’ physical domains. Dozens of evenly spaced sampling points are placed over each compartment to probe data at the height of 1.5   m from the floor, reference point where the velocity field must comply with the Brazilian technical regulations.
Buildings 13 01072 g007
Figure 8. Violin plots describing the density of the velocity field’s distribution (magnitude measured according to the usual Euclidean norm). From left to right, the boxed figures represent the cases studied (0: no filter; 1: 1′ filter; 2: 2″ filter), organized per room.
Buildings 13 01072 g008
Figure 9. Quantile–quantile (Q–Q) plots of the velocity distribution (in magnitude) for each case studied (0: no filter; 1: 1 (in) filter; 2: 2 (in) filter), organized per room in blocks of 3. The symbol N denotes the normal distribution; each N denotes the normal distribution and V c , r denotes the velocity distribution for the c-th case of the r-th room. It can be verified that all cases move away normality but expound similar behaviors.
Buildings 13 01072 g009
Figure 10. Data collection pillars were placed at the core of Room 1 for plotting vertical velocity profiles. Each pillar is formed by 20 stacked and uniformly spaced points over the compartment’s height, 2.5 m, and inside a neighborhood 0.85 m from the center, where pillar (C) is found. The other 8 pillars were placed in the cardinal directions along the azimuthal direction of the reference circle drawn at the room’s top surface.
Buildings 13 01072 g010
Figure 11. Velocity profiles were computed for each pillar inside Room 1. They vary per case (indicated by changing color tones) and pillar position (indicated by direction markers). The orientation of the plots is from top left to bottom right. They are associated with the anti-clockwise direction beginning at the West (W) position. The vertical dashed line in gray marks the abscissa of the velocity value recommended by regulations (0.25 m/s). The horizontal dashed line in blue indicates the ordinate of the regulatory height where we took measurements (1.5 m).
Buildings 13 01072 g011
Figure 12. Numerical simulations: (a) Case 0; (b) Case 1; (c) Case 2 (legend included). Screenshots of velocity contours over the vertical medial planes (blocks of three along the left column—frontal view) and horizontal medial planes (blocks of three along the right column—superior view) for each case and room. The velocity range is scaled, and the time instant is fixed.
Buildings 13 01072 g012
Figure 13. Numerical simulation: temperature field for Case 0 for Rooms 1 to 3 (left to right).
Buildings 13 01072 g013
Figure 14. Percentage relative error as a function of the mesh element size (left); absolute velocity magnitude for the reference mesh (right). The error decreases as the factor multiplying h decreases, thus indicating that the numerical solution on coarser meshes should converge to that over the (finest) reference mesh (black square marker) through h-refinement. On the right, the colored borders indicate the maximum velocity reached at the pillar C for Case 0 inside each room computed for the reference mesh.
Buildings 13 01072 g014
Table 1. MERV filter classification according to ASHRAE 52.1/52.2 standards. Source: [31,32].
MERVEfficiencyTypical ContaminantApplicationsFilter Class
20Not Applied 0.3  μ m diameterClean roomsHEPA/ULPA
19Not AppliedVirusesRadioactive materialsEffic. ≤ 99.999%
18Not AppliedSea SaltPharmaceutical industriesTypes A, C, D and F
17Not AppliedCombustion fumesSurgical centersNot applied
16Not Applied 0.3  μ m to 1.0   μ m HospitalsBag filters
15>95%All bacteriaGeneral surgeriesNot applied
1490 to 95%Cigarette smokeSmokers’ loungesNot applied
1380 a 90%Cooking oil/paintCommercial buildingsNot applied
1270 to 75% 1.0  μ m to 3.0   μ m Residences (top conditions for air circulation)Filter bags
1160 to 65%LegionellaCommercial buildingsNot applied
1050 to 55%Lead/charcoal dustHospital laboratoriesNot applied
940 to 45%Car emissionsNot appliedNot applied
830 to 35% 3.0  μ m to  10.0   μ m Commercial buildingsPleated filters
725 to 30%MoldResidencesNot applied
6<20%SporesIndustrial placesDisposable filters
5<20%CementPaint boothNot applied
4<20%> 10.0   μ m Minimal filtrationDisposable filters
3<20%Spanish mossResidencesWashable filters
2<20%Paint spray powdersWindow air conditionersElectrostatics
1<20%Sanding powdersNot appliedNot applied
Table 2. Comparative view of filters according to ASHRAE 62.1 and ABNT/NBR 16101/2012 standards. Source: prepared by the authors.
Efficiency LevelLowerBuildings 13 01072 i001Higher
NBR 16101/2012G1G2G3G4M5M6F7F8F9
MERV 62.112–45–67–89–1011–12131415
NBR 7256/2005 applicationsNot appliedNot appliedImage examination roomOutpatient careNot appliedNot appliedPneumology procedure roomLow-risk operating roomHigh-risk operating room
Risk level--11--123
Table 3. Boundary conditions imposed on the numerical simulation models.
BoundaryPropertyBCValue
Intake grillesVelocityDirichlet 2.0   m   s 1
Intake grillesTemperatureDirichlet 280.0   K
Exhaust grillesPressureDirichlet 0.0   k Pa
Doors and wallsVelocity (no-slip)Dirichlet 0.0   m   s 1
Doors and wallsTemperature (no-flux)Neumann 0.0   W   m 2
Table 4. Metrics computed for the mesh tests, where h is the average mesh cell size, n e is the number of mesh cells, M C Q is the minimum cell quality, and M S A is the maximum skewness angle.
h n e MCQ MSA
0.025 m57,121,0340.151175.33
0.050 m13,609,1620.152375.83
0.100 m7,319,7000.151475.39
0.200 m6,552,3710.157275.41
Disclaimer/Publisher’s Note: The statements, opinions and data contained in all publications are solely those of the individual author(s) and contributor(s) and not of MDPI and/or the editor(s). MDPI and/or the editor(s) disclaim responsibility for any injury to people or property resulting from any ideas, methods, instructions or products referred to in the content.

