Article

Prediction of the Long-Term Tensile Strength of GFRP Bars in Concrete

1
College of Civil Engineering, Tongji University, Shanghai 200092, China
2
Key Laboratory of Performance Evolution and Control for Engineering Structures, Tongji University, Ministry of Education, Shanghai 200092, China
3
Shanghai Municipal Engineering Design Institute (Group) Co., Ltd., Shanghai 200092, China
*
Author to whom correspondence should be addressed.
Buildings 2023, 13(4), 1035; https://doi.org/10.3390/buildings13041035
Submission received: 20 March 2023 / Revised: 1 April 2023 / Accepted: 10 April 2023 / Published: 14 April 2023
(This article belongs to the Special Issue Latest Advances of Green Concrete Technology in Civil Engineering)

Abstract

:
The durability of two types of widely used glass fiber reinforced polymer (GFRP) bars, one without coating (G1) and one with slightly surface sand-coating (G2), were studied through accelerated aging. Concrete cylinders reinforced with GFRP bars were immersed in tap water in temperature-controlled tanks. The influence of different exposure temperatures, 20, 40, and 60 °C, and also different exposure times, 30, 60, 90, 120, and 180 days, on the degradation of the two types of GFRP bars was investigated. The tensile strengths of GFRP bars after different exposure times were evaluated with tensile tests, and the variation of the microstructure and elemental compositions of conditioned specimens was evaluated with scanning electron microscopy (SEM) images and energy dispersive X-ray spectroscopy (EDS), respectively. The degradation rate of the tensile strength retentions of two types of GFRP bars decreased with an increase in the exposure time at all exposure temperatures. The tensile strength retentions of the GFRP bars were studied by three commonly used prediction models. Based on the degradation mechanism of fiber-matrix debonding, a new model was proposed. These four models were evaluated with the test results and a new model proposed was suggested as the best model to predict the residual tensile strength of the GFRP bars. The durability parameters of the GFRP bars were discussed. The tensile strength retention tended to converge to a constant value (52%) with the increase of exposure time, which contributes to the determination of the environmental reduction factor in relevant design guides, and the fiber-matrix debonding was found to be the main degradation mechanism due to the surrounding concrete environment. The sand-coating had some effect on the activation energy of the GFRP bars.

1. Introduction

To overcome the corrosion of steel in concrete structures, fiber-reinforced polymer (FRP) bars were developed. Among the different FRP bars, GFRP bars are used the most due to their low cost. GFRP has been widely used in the United States, Japan, and other countries. However, the degradation of its mechanical properties can be caused by alkalinity in the surrounding concrete. Feng et al. [1] reviewed the degradation of the mechanical properties of FRP bars due to severe environmental conditions. The alkalinity of the solution can cause the deterioration of FRP bars. In most studies on the alkaline environment, the GFRP bars were exposed to an alkaline solution and had significant degradation of mechanical properties after conditioning. With an increase in the exposure time, the tensile strength of the GFRP bars reduced, and the degradation rate increased as the temperature increased (Wang and Xue [2]). Chen et al. [3] made a similar observation; the tensile strength of the GFRP bars decreased by 36% after being exposed to an alkaline solution at 60 °C for 70 days. Kim et al. [4] found that under humid, chloride, alkali, and freeze-thaw cycling conditions, the tensile properties of the GFRP bars significantly decreased, while alkaline environmental conditions had a greater impact on the degradation of the GFRP bars compared to other conditions. Benmokrane et al. [5] found that, among different types of GFRP bars, GFRP bars made with vinyl-ester and epoxy exhibited the lowest degradation rate after conditioning in an alkaline solution. Lu et al. [6] found that the durability of GFRP bars in seawater environments was better than that of basalt fiber-reinforced polymer (BFRP) bars because BFRP bars have higher water absorption and weak bonding between the basalt fibers and the polymer matrix. Through accelerated experiments, Zhu et al. [7] found that alkaline solutions have a firmer impact on GFRP than deionized water, seawater, and acidic solutions.
Numerous studies have been carried out to develop durability prediction models for GFRP bars. Many of these were based on the Arrhenius equation. Phani and Bose [8] investigated the effects of environmental history on the strength characteristics of the CSM-laminate through three-point bending tests. Based on the test results, the prediction model of the strength degradation was developed according to the Arrhenius equation. The degradation of the interlaminar shear strength of different types of FRP bars aged in an alkaline solution was studied based on Arrhenius theory [9,10]. The tensile strength degradation of GFRP bars exposed to tap water, artificial seawater, and alkaline solutions was investigated and prediction models were developed based on the Arrhenius equation by Lu et al. [11]. Guo et al. [12] used the Arrhenius model to predict the long-term short-beam shear strength (SBSS) and three-point bending strength (TPBS) of GFRP reinforcement under bridge service environments. Emparanza et al. [13] predicted that all GFRP bars that meet the acceptance criteria are expected to maintain 85% tensile strength at 23 °C based on the Arrhenius equation. Chen et al. [14] investigated the tensile strength degradation of GFRP bars exposed to simulated concrete pore solutions and made a prediction according to the Arrhenius equation. Huang and Aboutaha [15] proposed a prediction model using time extrapolation and time-temperature shift approaches. Bazli et al. [16] studied the durability of GFRP in seawater, alkali solution, and high-temperature environments using the Arrhenius formula in conjunction with Fick’s law, and found that the water diffusion coefficient increased with increases in temperature. Zhang et al. [17] established a moisture absorption model of GFRP bars in steam-curing concrete and found that the moisture absorption curve essentially conformed to Fick’s law. Phani et al. [8] developed an exponential model for the flexural strength and tensile strength degradation of GFRP and BFRP bars exposed to harsh alkaline solutions. Based on this, Morales et al. [18] developed an exponential model for the prediction of GFRP tensile strength degradation. Duo et al. [19] collected experimental data on the tensile strength and elastic modulus of 557 GFRP and BFRP steel bars under different harsh environments, and adjusted the exponential model to make the meaning of the model parameters clearer.
Most prediction models were developed from the results of accelerated tests, where the FRP bars were exposed to simulated concrete pore solutions [20,21,22,23,24]. Few tests have been performed on FRP bars in actual concrete. Indeed, GFRP reinforcement has different durability in simulated concrete pore solutions compared with that in actual concrete environments [21]. Furthermore, the models in most studies were established based on one theory [25,26,27], and it would be beneficial to consider different theories. In this study, the degradation of GFRP bars in concrete under accelerated aging was investigated. To avoid uneven corrosion of the GFRP bars by the environment, a cylinder concrete specimen with a GFRP rebar in the center was designed. Based on the test results, four models were developed and evaluated for the prediction of the long-term tensile strength of GFRP bars. The Tre − 1/(1 + et/B) prediction model was considered to be the best model.

2. Experimental Preparation

2.1. Materials

Two types of GFRP ribbed bars with a diameter of 12 mm, as shown in Figure 1, were tested. They were made of E-glass fibers and vinyl ester resin, one without coating (G1) and one with slight surface sand-coating (G2). Both had more than 70% of glass fibers by volume. The GFRP bars were produced in the factory. For the sand-coating, a sandblasting machine was used to direct highly pressurized air and quartz sand onto the surface of the GFRP bars.
For the concrete, P.O 42.5 ordinary Portland cement was used, and the proportions for cement, water, and fine and coarse aggregate were 1:0.519:1.834:3.724 by weight. Three cubic specimens of 150 mm × 150 mm × 150 mm were fabricated and cured following the same procedure as the concrete cylinder specimens with the GFRP bars, and the 28-day compressive strength was 34.0 MPa for G1 specimens and 34.9 MPa for G2 specimens.

2.2. Specimens Design and Preparation

A 900-mm long GFRP bar was placed in the center of the concrete cylinder of 100 mm diameter and 200 mm height, as shown in Figure 2. The cylinder specimen was used, considering the influence on the GFRP bar in the cylinder specimen by the exposure environment was the same in all directions.
To prevent local failure at the ends of the GFRP bars in the tensile tests, the GFRP bars were strengthened at the ends with 45 # seamless steel tubes with internal threads, and epoxy was injected into the tubes. The concrete specimens were then fabricated with specially made molds and frames, as shown in Figure 2a. The specimens were cured in the laboratory at a temperature of 20 ± 5 °C for one day, and after demolding they were kept in a standard curing room with a temperature of 20 ± 2 °C and humidity over 90% for 28 days. The specimens were then immersed in different temperature-controlled water tanks (20, 40, and 60 °C). Elevated temperatures were used to accelerate the aging of the GFRP bars. The influence of different exposure temperatures, 20, 40, and 60 °C, and also different exposure times, 30, 60, 90, 120, and 180 days, on the degradation was investigated. Five specimens were prepared for each condition (exposure time and temperature).
After the designed exposure time, the concrete specimens were split along the longitudinal direction, and the GFRP bars were extracted for further tests.

2.3. Test Method

2.3.1. Tensile Strength Test

Tensile tests were performed following GB/T 13096-2008 [28]. Two strain gages were placed in the middle of each GFRP bar. All data were collected by the NI system. The test instruments are shown in Figure 3. Five specimens were tested for each condition (exposure time and temperature).

2.3.2. Microstructure Analysis

The XL30-FEG SEM was used to observe the microstructure of GFRP. 5 mm thick samples of GFRP were prepared, as shown in Figure 4.

2.3.3. Elemental Composition Analysis

The element analysis of GFRP bars was carried out by energy-dispersive X-ray spectroscopy (EDS), which is compatible with the electron microscope model XL30-FEG. EDS works to identify the main elemental compositions of fibers in GFRP, and the change in the fiber’s chemical composition during the aging process was analyzed [18].

2.3.4. Alkalinity Analysis of Concrete Pore Solution

The ex situ leaching method is known for its simplicity and accuracy in all pH measurement methods [29,30,31] and is the most widely used method for the pH measurement of concrete. In this paper, the alkalinity of concrete pore solution was analyzed with the ex situ leaching method. 10 mm deep holes were drilled from the surface of the concrete cylinders, and then the concrete powder from a depth of 10 mm to 40 mm was collected by drilling. After grinding, the powder was sieved using a 0.08 mm sieve. The solution was made with the powder and the pH value was analyzed with the pH meter. The experimental procedure is shown in Figure 5.

3. Results and Discussion

3.1. Tensile Strength Test

The diameters of all the GFRP bars before and after conditioning were measured and the change was negligible for all the condition temperatures and exposure times.
All the GFRP bars failed in the middle of the length. During the tensile strength tests, the GFRP bars showed approximately linear stress–strain behavior up to failure, characterized by delamination and fiber fracture. This applied to all the GFRP bars, including the unconditioned ones and also the conditioned ones in water.
The modulus of elasticity of the GFRP bars after different exposure times at different temperatures is shown in Figure 6 the exposure time or temperature had no significant influence on the residual modulus of elasticity of the GFRP bars, which was consistent with the test results of Wu [32]. In addition, exposure temperature has no significant influence on the residual elastic modulus.
The tensile strength retention ( T r e ) was calculated as the percentage of the tensile strength of the GFRP bars after conditioning over that of the unconditioned ones, as shown in Figure 7. The tensile strength of both G1 and G2 decreased with increased exposure time at all exposure temperatures. For aging at 20 °C, the degradation rate of both G1 and G2 decreased after 120 days. For aging at 40 °C, the degradation rate of both G1 and G2 varied little. For aging at 60 °C, the degradation rate of G1 decreased significantly after 60 days, while the degradation rate of G2 decreased significantly after 30 and 120 days. The degradation rate decreased as the exposure time increased, and the tensile strength retentions tended to converge to a constant value with increased exposure time. As the exposure temperature increased, the degradation rate increased. This was mainly because both the rate of hydrolysis of resin and the reaction between the fiber and hydroxide ion increased as the temperature increased. For aging at 20, 40 °C and 60 °C, there was little difference in the residual tensile strength between the two types of GFRP bars after different exposure times, except 60 days at 60 °C, when G2 had a higher tensile strength retention than G1 (shown in Figure 8). It should be emphasized that after 180 days (the longest exposure time), the residual tensile strength of the two types of GFRP bars was similar.
There has been little relevant research in this field. The experimental results of this study (G1, 20 °C) were compared with those of Wu’s study [32], as shown in Table 1. The deviation of the residual tensile strength at both 90 and 180 days was small, which verifies the accuracy of the test.

3.2. Microstructure Analysis of GFRP Bars

The microstructure of unconditioned G1 and G2 was analyzed with SEM, as shown in Figure 9 and Figure 10, respectively.
After conditioning in concrete at different temperatures for 180 days, the microstructures of G1 and G2 are illustrated in Figure 11 and Figure 12, and Figure 13 and Figure 14, respectively.
Comparing Figure 10a with Figure 13a and Figure 14a, more voids were observed at the edge of the GFRP bars after conditioning for G2, which also applied for G1. This was due to the decomposition of resin by the alkaline solutions in the concrete. As shown in Figure 11, Figure 12, Figure 13 and Figure 14, the cross sections of most of the glass fibers remained a complete circle with little defect. Degradation of the fibers was not obvious. It was possible that the corrosion of glass fibers mainly developed along the fiber direction and defects might not have been detected.
The matrix damage and debonding between the matrix and fibers could be observed for both types of GFRP at all temperatures, as shown in Figure 11, Figure 12, Figure 13 and Figure 14, which was caused by the hydrolysis of resin. This was the main reason for the degradation of the GFRP bars. The debonding can result in uneven distribution of stress under loading, and thus fibers with greater stress fractured earlier.
Comparing the corrosion of G1 and G2, it was found that the G1 surface was rougher than the G2 surface, and in most cases, the debonding condition of G1 was also more severe than that of G2. The sand-coating surface of G2 can provide certain protection for GFRP bars and thus slow down the corrosion of GFRP bars.

3.3. Analysis of Elemental Composition of Glass Fiber

The elemental composition of the glass fiber of G1 before conditioning and after conditioning in concrete for 180 days at 60 °C was analyzed with EDS. The analysis results are illustrated in Figure 15. Fibers where deterioration of the fiber-matrix interface had developed were selected for analysis.
Comparing Figure 15a,b, there was little change in the elemental composition of the fibers. So fiber corrosion was not the reason for the degradation of the GFRP, and the deterioration of the fiber-matrix interface was the dominant degradation mechanism for GFRP bars in concrete.

3.4. Alkalinity Analysis of Concrete Pore Solution

The pH values of the concrete pore solution at different exposure temperatures developed with time, as shown in Figure 16. The pH value fluctuated at 13.5 for all exposure temperatures, and there was little variation with time. The fluctuation of the pH value was caused by the hydration development in the saturated concrete.

4. Prediction of Tensile Strength Degradation of GFRP Bars

4.1. Prediction Models

Different prediction models for long-term performance were developed based on the Arrhenius formula, as shown in Equation (1):
k = A e E a / R T
where k is the reaction rate, A is the Arrhenius constant (same unit as k ), E a is activation energy ( J / m o l or k J / m o l ), R is gas constant ( 8.314   J / ( m o l k ) ) and T is the absolute temperature ( K ). According to the Arrhenius formula, as E a increases, the influence of temperature on the reaction rate increases. For a certain chemical reaction, E a is a constant, and thus the reaction rate can be changed through temperature change.

4.1.1. T r e l g t Prediction Model

Tensile strength retention was predicted with Equation (2):
T r e = a l g t + b
where t is the exposure time, and a and b are regression constants. This model was first developed by Proctor et al. [33] and was successfully applied in the prediction of the residual strength of glass fiber concrete (GRC). Bank et al. [34] introduced this method in the prediction of the property development of GFRP bars. However, there are limitations to this model. Firstly, no degradation mechanism is considered. Secondly, the strength approaches infinity at time zero based on this model.
As shown in Table 2 and Table 3, the coefficient of determinations (R2) was low for G1, while R2 was above 0.90 for G2.
Arrhenius plots for tensile strength retention to reach 90%, 80%, 70%, and 60% were developed based on the regression coefficients determined, as shown in Figure 17. The Arrhenius lines based on the first model were not parallel to each other. This implied that the degradation mechanism changed over time, which violated the premise of the Arrhenius equation. Therefore, the first model was not suitable for the long-term tensile strength prediction of GFRP bars.

4.1.2. T r e e t / τ Prediction Model

Phani and Bose [8] proposed a prediction model for the bend strength reduction of random-fiber composites due to hydrothermal effects following the Arrhenius formula, as Equation (3):
σ t = σ 0 σ e x p t τ 0 e x p E a R T + σ ,
where σ t is the strength at time t , σ 0 is the strength at time 0 , σ is the strength at the time of infinite, E a is activation energy ( J / m o l or k J / m o l ), R is gas constant ( 8.314   J / ( m o l K ) ), τ 0 is a constant, and T is the absolute temperature ( K ). The premise of this model is that the degradation of GFRP is caused by the debonding between the glass fiber and resin matrix [35]. Equation (4) could be derived from Equations (1) and (3):
T r e = σ t σ 0 × 100 = σ 0 σ e x p t τ 0 e x p E a R T + σ σ 0 × 100 = 100 T r e _ e x p t τ 0 e x p E a R T + T r e _
where T r e _ is the tensile strength retention rate (%) at the time of infinite. As 1 / τ = 1 / τ 0 e x p E a R T , the second prediction model could be derived as Equation (5):
T r e = 100 T r e _ e x p t τ + T r e _
where τ is a characteristic time dependent on temperature.
The debonding between the glass fiber and resin matrix was observed by SEM as discussed, which satisfied the premise of the model. The T r e t fitting curves of the second prediction model are shown in Figure 18, and the values of T r e _ and τ are listed in Table 4 and Table 5.
As shown in Table 4 and Table 5, T r e _ of both GFRP bars tended towards a certain value at different temperatures (20 °C, 40 °C, and 60 °C). For both GFRP bars, the R 2 was above 97%, and thus Equation (5) can be used in the study of the long-term performance of GFRP bars.
To verify whether the fitting of the second prediction model conforms to the Arrhenius formula, Equation (5) was transformed into Equation (6):
t = l n T r e T r e _ / 100 T r e _ τ
For T r e of 90%, 80%, 70%, and 60% respectively, the values of l n t at different temperatures can be calculated, and the l n t 1 / T fitting lines are presented in Figure 19. In addition, E a / R can be determined, as shown in Table 6 and Table 7.
From Figure 19, and Table 6 and Table 7, it could be concluded that the Arrhenius lines of the same types of GFRP bars for different strength retention were parallel to each other, which implied that this model conformed to the premise of the Arrhenius formula. Therefore, the Arrhenius formula could be used to predict the long-term tensile strength retention of the GFRP bars. For both GFRP bars, the R 2 was above 96%.
The time shift factor (TSF) was introduced to describe the relationship between the degradation rate at the selected temperature ( T b ) and at the reference temperature T a . According to Table 6 and Table 7, the differences of T r e _ between the two types of GFRP bars at temperatures of 20, 40, and 60 °C were negligible. For the same tensile strength retention, T S F could be derived as Equation (7):
T S F = t a t b = l n T r e T r e _ / 1 T r e _ τ a l n T r e T r e _ / 1 T r e _ τ b = τ a τ b
where t a and t b are the exposure time needed to reach the same T r e at temperatures T a and T b , respectively; τ a and τ b are the time constants at temperatures T a and T b , respectively.
The TSF values of the two kinds of GFRP bars at temperatures (40 °C and 60 °C) relative to the reference temperature (20 °C) were calculated according to Table 4 and Table 5 and Equation (7), as shown in Table 8. For the same T r e , the exposure time needed at temperature T a can be estimated with the exposure time needed at temperature T b and the TSF value. Thus, the tested exposure times at temperatures of 40 and 60 °C were converted to the estimated exposure times needed at 20 °C, and the estimated data and the test data at 20 °C, with the curve for 20 °C by the second prediction model, were plotted and are shown in Figure 20.
As shown in Figure 20, the curve by the second model fitted well with the data. Therefore, the second model can be used for predicting the long-term tensile strength retention of GFRP bars. Some data had higher tensile strength retention than the data at earlier times, which was due to experimental error and individual differences among the GFRP bars. With the standard deviation considered, the tensile strength retention declined with time. As time increased, T r e _ converged to 52%, according to the second model.

4.1.3. T r e 2 A C t Prediction Model

Uomoto T and Katsuki F [36] believed that areas of GFRP bars with alkalinity permeated provide no strength. The reserved strength is provided by areas where no alkalinity is reached and the strength in this area stays the same as the initial strength. Assuming that the diameter of the corroded GFRP bar stays unchanged, the prediction model could be developed with Fick’s law, as in Equation (8):
σ t = σ 0 1 2 A C t r 0 2
where σ t is the tensile strength at the time t, σ 0 is the initial tensile strength, r 0 is the radius of the GFRP bar, A is the diffusion coefficient, and C is the solution concentration. Equation (9) below could be derived through Equation (8):
T r e = σ t σ 0 × 100 = 1 2 A C t r 0 2 × 100
The diameters of G1 and G2 changed little after conditioning, which satisfied the premise of this prediction model. This model was conservative, as the strength of the part of the GFRP bars with alkalinity permeated was not considered. The T r e t fitting curves of the third prediction model were plotted and are shown in Figure 21, and the values of 2 A C are listed in Table 9 and Table 10.
As shown in Table 8 and Table 9, the R 2 of all the fitting curves based on the third model were above 94% for both GFRP bars.
To validate whether the fitting of the test data based on the third prediction model conformed to the relationship between exposure time and temperature in the Arrhenius formula, Equation (9) was transformed into Equation (10):
t = 1 T r e 100 r 0 2 / 2 A C
When T r e (%) was 90, 80, 70, and 60 respectively, the values of l n t at different temperatures were determined. The l n t 1 / T fitting lines are presented in Figure 22, and the values of E a / R are listed in Table 11 and Table 12.
From Figure 22, and Table 11 and Table 12, the Arrhenius lines for different strength retentions were parallel to each other, which indicated that the third model conformed to the premise of the Arrhenius formula and could be used to predict the long-term tensile strength retention of GFRP bars. T S F was calculated as Equation (11):
T S F = t a t b = 1 T r e 100 r 0 2 / 2 A C a 1 T r e 100 r 0 2 / 2 A C b = A C b A C a
where A C a and A C b are the time constants at temperatures T a and T b , respectively.
The TSF of the two kinds of GFRP bars at different temperatures (40 °C and 60 °C) relative to the reference temperature (20 °C) was calculated according to Table 9 and Table 10, and Equation (11), as shown in Table 13. Thus, the test exposure times at temperatures of 40 °C and 60 °C were converted to the estimated exposure times needed at 20 °C, and the estimated data and the test data at 20 °C, with the curve for 20 °C by the third prediction model, were plotted and are shown in Figure 23.
As shown in Figure 23, the curve by the third model fitted well with the data. Some data had higher tensile strength retention than the data at earlier times, which was due to experimental error and individual differences among the GFRP bars. However, even though the standard deviation was considered, there were still some unreasonable data in Figure 23a, which indicated that the third model was irrational. Also with increased time, the development ratio of the strength retention did not decrease significantly, as it did in the test. Therefore, the third prediction model was not suitable for the prediction of the long-term tensile strength of GFRP bars in concrete.

4.1.4. Tre − 1/(1 + et/B) Prediction Model

As shown in the SEM images, the decrease in the tensile strength of the GFRP was due to the debonding between the matrix resins and glass fibers. Considering the nonlinear growth of the debonding, a new model was proposed based on the Boltzmann equation (Equation (12)), as Equation (13):
y = A 1 A 2 1 + e x x 0 / d x + A 2
T r e = 2 100 T r e _ 1 + e t / B + T r e _ ,
where B is a time constant dependent on temperature.
Equation (13) was fitted to the test data and the T r e t fitting curves of the fourth prediction model are shown in Figure 24. The values of T r e _ and B are listed in Table 14 and Table 15.
As shown in Table 14 and Table 15, the T r e _ of both GFRP bars tended towards a certain value at different temperatures (20, 40, and 60 °C). For both GFRP bars, the R 2 was above 95%, and thus Equation (13) can be used in the prediction of the long-term performance of GFRP bars.
To validate whether the fitting of the fourth prediction model conformed to the Arrhenius formula, Equation (13) was transformed into Equation (14):
t = l n 2 100 T r e _ T r e T r e _ 1 × B
For T r e of 90%, 80%, 70%, and 60% respectively, the values of l n t at different temperatures were calculated, and the l n t 1 / T fitting lines are presented in Figure 25. in addition, E a / R was determined, as shown in Table 16 and Table 17.
From Figure 25, and Table 16 and Table 17, it can be seen that the Arrhenius lines under different strength retentions were parallel to each other. For both GFRP bars, the R 2 was above 95%. The T S F was calculated as Equation (15):
T S F = t a t b = l n 2 100 T r e _ T r e T r e _ × B a l n 2 100 T r e _ T r e T r e _ × B b = B a B b
where B a and B b are time constants at temperatures T a and T b , respectively.
The TSF values of the two kinds of GFRP at temperatures (40 °C and 60 °C) relative to the reference temperature (20 °C) were calculated according to Table 14 and Table 15, and Equation (15), as shown in Table 18. In addition, the test exposure times at temperatures of 40 °C and 60 °C were converted to the estimated exposure times needed at 20 °C, and the estimated data and the test data at 20 °C, with the curve for 20 °C by the fourth prediction model, were plotted in Figure 26.
As shown in Figure 26, the curve by the fourth model fitted well with the data. In addition, the fourth model can be used for predicting the long-term tensile strength retention of GFRP bars.
According to Figure 20, Figure 23 and Figure 26, the R 2 values of the second, third, and fourth models are listed in Table 19.
According to Table 19, the third model had a lower R 2 value. According to Figure 20 and Figure 26, for both the second and fourth models, some data had higher tensile strength retention than the data at earlier times. There were fewer problem data for the fourth model, which indicated that the fourth model was more suitable than the second model in this study. Thus, the fourth model was recommended as the best model for predicting the long-term tensile strength of GFRP bars in concrete.
According to Equations (13) and (15), the strength retention can be calculated as:
T r e = 2 100 T r e _ 1 + e T S F t b / B a + T r e _
According to the China statistical yearbook 2013 [37], the average annual temperatures of the main cities in China ranged from 4.6 °C (Harbin) to 24.6 °C (Haikou), and between these, the average annual temperatures in Beijing, Shanghai, and Guangzhou were 12.9 °C, 16.9 °C, and 21.7 °C, respectively. The values of TSF at different temperatures relative to the reference temperature of 20 °C were calculated. The T r e t curves were plotted based on Equation (13), as shown in Figure 27.
Figure 27 shows that for all the temperatures, the slopes of the curves decreased over time and eventually stayed at zero, which meant that the GFRP tensile strength retention stayed at a certain level after some time. As the temperature increased, the decline rate increased. For the same type of GFRP bars, the eventual tensile strength retention at different temperatures was the same. The decline rate of G2 was smaller than G1 at the same temperature.

4.2. Durability Parameters of GFRP Bars

4.2.1. T r e _

As shown in Table 4 and Table 5, and Figure 20, as well as in Table 14 and Table 15, and Figure 26, for both GFRP bars, T r e _ was about 52% at all three temperatures, 20 °C, 40 °C, and 60 °C, which indicates that the temperature can accelerate the corrosion without altering the mechanism of corrosion. in addition, the final tensile strength at the time of infinity would be the same under any temperature, as long as the physical condition of the GFRP bars remains unchanged (e.g., not exceeding the glass transition temperature of GFRP).
In the experiment, the GFRP bars were exposed to a moisture-saturated environment in concrete, but in practice, the moisture in concrete is normally unsaturated. The exposure condition in this study was more severe than that in practice, considering the hydrolysis reaction in the GFRP corrosion under an alkaline environment [38]. Therefore, the tensile strength retention rate of the GFRP bars in this study was conservative.
Lqbal et al. [39] concluded that in most articles, the tensile strength retention of GFRP bars is above 60%, irrespective of aging conditions. In this study, after 90-day aging at 60 °C, the residual tensile strength of GFRP was below 60%.

4.2.2. Activation Energy E a

As shown in Table 6, Table 7, Table 11, Table 12, Table 16 and Table 17, the activation energies of the same material under different temperatures were almost the same.
According to the Arrhenius equation, the reaction rate under the same temperature was negatively correlated with the activation energy, i.e., higher activation energy meant a slower corrosion rate. The activation energy can be regarded as one of the evaluation parameters for the durability of GFRP bars. However, the value of activation energy is related to the prediction model and different models can result in different values of activation energy. Thus, the activation energy should be compared under similar models.
The activation energy of GFRP bars determined in this study and former studies are summarized in Table 20.
From Table 18, the activation energies of both types of GFRP bars under the second prediction model in this study were the same, and they were the same as the result by Davalos. The activation energy of G2 under the third prediction model was 10% higher than that of G1, and under the fourth prediction model, the activation energy of G2 was 4% higher than that of G1. Considering the SEM analysis, it can be concluded that the corrosion of sand-coated GFRP bars was slower than ordinary ones in an alkaline environment of concrete.
In the study by Davalos et al. [35], the activation energy of GFRP bars under load was lower than that of GFRP bars without load, and it was believed that the load increased the reaction rate.

5. Conclusions

  • Exposure time and temperature had no significant influence on the modulus of elasticity of the GFRP bars. The degradation rate of the tensile strength of both G1 and G2 decreased with increased exposure time at all exposure temperatures, and the tensile strength retentions tended to converge to a constant value with increased exposure time. As the exposure temperature increased, the degradation rate increased.
  • According to the analysis of microstructure by SEM, the matrix damage and debonding between the matrix and fibers was observed for both types of GFRP at all temperatures, due to the hydrolysis of resin in the alkaline environment of concrete. This was the main reason for the degradation of the GFRP bars. The corrosion of the ordinary GFRP bar was more severe than the sand-coated one.
  • According to the EDS analysis, little change was observed in the elemental composition of the fibers after the 180-day exposure, and the fiber corrosion was not the main reason for the degradation of the GFRP. The deterioration of the fiber-matrix interface was the dominant degradation mechanism for the GFRP bars in concrete.
  • Four prediction models for GFRP tensile strength were developed based on the test results. The second and fourth models were suitable for the long-term tensile strength prediction of GFRP bars, and the fourth model was suggested to be the best model.
  • For both GFRP bars, T r e _ was about 52% at all three temperatures, 20, 40, and 60 °C, which indicates that the temperature can accelerate the corrosion without altering the mechanism of corrosion. At the time of infinity, the final tensile strength would be the same under any temperature, as long as the physical condition of the GFRP bars remains unchanged (e.g., does not exceed the glass transition temperature of the GFRP). The tensile strength retention rate of the GFRP bars in this study was conservative, considering more severe exposure conditions in the experiment than in practice. In addition, this study is helpful for the determination of the environmental reduction factor in the design guides.
  • This study focused on the degradation of tensile strength and elastic modulus of GFRP bars, and further work is suggested on the shear strength and flexural strength of GFRP bars, as well as the adhesive properties between GFRP bars and concrete.
  • In practice, concrete rarely remains in saturated humidity; therefore, the durability of GFRP bars in concrete with different humidities should be studied.

Author Contributions

Writing—original draft preparation, Z.L.; Writing—review & editing, P.Z. and Y.Z.; Validation, Y.W.; Funding acquisition, P.Z.; Supervision, W.Q.; Conceptualization, P.Z.; Resources, P.Z.; Visualization, Y.Z. All authors have read and agreed to the published version of the manuscript.

Funding

This research was funded by the National Key Research and Development Program of China (2022YFC3801100), and the Shanghai Pujiang Program (12PJ1409000).

Data Availability Statement

Data that support the findings of this study are available from the corresponding author upon reasonable request.

Conflicts of Interest

The authors declare no conflict of interest.

References

  1. Feng, G.; Zhu, D.; Guo, S.; Rahman, M.Z.; Jin, Z.; Shi, C. A review on mechanical properties and deterioration mechanisms of FRP bars under severe environmental and loading conditions. Cem. Concr. Compos. 2022, 134, 104758. [Google Scholar] [CrossRef]
  2. Wang, W.; Xue, W. Accelerated Aging Tests for Evaluations of Tensile Properties of GFRP Rebars Exposed to Alkaline Solution (in Chinese). J. Build. Mater. 2012, 15, 760–766. [Google Scholar]
  3. Chen, Y.; Davalos, J.F.; Ray, I.; Kim, H.-Y. Accelerated aging tests for evaluations of durability performance of FRP reinforcing bars for concrete structures. Compos. Struct. 2007, 78, 101–111. [Google Scholar] [CrossRef]
  4. Kim, H.-Y.; Park, Y.-H.; You, Y.-J.; Moon, C.-K. Short-term durability test for GFRP rods under various environmental conditions. Compos. Struct. 2008, 83, 37–47. [Google Scholar] [CrossRef]
  5. Benmokrane, B.; Ali, A.H.; Mohamed, H.M.; ElSafty, A.; Manalo, A. Laboratory assessment and durability performance of vinyl-ester, polyester, and epoxy glass-FRP bars for concrete structures. Compos. Part B Eng. 2017, 114, 163–174. [Google Scholar] [CrossRef] [Green Version]
  6. Lu, Z.; Jiang, M.; Pan, Y.; Xian, G.; Yang, M. Durability of basalt fibers, glass fibers, and their reinforced polymer composites in artificial seawater. Polym. Compos. 2022, 43, 1961–1973. [Google Scholar] [CrossRef]
  7. Zhu, J.; Deng, Y.; Chen, P.; Wang, G.; Min, H.; Fang, W. Prediction of Long-Term Tensile Properties of Glass Fiber Reinforced Composites under Acid-Base and Salt Environments. Polymers 2022, 14, 3031. [Google Scholar] [CrossRef]
  8. Phani, K.K.; Bose, N.R. TEMPERATURE-DEPENDENCE OF HYDROTHERMAL AGING OF CSM-LAMINATE DURING WATER IMMERSION. Compos. Sci. Technol. 1987, 29, 79–87. [Google Scholar] [CrossRef]
  9. Pan, Y.; Yan, D. Study on the durability of GFRP bars and carbon/glass hybrid fiber reinforced polymer (HFRP) bars aged in alkaline solution. Compos. Struct. 2021, 261, 113285. [Google Scholar] [CrossRef]
  10. Wang, Z.; Zhao, X.-L.; Xian, G.; Wu, G.; Singh Raman, R.K.; Al-Saadi, S. Durability study on interlaminar shear behaviour of basalt-, glass- and carbon-fibre reinforced polymer (B/G/CFRP) bars in seawater sea sand concrete environment. Constr. Build. Mater. 2017, 156, 985–1004. [Google Scholar] [CrossRef]
  11. Lu, C.; Ni, M.; Chu, T.; He, L. Comparative Investigation on Tensile Performance of FRP Bars after Exposure to Water, Seawater, and Alkaline Solutions. J. Mater. Civ. Eng. 2020, 32, 04020170. [Google Scholar] [CrossRef]
  12. Guo, R.; Xian, G.; Li, F.; Li, C.; Hong, B. Hygrothermal resistance of pultruded carbon, glass and carbon/glass hybrid fiber reinforced epoxy composites. Constr. Build. Mater. 2022, 315, 125710. [Google Scholar] [CrossRef]
  13. Emparanza, A.R.; Kampmann, R.; De Caso, F.; Morales, C.; Nanni, A. Durability assessment of GFRP rebars in marine environments. Constr. Build. Mater. 2022, 329, 127028. [Google Scholar] [CrossRef]
  14. Chen, Y.; Davalos, J.F.; Ray, I. Durability prediction for GFRP reinforcing bars using short-term data of accelerated aging tests. J. Compos. Constr. 2006, 10, 279–286. [Google Scholar] [CrossRef]
  15. Huang, J.W.; Aboutaha, R. Environmental Reduction Factors for GFRP Bars Used as Concrete Reinforcement: New Scientific Approach. J. Compos. Constr. 2010, 14, 479–486. [Google Scholar] [CrossRef]
  16. Bazli, M.; Ashrafi, H.; Oskouei, A.V. Effect of harsh environments on mechanical properties of GFRP pultruded profiles. Compos. Part B Eng. 2016, 99, 203–215. [Google Scholar] [CrossRef]
  17. Zhang, K.; Yang, W.R.; Li, H.Y.; Tang, Z.Y.; Wu, W.W.; Yuan, J.; Feng, Z.M. Semi-Reliability Probability Damage Assessment of GFRP Bars Embedded in Steam-Curing Concrete Beams Based on the Multiple Factors Related Moisture Absorption Model. Polymers 2021, 13, 4409. [Google Scholar] [CrossRef]
  18. Morales, C.N.; Claure, G.; Emparanza, A.R.; Nanni, A. Durability of GFRP reinforcing bars in seawater concrete. Constr. Build. Mater. 2021, 270, 121492. [Google Scholar] [CrossRef]
  19. Duo, Y.; Liu, X.; Liu, Y.; Tafsirojjaman, T.; Sabbrojjaman, M. Environmental impact on the durability of FRP reinforcing bars. J. Build. Eng. 2021, 43, 102909. [Google Scholar] [CrossRef]
  20. Guo, F.; Al-Saadi, S.; Raman, R.K.S.; Zhao, X.L. Durability of fiber reinforced polymer (FRP) in simulated seawater sea sand concrete (SWSSC) environment. Corros. Sci. 2018, 141, 1–13. [Google Scholar] [CrossRef]
  21. Manalo, A.; Maranan, G.; Benmokrane, B.; Cousin, P.; Alajarmeh, O.; Ferdous, W.; Liang, R.; Hota, G. Comparative durability of GFRP composite reinforcing bars in concrete and in simulated concrete environments. Cem. Concr. Compos. 2020, 109, 103564. [Google Scholar] [CrossRef]
  22. Tu, J.W.; Xie, H.; Gao, K.; Li, Z.; Zhang, J.R. Durability Prediction of GFRP Rebar Based on Elastic Modulus Degradation. Front. Mater. 2019, 6, 8. [Google Scholar] [CrossRef]
  23. Benmokrane, B.; Mousa, S.; Mohamed, K.; Sayed-Ahmed, M. Physical, mechanical, and durability characteristics of newly developed thermoplastic GFRP bars for reinforcing concrete structures. Constr. Build. Mater. 2021, 276, 122200. [Google Scholar] [CrossRef]
  24. Yi, Y.; Zhu, D.J.; Rahman, M.Z.; Shuaicheng, G.; Li, S.; Liu, Z.J.; Shi, C.J. Tensile properties deterioration of BFRP bars in simulated pore solution and real seawater sea sand concrete environment with varying alkalinities. Compos. Part B-Eng. 2022, 243, 110115. [Google Scholar] [CrossRef]
  25. Wang, P.; Wu, H.-L.; Ke, L.-y.-w.; Leung, C.K.Y. Mechanical and long-term durability prediction of GFRP rebars with the adoption of low-pH CSA concrete. Constr. Build. Mater. 2022, 346, 128444. [Google Scholar] [CrossRef]
  26. Bazli, M.; Zhao, X.L.; Bai, Y.; Raman, R.K.S.; Al-Saadi, S.; Haque, A. Durability of pultruded GFRP tubes subjected to seawater sea sand concrete and seawater environments. Constr. Build. Mater. 2020, 245, 118399. [Google Scholar] [CrossRef]
  27. Wu, G.; Dong, Z.Q.; Wang, X.; Zhu, Y.; Wu, Z.S. Prediction of Long-Term Performance and Durability of BFRP Bars under the Combined Effect of Sustained Load and Corrosive Solutions. J. Compos. Constr. 2015, 19, 9. [Google Scholar] [CrossRef]
  28. GB/T 13096-2008; Test Method for Mechanical Properties of Pultruded Glass Fiber Reinforced Plastic Rods. Standards Press of China: Beijing, China, 2008. (In Chinese)
  29. Wang, W.-C.; Huang, W.-H.; Lee, M.-Y.; Duong, H.T.H.; Chang, Y.-H. Standardized Procedure of Measuring the pH Value of Cement Matrix Material by Ex-Situ Leaching Method (ESL). Crystals 2021, 11, 436. [Google Scholar] [CrossRef]
  30. Loh, P.Y.; Shafigh, P.; Katman, H.Y.B.; Ibrahim, Z.; Yousuf, S. pH Measurement of Cement-Based Materials: The Effect of Particle Size. Appl. Sci. 2021, 11, 8000. [Google Scholar] [CrossRef]
  31. Behnood, A.; Van Tittelboom, K.; De Belie, N. Methods for measuring pH in concrete: A review. Constr. Build. Mater. 2016, 105, 176–188. [Google Scholar] [CrossRef]
  32. Wu, W.; He, X.; Yang, W.; Dai, L.; Wang, Y.; He, J. Long-time durability of GFRP bars in the alkaline concrete environment for eight years. Constr. Build. Mater. 2022, 314, 125573. [Google Scholar] [CrossRef]
  33. Proctor, B.A.; Oakley, D.R.; Litherland, K.L. Developments in the assessment and performance of grc over 10 years. Composites 1982, 13, 173–179. [Google Scholar] [CrossRef]
  34. Bank, L.C.; Gentry, T.R.; Thompson, B.P.; Russell, J.S. A model specification for FRP composites for civil engineering structures. Constr. Build. Mater. 2003, 17, 405–437. [Google Scholar] [CrossRef]
  35. Davalos, J.F.; Chen, Y.; Ray, I. Long-term durability prediction models for GFRP bars in concrete environment. J. Compos. Mater. 2012, 46, 1899–1914. [Google Scholar] [CrossRef]
  36. Uomoto, T. Durability of FRP as reinforcement for concrete structures. In Proceedings of the Advanced Composite Materials in Buildings and Structures 3rd International Conference, Ottawa, ON, Canada, 15–18 August 2000. [Google Scholar]
  37. National Bureau of Statistics of China. China Statistical Yearbook; National Bureau of Statistics of China: Beijing, China, 2013.
  38. Almusallam, T.H.; Al-Salloum, Y.A.; Alsayed, S.H.; El-Gamal, S.; Aqel, M. Tensile properties degradation of glass fiber-reinforced polymer bars embedded in concrete under severe laboratory and field environmental conditions. J. Compos. Mater. 2012, 47, 393–407. [Google Scholar] [CrossRef]
  39. Iqbal, M.; Zhang, D.; Jalal, F.E.; Faisal Javed, M. Computational AI prediction models for residual tensile strength of GFRP bars aged in the alkaline concrete environment. Ocean Eng. 2021, 232, 109134. [Google Scholar] [CrossRef]
Figure 1. Two types of GFRP ribbed bars.
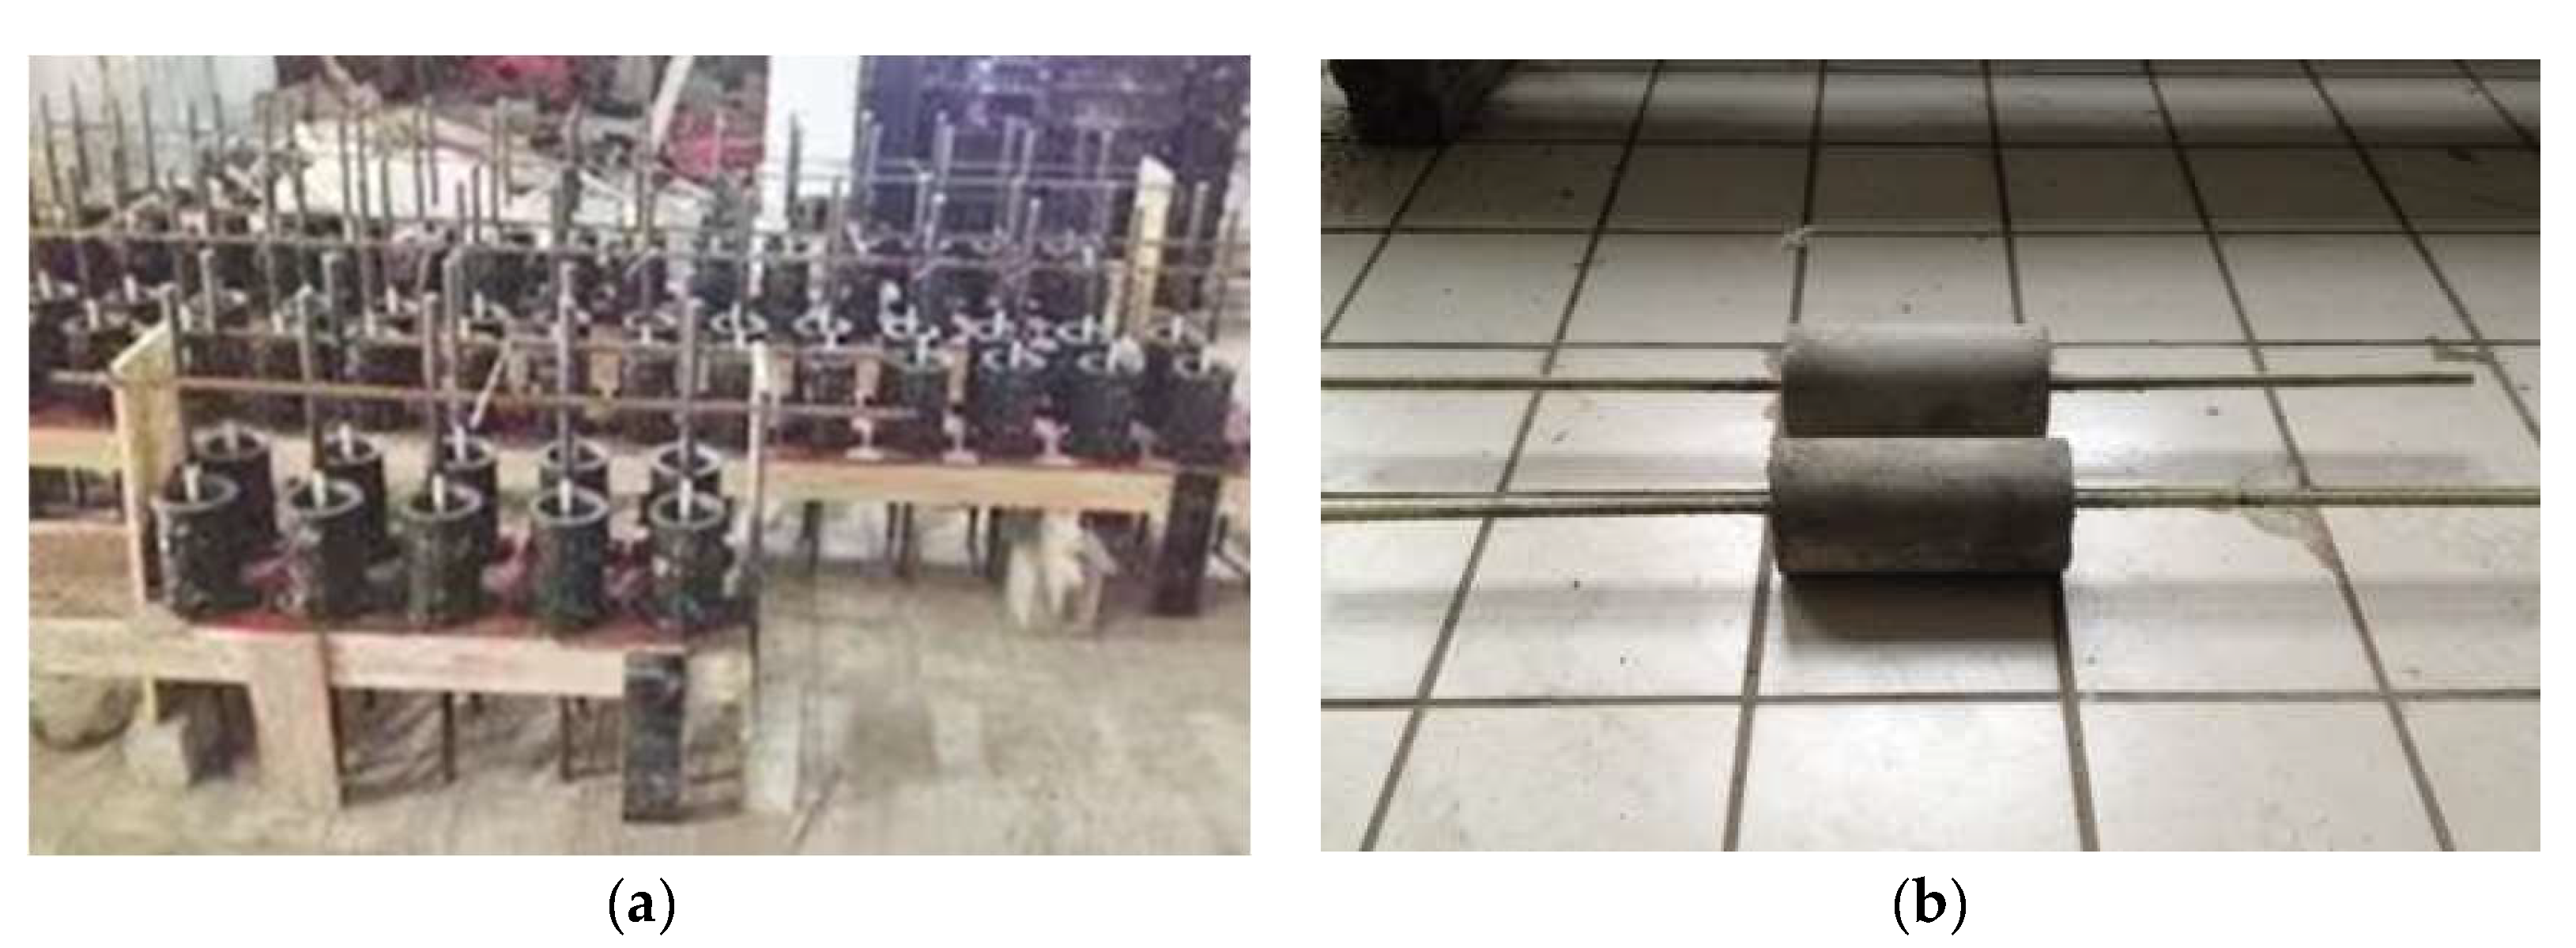
Buildings 13 01035 g001
Figure 2. Fabrication of concrete specimens with GFRP bars: (a) Molds secured in place; (b) Concrete specimens with GFRP bars.
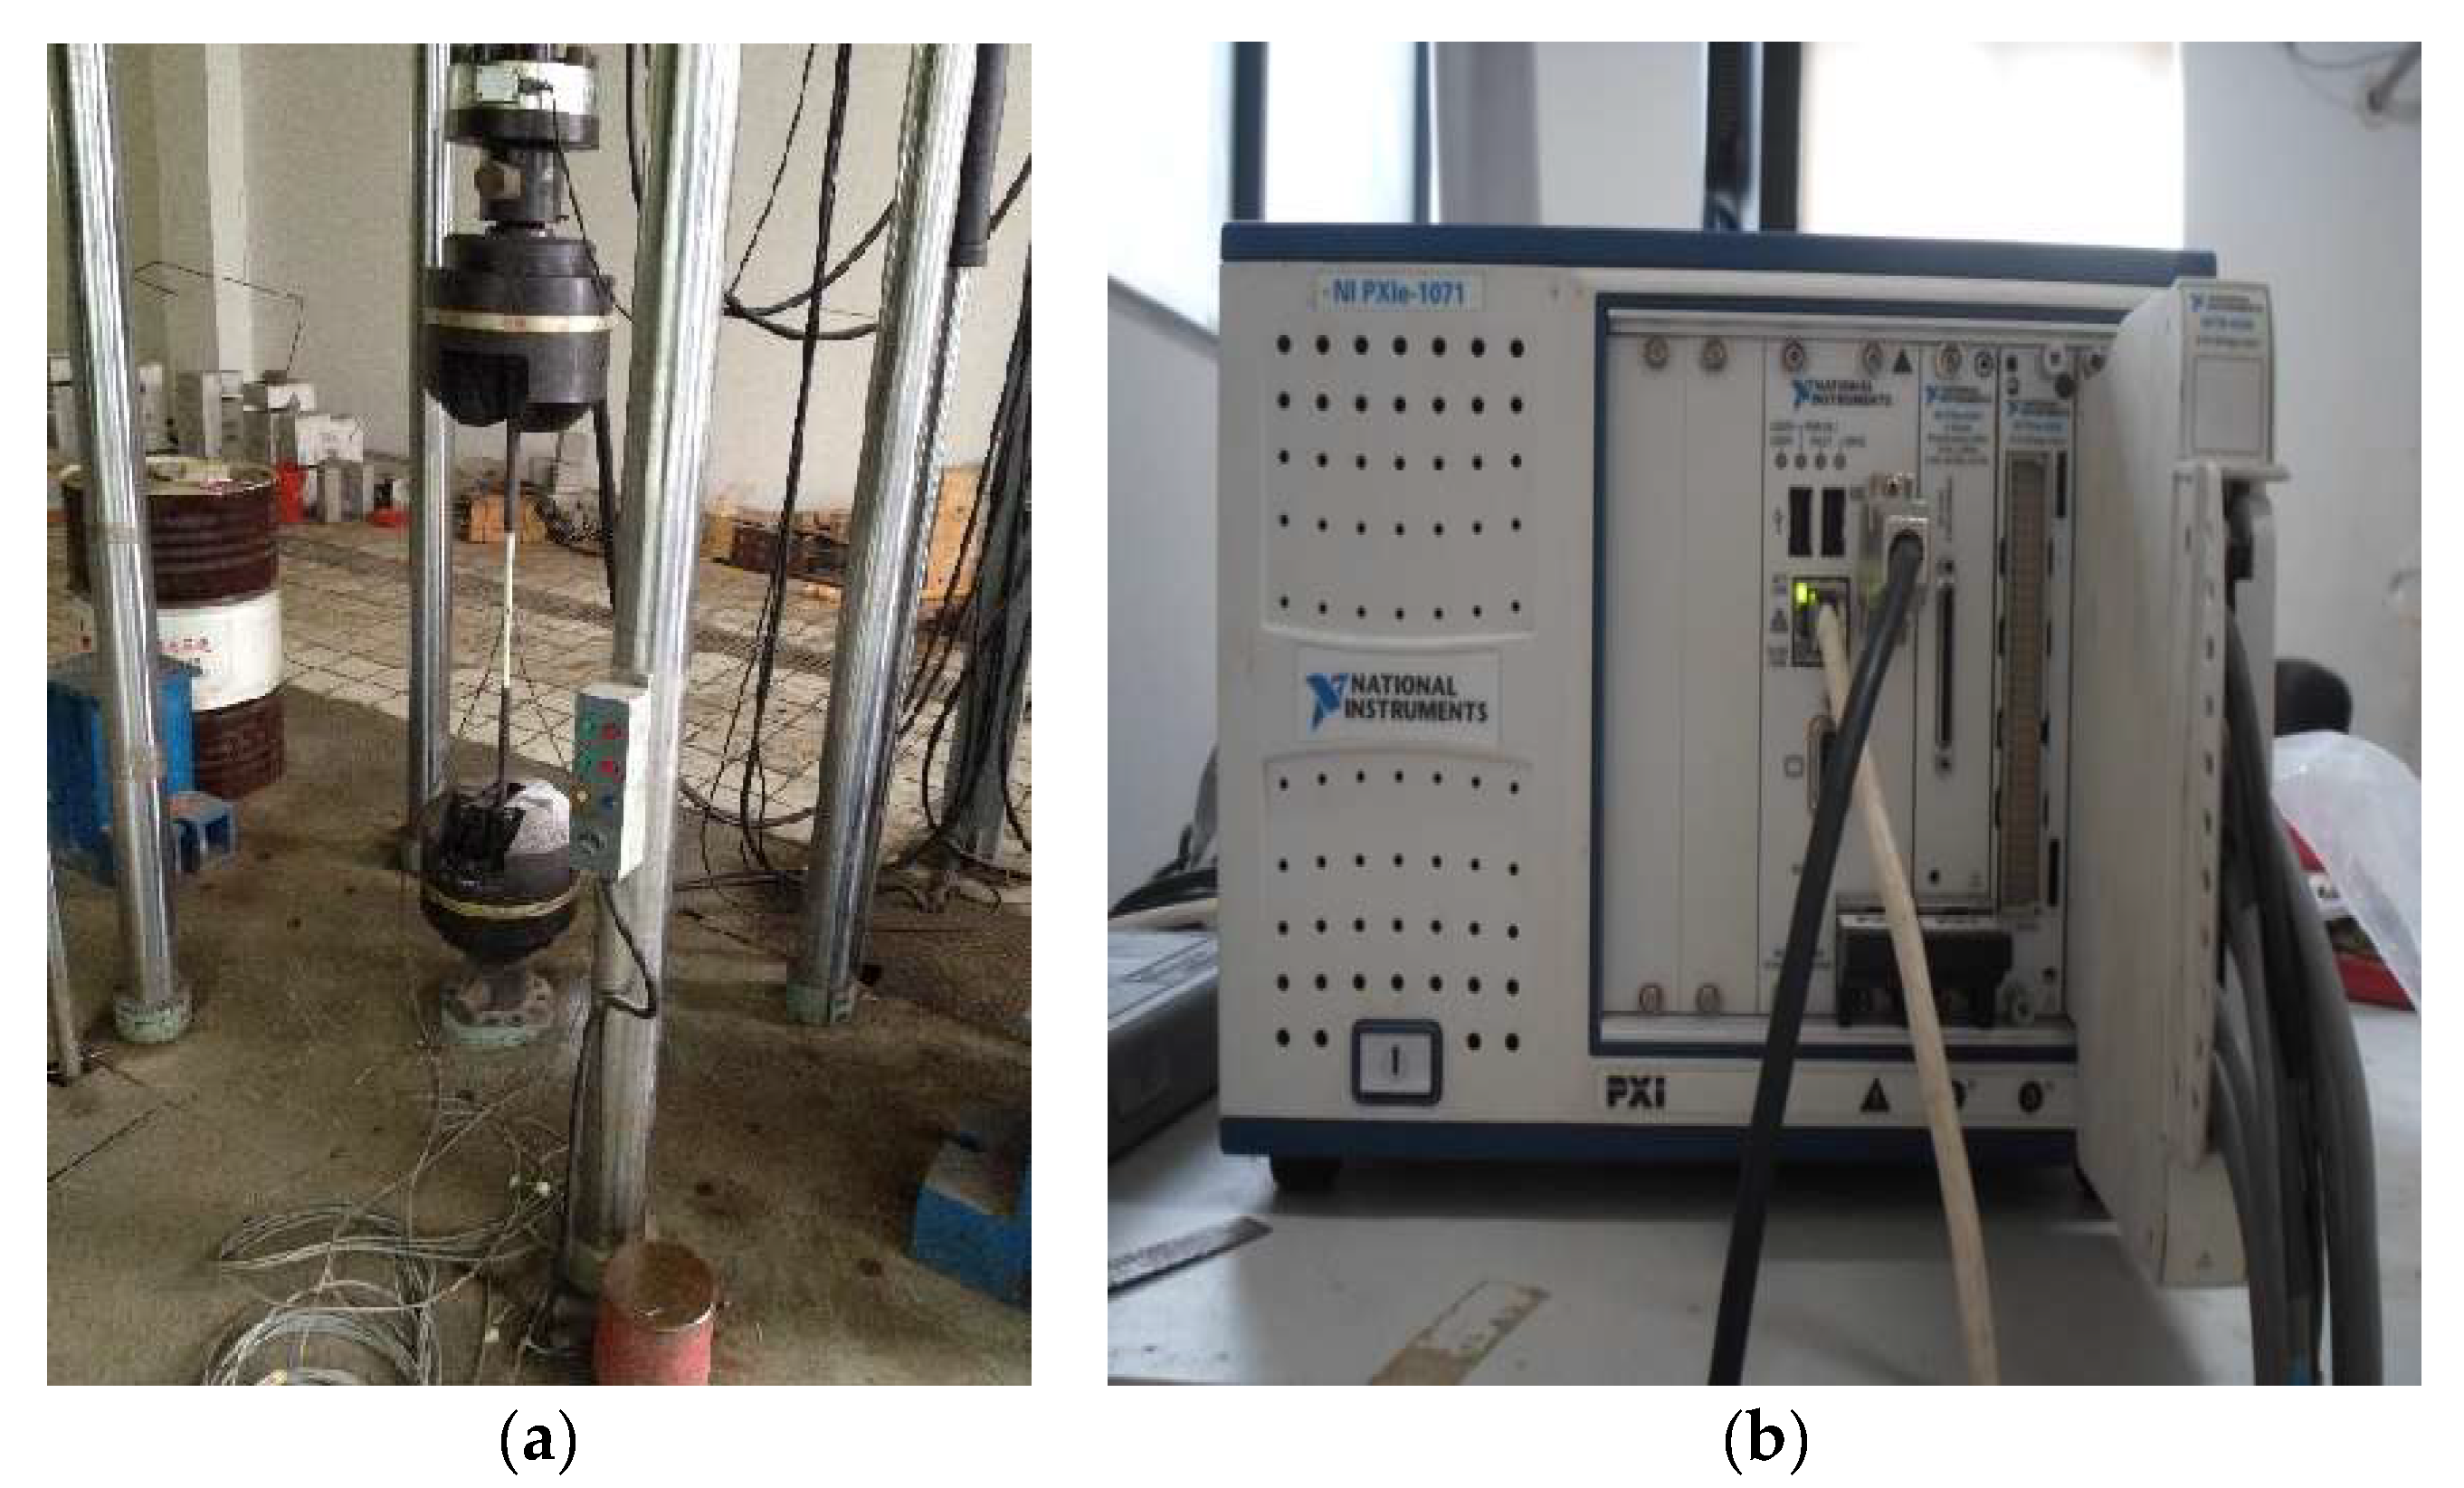
Buildings 13 01035 g002
Figure 3. Test instrument: (a) 500 kN multifunctional hydraulic testing machine; (b) NI data acquisition instrument.
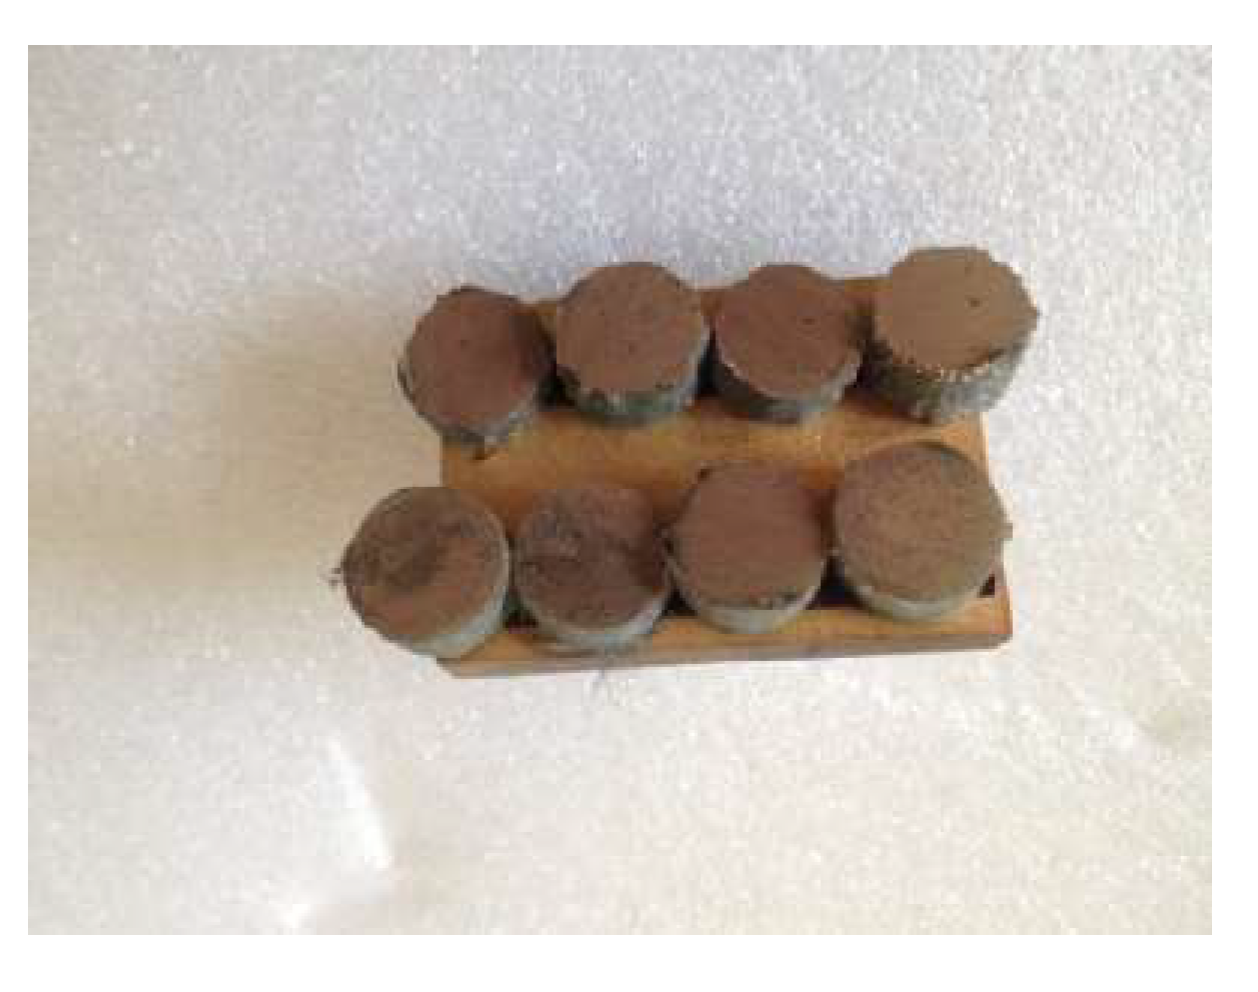
Buildings 13 01035 g003
Figure 4. SEM sample preparation.
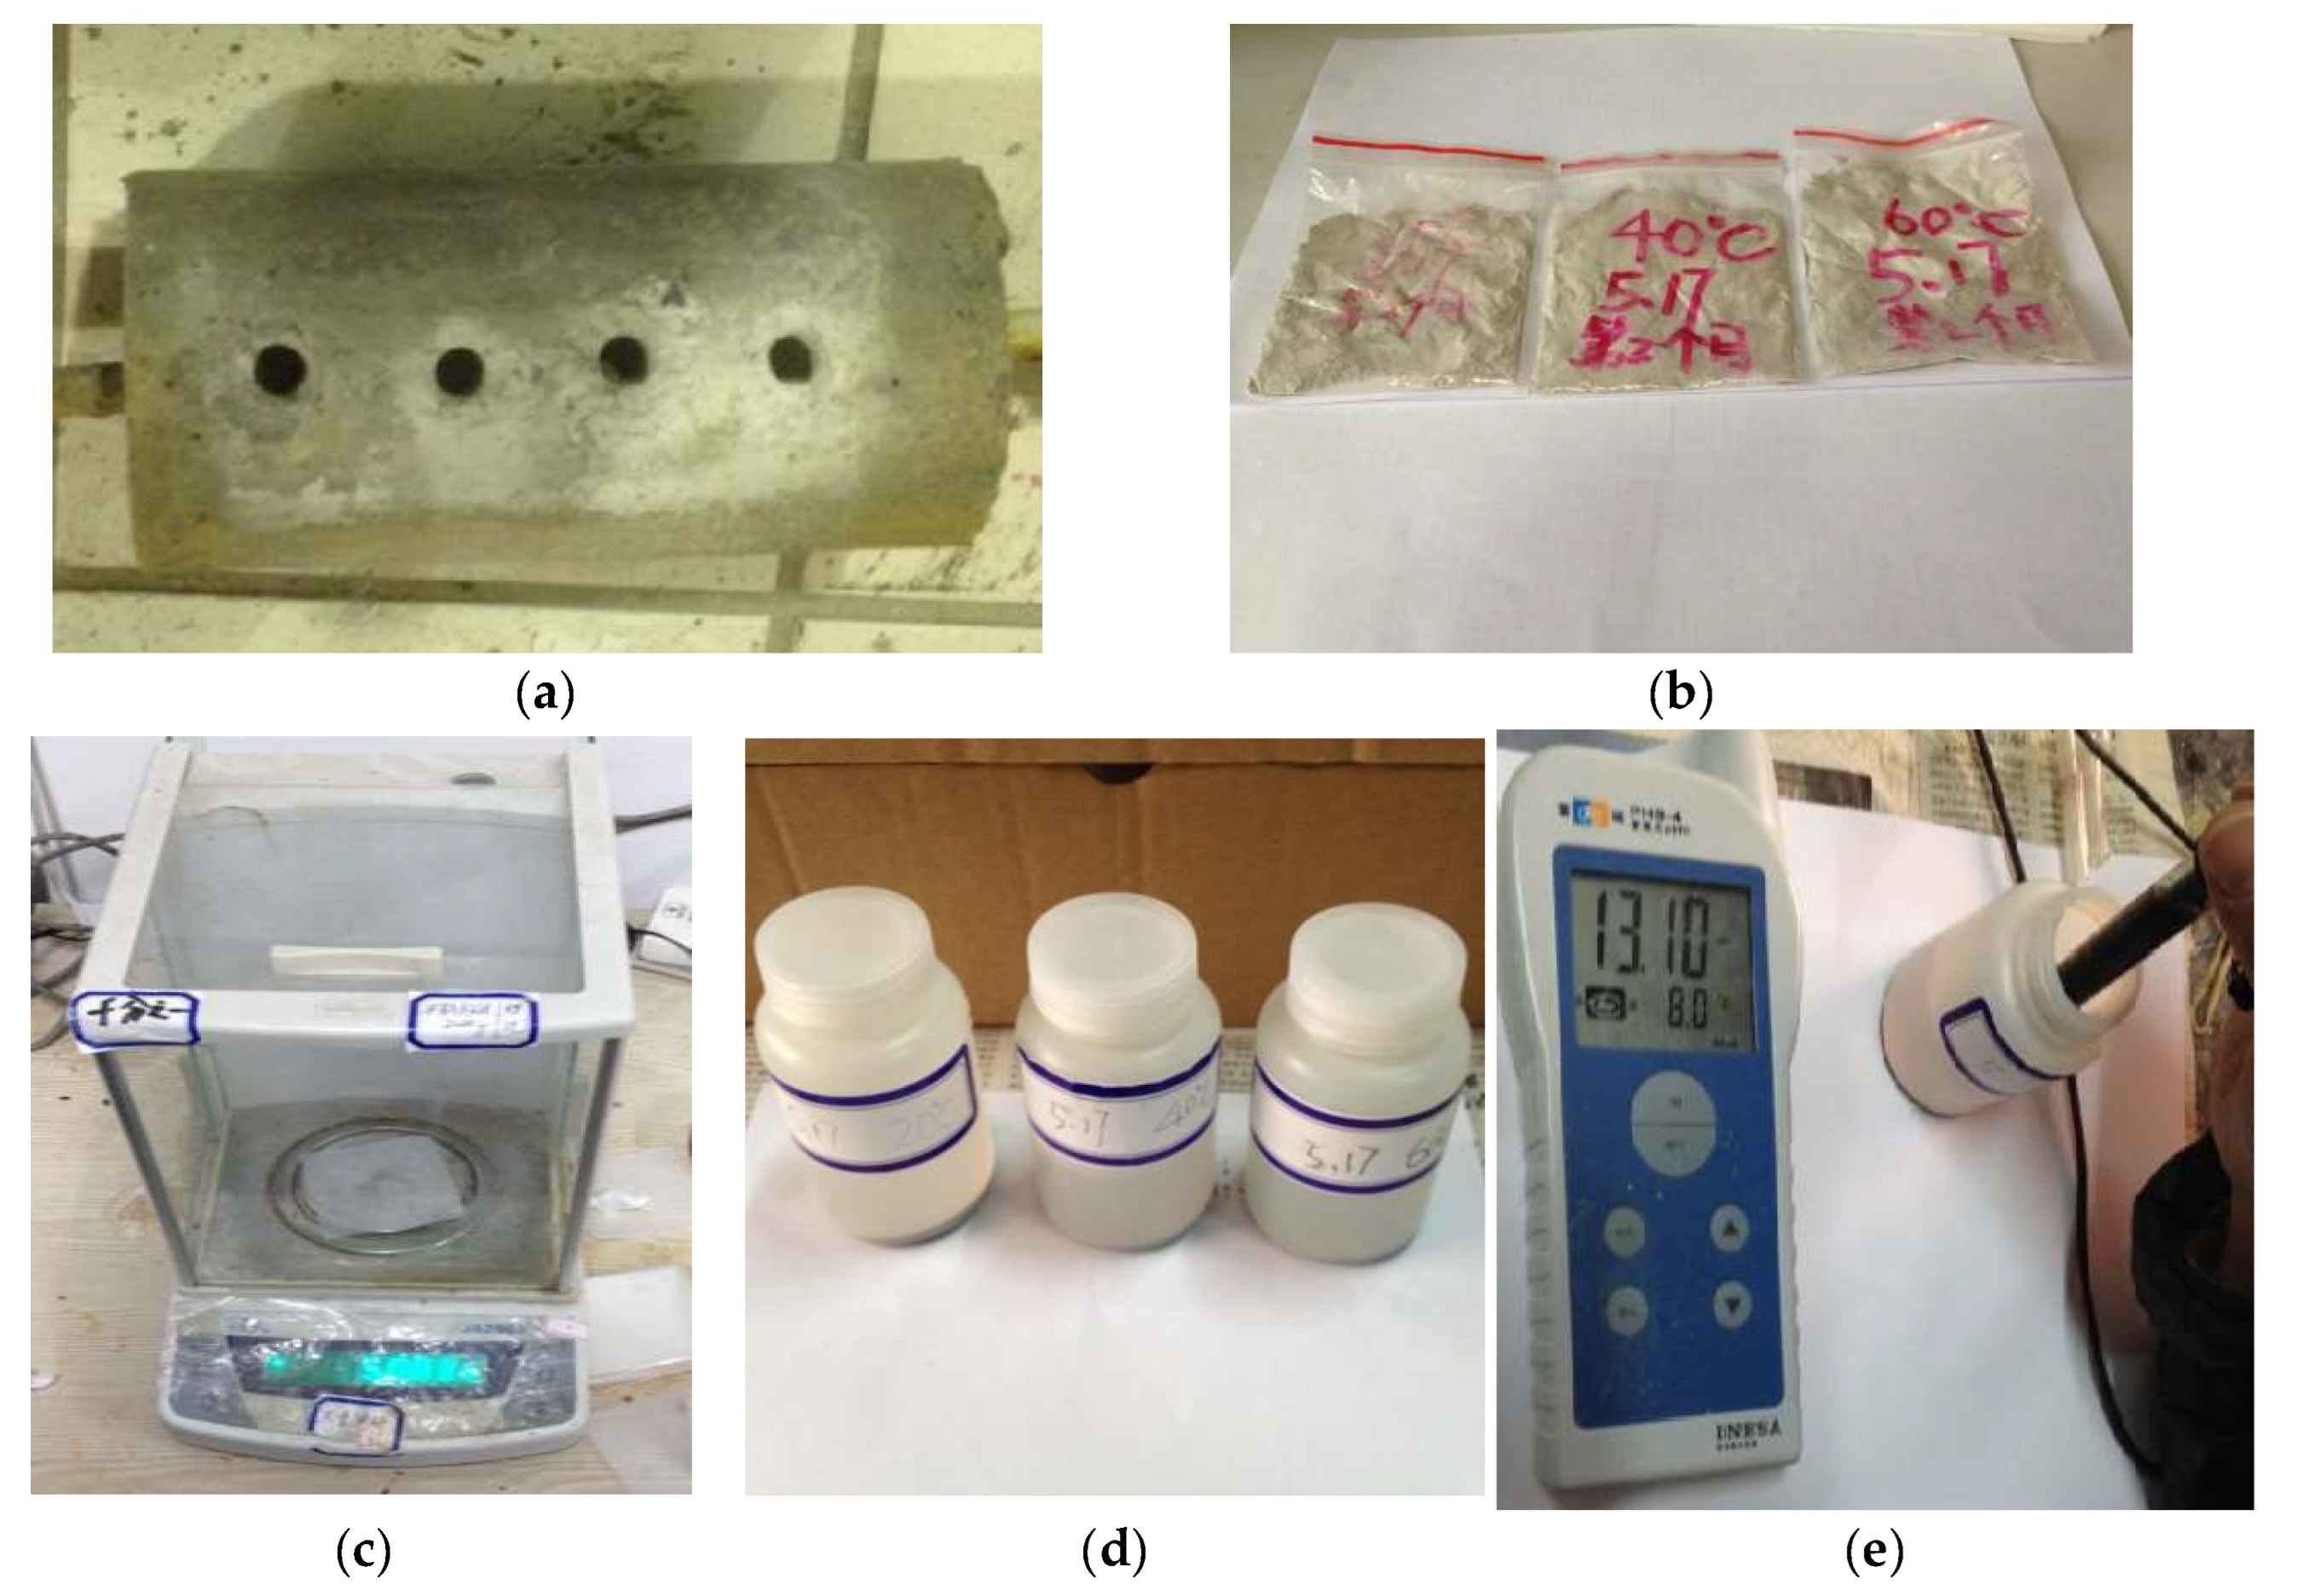
Buildings 13 01035 g004
Figure 5. Determination of pH value of pore solution in concrete: (a) Hole drilling; (b) Concrete powder after aging for 60 days; (c) Weight after sieving; (d) Solution; (e) pH analysis.
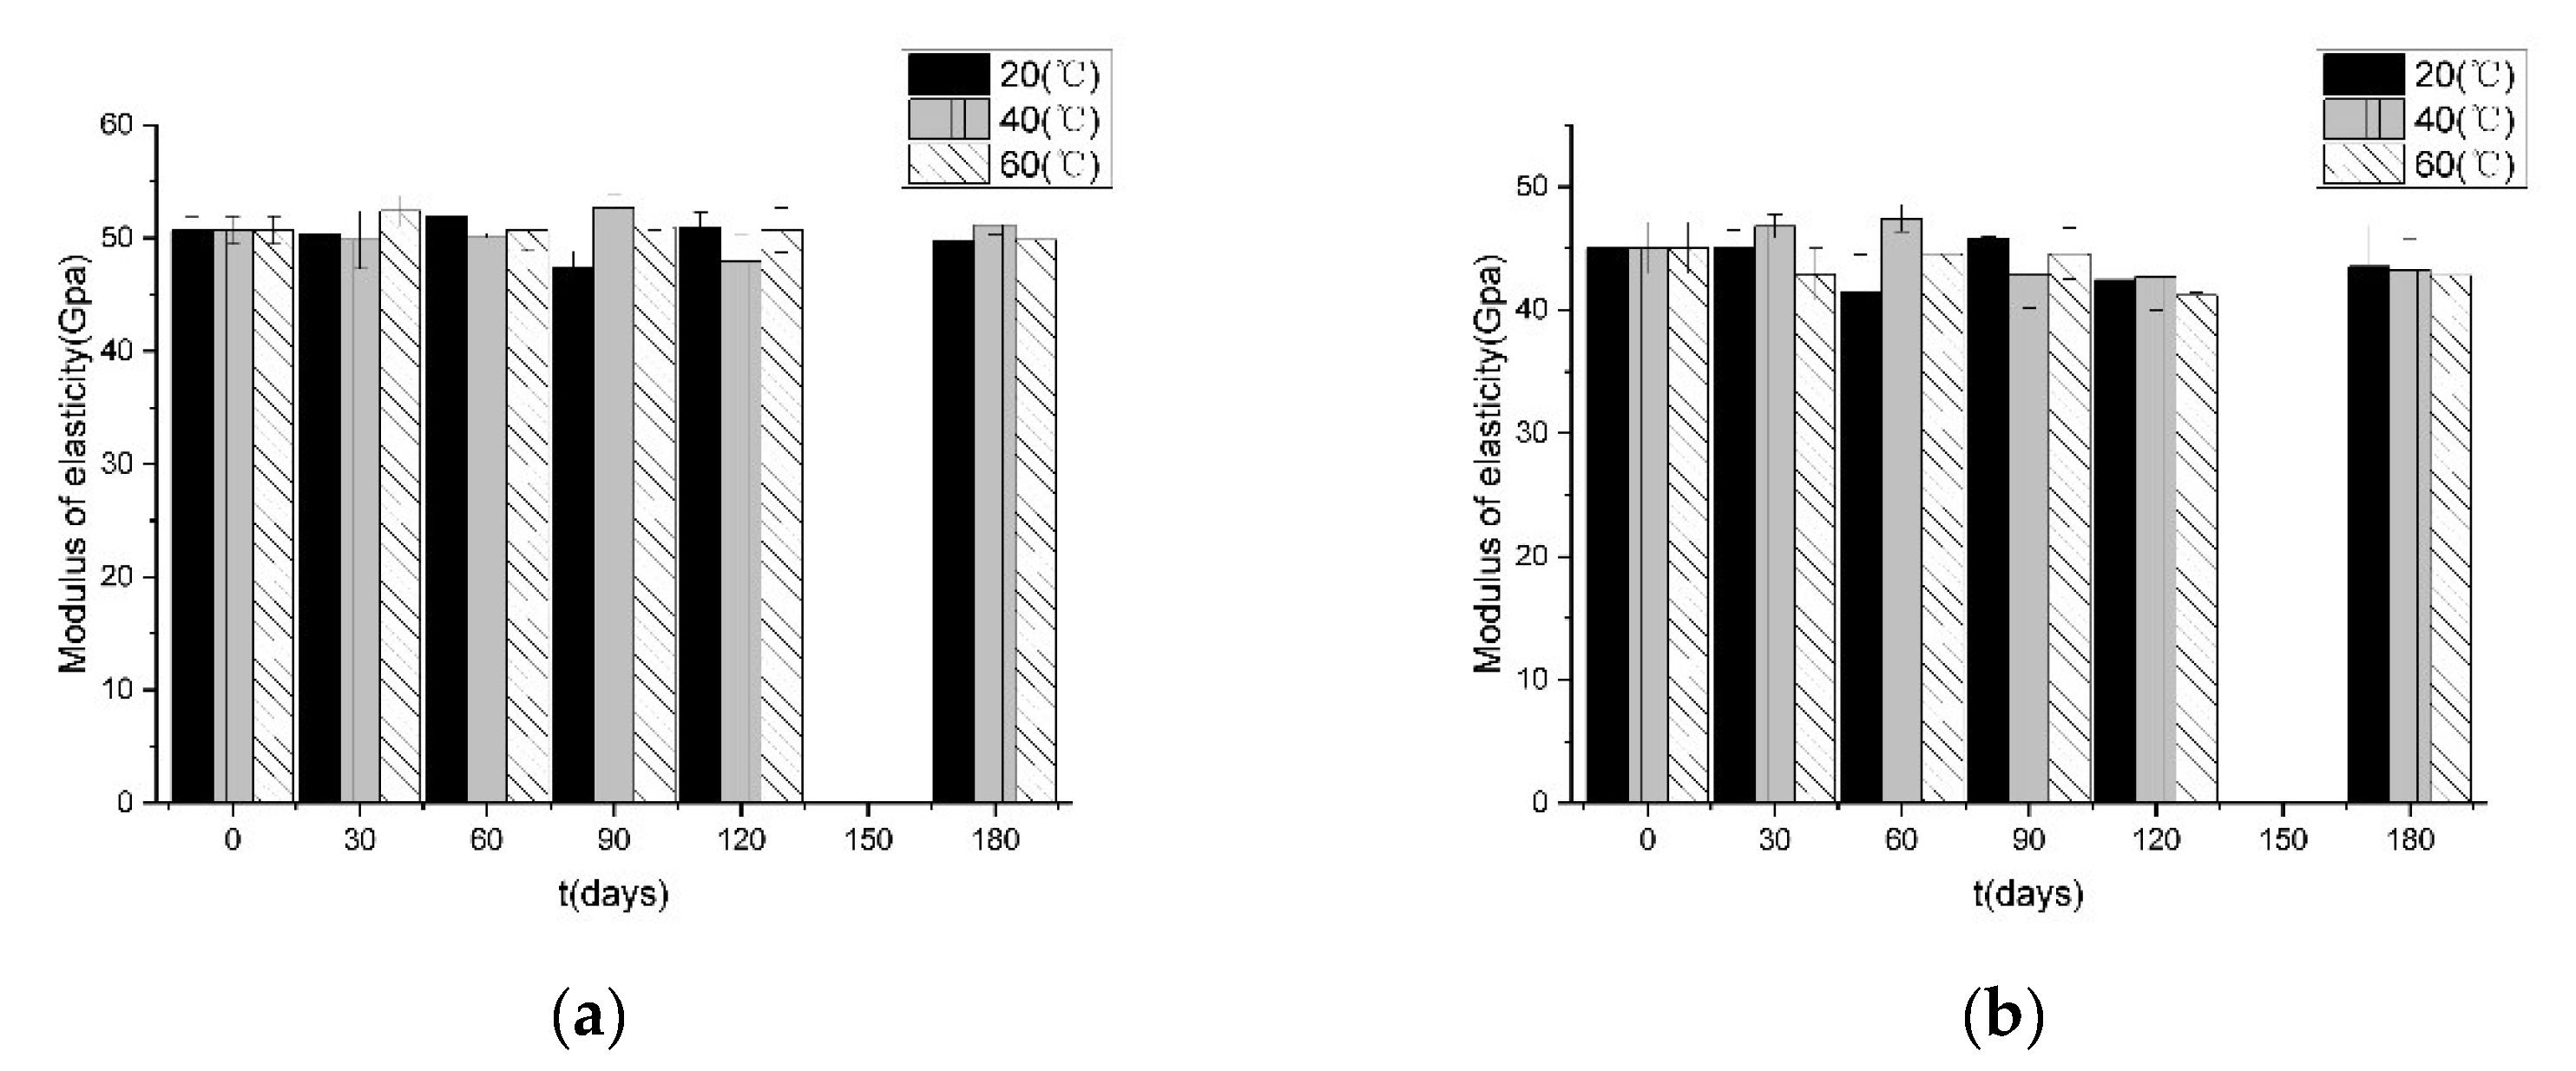
Buildings 13 01035 g005
Figure 6. Modulus of elasticity of GFRP bars after accelerated aging: (a) G1; (b) G2.
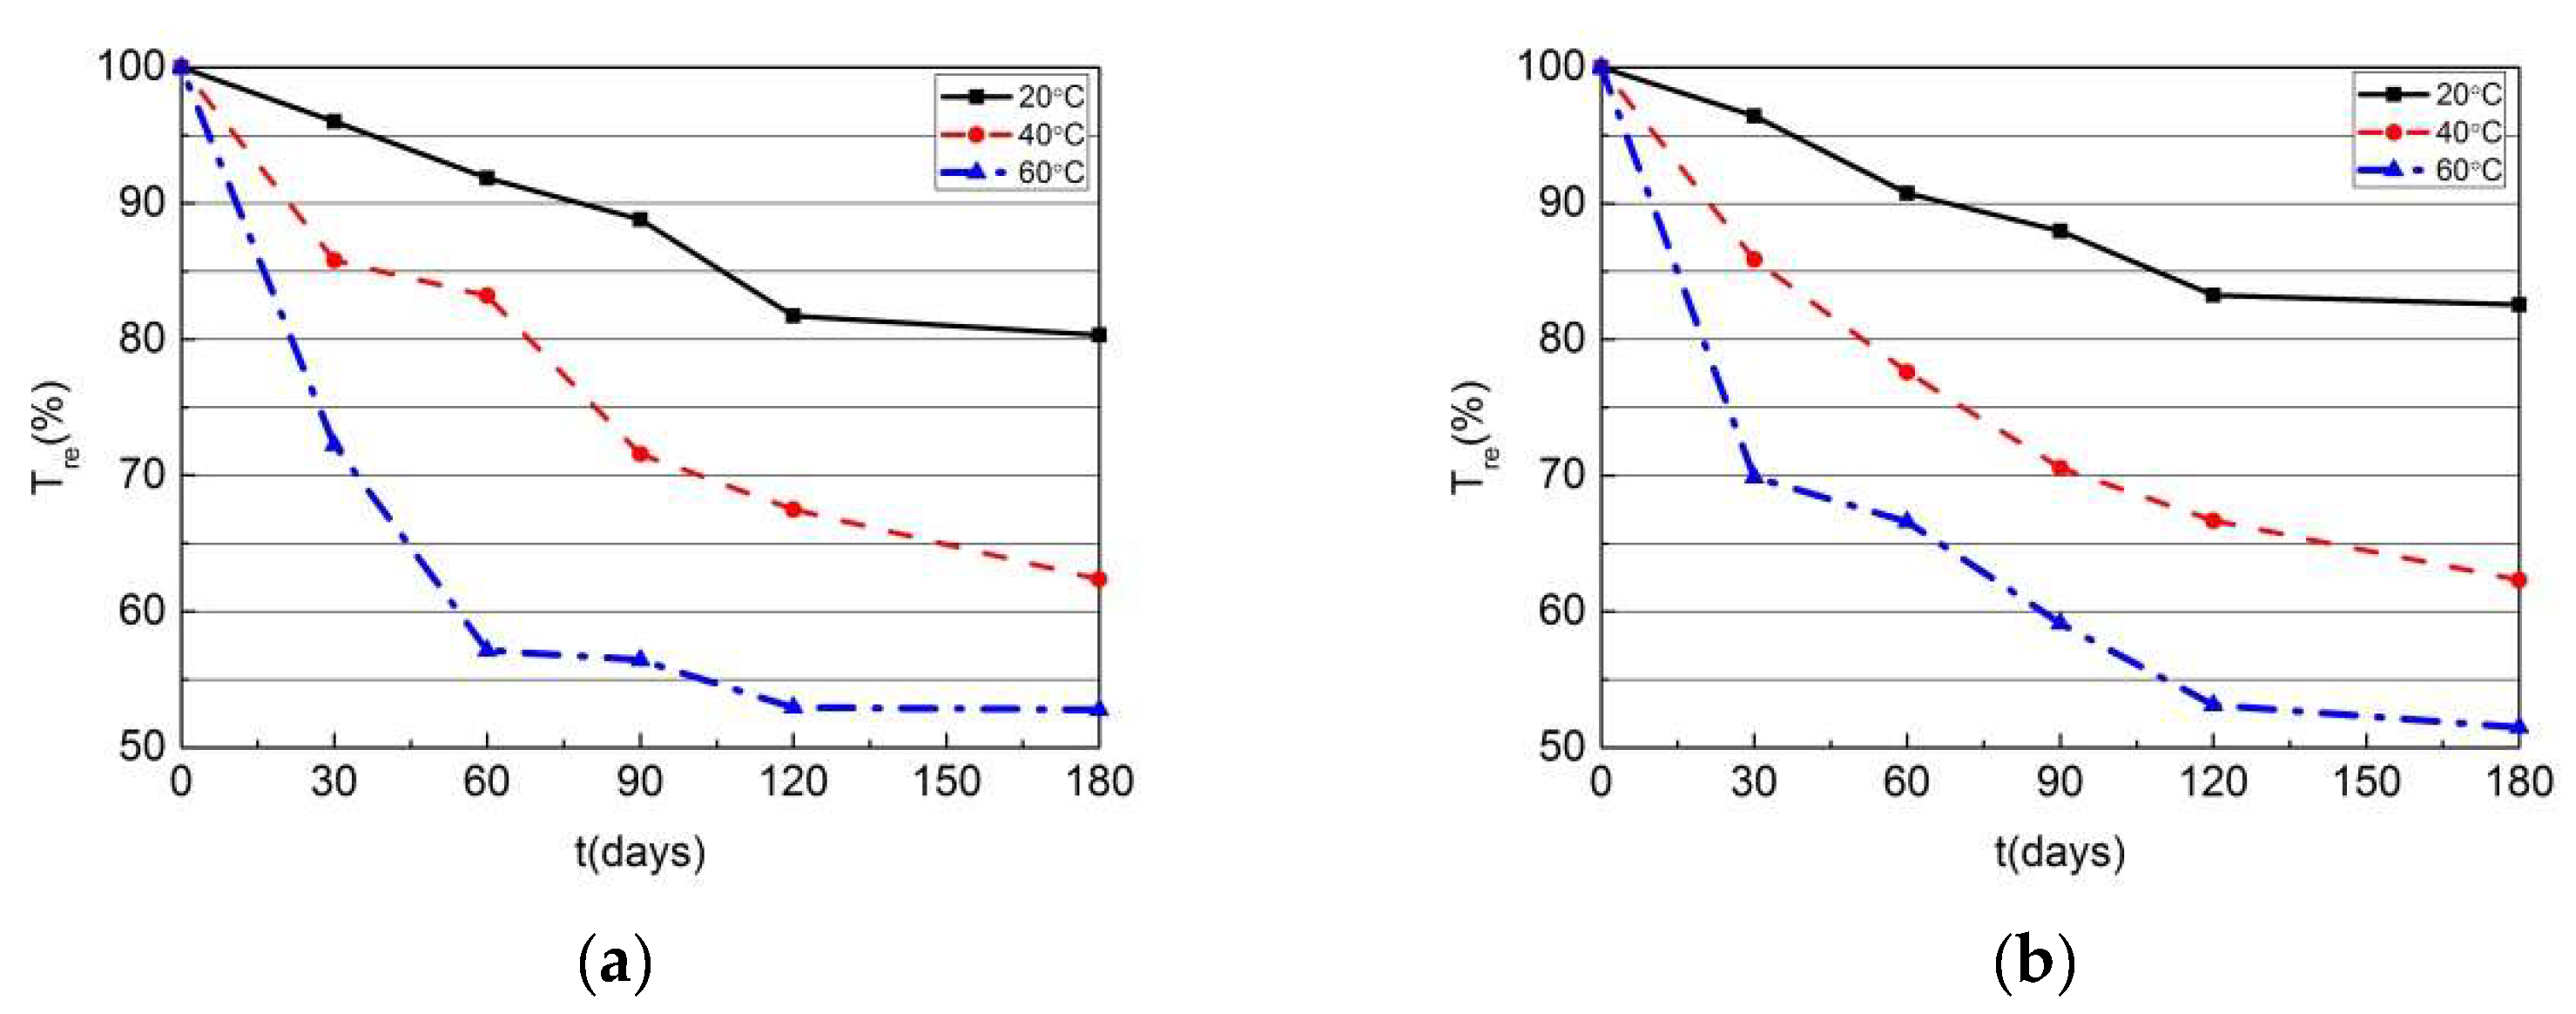
Buildings 13 01035 g006
Figure 7. Tensile strength retention of GFRP bars after accelerated aging at different temperatures: (a) G1; (b) G2.
Buildings 13 01035 g007
Figure 8. Tensile strength retention of two types of GFRP bars after accelerated aging at different ages: (a) 20 °C; (b) 40 °C; (c) 60 °C.
Buildings 13 01035 g008
Figure 9. Microstructure of unconditioned G1: (a) 100× G1; (b) 400× G1.
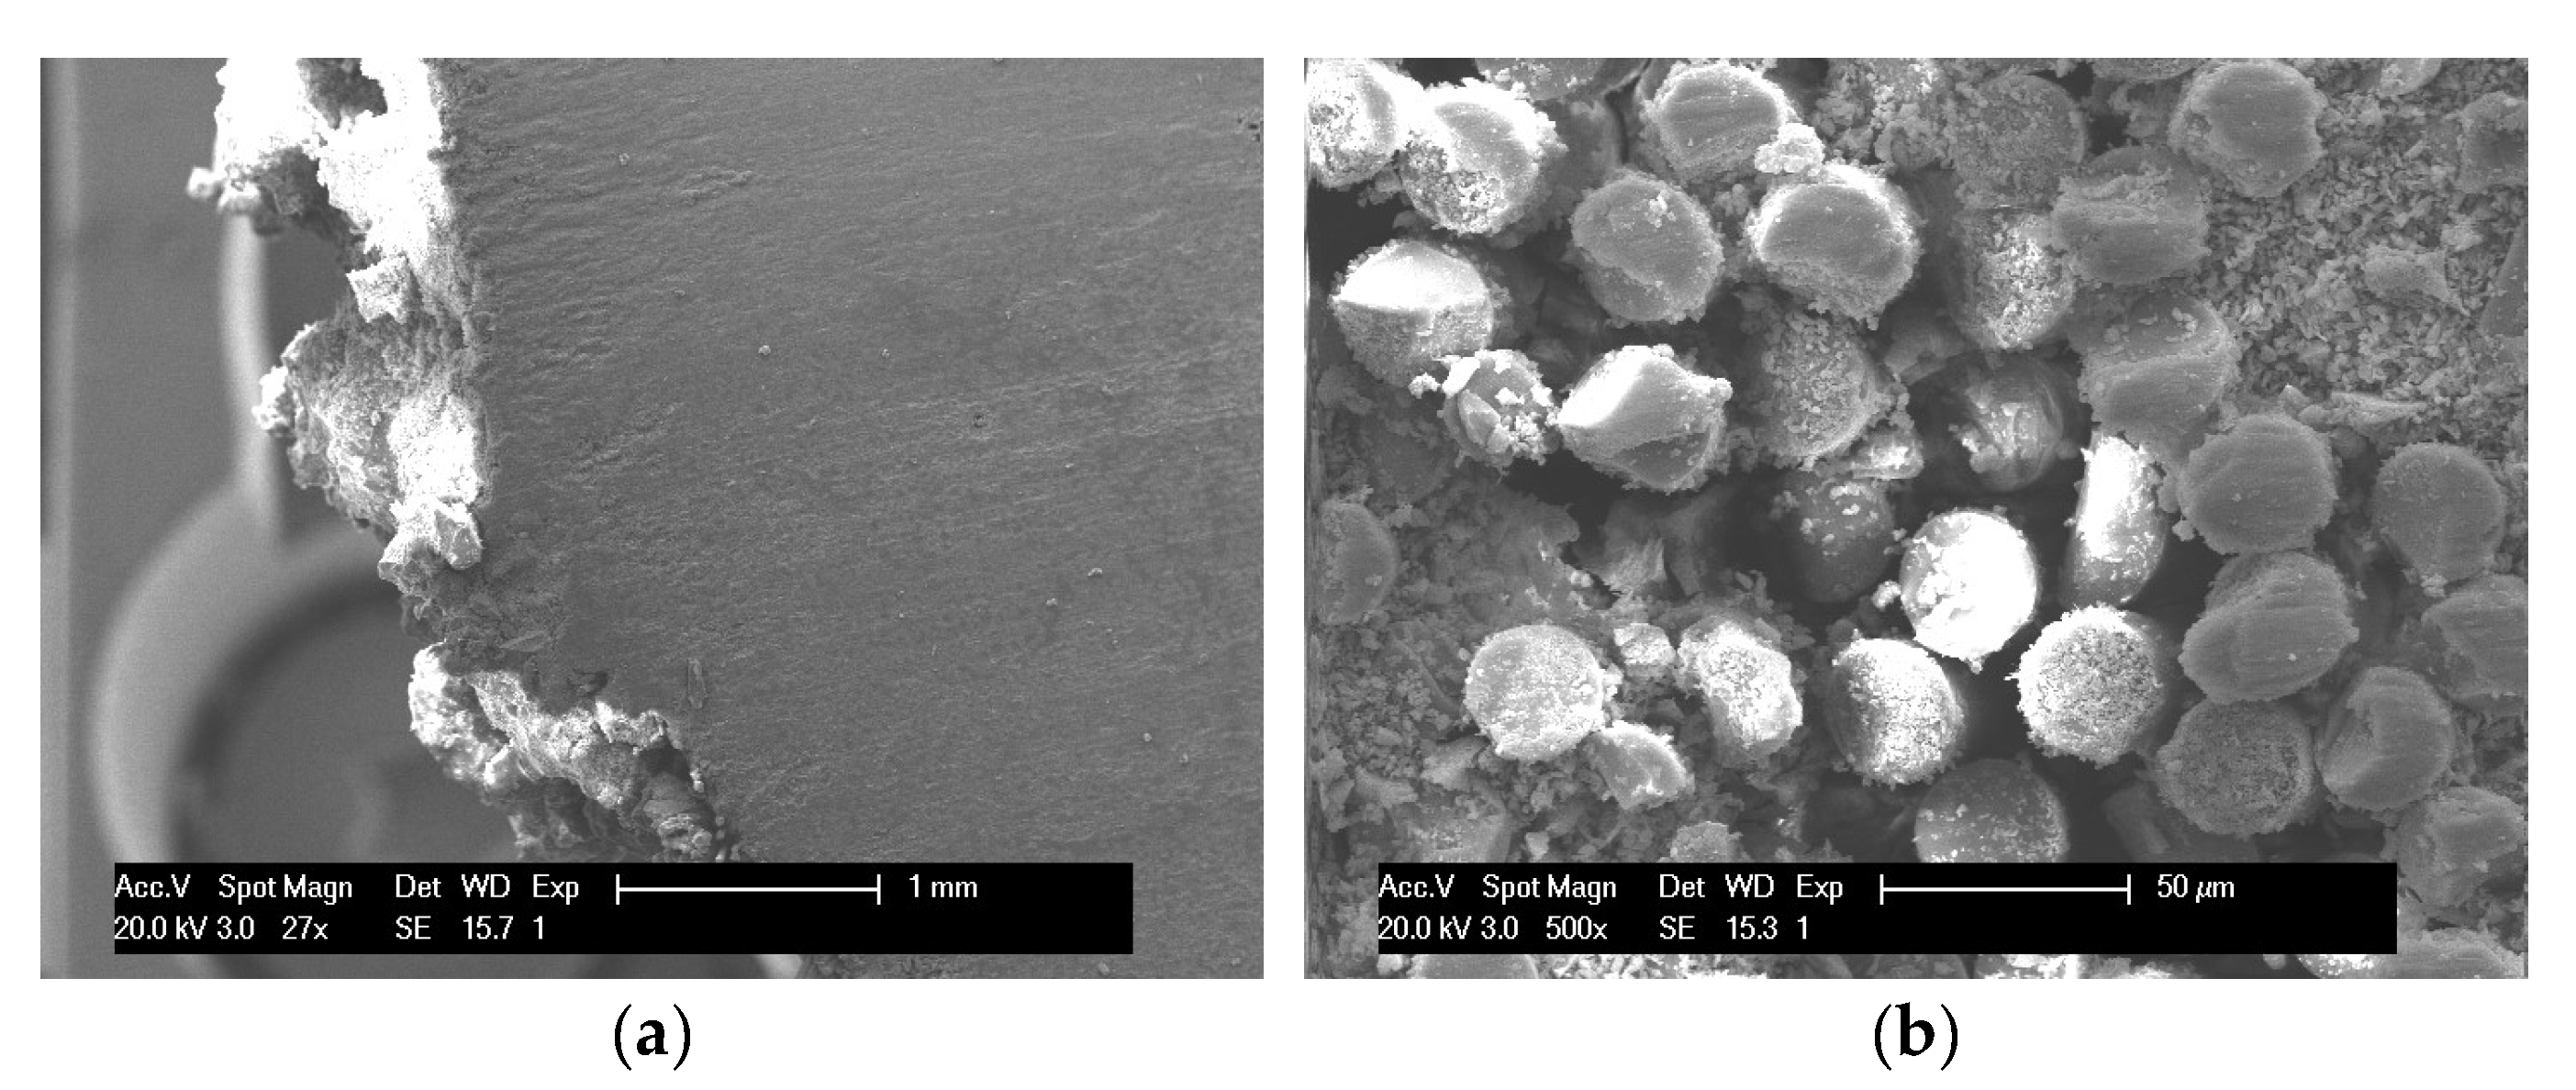
Buildings 13 01035 g009
Figure 10. Microstructure of unconditioned G2: (a) 27× G2; (b) 500× G2.
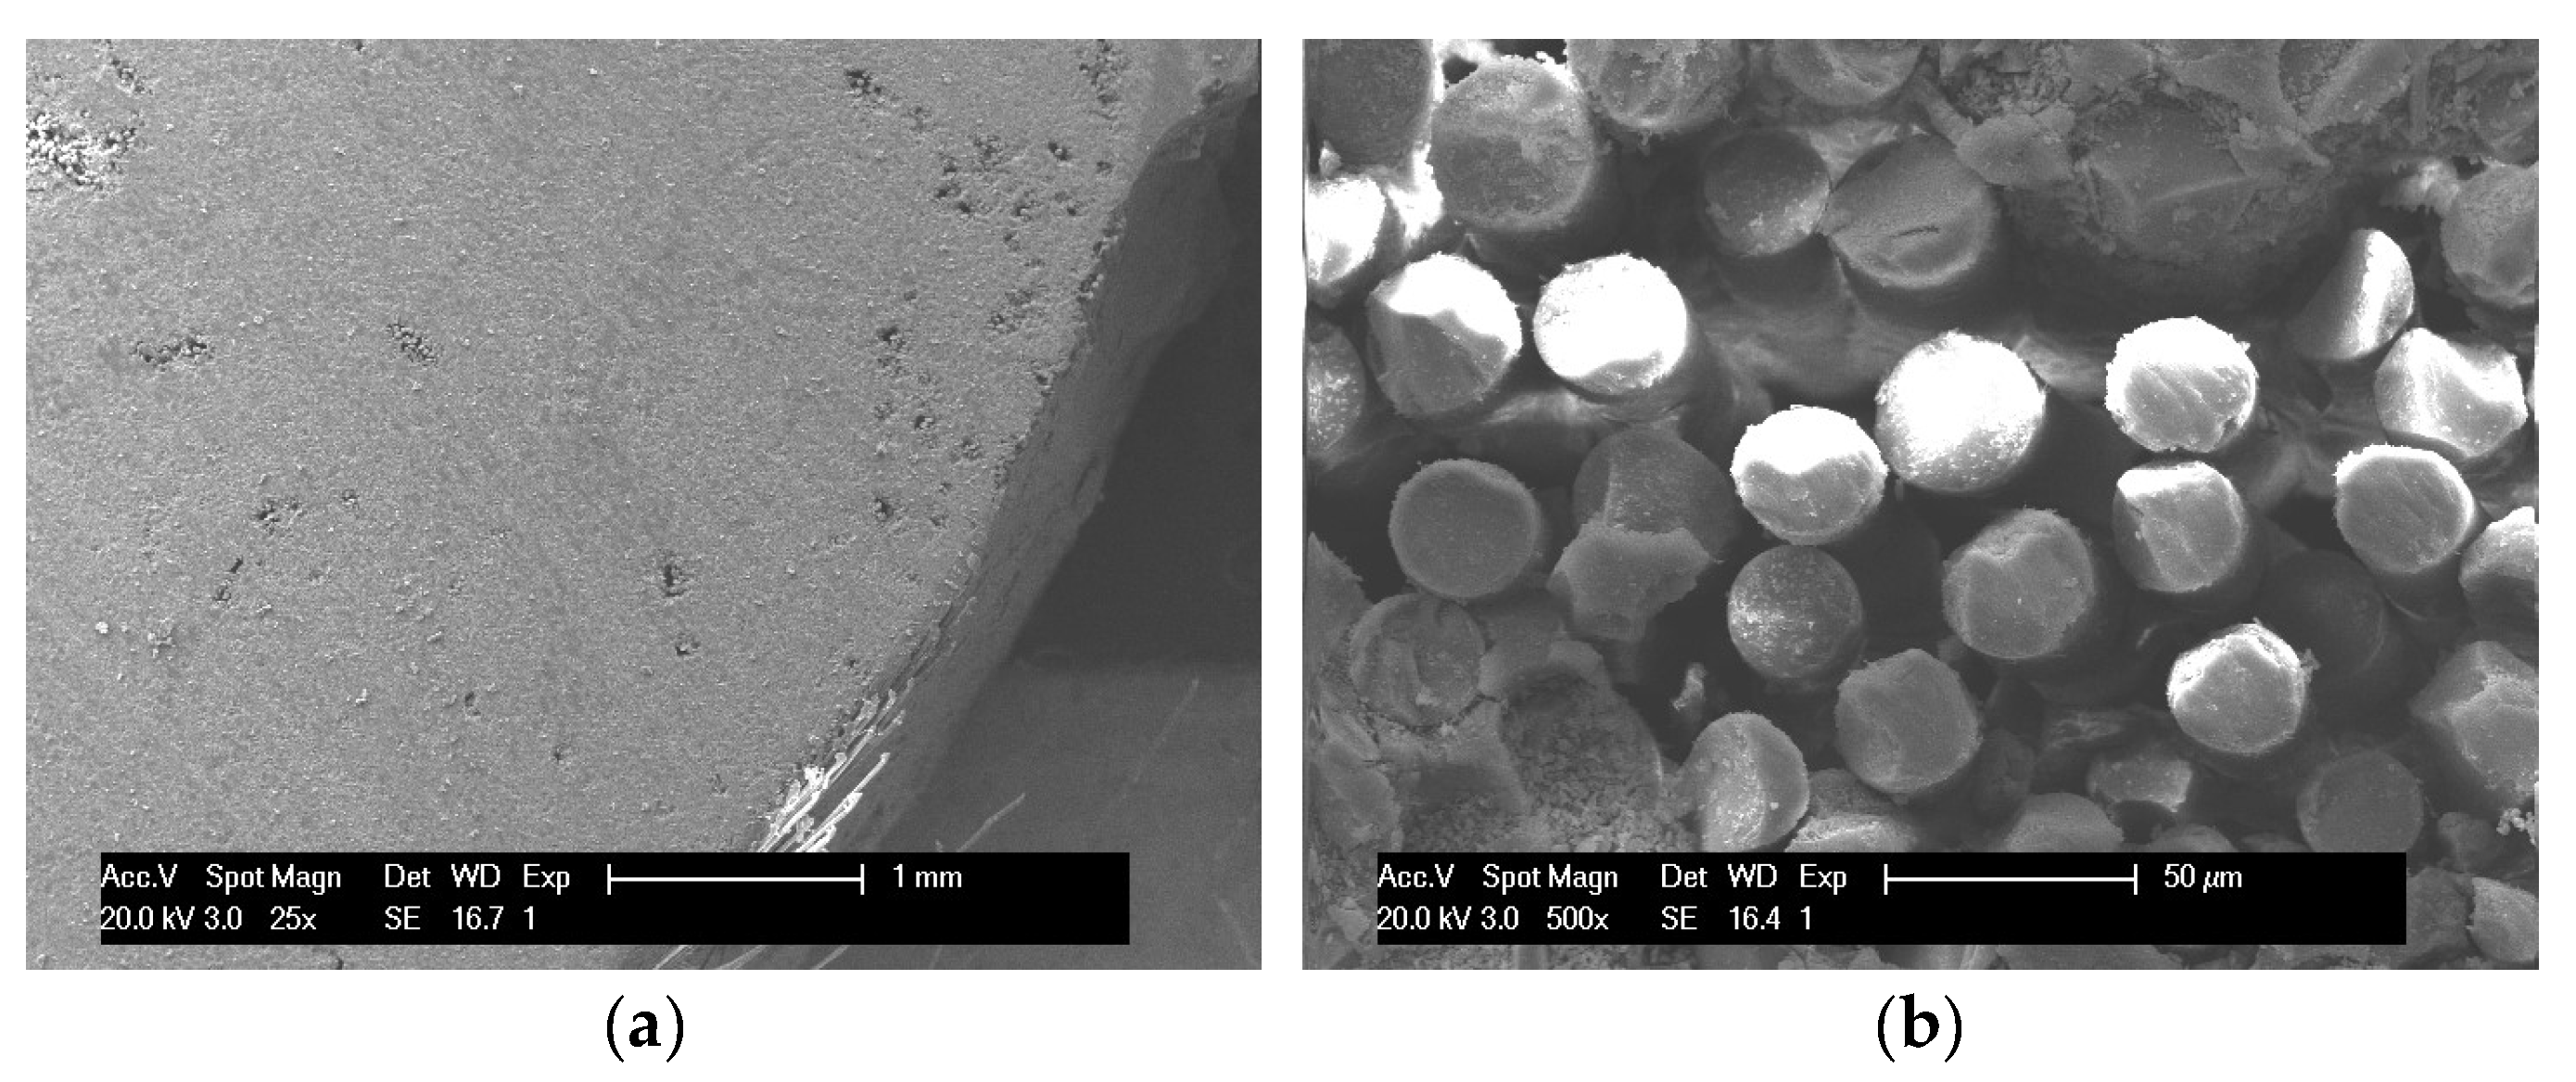
Buildings 13 01035 g010
Figure 11. Microstructure of G1 after accelerated aging at 20 °C for 180 days: (a) 100× G1; (b) 500× G1.
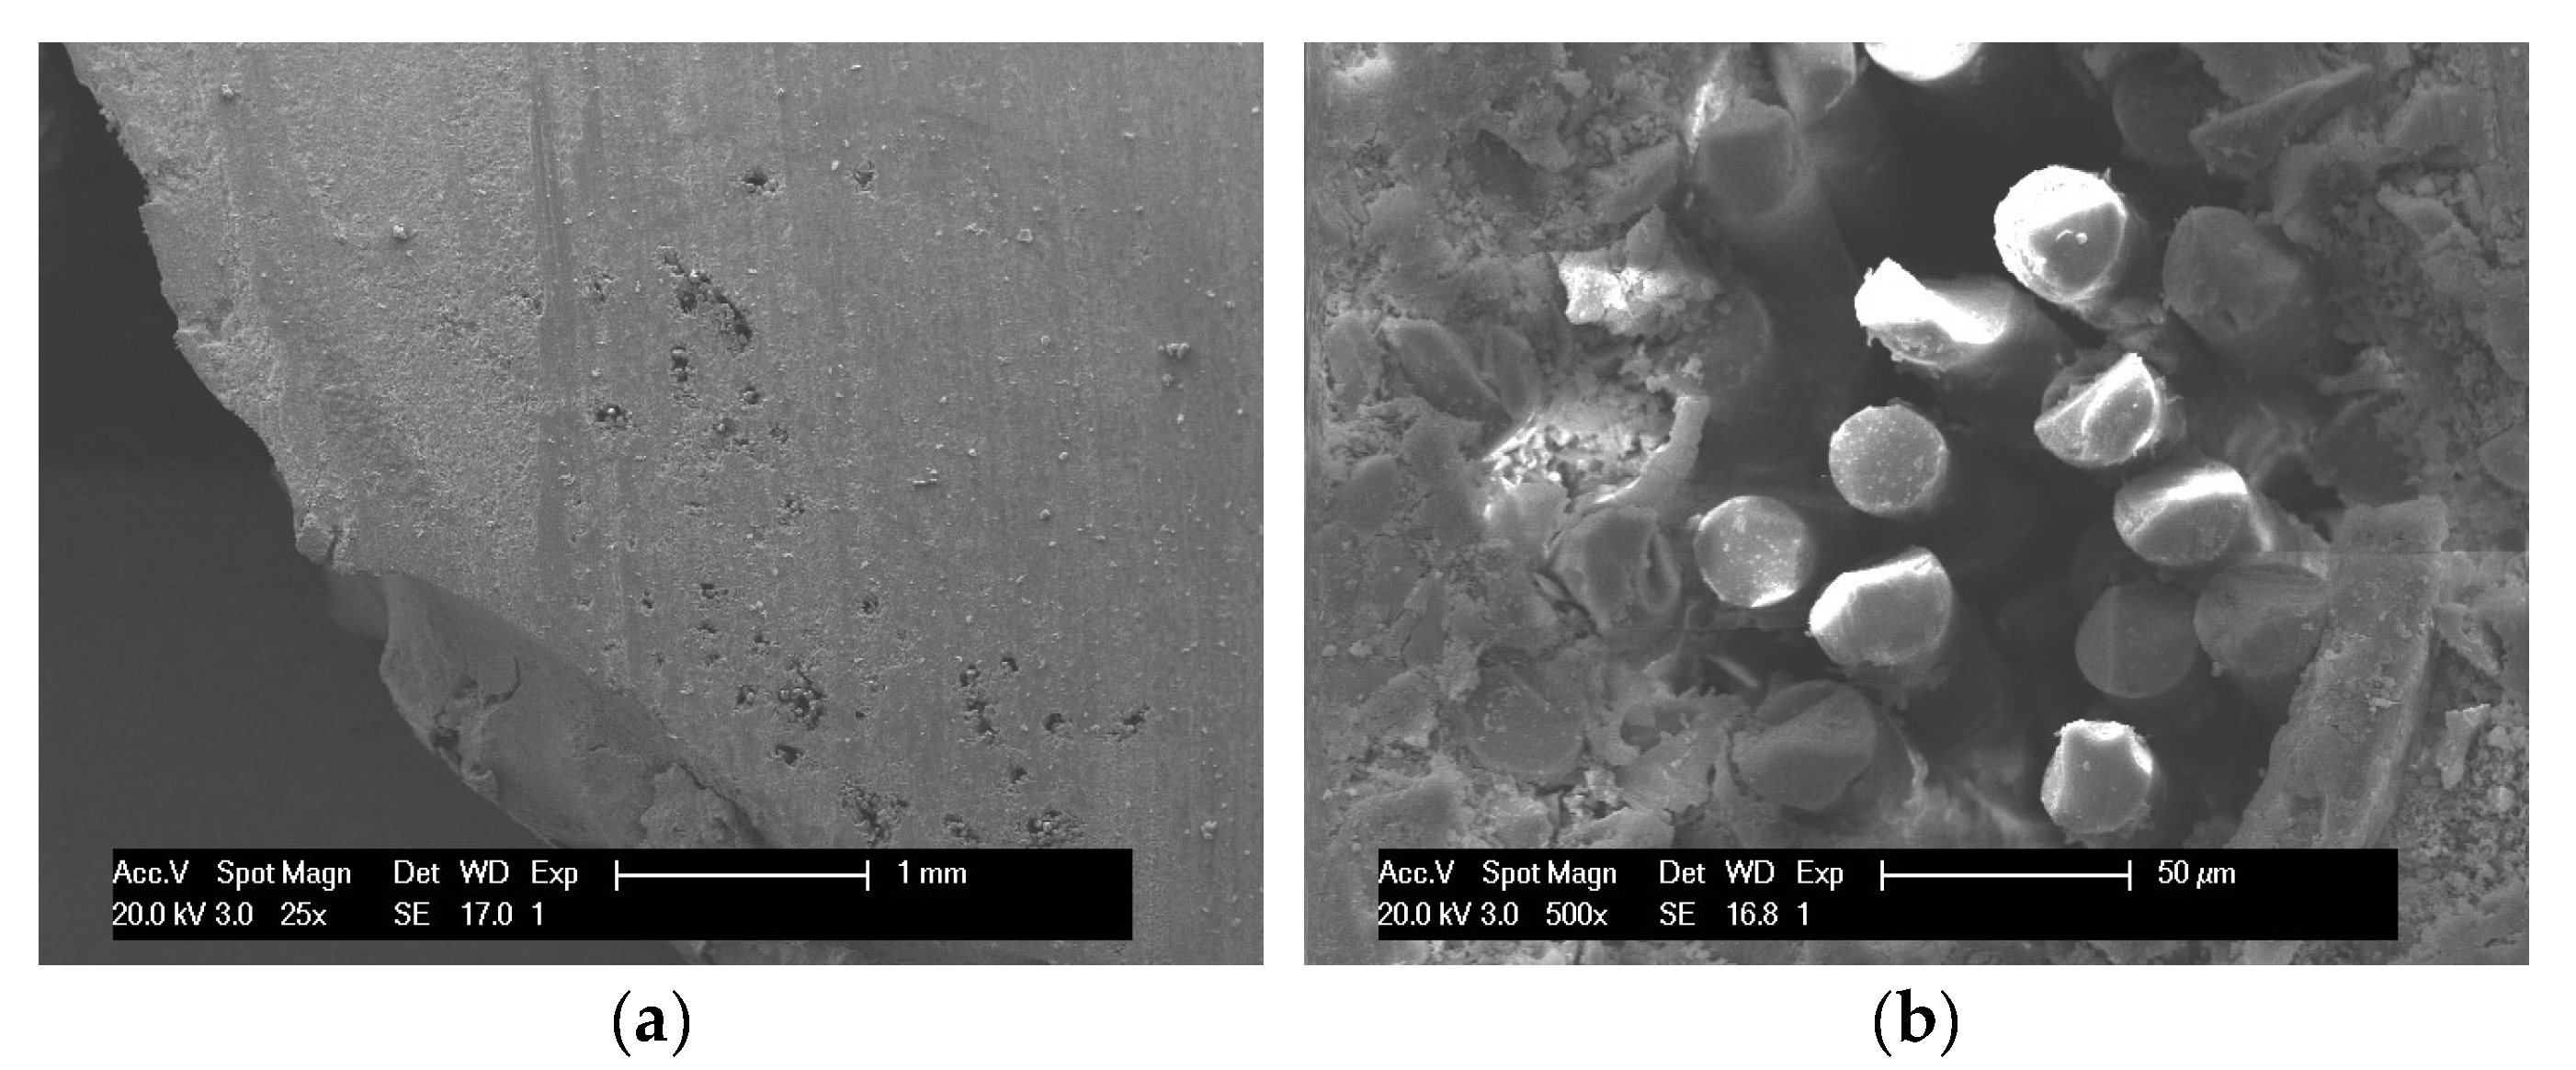
Buildings 13 01035 g011
Figure 12. The microstructure of G1 after accelerated aging at 60 °C for 180 days: (a) 29× G1; (b) 500× G1.
Buildings 13 01035 g012
Figure 13. The microstructure of G2 after accelerated aging at 20 °C for 180 days: (a) 25× G2; (b) 500× G2.
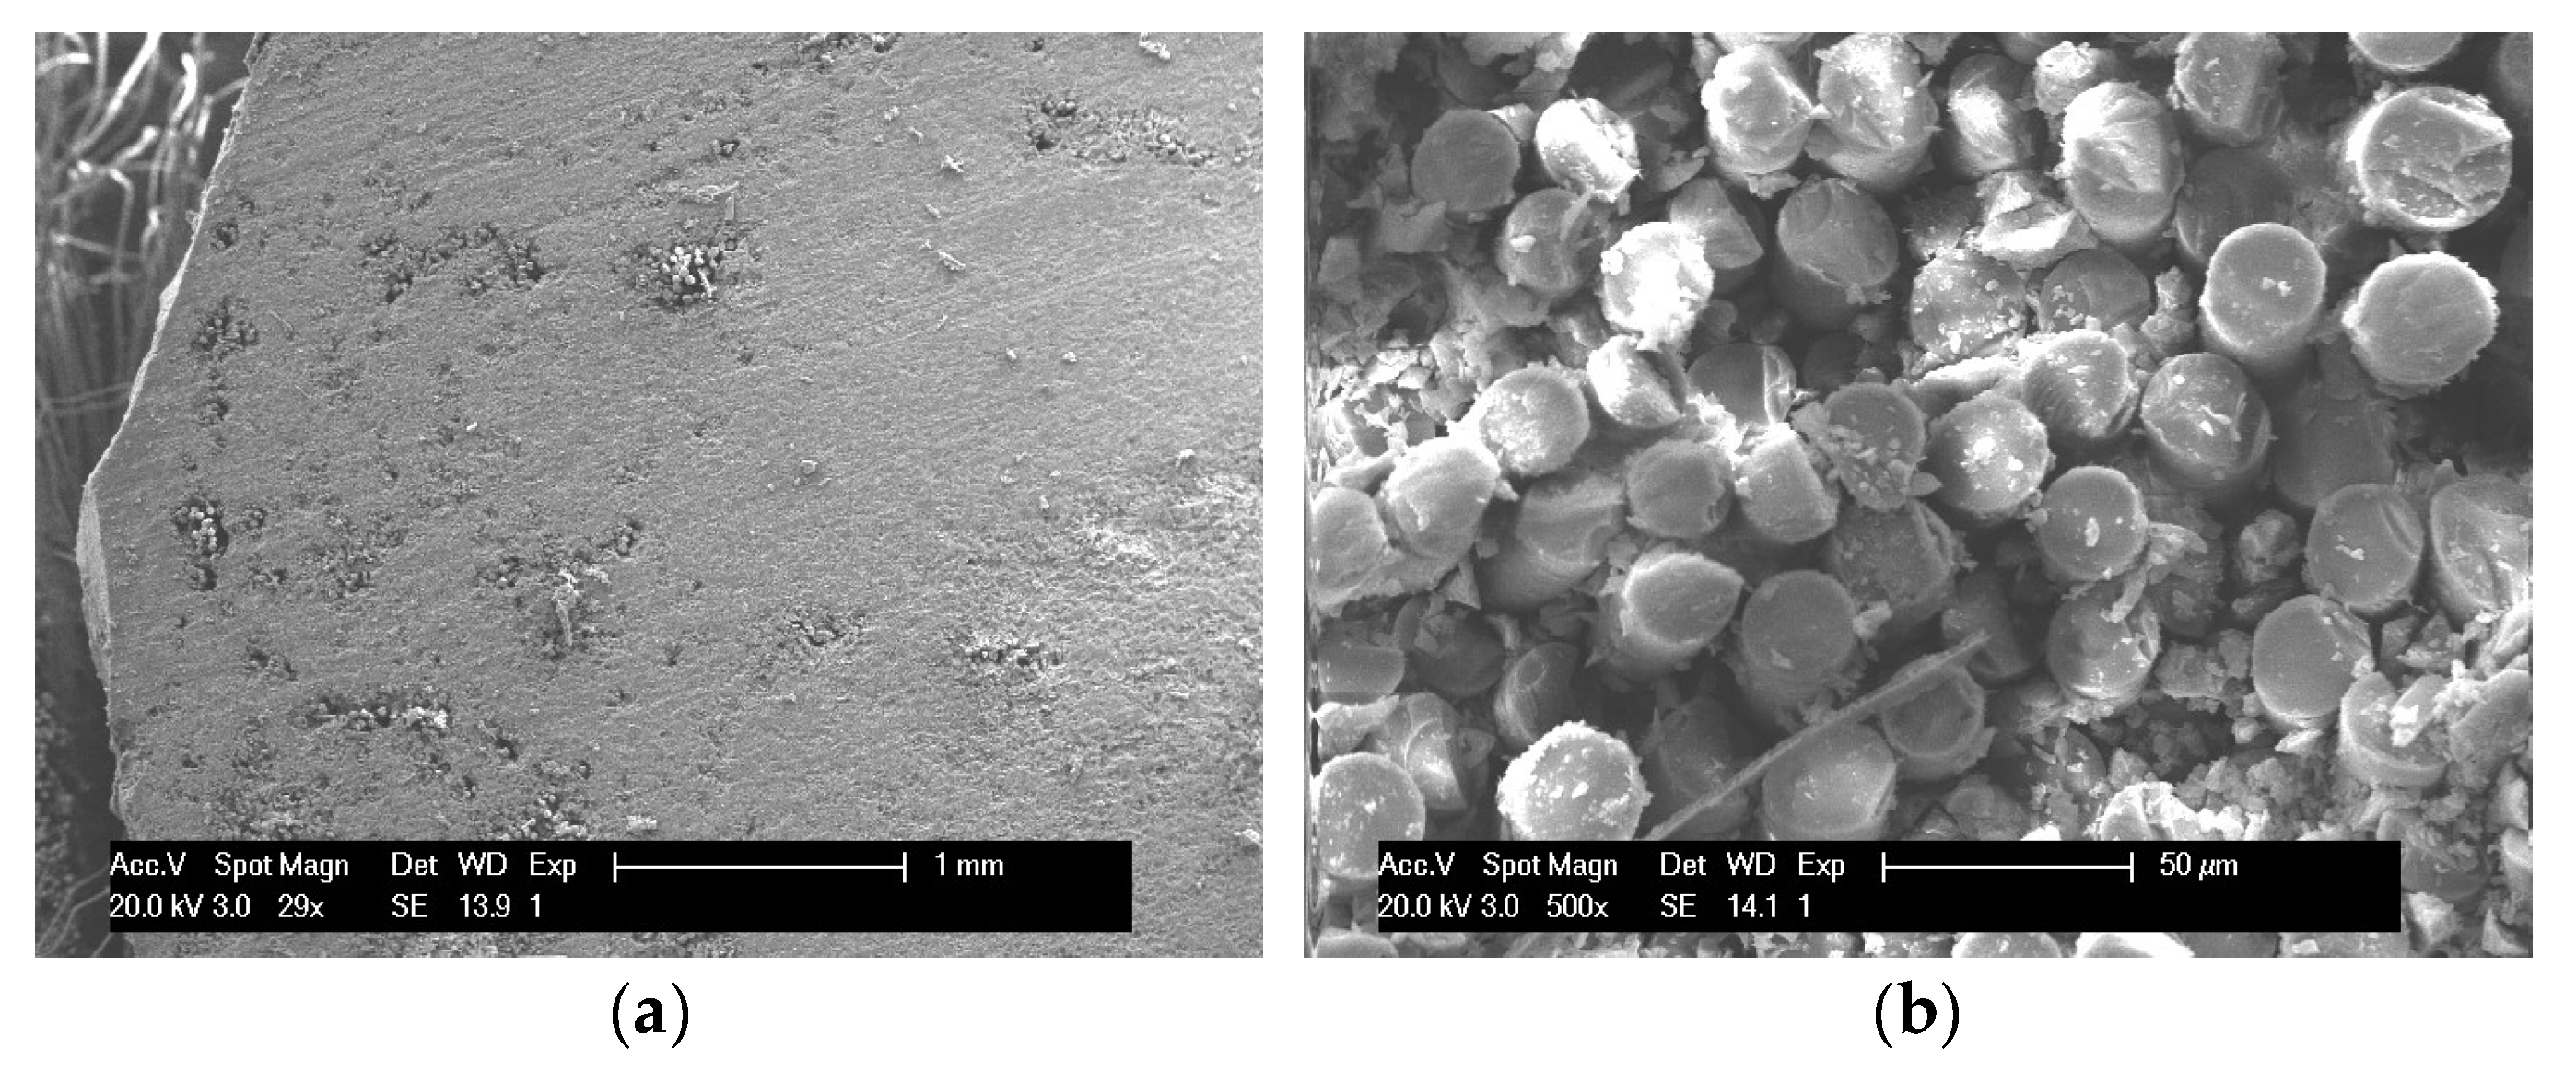
Buildings 13 01035 g013
Figure 14. The microstructure of G2 after accelerated aging at 60 °C for 180 days: (a) 25× G2; (b) 500× G2.
Buildings 13 01035 g014
Figure 15. Elemental composition of fibers of G1: (a) Before conditioning; (b) After accelerated aging at 60 °C for 180 days. (Notes: The peak on the right of Si was Au. GFRP itself does not contain gold elements, and this came from the gold coating for the sample preparation. This element is not listed in the figure.)
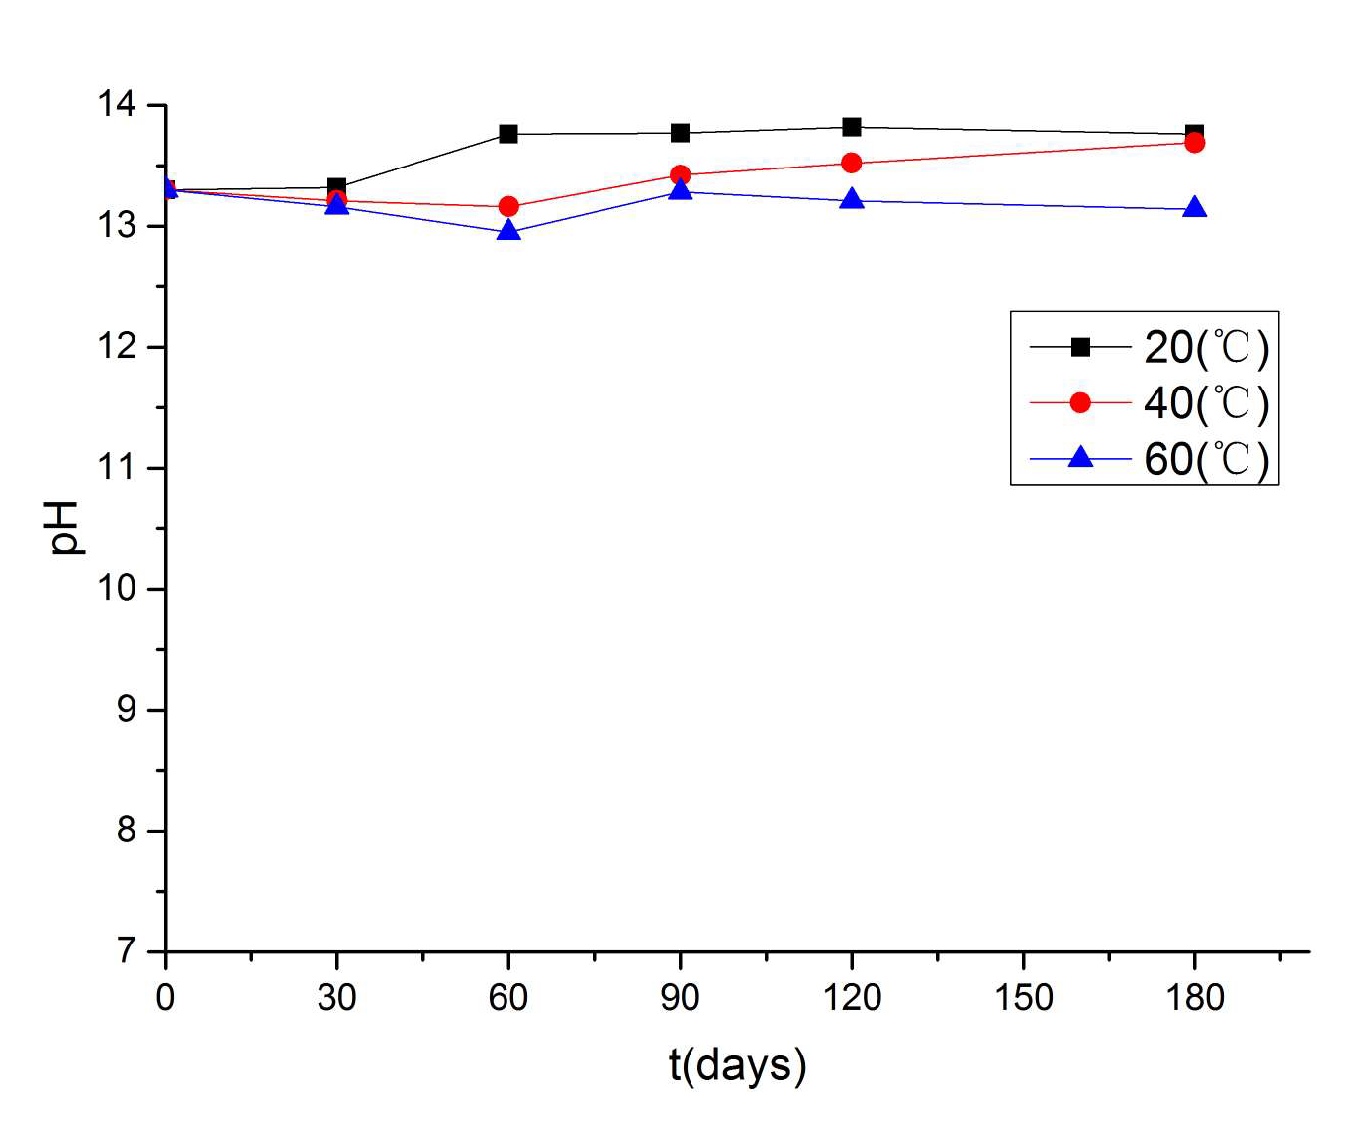
Buildings 13 01035 g015
Figure 16. pH value of concrete pore solution versus time.
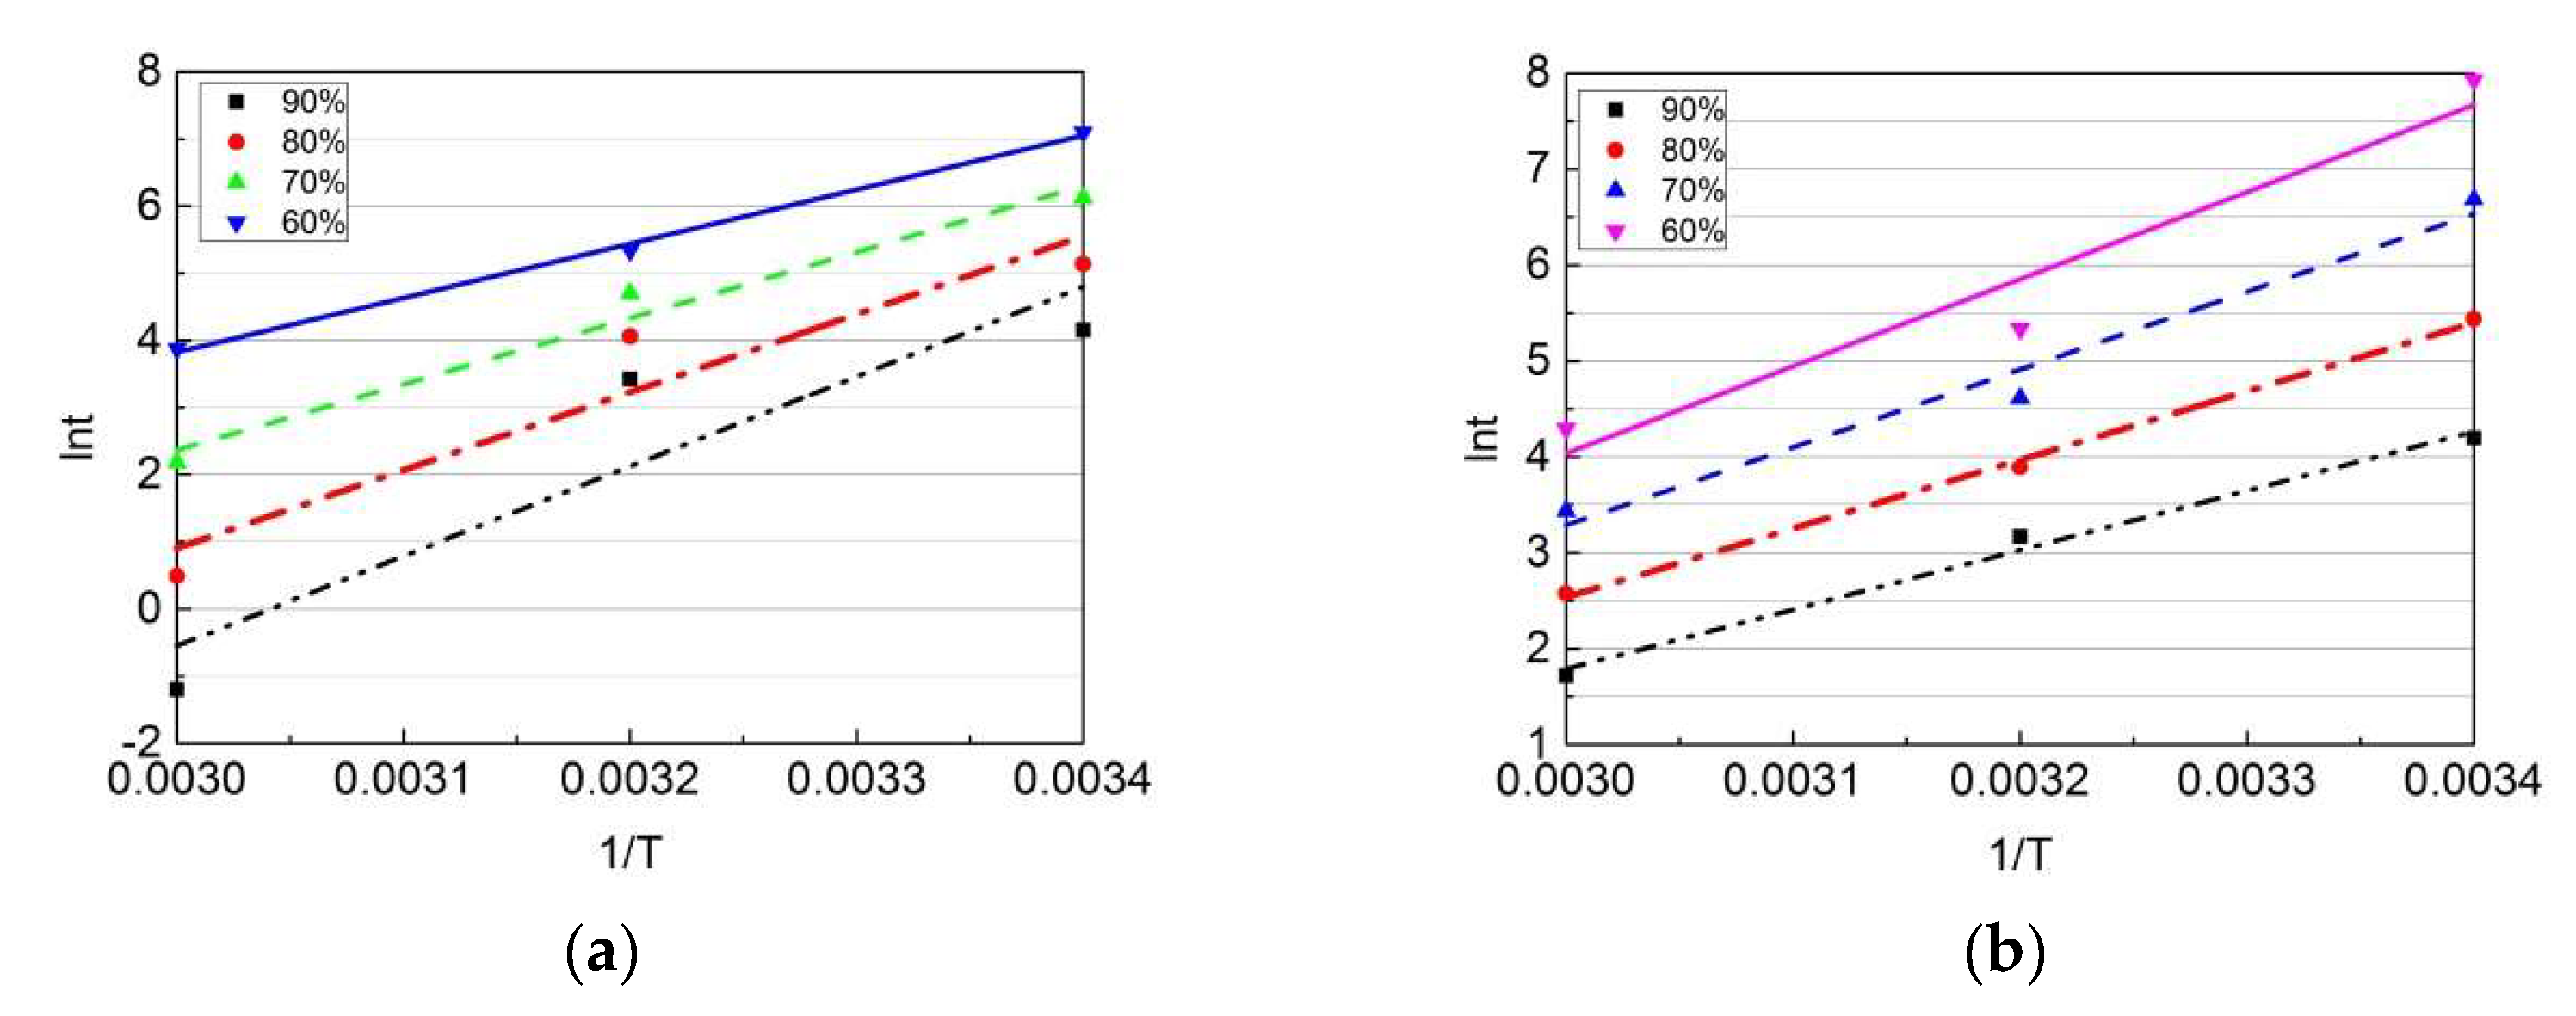
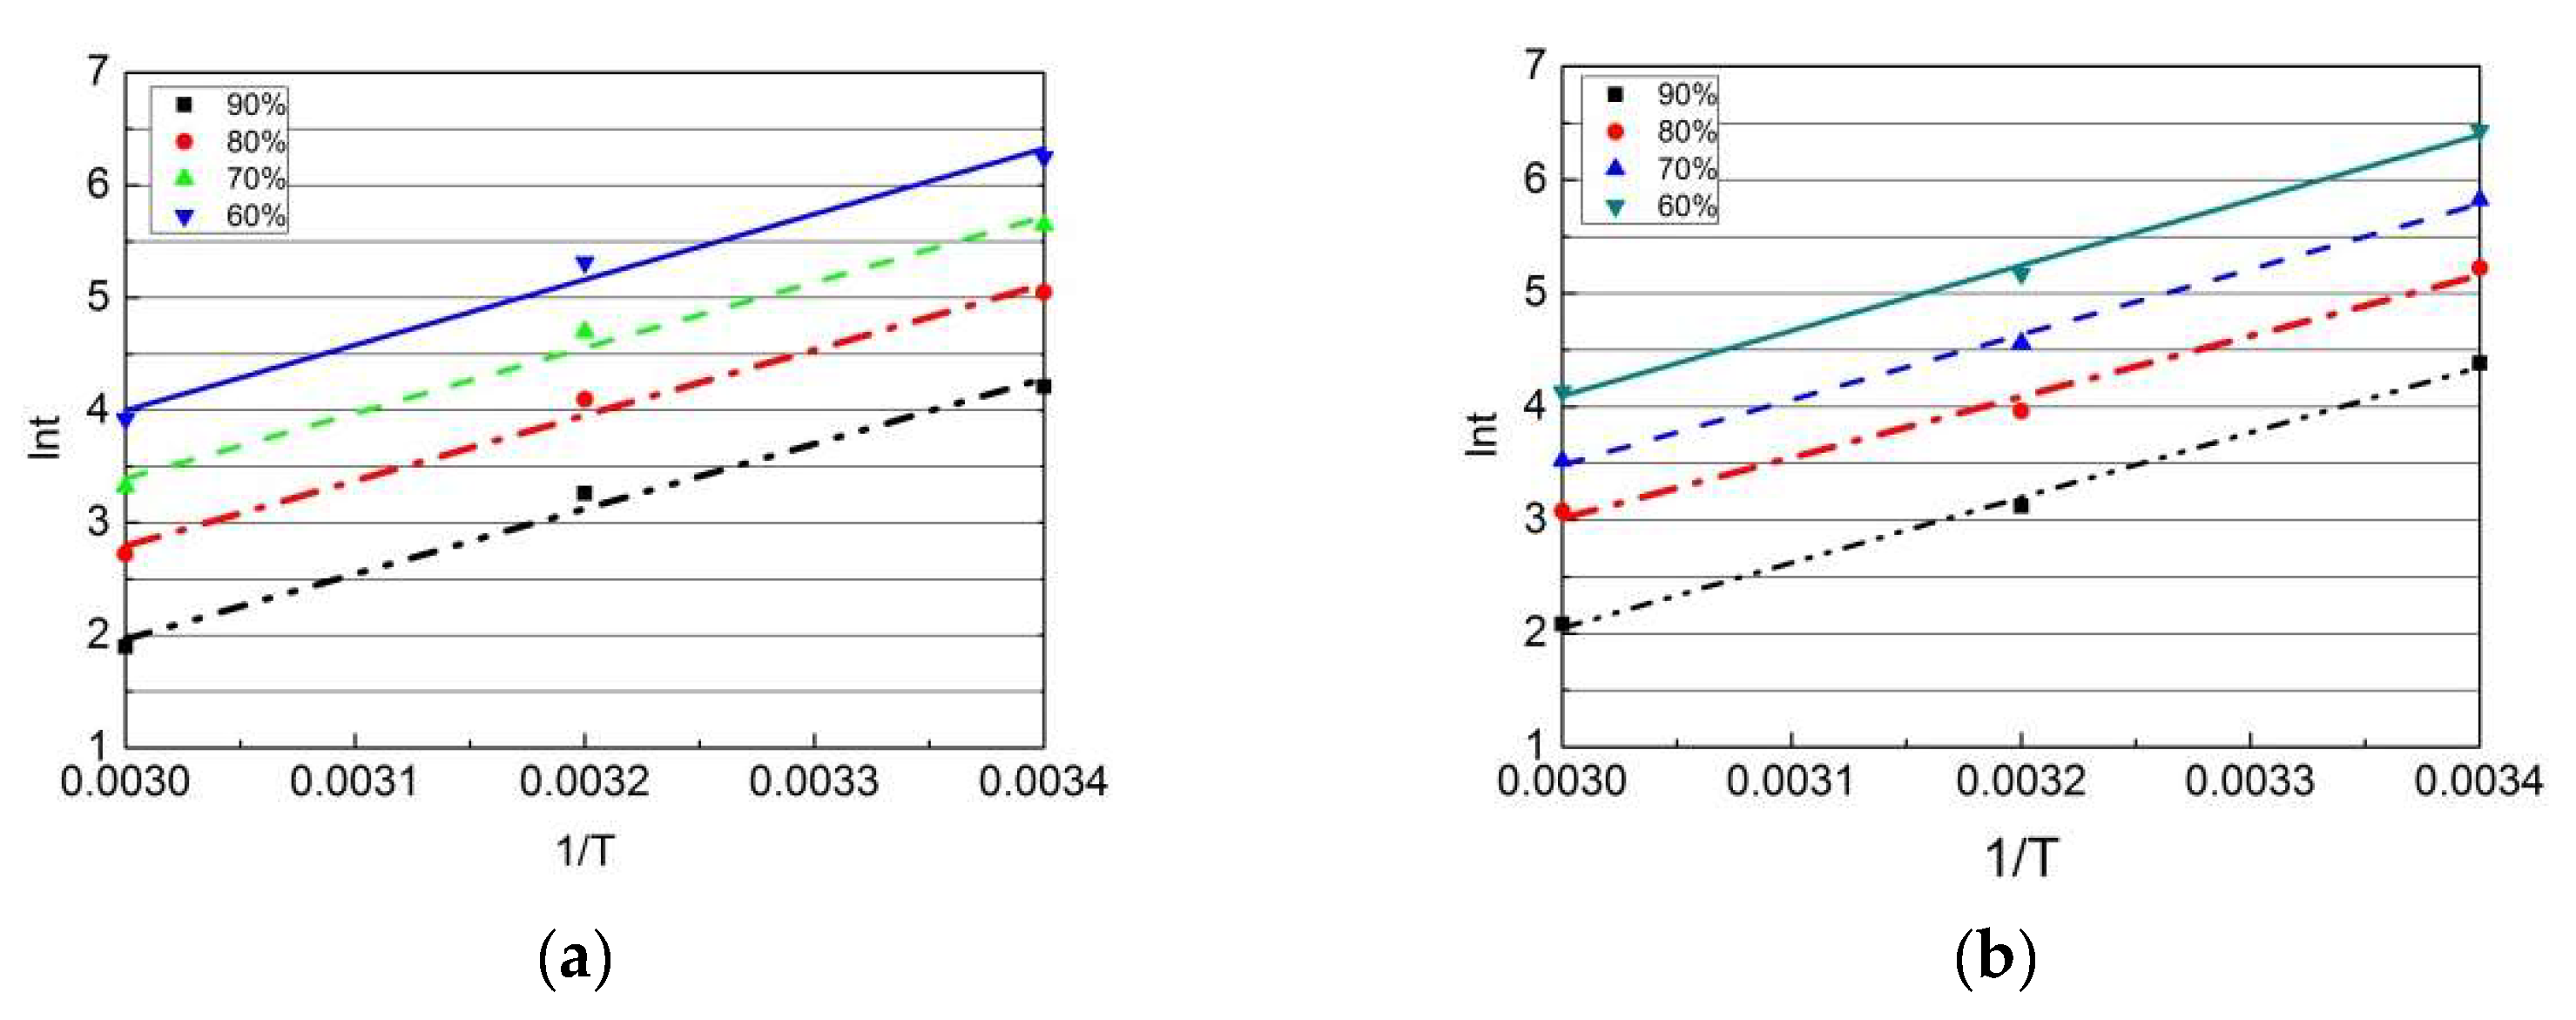
Buildings 13 01035 g016
Figure 17. Arrhenius graphs based on the first prediction model: (a) G1; (b) G2.
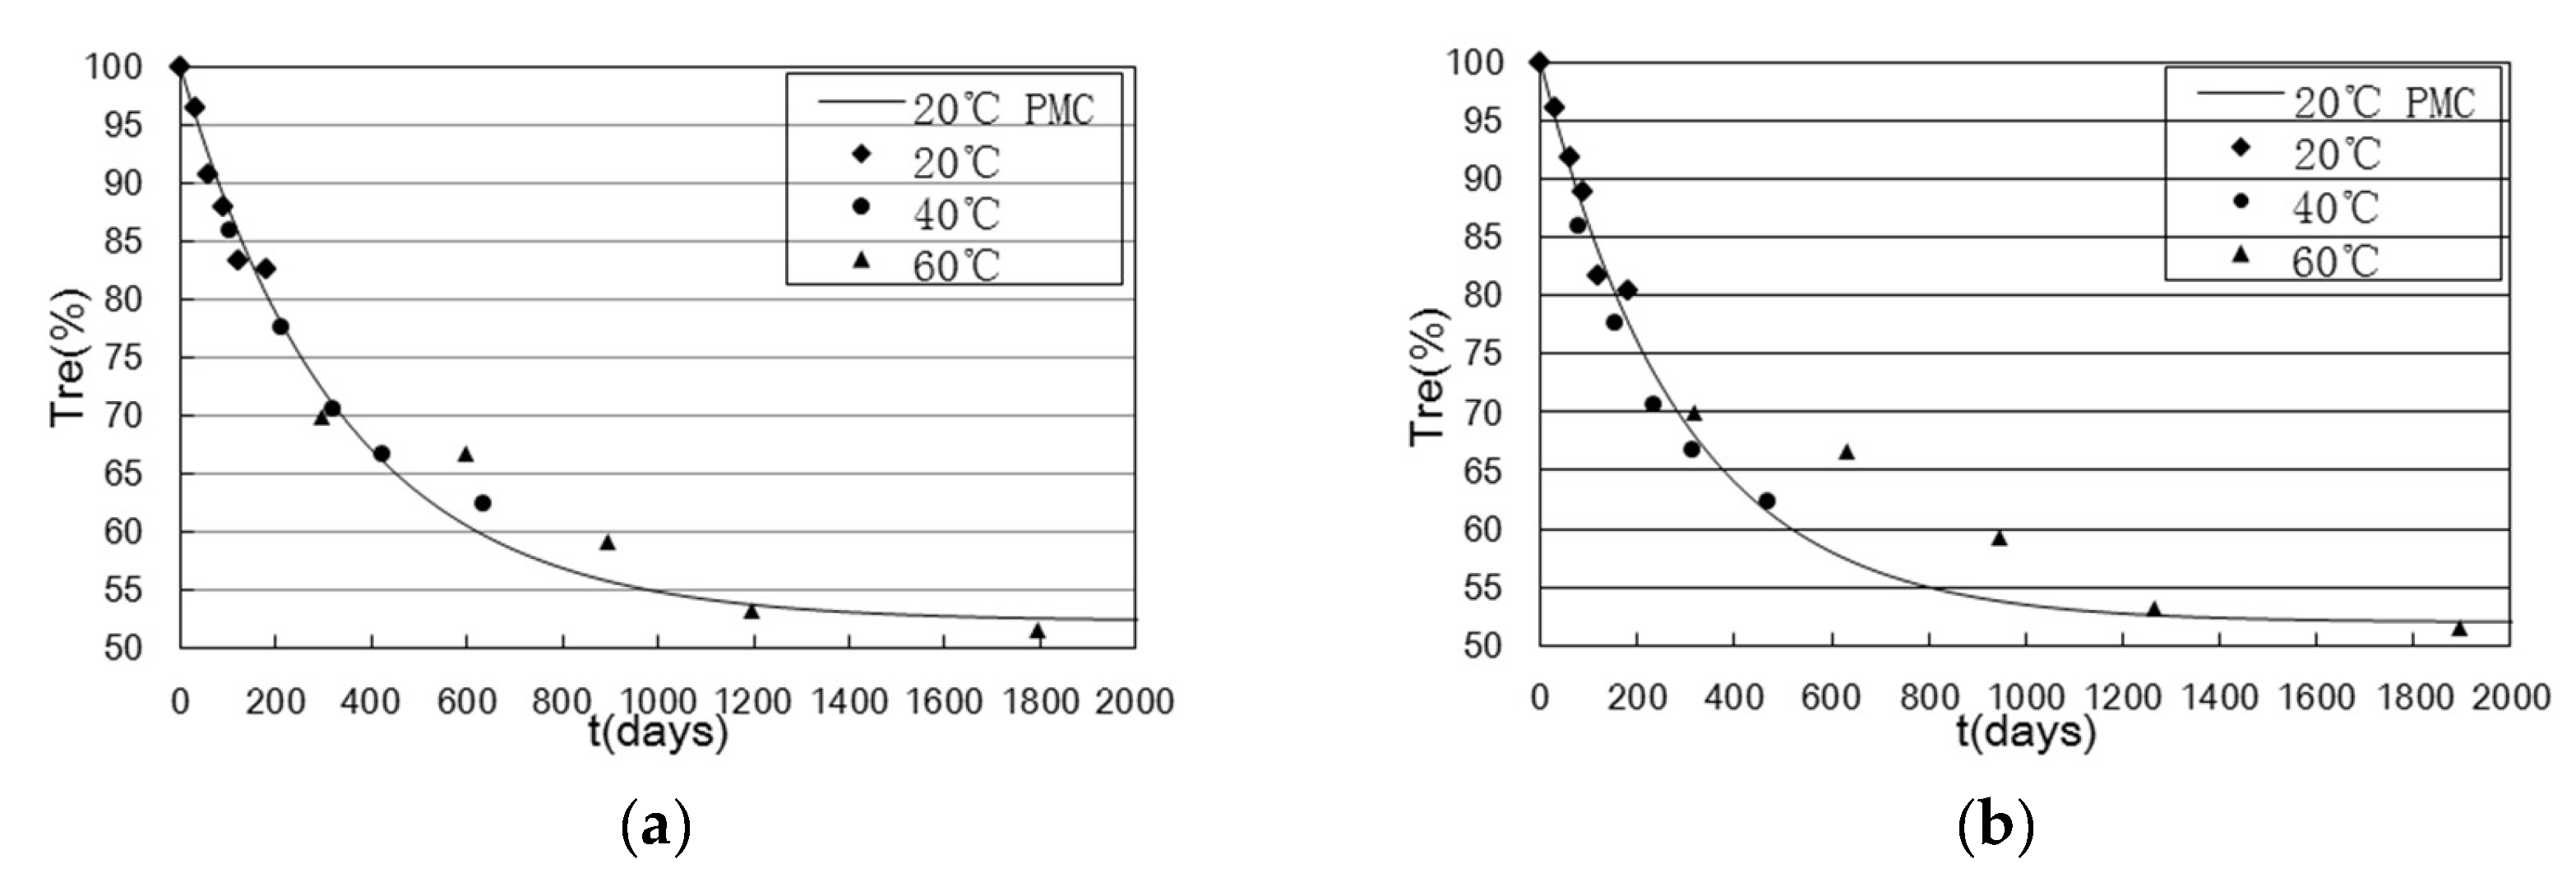
Buildings 13 01035 g017
Figure 18. T r e t fitting curves under different temperatures based on the second prediction model: (a) G2; (b) G2.
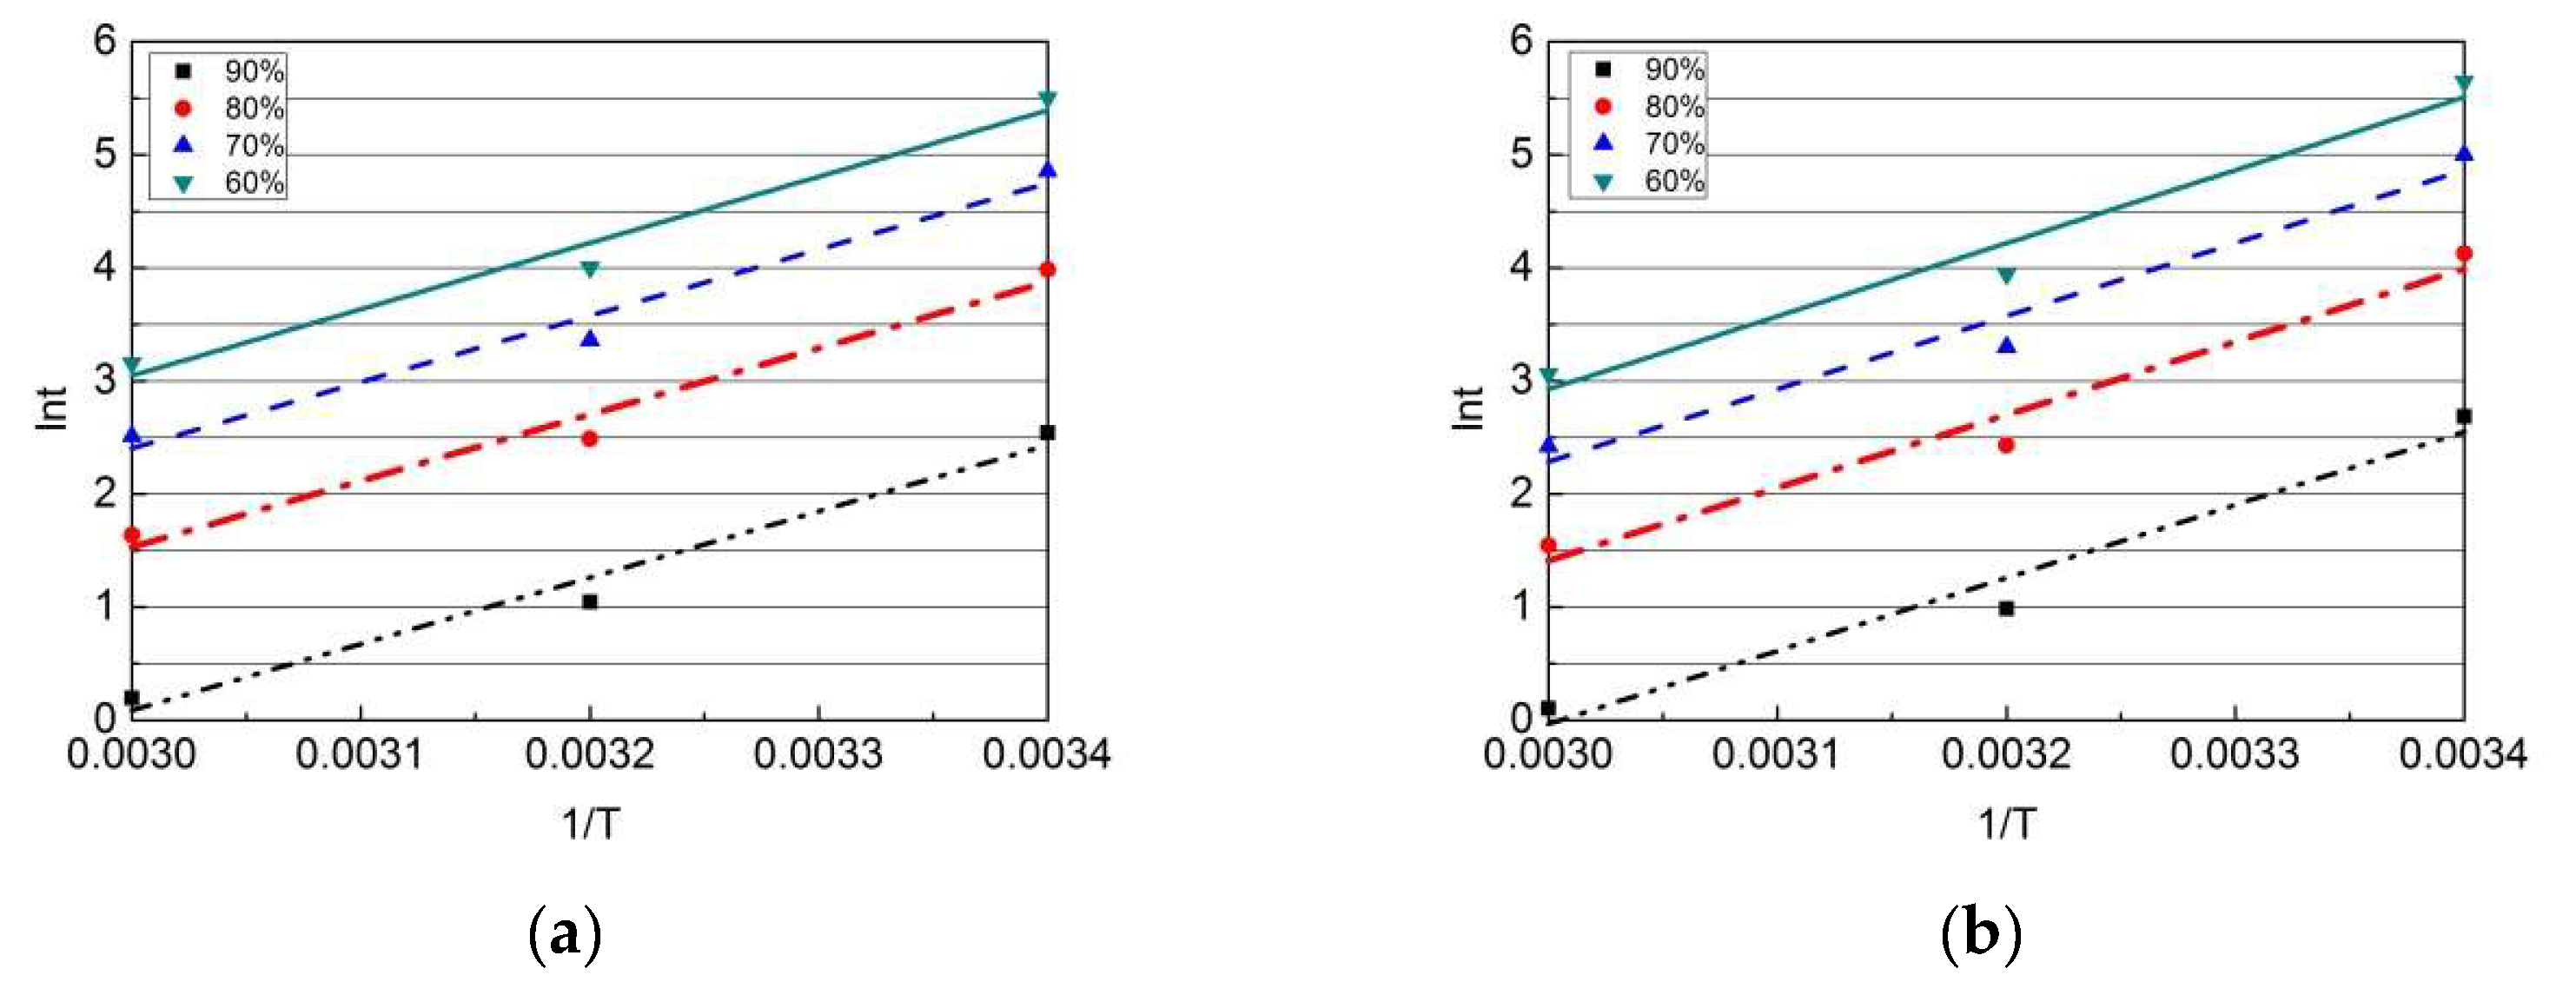
Buildings 13 01035 g018
Figure 19. Arrhenius graphs based on the second prediction model: (a) G1; (b) G2.
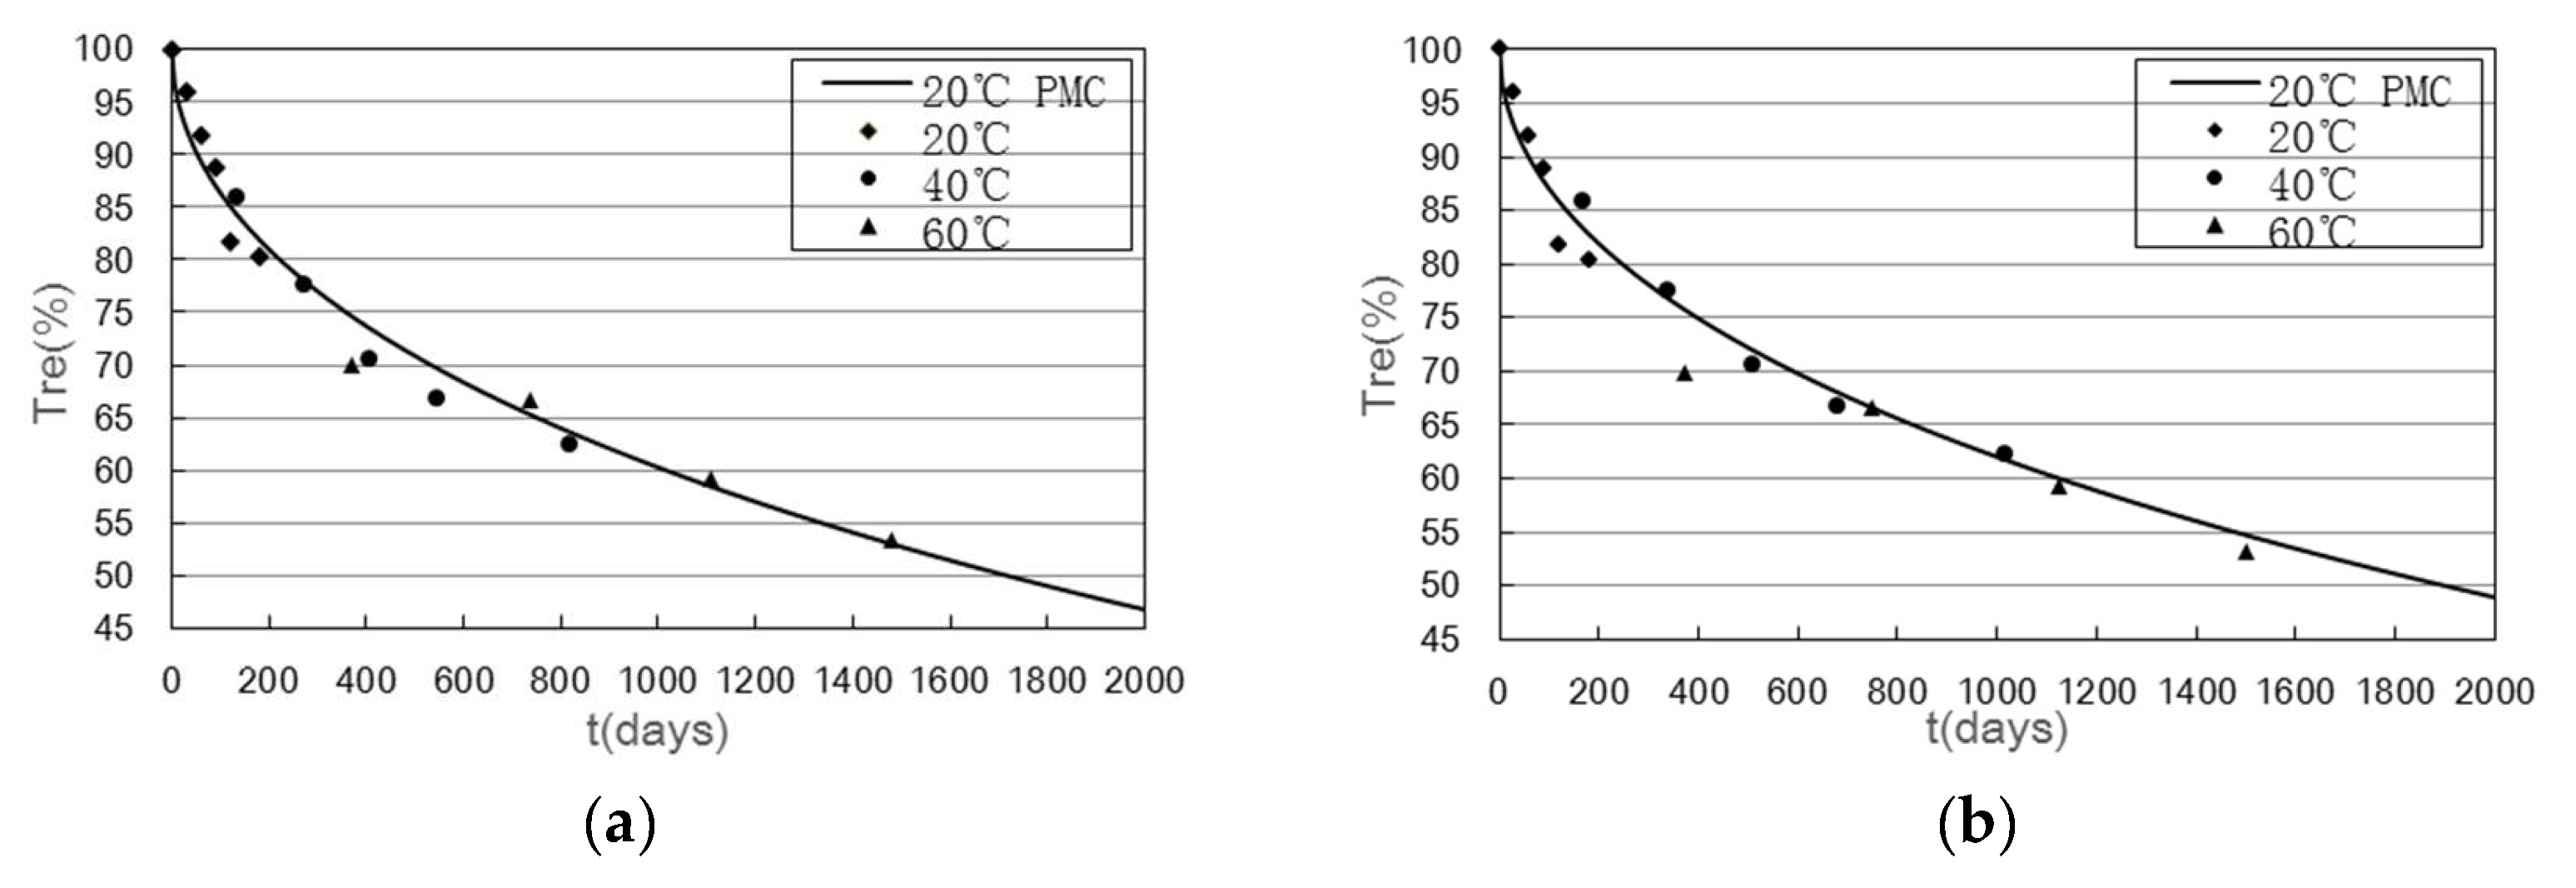
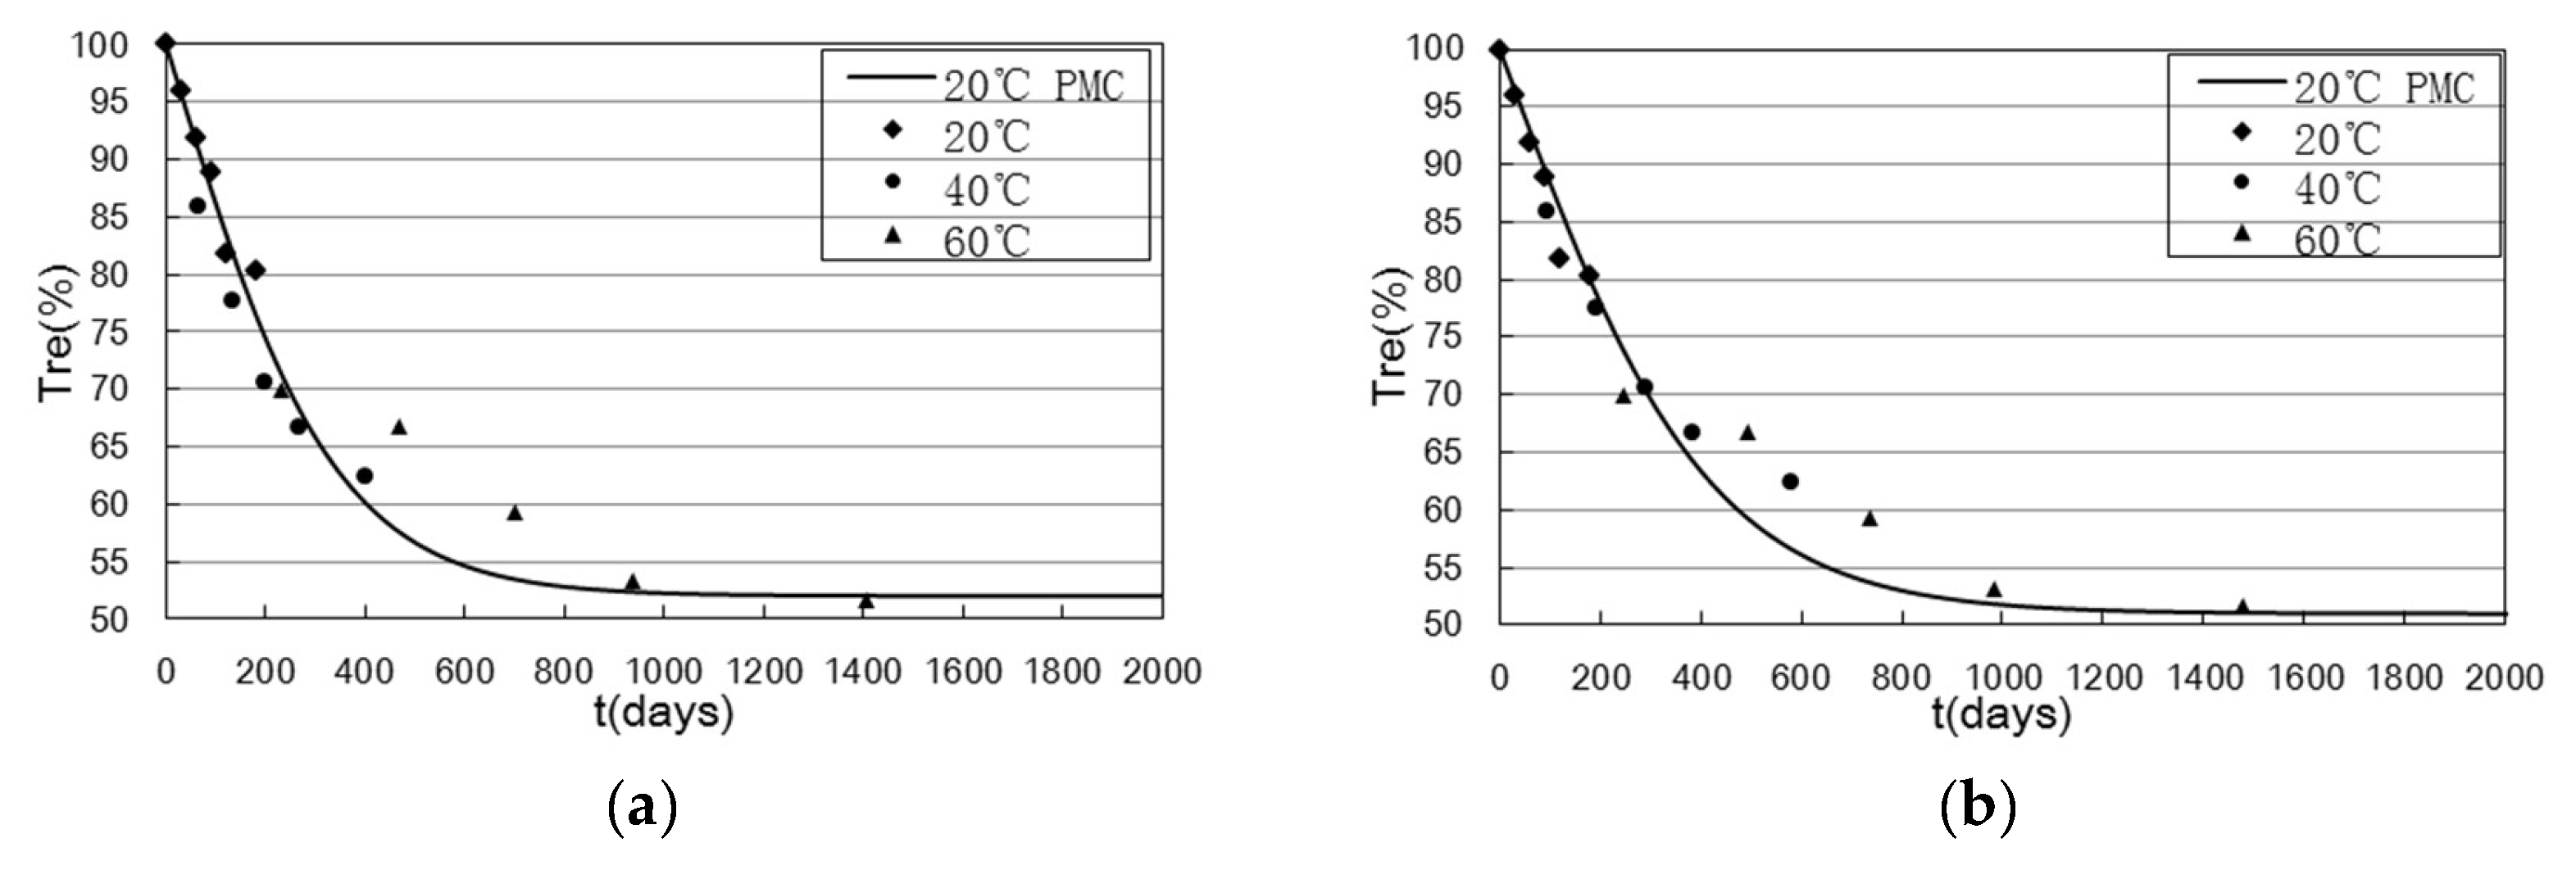
Buildings 13 01035 g019
Figure 20. Estimated data and test data at 20 °C with the curve for 20 °C by the second model: (a) G1; (b) G2.
Buildings 13 01035 g020
Figure 21. T r e t fitting curves based on the third model: (a) G1; (b) G2.
Buildings 13 01035 g021
Figure 22. Arrhenius graphs based on the third prediction model: (a) G1; (b) G2.
Buildings 13 01035 g022
Figure 23. Estimated data and test data at 20 °C, with the curve for 20 °C by the third model: (a) G1; (b) G2.
Buildings 13 01035 g023
Figure 24. T r e t fitting curves based on the fourth prediction model: (a) G1; (b) G2.
Buildings 13 01035 g024
Figure 25. Arrhenius graphs based on the fourth prediction model: (a) G1; (b) G2.
Buildings 13 01035 g025
Figure 26. Estimated data and test data at 20 °C, with the curve for 20 °C by the fourth model: (a) G1; (b) G2.
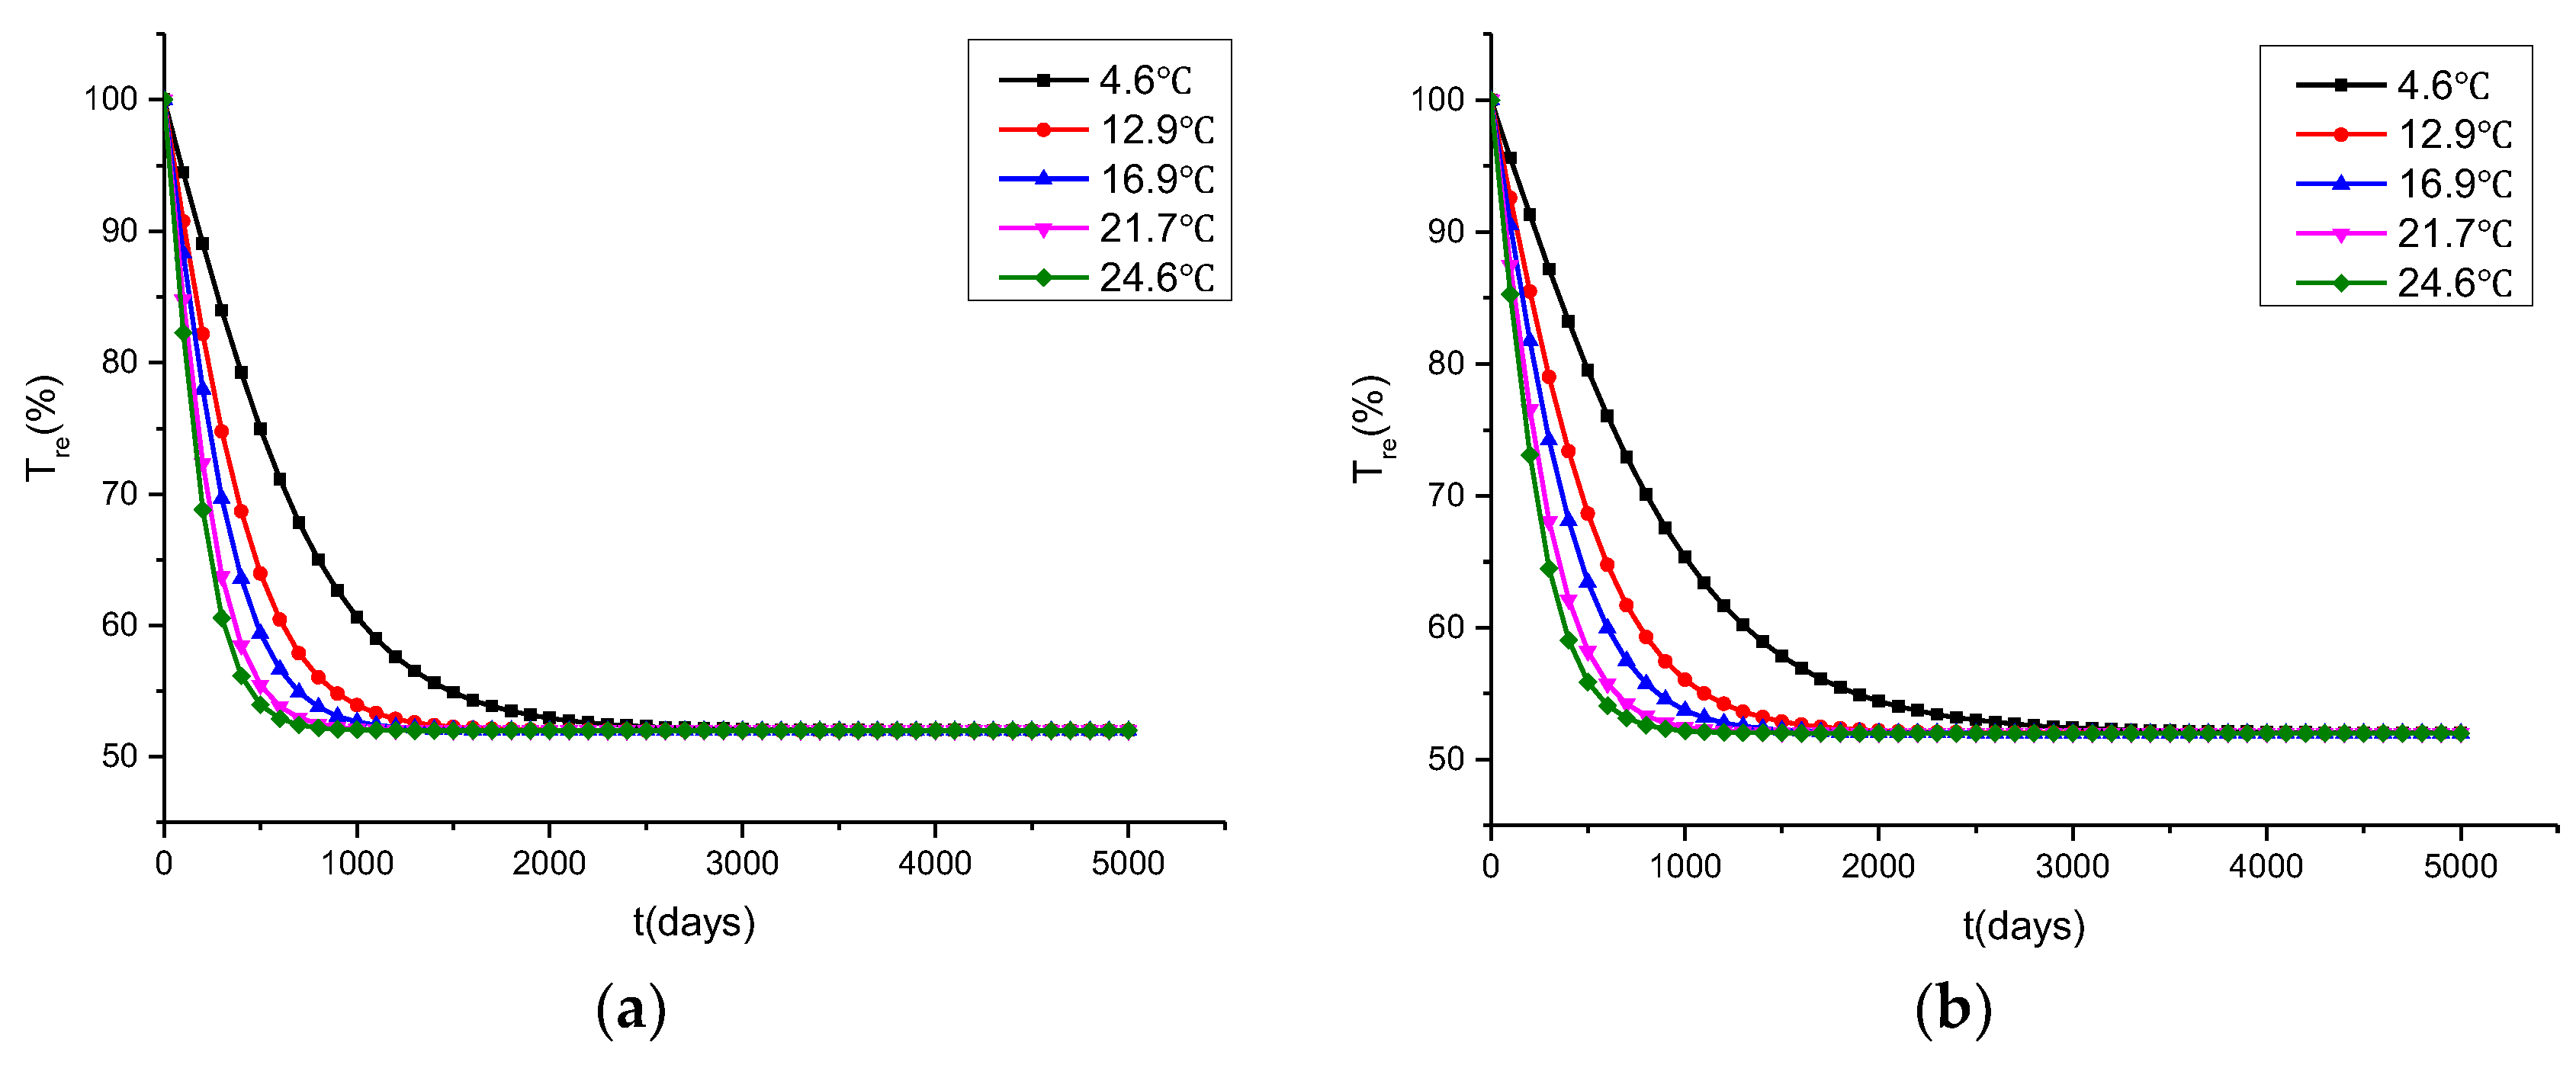
Buildings 13 01035 g026
Figure 27. T r e t curves: (a) G1; (b) G2.
Buildings 13 01035 g027
Table 1. Comparison of residual tensile strength between this article and Wu [32].
Time (Days)This Article (%)Wu (%)
9088.887.5
18080.383.8
Table 2. Determined values of a and b (G1).
T (°C)ab R 2 ( % )
20−23.4132.287
40−36.1143.790
60−13.682.961
Table 3. Determined values of a and b (G2).
T (°C)ab R 2 ( % )
20−18.5123.796
40−31.9133.999
60−26.8110.093
Table 4. Determined values of T r e _ and τ (G1).
T (°C) T r e _ (%) τ R 2 ( % )
2052.0288.998
4052.4110.599
6052.627.499
Table 5. Determined values of T r e _ and τ (G2).
T (°C) T r e _ (%) τ R 2 ( % )
2052.3341.197
4052.396.799
6052.334.299
Table 6. Values of E a / R (G1) based on the second prediction model.
T r e ( % ) E a / R R 2 ( % )
905687.496
805669.096
705681.196
605633.096
Table 7. Values of E a / R (G2) based on the second prediction model.
T r e ( % ) E a / R R 2 ( % )
905621.399
805621.399
705621.399
605621.399
Table 8. TSF at temperatures of 20, 40, and 60 °C based on the second prediction model.
GFRP Type20 °C40 °C60 °C
G11.002.6110.54
G21.003.539.97
Table 9. Values of 2 A C (G1).
T (°C) 2 A C R2 (%)
200.086494
400.182699
600.279294
Table 10. Values of 2 A C (G2).
T (°C) 2 A C R2 (%)
200.080495
400.188099
600.292394
Table 11. Values of E a / R (G1) based on the third prediction model.
T r e ( % ) E a / R R 2 ( % )
905753.897
805753.897
705753.897
605753.897
Table 12. Values of E a / R (G2) based on the third prediction model.
T r e ( % ) E a / R R 2 ( % )
906335.696
806335.696
706335.696
606335.696
Table 13. TSF at temperatures of 20, 40, and 60 °C based on the third prediction model.
GFRP Type20 °C40 °C60 °C
G11.004.4710.44
G21.005.4713.22
Table 14. Determined values of T r e _ and τ (G1).
T (°C) T r e _ (%) B R 2 ( % )
2052.0167.998
4052.074.599
6052.021.599
Table 15. Determined values of T r e _ and τ (G2).
T (°C) T r e _ (%) B R 2 ( % )
2051.0207.095
4051.064.397
6051.025.299
Table 16. Values of E a / R (G1) based on the fourth prediction model.
T r e ( % ) E a / R R 2 ( % )
904989.295
804989.295
704989.295
604989.295
Table 17. Values of E a / R (G2) based on the fourth prediction model.
T r e ( % ) E a / R R 2 ( % )
905150.099
805150.099
705150.099
605150.099
Table 18. TSF at temperatures of 20, 40, and 60 °C based on the fourth prediction model.
GFRP Type20 °C40 °C60 °C
G11.002.227.81
G21.003.228.22
Table 19. R 2 values of the second, third, and fourth models for the estimated data and test data at 20 °C.
GFRP TypeSecond ModelThird ModelFourth Model
G10.990.940.99
G20.990.980.97
Table 20. Activation energy as determined in different studies.
Data SourceTest ConditionPrediction ModelGFRP E a   ( K J / m o l )
This studyConcrete Cylinders T r e e t / τ (The second prediction model)G147
G247
T r e e t / τ (The third prediction model)G148
G253
T r e 1 / ( 1 + e t / B ) (The fourth prediction model)G150
G252
Davalos [35]Concrete Beams (not-loaded) T r e e t / τ (The second prediction model)E-glass & vinyl ester47
Concrete Beams (loaded)32
Phani [8]Hot water T r e e t / τ (The second prediction model)E-glass & polyester12
Wang [2]Alkaline Solution T r e l g t (The first prediction model)E-glass & vinyl ester46
Disclaimer/Publisher’s Note: The statements, opinions and data contained in all publications are solely those of the individual author(s) and contributor(s) and not of MDPI and/or the editor(s). MDPI and/or the editor(s) disclaim responsibility for any injury to people or property resulting from any ideas, methods, instructions or products referred to in the content.

