
Design and Implementation of a Futuristic EV Energy Trading System (FEETS) Connected with Buildings, PV, and ESS for a Carbon-Neutral Society
 , , , ,
Abstract
:1. Introduction
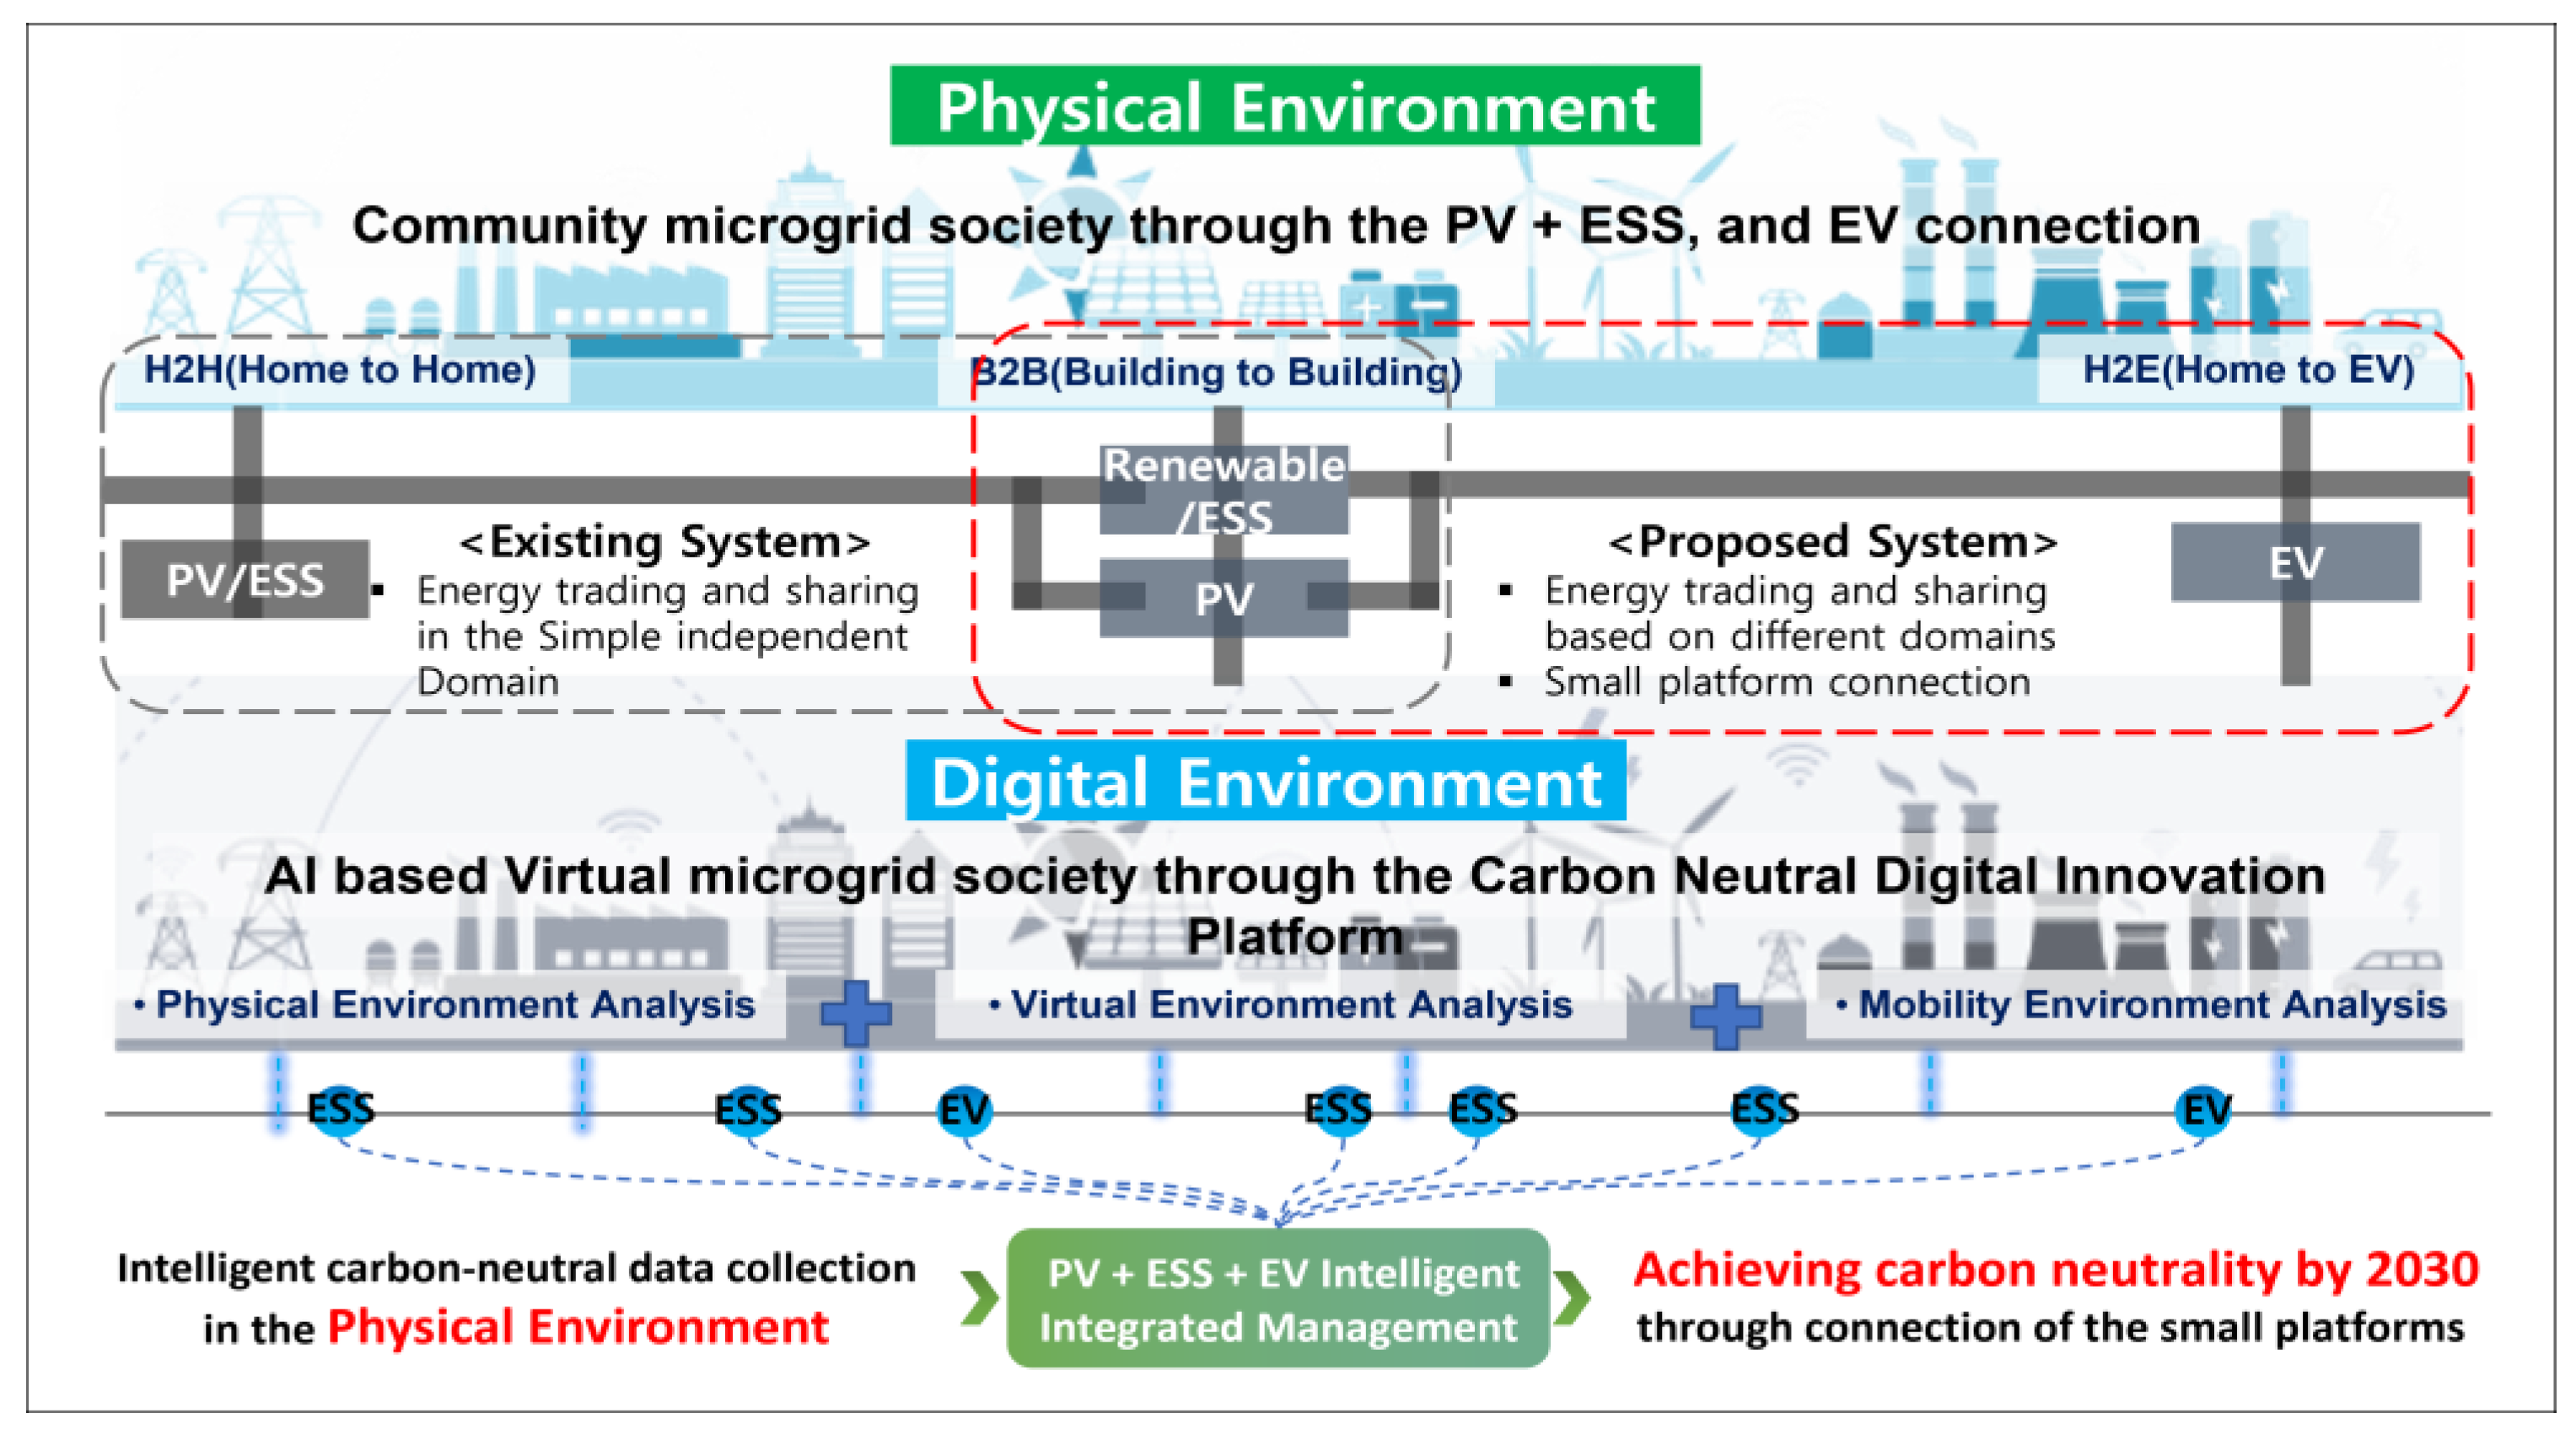
1.1. The Necessity of Platform-Based Integrated Energy Management
1.2. The Concept of Used Energy Trading Platform and Prosumer
- In Section 3, we introduce the Carbon-Neutral Digital Innovation Platform and present the importance of energy strategy through the small platform connection method.
- We design a futuristic energy trading business model and accompanying PV and EV charging and trading platform based on an energy sharing mechanism in Section 5.
- We introduce Korea’s energy policy and contract power and propose an energy supply strategy based on the energy supply and demand mechanism to respond to contract power in Section 6.
- We analyze the electricity bill for one month through scenario-based simulations of an existing building and the proposed system in Section 6.
2. Related Work
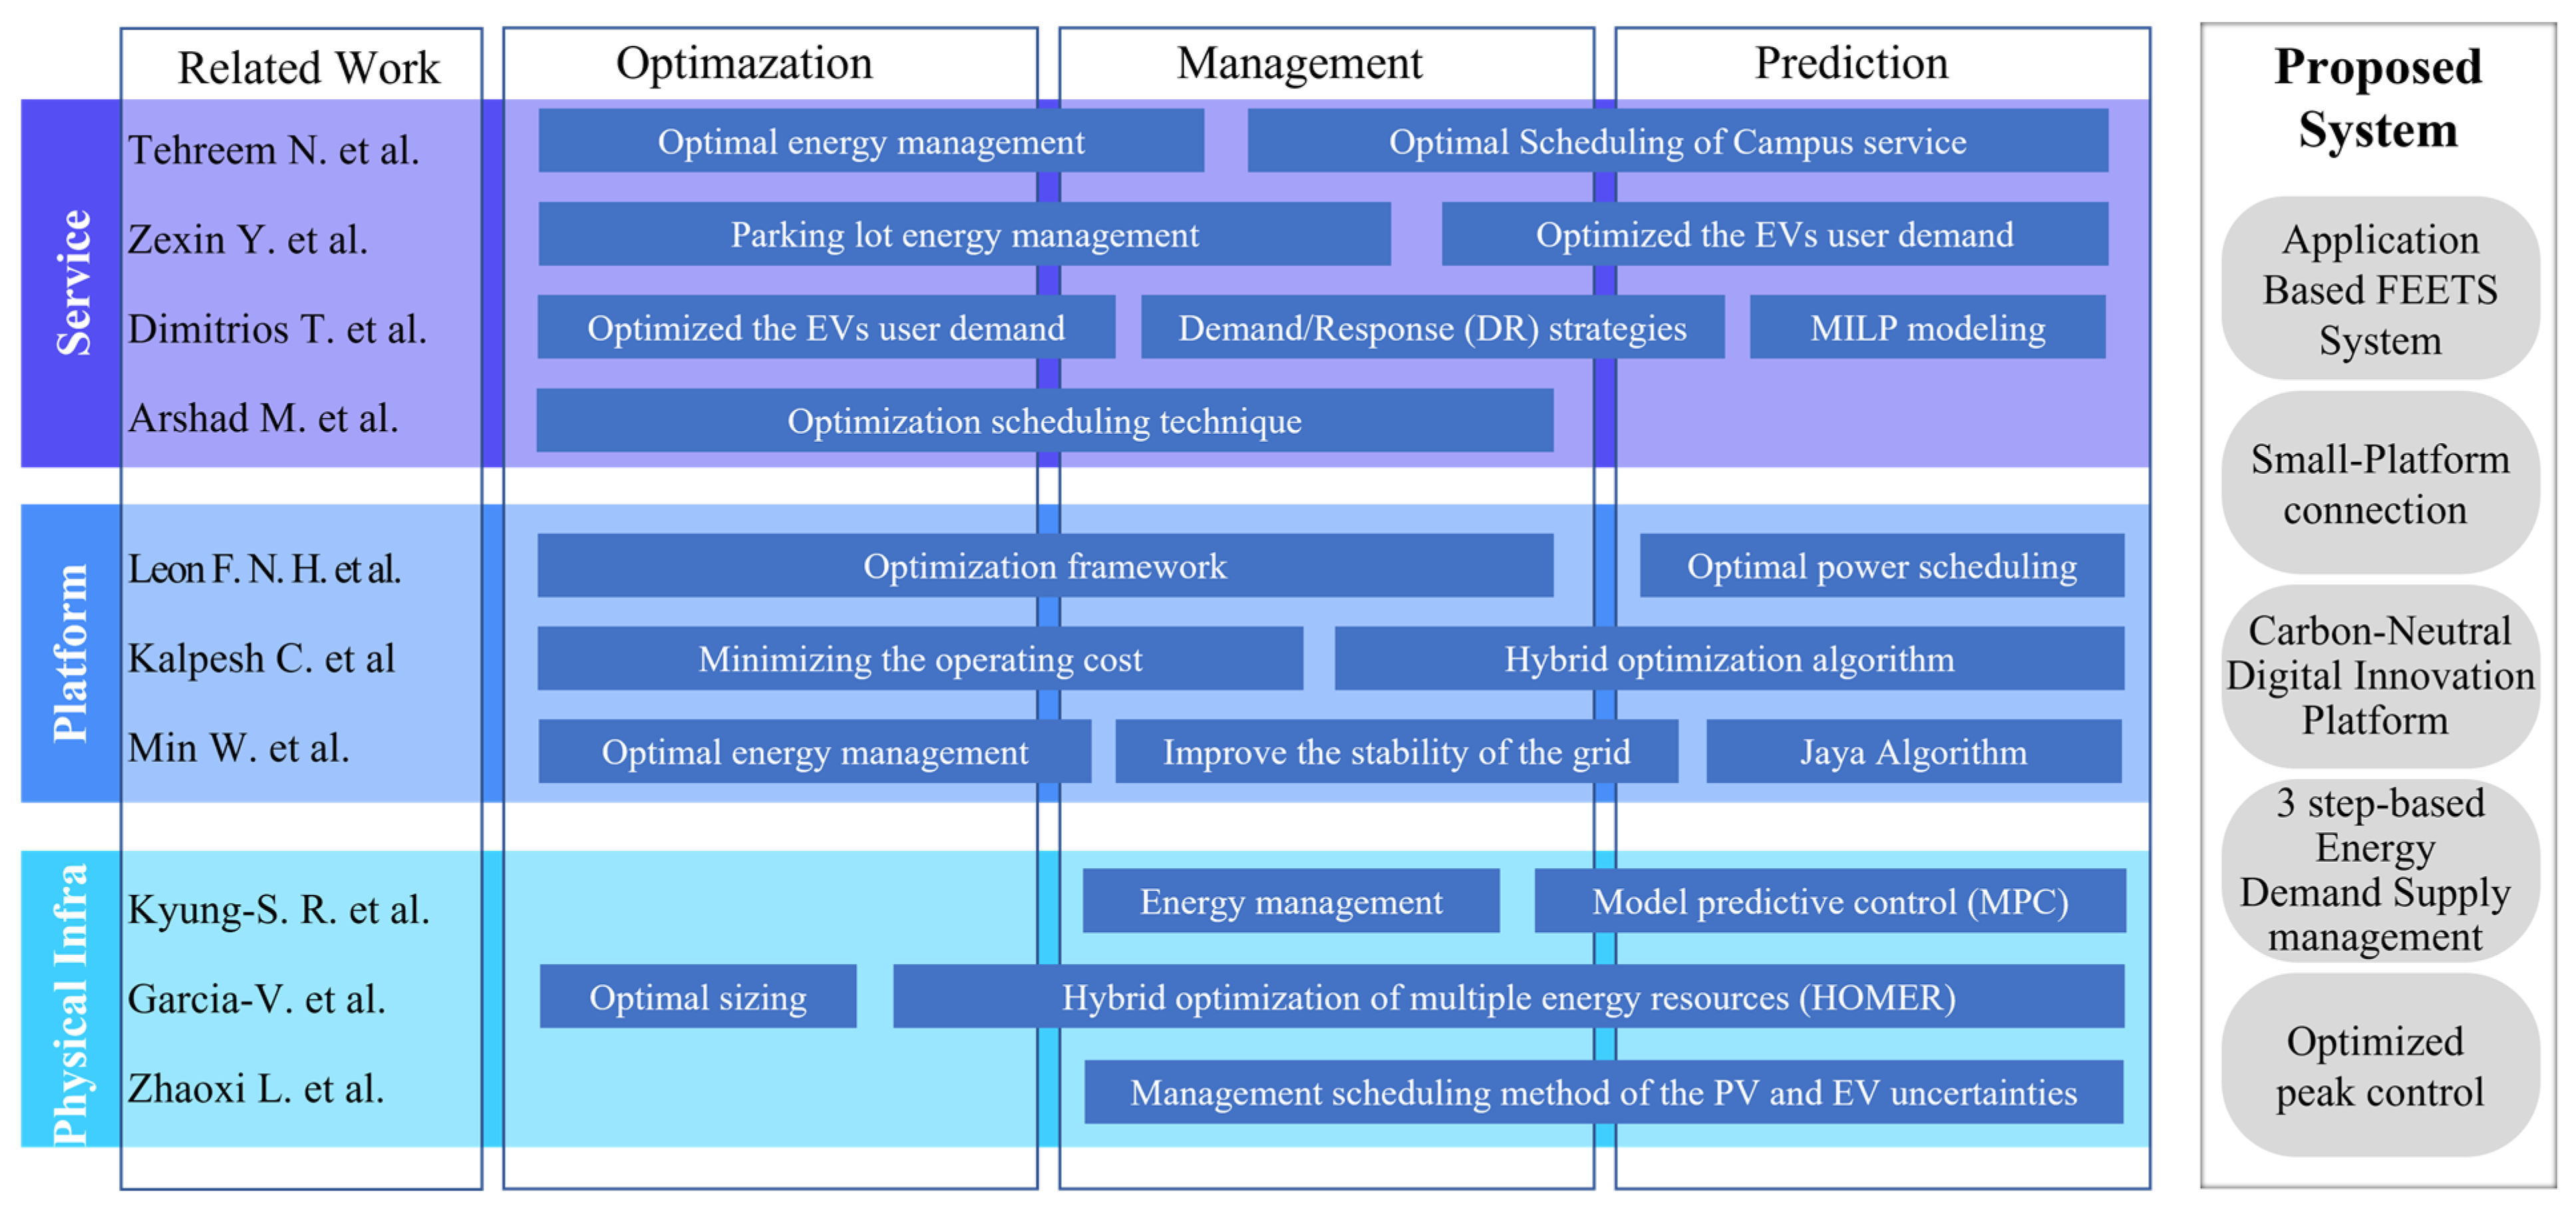
2.1. Service Aspect
2.2. Platform Aspect
2.3. Physical Infra. Aspect
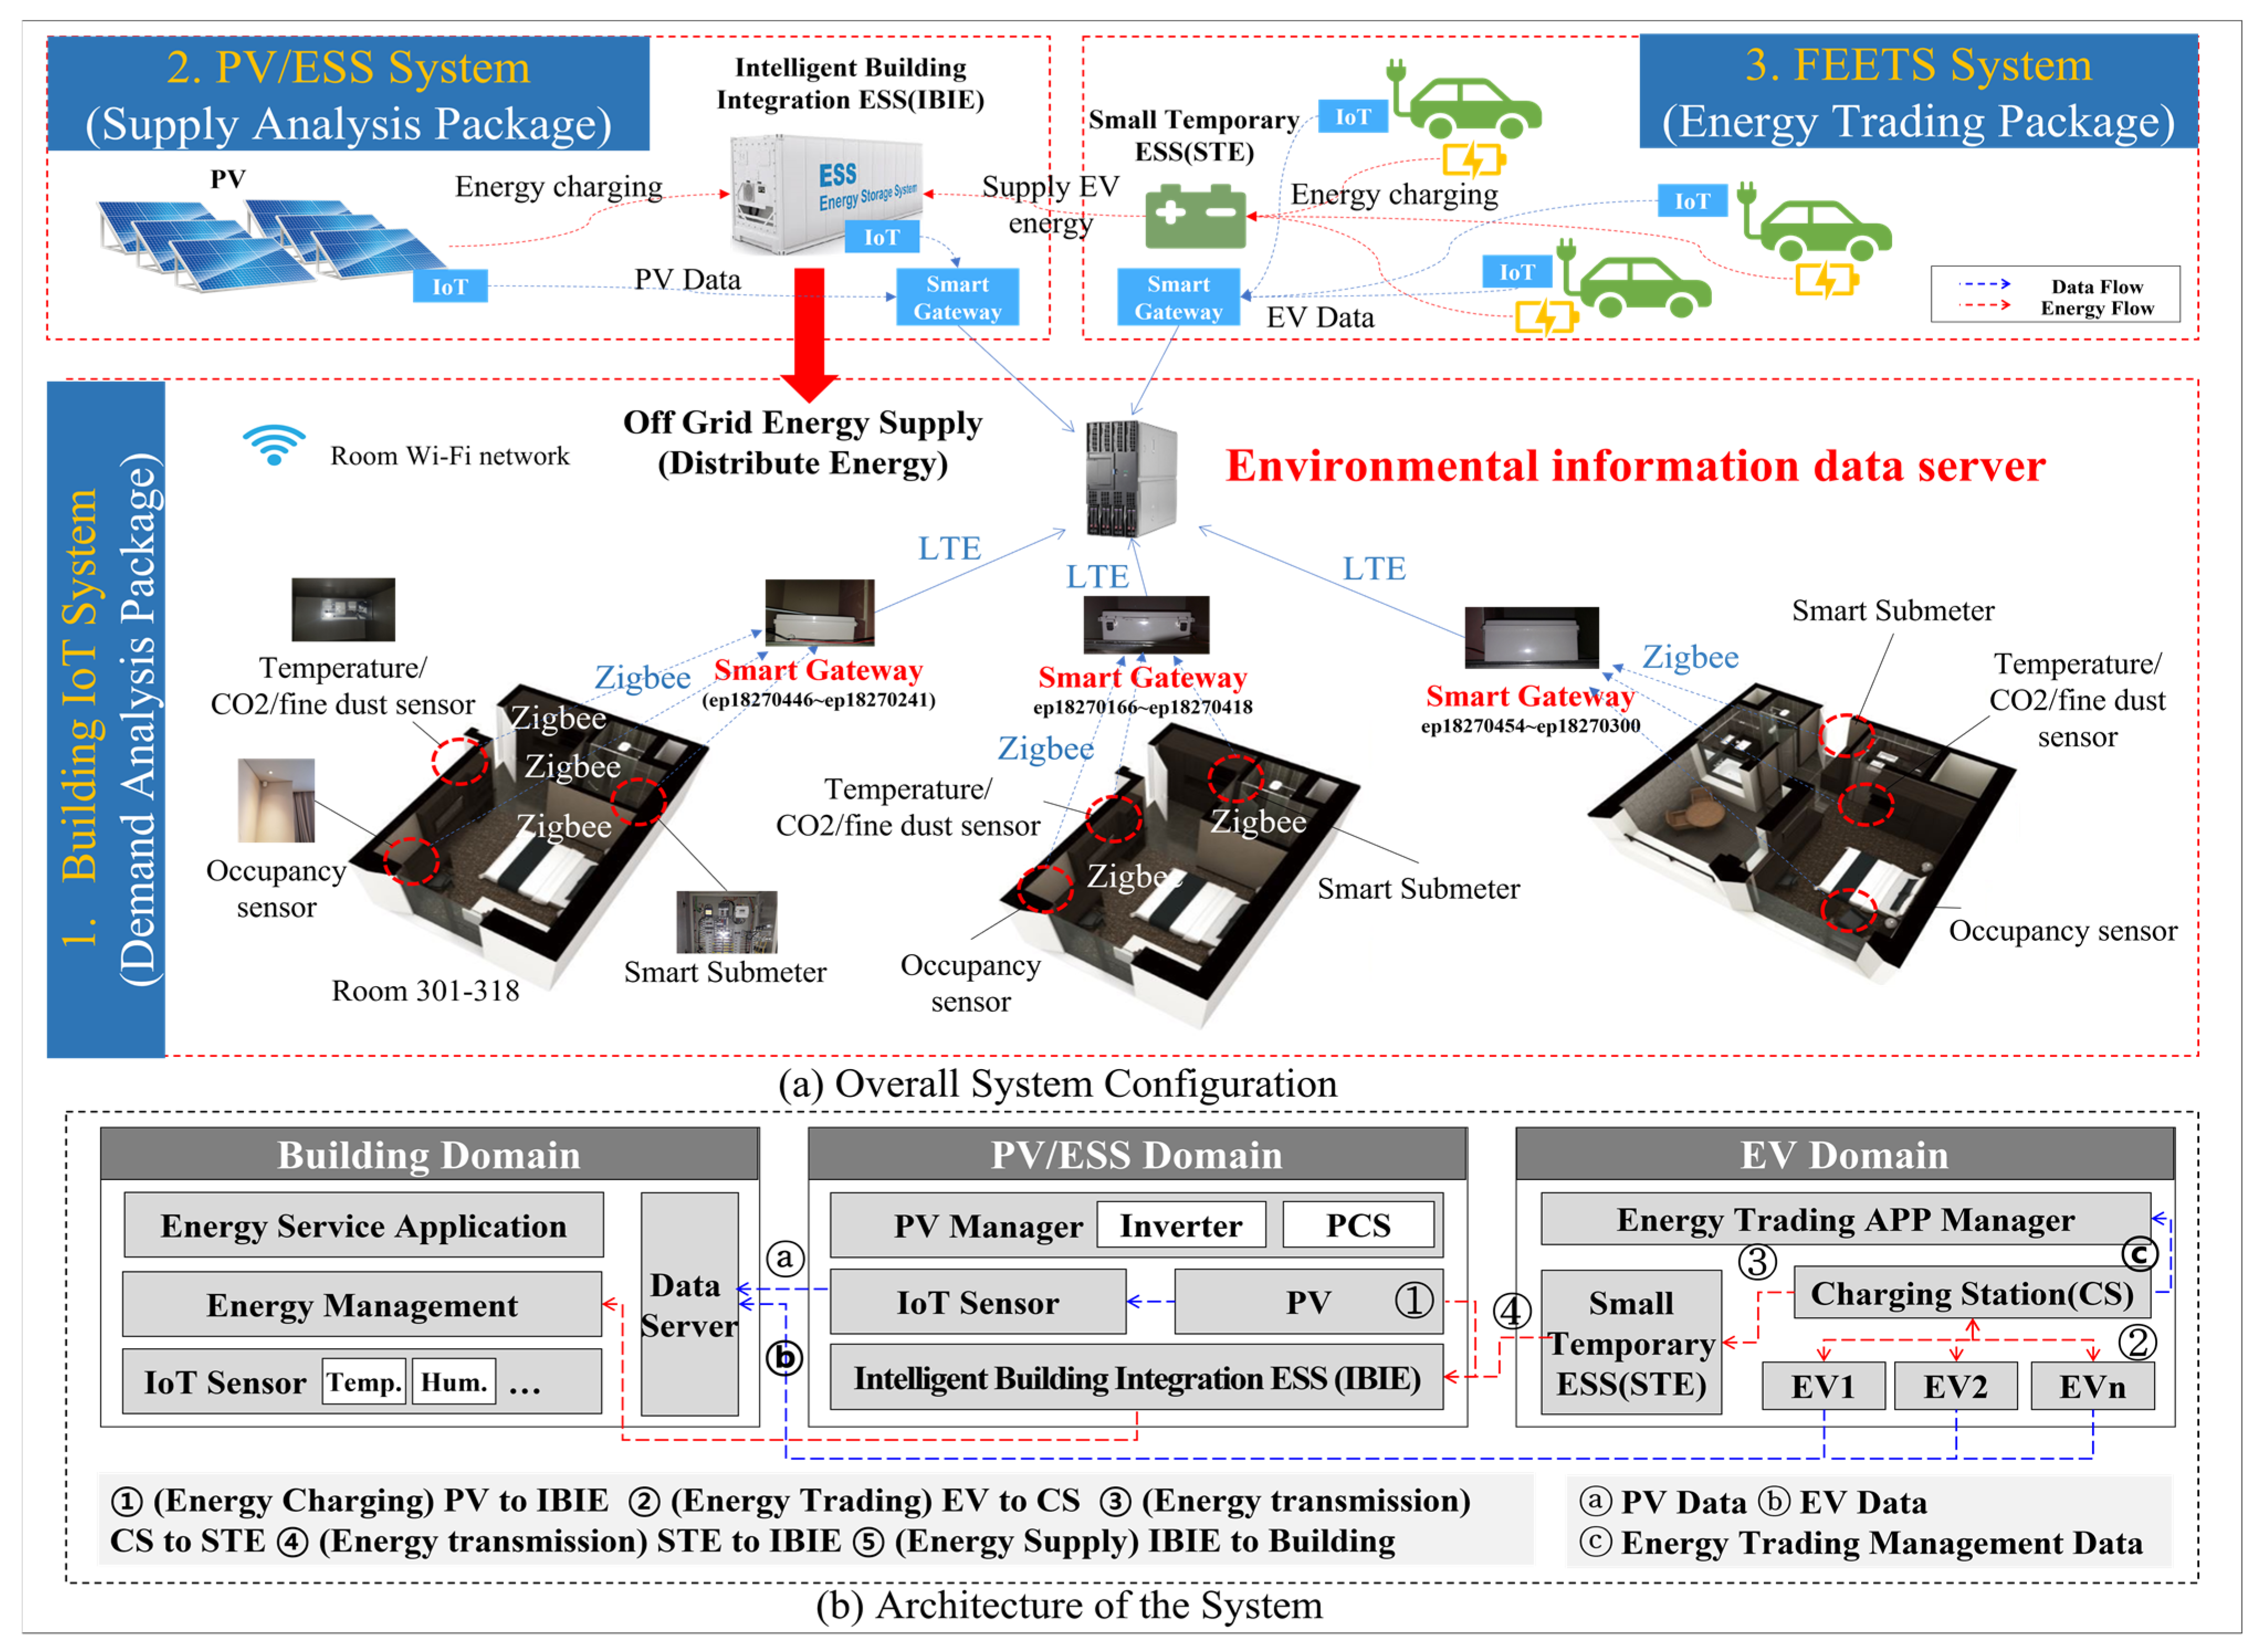
3. System Configuration
3.1. System Architecture
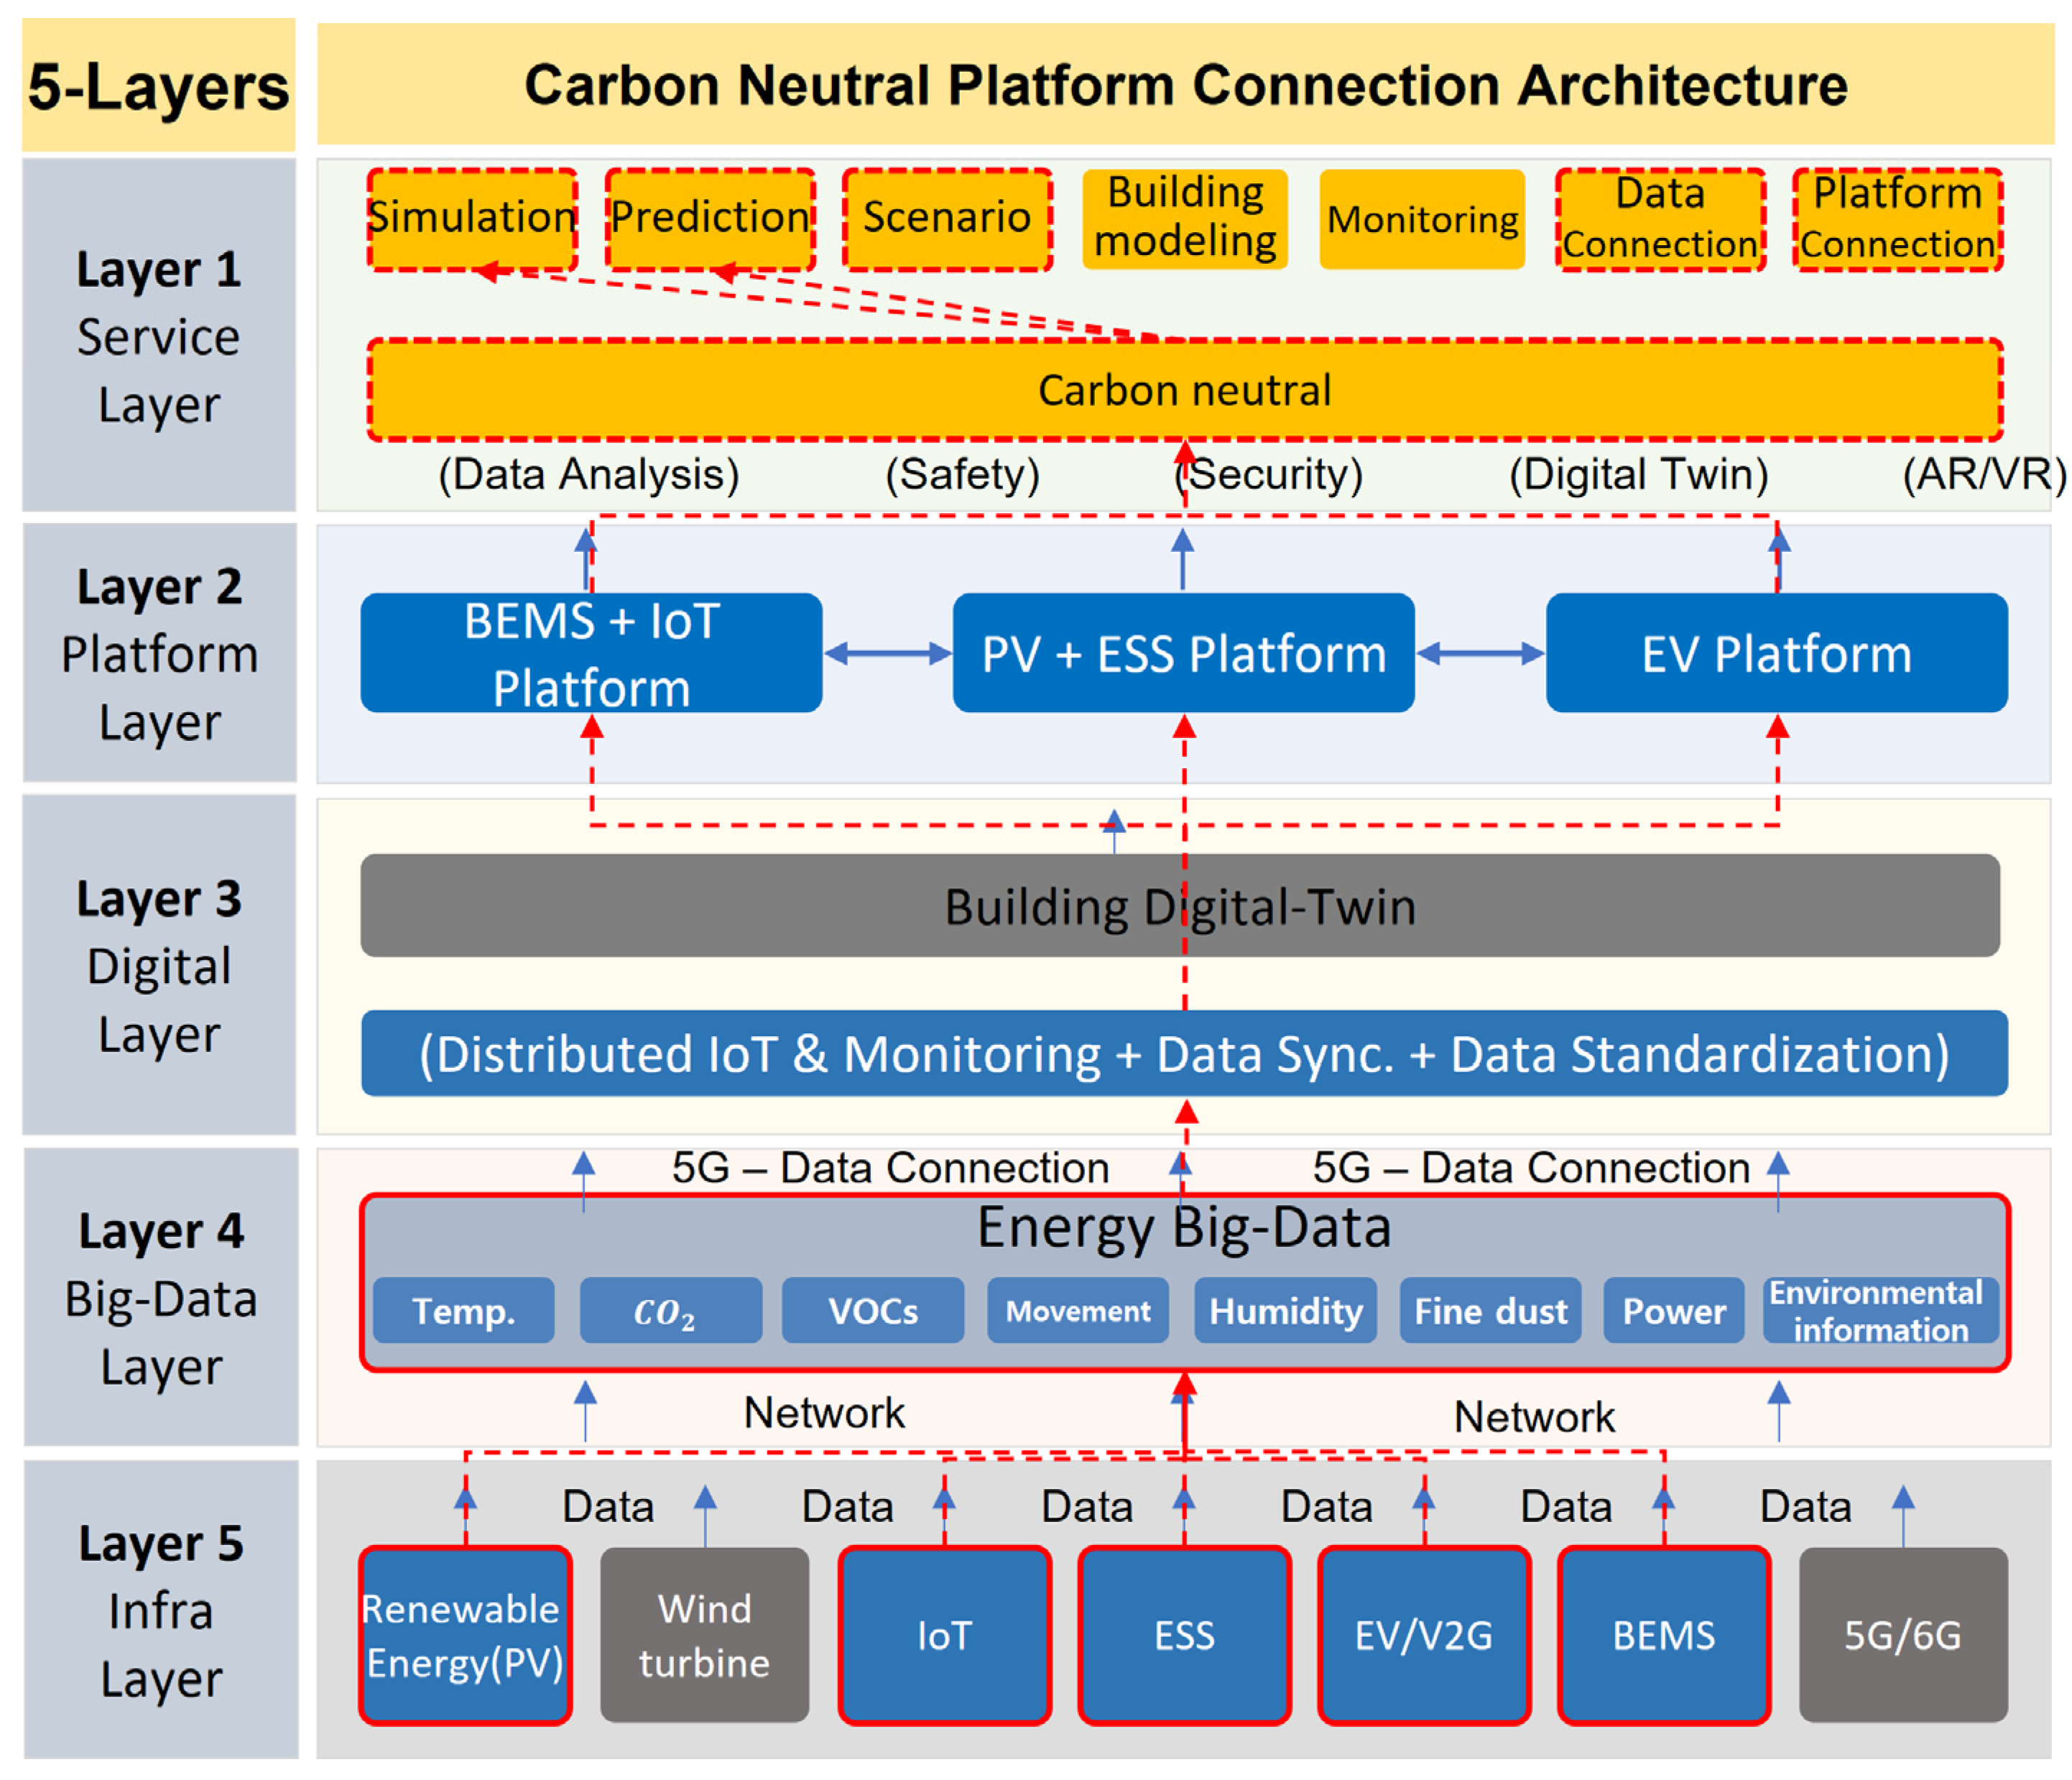
3.1.1. Carbon-Neutral Digital Innovation Platform (CNDIP)
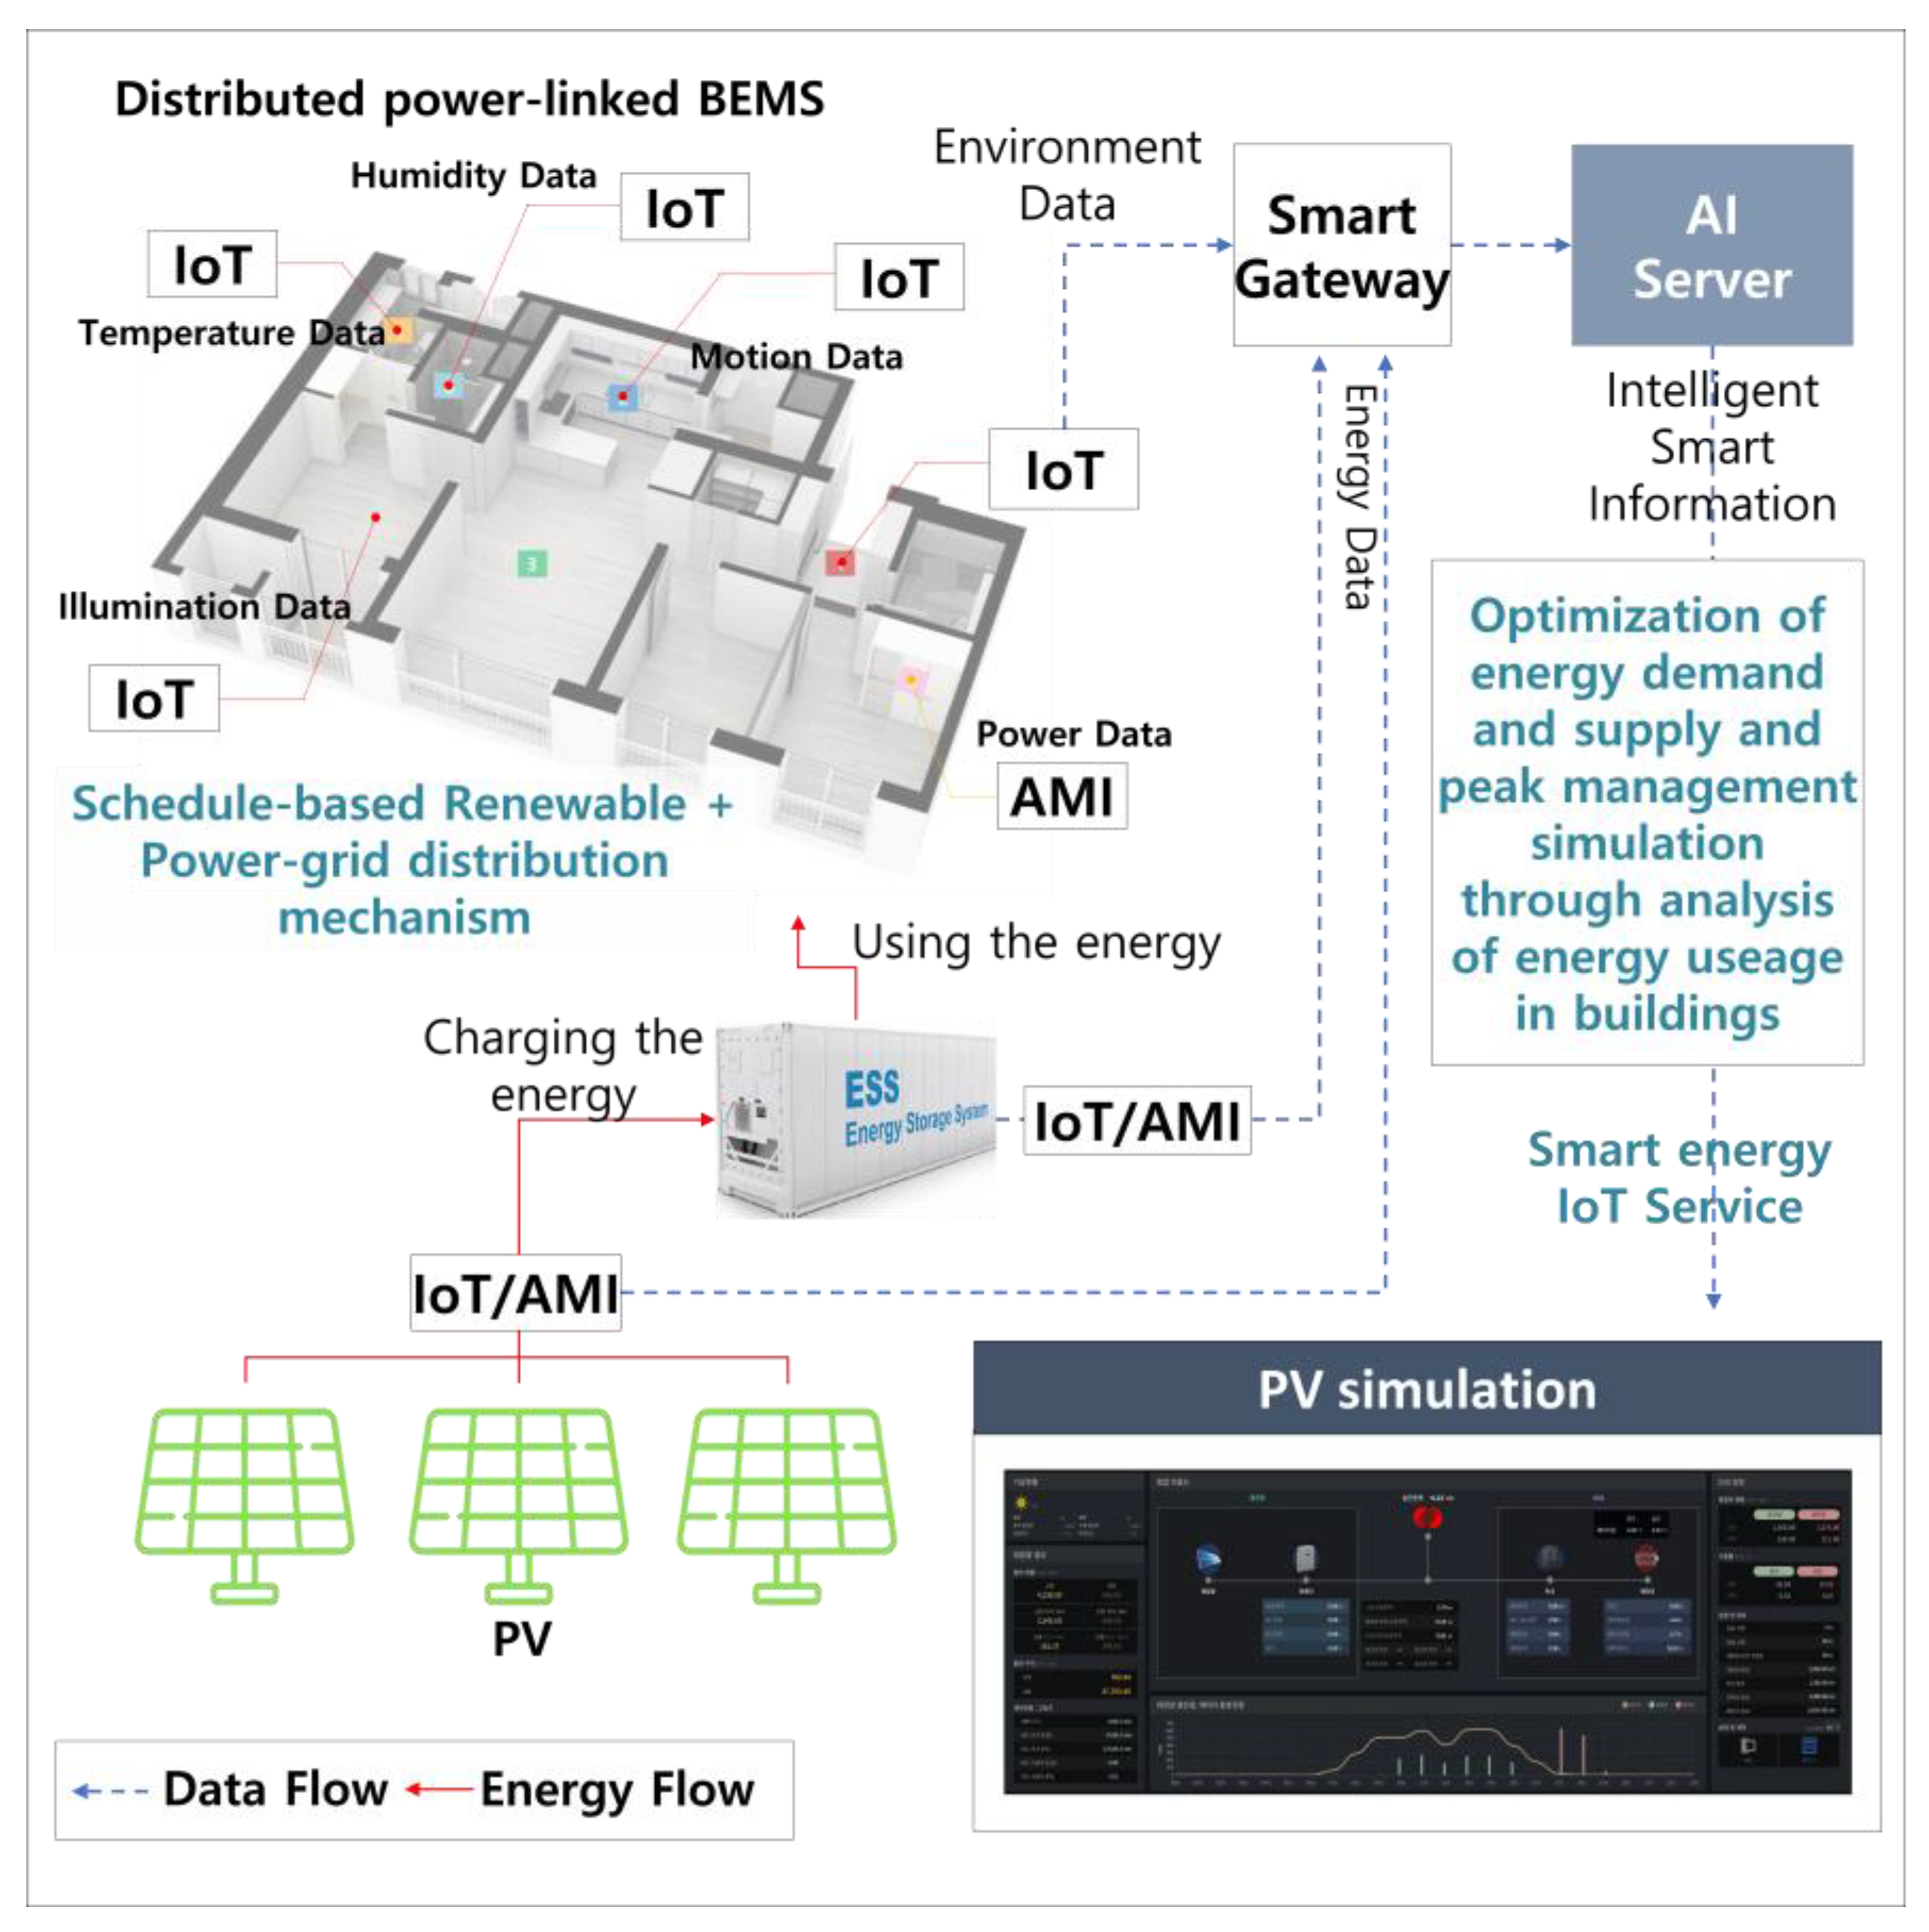
- Infrastructure layer: The most important element in the infrastructure layer is the energy IoT. The energy IoT refers to a service that maximizes the energy efficiency through energy information collection, load management of the energy demand, and energy sharing/transactions by developing IoT-based smart energy platform technology to solve energy problems in a hyper-connected society. In addition, data are one of the important elements in the infrastructure layer. Representatively, there are various types of data (temperature, humidity, movement, power, etc.) from BEMS smart sensors and advanced metering infrastructure (AMI), renewable energy generation/facilities, fuel cells, PV infrastructure, and wind power generation infrastructure.
- Big-data layer: The big-data layer manages carbon-neutral data and analyzes energy data to optimize various types of carbon-neutral data from the infrastructure layer.
- Digital layer: The digital layer is responsible for data analysis and intelligence processing to create meaningful values of big data from the infrastructure layer. In addition, it is possible to link digital twins through a federated digital twin.
- Platform layer: Creating new value through platform linkage is becoming an essential technology. Through the connection between the previously built platform and the newly created platform, it is possible to build a customized platform for users. Therefore, the platform layer has a role in connecting various platforms of carbon neutrality and energy.
- Service layer: In the service layer, analysis prediction can be performed through data received from the infrastructure layer, and a business model can be built as a service element.
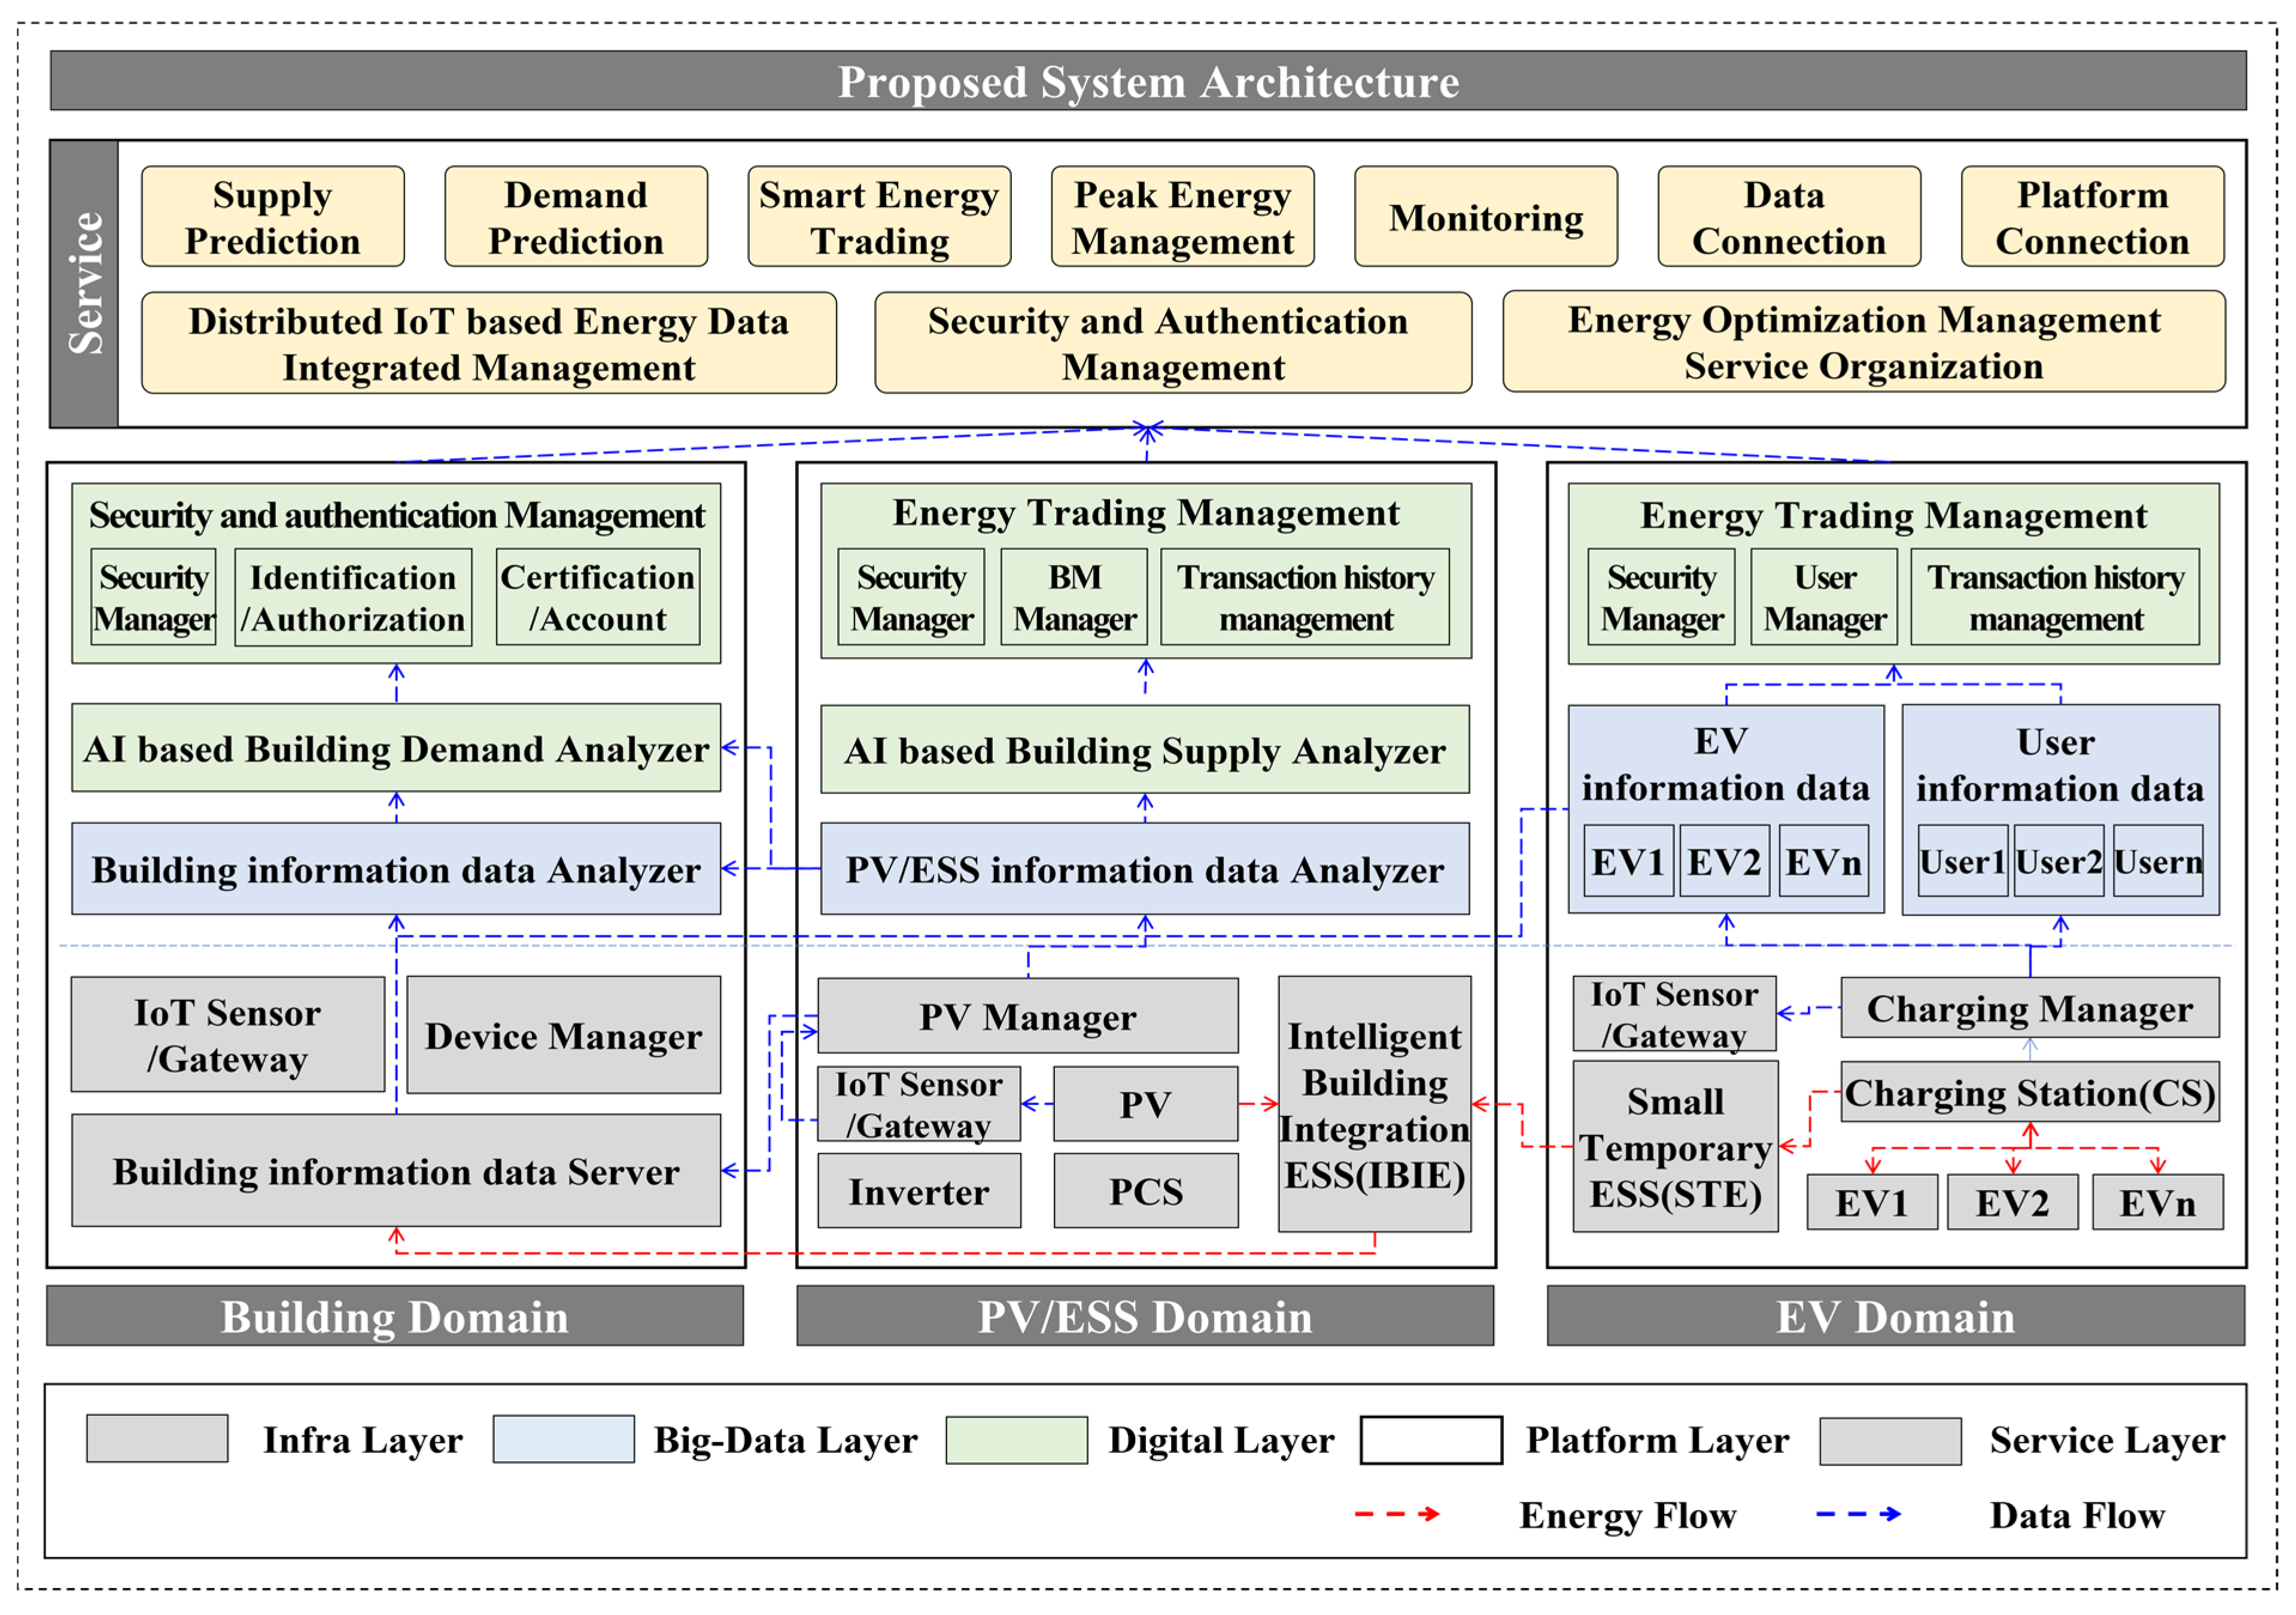
3.1.2. Proposed System Architecture (Connection of CNDIP)
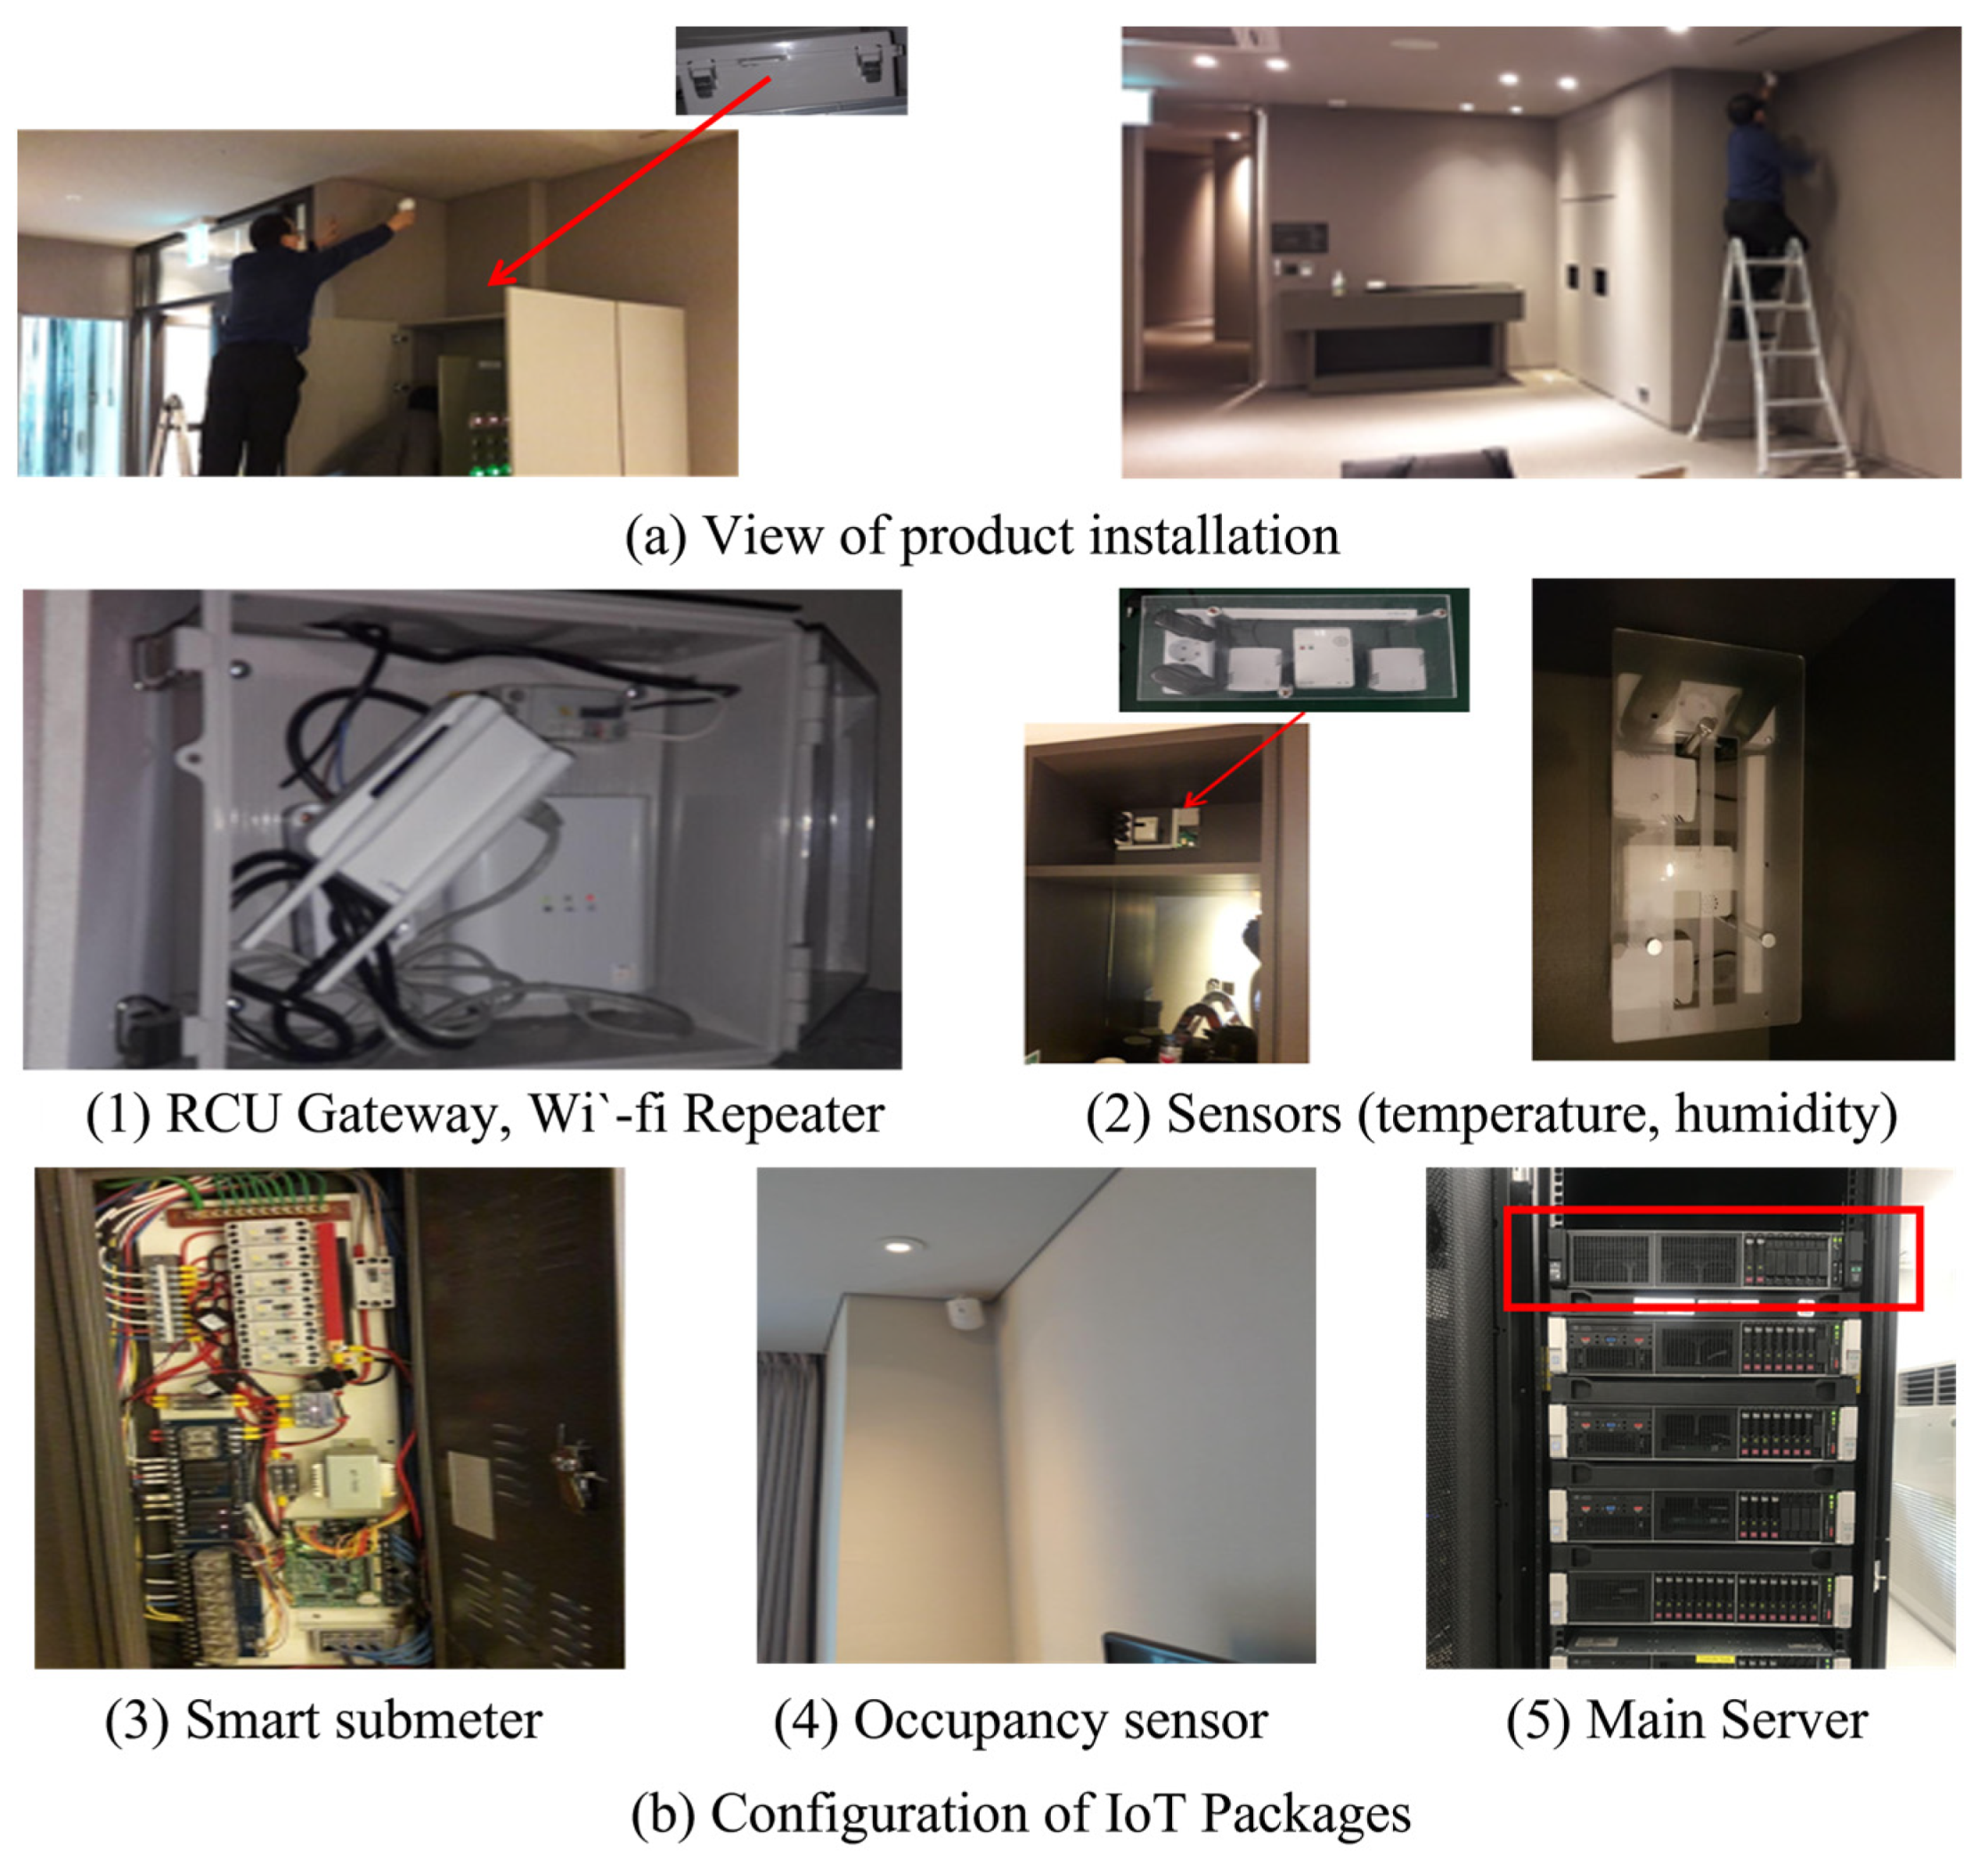
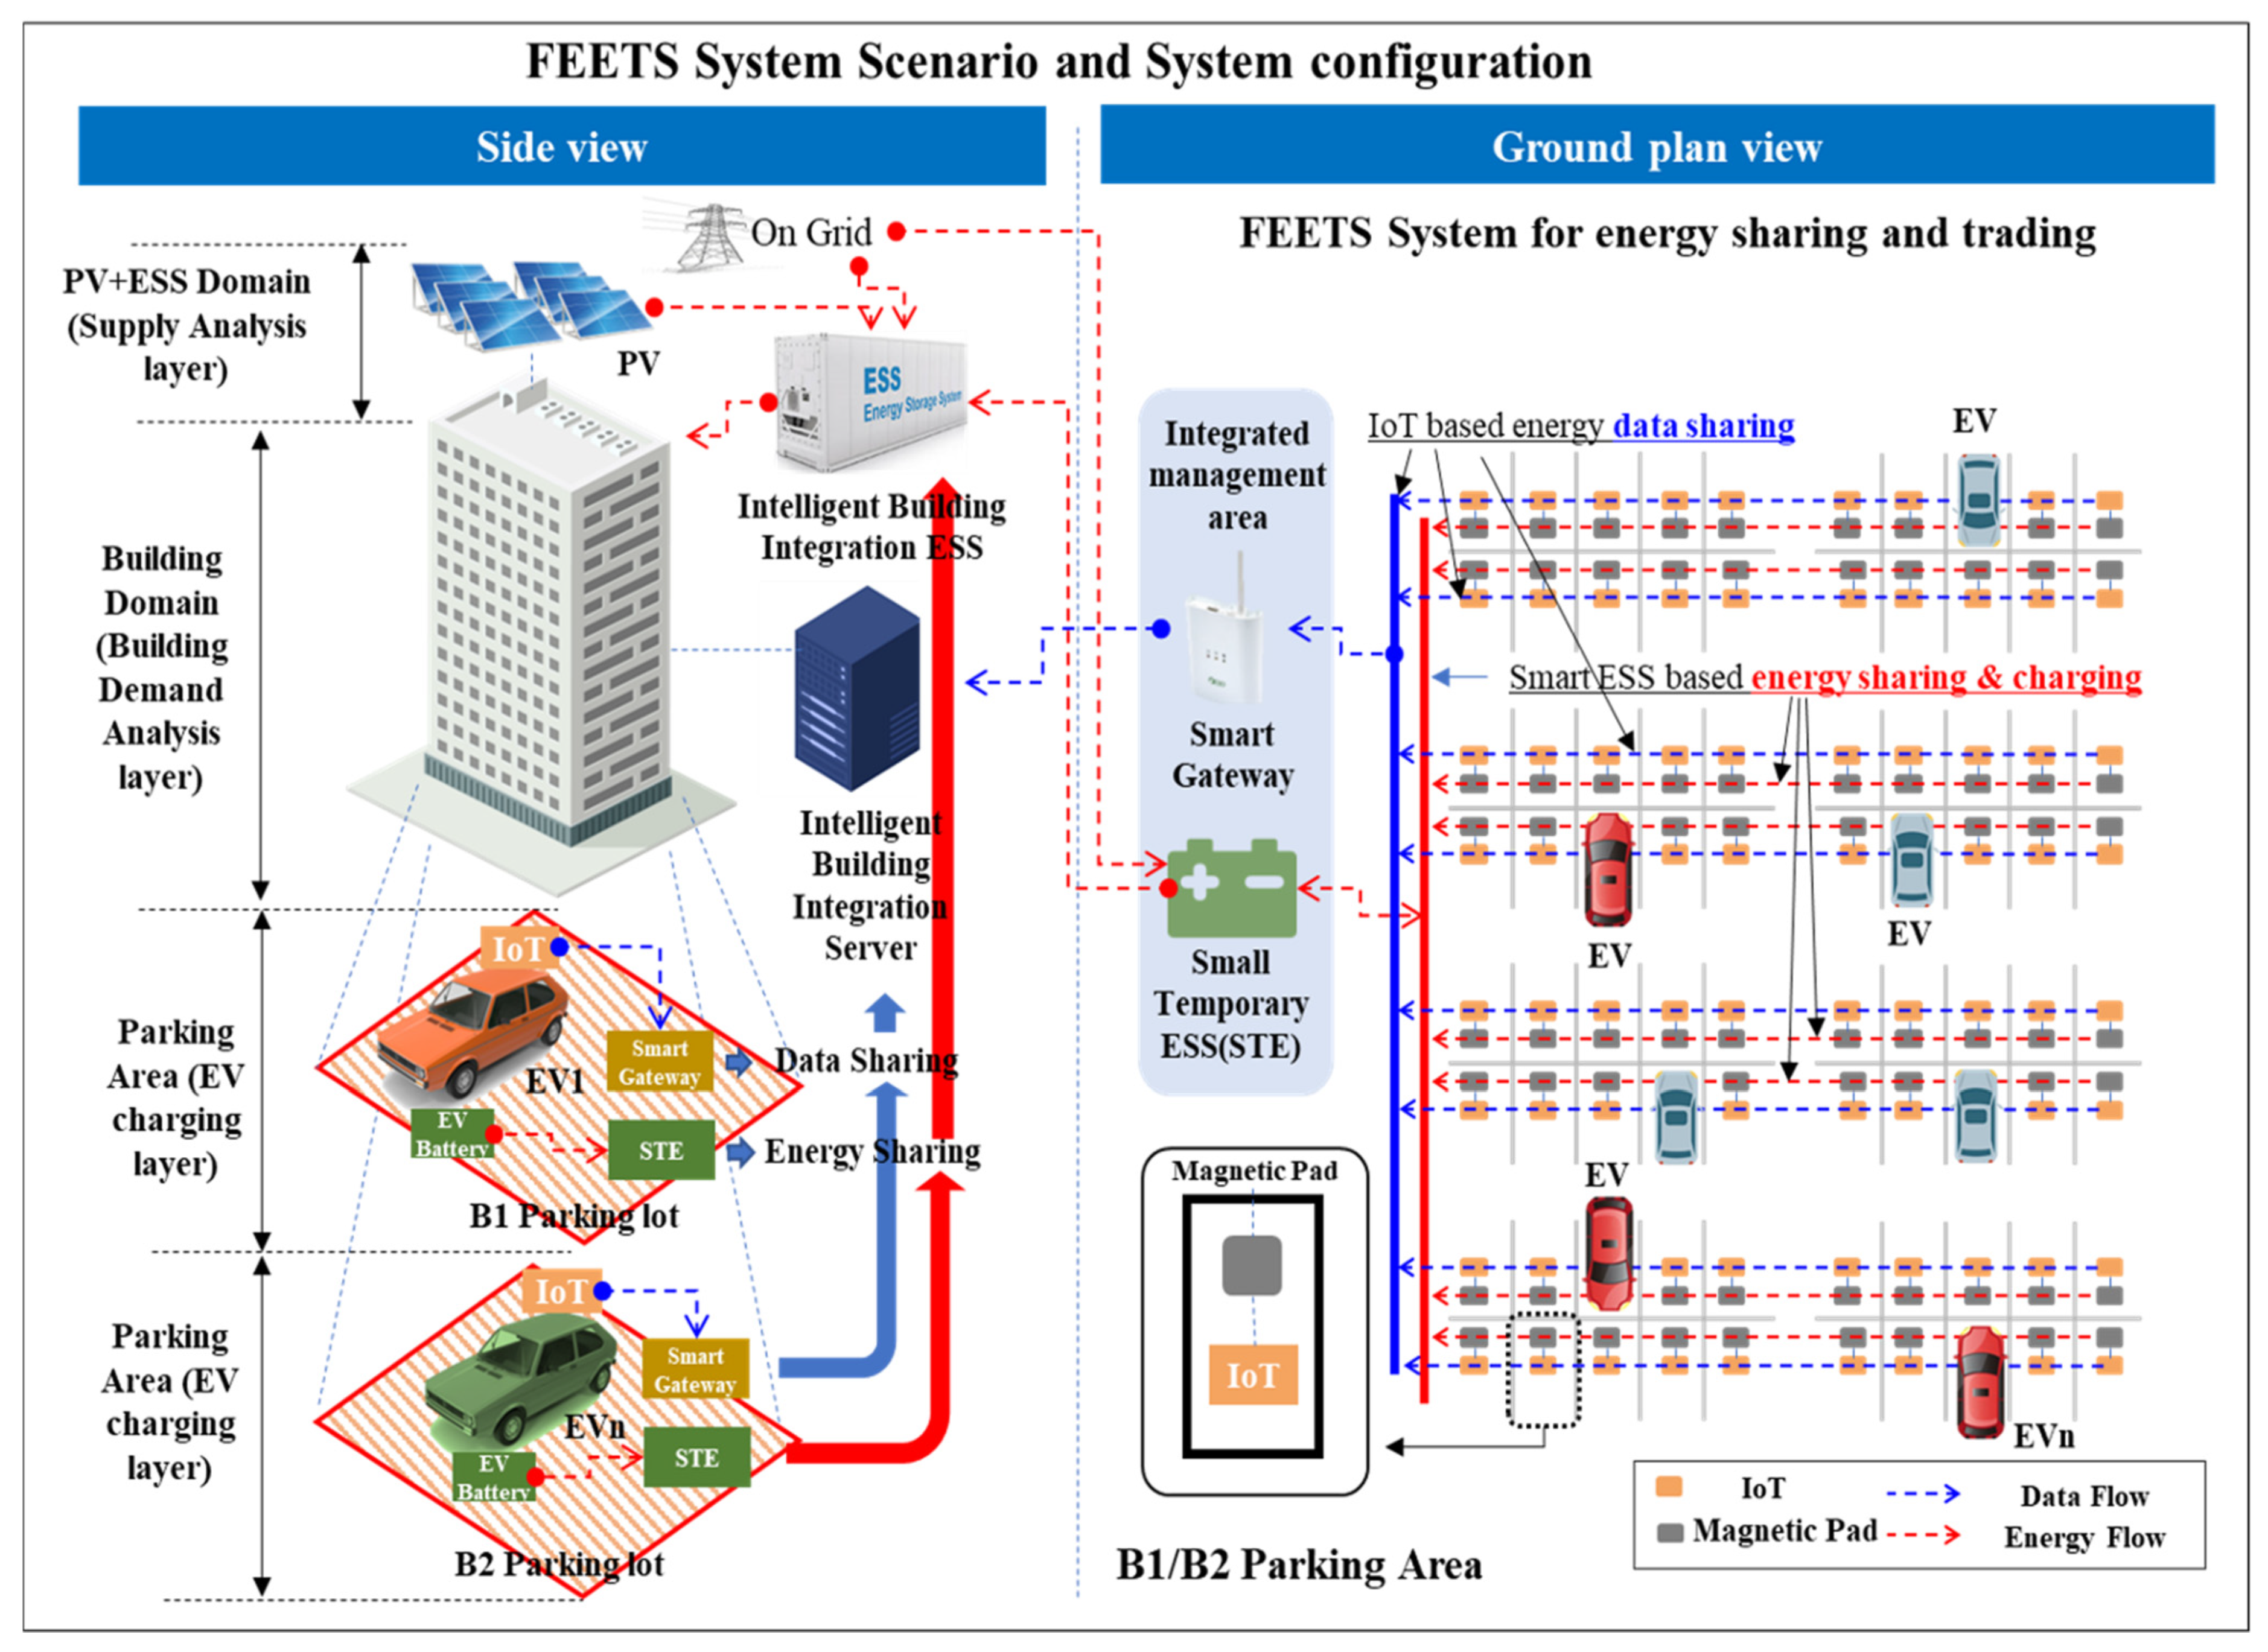
3.2. Overview of the System in the Building Domain
3.3. Construction of PV and ESS Domain
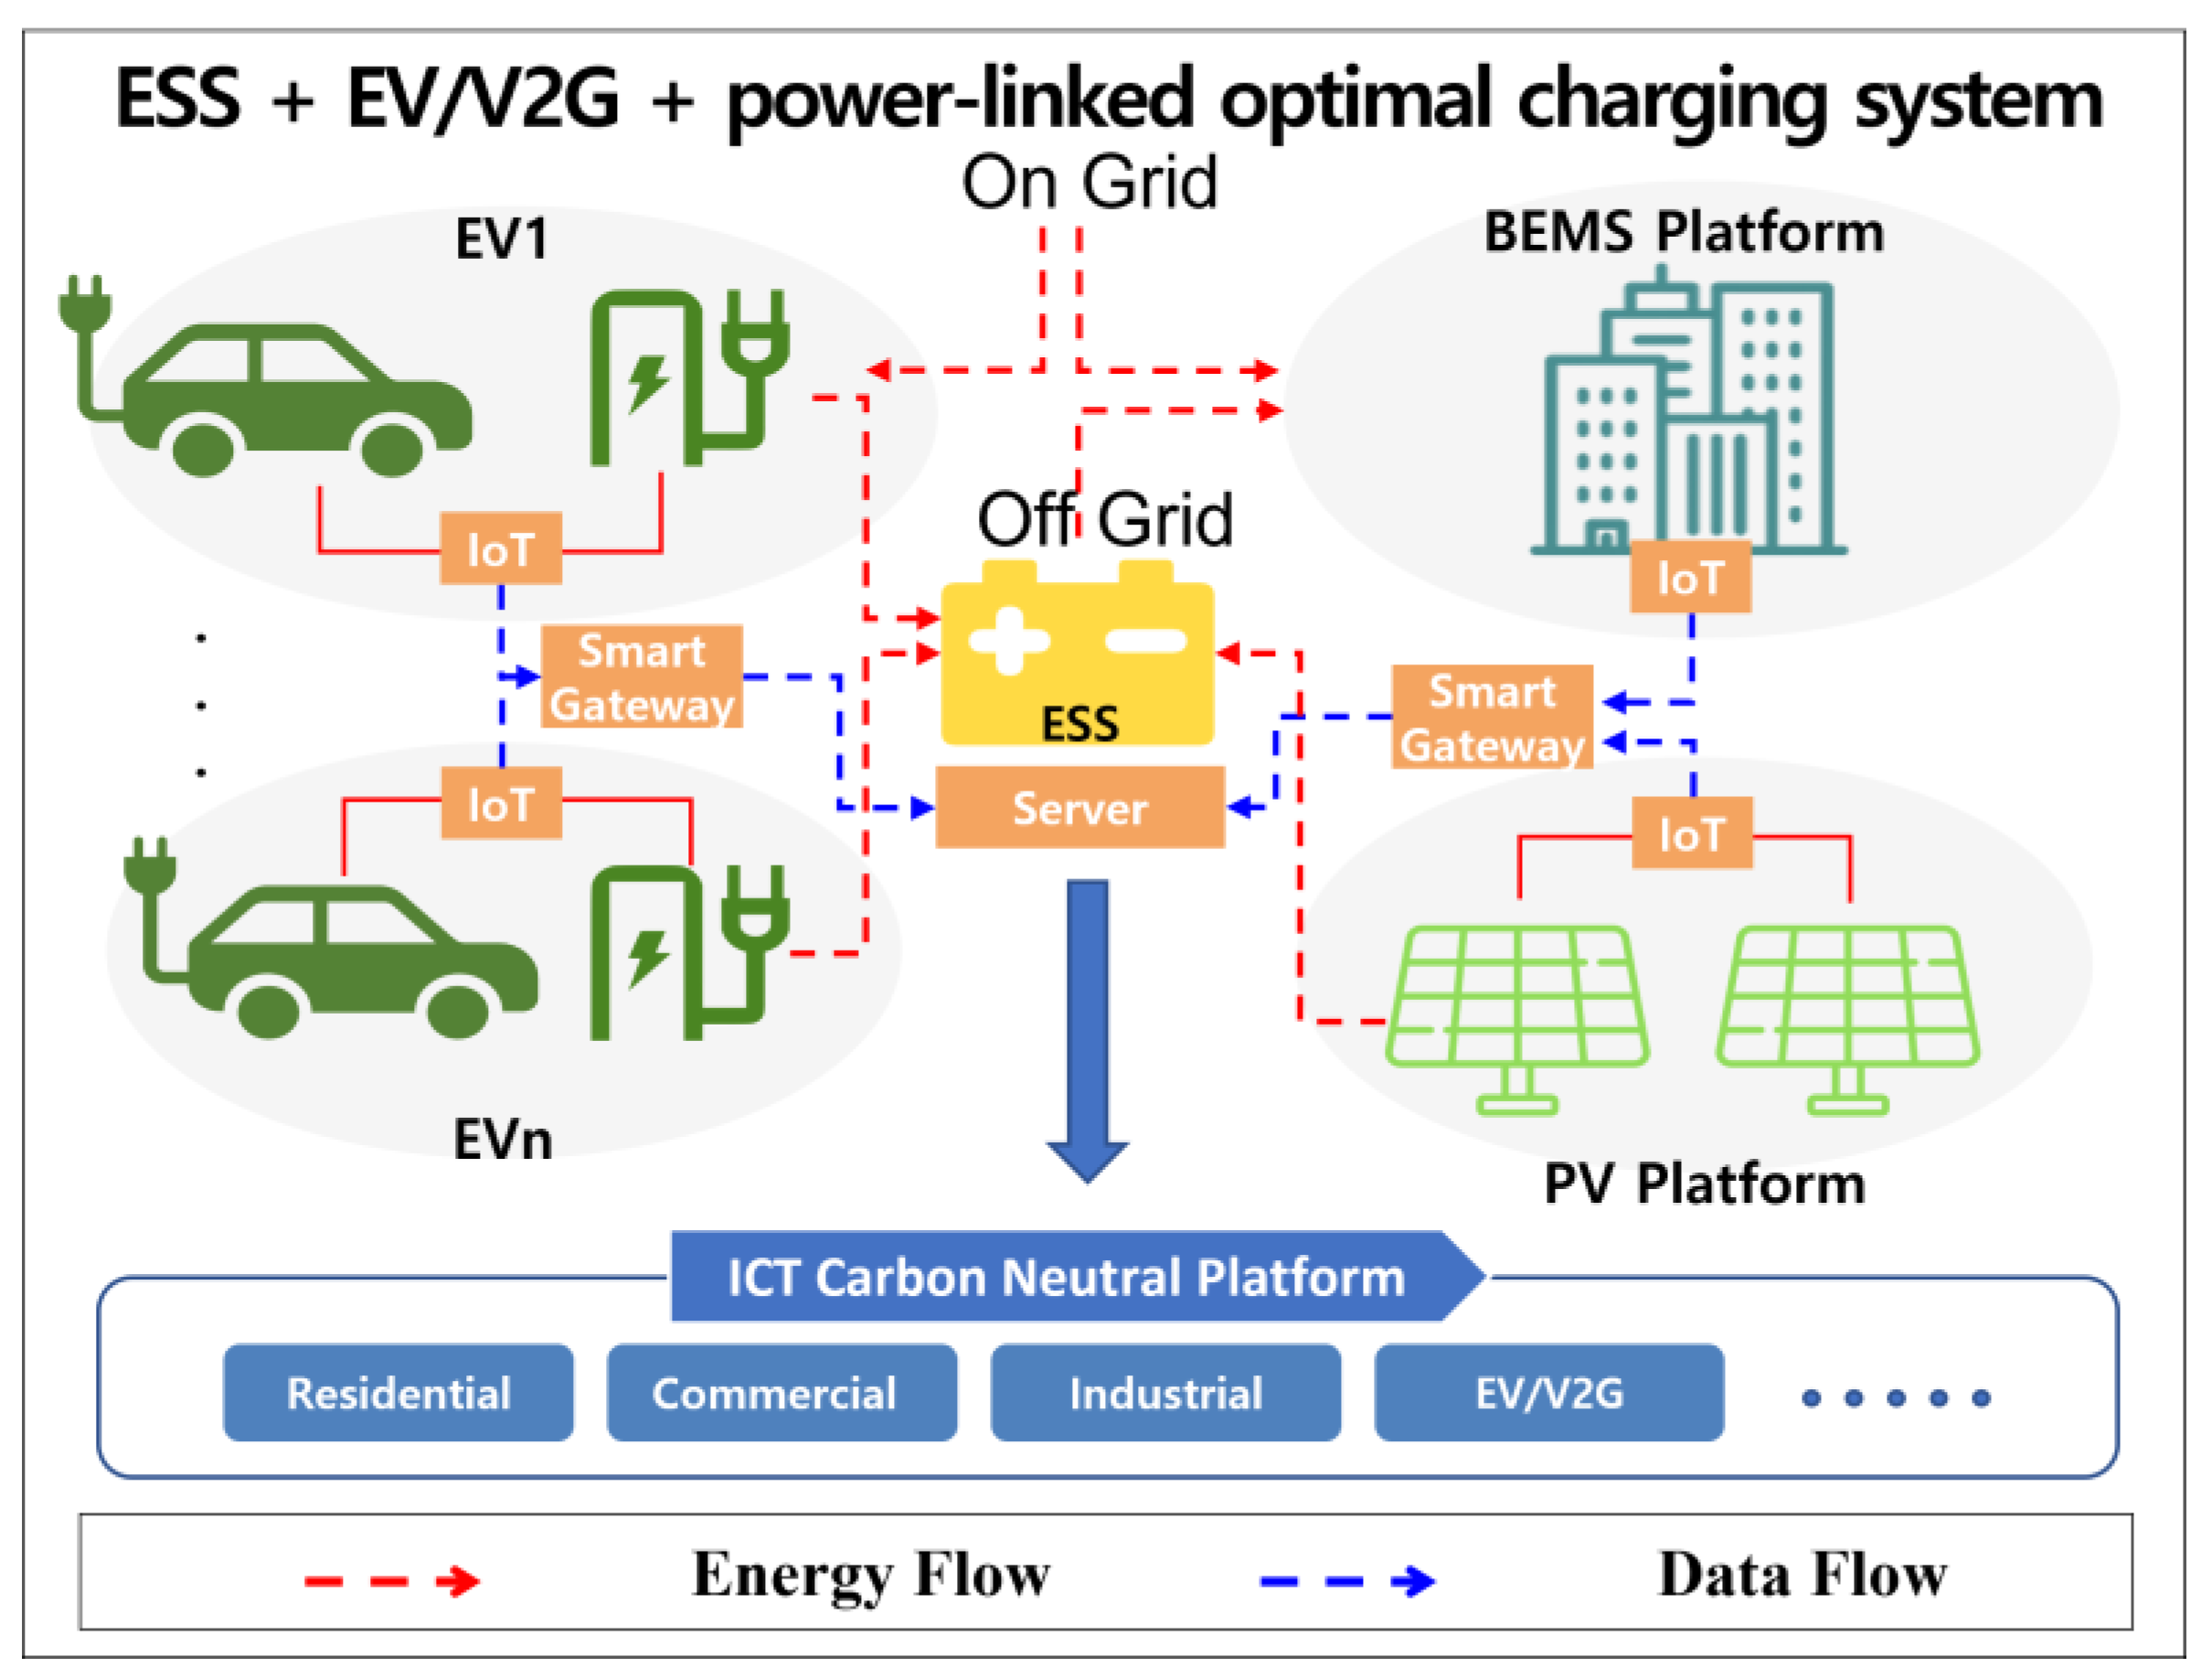
3.4. Construction of the EV/V2G Domain
3.5. Overall System Connection Diagram and Architecture
4. Methodology
4.1. Energy DR Management Methodology
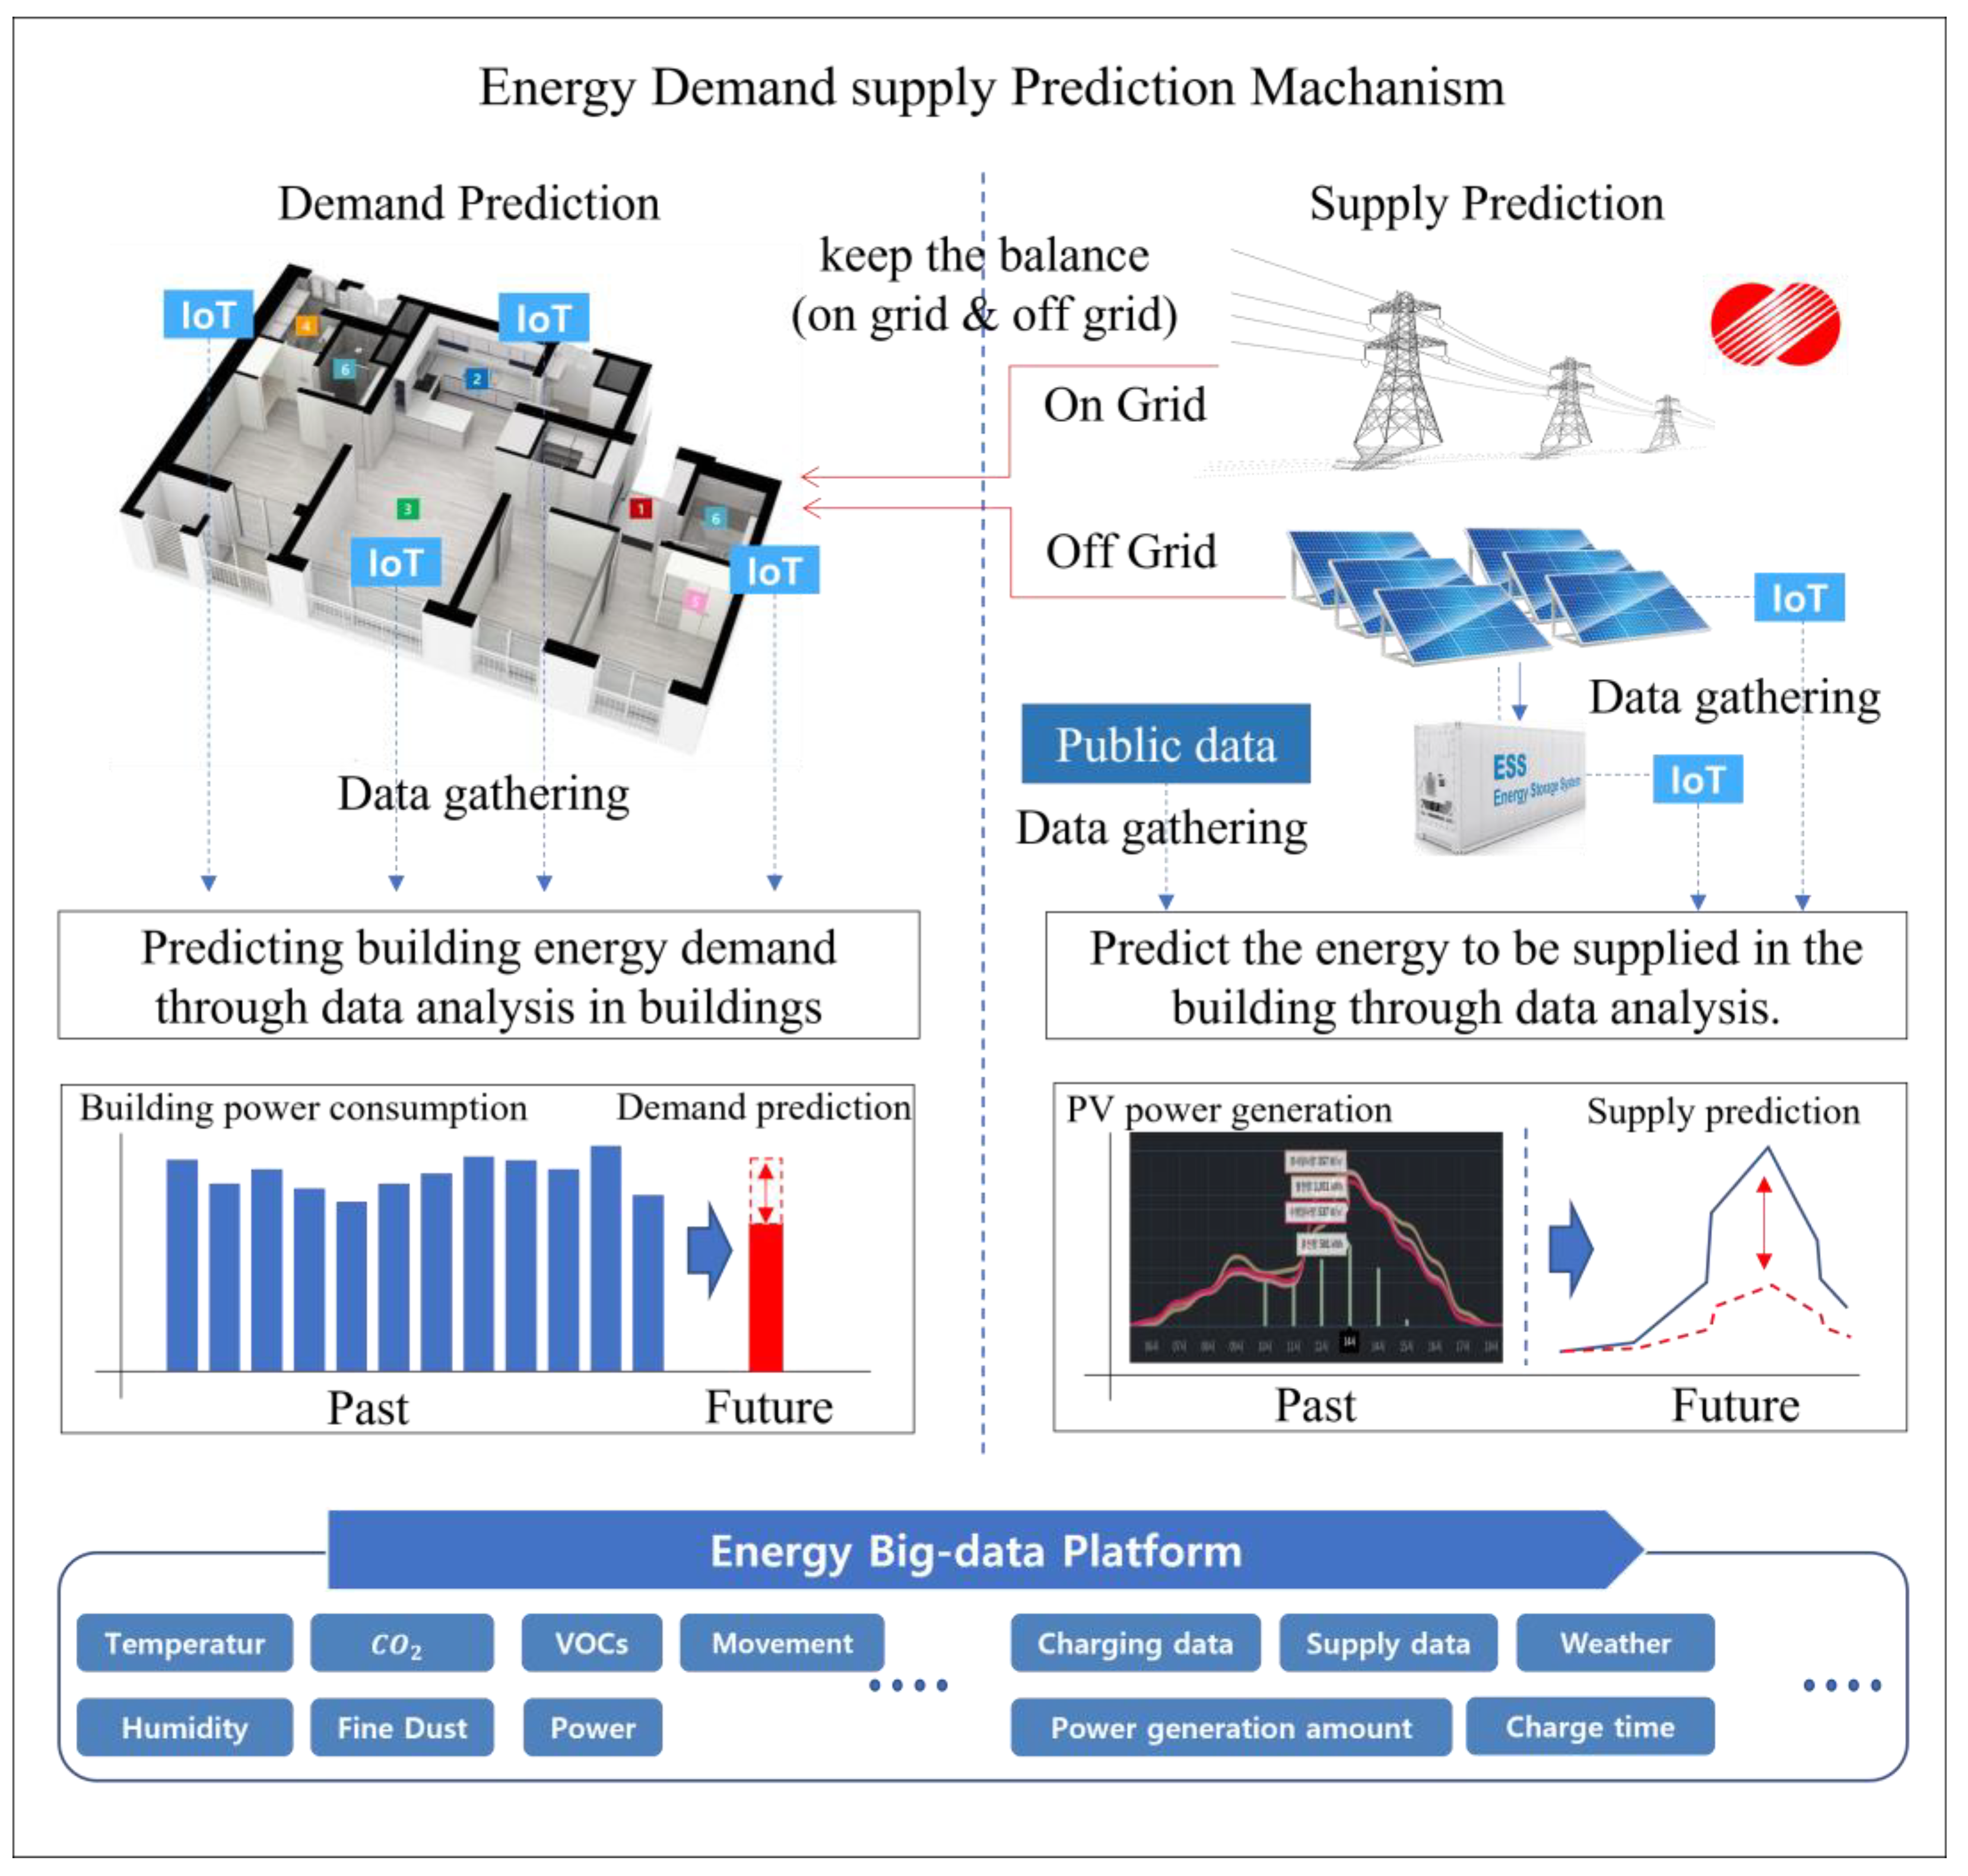
4.1.1. Demand Prediction
4.1.2. Supply Prediction
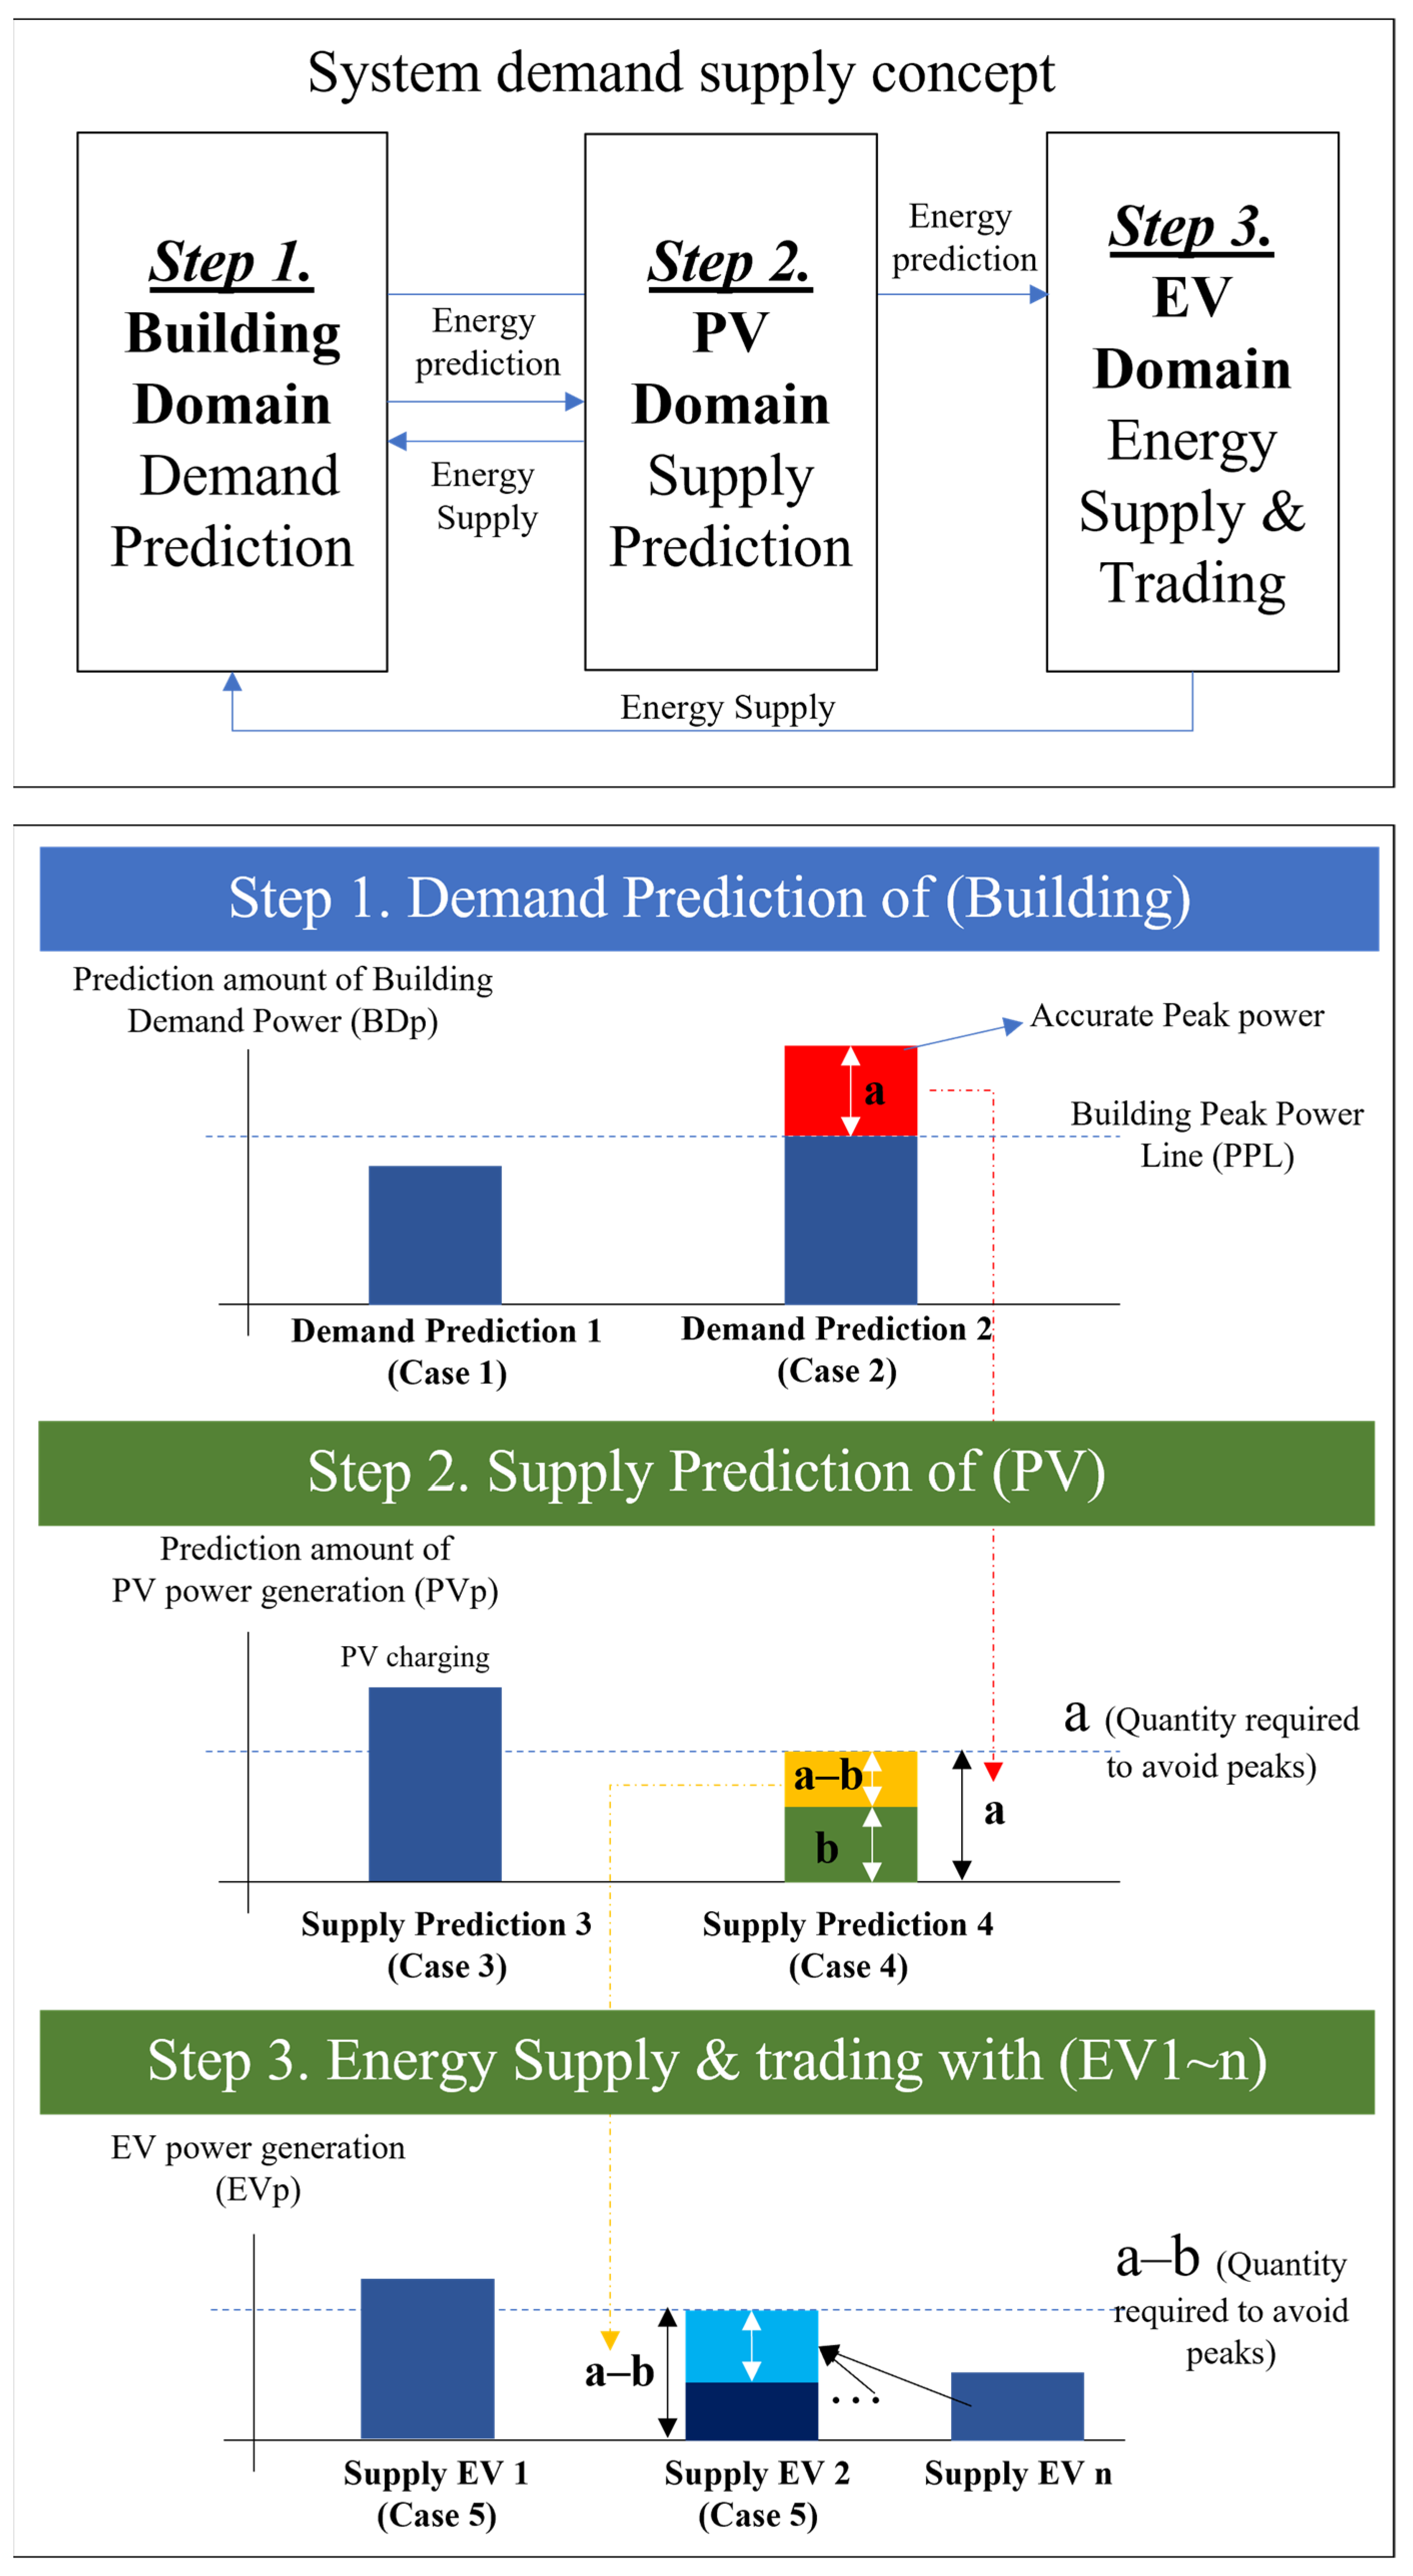
4.2. Three Steps to Avoid Building Peaks (BEMS, PV/ESS, and EV Demand–Supply Management)
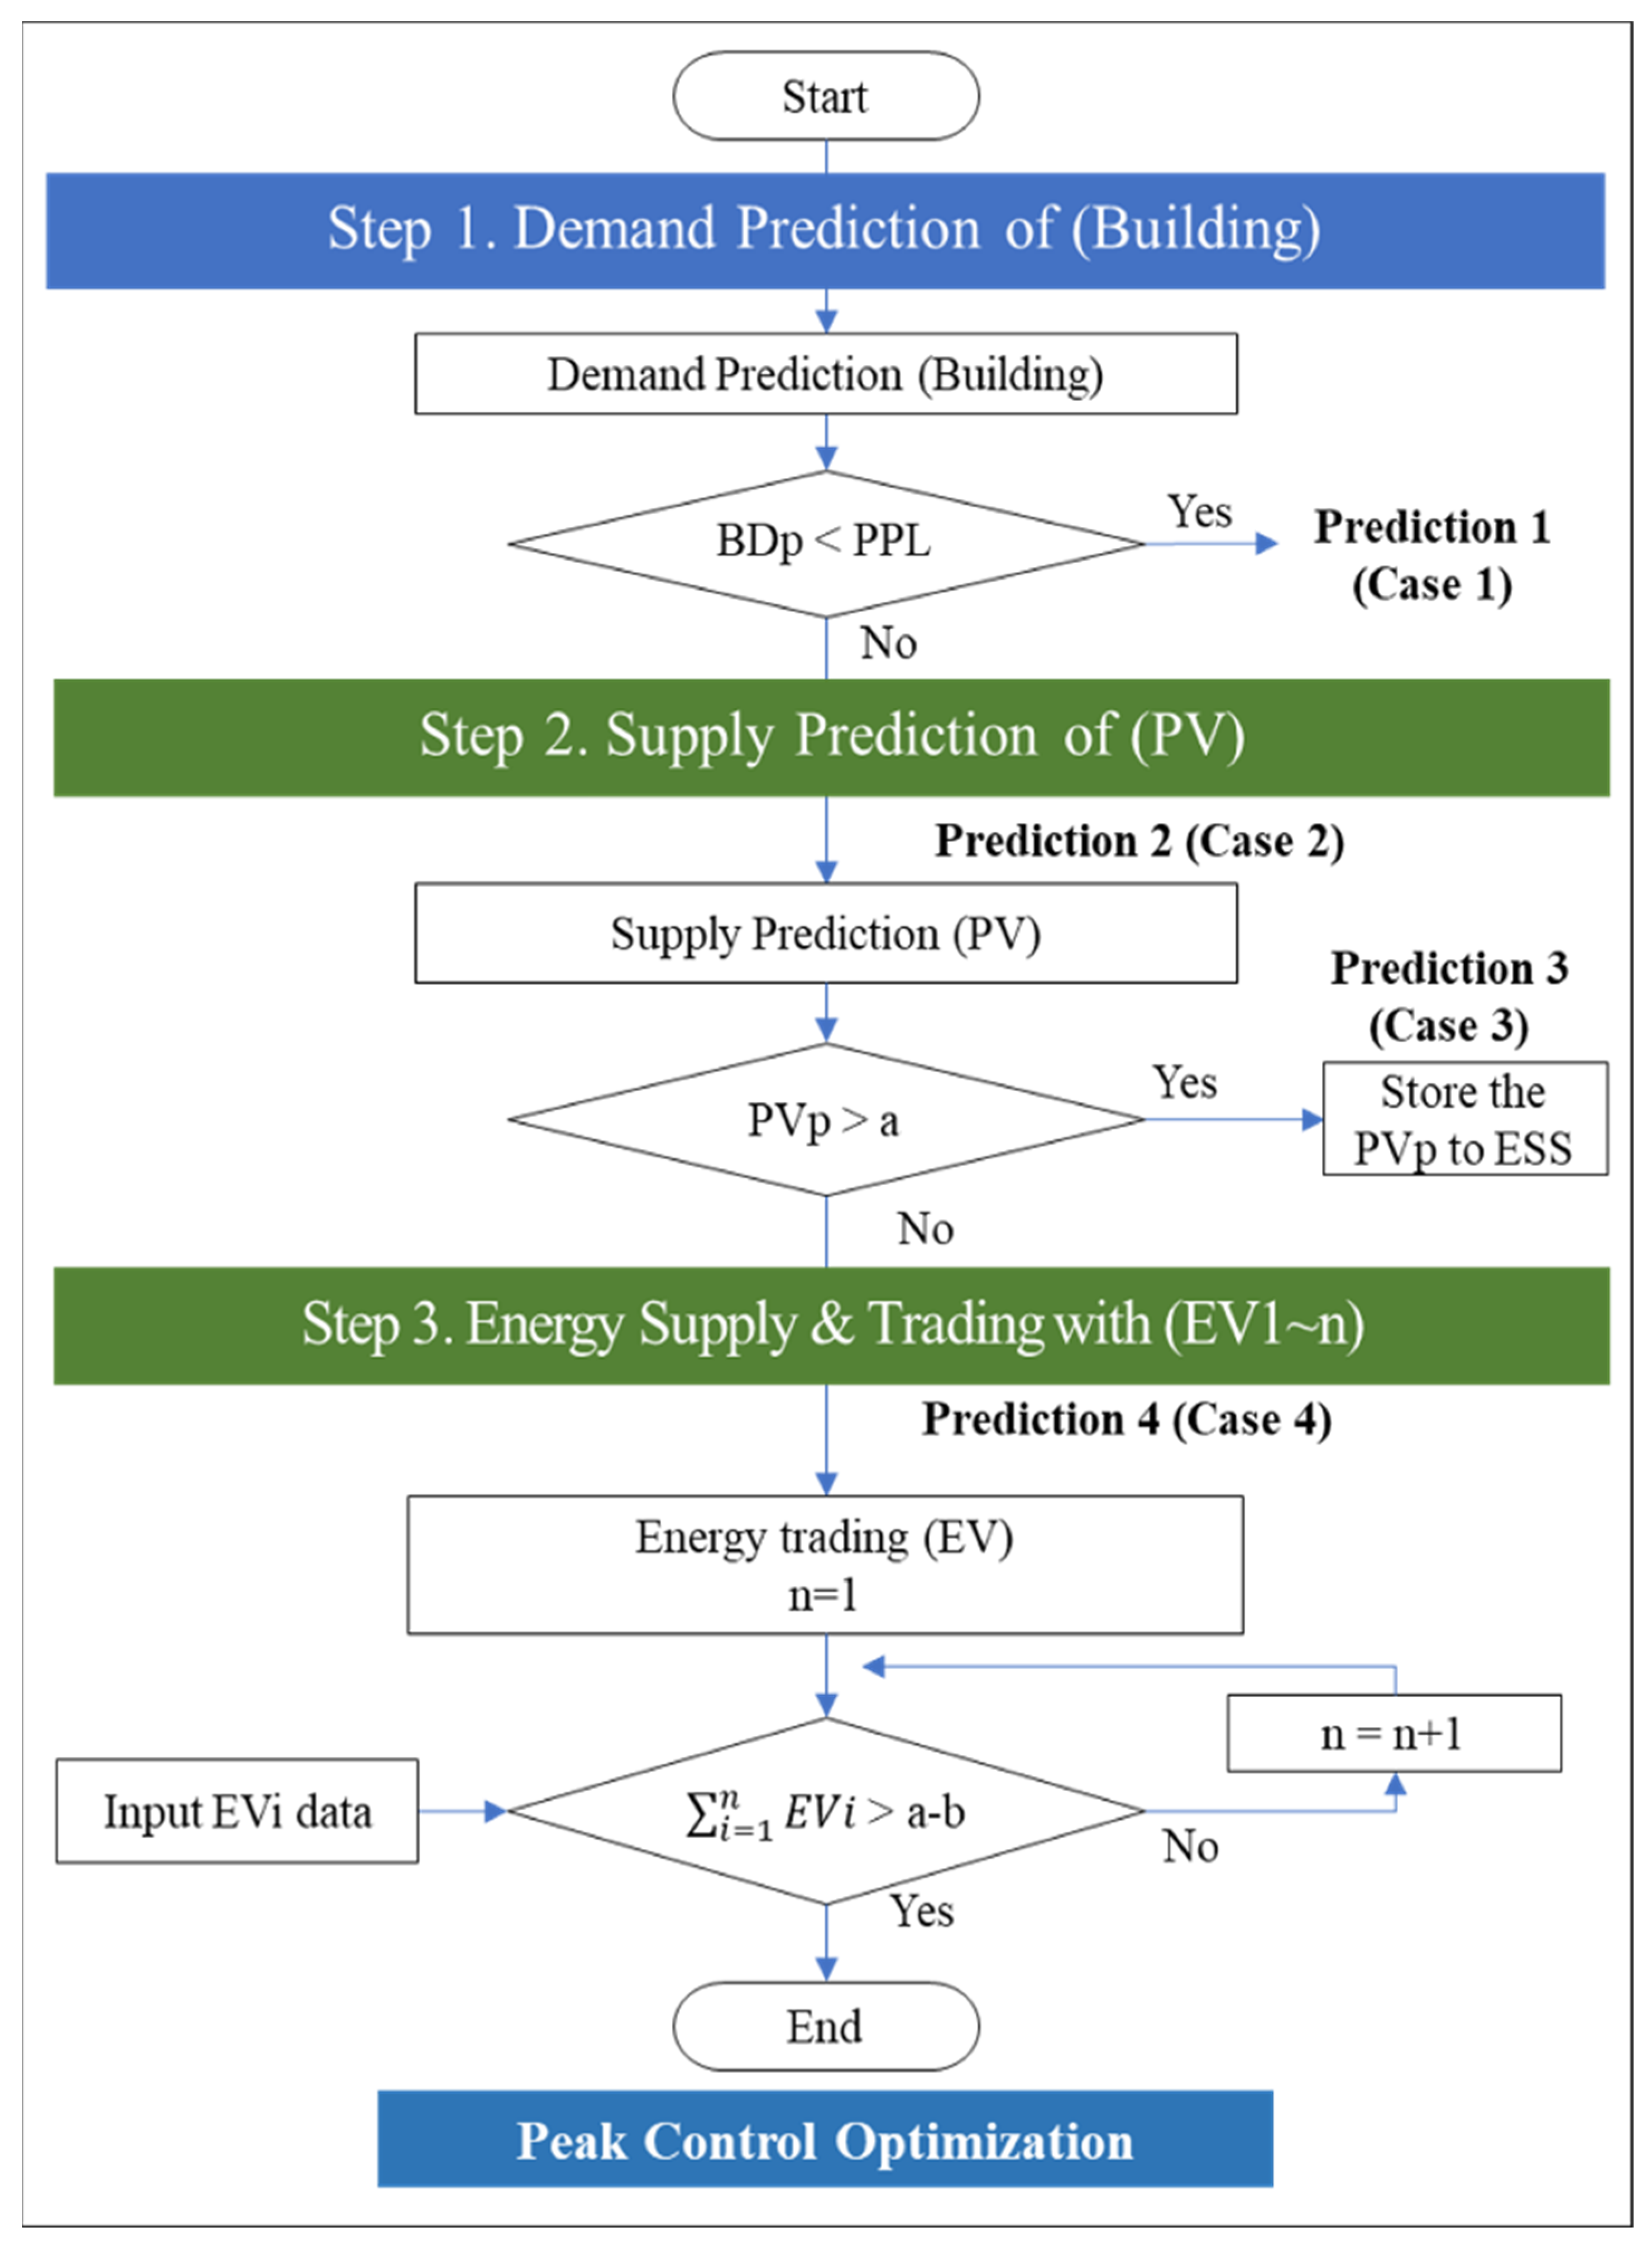
4.3. Platform Connection-Based Energy Management Algorithm
4.3.1. Step 1. Demand Prediction of the Building
4.3.2. Step 2. Supply Prediction of the PV and ESS
4.3.3. Step 3. Energy Supply and Trading with EV
5. Proposed System Scenarios
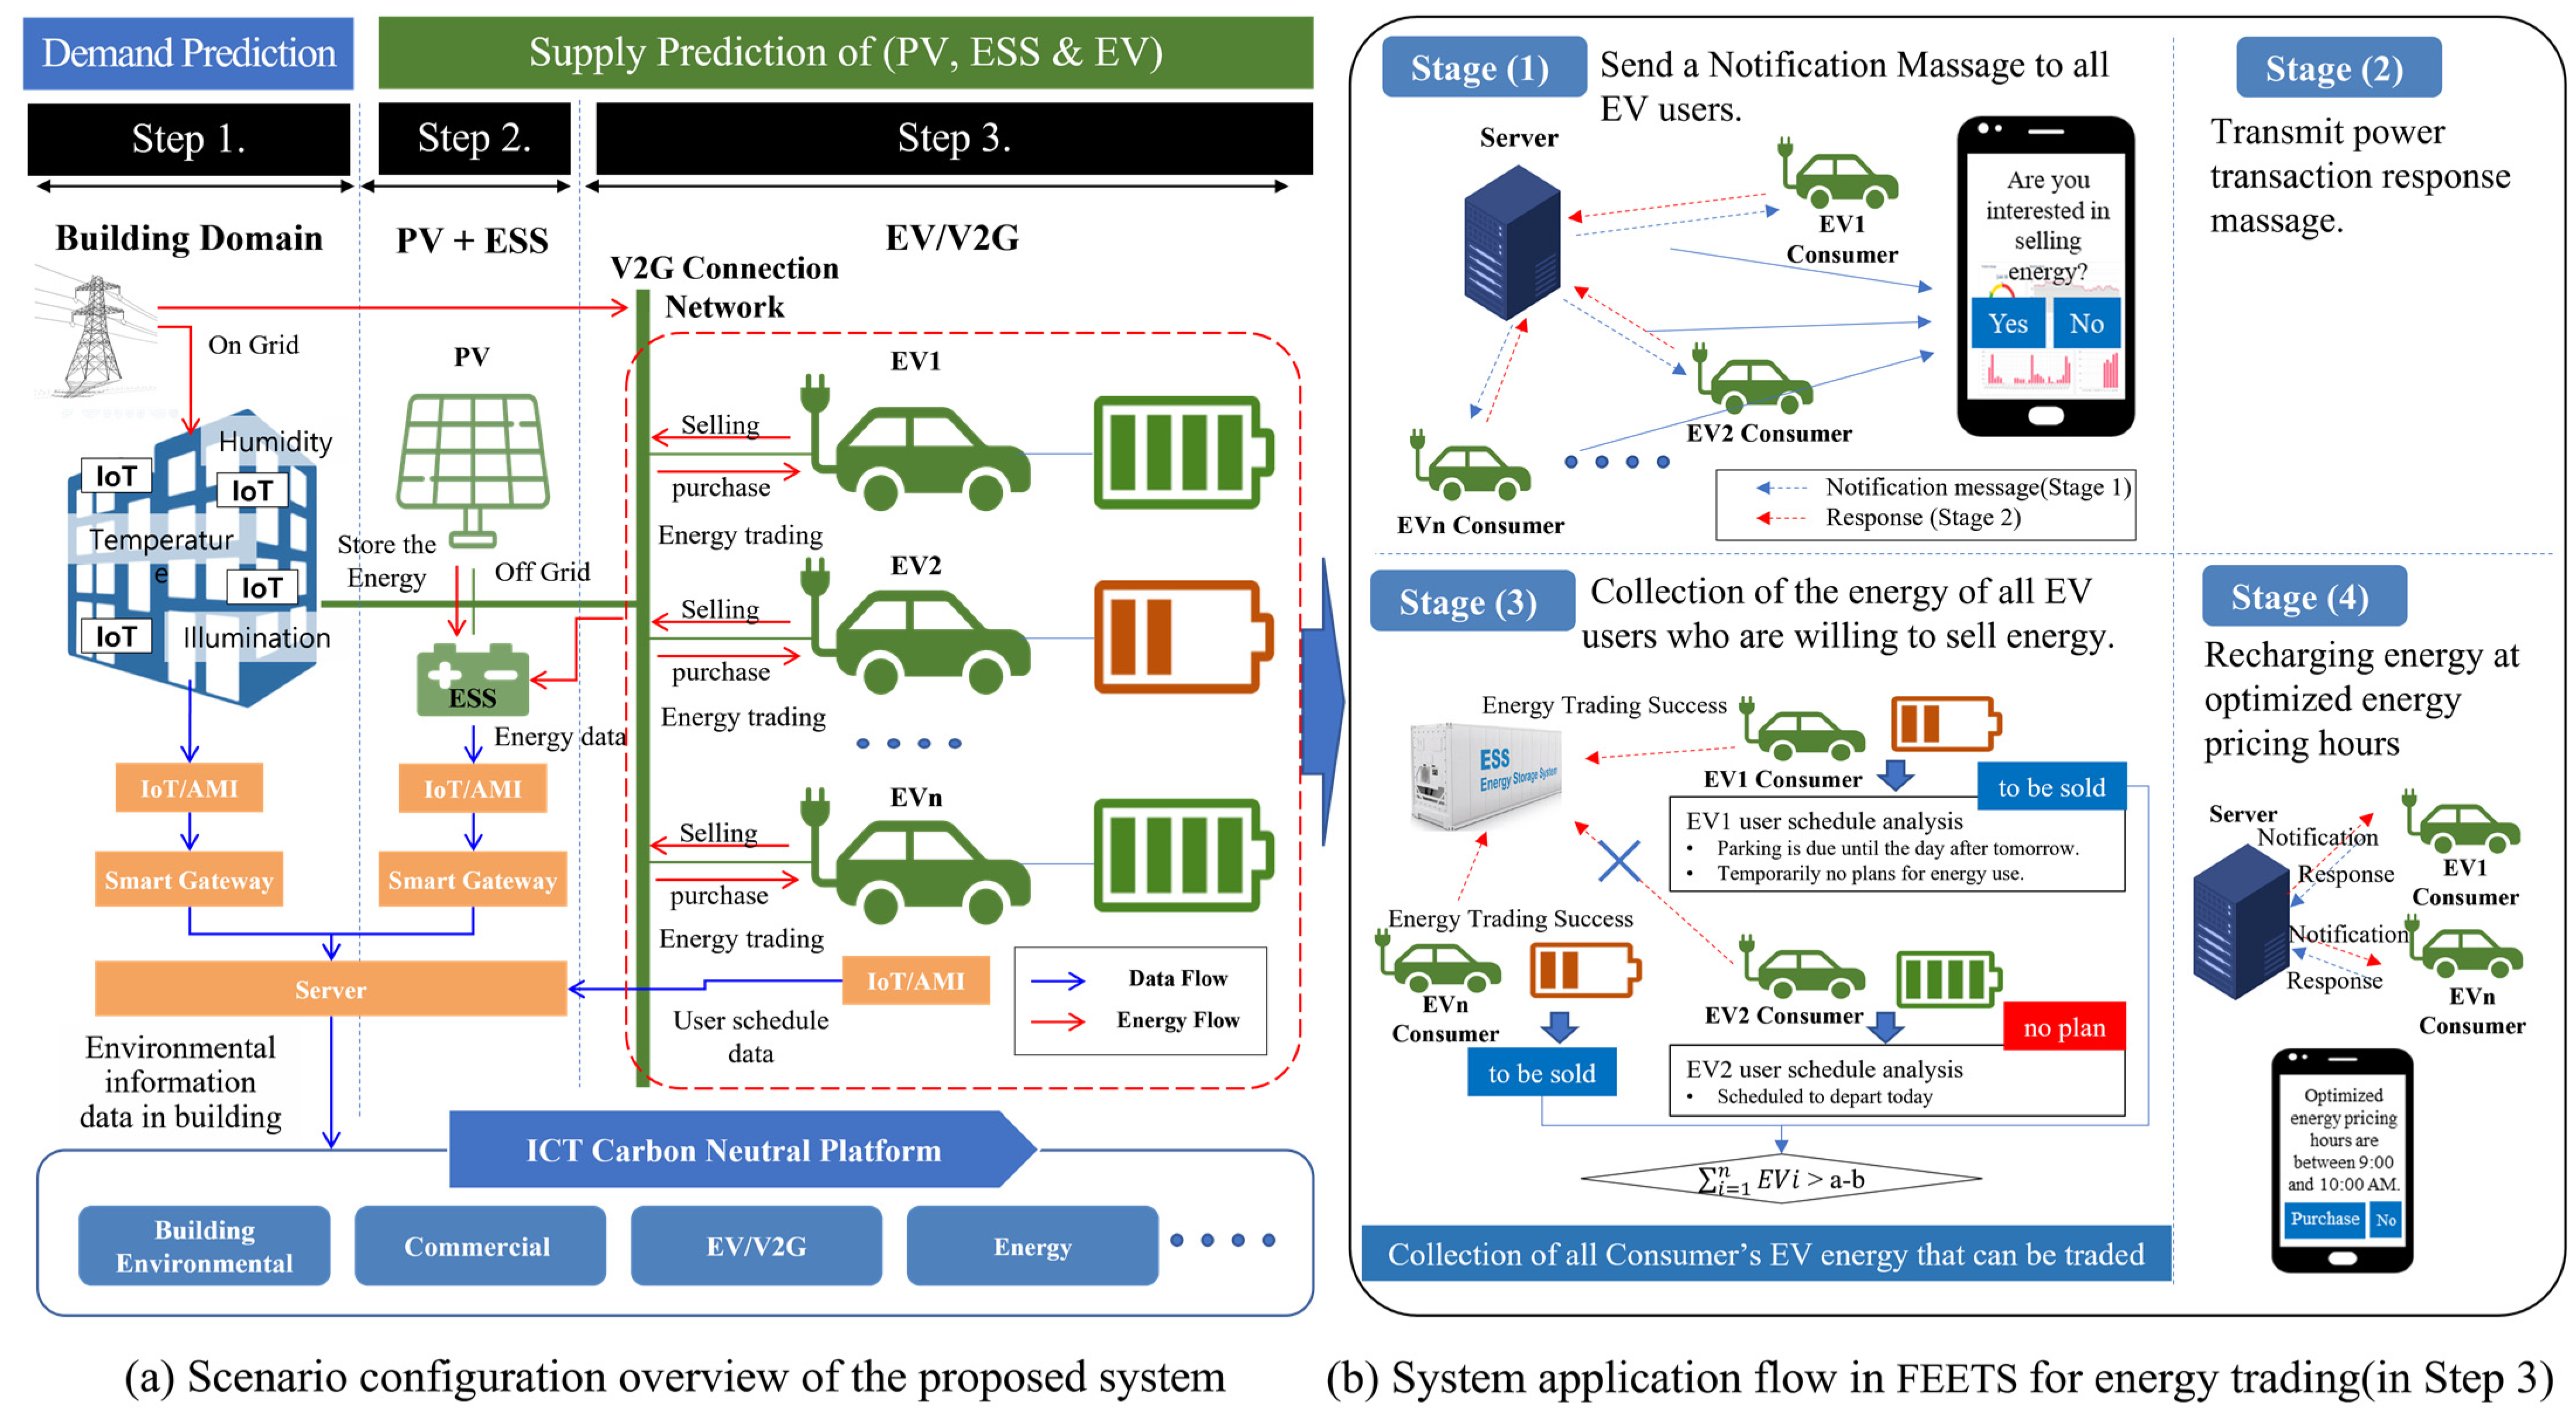
5.1. Step 1. Building Domain
5.2. Step 2. PV + ESS Domain
5.3. Step 3. EV Domain (FEETS_Energy Transaction)
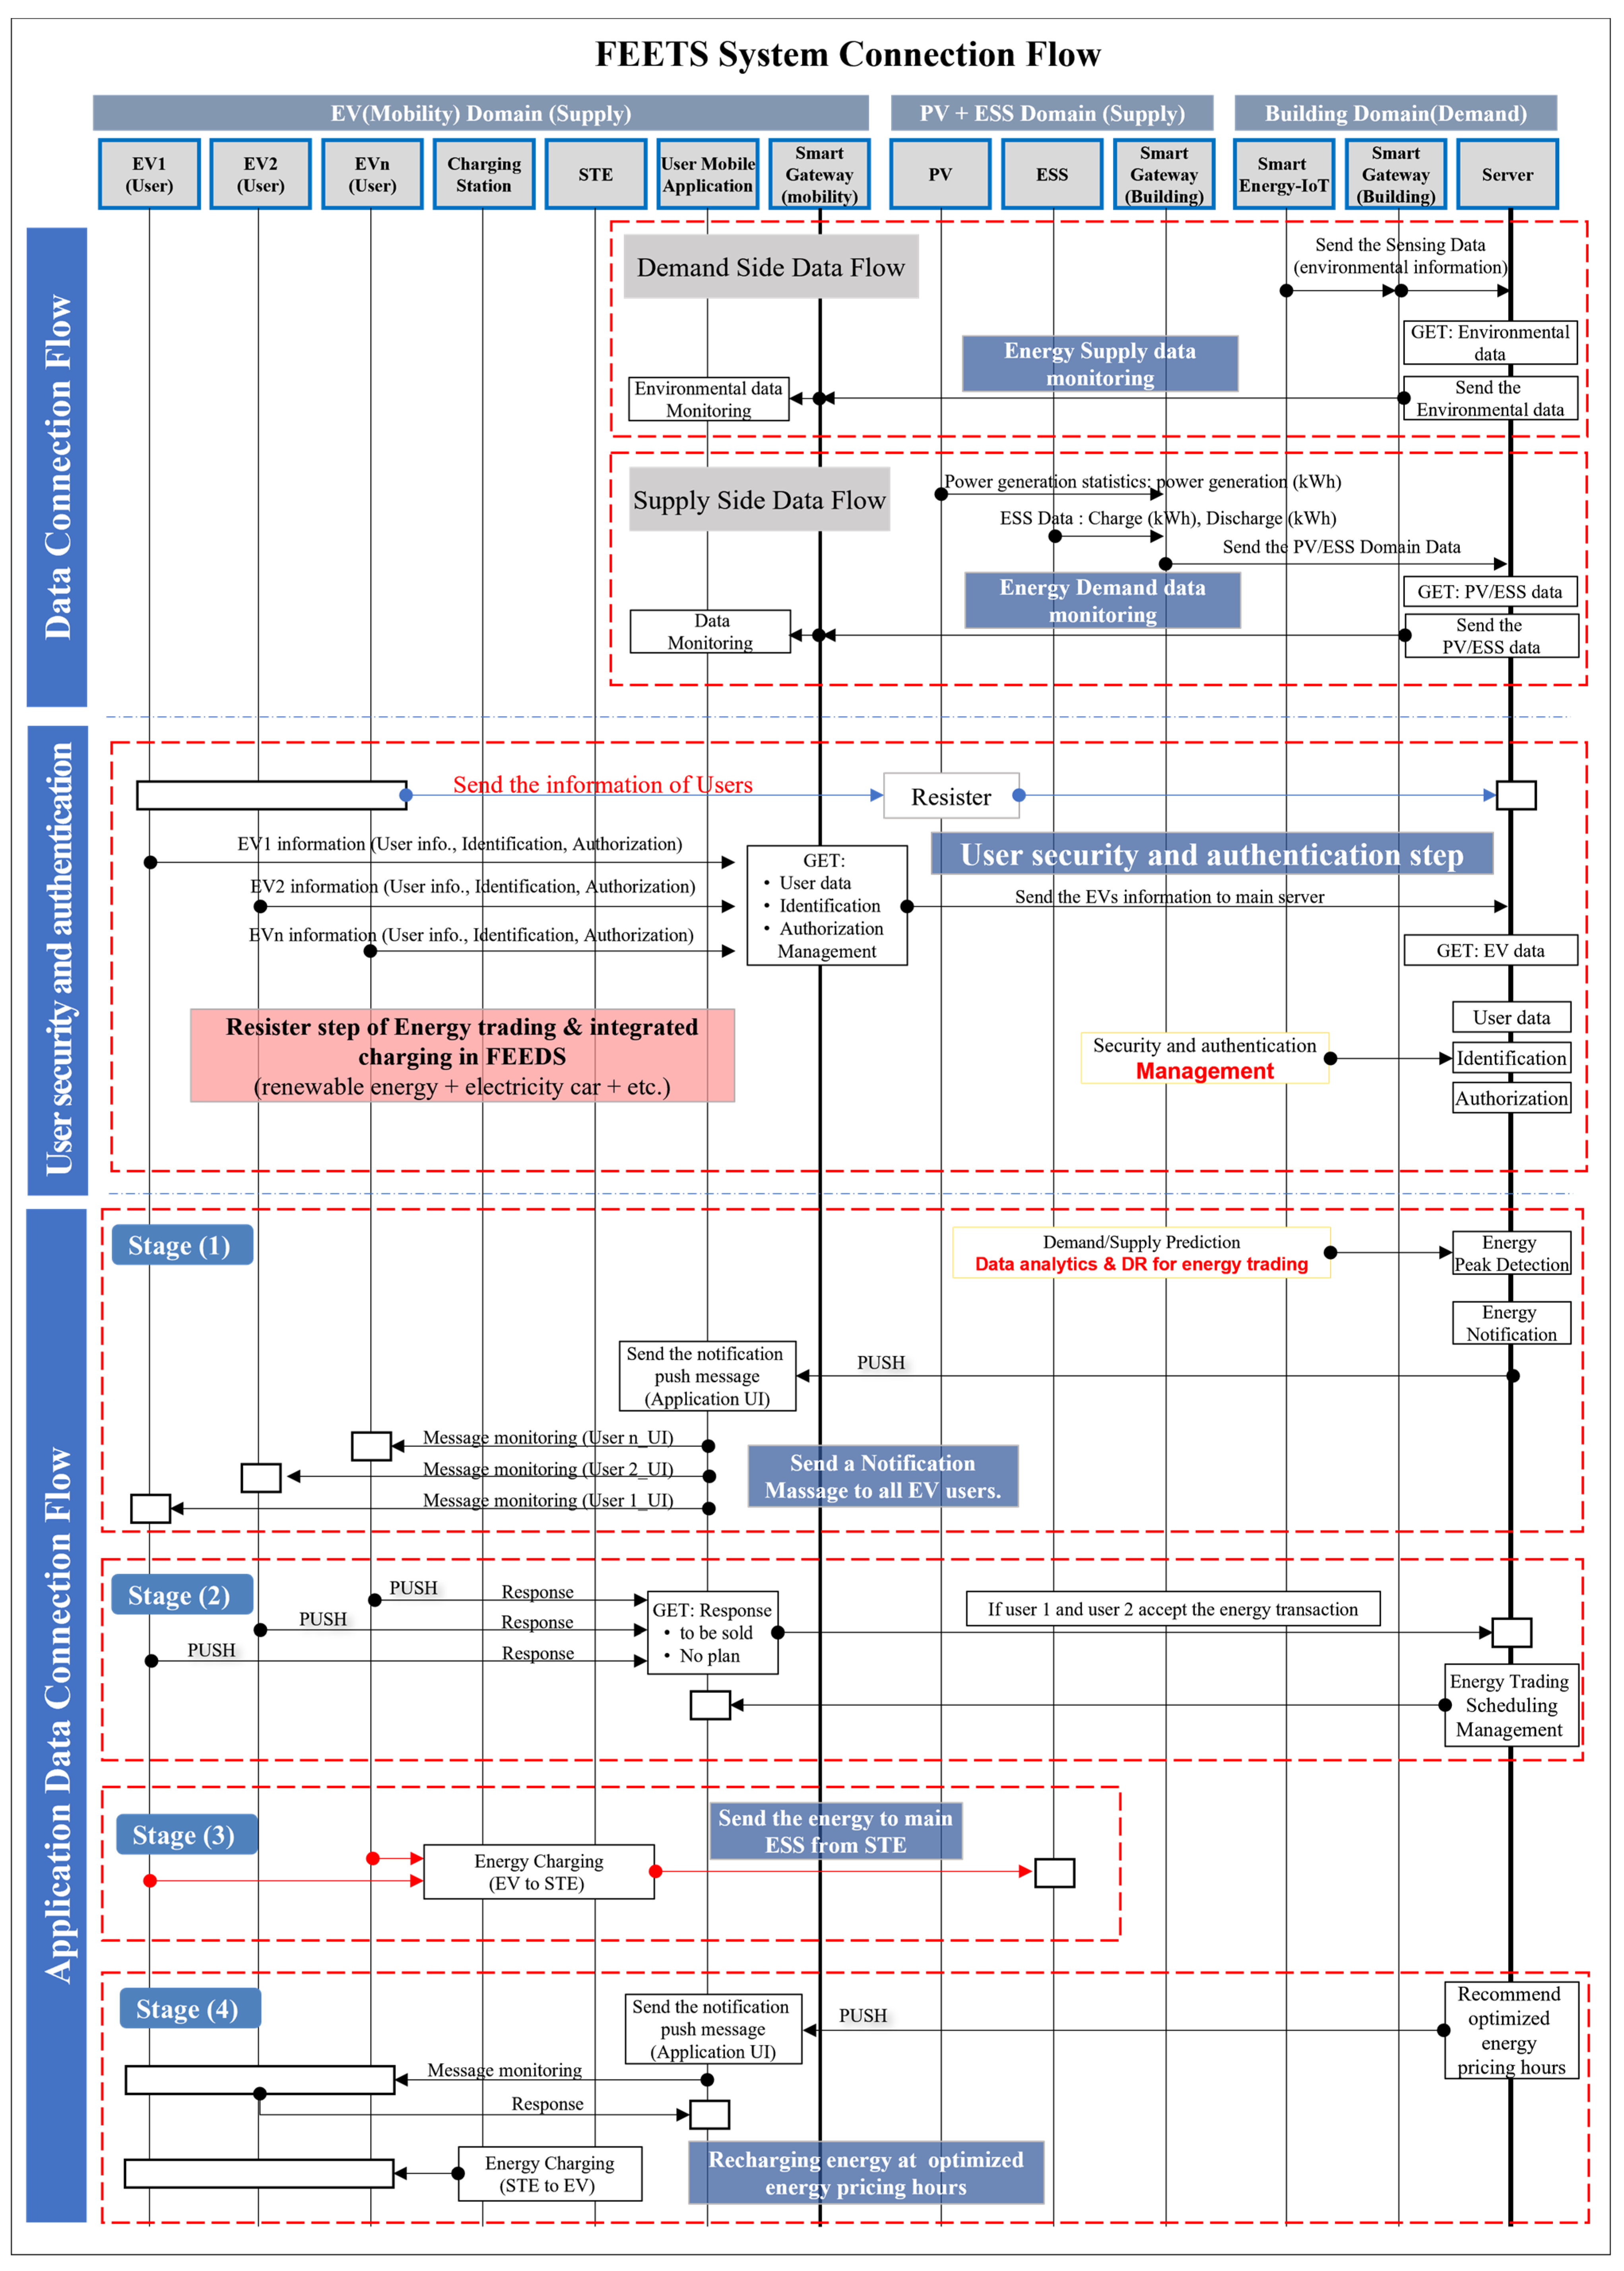
5.4. System Connection Process Based on the FEETS Overall Scenario
5.5. Business Model of FEETS
6. Business Analysis Simulation Based on a Scenario
6.1. Simulation Value Settings
6.2. BM Analysis Simulation Procedure Based on a Scenario
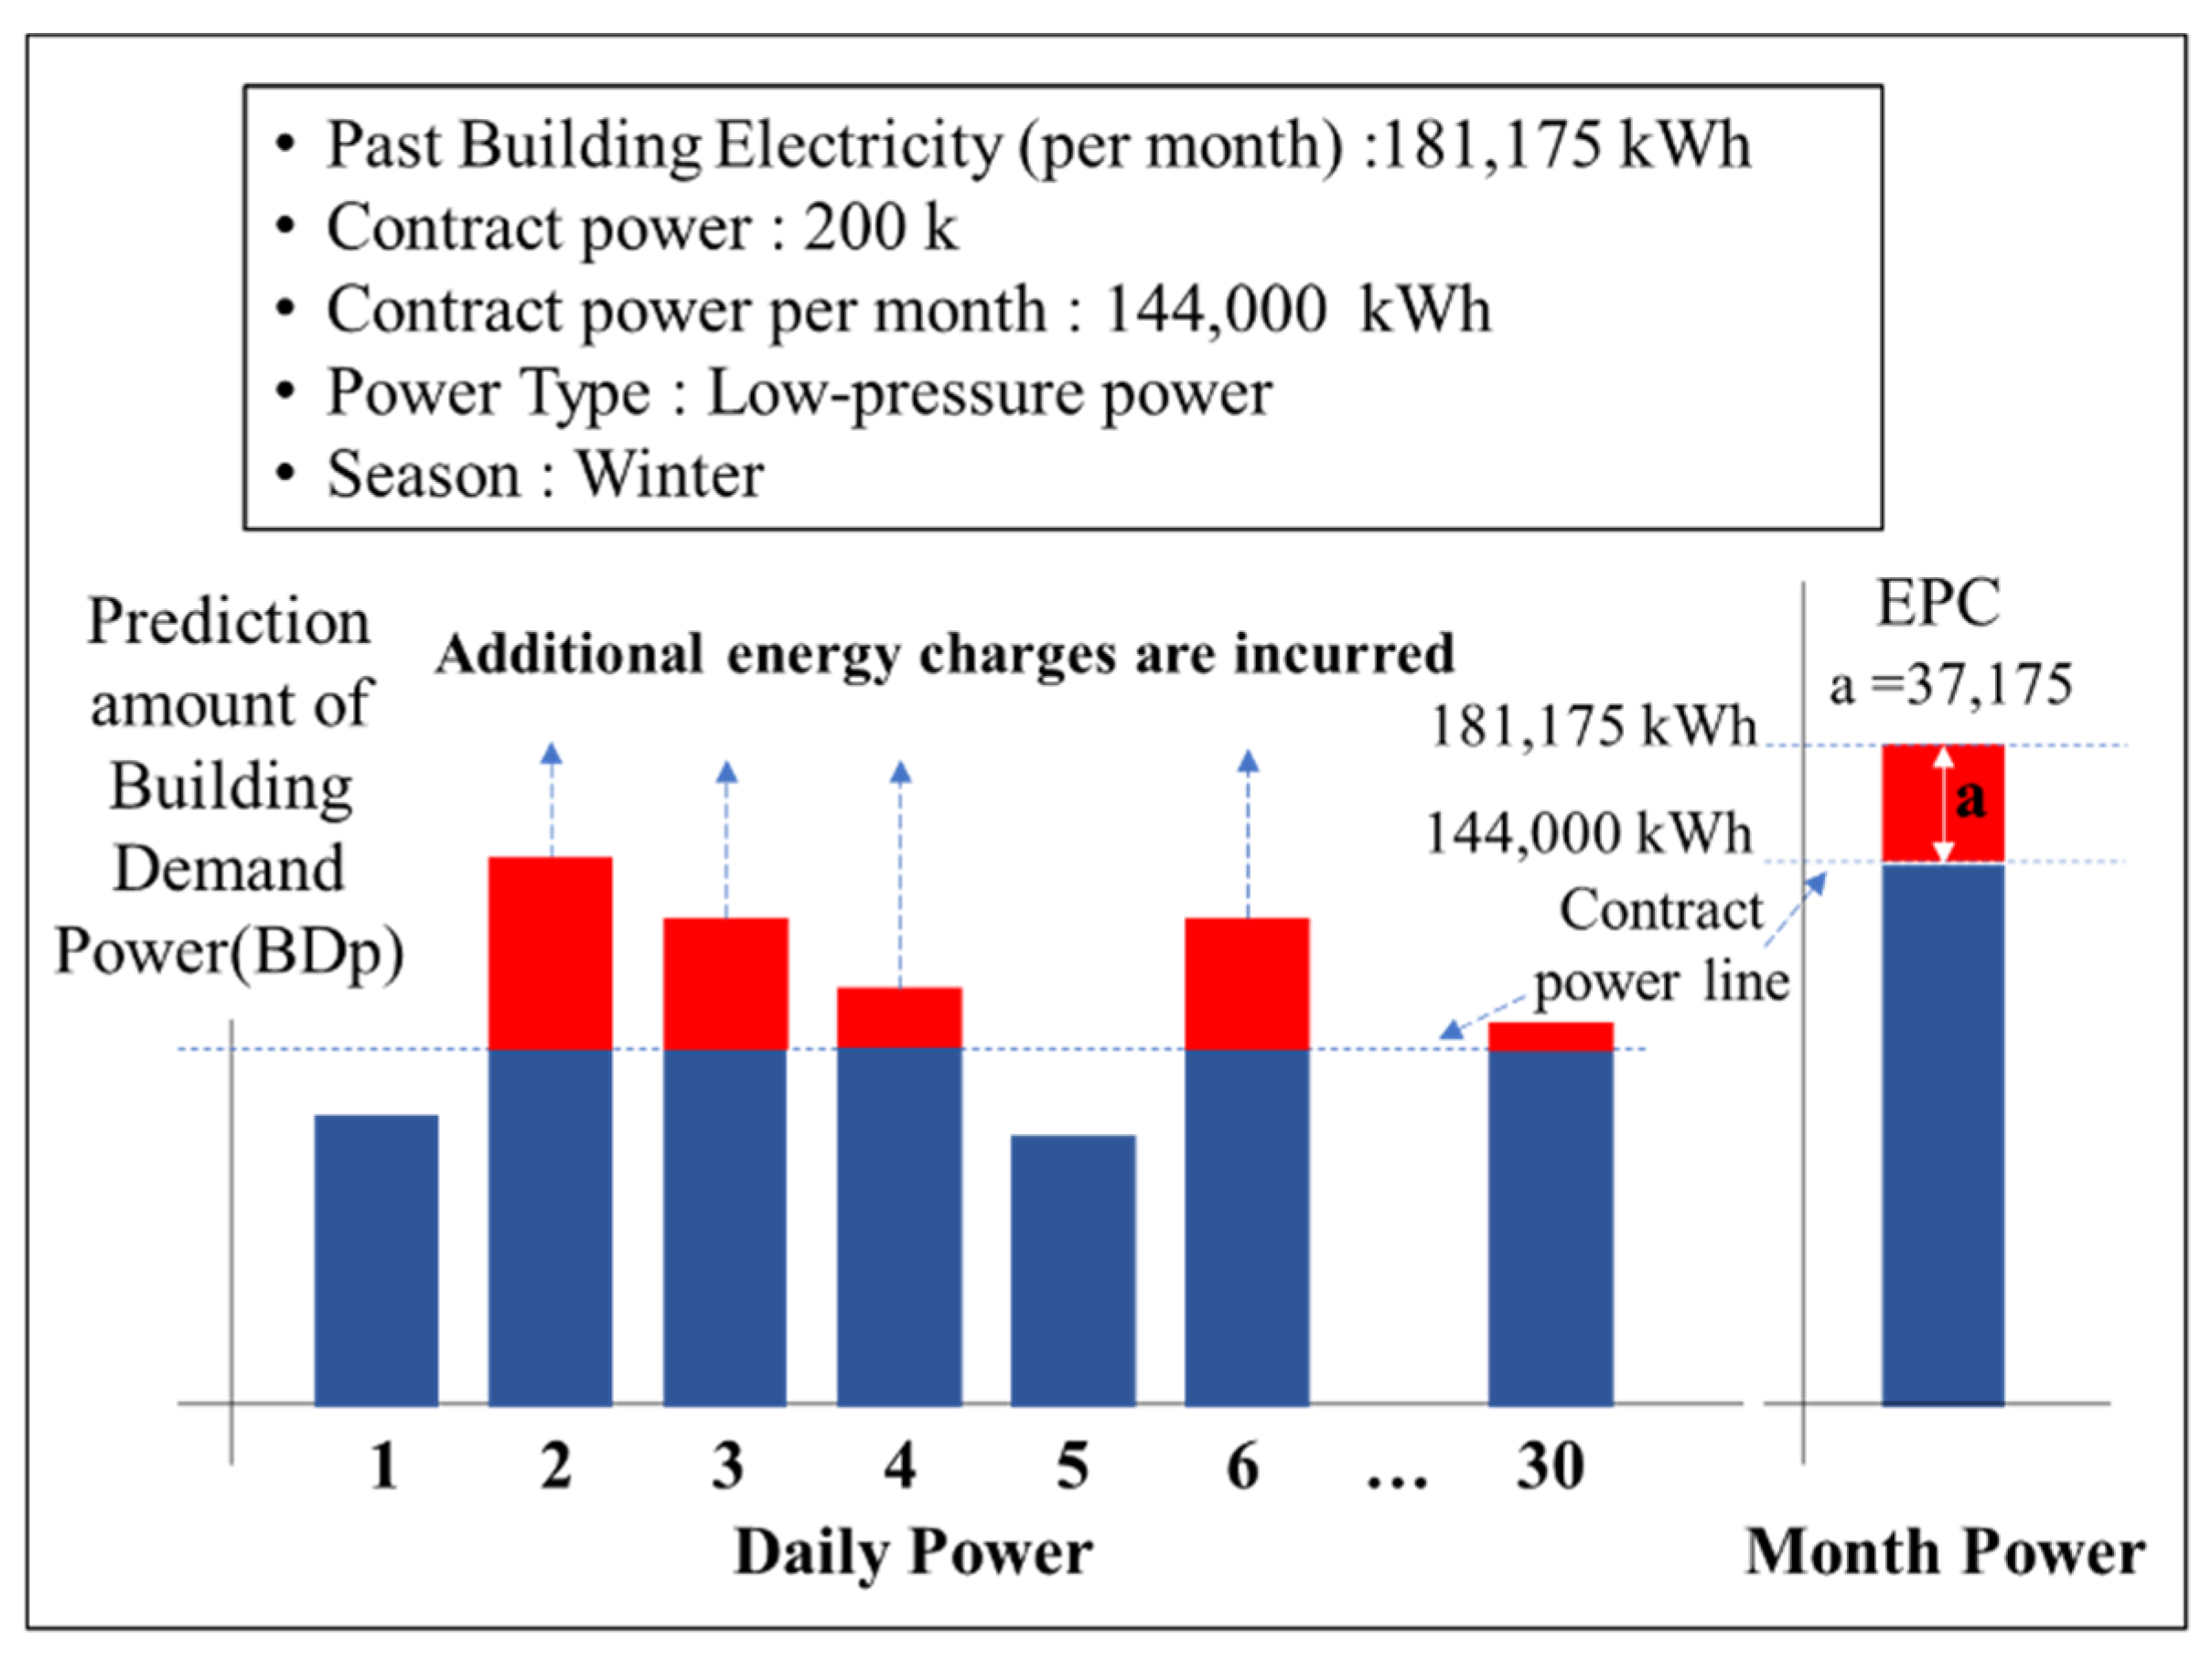
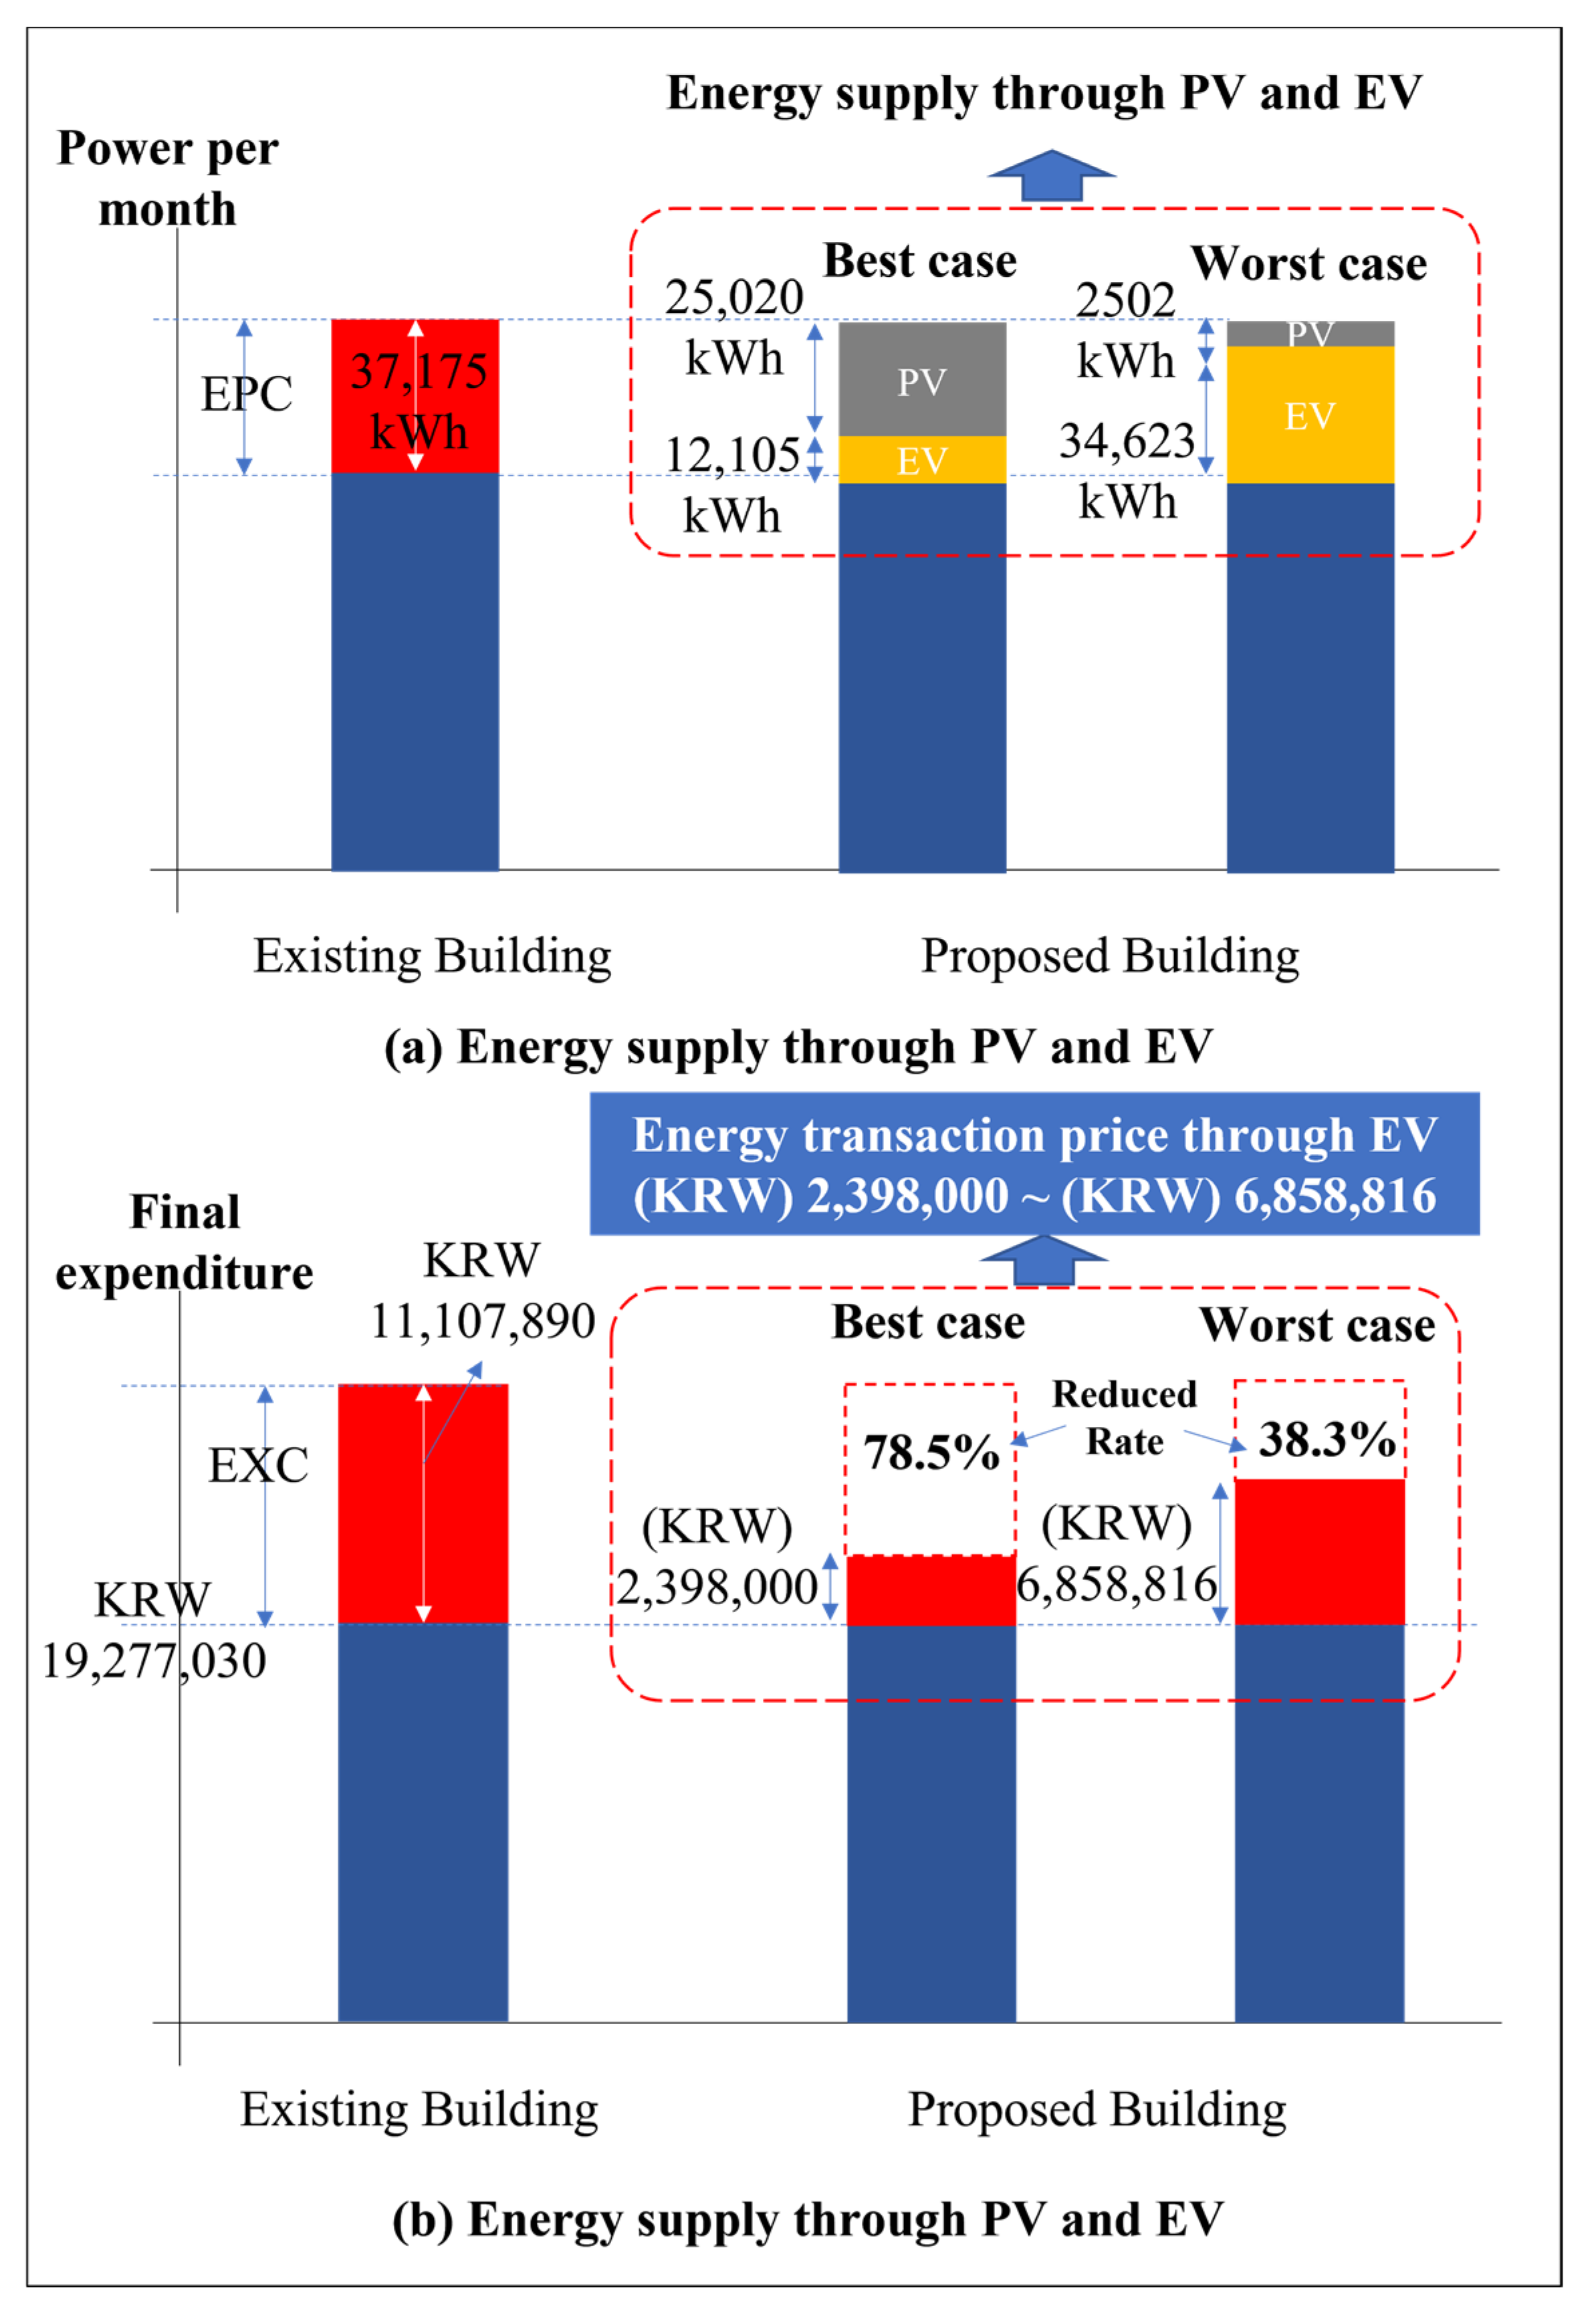
6.2.1. Existing Building Electricity Bill Simulation
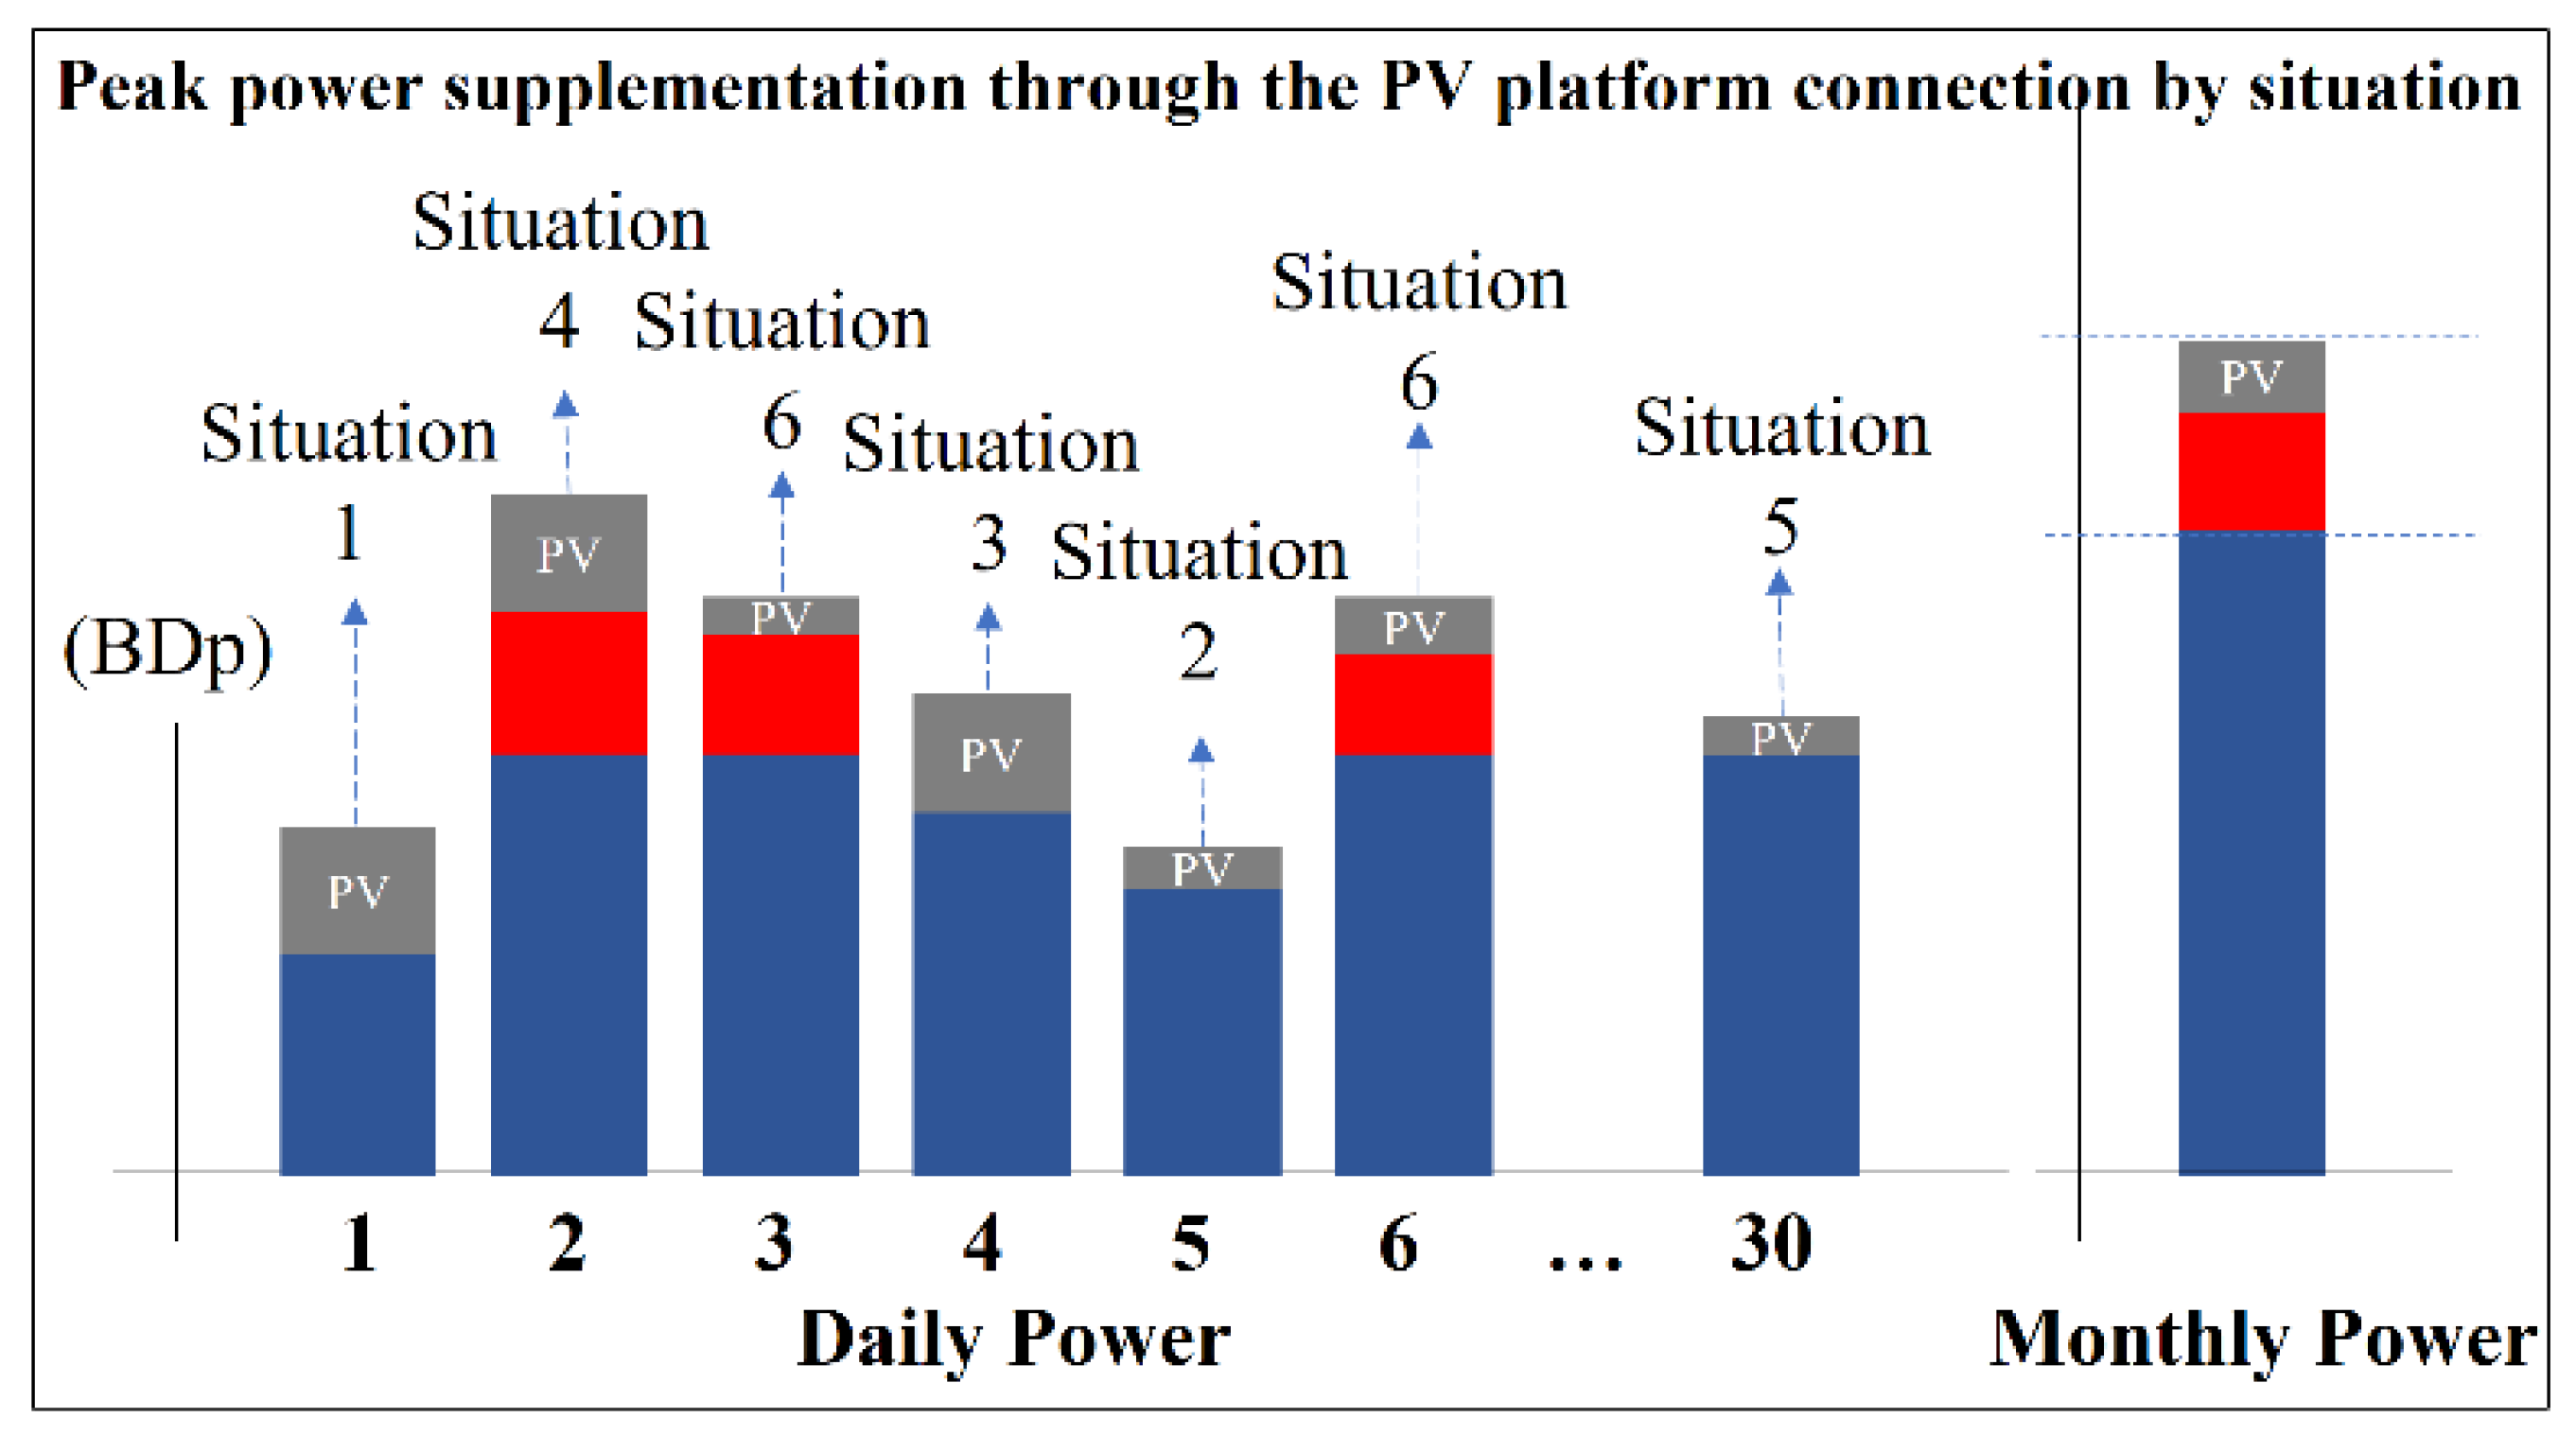
6.2.2. Proposed Building Application with a System Electricity Bill Simulation
- One day (10~14:00) production per PV panel (0.5 k): 3 k.
- Best-case PV generation amount per day (PVs): 834 kWh;
- Worst-case PV generation amount per day (PVc): 83.4 kWh (Set to 10% of PVs).
6.3. Business Model of FEETS and Future Platform Strategy
6.3.1. The Used Energy Trading Platform (UETP)
6.3.2. Importance of Small Platform Connection
7. Conclusions
Author Contributions
Funding
Data Availability Statement
Conflicts of Interest
References
- Asad, J.; Avleen, M.; Tuomas, K.; Kary, F. Scalable IoT Platform for Heterogeneous Devices in Smart Environments. IEEE Access 2020, 8, 211973–211985. [Google Scholar]
- Mosaddek Hossain Kamal, T.; Adel, W.Z.; Chadi, A. Demand-Side Management by Regulating Charging and Discharging of the EV, ESS, and Utilizing Renewable Energy. IEEE Trans. Ind. Inform. 2018, 14, 117–126. [Google Scholar]
- Im, H.; Kwon, P.S. Decarbonization scenarios for residential building sector in South Korea toward climate neutrality in 2050. Int. J. Sustain. Energy 2022, 41, 1888. [Google Scholar] [CrossRef]
- Jeong, K.; Ji, C.; Yeom, S.; Hong, T. Development of a greenhouse gas emissions benchmark considering building characteristics and national greenhouse emissions reduction target. Energy Build. 2022, 269, 112248. [Google Scholar] [CrossRef]
- Shin, H.-P.; Choi, J.-M. A Study on the Characteristics of Greenhouse Gas Emissions by Building Use—Based on Green Together data from 2018 to 2021. J. Archit. Inst. Korea 2022, 38, 237–246. [Google Scholar]
- Zheng, Y.; Tao, J.; Sun, Q.; Sun, H.; Chen, Z.; Sun, M. Deep reinforcement learning based active disturbance rejection load frequency control of multi-area interconnected power systems with renewable energy. J. Frankl. Inst. 2022. [Google Scholar] [CrossRef]
- Ghenai, C.; Ahmad, F.F.; Rejeb, O.; Bettayeb, M. Artificial neural networks for power output forecasting from bifacial solar PV system with enhanced building roof surface Albedo. J. Build. Eng. 2022, 56, 104799. [Google Scholar] [CrossRef]
- Xu, Y.; Wang, S.; Long, C. A Vehicle-to-vehicle Energy Trading Platform Using Double Auction With High Flexibility. In Proceedings of the 2021 IEEE PES Innovative Smart Grid Technologies Europe (ISGT Europe), Espoo, Finland, 18–21 October 2021; pp. 1–5. [Google Scholar]
- Li, J.; Ye, Y.; Strbac, G. Stabilizing peer-to-peer energy trading in prosumer coalition through computational efficient pricing. Electr. Power Syst. Res. 2020, 189, 106764. [Google Scholar] [CrossRef]
- Tehreem, N.; Safdar, R.; Muhammad, A.; Hafiz Abdul, M.; Harun, J.; Faiza, Q.; Omar, C.; Fawaz, A.; Habib, H. Optimal Scheduling of Campus Microgrid Considering the Electric Vehicle Integration in Smart Grid. Sensors 2021, 21, 7133. [Google Scholar]
- Zexin, Y.; Xueliang, H.; Shan, G.; Qi, Z.; Hongen, D.; Tian, G.; Dongyu, M.; Rui, Y. Operation Strategy of Parking Lots Integrated with PV and Considering Energy Price Tags. World Electr. Veh. J. 2021, 12, 205. [Google Scholar]
- Thomas, D.; Deblecker, O.; Ioakimidis, C.S. Optimal operation of an energy management system for a grid-connected smart building considering photovoltaics’ uncertainty and stochastic electric vehicles’ driving schedule. Appl. Energy 2018, 210, 1188. [Google Scholar] [CrossRef]
- Mohammad, A.; Zuhaib, M.; Ashraf, I.; Sarwar, A.; Alsultan, M.; Ahmad, S.; Abdollahian, M. Integration of electric vehicles and energy storage system in home energy management system with home to grid capability. Energies 2021, 14, 8557. [Google Scholar] [CrossRef]
- Leon Fidele Nishimwe, H.; Sung-Guk, Y. Combined Optimal Planning and Operation of a Fast EV-Charging Station Integrated with Solar PV and ESS. Energies 2021, 14, 3152. [Google Scholar] [CrossRef]
- Kalpesh, C.; Abhisek, U.; Kumar, K.N.; Ujjal, M.; Sathish Kumar, K. Hybrid Optimization for Economic Deployment of ESS in PV-Integrated EV Charging Stations. IEEE Trans. Ind. Inform. 2018, 14, 106–116. [Google Scholar]
- Min, W.; Modawy Adam Ali, A. Optimal Energy Scheduling Based on Jaya Algorithm for Integration of Vehicle-to-Home and Energy Storage System with Photovoltaic Generation in Smart Home. Sensors 2022, 22, 1306. [Google Scholar]
- Kyung-Sang, R.; Dae-Jin, K.; Heesang, K.; Chang-Jin, B.; Jongrae, K.; Young-Gyu, J.; Ho-Chan, K. MPC Based Energy Management System for Hosting Capacity of PVs and Customer Load with EV in Stand-Alone Microgrids. Energies 2021, 14, 4041. [Google Scholar]
- García-Vázquez, C.A.; Espinoza-Ortega, H.; Llorens-Iborra, F.; Fernández-Ramírez, L.M. Feasibility analysis of a hybrid renewable energy system with vehicle-to-home operations for a house in off-grid and grid-connected applications. Sustain. Cities Soc. 2022, 86, 104124. [Google Scholar] [CrossRef]
- Zhaoxi, L.; Qiuwei, W.; Mohammad, S.; Canbing, L.; Shaojun, H.; Wei, W. Transactive Real-Time Electric Vehicle Charging Management for Commercial Buildings With PV On-Site Generation. IEEE Trans. Smart Grid 2019, 10, 4939–4950. [Google Scholar]
- Park, S.; Lee, S.; Park, S.; Park, S. AI-Based Physical and Virtual Platform with 5-Layered Architecture for Sustainable Smart Energy City Development. Sustainability 2019, 11, 4479. [Google Scholar] [CrossRef] [Green Version]
- Kim, H.; Choi, H.; Kang, H.; An, J.; Yeom, S.; Hong, T. A systematic review of the smart energy conservation system: From smart homes to sustainable smart cities. Renew. Sustain. Energy Rev. 2021, 140, 110755. [Google Scholar] [CrossRef]
- Plageras, A.P.; Psannis, K.E.; Stergiou, C.; Wang, H.; Gupta, B.B. Efficient IoT-based sensor BIG Data collection–processing and analysis in smart buildings. Future Gener. Comput. Syst. 2018, 82, 349–357. [Google Scholar] [CrossRef]
- Talebkhah, M.; Sali, A.; Marjani, M.; Gordan, M.; Hashim, S.J.; Rokhani, F.Z. IoT and Big Data Applications in Smart Cities: Recent Advances, Challenges, and Critical Issues. IEEE Access 2021, 9, 55465–55484. [Google Scholar] [CrossRef]
- Park, S.; Park, S.; Choi, M.I.; Lee, S.; Lee, T.; Kim, S.; Cho, K.; Park, S. Reinforcement learning-based bems architecture for energy usage optimization. Sensors 2020, 20, 4918. [Google Scholar] [CrossRef]
- Sangmin, P.; Sang-Uk, P.; Jinsung, B.; Yeong, Y.; Sehyun, P. Design of Building Energy Autonomous Control System with the Intelligent Object Energy Chain Mechanism Based on Energy-IoT. Int. J. Distrib. Sens. Netw. 2015, 11, 1–9. [Google Scholar]
- Park, S.; Park, S.; Park, S.; Cho, K.; Kim, S.; Yoon, G.; Choi, M.I. Distributed energy IoT-based real-time virtual energy prosumer business model for distributed power resource. Sensors 2021, 21, 4533. [Google Scholar] [CrossRef] [PubMed]
- Tamer, T.; Dino, I.G.; Akgul, C.M. Data-driven, long-term prediction of building performance under climate change: Building energy demand and BIPV energy generation analysis across Turkey. Renew. Sustain. Energy Rev. 2022, 162, 112396–112412. [Google Scholar] [CrossRef]
- Cebekhulu, E.; Onumanyi, A.J.; Isaac, S.J. Performance Analysis of Machine Learning Algorithms for Energy Demand–Supply Prediction in Smart Grids. Sustainability 2022, 14, 2546. [Google Scholar] [CrossRef]
- Feng, Y.; Huang, Y.; Shang, H.; Lou, J.; Knefaty, A.d.; Yao, J.; Zheng, R. Prediction of Hourly Air-Conditioning Energy Consumption in Office Buildings Based on Gaussian Process Regression. Energies 2022, 15, 4626–4644. [Google Scholar] [CrossRef]
- Ku, T.Y.; Park, W.K.; Choi, H. ESS Simulation based on PV Generation Prediction. In Proceedings of the 9th International Conference on Information and Communication Technology Convergence: ICT Convergence Powered by Smart Intelligence, ICTC 2018, Jeju, South of Korea, 17–19 October 2018; p. 953. [Google Scholar]
- Zaini, S.A.; Abu Hanifah, M.S.; Yusoff, S.H.; Nanda, N.N.; Badawi, A.S. Design of circular inductive pad couple with magnetic flux density analysis for wireless power transfer in EV. Indones. J. Electr. Eng. Comput. Sci. 2021, 23, 132. [Google Scholar] [CrossRef]
- Corporation, K.E.P. Terms and Conditions of Electricity Supply. Available online: https://cyber.kepco.co.kr/ckepco/front/jsp/CY/D/C/CYDCHP00108.jsp (accessed on 1 December 2022).
- Foroozandeh, Z.; Ramos, S.; Soares, J.; Vale, Z.; Dias, M. Single contract power optimization: A novel business model for smart buildings using intelligent energy management. Int. J. Electr. Power Energy Syst. 2022, 135, 107534. [Google Scholar] [CrossRef]
- Corporation, K.E.P. Electric Rates Table-Residential Service (Low-Voltage). Available online: https://cyber.kepco.co.kr/ckepco/front/jsp/CY/E/E/CYEEHP00102.jsp (accessed on 1 December 2022).
- Corporation, K.E.P. Electric Vehicle Charging Power Rate. Available online: https://cyber.kepco.co.kr/ckepco/front/jsp/CY/E/E/CYEEHP00108.jsp (accessed on 1 December 2022).


| Class. | Existing System | Proposed System |
|---|---|---|
| Service domain |
|
|
| Discrimination in services |
|
|
| Service application area |
|
|
| DR management |
|
|
| Energy peak control |
|
|
| Domain | Modules | Details | Related Service | Related Layer |
|---|---|---|---|---|
| Building |
| The temperature/humidity/CO2/fine dust sensors |
| Infra Layer |
| Device management and operation | |||
| Building information data gathering and integrate management |
| ||
| Building energy analysis and management |
| Big-Data Layer | |
| Demand analysis and energy prediction | Digital /Platform Layer | ||
| User and EV identification and authorization management |
| ||
| PV/ESS |
| PV management and operation |
| Infra Layer |
| Building integration main intelligent ESS | |||
| PV management and operation |
| ||
| Power generation (kWh), Charge (kWh), Discharge (kWh) data |
| ||
| PV/ESS energy analysis and management |
| Big-Data Layer | |
| Supply analysis and energy prediction management | Digital /Platform Layer | ||
| User identification and authorization management |
| ||
| EV |
| Small temporary ESS for EVs |
| Infra Layer |
| EV charging integrates management and operation |
| ||
| Energy charging system for EVs |
| ||
| EV information integrates management |
| Big-Data Layer | |
| User information integrates management | |||
| Intelligent energy trading management system |
| Digital /Platform Layer |
| Num. | Item | Contents and Components |
|---|---|---|
| 1 | Testbed active optimal control system (IoT sensor) |
|
| 1-1 | Testbed active-type optimal control system (IoT sensor) components |
|
| 1-2 |
| |
| 1-3 |
| |
| 1-4 |
| |
| 1-5 |
| |
| 2 | Testbed active-type optimal control system (control equipment) |
|
| Num. | Domain | Scenario Parameter | Value |
|---|---|---|---|
| 1 | Building |
|
|
|
| ||
|
| ||
| 2 | PV/ESS |
|
|
|
| ||
|
| ||
| 3 | EV |
|
|
| 4 | Environmental information |
|
|
| 5 | Power type |
|
|
| Domain | Scenario Parameter |
|---|---|
| 451 kWh/month ~ kWh/month |
|
| |
| |
| ~720 kWh/month excess |
|
| Power Type | Base Rate Bill (KRW) (A) | Electricity Bill (Month) (B) | |||
|---|---|---|---|---|---|
| Summer (6~8) | Spring/Fall (3~5, 9~10) | Winter (11~12) | |||
| Low-pressure power | 6160 | 113.0 | 72.5 | 99.6 | |
| High-pressure power A | I | 7170 | 123.2 | 79.2 | 110.9 |
| II | 8230 | 119.2 | 74.9 | 105.6 | |
| High-pressure power B | I | 7170 | 121.1 | 78.1 | 107.9 |
| II | 8230 | 115.8 | 72.8 | 102.6 | |
| Class | Building Demand Rate | PV Supply Rate | Weather | Situation Details |
|---|---|---|---|---|
| Situation 1 | Low | High (100%) | Sunny |
|
| Situation 2 | Low | Low (10%) | Cloud |
|
| Situation 3 | High | High (100%) | Sunny |
|
| Situation 4 | High | High (100%) | Sunny |
|
| Situation 5 | High | Low (10%) | Cloud |
|
| Situation 6 | High | Low (10%) | Cloud |
|
| Class | Electricity Bill (KRW) | |||
|---|---|---|---|---|
| Time | Summer (6~8) | Spring/Fall (3~5, 9~10) | Winter (11~12) | |
| Low-pressure power | 23:00~09:00 | 64.9 | 66.0 | 88.0 |
| 09:00~10:00 12:00~13:00 17:00~23:00 | 152.6 | 77.8 | 135.5 | |
| 10:00~12:00 13:00~17:00 | 239.8 | 82.7 | 198.1 | |
Disclaimer/Publisher’s Note: The statements, opinions and data contained in all publications are solely those of the individual author(s) and contributor(s) and not of MDPI and/or the editor(s). MDPI and/or the editor(s) disclaim responsibility for any injury to people or property resulting from any ideas, methods, instructions or products referred to in the content. |
© 2023 by the authors. Licensee MDPI, Basel, Switzerland. This article is an open access article distributed under the terms and conditions of the Creative Commons Attribution (CC BY) license (https://creativecommons.org/licenses/by/4.0/).
Share and Cite
Park, S.; Park, S.; Yun, S.-P.; Lee, K.; Kang, B.; Choi, M.-i.; Jang, H.; Park, S. Design and Implementation of a Futuristic EV Energy Trading System (FEETS) Connected with Buildings, PV, and ESS for a Carbon-Neutral Society. Buildings 2023, 13, 829. https://doi.org/10.3390/buildings13030829
Park S, Park S, Yun S-P, Lee K, Kang B, Choi M-i, Jang H, Park S. Design and Implementation of a Futuristic EV Energy Trading System (FEETS) Connected with Buildings, PV, and ESS for a Carbon-Neutral Society. Buildings. 2023; 13(3):829. https://doi.org/10.3390/buildings13030829
Chicago/Turabian StylePark, Sangmin, SeolAh Park, Sang-Pil Yun, Kyungeun Lee, Byeongkwan Kang, Myeong-in Choi, Hyeonwoo Jang, and Sehyun Park. 2023. "Design and Implementation of a Futuristic EV Energy Trading System (FEETS) Connected with Buildings, PV, and ESS for a Carbon-Neutral Society" Buildings 13, no. 3: 829. https://doi.org/10.3390/buildings13030829