Article

Influence of Tunnel Excavation on the Deformation of a Frame Building

1
School of Resources and Civil Engineering, Northeastern University, Shenyang 110819, China
2
State Key Laboratory of Coastal and Offshore Engineering, Dalian University of Technology, Dalian 116024, China
3
North China Branch, China Construction Eighth Engineering Division Corp. Ltd., Tianjin 300450, China
4
Department of Civil and Environmental Engineering, Brunel University London, London UB8 3PH, UK
*
Author to whom correspondence should be addressed.
Buildings 2023, 13(3), 810; https://doi.org/10.3390/buildings13030810
Submission received: 24 January 2023 / Revised: 3 March 2023 / Accepted: 15 March 2023 / Published: 19 March 2023
(This article belongs to the Section Building Structures)

Abstract

:
Tunnel excavation inevitably causes surface deformation. In urban areas, surface deformation could lead to the deformation of surrounding buildings, which may cause damage to communities when accumulated to a certain extent. However, the current construction organization and management mainly rely on on-site deformation measurements, and there is still a lack of reliable prediction methods. Here, we proposed an effective evaluation method for frame building deformation based on the stochastic medium theory and the equivalent beam theory. This method could effectively evaluate the surface and building deformation after a horseshoe tunnel excavation by considering the non-uniform convergence. Furthermore, its accuracy and practicability were verified using the Nanyan Fourth Circuit Transmission Reconstruction located in Dalian, China. The results show that the spatial distribution and characteristic values of the maximum tensile strains were closely related to the ratio of Young’s modulus to the shear modulus (E/G), the building height (h), the tunnel depth (H), the tangent of the tunnel influence angle (tan β) and the convergence radius (ΔR). These achievements can provide a theoretical basis and analytical ideas for investigating the influence of shallow buried tunnel excavation on frame structure buildings in cities.

1. Introduction

With the increasing demand for advanced urban transportation and pipe networks, more and more cities in China are planning, building or updating municipal tunnels and rail transit systems [1]. These tunnels will occupy an increasingly large volume of urban underground space, and their structures are becoming more complex and denser. Utilizing underground space, land and resources has become an inevitable choice for the development of modern cities. However, tunnel excavation will cause a disturbance to the surrounding rock and soil mass and destroy its original occurrence state [2,3]. Once this disturbance is transmitted to the surface, it will result in nonuniform settlement of the surface. Especially in developed cities with many buildings, tunnel excavation will not only have a great impact on the road surface but may also significantly affect the existing buildings [4,5].
Many researchers investigated the influence of tunnel excavation on surface deformation from different aspects [6,7]. The Peck formula [8] is the most common empirical method for surface settlement caused by tunnel construction. Studies showed that the surface deformation and settlement trough approximately follow the Gaussian normal distribution [9]. On this basis, OReilly and New [10] analyzed the measured data and concluded that there was a linear relationship between the width of a settlement trough and the buried depth of a tunnel. Mair et al. [11] proposed that the settlement trough in any plane below the surface above the tunnel could also be described by a normal distribution curve. In terms of testing, the centrifugal loading method is adopted [12]. Regarding theory, Litwiniszyn [13] proposed “stochastic medium theory”, which regards rock and soil mass as a random medium to predict surface deformation. Sagaseta [14] used the “virtual image technique” and gave an analytical solution for the surface deformation caused by tunnel excavation. On the basis of Sagaseta’s research results, Verruijt and Booker [15] gave full consideration to the influence of tunnel ellipticity and corrected the analytical solution of stratum deformation caused by tunnel excavation. Regarding numerical simulations, the finite element technique [16,17,18] was widely used to simulate the deformation of geomaterials [19,20,21]. Meanwhile, in terms of the deformation of the ground surface and building, numerical simulation methods were widely used [22,23,24]. Gong et al. [25] simulated the effect of double-hole EPB tunneling on masonry construction in soft soil. The calculated maximum tensile strain was 0.008%, and no significant cracks were found on site. Fu et al. [26] modeled the influence of tunnel excavation on frame structure buildings, and a tunnel–surface–building analysis system was established. It was considered that the stiffness of the building, the relative position of the tunnel, the weight of the building and other factors will affect the deformation of both the surface and the building.
However, model establishment and numerical calculation are generally time-consuming, and specific engineering cases often need complex adjustments. For standard construction, the theoretical analysis method is more effective. Burland and Wroth [27] proposed to judge the degree of building deformation based on the maximum tensile strain and gave the classification index of building deformation. On this basis, Camos and Molins [28] studied the maximum tensile strain of building deformation under three-dimensional conditions. These studies were based on the Peck formula. However, the Peck formula, as an empirical method, is generally not applicable to tunnels with an irregular section. Han and Li [29] made an in-depth comparison between the Peck formula and the stochastic medium theory and concluded that the Peck formula was only a special case of the stochastic medium theory and only applicable to deeply buried tunnels. However, many tunnels excavated in urban areas are shallow or ultra-shallow buried tunnels. Therefore, a new method is required to calculate the excavation influence of a shallow tunnel with an irregular section on the surface and building deformations, which will have significant theoretical significance and engineering application value.
In this study, a new theoretical method for calculating the maximum tensile strain of buildings based on stochastic medium theory and equivalent beam theory was proposed. First, the analytical solution of surface deformation caused by horseshoe tunnel excavation under the condition of non-uniform convergence was deduced using a Gauss–Legendre integral [30]. Then, the maximum tensile strain of buildings caused by surface deformation was calculated by the equivalent beam theory. Furthermore, the proposed method was applied to the Nanyan Fourth Circuit Transmission Reconstruction located in Dalian, China, to verify its effectiveness. Finally, the influence of different parameters on building deformation is discussed.

2. Materials and Methods

2.1. Horseshoe-Shaped Tunnel Deformation Based on the Stochastic Medium Theory

In 1957, the stochastic medium theory was proposed by the Polish professor Litwiniszyn to analyze the settlement of a coal bed caused by underground mining [13]. In this theory, rock and soil mass is regarded as a stochastic medium, and the motion law of rock and soil mass medium is described using statistics and probability. Specifically, the displacement caused by the excavation process of rock and soil mass can be decomposed into the displacement of infinitely small units. Thus, the displacement caused by excavation can be obtained by superposition and summation of the displacement of all small units. Yang et al. [31] introduced the stochastic medium theory into the field of tunnel deformation analysis and verified it with the related data.
According to the stochastic medium theory, the vertical settlement and horizontal deformation caused by tunnel excavation can be obtained using the following formulas [13,31]:
d W ( X ) = tan β η e π tan 2 β η 2 X ε 2 d ε d η
d U ( X ) = ( X ε ) tan β η 2 e π tan 2 β η 2 X ε 2 d ε d η
In Equations (1) and (2), W(X) is the vertical settlement of the ground surface; U(X) is the horizontal displacement of the ground surface; β represents the influence angle of the tunnel, which can be determined by the excavation depth and the material properties of the overlying strata [31]; and X is the horizontal distance from the measured point to the central axis of the tunnel.
As shown in Figure 1, after completing a tunnel excavation, due to the ground loss, the original excavation section Ω will shrink inward, forming a new section ω. Therefore, the settlement deformation can be determined using the convergence difference between the two regions [31]. Specifically, the vertical settlement and the horizontal displacement can be expressed as
W ( X ) = W Ω ( X ) W ω ( X ) = Ω - ω tan β η e π tan 2 β η 2 X ε 2 d ε d η
U ( X ) = U Ω ( X ) U ω ( X ) = Ω - ω X ε tan β η 2 e π tan 2 β η 2 X ε 2 d ε d η
where WΩ(X) represents the settlement caused by the original excavation section Ω, Wω(X) represents the settlement caused by the original excavation section ω, UΩ(X) represents the horizontal displacement caused by the original excavation section Ω and Uω(X) represents the horizontal displacement caused by the original excavation section ω.
Han and Li [33] proposed that the cross-section convergence deformation caused by tunnel excavation is usually non-uniform. Therefore, considering the non-uniform convergence will make the calculation result more accurate (as shown in Figure 2).
For the horseshoe tunnel section, under the condition of uniform convergence, the uplift of the floor is zero, and the tunnel section will move down by ΔR compared with the uniform convergence. In fact, floor heave is inevitable during excavation because of the induced stress release. According to Han and Li [33], the cross-section of a horseshoe tunnel can be divided into a semi-elliptical cross-section and a rectangular cross-section, and its horizontal deformation can be obtained via superposition of the two as follows:
U X = U X elliptical + U X rectangular
where U(X)elliptical is the horizontal displacement caused by the ellipse part (given briefly as U(X)e); U(X)rectangular is the horizontal displacement caused by the rectangular part (given briefly as U(X)r). U(X)e can be calculated using the following equation:
U X e = a b c d ( X ε ) tan β η 2 e π tan 2 β η 2 X ε 2 d ε d η e f g h ( X ε ) tan β η 2 e π tan 2 β η 2 X ε 2 d ε d η
In Equation (6), a = HCB, b = HC, c = A 1 H C η B 2 , d = −c, e = HCB + 2ΔR, f = HC + ΔR, g = ( A Δ R ) 1 H ( C Δ R ) η B Δ R 2 and h = −g (as shown in Figure 2b). Here, A is half the width of the floor (it equals the length of the semimajor axis); B is the length of the semiminor axis; C is the height of the straight wall; and ΔR represents the convergence radius of the tunnel, which can be determined using the construction method, in situ stress state and stress–strain relationship [31].
Setting I = a b c d ( X ε ) tan β η 2 e π tan 2 β η 2 X ε 2 d ε d η , then I can be expressed using the following formula:
I = a b c d X ε tan β η 2 e π tan 2 β η 2 X ε 2 d ε d η = a b tan β η 2 d η c d X ε e π tan 2 β η 2 X ε 2 d ε
According to the Gauss–Legendre integral [30], if it is assumed that
ε = d c 2 t 2 + d + c 2 = A 1 H C η B 2 t 2
then I can be further expressed using the following formula:
I = a b tan β η 2 × A 1 H C η B 2 d η × 1 1 ( X A 1 H C η B 2 t 2 ) e π tan 2 β η 2 X A 1 H C η B 2 t 2 2 d t 2
When n = 5, I can be represented using the following Gauss–Legendre integral transformation:
I = a b tan β η 2 × A 1 H C η B 2 d η × A 1 f x 1 + A 2 f x 2 + A 3 f x 3 + A 4 f x 4 + A 5 f x 5
where xi represents the quadrature node and Ai stands for the Gaussian weighting coefficient. Both parameters can be obtained by checking Table A1 in Appendix A. Here, A1f(x1) can be expressed as
A 1 f x 1 = A 1 × X A 1 H C η B 2 x 1 × e π tan 2 β η 2 X A 1 H C η B 2 x 1 2
If the first term in Equation (10) is set to I 1 = a b tan β η 2 × A 1 H C η B 2 d η × A 1 f x 1 , then I1 can be calculated as follows:
I 1 = A 1 a b tan β η 2 × A 1 H C η B 2 × X A 1 H C η B 2 x 1 × e π tan 2 β η 2 X A 1 H C η B 2 x 1 2 d η
Similarly, the Gauss–Legendre integral is used again. If it is assumed that
η = b a 2 t 1 + b + a 2 = B 2 t 1 + 2 H 2 C B 2
I1 can be expressed as
I 1 = B 2 A 1 1 1 tan β B 2 t 1 + 2 H 2 C B 2 2 × A 1 H C B 2 t 1 2 H 2 C B 2 B 2 × X A 1 H C B 2 t 1 2 H 2 C B 2 B 2 t 1 × e π tan 2 β B 2 t 1 + 2 H 2 C B 2 2 X A 1 H C B 2 t 1 2 H 2 C B 2 B 2 t 1 2 d t 1 = A B 2 A 1 A 1 g x 1 + A 2 g x 2 + A 3 g x 3 + A 4 g x 4 + A 5 g x 5
Therefore, the final expression of Iij can be obtained using
I i j = i , j = 1 5 A i A j A B × 2 tan β B x j + 2 H 2 C B 2 1 x j 1 2 2 × X A 1 x j 1 2 2 x i × e 4 π tan 2 β B x j + 2 H 2 C B 2 X A 1 x j 1 2 2 x i 2
Similarly, in Equation (6), if I i j = e f g h tan β η e π tan 2 β η 2 X ε 2 d ε d η , the expression for I i j will be
I i j = i , j = 1 5 A i A j ( A Δ R ) ( B Δ R ) × 2 tan β ( B Δ R ) x j + 2 H 2 C B + 3 Δ R 1 x j 1 2 2 × X A Δ R 1 x j 1 2 2 x i × e 4 π tan 2 β ( B Δ R ) x j + 2 H 2 C B + 3 Δ R 2 X ( A Δ R ) 1 x j 1 2 2 x i 2
Therefore, the horizontal displacement of the surface caused by the excavation of the elliptical part can be calculated using the following formula:
U X e = I i j I i j   ( i , j = 1 , 2 , , 5 )
Similarly, the horizontal displacement of the surface caused by the excavation of the rectangular part can be calculated using the following formula:
U X r = J i j J i j   ( i , j = 1 , 2 , , 5 )
J i j = i , j = 1 5 A i A j A C × tan β C x j + 2 H C 2 × X A x i × e 4 π tan 2 β C x j + 2 H C 2 X A x i 2
J i j = i , j = 1 5 A i A j ( A Δ R ) ( C Δ R ) × tan β ( C Δ R ) x j + 2 H C + Δ R 2 × X A Δ R x i × e 4 π tan 2 β ( C Δ R ) x j + 2 H C + Δ R 2 X ( A Δ R ) x i 2
In summary, according to the stochastic medium theory, the horizontal displacement of the surface caused by horseshoe tunnel excavation can be expressed as
U X = U X e + U X r = ( I i j I i j ) + ( J i j J i j )   ( i , j = 1 , 2 , , 5 )
In previous studies, the stochastic medium theory is only expressed in the form of an integral, but this study further gives a more intuitive and convenient form for practical application. For the ground surface settlement W(X), Li et al. [32] gave the calculated results, which will not be repeated here.

2.2. Building Strain

As is already known to us, the strain distribution along the beam depends on the deformation mode of the beam, which usually includes two kinds: bending deformation and shear deformation. Therefore, we should determine the most critical forms in practical projects, i.e., pure bending and pure shear deformations. The maximum tensile strain in a beam due to pure bending (εbr) and pure shear (εdr) deformation can be given by elastic beam theory as follows:
ε b r = ( ε b max + ε h )
ε d r = ε h ( 1 E 4 G ) + ε h 2 16 ( E G ) 2 + ε d max 2
where E/G is the ratio of Young’s modulus to the shear modulus of the building; εbmax and εdmax are the deflection deformation of the beam under pure bending and pure shear modes, respectively. εh is the horizontal strain of the ground on the beam foundation, which depends on the shape of the settling trough of the beam and the relative position of the reference point. The maximum tensile strain εmax is the maximum of εbr and εdr along the beam direction.
According to Mair et al. [34], the settlement deformation under the building can be divided into the zones of the building undergoing sagging deflection and the zones of the building undergoing hogging deflection when the tunnel is excavated and penetrates the geomaterial under the existing building, as shown in Figure 3.
The maximum strains of the beam under the pure bending (εbmax) and shear (εdmax) deformation modes need to be calculated. They can be determined using the expressions given by Burland and Wroth [27]:
ε b max = Δ l l 12 t + 3 I 2 a l h E G
ε d max = Δ l 1 + h l 2 18 I G E
where h is the height of the beam (i.e., the height of the building); I is the inertia per unit length, which is numerically equal to h3/12 in sagging zones and h3/4 in hogging zones; and t is the location of the neutral axis. In sagging zones, the neutral axis is assumed to be located at the middle height t = h/2. In the hogging zones, it is assumed that the neutral axis is located at the top t = h, as shown in Figure 3. Moreover, a is the position where the strain is calculated. If the strain is considered at the position of the neutral axis, we will have a = t in both cases. Δ/l is the maximum deflection of the two circumstances, where l is the horizontal distance between two reference points and Δ is the deflection between the two points. This relative deflection is given by the difference between the settlement curve and the straight line connecting the building’s reference and inflection points.
The horizontal strain εh of the surface can be calculated using Equation (26), as shown below:
ε h = U ( X ) X
where U(X) is the horizontal displacement of the ground surface caused by tunnel excavation. Therefore, the maximum strain can be obtained by the following formula:
ε max = max { ε b r h o g , ε b r s a g , ε d r h o g , ε d r s a g }
where εmax is the maximum of ε b r h o g , ε b r s a g , ε d r h o g and ε d r s a g ; ε b r s a g is the pure bending strain in the sagging zones; ε b r h o g is the pure bending strain in the hogging zones; ε d r s a g is the pure shear strain in the sagging zones; and ε d r h o g is the pure shear strain in the hogging zones.

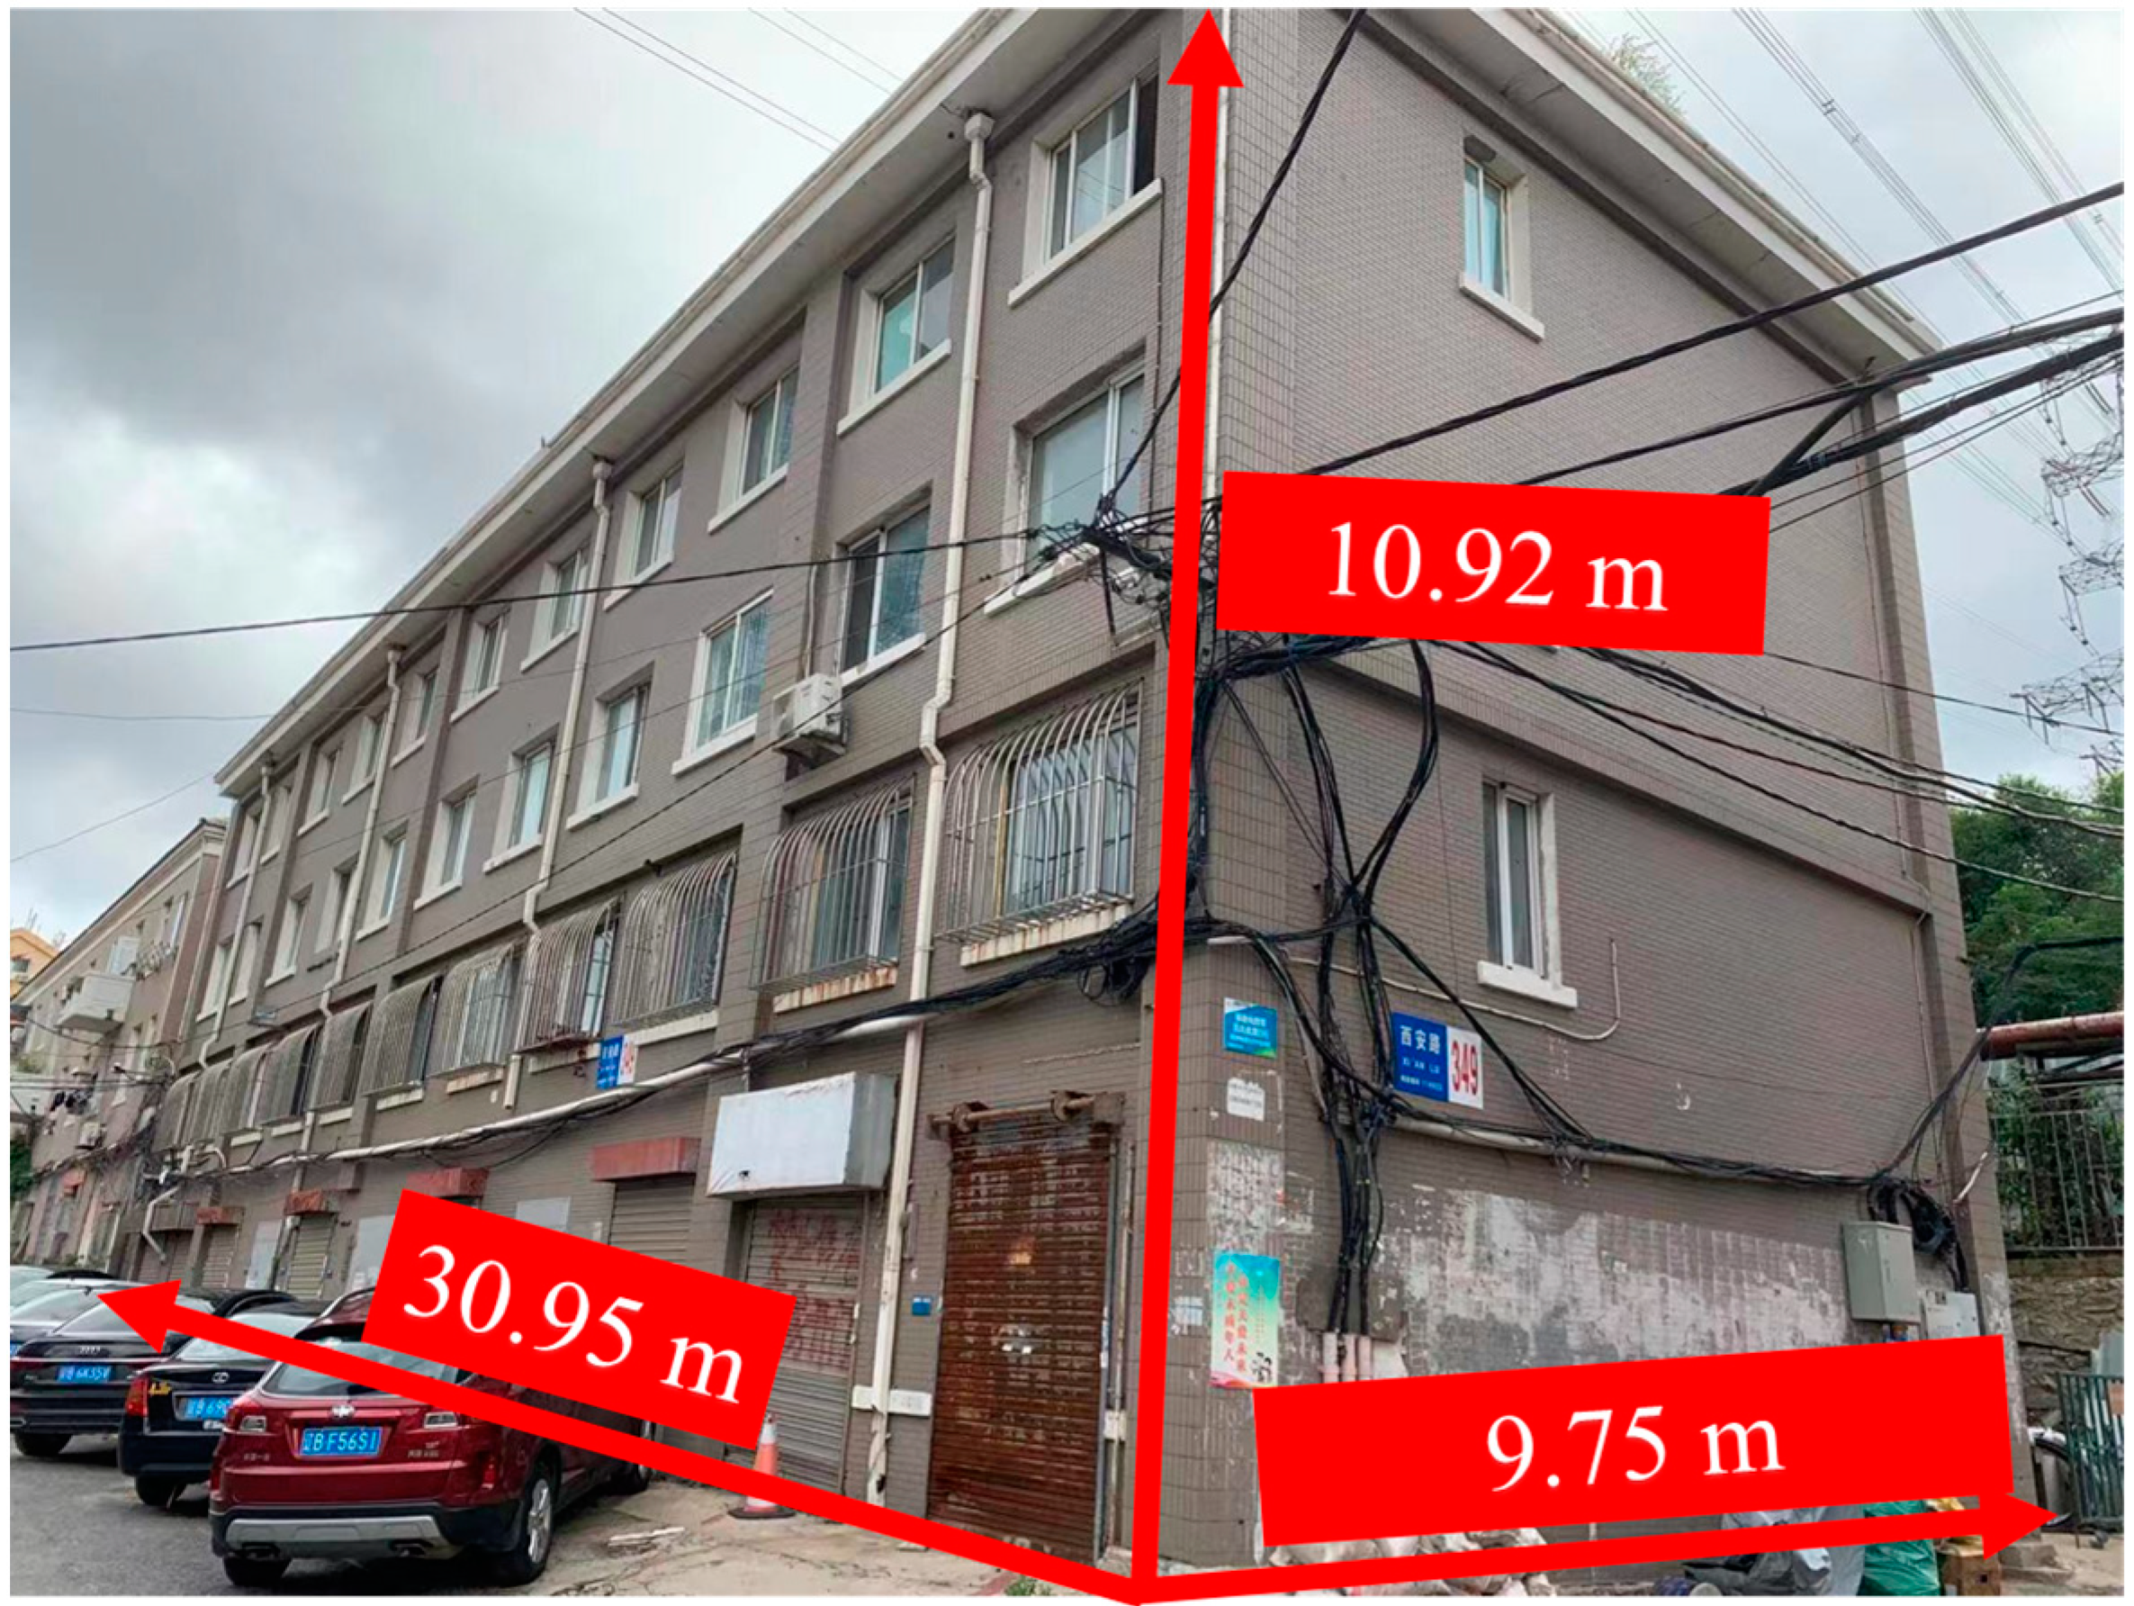
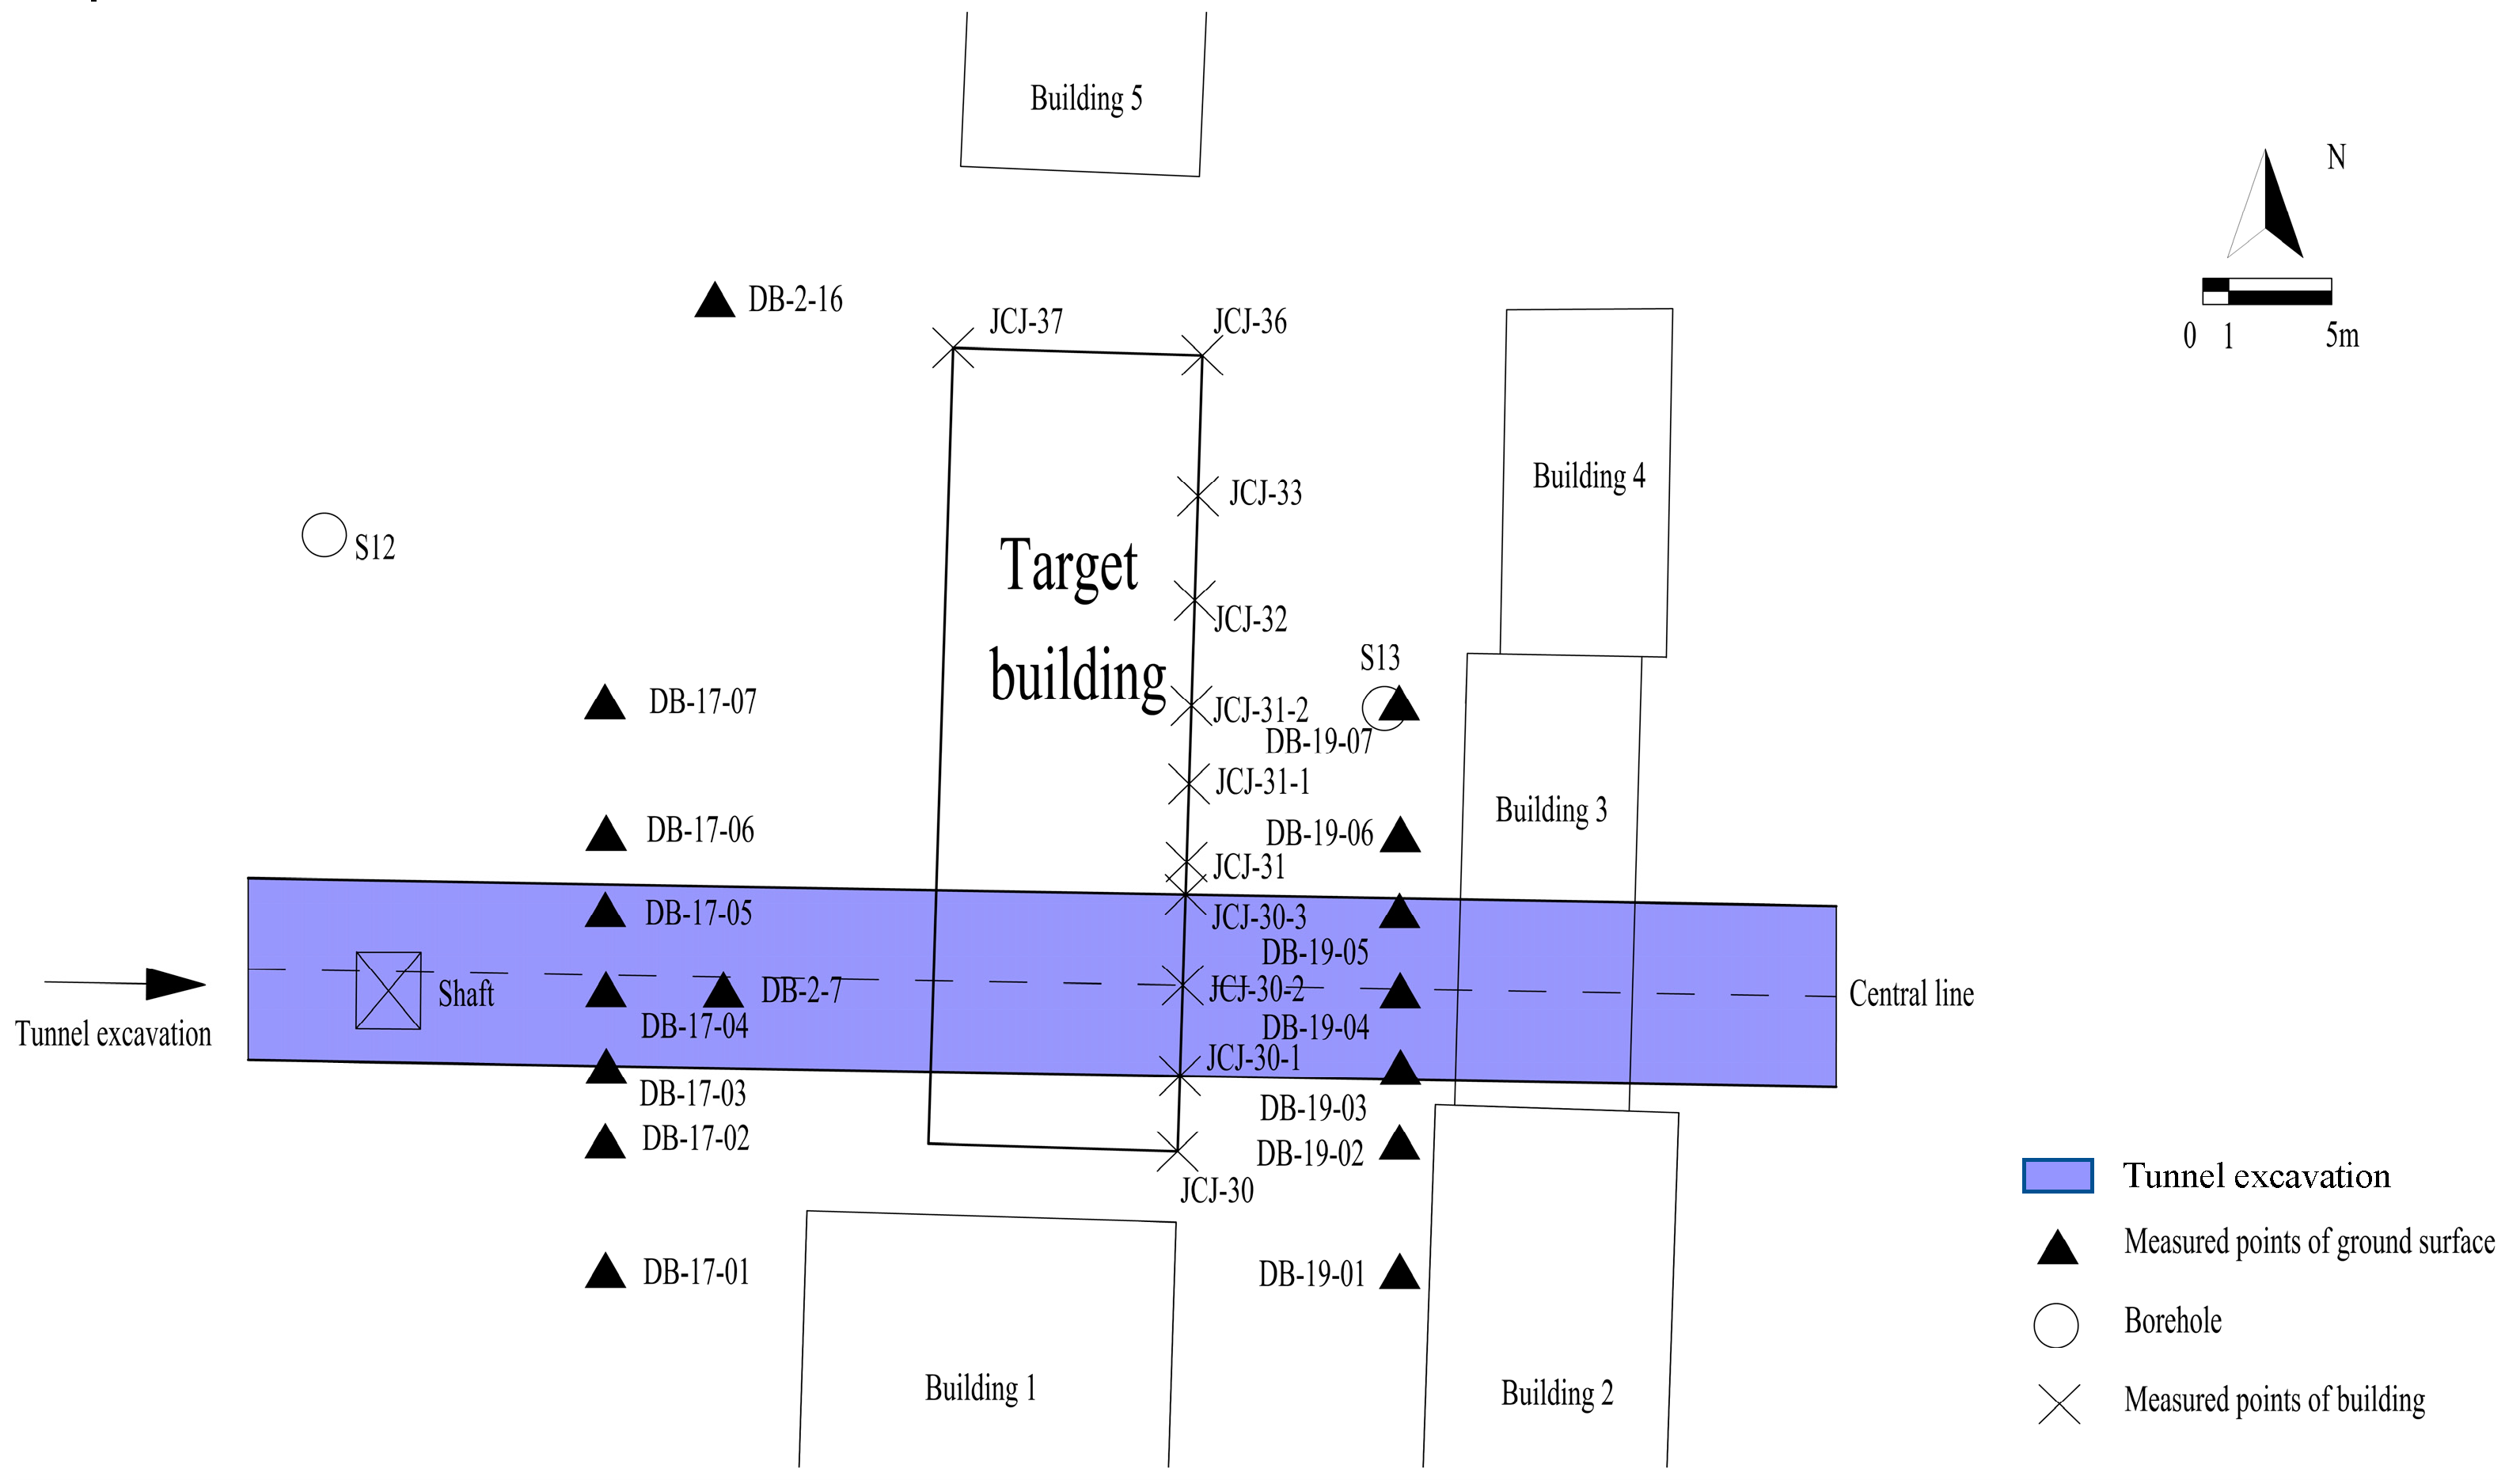
3. Engineering Background
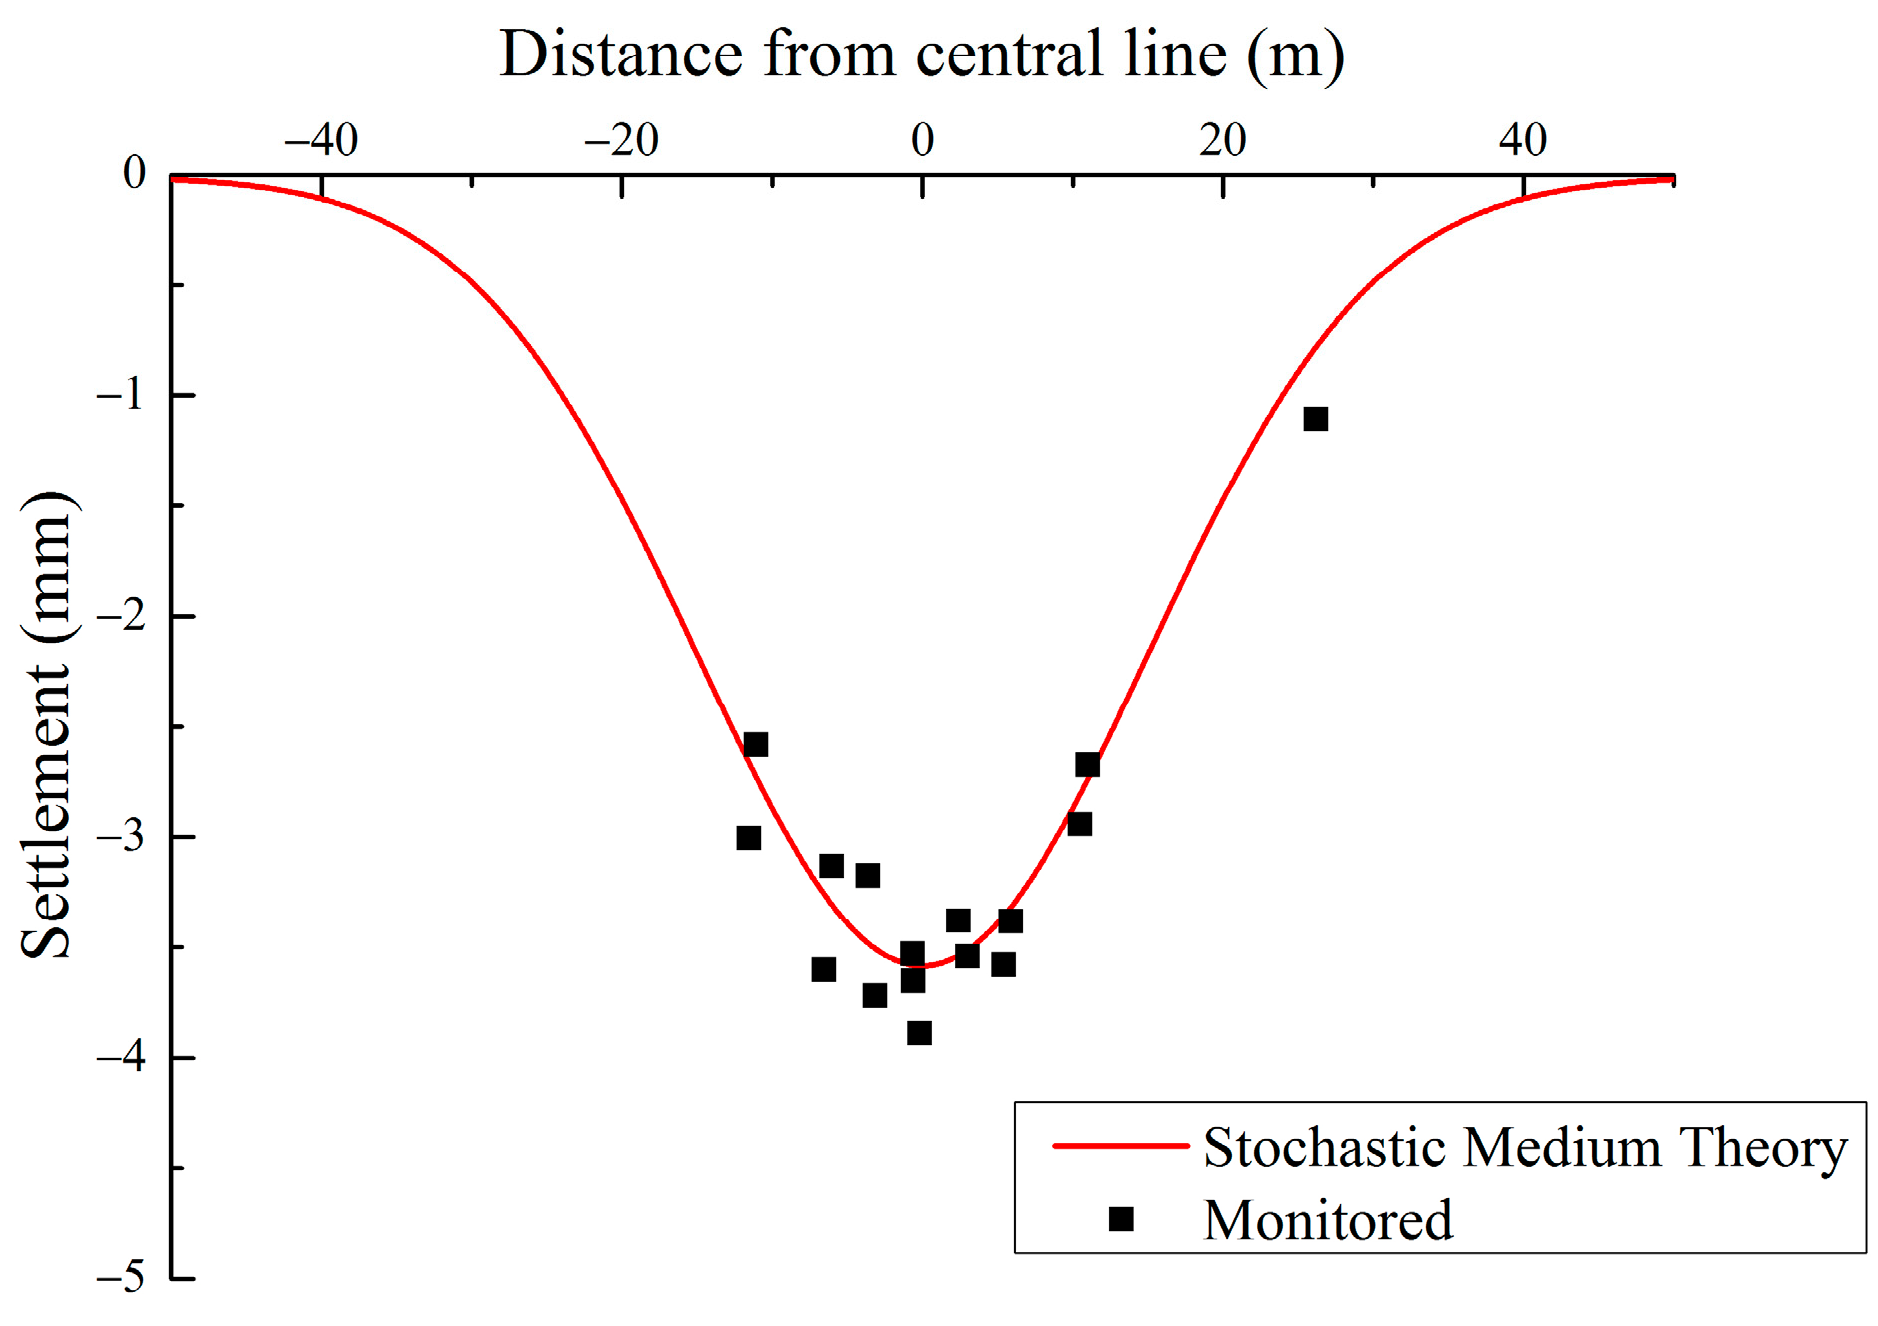
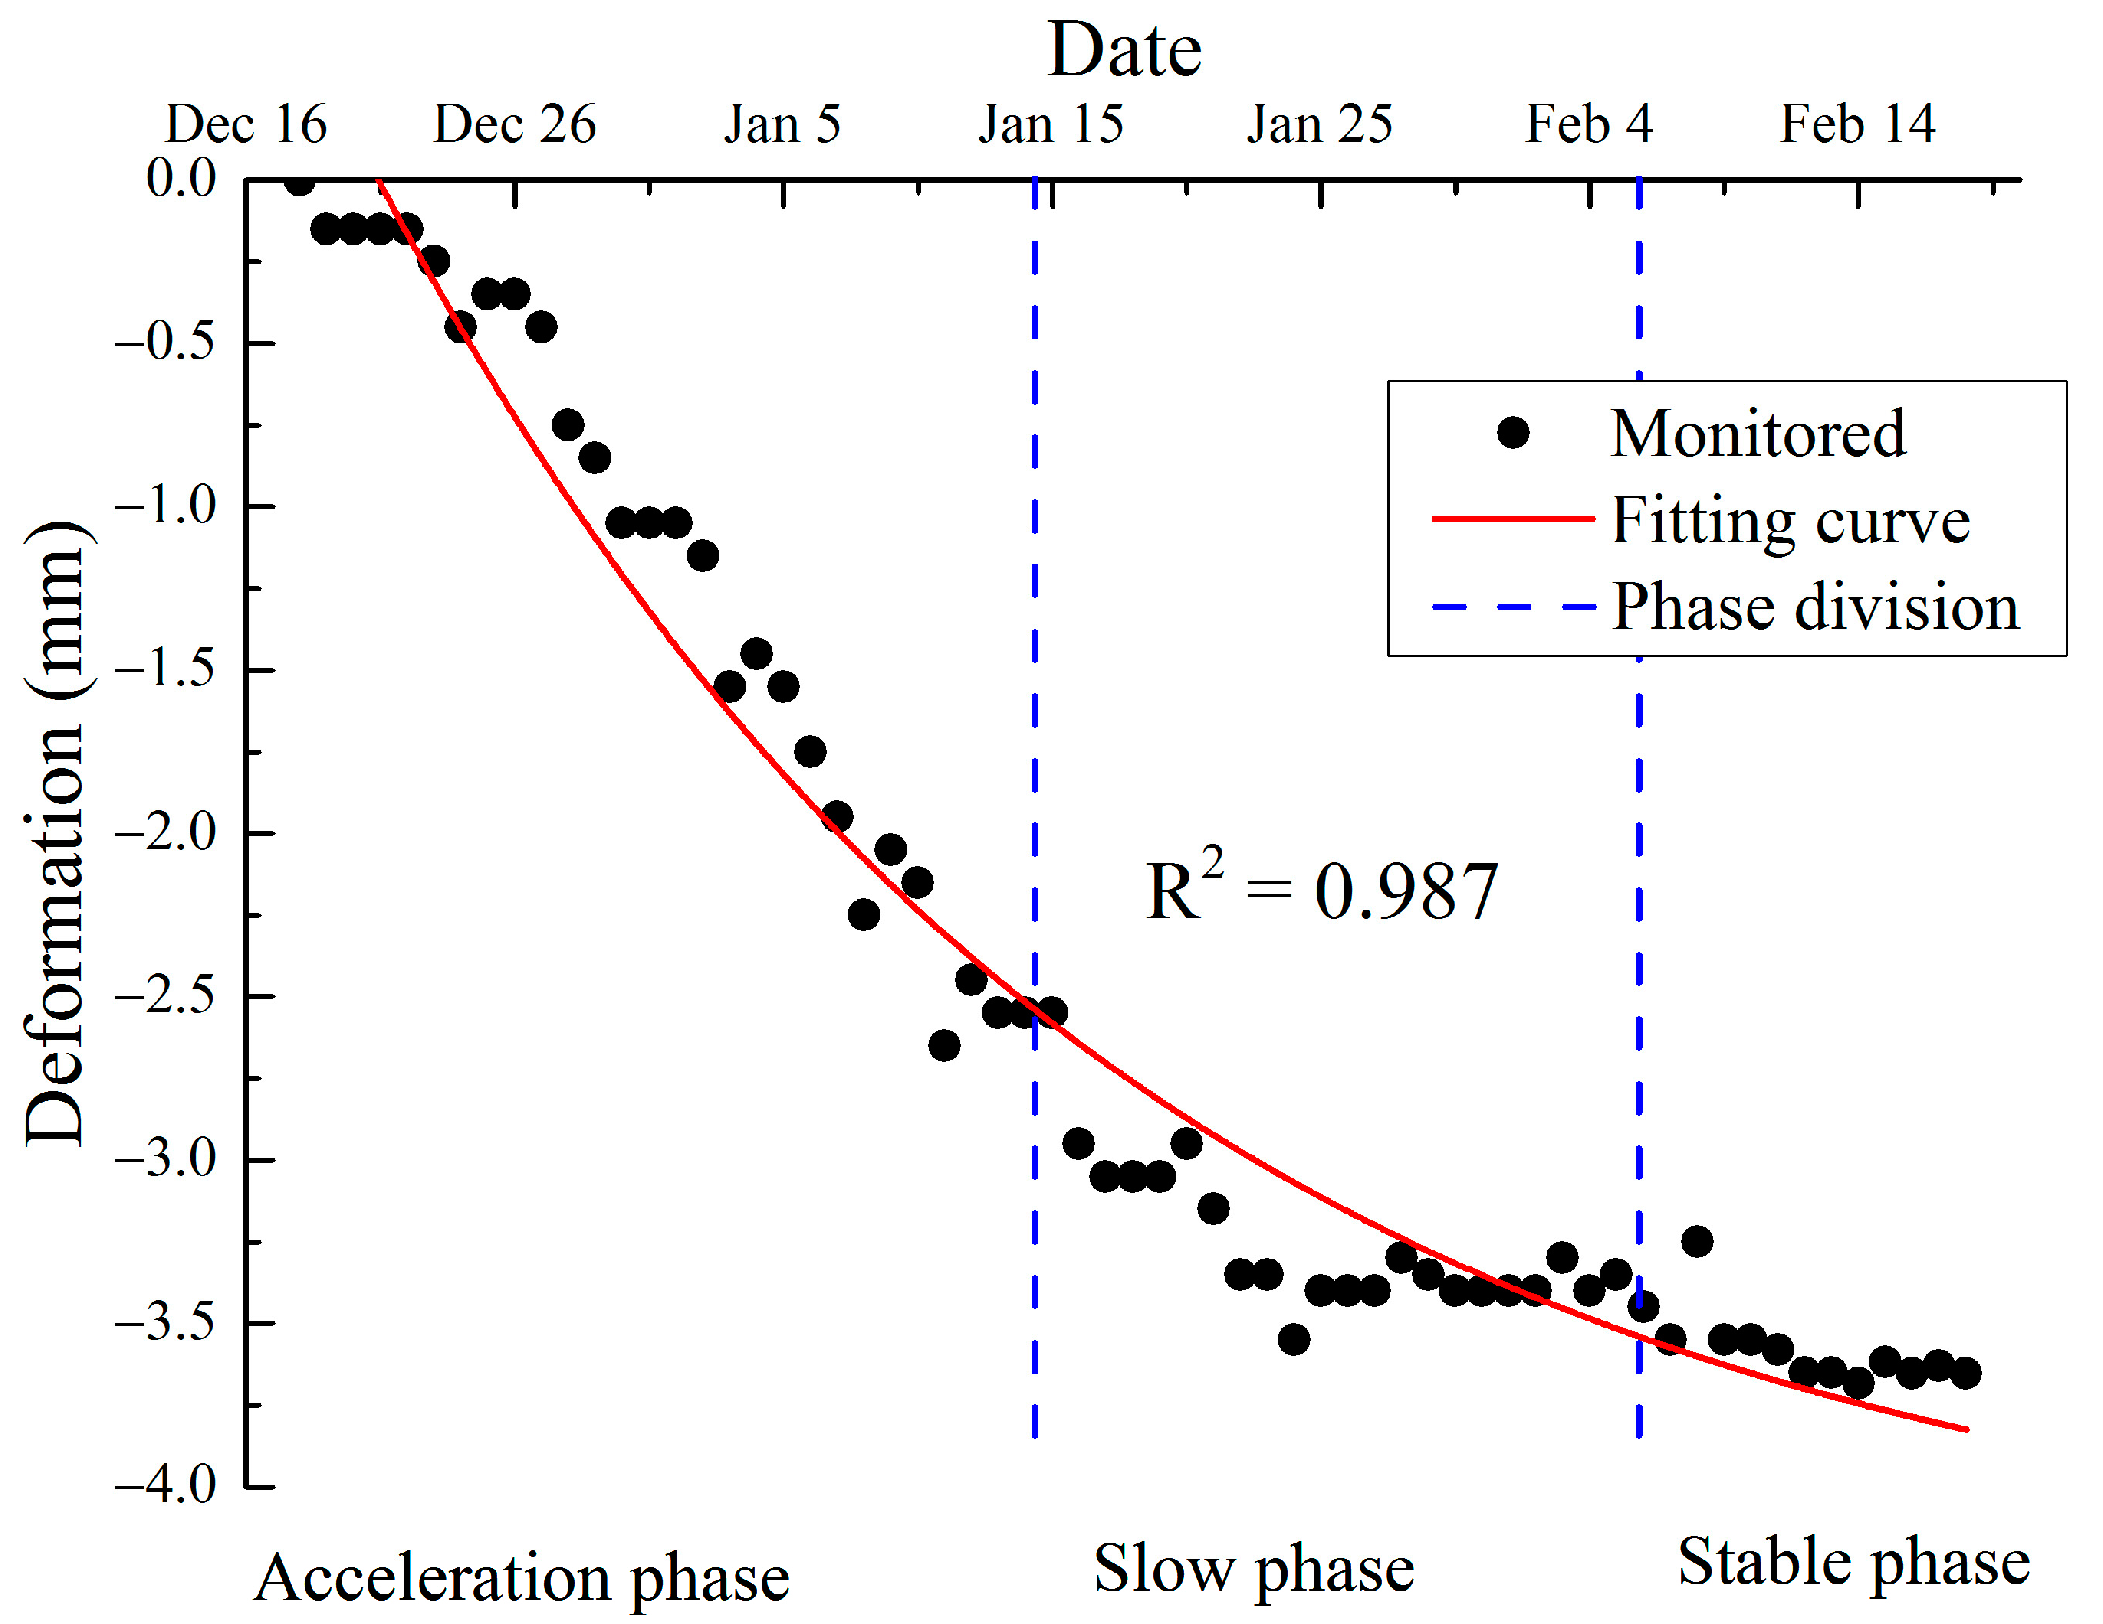
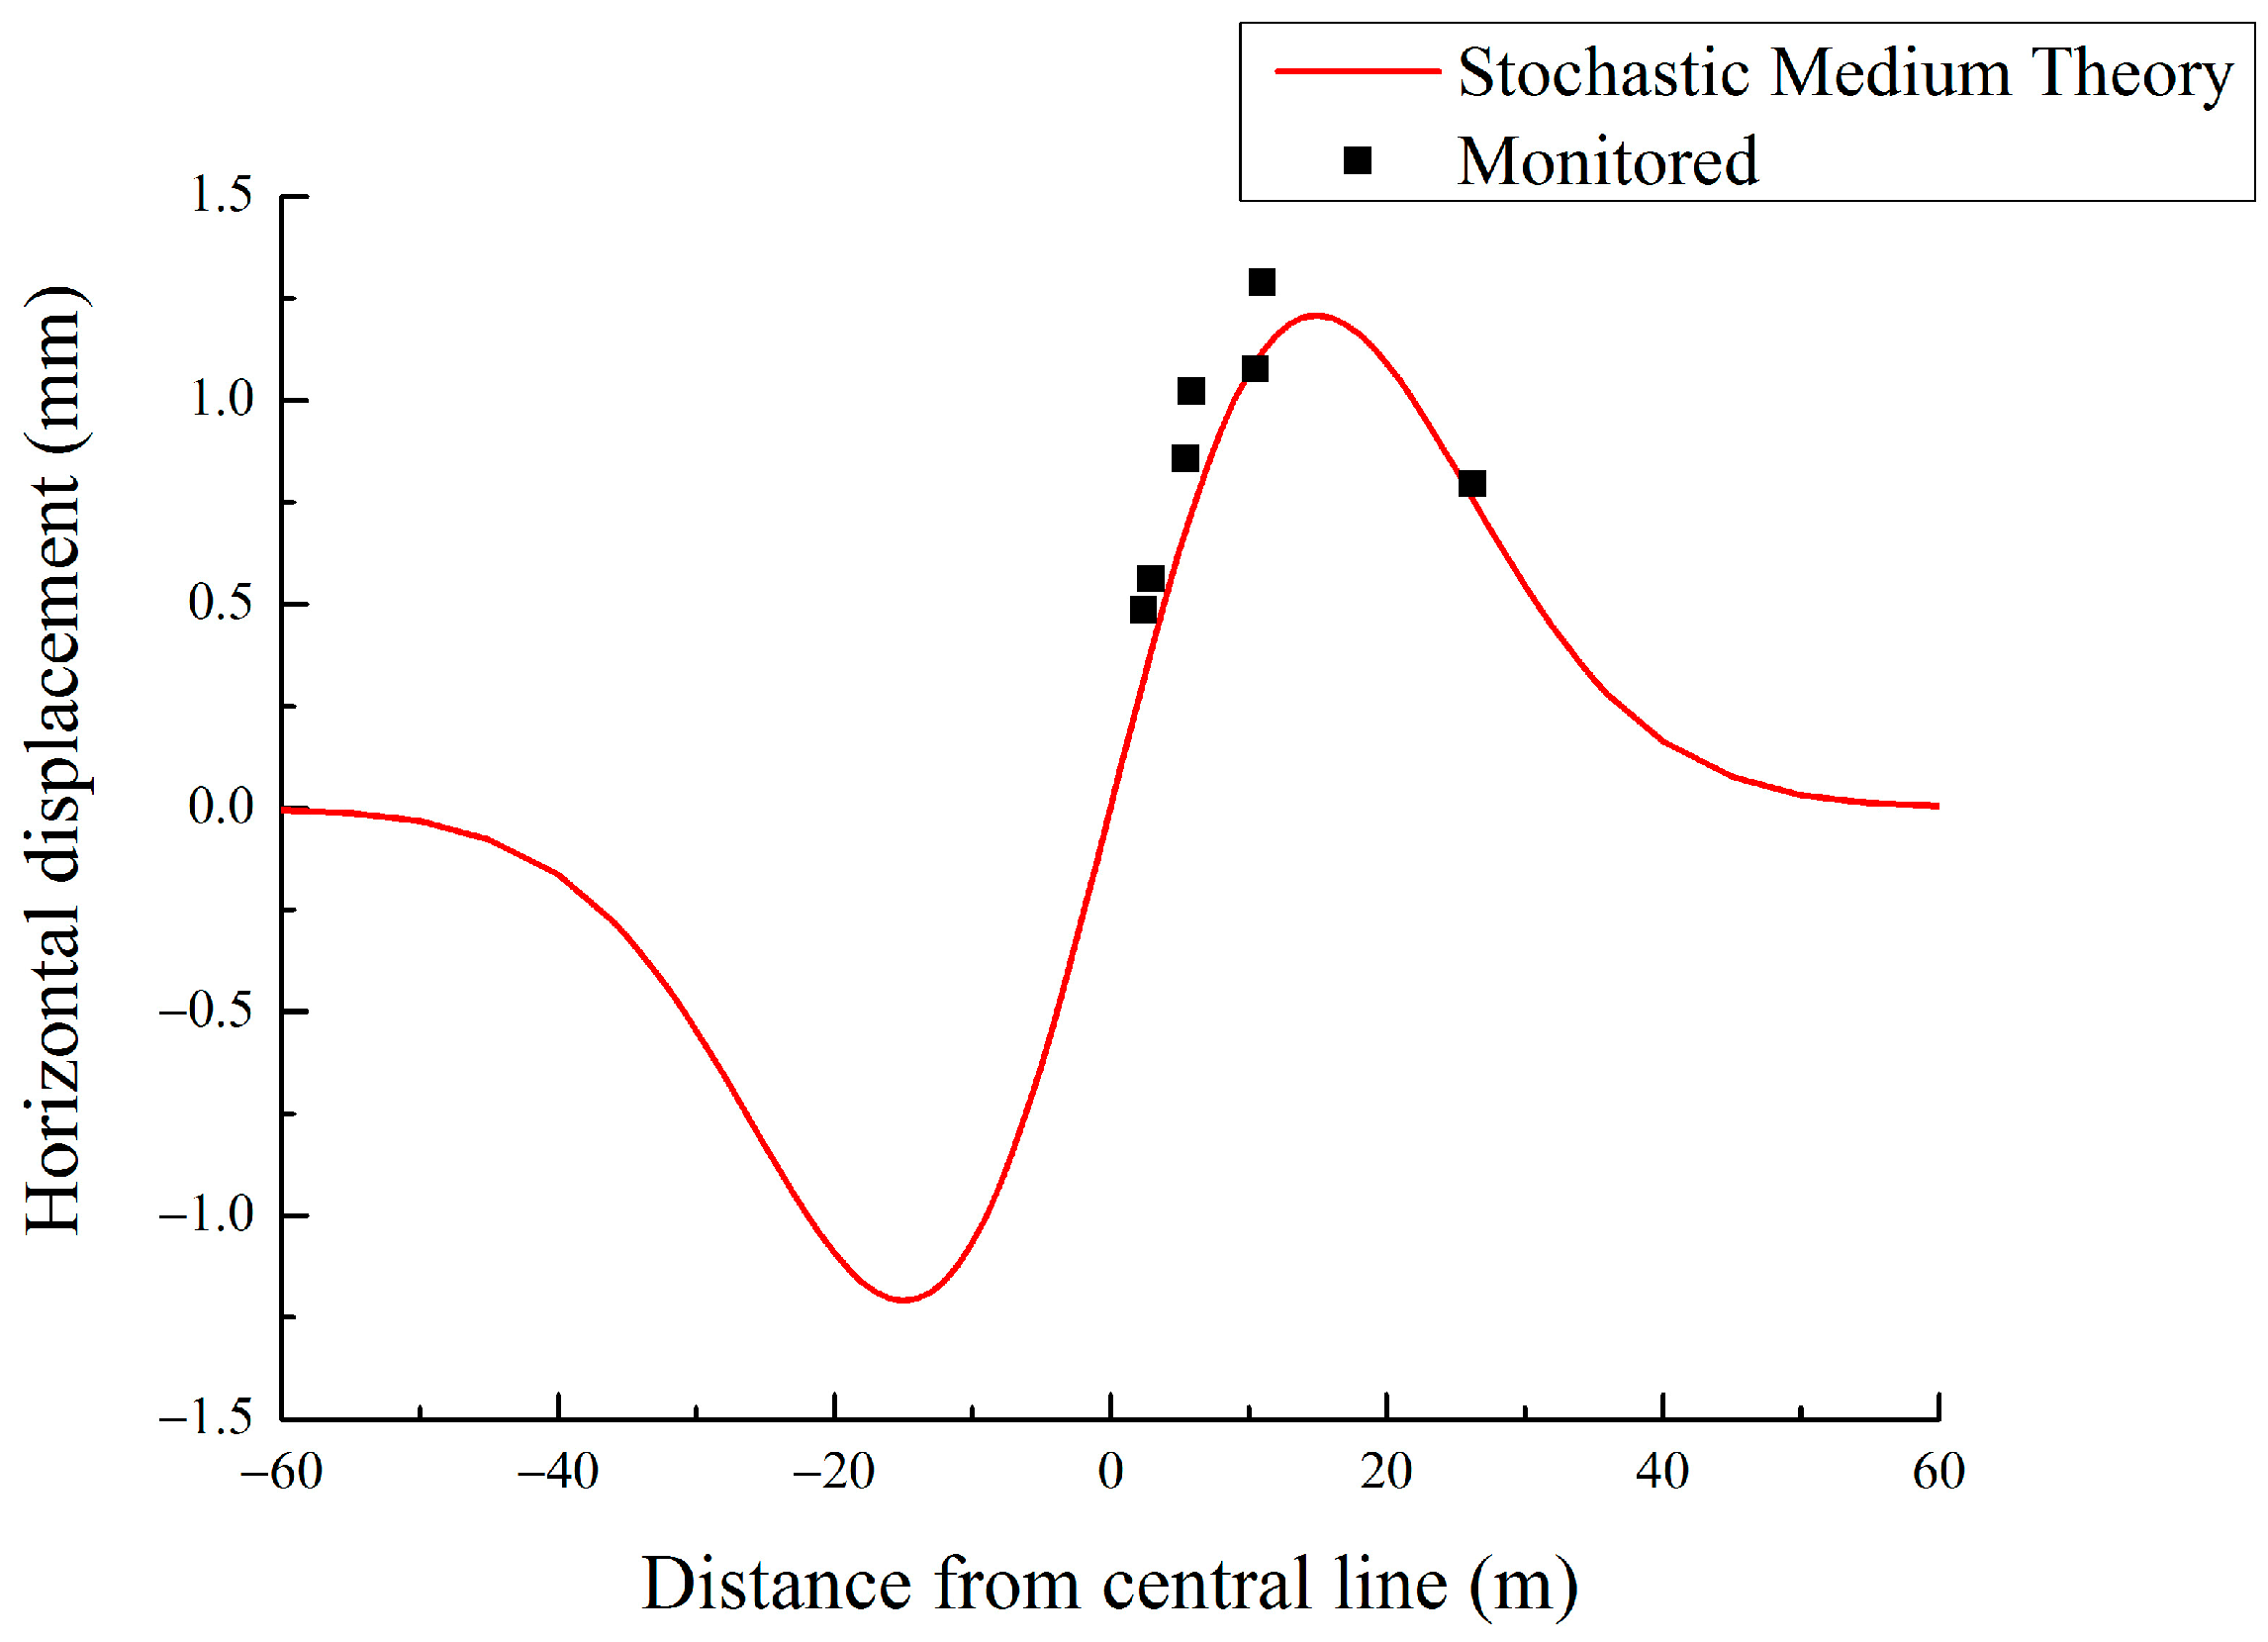
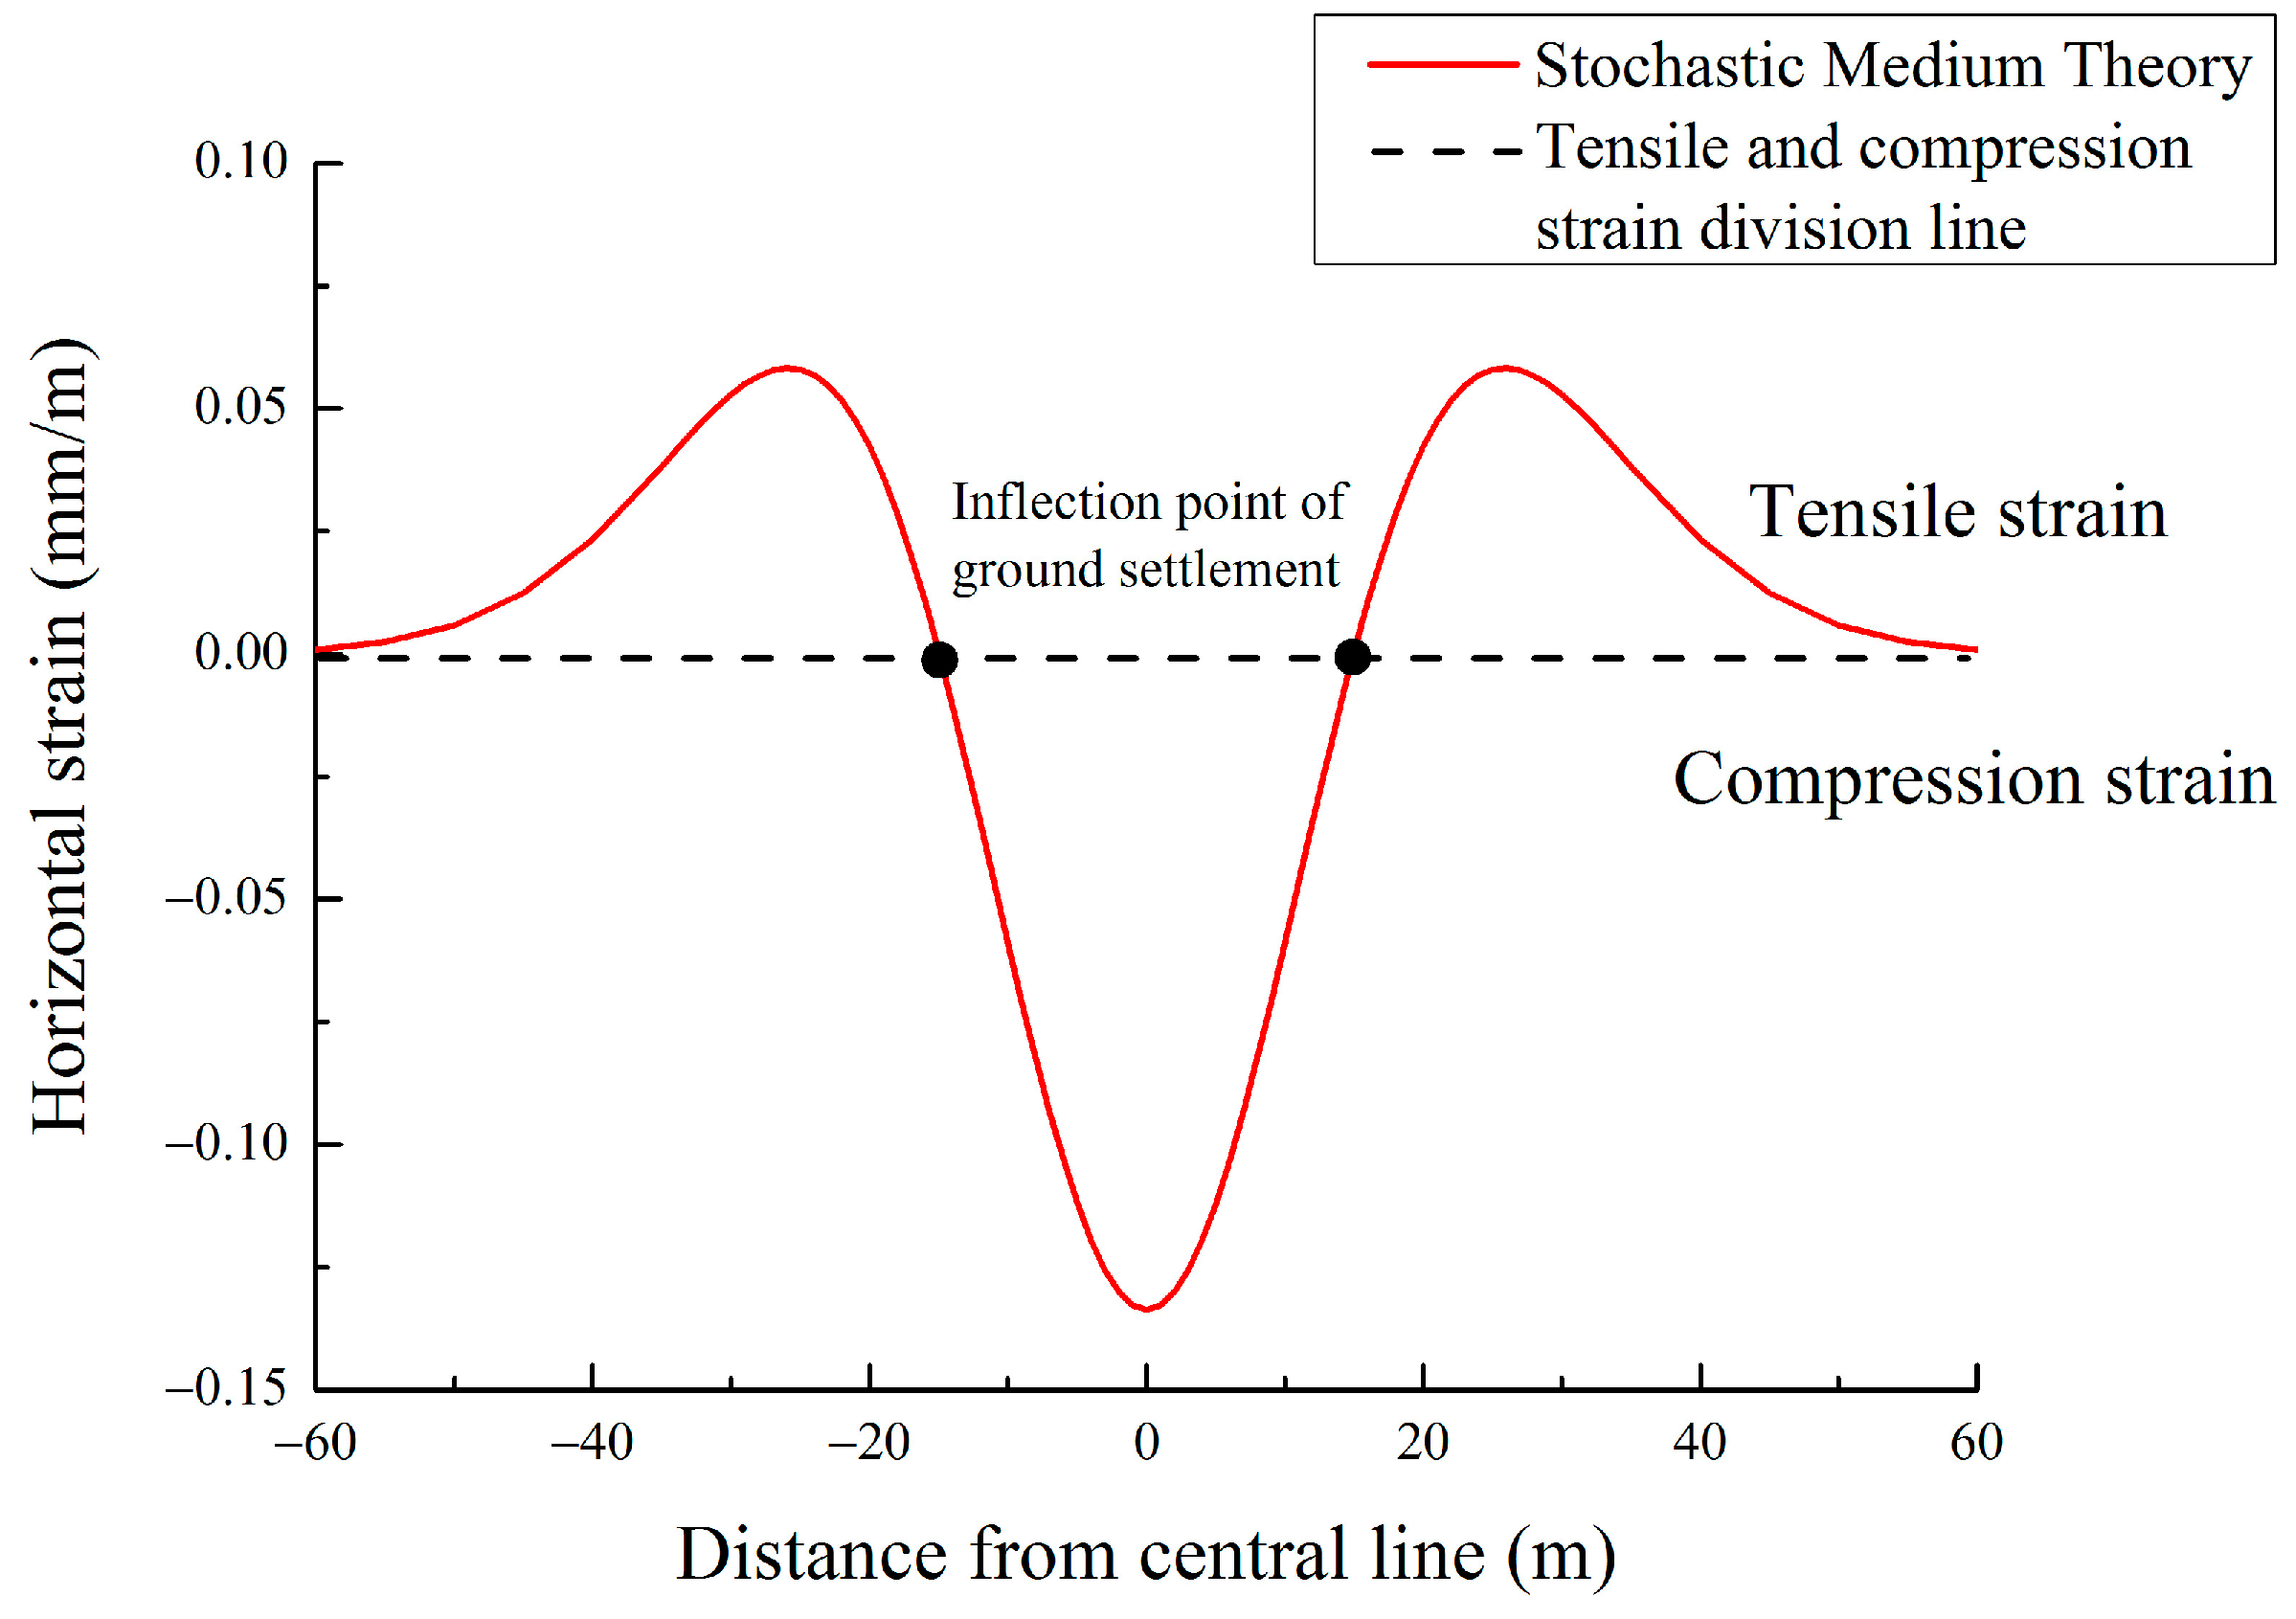
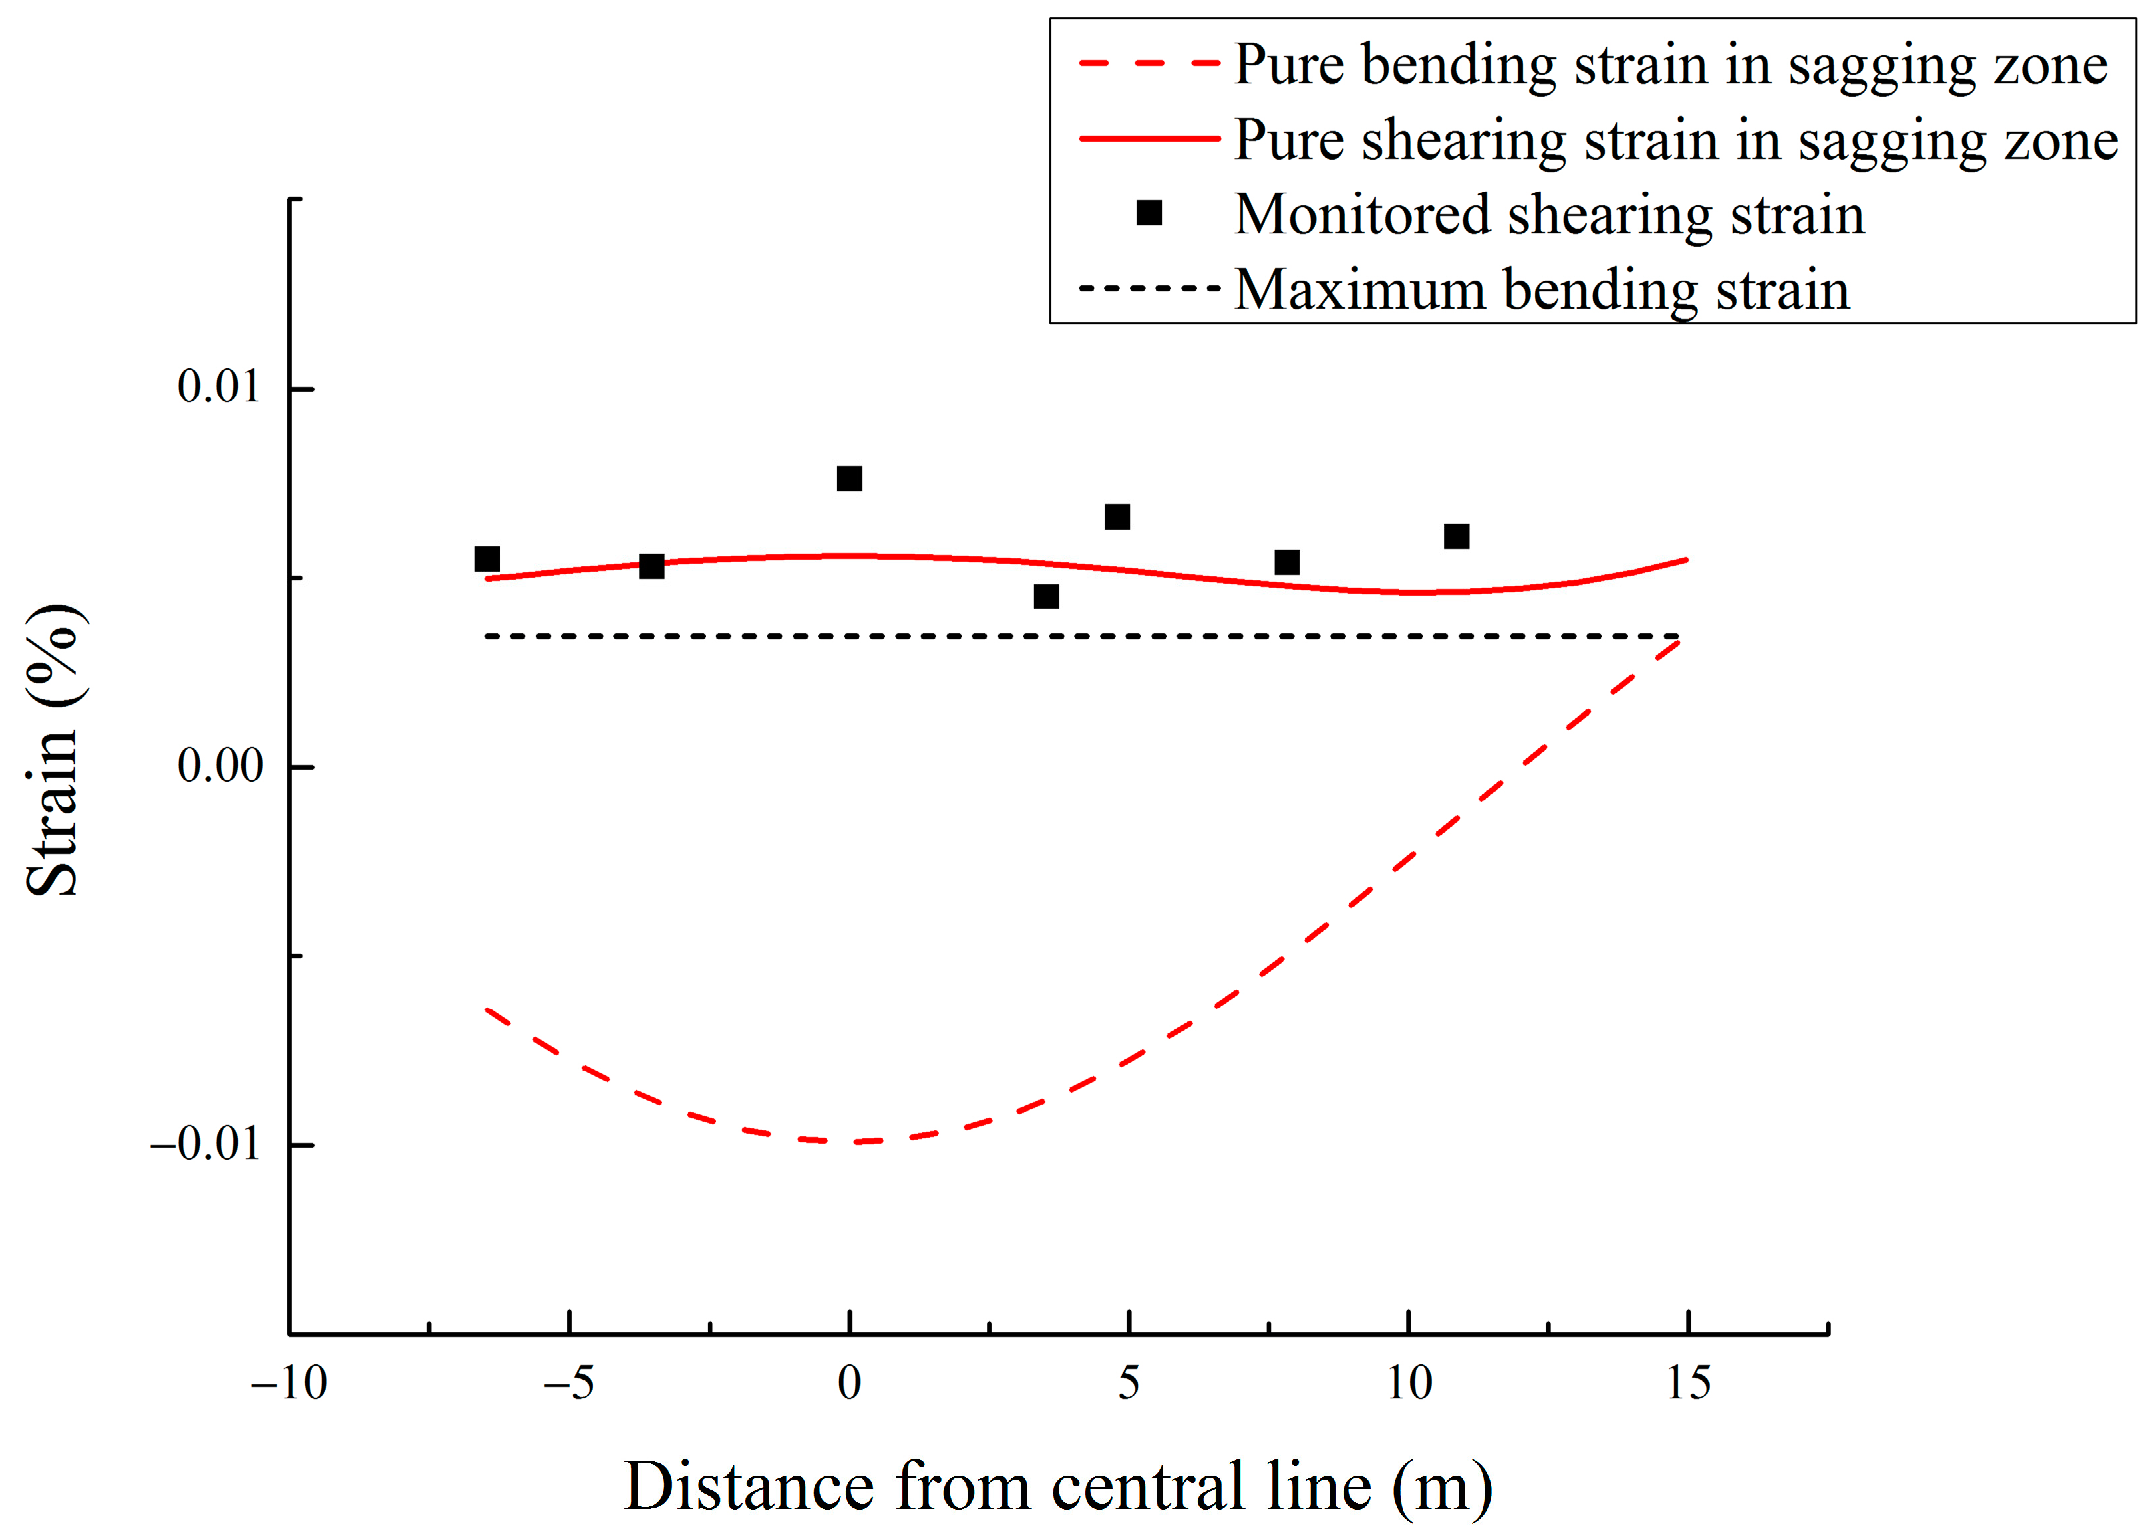
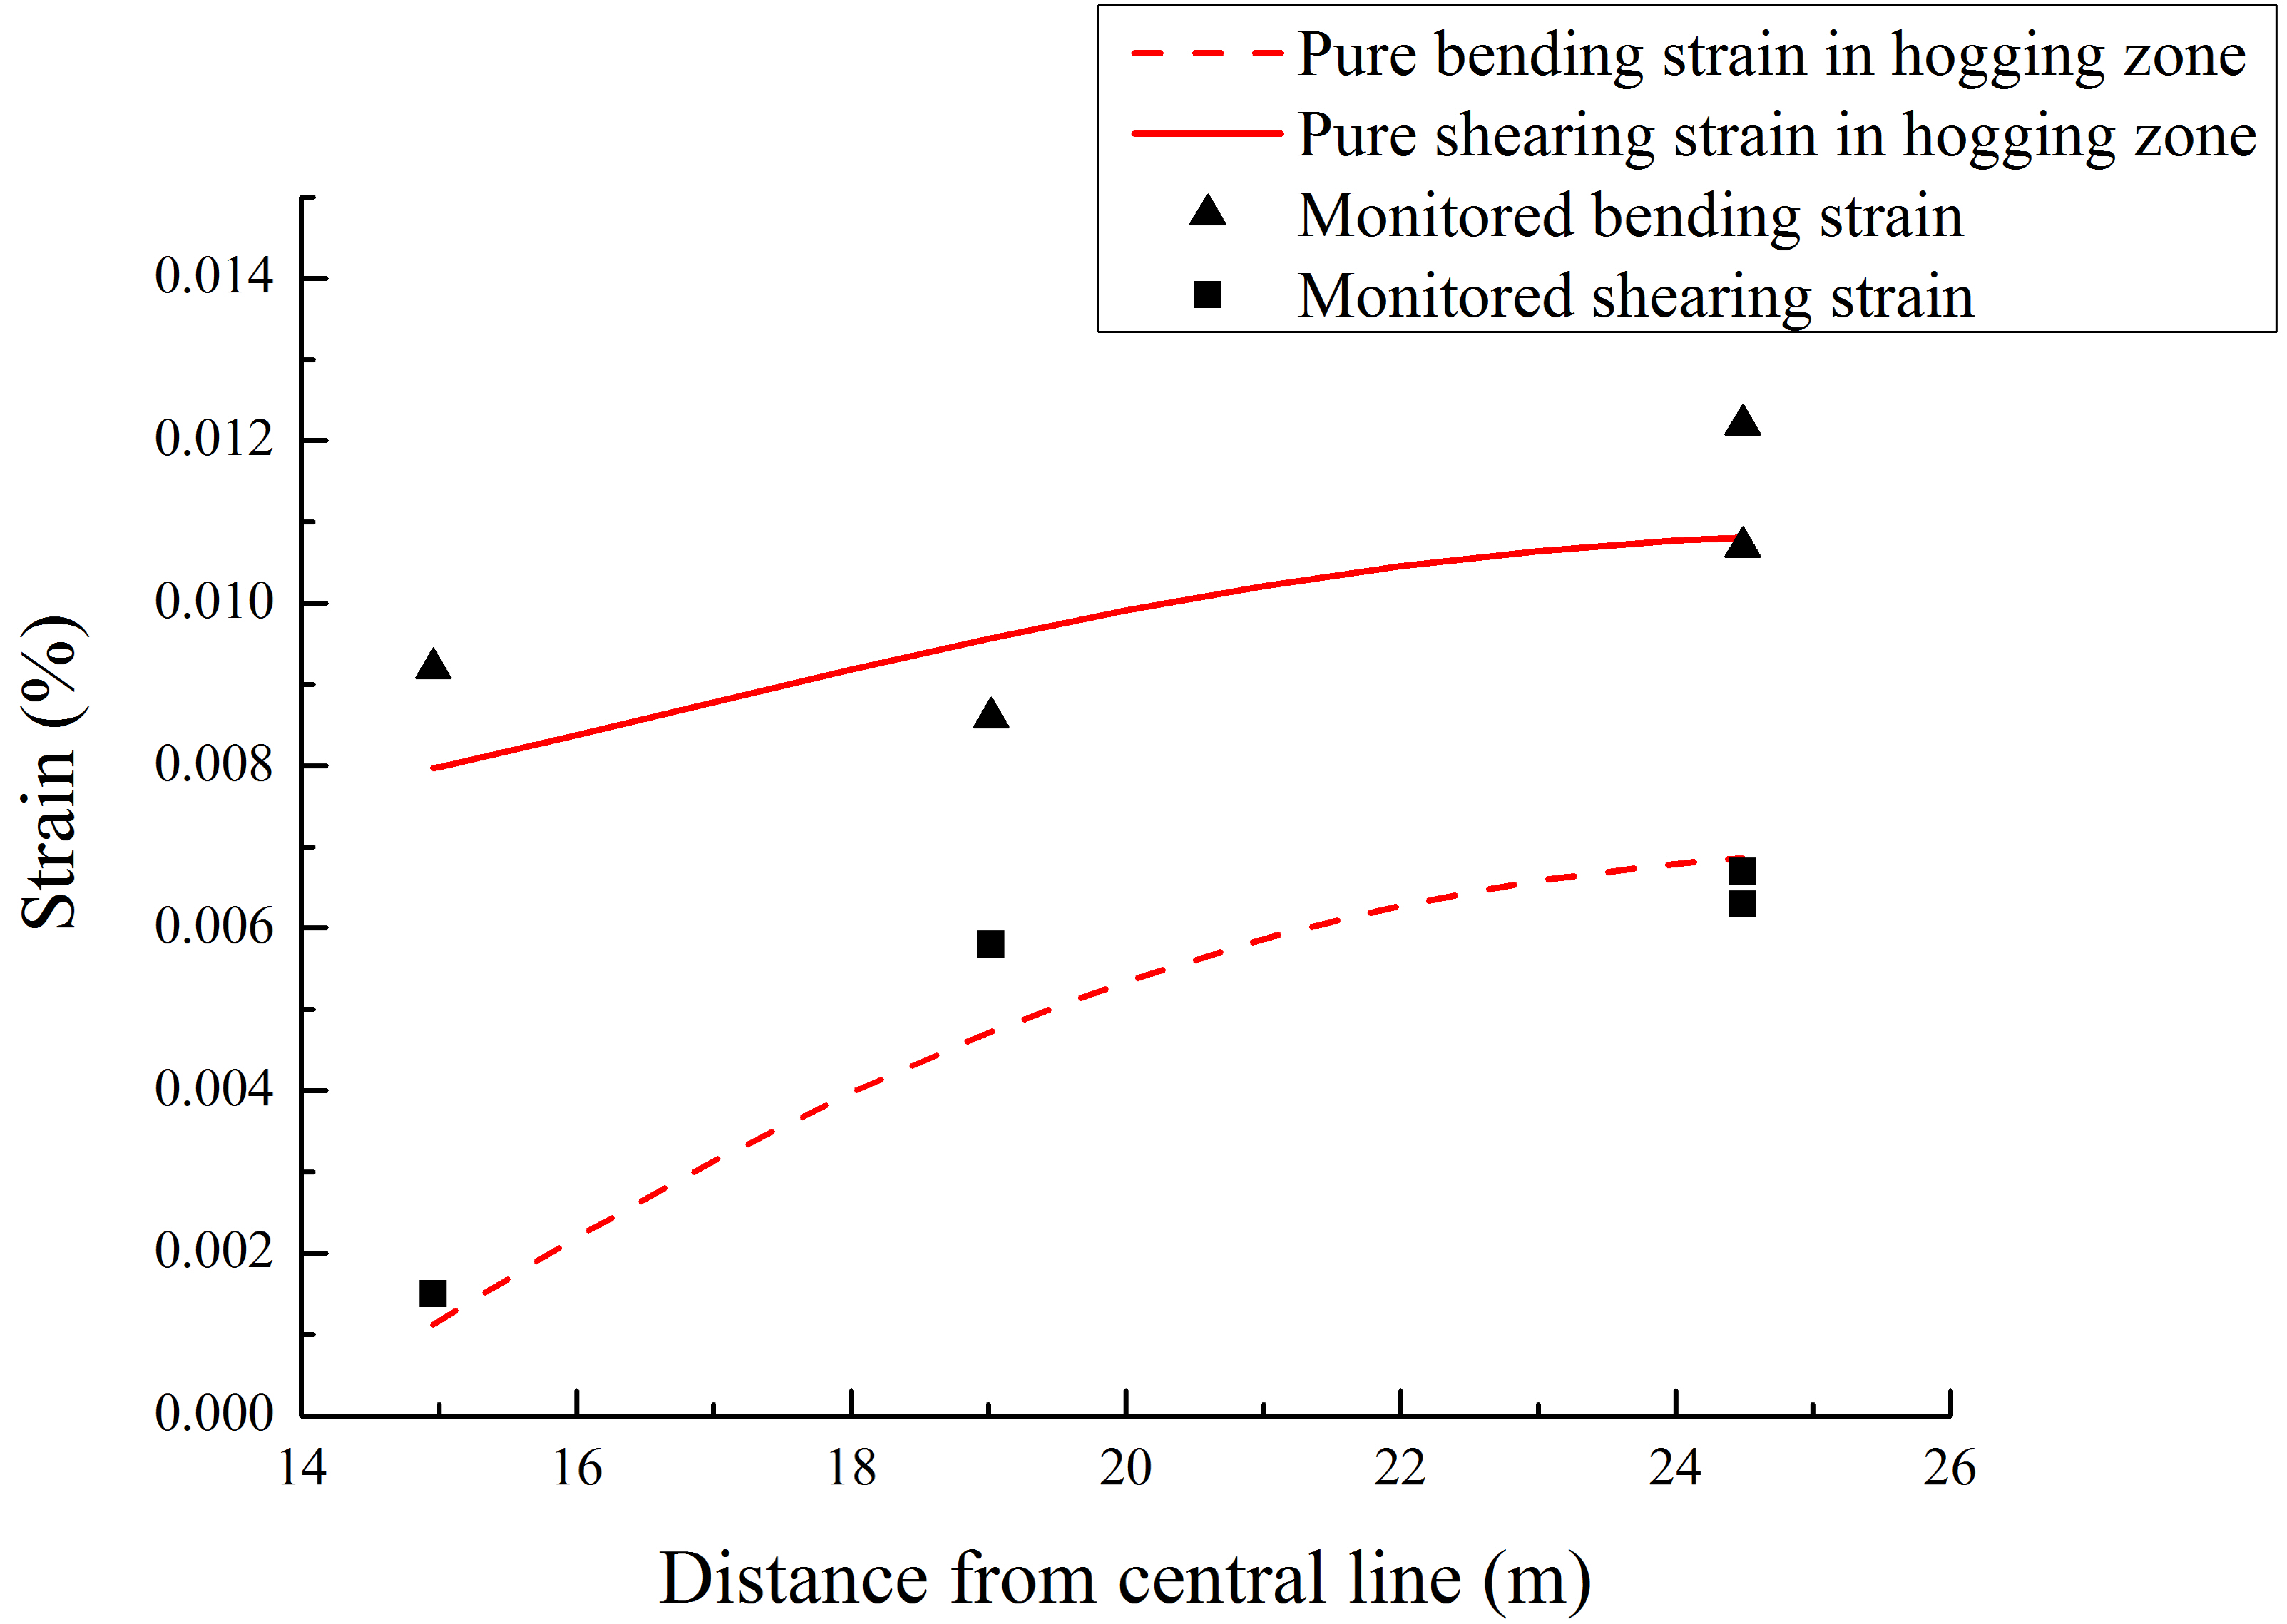
The Nanyan Fourth Circuit Transmission Reconstruction is located in the eastern part of Dalian City, Liaoning Province, China. The former No. 95 tower of Nanyan Fourth Circuit started at the Zhongshan Road and the two sides of the Malan River, and finally reached the Yanshui Substation, with a total length of 1.71 km. Many streets were along the tunnel. The buildings and underground networks were dense. Tunnel excavation led to ground settlement, which had a certain influence on the safe use of the surrounding pipelines and roads.
The tunnel excavation was conducted using drilling and blasting. The rock mass was medium-weathered quartzite with a lot of joints and fissures, and the joint dip angle was about 40°~80°. The core was fragmentary, columnar, medium-weathered and isogranular. The degree of integrity was from relatively complete to relatively broken, and the basic quality level of rock mass was class four (Figure 4). The other layers are shown in Figure 5.
The targeted building shown below is a four-story frame structure residential building, as shown in Figure 6. It is an old residential building built in 1987. The building adopted an independent foundation under the column and the horizontal and vertical bearing systems. The ground beam was set to enhance the stability of the overall bearing. The main structure was made up of beams, columns and floors made of tertiary rebar and C30 concrete. There were the Xinghai Convention and Exhibition Center subway station, residential areas, streets, highways, light rail and other public infrastructure around the building. All of the public infrastructure was in operation. Therefore, it was necessary to ensure the safety of existing structures during the tunnel excavation process.

4. Data Analysis

Figure 7 shows the distribution of the surrounding buildings and monitoring points. The blue color part represents the tunnel excavation. The measuring points were located on the third floor of the building. The main reasons for choosing the targeted building were as follows: (1) the tunnel excavation went under the targeted building, and the building was approximately perpendicular to the central axis of tunnel excavation; (2) the targeted building was a frame structure building, which conformed to the operating conditions of the equivalent beam principle; (3) the building was not symmetrical to the central axis of tunnel excavation, and the sagging and hogging zones were different, which is representative to a certain extent.
As mentioned above, the convergence radius of tunnels is mainly related to the excavation method. According to Li et al. [32], the convergence radius of the tunnel in this study was ΔR = 0.0042 m. The tangent value of the tunnel influence angle tan β is related to the excavation depth and the material properties of the overlaying rock masses. Through the parameter back analysis, tan β could be set to 0.70. The basic parameters of tunnel excavation were A = 3.4 m, B = 2.1 m, C = 4.85 m and H = 30.52 m.
In Figure 7, DB is the monitoring point of surface subsidence, and the corresponding surface subsidence curve is shown in Figure 8. It can be seen from the figure that the actual monitored surface settlement was generally slightly less than the predicted value of the stochastic medium theory, which also agrees with the conclusion of Burd [35]. In fact, the interaction between the whole tunnel–surface–foundation system is very complex. The dead weight of the building will increase the vertical displacement of the surface, while the interaction between the building and the surface will slow the deformation trend of the surface. In general, it is accepted that the self-weight of a building predominates.
The settlement of the ground surface here is the difference in the monitored values before and after the tunnel excavation. The Trimble DiNi03 electronic level was adopted to measure the deformation of the ground surface, and the height measurement accuracy was 0.01 mm. The theoretical maximum settlement of the ground surface was 3.58 mm, and the measured maximum was 3.89 mm. It can be considered that the curve was basically consistent with the actual results. It also shows that the method derived in this study could effectively predict the surface settlement caused by the tunnel excavation. The deformation limit of the ground surface was 20 mm according to the Code for Design of Railway Tunnel [36].
As shown in Figure 9, the measurement started on December 18. As the working face was excavated, the settlement increased quickly (acceleration phase). About a month later, the settlement continued to increase but with a relatively smaller increase rate (slow phase). The settlement eventually increased up to 3.65 mm and stabilized about 2 months after the construction was initiated.
In terms of the horizontal displacement of the surface, the measured values were generally slightly larger than the theoretical values, shown in Figure 10. Although a building’s dead weight increases the horizontal displacement of the surrounding surface, the interaction between the building foundation and the surface also weakens the horizontal displacement of the surface. The calculated maximum value of surface horizontal displacement was 1.21 mm, and the measured maximum value was 1.28 mm. The difference was within the controllable range, and the theoretical value was in good agreement with the measured value.
In Figure 11, the curve is divided into two parts by the horizontal strain εh = 0. The point of εh = 0 was the inflection point of the subsidence curve, which was also the dividing point between the sagging zones and hogging zones. In the sagging zones, the horizontal deformation of the surface was negative (εh < 0), resulting in compression strain. Hence, it had a buffer effect on building deformation. In contrast, the surface horizontal deformation in hogging zones was positive (εh > 0), resulting in tensile strain, and thus, promoting building deformation. This also verifies the views of Burland [37] and Fu et al. [26].
Figure 12 shows the strain in the sagging zones of the targeted building when E/G = 12.5. It can be seen from the figure that in sagging zones, the bending strain calculated using Equation (23) may be relatively small, or even less than 0. Because εh < 0, compression strain was generated. Camos and Molins [28] proposed that for the conservative estimation, εh could be considered as zero, and the maximum bending strain εbmax could be considered as the value of bending strain εb (i.e., the horizontal dashed line in Figure 12). In terms of the shear strain, the maximum shear strain calculated theoretically was 0.0056%, which occurred directly above the central axis of the tunnel. Meanwhile, due to the measurement error, the measured value fluctuated between 0.005% and 0.008%. Furthermore, at the boundary X = 14.96 m in the sagging zones, the shear strain was also relatively large, which was 0.0055%. Therefore, during the process of tunnel excavation, attention should be paid to the maximum tensile strain at the two places directly above the central axis of the tunnel and the boundary in sagging zones.
In addition, it can be seen that there was little difference between the bending strain and shear strain in the sagging zones. This indicates that the building was subjected to both bending and shear deformation in sagging zones. In fact, because the value of l/h (1.96) in sagging zones was relatively large, even though the targeted building was a frame building, the bending deformation was also a non-negligible factor.
Figure 13 shows the strain of the targeted building in hogging zones. Both the bending strain and shear strain increased with the growth of the X-coordinate. Both maxima were generated at the abscissa of 30.95 m, which was at the edge of the building. The maximum bending strain calculated theoretically was 0.0069%, and the measured strain was 0.0067%. The maximum shear strain calculated theoretically was 0.0108%, and the measured shear strain was 0.0122%. Furthermore, the measured values of the bending strain and shear strain basically matched the theoretical results. Hence, it can be considered that the formula derived in this study could effectively predict the strain of the building. Additionally, it can be seen that the shear strain was much greater than the bending strain in the hogging zones. This was because of the small value of l/h (0.87) in the hogging zones.
To sum up, the maximum strain of the building studied in this case was the shear strain in the hogging zones, i.e., ε max = ε d r h o g . Table 1 shows the building deformation and failure classification according to Burland and Wroth [27]. The maximum tensile strain of the target building was 0.0122%, which belongs to the category class zero with a tiny deformation. Therefore, it can be considered that the building was in a safe and stable state after the tunnel excavation.
In fact, the surrounding rock masses of the tunnel excavation were mainly moderately weathered quartzite with relatively high strength and stiffness. Thus, the settlement and deformation of the surface and the building caused by the excavation were relatively small. Moreover, the building was a frame structure with a relatively large and stable length-to-height ratio l/h. However, in many other urban areas, tunnel excavation is carried out at a shallow depth and even in a shallow soil layer, resulting in a large settlement and horizontal displacement. In particular, some tunnel excavations go under the masonry structure of the building, which causes a large deformation of the building. Therefore, the corresponding parameters were analyzed and are further discussed in the next section.

5. Sensitivity Analysis

As mentioned above, the maximum strain of the building based on the stochastic medium theory was calculated. In this section, the results of the parameter sensitivity analysis regarding the strain obtained by the formula are given, and then the detailed influences of the main parameters on the maximum strain of the building are discussed.

5.1. Parameters of the Stochastic Medium Theory

In general, there are two main parameters of the stochastic medium theory, i.e., the tangent of tunnel influence angle tan β and the convergence radius of tunnel ΔR. Simultaneously, this section will also discuss the influence of tunnel excavation depth H on the results.

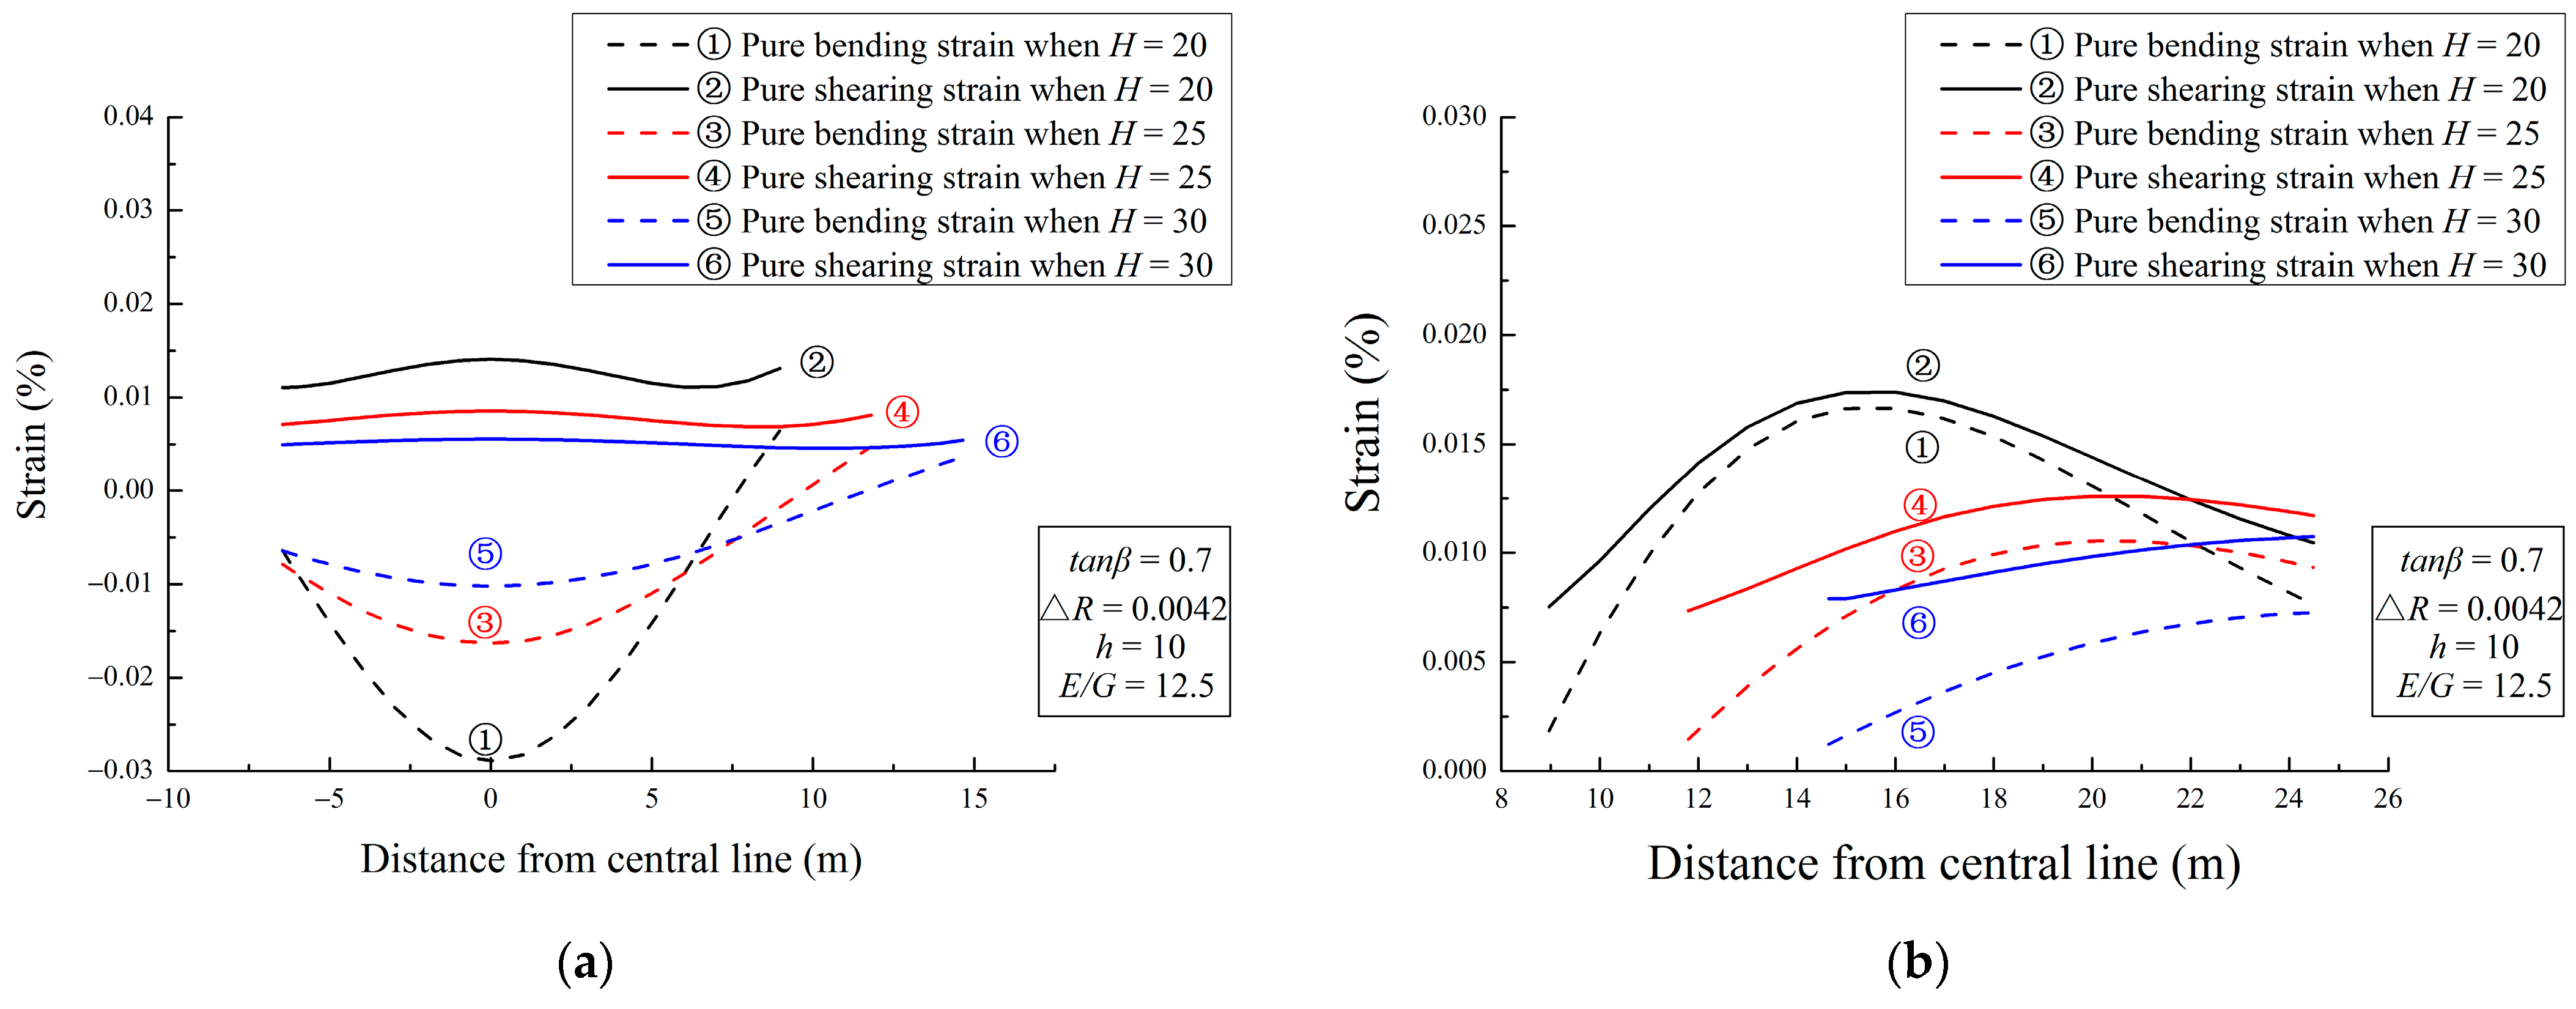
5.1.1. Depth of the Tunnel

There are many kinds of tunnels excavated in urban cities, such as municipal tunnels, traffic tunnels and pipes. A large number of them are shallow or ultra-shallow tunnels. In this section, the distance from the tunnel floor to the ground surface H mentioned above was set to be 20 m, 25 m and 30 m to discuss the influence of the excavation depth on building deformation.
It can be seen from Figure 14 that in sagging zones, with the growth of excavation depth, the shear strain was greater than the bending strain, the maximum shear strain was generated just above the central axis of the tunnel, and the range of the hogging zones gradually increased. In the hogging zones, the shear strain was also greater than the bending strain, and the maximum tensile strain gradually decreased with the increase in depth, which indicated that the greater the excavation depth, the smaller the influence of the tunnel on the surface and building deformation. In addition, it can be seen that with the increase in excavation depth, the position of the maximum shear strain generation in the hogging zones gradually moved from the middle to the edge of the building.

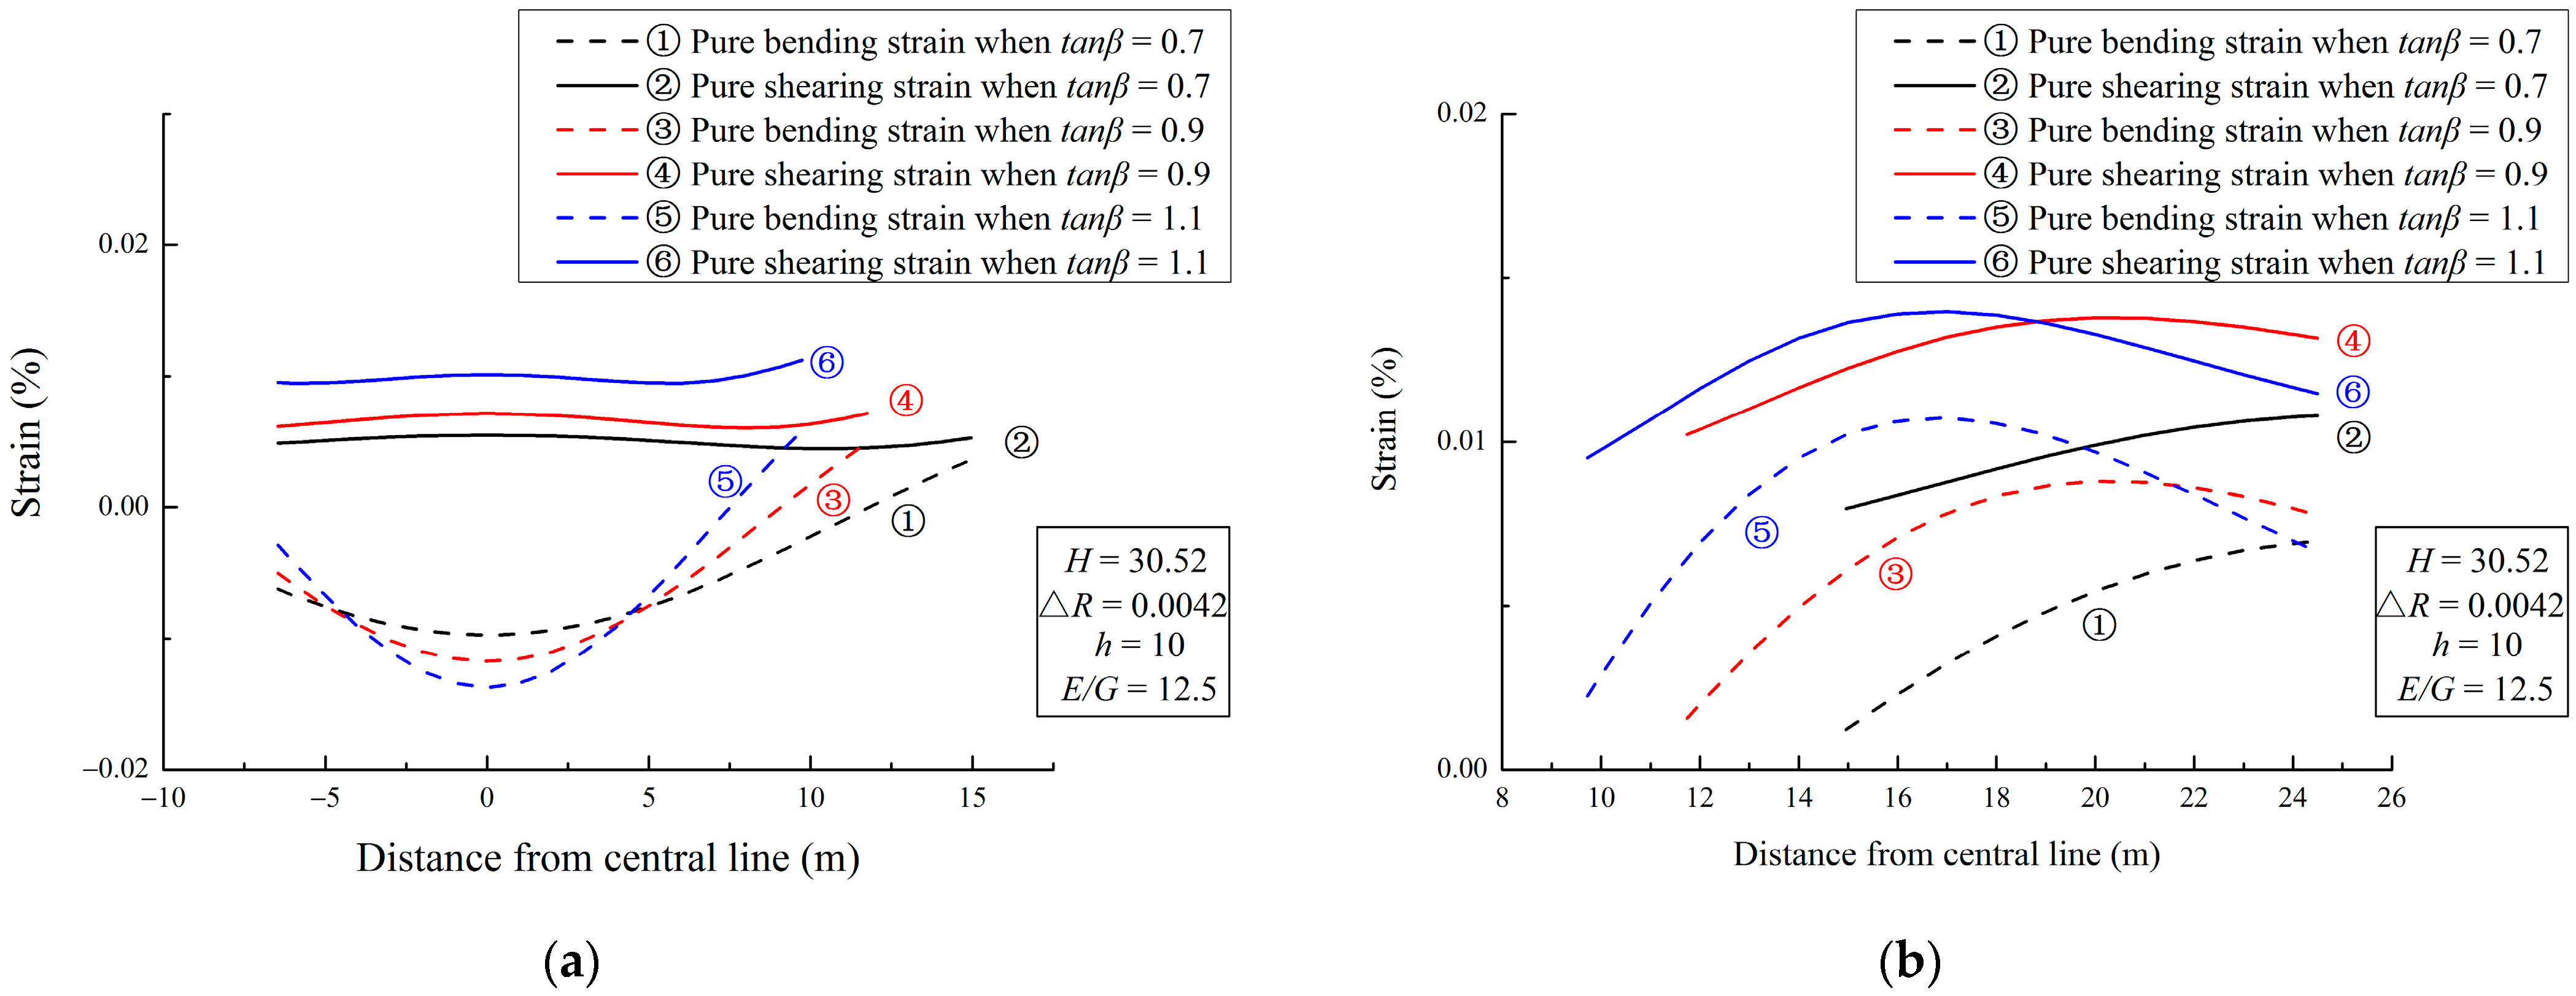
5.1.2. Tangent of the Influence Angle tan β

Figure 15 shows the effect of the tangent of the tunnel influence angle on the maximum tensile strain. It can be seen that the tunnel influence angle also affected the range of the sagging and hogging zones. In the sagging zones, the shear strain was greater than the bending strain. In the hogging zones, the maximum shear strain occurrence gradually moved from the edge of the building to the middle.

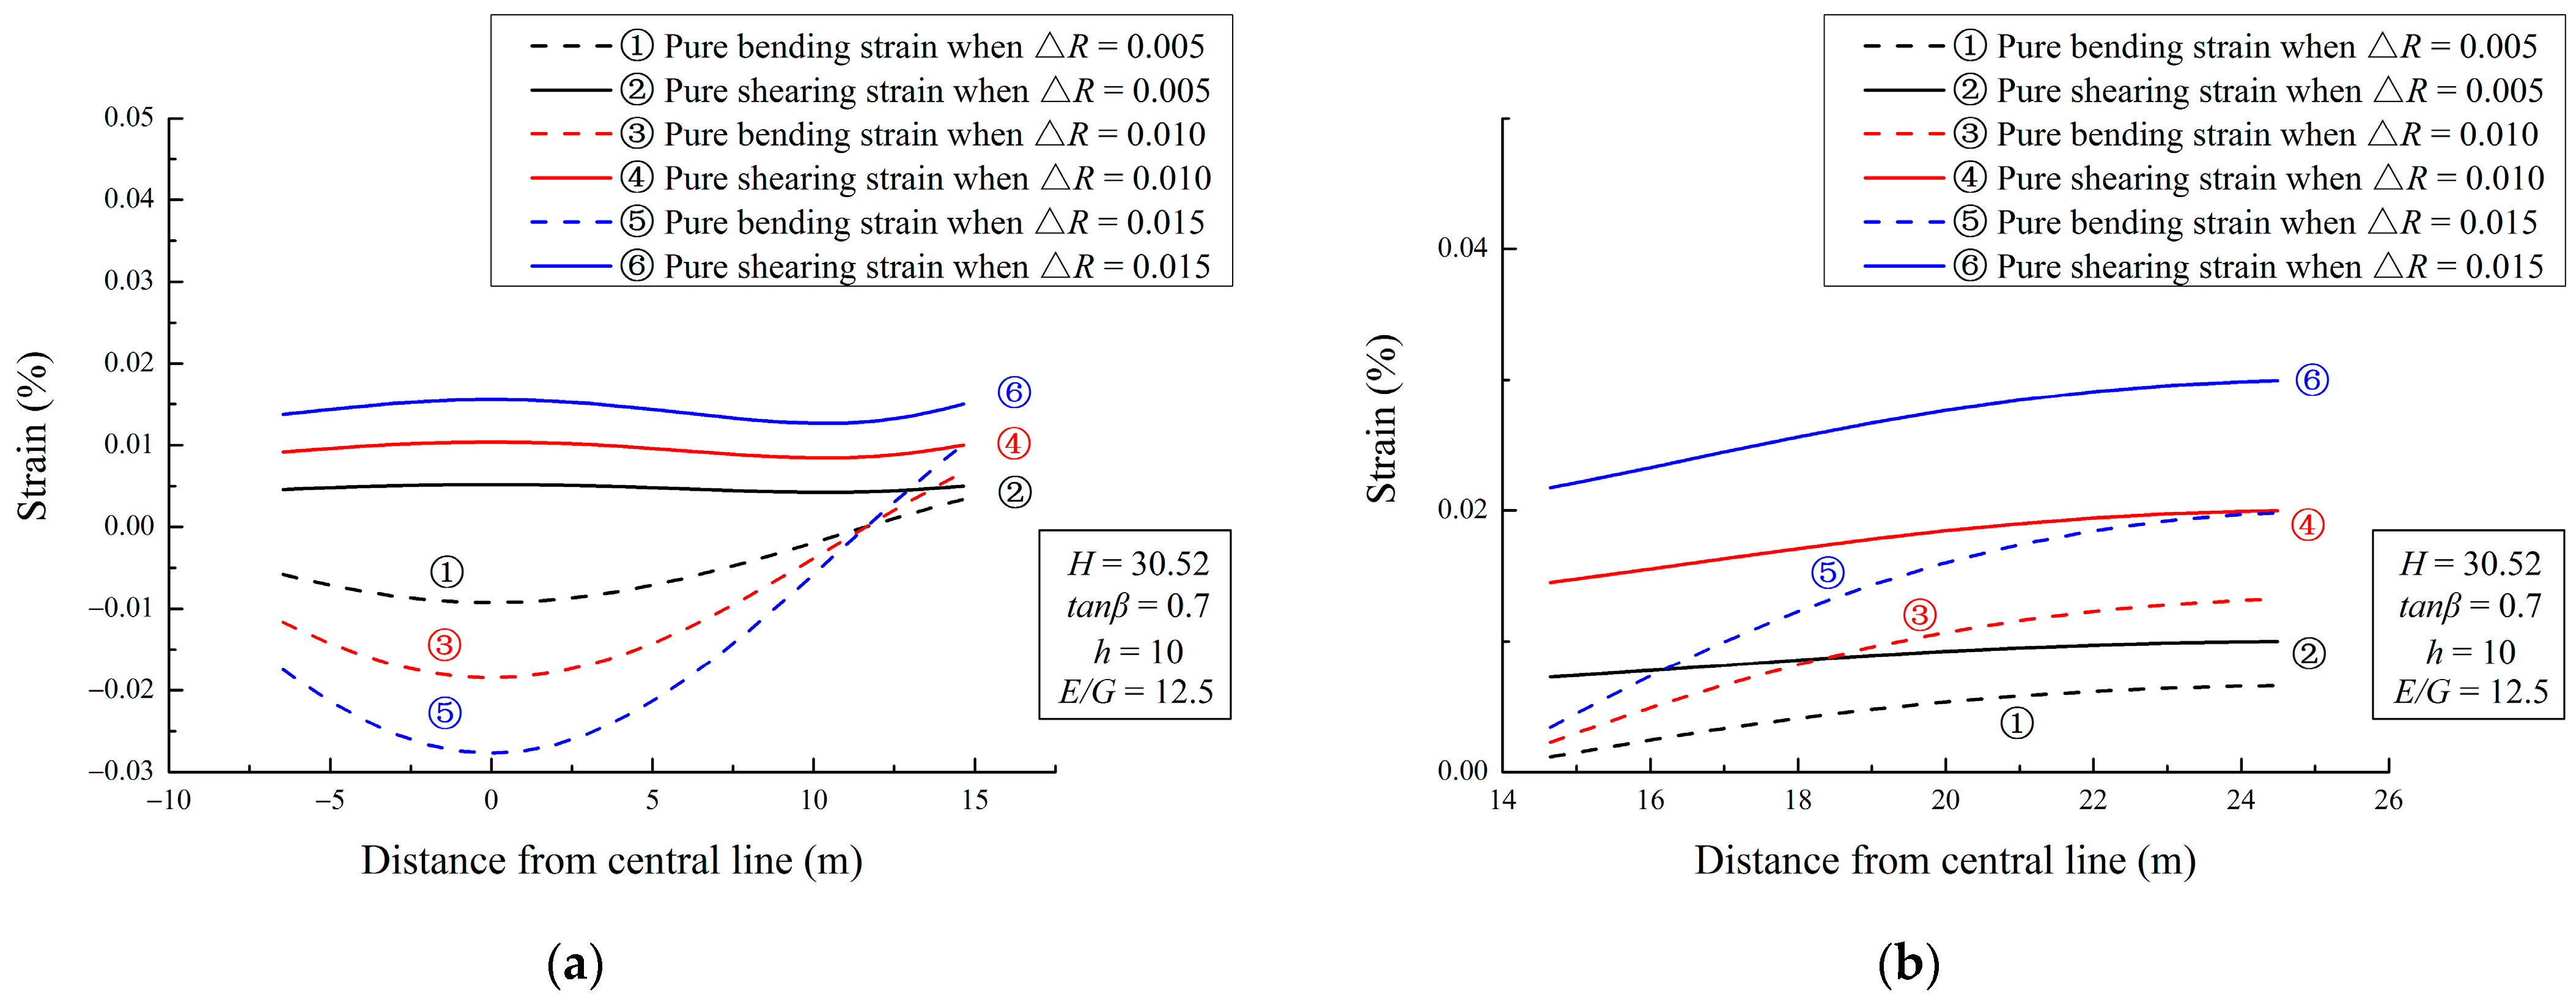
5.1.3. Radius of Tunnel Convergence ΔR

As can be seen from Figure 16, the convergence radius ΔR did not change the range of sagging zones and hogging zones. Because the convergence radius of the tunnel reflects the construction method, the stress state of the original rock and other conditions, a smaller tunnel convergence indicated a better and more stable state of the surrounding rock and soil. Moreover, it can also be seen from Figure 16 that the growth of ΔR increased both the bending strain and shear strain in the sagging and hogging zones, but did not change the deformation mode of the building.

5.2. Parameters of the Equivalent Beam Theory

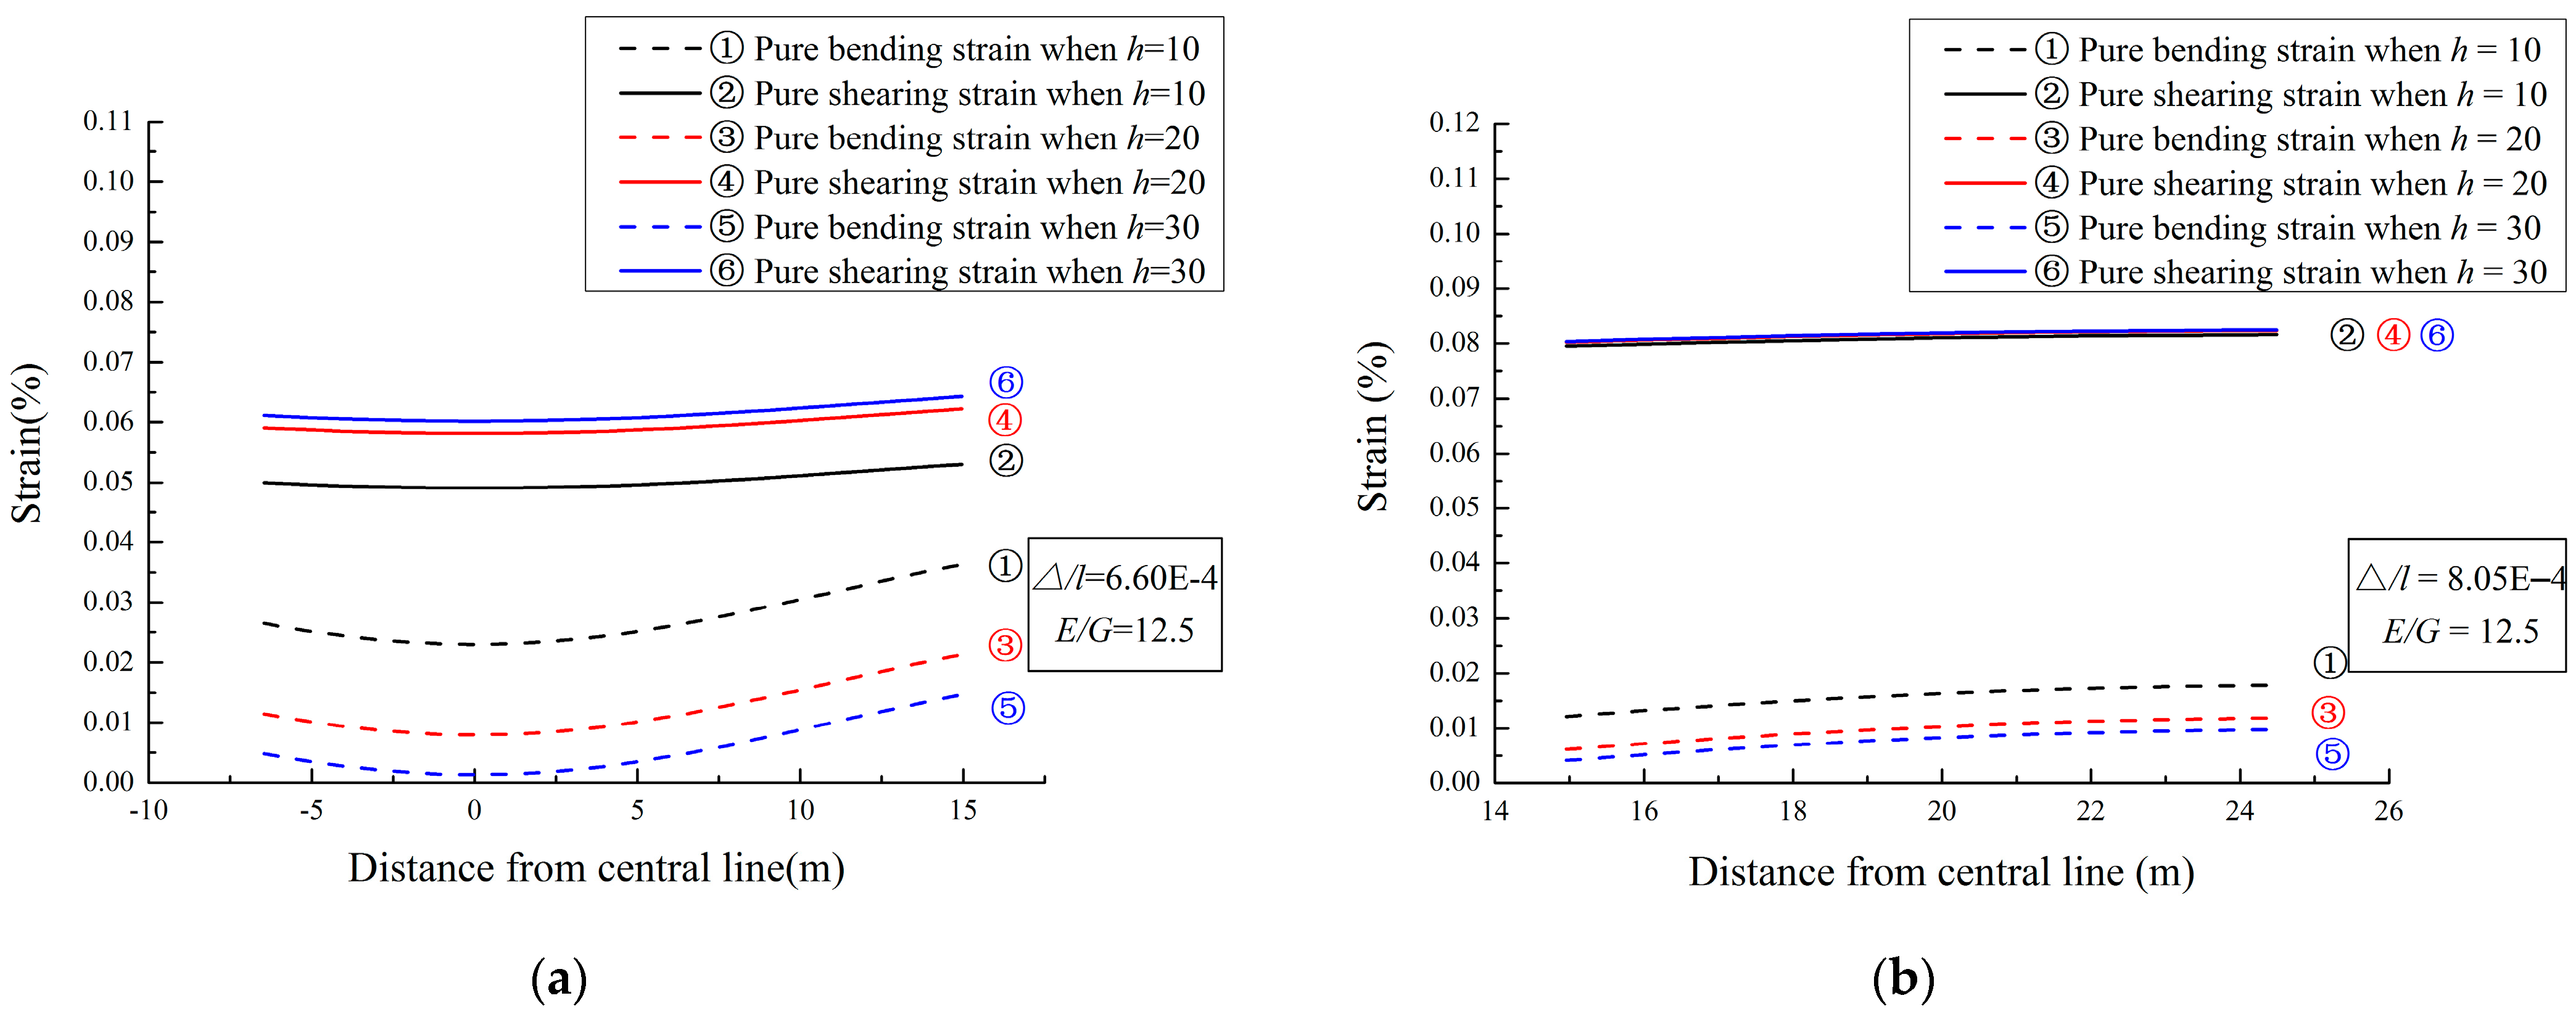
5.2.1. Height of the Building h

Usually, the height of a frame building is lower than 50 m because of the requirement of seismic fortification. In order to give the research practical significance and engineering reference, this study considered the deformation of a building when h was within the range of 10–30 m. Meanwhile, Δ/l was set to 6.6 × 10⁴ and 8.1 × 10⁴ (relatively large) to analyze the deformation mode of the building. It can be seen from Figure 17 that when the deflection of the building was relatively large, the bending strain of the building gradually decreased in the sagging zones, while the shear strain gradually increased. In the hogging zones, the shear strain was almost the same, and the bending strain gradually decreased. These results are in line with reality.

5.2.2. Relative Position of the Measured Points l

The relative position l of a measured point can be decomposed into two parts, namely, lsag in the sagging zones and lhog in the hogging zones, as shown in Figure 3. The sum of these two values equals the total length of the building. In fact, the total length of a specific building is fixed. The dividing point between sagging zones and hogging zones is the inflection point (second derivative) of the settlement curve. Moreover, h/l is considered a parameter. If the value of l is given, the growth of h will cause the growth of h/l, as described above, which will not be repeated here.

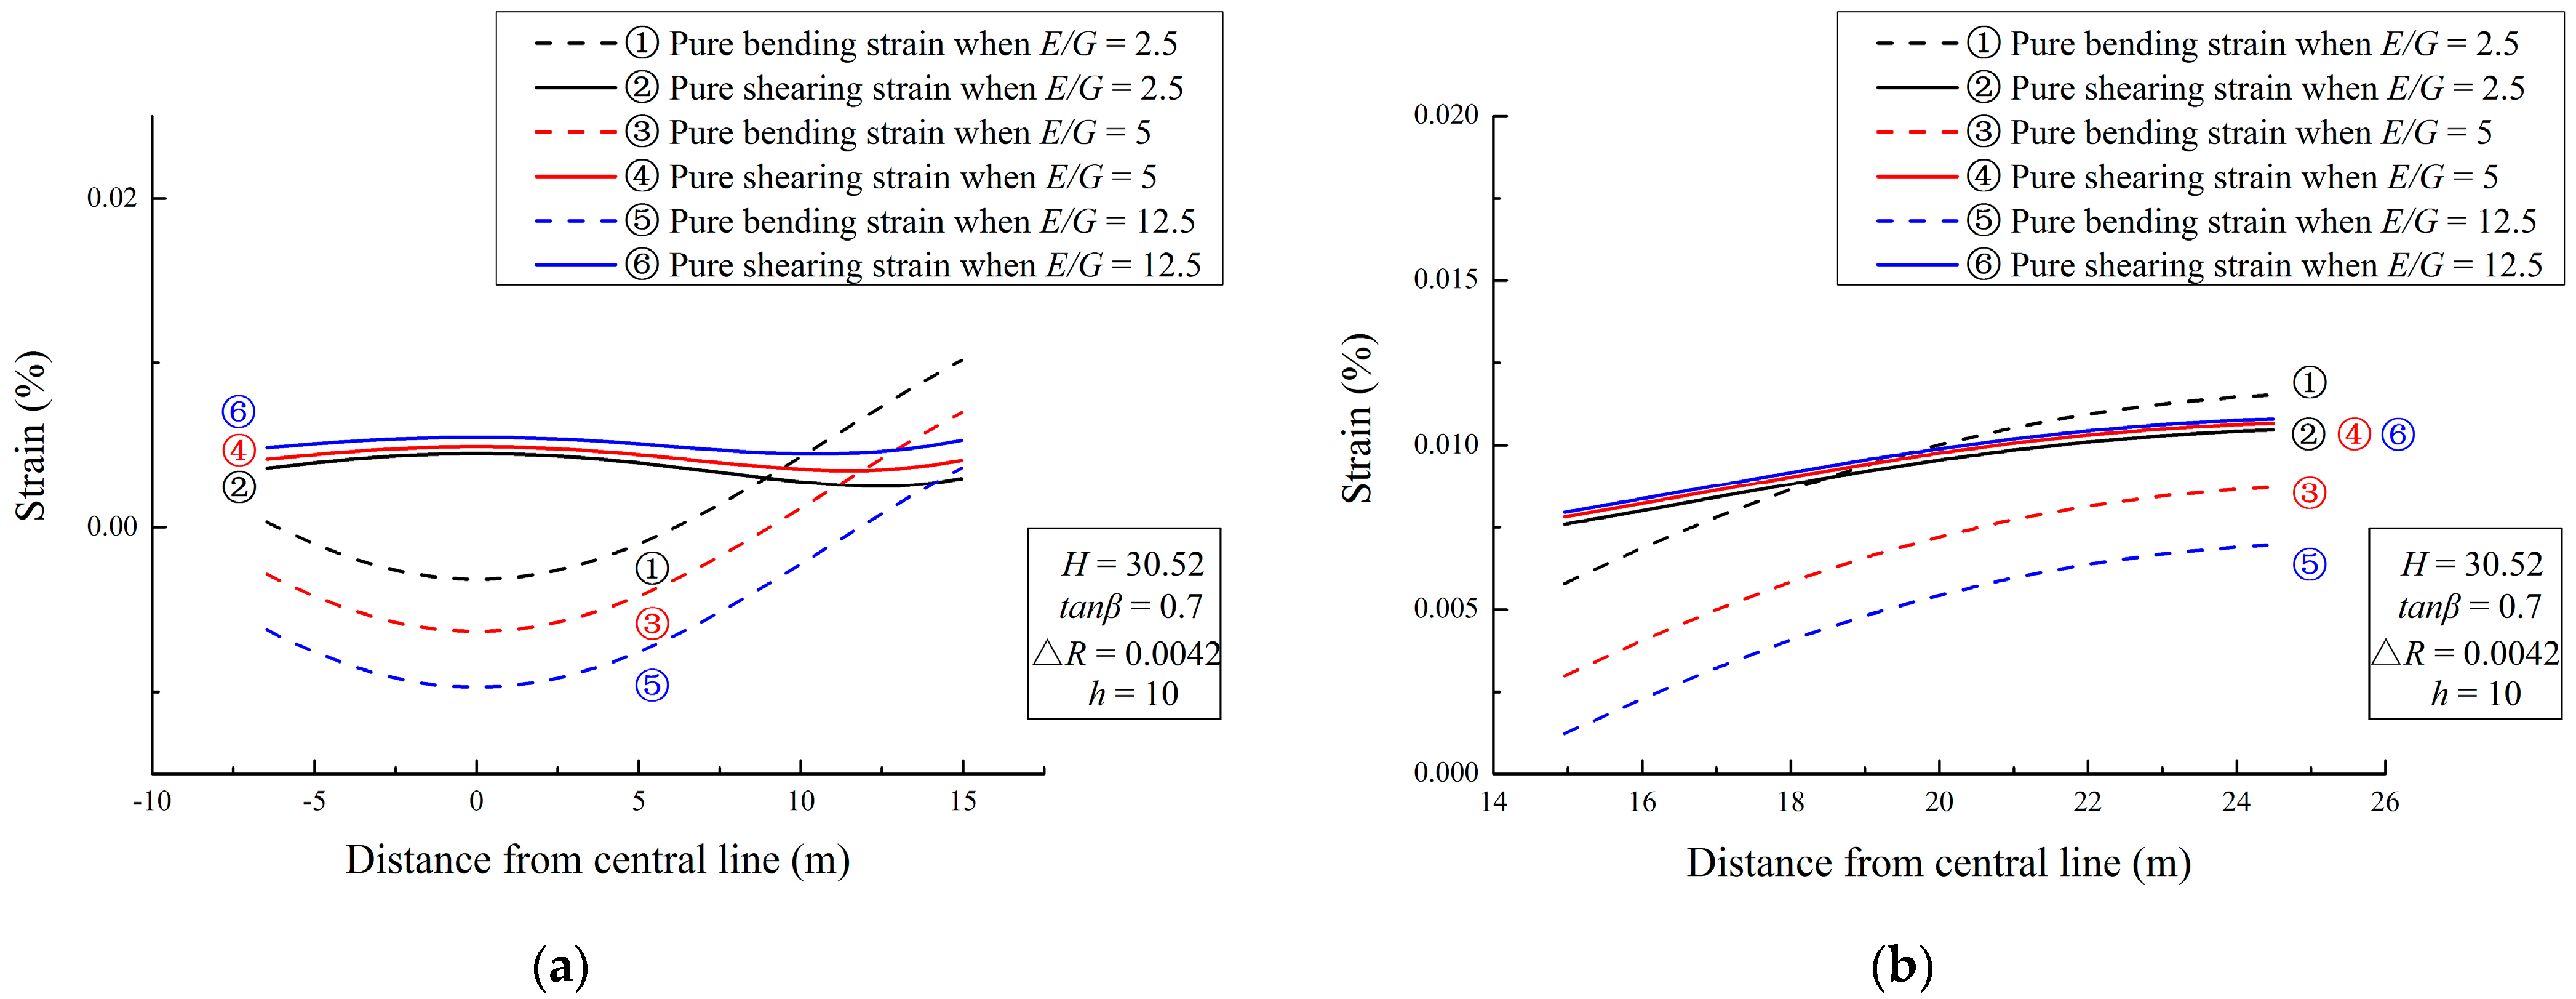
5.2.3. Ratio of Young’s Modulus to Shear Modulus E/G

As mentioned above, the ratio of Young’s modulus to the shear modulus E/G varies greatly for different building types. For masonry buildings, E/G is usually around 2.6 [27]. However, for frame buildings, E/G is usually around 12.5, as referenced by Burland and Wroth. Because the shear stiffness of frame structures is relatively lower than the flexural stiffness, most of them will mainly suffer shear deformation. However, for masonry structure buildings, according to the different l/h, bending deformation may predominate.
It can be seen from Figure 18 that as the value of E/G increased, the bending strain of the building in the sagging zones gradually decreased, while the shear strain slightly increased. The maximum tensile strain gradually transitioned from bending strain to shear strain. This also accords with the actual situation, where the masonry structure mainly suffered bending deformation and the frame structure mainly suffered shear deformation. In addition, it can be seen that the maximum bending strain occurred at the boundary between the sagging and hogging zones, while the maximum shear strain occurred just above the central axis of the tunnel. In the hogging zones, the shear strain showed little change, while the bending strain gradually decreased with the increase in E/G, and all of them occurred at the edge of the building.
It should be noted that the factors that affect surface deformation, including the tunnel excavation depth, stratum conditions and tunnel convergence value, are not isolated. Actually, they can interact and influence each other. Therefore, in the actual design and construction, it is suggested to make a comprehensive analysis of multiple factors to comprehensively consider the possible impact of tunnel excavation on the surface and the building.

6. Discussion

Bruland and Wroth [27] suggested that the E/G of frame buildings should be 12.5. It should be noted that in Equation (23), the first term is εh(1 − E/4G). If E/G = 12.5, the result of this term is negative, indicating that the surface deformation will slow the shear deformation of the building and make the shear strain smaller, which is obviously not in line with reality. Mair et al. [34] suggested that the Poisson’s ratio of frame structure buildings should be set to v = 0.3, and the following formula can be used to calculate the shear deformation of buildings:
ε d r = 0.35 ε h + ( 0.65 ε h ) 2 + ε d max 2
In this study, Equation (28) was used to avoid calculation errors. As is known, there is reinforced concrete in frame buildings, which is more sensitive to shear and is not easily influenced. The value of E/G is nearly impossible to measure. Therefore, an equivalent parameter was adopted to analyze the shear deformation strain. As for the masonry buildings, E/G was set to be 2.6 [27,28,34,37] and no such errors were generated.

7. Conclusions

(1) In this study, a new evaluation method for predicting the deformation characteristics of buildings based on stochastic medium theory and equivalent beam model was proposed. Compared with the conventional methods, this method can take into account the influence of horseshoe-shaped tunnel excavation on surface deformation under the condition of non-uniform convergence. Moreover, it has a clearer theoretical basis and wider applicability.
(2) The stochastic medium theory was successfully applied to predict the horizontal and vertical displacement of the ground surface, and the results indicated that it can effectively estimate the deformation trend and value of the ground surface.
(3) The ratio of building length to the height of the targeted building in the sagging zones in the Nanyan Fourth Circuit Transmission Reconstruction was 1.96 under the effect of both bending deformation and shear deformation. In the hogging zones, the ratio of the building length to the height was 0.87, and the shear strain was much larger than the bending strain. The maximum value of the building strain was 0.0108%, and the measured value was 0.0122%. The small difference between the calculated value with the measured data indicates that the proposed method can effectively predict and calculate the deformation of buildings.
(4) The convergence radius, the height of the building and the ratio of Young’s modulus to the shear modulus can only change the maximum tensile strain of the building. However, the depth of the tunnel and the tangent of the tunnel influence angle will significantly change the range of the sagging zones and the hogging zones.
(5) The maximum tensile strain value of the targeted building in the Nanyan Fourth Circuit Transmission Reconstruction occurred at the edge of the building in the hogging zones, and the damage degree was relatively slight. Therefore, the building can be considered to be in a relatively safe state.

Author Contributions

Conceptualization, Y.L. and B.G.; methodology, Y.L. and B.G.; investigation, Y.L. and G.Z.; formal analysis, Y.L. and T.L.; validation, G.Z. and K.W.; data curation, Y.L.; visualization, Y.L.; supervision, B.G. and C.T.; resources, C.T.; funding acquisition, C.T.; writing—original draft preparation, Y.L.; writing—review and editing, B.G. All authors have read and agreed to the published version of the manuscript.

Funding

This research was financially supported by the National Natural Science Foundation of China (Grant no. 41941018).

Data Availability Statement

The datasets generated and/or analyzed during the current study are available from the corresponding author upon reasonable request.

Acknowledgments

We acknowledge the technical support from the Northeastern Branch of China Construction Eighth Engineering Division Corp. Ltd. and the North China Branch of China Construction Eighth Engineering Division Corp. Ltd.

Conflicts of Interest

The authors declare no conflict of interest.

Appendix A

Table A1. Integration point (xi) and Gaussian weighting coefficient (Ai) of the Gauss–Legendre integral. (Reprinted with permission from Ref. [32]. Copyright 2021 Springer Nature).
nIntegration Point Gaussian Weighting Coefficient
2±0.57735026921.0
30.00.8888888889
±0.77459666920.5555555556
4±0.339998104360.6521451549
±0.86113631160.3478548451
50.00.5688888889
±0.53846931010.4786286705
±0.90617984590.2369268851
6±0.23861918610.4679139346
±0.66120938650.3607615731
±0.93246951420.1717244923

References

  1. Xie, H.; Leung, C.; Wang, J.; Li, X. Advancing deep underground research through integration of engineering and science. Deep Undergr. Sci. Eng. 2022, 1, 1–2. [Google Scholar] [CrossRef]
  2. Raphael, S.; Yu, H.T.; Robert, B. UCIMS: Advances in geotechnical construction and performance monitoring. J. Rock Mech. Geotech. Eng. 2015, 7, 207–212. [Google Scholar]
  3. Chen, G.; Liu, X.; Song, D. Research on in situ stress inversion of deep-buried tunnel based on pressure/tension axis mechanism and geological structure. Deep Undergr. Sci. Eng. 2023, 2, 1–13. [Google Scholar] [CrossRef]
  4. Fang, Q.; Zhang, D.L.; Wong, L.N.Y. Environmental risk management for across interchange metro station construction in China. Tunn. Undergr. Space Technol. 2011, 26, 750–763. [Google Scholar] [CrossRef]
  5. Zhao, C.Y.; Lavasan, A.A.; Hölter, R.; Schanz, T. Mechanized tunneling induced building settlements and design of optimal monitoring strategies based on sensitivity field. Comput. Geotech. 2018, 97, 246–260. [Google Scholar] [CrossRef]
  6. Hu, L.; Wang, J.; Karrech, A.; Li, X.; Zhao, P.; Liu, L. Exploring the frontiers of deep underground sciences and Engineering—China Yunlong Lake Laboratory is striving to be the best. Deep Undergr. Sci. Eng. 2022, 1, 130–136. [Google Scholar] [CrossRef]
  7. Wang, Y.; Liu, X.; Xiong, Y. Numerical simulation of zonal disintegration of surrounding rock in the deep-buried chamber. Deep Undergr. Sci. Eng. 2022, 1, 173–181. [Google Scholar] [CrossRef]
  8. Peck, R.B. Deep excavations and tunnelling in soft ground state-of-the-art report. In Proceedings of the 7th International Conference on Soil Mechanics and Foundation Engineering, Mexico City, Mexico, 29 August 1969; pp. 225–290. [Google Scholar]
  9. Attewell, P.B.; Woodman, J.P. Predicting the dynamics of ground settlement and its derivatives caused by tunnelling in soil. Ground. Eng. 1982, 15, 13–22. [Google Scholar]
  10. O’Reilly, M.P.; New, B.M. Settlements above tunnels in United Kingdom-their magnitude and prediction. In Tunnelling’82 Symposium; Institution of Mining and Metallurgy: London, UK, 1982; pp. 173–181. [Google Scholar]
  11. Mair, R.J.; Taylor, R.N.; Bracegirdle, A. Subsurface settlement profiles above tunnels in clays. Géotechnique 1993, 43, 315–320. [Google Scholar] [CrossRef]
  12. Ng, C.W.W.; Boonyarak, T.; Mašín, D. Three-dimensional centrifuge and numerical modeling of the interaction between perpendicularly crossing tunnels. Can. Geotech. J. 2013, 50, 935–946. [Google Scholar] [CrossRef]
  13. Litwiniszyn, J. The theories and model research of movements of ground masses. In Proceedings of the European Congress Ground Movement; University of Leeds: Leeds, UK, 1957; pp. 203–209. [Google Scholar]
  14. Sagaseta, C. Analysis of undrained soil deformation due to ground loss. Géotechnique 1987, 37, 301–320. [Google Scholar] [CrossRef]
  15. Verruijt, A.; Booker, J.R. Surface settlements due to deformation of a tunnel in an elastic half plane. Géotechnique 1996, 46, 753–756. [Google Scholar] [CrossRef]
  16. Gong, B.; Liang, Z.Z.; Liu, X.X. Nonlinear deformation and failure characteristics of horseshoe-shaped tunnel under varying principal stress direction. Arab. J. Geosci. 2022, 15, 475. [Google Scholar] [CrossRef]
  17. Wang, Y.; Gong, B.; Zhang, Y.; Yang, X.; Tang, C. Progressive fracture behavior and acoustic emission release of CJBs affected by joint distance ratio. Mathematics 2022, 10, 4149. [Google Scholar] [CrossRef]
  18. Li, G.; Wang, K.; Gong, B.; Tao, Z.G.; Du, K. A multi-temporal series high-accuracy numerical manifold method for transient thermoelastic fracture problems. Int. J. Solids Struct. 2021, 230–231, 111151. [Google Scholar] [CrossRef]
  19. Chen, T.T.; Foulger, G.R.; Tang, C.A.; Mathias, S.A.; Gong, B. Numerical investigation on origin and evolution of polygonal cracks on rock surfaces. Eng. Geol. 2022, 311, 106913. [Google Scholar] [CrossRef]
  20. Wang, Y.; Gong, B.; Tang, C. Numerical investigation on anisotropy and shape effect of mechanical properties of columnar jointed basalts containing transverse joints. Rock Mech. Rock Eng. 2022, 55, 7191–7222. [Google Scholar] [CrossRef]
  21. Feng, X.H.; Gong, B.; Cheng, X.F.; Zhang, H.H.; Tang, C.A. Anisotropy and microcrack-induced failure precursor of shales under dynamic splitting. Geomat. Nat. Hazards Risk. 2022, 13, 2864–2889. [Google Scholar] [CrossRef]
  22. Finno, R.J.; Harahap, I.S.; Sabatini, P.J. Analysis of braced excavations with coupled finite element formulations. Comput. Geotech. 1991, 12, 91–114. [Google Scholar] [CrossRef]
  23. Do, N.A.; Dias, D.; Oreste, P.; Djeran-Maigre, I. Three-dimensional numerical simulation of a mechanized twin tunnels in soft ground. Tunn. Undergr. Space Technol. 2014, 42, 40–51. [Google Scholar] [CrossRef]
  24. Shao, G.; Yang, N.; Han, J. Study on the Deformation Induced by Vertical Two-Layer Large Diameter Pipe-Jacking in the Soil-Rock Composite Stratum. Appl. Sci. 2022, 12, 12780. [Google Scholar] [CrossRef]
  25. Gong, C.; Ding, W.; Xie, D. Twin EPB tunneling-induced deformation and assessment of a historical masonry building on Shanghai soft clay. Tunn. Undergr. Space Technol. 2020, 98, 103300. [Google Scholar] [CrossRef]
  26. Fu, J.; Yu, Z.; Wang, S.; Yang, J. Numerical analysis of framed building response to tunnelling induced ground movements. Eng. Struct. 2018, 158, 43–66. [Google Scholar] [CrossRef]
  27. Burland, J.B.; Wroth, C.P. Settlement of Buildings and Associated Damage; Brick Construction; The National Academies of Sciences, Engineering, and Medicine: Washington, DC, USA, 1975. [Google Scholar]
  28. Camós, C.; Molins, C. 3D analytical prediction of building damage due to ground subsidence produced by tunneling. Tunn. Undergr. Space Technol. 2015, 50, 424–437. [Google Scholar] [CrossRef] [Green Version]
  29. Han, X.; Li, N. Comparative analysis of strata predictiton models for ground movement induced by tunnel construction. Chin. J. Rock Mech. Eng. 2007, 03, 594–600. [Google Scholar]
  30. Mathews, J.H.; Fink, K.D. Numercial Methods Using Maltab; Prentice Hall: Hoboken, NJ, USA, 2004. [Google Scholar]
  31. Yang, J.S.; Liu, B.C.; Wang, M.C. Modeling of tunneling-induced ground surface movements using stochastic medium theory. Tunn. Undergr. Space Technol. 2004, 19, 113–123. [Google Scholar] [CrossRef]
  32. Li, Y.; Zhou, G.Y.; Tang, C.A.; Wang, S.Y.; Wang, K.K.; Wang, T.T. Influence of undercrossing tunnel excavation on the settlement of a metro station in Dalian. Bull. Eng. Geol. Env. 2021, 80, 4673–4687. [Google Scholar] [CrossRef]
  33. Han, X.; Li, N. Predicting model for ground movement induced by non-uniform convergence of tunnel. Chin. J. Rock Mech. Eng. 2007, 29, 347–354. [Google Scholar]
  34. Mair, R.J.; Taylor, R.N.; Burland, J.B. Prediction of ground movements and assessment of risk of building damage due to bored tunnelling. In Geotechnical Aspects of Underground Construction in Soft Ground; Balkema: Rotterdam, Netherlands, 1996. [Google Scholar]
  35. Burd, H.J.; Houlsby, G.T.; Augarde, C.E.; Liu, G. Modelling tunnelling-induced settlement of masonry buildings. Proc. Inst. Civ. Eng. -Geotech. Eng. 2000, 143, 17–29. [Google Scholar] [CrossRef] [Green Version]
  36. TB10003-2005; Code for Design of Railway Tunnel. China Railway Publishing House: Beijing, China, 2005.
  37. Burland, J.B. Assessment of risk of damage to buildings due to tunnelling and excavation. In Earthquake Geotechnical Engineering; Springer: Berlin/Heidelberg, Germany, 1997. [Google Scholar]
Figure 1. Schematic diagram of the stochastic medium theory (Reprinted with permission from Ref. [32]. Copyright 2021 Springer Nature).
Buildings 13 00810 g001
Figure 2. Horseshoe section of a tunnel: (a) uniform convergence and (b) non-uniform convergence. (Reprinted with permission from Ref. [32]. Copyright 2021 Springer Nature).
Buildings 13 00810 g002
Figure 3. Schematic diagram of the ground surface settlement and building deformation after a tunnel excavation.
Buildings 13 00810 g003
Figure 4. Drill cores of S12 from the depths of 5–10 m and 25–30 m.
Buildings 13 00810 g004
Figure 5. Geological profile of the tunnel and location of the building.
Buildings 13 00810 g005
Figure 6. Dimensions of the target building.
Buildings 13 00810 g006
Figure 7. Distribution of the building and the measured points.
Buildings 13 00810 g007
Figure 8. Comparison of the settlement between the stochastic medium theory and on-site monitoring.
Buildings 13 00810 g008
Figure 9. Velocity of the deformation of the ground surface.
Buildings 13 00810 g009
Figure 10. Comparison of the horizontal displacement between the stochastic medium theory and on-site monitoring.
Buildings 13 00810 g010
Figure 11. The horizontal displacement and the inflection point of ground settlement.
Buildings 13 00810 g011
Figure 12. Bending strain and shear strain in the sagging zones.
Buildings 13 00810 g012
Figure 13. Bending strain and shear strain in the hogging zones.
Buildings 13 00810 g013
Figure 14. Effect of the excavation depth on the tensile strain in (a) the sagging zones and (b) the hogging zones.
Buildings 13 00810 g014
Figure 15. Effect of the tangent of the influence angle on the tensile strain in (a) the sagging zones and (b) the hogging zones.
Buildings 13 00810 g015
Figure 16. Effect of the radius of the tunnel convergence on the tensile strain in (a) the sagging zones and (b) the hogging zones.
Buildings 13 00810 g016
Figure 17. Effect of the height of the building on the tensile strain in (a) the sagging zones and (b) the hogging zones.
Buildings 13 00810 g017
Figure 18. Effect of the ratio of Young’s modulus to the shear modulus on the tensile strain in (a) the sagging zones and (b) the hogging zones.
Buildings 13 00810 g018
Table 1. Classification of damage to buildings (Burland and Wroth [27]).
Category of DamageNormal Degree of SeverityTensile Strain εmax (%)εlim (%)
0Negligible0–0.0500.050
1Very slight0.050–0.0750.075
2Slight0.075–0.1500.150
3Moderate0.150–0.3000.300
4Severe>0.300-
5Very severe--
Disclaimer/Publisher’s Note: The statements, opinions and data contained in all publications are solely those of the individual author(s) and contributor(s) and not of MDPI and/or the editor(s). MDPI and/or the editor(s) disclaim responsibility for any injury to people or property resulting from any ideas, methods, instructions or products referred to in the content.

