1. Introduction
Different structural advantages of the concrete-filled steel tube (CFST) construction include large strength and fire resistance, good ductility, and significant energy absorption (EA) capacity. Also, shuttering is not required during concrete construction, which lowers both the cost and duration of projects. These benefits have widely been utilized, and as a result, concrete-filled tube structures are frequently used in high-rise buildings and bridges [
1,
2]. The CFSTs are composite components that help reduce the environmental impact of construction by using resources more effectively. An innovative typology known as steel-reinforced concrete-filled tube (SR-CFST) is created by embedding a steel section within a CFST section. These composite columns can be improved both in terms of their combustion behavior and load-carrying capacity at room temperature [
3]. However, because the steel tube and concrete core have different dilatation [
4,
5,
6], there is a problem with the early elastic stage interface bonding that affects the elastic strength and stiffness of the CFST columns and results in significant drift in buildings throughout the service. De-bonding would similarly decrease the nominal squash load of thin-walled CFST columns with high-strength concrete (HSC) infill, indicating that no composite action has been generated at all, and reducing the load-carrying capacity [
7]. According to O’Shea and Bridge [
8], in the CFST columns, de-bonding could happen, mostly because of shrinkage and temperature fluctuations of the core concrete and/or different dilation characteristics of the steel and concrete in the early stage under uniaxial stress. If thin-walled structural steel is employed, the poor bonding increases the risk of the tube local buckling at the elastic stage. Giakoumelis and Lam [
9] found that for the CFST columns with the concrete compressive strength of more than 100 MPa, the poor bonding might limit the axial load-carrying capacity by 14%. By measuring the circumferential gap, Liao et al. [
5] determined the amount of de-bonding which might reach the ratio of 2.2%, resulting in the 29% reduction in the ultimate strength. Therefore, steps must be taken to enhance the circumstances for the interface bonding. Previous studies have identified two key strategies for improving the bonding situation, firstly by utilizing expansive concrete [
10], and secondly, by employing various confining strategies such as tie bars [
11,
12], stiffeners [
13], fiber-reinforced polymers (FRPs) [
14], and external rings [
15].
Different combinations with varied mix designs and fiber lengths were created. Fibers were made up between 1% and 2% of the volume. In comparison, the compressive failure mode of the reinforced specimens significantly changed from brittle to ductile, according to the uniaxial compressive testing, although the compressive strength of the material was less influenced by the presence of fibers [
16]. Portland cement was partially substituted with metakaolin (MK) as 10% by weight of the total binder cement in order to make the MK added steel fiber-reinforced concrete (SFRC) mixes [
17]. To make the SFRCs, two different types of hooked end steel fibers (SFs) with the length/aspect ratios of 60/80 and 30/40 were used. Water to the binder ratios of 0.35 and 0.50 were utilized to develop two series of concrete groups which led to the compressive strengths of 75.7 MPa and 58.8 MPa, respectively. The MK concretes demonstrated a greater degree of improvement than ordinary concretes.
Moreover, concrete infrastructure renovation is extensively using externally bonded carbon FRP (CFRP) composites. There are many studies on the mechanical performance and long-term durability of such repair. However, only limited research works have been conducted on polyurethane-based composites for concrete restoration. The researchers compared the durability and failure modes of two distinct wet lay-up CFRP systems used for concrete’s flexural reinforcement: a two-part epoxy and water catalyzed polyurethane with aromatic chemistry as a matrix. The systems were tested in seven different settings [
18]. Comparable outcomes were also reported by other researchers [
19,
20], who performed a number of tests on the SFRC made with pumice aggregate while altering the amount of the SFs and pumice aggregate content. The unit weights of the control samples (including 25% pumice aggregate) without the SFs were 2027 kg/m
3, 1838 kg/m
3, 1631 kg/m
3, and 1453 kg/m
3, whereas they were 2084 kg/m
3, 1897 kg/m
3, 1698 kg/m
3, and 1498 kg/m
3 for the sample containing the SFs with the volume fraction of the SFs to concrete (V
f) as 0.5%. Comparing the unit weight with the control samples, there were only increases of 2.8%, 3.2%, 4.1%, and 3.1%. Nematzadeh et al. [
21] illustrated the effects of the axial compression and high temperatures of 20 °C, 250 °C, 500 °C, and 750 °C on the SFs and tire rubber in the CFST stub columns. The results indicated that the strength stayed constant up to 500 °C and then began to decrease by 34% at about 750 °C. In order to predict compressive strength outcomes, Savino et al. [
22] created numerical models of specimens containing the SFs of various types, volumes, and aspect ratios. They concluded the potential of 2% to 36% enhancements of the compressive strength.
The FRP confinement for preventing local buckling of the steel tubes is a proven method to enhance the seismic performance of composite columns, according to earlier research works. It is also vital to remember that longitudinal FRP reinforcing rather than the FRP confinement can improve the flexural capacity more efficiently. The failure of a column with longitudinal CFRP often exhibits some brittleness because of the low carbon fiber elongation ratio. Other ductile FRPs, such as glass FRP (GFRP), basalt FRP (BFRP), polyethylene terephthalate (PET), and polyethylene naphthalate (PEN), may be utilized as alternatives to resolve this issue. Depending on the stiffness of the inner tube, the confinement efficiency increases and may even approach that of a fully filled tube if the hole is maintained by a GFRP tube. Hoop tensile and compressive stresses are applied to the outer and inner tubes, respectively. Finally, the anti-corrosion properties of the concrete-filled GFRP steel tubes (GFRP-CFSTs) are superior to those of the CFSTs, allowing the steel tubes to be isolated from the external corrosive environment. Strengthening existing CFST structures for corrosion resistance and extending service life has a promising future. The GFRP sheets (jackets) can be utilized as an alternative to the FRP composites since they are less expensive than the CFRP composites, which are particularly expensive.
The GFRP is more attractive for the confinement of the steel tubes since it is less expensive and has a higher strain capacity (>2%), especially when the ductility increase is the primary goal. Galvanic corrosion is a concern when steel is in direct contact with the CFRP [
23,
24], and hence some researchers recommend reinforcing a layer of the GFRP between them (e.g., [
24]). Alajarmeh et al. [
25] provided a structurally effective building solution for marine and offshore buildings, such as bridge piers and piles, which is made up of hollow concrete columns (HCCs). Typically, the HCCs strengthened with steel bars are susceptible to corrosion and can become inoperable as a result, especially in severe environments. Moreover, the lack of the concrete core makes the HCCs susceptible to brittle failure behavior from concrete crushing. Thus, this study examined the use of the hollow composite-reinforced sections (HCRSs) to contain the inner concrete wall in the HCCs and the use of the GFRP bars as a corrosion treatment. In accordance with the test results, longitudinal reinforcement, whether in the form of the GFRP bars or HCRSs, considerably increased the strength and displacement capacity of the HCCs. The displacement capacity and confined strength might be enhanced more effectively by increasing the number of the GFRP bars than by enhancing the bars’ diameter. The FRP jacket also shields the outer steel tube from rust [
26,
27]. In comparison with the CFRP, the GFRP has a greater ultimate elongation. In addition, the GFRP is an electrical insulating material that prevents steel from corroding electrochemically.
The best application of the CFSTs was as compression components of load-carrying frames of buildings and structures. Researchers believe that the concrete-filled glass-fiber reinforced tubes (CFGTs) can be used effectively through a logical strategy [
28]. The GFRP-CFST is a composite system in which a steel tube is wrapped with a GFRP jacket and filled with concrete. The GFRP-CFST resembles the mechanical principles of the CFSTs or concrete-filled FRP tubes (CFFTs), and also takes advantage of the mechanical properties of the outer tube and core concrete combination. The steel tube also guarantees higher ductility of the GFRP-CFSTs compared with the CFFTs [
29]. The FRP sheets were recommended for use in the circular steel tubes by Teng and Hu [
30]. Based on their test results, the 3-layer wrapped samples of the GFRP had better axial load-carrying capacity and stiffness than the 1- or 2-layer wrapped samples. The authors also reported that the GFRP panels significantly reduced local buckling. Mirmiran and Shahawy [
31] tested the concrete-filled GFRP tubes using a different stiffness range which was comparable with various studies. The 32-MPa concrete was poured into the 152.5 mm × 305 mm tubes made of the GFRP, and only the concrete core was loaded during the compression testing. They consisted of filament-wound angle sheets of polyester resin with E-glass fibers at an angle of 15° to the circumferential direction, with the thickness ranging from 1.3 mm to 3.0 mm. Those preserve the core technical, structural, and economic advantages of the compressed CFST parts. They are also corrosion resistant. What limits the use of the CFGT structures is the lack of rules and recommendations for modeling them. In general, the strength of the compressed CFGT components is determined either experimentally or via finite element analysis [
32,
33].
3. CFSTs with SF Addition
Many types of in-fill materials have been employed to increase the ductility of composite tubes. Among the numerous in-fill materials, the SFs are gaining attention in the composite tubes, thanks to their high flexural and tensile strengths, low shrinkage, and superior fire resistance. Some studies have been conducted to investigate the behavior of the steel fiber-reinforced CFSTs (SFRCFSTs) [
40,
41,
42].
There are several important issues which can be considered in the SFRCFSTs, such as the ductility and strength indexes, axial load–axial shortening response, ultimate load, compressive strength, tensile strength, EA capacity, failure mode, and properties of the SFs, which are discussed in this article.
3.1. Ductility and Strength Indexes
According to Naji et al. [
43], ductility is often referred to a structure or an element’s ability to deform beyond its yield point. Lu et al. [
44] indicated that the ductility is a very critical requirement for structures that are situated in seismic zones. The ductility index (DI) of the CFSTs [
45] can be defined as:
where ε
85% is the nominal axial shortening (Δ/
L) of the columns corresponding to the load which drops to 85% of the ultimate axial load-carrying capacity, and ε
y is ε
75%/0.75 in which ε
75% is the nominal axial shortening of the columns corresponding to the load that obtains 75% of the ultimate axial load-carrying capacity in the pre-peak stage.
The DI of the CFSTs can also be assessed using Equation (2) [
46]:
where
u85% is the mid-height deflection of the columns corresponding to the load which drops to 85% of the ultimate load-carrying capacity, and
uy is
u75%/0.75 in which
u75% is the mid-height deflection of the columns corresponding to the load that attains 75% of the ultimate load-carrying capacity in the pre-peak stage.
The strength index (SI) of the CFSTs can be calculated utilizing Equation (3) [
43].
where
Nmu and
Nu are the measured ultimate strength and analytical axial load-carrying capacity of the columns, respectively.
The slenderness ratio (length/diameter) of each composite column was 3 in the study done by Lu et al. [
44]. The concrete matrix and geometrical dimensions of these examples were the same, but V
f varied. The V
f values of the specimens SS-0, SS-1, SS-2, and SS-3 were 0%, 0.6%, 0.9%, and 1.2%, respectively. However, the ductility values of the specimens SS-1, SS-2, and SS-3 were 57.1%, 135.1%, and 184.9% respectively higher than that of the reference specimen SS-0. The specimens clearly showed an enhancing trend in the ductility as the volume percentage of the SFs was increased. This might be owing to the active confining action associated with the fiber–concrete matrix interaction.
Thirty-six CFST specimens, including twenty-seven SFRCFST specimens and nine plain CFST (PCFST) specimens, were tested under an axial load by Lu et al. [
47]. Investigated factors included the concrete compressive strength, steel tube thickness, and volume fraction of the SFs. Each specimen had a length-to-diameter ratio of 3. Different diameter-to-thickness ratios were obtained using three different tube thicknesses of 3 mm, 4 mm, and 5 mm. The steel tube’s average modulus of elasticity, yield strength, and shear strength were 205 GPa, 417 MPa, and 306 MPa, respectively. Three concrete compressive strengths were taken into account as C50, C60, and C70. Concrete mixes were prepared using ordinary Portland cement, river sand, granite with a particle size of 5 mm–10 mm, fly ash, and silica fume. The type of the SF used in the concrete mixes was hooked end. The SFs had a density of 7850 kg/m
3, were 30 mm long and 0.52 mm in diameter, and had the aspect ratio of 57.6. The SFs’ tensile strength was more than 1060 MPa, according to the manufacturer. Three different volume percentages of the SFRCs were used as infilling: 0.6%, 0.9%, and 1.2%. Each batch of freshly mixed concrete had an SFRC slump flow greater than 500 mm.
Thirty-six specimens in total, including nine self-compacting CFSTs (SCCFSTs), nine self-stressing and self-compacting CFSTs (SS-SCCFSTs), and eighteen SF-reinforced self-stressing and self-compacting CFSTs (FSS-SCCFSTs), were made for the investigation conducted by Li et al. [
48]. The columns without self-stress were SCCFSTs, whereas the columns with self-stress were SS-SCCFSTs and FSS-SCCFSTs. The specimens were all 500 mm long and had an exterior diameter of 150 mm. The information of the specimens from two studies is listed in
Table 1. Also,
Table 1 provides different obtained results including the SI, DI, experimental ultimate load (N
u), and N
u/N
c as the ratio of experimental ultimate load to calculated ultimate load (N
c). Every specimen had its own designation. As an illustration, t3.5-a-0.6 designated the FSS-SCCFST with a 3.5 mm steel tube thickness, a self-stressing and self-compacting concrete (SS-SCC) of C40, and a 0.6% SF volume percentage. Self-stress did not lead to significant deterioration in the DI, except for t4-a0-0. The DI values of the SCCFSTs other than t4-a0-0 ranged from 1.10 to 2.55, while the DI values of the SS-SCCFSTs ranged from 1.33 to 1.90. Based on the results, the inclusion of the SFs improved the DI. Compared with the SS-SCCFSTs, the FSS-SCCFSTs with the SF contents of 0.6% and 1.2% enhanced the DI by 5.3% and 7.1% on average, respectively. In general, self-stress increased the CFSTs’ ultimate load. The SS-SCCFSTs’ ultimate loads were 9.8% to 27.6% more than those of the comparable SCCFSTs.
Liu et al. [
49] demonstrated that higher SF content often resulted in better DI values and adding the SFs could enhance the DI. Without the SFs, the recycled aggregate CFSTs’ (RACFSTs) DI ranged from 1.35 to 1.90. The DI was increased to 1.38–2.39 when 0.6% SFs was added. The DI was between 1.4 and 2.39 with 1.2% SFs. The DI ranged from 1.43 to 2.45 when 1.8% SFs was added. As V
f was increased from 0% to 0.6%, the DI of the specimens was improved by an average of 8.55%. When V
f was enhanced to 1.2%, the increase in the DI was approximately 13.98%. When V
f was increased to 1.8%, the DI was improved by 16.76%.
Karimi and Nematzadeh [
50] examined the post-heating performance of the CFSTs subjected to several temperatures (20 °C, 250 °C, 500 °C, and 750 °C) with regard to the amount of scrap-tire rubber aggregate used as a volume fraction of sand (0%, 5%, and 10%), quantity of the SFs in volume (0%, 1%, and 1.5%), and the ratio of the outer diameter to thickness of the steel tube (43 and 25.4). As an example,
Figure 2 depicts the DIs of the CFSTs using different percentages of the SFs. When the volume quantity of the SFs in the CFSTs subjected to 20 °C (T20R10-3.5 category) was increased from 0% to 1% and then to 1.5%, their DIs were obtained as 1.17, 3.54, and 2.99, respectively. These results clarified that utilizing 1% SF in the concrete volume not only enhanced the DI by almost three times but also was the optimum SF quantity for improving the DI of the CFSTs. However, as the volume quantity of the SFs in the CFSTs at 500 °C (T500R10-3.5 category) was increased from 0% to 1% and then to 1.5%, the DI reached to 4.42, 3.64, and 3.81, respectively. Consequently, adding the SFs to concrete in the heated CFSTs had adverse effects on the DI. It was also resulted from this study that the DIs of the heated CFSTs containing the SFs were increased compared with those of the corresponding non-heated specimens, since the axial load reductions in the post-peak stages of the heated specimens were inconsiderable.
According to Lu et al. [
47], the SFs had an impact on the SI (
Table 1). The confinement index was slightly decreased as the fraction of the SF volume was increased for the specimens in the same group. In the case of the specimens with C50 and C60 concretes, the SI was normally enhanced by decreasing the confinement index, or, more specifically, improved by increasing the SF volume percentage. However, this impact was not observed in the specimens made from C70 concrete until 1.2% of the SFs was added to concrete. It may be inferred that a greater volume percentage of the SFs was needed when harder concrete was used as the infilling in the CFST columns to maximize the composite action between the steel tube and concrete core.
3.2. Axial Load–Axial Shortening Response
Li et al. [
48] investigated the axial load–axial shortening (N–Δ) responses of the columns. All the samples displayed an initial linear section (elastic stage) up to 75–90% of the failure load, followed by a short transition section (elastic–plastic stage) up to the failure load, regardless of the presence of residual stress and softening stage (post-peak stage). In the post-peak stage, most of the N–Δ curves were characterized by a rapid drop in the axial load down to 70–80% of the peak load followed by a horizontal plateau. The calculations revealed the effect of residual stress on the axial load–axial shortening responses of the specimens. Compared with the SCCFSTs, the SS-SCCFSTs demonstrated a curve with much steeper elastic phase, higher peak load, and faster decay in the post-peak stage. In addition, axial shortening at N
u and axial shortening (Δ
u) at 0.85 N
u in the descending stage (Δ
85) of the SS-SCCFSTs were noticeably smaller than those of the SCCFSTs. From this point, it can be concluded that the development of residual stress considerably increased the stiffness in the elastic state and enhanced the load-carrying capacity but reduced the ductility.
Liu et al. [
49] reported the comparable effects of self-stress on the compressive behavior of the CFST columns. The increased compressive strength and elastic modulus of the expanded concrete core was what gave the CFST columns greater ultimate load and stiffness [
51]. As for the large decline of the load in the post-peak stage, it may also be related to the improving brittleness of the concrete core [
52]. In the elastic and elastoplastic stages, the incorporation of the SFs into concrete had minimal effect on the slope of the curves. In the post-peak stage, the slope of the curves for the SF-containing samples was more gradual, suggesting that the addition of the SFs relieved the axial stress to varying degrees and improved the ductility of the CFSTs. This development resulted from the SFs’ activity in repairing fractures, which enhanced the concrete core’s functionality [
50]. By decreasing the displacement between opposing sliding planes, lowering the local pressure on steel, increasing load transfer across the crack, and improving the CFSTs’ post-peak performance, this favorable impact on concrete also lowered the displacement between opposing sliding planes. Thicker steel tubes and larger SF volume percentages were recommended for the improved tube columns’ behavior using high-strength self-stress concrete.
Liu et al. [
49] stated that every specimen had a comparable axial load–axial shortening relationship. Three stages, i.e., the descending stage, the elastic–plastic stage, and the elastic stage, could be distinguished among the curves. During the elastic stage, the applied load was increased linearly by the increasing axial shortening until it reached around 80% of the ultimate load. When the curve entered the elastic–plastic stage, it lost some of its initial linearity, and its slope was decreased until it hit the peak load. The load was progressively reduced to 0.8N
u after the peak load. Steel fiber-reinforced self-stressing recycled aggregate CFSTs (SSRCFSTs) exhibited much greater stiffness in the elastic stage compared with the RACFSTs. The relation between concrete and steel tube prior to the expansion of self-stressing concrete could be attributed to the enhanced stiffness. The advantageous confinement of the steel tube increased the concrete strengths, and hence the ultimate capacities of the SSRCFSTs were always larger than those of the RACFSTs. The SFs’ bridging effect caused the SSRCFSTs’ descending stage to be extremely slow and delayed. The ductility of the SSRCFSTs was enhanced in comparison with the RACFSTs. To sum up, the confinement effect of the steel tube and the bonding impact of the SFs made up for the weakness in the RACFSTs.
The axial load–axial shortening curves for various specimens and the impacts of the tested parameters on the axial behavior of the SFRCFSTs were examined by Lu et al. [
47]. The axial shortening was the average outcome of four LVDTs. All the specimens’ axial load–axial shortening curves displayed a softening phase after achieving the maximum load. They presented how the SFRCFST specimens’ behavior was affected by the concrete strength. In the linear stage, the slope of the specimens with higher concrete strength was longer, signifying a larger stiffness. The descending stage of the specimens made of stronger concrete had a higher acceleration during the softening stage, and the axial shortening at 85% of the ultimate strength dropped as the strength of concrete increased. This suggested that increasing the concrete strength decreased the SFRCFSTs’ ability to deform. The SFRCFSTs’ behaviors with various steel tube thicknesses were compared. At 85% of the ultimate load, the specimens with thicker steel tubes depicted an enhancing axial shortening and a longer linear axial load–axial shortening reaction. In addition to having greater shear resistance, thicker steel tubes offered more lateral confinement to concrete. Greater shear transfer capacity was encouraged, and failure was postponed by the larger confining pressure across the crack face [
53]. One may measure the effect of the SFs by contrasting the behaviors of the SFRCFSTs to those of their corresponding PCFSTs. The axial load–axial shortening responses had similar patterns in both the PCFSTs and SFRCFSTs, where an ascending branch was followed by a descending stage. The SFRCFSTs indicated somewhat different reducing branch slopes from the PCFSTs, showing that the inclusion of the SFs had enhanced the post-peak behavior. This issue was because of the larger confining pressure across the crack face, which delayed collapse and promoted an increase in the shear transfer capacity.
3.3. Ultimate Load
According to Naji et al. [
43], in comparison with the control column (MC0), the performance of the circular CFST columns reinforced with the SFs (MC1) was improved by 28%, while the performance of the square CFST columns reinforced with the SFs (MS1) was enhanced by 20%. This enhancement was related to the concrete’s increased compressive strength, which filled the tubes. However, as can be seen from the SI values, the analytical strength of the CFST columns reinforced with the SFs was more conservative. To calculate the axial strength of the CFST columns reinforced with the SFs, more precise expressions are required.
Li et al. [
48] compared the ultimate loads of the SCCFSTs, SS-SCCFSTs, and FSS-SCCFSTs, as can be seen from
Figure 3. In general, self-stress increased the ultimate loads of the CFSTs. The ultimate loads of the SS-SCCFSTs were 9.8–27.6% greater than their equivalent SCCFSTs (
Figure 3). When V
f was increased from 0% to 0.6%, the ultimate load was typically improved, and when V
f was enhanced from 0.6% to 1.2%, the ultimate load marginally dropped. Except for the columns with c-1.2 (
Table 1), all the FSS-SCCFSTs revealed greater ultimate loads than their equivalent SS-SCCFSTs. The three-dimensional restriction of the SFs served as proof for this increase. This provided an additional constraint over the steel tube and thus improved the compressive strength of the concrete core [
54]. As for the reduction when c-1.2 was used as in-filling, we may assume that this phenomenon was caused by the original inaccuracy brought on by an unequal distribution of the SFs inside the concrete matrix. The difference in the maximum loads between the CFSTs with and without self-stress was attributed to variations in the concrete core’s compressive strength resulting from the combined effects of the radial and axial residual stresses. Radial self-stress, which increased the compressive strength of the concrete core, enhanced the ultimate load of the CFSTs. Axial self-stress, which was the pre-compressive stress of concrete, reduced the CFSTs’ ultimate load. To avoid the influence of the concrete core area (
Ac), in this study, the development was made by dividing the difference in the failure load by
Ac and the declared nominal strength increase (Δf
c). Thus, Δf
c is defined by Equation (4), in which
Nu,s and
Nu,0 are the ultimate loads of the SS-SCCFSTs and the equivalent SCCFSTs, respectively.
The ultimate loads of the columns were evaluated by Lu et al. [
47]. The ultimate loads of the SFRCFST specimens were affected by both the concrete compressive strength and steel tube thickness in the expected ways: as the concrete compressive strength was increased, the ultimate load was improved; as the steel tube thickness was increased, the ultimate load was enhanced. The ultimate load of the CFST specimens was little affected by the addition of the SFs to concrete. The SFRCFST specimens with 0.6%, 0.9%, and 1.2% SF contents produced gains in the ultimate loads by 2–6%, 4–10%, and 5–14%, respectively, above the benchmark PCFST specimens.
The tri-axial compression that the concrete core experienced in the CFSTs improved the concrete strength. The difference between the ultimate load, N
u, and the nominal squash load, N
0, was provided by the confining effect on the concrete strength, and this gain depended on the tube strength, N
s. Sakino et al. [
7] analyzed the confining influence on the concrete strength, and thus:
where γ is the augmentation factor derived based on experimental data, and N
0 and N
s are determined by Equations (6) and (7), respectively.
where
As and
Ac are the areas of the steel tube and the concrete core, respectively, and
f′c and
fy are the cylinder compressive strength of concrete and the yield strength of the steel tube, respectively. It is worth mentioning that the value of γ was increased by the SF volume percentage. A good bonding effect between the steel tube and the HSC core was confirmed. This may be due to the slightly increased axial elongation of the SFRCs at failure compared with the PCs. The axial load-carrying capacity, N
u, of the PCFSTs can be expressed by Equation (8) in which
θ is the confinement index.
The experimental findings of fifty-seven PCFST specimens examined in the research works [
8,
9,
55,
56,
57,
58] were chosen to compare with the predicted results in accordance with EC4 and AISC 360-10 in order to assess the accuracy of the suggested equations.
Table 2 summarizes the characteristics of the chosen specimens and experimental and predicted results. Based on the table, Equation (8) has been capable of providing an acceptable prediction for the ultimate loads of the PCFSTs. The mean of N
e/N
c was 1.025. N
e/N
c had a standard deviation of 0.108 and a coefficient of variation of 0.105. The circular PCFST columns’ axial load capacity was typically overestimated by the codes. The mean of the experimental results to the EC4’s predictions (N
e/N
EC4) was 1.216. N
e/N
EC4 had a standard deviation of 0.145 and a coefficient of variation of 0.119. The mean of the experimental results to the AISC 360-10’s predictions (N
e/N
AISC) was 1.250. N
e/N
AISC had a standard deviation of 0.181 and a coefficient of variation of 0.145.
3.4. Compressive Strength
To evaluate the compressive strength of the fiber-reinforced concretes (FRCs), uniaxial compression tests were conducted on cube specimens with the sizes 150 mm × 150 mm × 150 mm after the curing phase [
16]. In order to record the load–displacement curves, experimental tests were carried out using a hydraulic jack with a closed loop controlling system that had 3000 kN capacity and 0.5% accuracy. Load was applied gently until the failure at a constant load velocity of 0.5 N/mm
2s. As mentioned by the experimental findings, the presence of fibers had less impact on the compressive strength of the SFRCs. However, the transition from a brittle to a ductile failure mode was significant. The fibers’ bridging effect prevented the cube specimens from crushing and allowed them to maintain their integrity for the duration of the tests.
Güneyisi et al. [
17] demonstrated that the increase in fiber reinforcement was accompanied by a change in the compressive strength of the plain and MK included concretes. For the w/b ratios of 0.35 and 0.50, the compressive strengths of the PCs varied from 62 MPa to 72 MPa and from 45 MPa to 54 MPa, respectively, whereas those of the MK-incorporated concretes ranged from 66 MPa to 76 MPa for the former and from 49 MPa to 59 MPa for the latter. The results of the compressive strength tests clarified that adding MK to concrete remarkably enhanced its compressive strength. Previous studies have also provided similar findings. For instance, based on Güneyisi et al. [
17], concretes with 5% and 15% replacement levels of MK produced relatively better strengths than the PCs at two distinct w/b ratios. Adding more SFs enhanced the concrete’s compressive strength without adding MK or a higher w/b ratio. For example, the PCs produced with the w/b ratio of 0.35 and SF volume fraction of 0.75% achieved the compressive strengths of 71.4 MPa and 72.1 MPa for SF2 and SF1, respectively. However, the MK added concretes with the same parameters had the compressive strengths of 72.8 MPa and 75.7 MPa for SF2 and SF1, respectively.
Bayramov et al. [
19] obtained the results of tests on the compressive strength using cylindrical specimens. Concretes with a 65-aspect ratio appeared to be more significantly affected by the volume percentage of the SFs. The compressive strength was enhanced by 30% with a 0.64% increase in the volume fraction of the SFs. The influence of the volume fraction of the SFs on the compressive strength was inconsistent for the aspect ratios of 55 and 80, where no appreciable change was observed when the SFs volume fraction was increased. However, the compressive strength could have been influenced considerably by the diameter and orientation of the SFs. On the other hand, instead of improving the compressive strength, the addition of the SFs to concrete could enhance the ductility in the compressive failure.
Nematzadeh et al. [
21] found that when the CFST specimens were exposed to heat, the compressive strengths of the concrete core and CFSTs were decreased for a given amount of the SF, rubber, and tube thickness. As the exposure temperature rose, the compressive strengths of the concrete core and CFSTs were reduced. This impact was more significant when the exposure temperature was increased from 500 °C to 750 °C than when it was increased from 20 °C to 500 °C. The strength decreases of the CFSTs exposed to heat from 20 °C to 500 °C were less pronounced than those from 500 °C to 750 °C. However, when the temperature rose from 20 °C to 500 °C, the SFs’ bridging effect became more important than the internal stresses in concrete, which led to a less noticeable reduction in the concrete core’s compressive strength.
Savino et al. [
22] investigated the compressive and tensile strengths of a designated high-performance concrete using twenty-five series of the SFs with varied forms, aspect ratios (l/d
e), and doses (V
f). The toughness was also considered. Hooked-end fibers with three different l/d
e ratios of 45, 65, and 85 were employed, as well as straight fibers with two different l/d
e ratios of 65 and 75. Five different V
f contents were considered for each fiber: 1.5%, 2%, 3%, 4%, and 5%. The high-performance fiber-reinforced concrete (HPFRC) series’ values for the compressive strength were reported. The average compressive strength on the cube specimens from the control series (f
c,matrix) was around 76 MPa. The compressive strength was increased when the data for the control series and HPFRC series were compared, even though this enhancement was small for low l/d
e ratios (approximately 2%) but large for high l/d
e ratios (about 36%). For all the series, the compressive strength was enhanced as V
f was increased.
Gopal and Manoharan [
41] measured the strengths of individual tubes and their related mid-height deflections. The tests findings presented that the type of concrete and the slenderness ratio had effects on the load-carrying capacity. The ultimate strength of the composite columns was around 100–130% greater than that of the reference column. Each tube’s strength was depicted against the ratio of its slenderness. The pattern indicated that the slenderness ratio noticeably reduced the columns’ strength. Also, at a slenderness ratio of 19, the FRC-filled specimens outperformed conventional concrete-filled specimens in terms of the ultimate strength. The columns’ strength appeared to be impacted in some way by the FRC with rather high tensile strength.
In an experiment, Li et al. [
48] assessed the self-stress and steel tube thickness under the axial compression in a CFST containing different volume percentages of the SFs and self-compacting concrete. The fibers improved the ultimate load as well as the post-peak behavior.
Along with indicating the load capacities of the steel tube alone, the concrete core alone, and the composite action contribution, Karimi and Nematzadeh [
50] evaluated the F1R10-2 specimen series’ load capacities at various temperatures. The composite part’s capacity decline was minimal, especially up to 500 °C, despite the fact that the concrete core’s capacity drop at high temperatures was significant. There were two factors for it. First, the steel tube exhibited little changes in strength after heating. Second, the concrete core in these specimens was reinforced with 1% SF, which enhanced the composite action with the confining steel tube under the axial compression. The capacity of the steel tube to contain the concrete core was actually made stronger by the SFs, which lessened the severity of the heat-induced loss of the concrete strength. After cracking, the SFs in concrete served as bridges and delayed the crack opening.
It is common knowledge that the compressive strength is often defined as a concrete specimen’s greatest measurable resistance to the axial force at a 28-day age. There were more test ages utilized by Lange [
59]. For instance, the strength at 7 days was around 75% of the strength at 28 days, and the strengths at 56 days and 90 days were roughly 10% to 15% larger than the strength at 28 days. Typically, the real compressive strength exceeded the compressive strength.
The best and simplest technique to determine the condition of a concrete is to do a compression test, which involves applying compressive force. Atea [
60] studied the cumulative impact of five short square RC columns (100 mm × 100 mm × 1000 mm) made of the SFs and polypropylene fibers using the axial compression. In addition to longitudinal reinforcement, the experiment took differences in lateral tie spacing into consideration. A finite element model was created, and two aspect ratios (60 and 100) of the SFs were included. According to the findings, the compressive strength was slightly improved. Tests on ultra-high performance concrete in the stub CFST columns done by Xu et al. [
61] with various percentages and aspect ratios of the SFs and polypropylene fibers as well as different steel tube thicknesses produced positive outcomes for the columns under the axial compression.
Abbass et al. [
62] presented the results of the average compressive strengths for three specimens at 7 days and 28 days with various fiber contents. The results are depicted in
Figure 4. It is clear that the fiber addition increased the concrete compressive strength. With an increase in the fiber content from 0.5% to 1.5%, higher strength concrete with w/c = 0.25 showed only a slight gain in the compressive strength after 28 days compared with the high strength SFRC increases of 7% to 15%. Increases in the compressive strength of around 10% to 25% were witnessed for concrete of intermediate strength with w/c = 0.35 and 0.45. The restricting effect that the fibers gave to concrete might be responsible for this improvement in the compressive strength. Depending on the binding strength of the SFs and matrix, the ultimate compressive strength of concrete was enhanced as the propagation of cracks was stopped. Additionally, it was found that adding more fiber to the mix had a negative impact on its workability, which led to less concrete being compacted. Furthermore, they found that increasing the fibers’ aspect ratio slightly improved the compressive strength, as the crack growth was successfully restricted.
3.5. Tensile Strength
At about 28 days of curing, direct tensile tests were performed on prismatic specimens with the dimensions of 30 mm × 80 mm × 350 mm [
16]. In order to have a reduced range of values for the description of the SFRCs’ tensile behavior, only 22 mm and 30 mm fibers were employed in the experiment, which also focused on the bridging effect created by the fibers during the tensile testing. The investigations employed electro-mechanic testing equipment for combined tensile–torsion tests with the tensile capacity of 250 kN. The machine was linked to a computer so that data could be collected, and load–displacement diagrams and failure tensile loads could be recorded. The testing used a 0.3 mm/min loading rate that was displacement-regulated. It was obvious that the studied specimens had lower tensile strength, but the bonding effect was more apparent because of the longer fibers (40 mm).
The splitting tensile strength and rupture modulus of conventional and MK-incorporated concretes were assessed by Güneyisi et al. [
17] and measured together with the tensile strength. To investigate the efficiency of the SF reinforcing, the results of the flexural and splitting tensile strengths tests were analyzed. The findings demonstrated that, for the w/b ratios of 0.35 and 0.50, the SF addition increased the flexural strength of the PCs by 34% and 24.6%, respectively. The MK-incorporated ones, on the other hand, depicted the increases of 13.5% and 18% for those w/b ratios. The SFs’ primary and noticeable contribution could come from the concrete’s enhanced ability to withstand the tensile strain.
Bayramov et al. [
19] found that the splitting tensile strength was improved by 23% with the fiber aspect ratio of 55 and the fiber volume fraction increase from 0% (i.e., conventional concrete) to 0.64%. This growth was 42% for the aspect ratios of 65 and 80. Thus, it can be inferred that the SFRCs with the fiber aspect ratio of 65 produced more significant results. In most cases, the fibers having the aspect ratio of 65 (l/d = 65) were pulled out of the matrix rather than breaking. However, the fibers with the aspect ratio of 80 (l/d = 80) were split into two pieces. The results for the fibers with l/d = 65 may be explained by the fact that they had bigger cross sections than the fibers with l/d = 80.
For the control series and HPFRC series, Savino et al. [
22] examined the mean strength values based on groups of three and nine samples, respectively. The tensile strength of the control series was 3.3 MPa. The maximum tensile strength values of the series SF65, SF75, HF45, HF65, and HF85 were 7.54 MPa, 6.24 MPa, 6.87 MPa, 6.26 MPa, and 7.34 MPa, respectively, while the minimum tensile strength values of these series were 3.73 MPa, 4.17 MPa, 3.41 MPa, 3.74 MPa, and 4.03 MPa, respectively. This issue clarified an enhancement in the tensile strength up to 128%, when compared with the values of the control series (f
t,matrix). In all the HF series, the tensile strength was enhanced, as l/d
e ratio and V
f were increased.
The tensile strength of concrete, which is equivalent to 8–12% of the compressive strength, may be calculated using the square root of the compressive strength in MPa. In accordance with estimates, the splitting tensile strength made up 8–14% of the compressive strength. The splitting tensile strength versus time graphs were reported by Lange [
59].
However, Abbass et al. [
62] stated that the tensile strength of concrete was increased more remarkably by the reinforcement of fibers, reaching the values of 11% and 47% for 0.5% and 1.5% fiber levels, respectively, at 28 days. The tensile strengths were seen to improve linearly as the fiber content was increased. In the F15L60 mix, concrete with a lower water-to-cement ratio illustrated a decreased improvement in the tensile strength by approximately 31%, whereas concrete with a greater water-to-cement ratio displayed an enhancement in the tensile strength by around 47%, perhaps due to the prevention of cracking. The enhancement in the tensile strength was more noticeable in concrete with lower strength due to the reduced matrix toughness and incidence of crack prevention by the fibers.
Eren and Celik [
63] obtained comparable outcomes. Given that the PC utilized in this work had the cylinder compressive strength of roughly 60 MPa, the mismatch between the SFs and concrete for the SFs with l/d = 80 may also have contributed to this behavior. High strength SFs with the tensile strength of 2000 MPa were advised for use in the HSCs [
64].
Based on Tong et al. [
65], a tall multi-cell CFST wall (MCFSTW) can be constructed by combining two medium height wall segments that are butt welded to the joint. A butt joint is created at the junction between two wall segments by fusing the seams of the upper and lower wall segments with steel plates. Since butt joints are prone to the tensile failure, it is important to consider the mechanism of the tensile failure. In this study, twelve samples with six different configurations were tested under load to represent various butt joint components. These samples were created using various joint geometries and considering different welding conditions. The test findings were analyzed and verified using a numerical simulation while taking into account the requirements for the ductile damage. To investigate the fracture performance of the whole butt joint, a simplified model was developed based on a trustworthy finite element model. In order to enhance the tensile performance of butt joints in the MCFSTWs, credible design advice was provided according to the test findings and further finite element analyses. The fiber’s ability to prevent cracks and absorb energy depends on how well it can increase the tensile strength of concrete.
Table 3 presents some empirical formulas for relations between the compressive and tensile strengths.
3.6. EA Capacity
The area below the load–displacement curve is referred to as the EA surface. On the basis of the definition of the EA and the peak load value which was reached in the first stage of a quasi-static test, the average load is designated as one of the determining criteria of the EA capacity. Toughness in the materials science and metallurgy refers to a material’s capacity for the EA and plastic deformation without fracture. The strength with which a substance resists rupturing is known as its toughness. The amount of energy per unit volume that a material can hold before rupturing is one way to define material toughness. This toughness measurement is distinct from fracture toughness, which implies the capacity of materials to support loads despite fractures.
Gopal and Manoharan [
41] declared that the EA is a crucial standard for buildings situated in seismic zones. The work performed by the external force until the column specimen fails is the EA. The area of the load–deflection diagram is a good representation of how much energy is absorbed while loading is constant. The findings indicated that the columns with FRC filling had the maximum EA. The average EA of FRC-filled tubes is 7.8% higher than that of ordinary concrete-filled columns and more than twice as high as that of hollow columns.
According to Lu et al. [
47], the significant enhancement in the CFST column’s deformation capacity may considerably enhance the EA capacity. The axial load-axial shortening curves up to 85% of the maximum load in the descending stage were used to compute the EA capacity. The EA performance of the SFRCFST specimens with 0.6%, 0.9%, and 1.2% contents of the SFs increased by 14.9–31.7%, 25.3–94.1%, and 85.5–220.2%, respectively, when compared with the similar PCFST specimens. This process contributed to enhance the EA of concrete. The ability of concrete to absorb energy is improved by the SFs because of the increased lateral strain capacity that they impart and the EA during the pull-out of fibers that bridge tension and shear cracks in the failing matrix.
Karimi and Nematzadeh [
50] reported that the residual toughness ratios are computed as 1.98, 2.11, and 3.32 in the fibreless specimens under 20 °C, 250 °C, and 500°C, and as 2.15, 5.04, and 4.04 in the fiber-reinforced specimens, respectively, while the steel tube thickness increased from 2 mm to 3.5 mm. According to these results, enhancing the steel tube’s thickness significantly improved the ratio of residual toughness, which was due to a large rise in the compressive strength as well as a reduced slope in the load-strain curve’s descending stage. Furthermore, in contrast to the equivalent fibreless specimens, the specimens with 1% SF content always displayed a greater residual toughness ratio. This demonstrated that adding the SFs to the concrete core at the same time as thickening the steel tubes could significantly develop the residual toughness ratio.
Gajalakshmi and Helena [
69] provided the results from strain gauges at the base of the steel tubes and revealed that the outer steel tubes started yielding once the drift reached 1% or above. They achieved the specimens’ EA capacity after being loaded with varying amplitudes. When compared with the equivalent CFSTs, the SFRCFSTs with the D/t ratio of 38 showed an improvement in the EA capacity as 1.77 times. The EA capacity of the SCFTs with the D/t ratio of 57 was 1.55 times greater than that of the comparable CFST columns. This was owing to the point that adding 1% SFRC in-fill postponed local buckling and raised the number of cycles to failure, which improved the EA capacity.
Gajalakshmi et al. [
70] elaborated that depending on the in-fill type, thicker tubes have a higher increase in the EA capacity than thinner tubes. The EA capacity in all the tubes is dramatically decreased as the drift ratio is increased. Despite the D/t ratio and type of in-fill, the reduction in the EA capacity was roughly 1.2 to 1.9 times with an increase in the drift ratio from 2% to 4%, and around 1.4 to 1.8 times with an increase in the drift ratio from 4% to 6%.
3.7. Failure Mode
Gopal and Manoharan [
41] tested twelve slender circular steel tube columns filled with both plain concrete and FRC. Due to steel yielding and concrete crushing in the compression zone, all the specimens filled with concrete failed at the mid-height. The CFSTs could support more loads before failing from overall buckling, and they did not exhibit any localized evidence of buckling of the tube.
Lu et al. [
44] analyzed the failure mechanisms of all the specimens. Local buckling was the cause of the CFSTs’ failures. Throughout testing these specimens, cracking sounds were heard. The SFRCFSTs’ failure modes were the same as the CFSTs’ failure modes. The buckling deflection of these composite columns was slowed down by the addition of the SFs to concrete. This was a result of the SFs’ capability. The confinement of concrete by the SFs decreased the stress on the encasing steel tubes until concrete was fractured with its volumetric expansion, and the specimens were collapsed simultaneously.
Li et al. [
48] indicated that all the specimens exhibited similar failure patterns under loading. No visible deformation was observed, except for the gradual delamination of the steel tubes’ oxide coating and residual cement grout until the axial load was increased to 75% to 90% of the ultimate load (N
u). When the axial load exceeded the ultimte load, all the supports experienced significant volumetric expansion and the steel tubes began to buckle outwards. Several sever bulges occurred in the steel tube after the peak, and oblique slips occurred along the height of the steel tubes. All the samples had shear failure. Two visible local buckling and distinct shear failure lines appeared in the steel tubes. The addition of the SFs had no effect on the failure modes. This was because the SFs came into play after fracture occurred, and this mechanism played a role in limiting crack extension, growth, and propagation. After the outer steel tubes were removed, a definite shear plane was seen in the concrete core.
Local buckling that appeared around the columns ends was the failure mode of the square CFST columns, according to Naji et al. [
43], whereas local buckling toward the mid-height was the failure mode of the circular CFST columns.
Karimi and Nematzadeh [
50] discussed that the steel tubes surface color changed somewhat after being heated in the CFST tests. The surface color of the steel tubes heated to 250 °C was brighter than it was at 20 °C (room temperature). However, the steel tubes clearly darkened as the temperature surpassed 500 °C. After 750 °C, the steel tubes were nearly black, and their outer walls were covered with a thin brick red layer. This coating could be easily removed from the surface of the tubes, and as they were being loaded and before reaching their ultimate load, a section of this layer gradually fell. Shear slippage lines with a 45° angle relative to the horizontal line could be clearly visible on the surface of the CFST specimens that had previously been subjected to 750 °C during the compressive loading. The specimens heated to 250 °C and 500 °C illustrated this phenomenon to a lesser extent. The likelihood of the shear failure in the specimens was increased by the appearance of this phenomenon close to the two ends. In addition, before the compressive loading at 750 °C, aggregate particles around the top and bottom ends of the concrete core became loose and spalled off. The bulging of the steel tubes occurred in the region of this shear plane corresponding to the slip line on the steel tubes surfaces. Significant numbers of the SFs were drawn out in the shear plane, representing a strong bridging effect.
To provide acceptable structural safety, failure scenarios in concrete incorporating the SFs must be examined. Predicting the failure and strength of the SF anchorages was a research subject for Tóth et al. [
71]. Consequently, sixty-two pull-out and shear loading tests on steel anchors in the PCs and SFRCs were carried out. The test findings discovered that the SFRCs outperformed the PCs in terms of the load-displacement behavior. The SFRCs improved the load-displacement behavior of fastening systems. Further, a greater ductile behavior and crack bridging mechanism of the SFRCs allowed for a better fastening technology adoption.
3.8. Properties of SFs
The different properties of the SFs used in various research works are listed in
Table 4. From the table, it can be seen that various qualities of the SFs were employed.
The expansion agent of 40 kg/m
3 was applied for equivalent sand, and the SFs were added using external additional techniques. S0 was the control sample and S40–S80 (40 and 80 mean that the contents of the SFs were 40 kg and 80 kg, respectively) were analyzed. The mix proportions and workability values of concrete are provided in
Table 5, where C is cement content, FA is fine aggregate, SF is the steel fiber, SFB is the multi-anchor type steel fiber, S is sand, CA is coarse aggregate, W is water, WRA is water reducing agent, L
f is flow distance of concrete in L-type flowmeter, and V
t is time of concrete flow through V-type funnel. S40, S60, and S80 had the SF volume fractions of 0.5%, 0.75%, and 1%, respectively.
Concrete slump ranged from 210 mm to 250 mm, while its spreading values ranged from 500 mm to 650 mm [
73]. Concrete showed excellent performance in terms of enclosed property, fluidity, and self-compacting, which can meet the demands for engineering technology. It also did not bleed or segregate. The inclusion of the SFs altered the workability of micro-expansive concrete. As the dose was increased from 0 kg to 80 kg, the slump was decreased from 240 mm to 200 mm, the spreading was declined from 600 mm to 510 mm, the flow distance of the L-type flowmeter dropped to 200 mm, and the time flow through V-type funnel was increased in 2 s. These results suggested that the SFs reduced the fluidity of concrete and obviously decreased the concrete covering properties. Furthermore, there were significant shifts in the workability and pumping properties. When pumping concrete in the steel tube, the SF volume percentage should be less than 0.75%. The 7-day and 28-day strengths of S40–S80 were greater than S0, as seen in
Table 6. The compressive strength, tensile strength, and splitting tensile strength were enhanced by 15.8%, 78%, and 64.7%, respectively. The greater the SF concentration, the sharper increasing impact was on the strength. The strength enhancement effect was slowed down when the SF content was higher than 60 kg.
The experimental findings indicated that when the SFs and expanding agent were both utilized, the characteristics of concrete would be enhanced. In the fiber-reinforced micro-expansive concrete, the SFs constrained both the shrinkage and expansion, which increased the density of inner structure of concrete, the binding power between the SFs and cement paste, and the restriction impact on the concrete expansion. Moreover, the micro-expansion of concrete was considerably constrained, and self-stress produced. Resistance of the SFs and the self-stress substantially improved the tensile strength and ductility of concrete. Therefore, adding the SFs to the micro-expansive concrete that was poured into the steel tube significantly improved the CFSTs’ strength and ductility, when subjected to an eccentric or bending force.
Shi et al. [
74] evaluated different types of the SFRCs in which four groups of cube specimens and two groups of hexagonal prism specimens were made and cured under the same conditions. The compressive strengths of the cubes were measured after 28 days of curing and on the day of testing. Two sets of prismatic samples were utilized on the testing day to measure the concrete’s compressive strength and elastic modulus. The test results are given in
Table 7 according to the Chinese standard GB/T50081-2002 [
75,
76].
Zhang et al. [
77] tested two types of concrete specimens. In this experiment, C80-grade concrete with or without the SFs was used. The features of the mixes are displayed in
Table 8. The SFs that were employed had the length of 22 mm, the diameter of 0.73 mm, and the tensile strength of 1170 MPa. It was configured like an end hook shape. The measured cube compressive strength, f
c, and the modulus of elasticity, E
c, are reported in the table too.
Eight fire resistance tests were carried out by Zhu et al. [
78] on the SR-CFST columns filled with standard strength concrete under non-uniform fire circumstances. Five square and three circular SR-CFST columns were tested. A finite element model for the SR-CFST columns exposed to non-uniform fire was constructed by Meng et al. [
79,
80] and verified against the experiments previously done by Zhu et al. [
78]. Four-node shell elements, S4R, were employed in this investigation. The constant value of 200 W/m
2 for the gap conductance was used to create contact between the outer steel tube and the inner concrete core. The standard deviation was 0.015, and the average ratio of the experimental ultimate load-carrying capacity, N
cr, to the simulated values, N′
cr, was 0.98. Applying the numerical model, parametric studies were conducted to determine if the current fire design procedures for the CFST columns could be utilized for the SR-CFST columns.
Table 9 reports various properties of the SFRCs used in different studies where the investigated properties included the compressive strength (CS), splitting tensile strength (TS), flexural strength (FS), modulus of elasticity (ME), water-to-cement ratio (w/c ratio), steel fiber volume fraction (SFV), aggregate size (AZ), concrete strength (CoS), steel fiber ratio (SAR), steel fiber shape (SFS), and steel fiber type (SFT).
3.9. Summary of SFAddition
A large number of published articles were investigated by the authors of the current article. Generally, the SFs could improve the axial compressive behavior of the CFST columns. In total, the following summarized points were found.
Long and medium FRCs had higher flexural and strain hardening capabilities than short FRCs, and fiber lengths should be 2 to 5 times the maximum aggregate size.
Use of the SFRC as a filler in the steel tubes enhanced the fire resistance.
The ductility of the SFRCFSTs was increased, and the bulges in the steel tube were postponed by using the SFRC as a filler material.
The impact of the slenderness ratio on the SFRCFST columns was as the same as that of the CFST columns.
The addition of the SFRC to the steel tubes improved the SFRCFSTs’ EA capacity.
4. CFSTs with GFRP Jacketing
Fam and Rizkalla [
28] resulted that the confinement provided by the GFRP tubes could increase the strength and ductility of concrete. The maximum level of the confinement was attained for fully filled tubes. While adding an inner tube could enhance the confinement for this type of member, using a central hole diminished the impact. According to the test results, filling the GFRP tubes reduced the confinement efficiency. The implications of the laminate structure, tube stiffness, concrete core contact conditions, and failure modes were examined.
Abdalla et al. [
97] assessed the behavior of the circular GFRP wrapping sheets on the CFSTs and confined CFSTs (CCFSTs) under concentric compressive quasi-static stresses. The influences of various conditions on the behavior of thirty-five CFST and CCFST specimens were studied. Two concrete compressive strengths of 44 MPa and 60 MPa were taken into account along with three diameter-to-thickness (D/t) ratios of 54, 32, and 20. The principal cause of failure for the CCFST specimens was found to be the explosive rupture of the GFRP wraps at the specimens’ mid-height region. The axial load-carrying and ductility capabilities of the CCFST specimens were considerably enhanced as a result of the GFRP extra confinement, even if the strain hardening zone was as obvious in the CCFST specimens as it was in its CFST benchmarks.
Divya and Anima [
98] tested the axial compressive behavior of the circular CFST short columns filled with various forms and ratios of fiber reinforced concrete, such as GFRC and coir fiber-reinforced concrete (CFRC). A total of eighteen specimens with varied volume percentages of 0.00, 0.50, 0.75, 1.00, and 1.25 were cast in glass and coir fibers.
In accordance with Wang and Zha [
99], the load-carrying capacity of the GFRP-reinforced CFSTs having fibers with hoop direction was increased by 35% compared with the control CFSTs, while the load-carrying capacity of the columns having fibers with 45° winding angles was enhanced by 17.5%.
Reddy and Sivasankar [
100] reported the axial deformation values of the GFRP-wrapped tubes (CCFST-1L-2, CCFST-2L-2, and CCFST-3L-1) as 4.06%, 6.53%, and 8.85% greater than CC2, respectively. At the maximum load, the corresponding deformations were 6.61 mm, 6.44 mm, and 6.28 mm, respectively.
4.1. Ductility
The ductility and ultimate strength of the specimens may significantly be increased by the GFRP tubes, and the confinement behavior can be dependent on the winding angles of fibers. Although they have little impact on the load-carrying capacity, fibers with the winding angles of less than ±45° noticeably improve the ductility of columns [
99].
The recycled aggregate concrete (RAC)-filled GFRP-steel composite tubes showed greater ductility compared with the RAC-filled steel tubes [
101]. The two specimens (G-N1-S5 and G-N2-S5) with the aspect ratio of 5 provided good ductility indexes above 4. G-N2-S5, as the specimen with the greatest ductility index among the examined specimens (5.47), clearly indicated remarkable ductility behavior. Additionally, the ductility indexes of the specimens, with the aspect ratios of 7.5 (S-N2-S7, G-N2-S7, and G-N3-S7), which were categorized as moderate according to FEMA 356, were greater than 2 but less than 4. Only one specimen (G-N2-S10), which had the aspect ratio of 10 or greater, satisfied the requirement for low ductility. The ductility of the RAC-filled GFRP–steel composite tubes was reduced when the aspect ratio increased. This demonstrated that a proper length could effectively enhance the ductility of the tubes.
The circumferential FRP-reinforced specimens (G-H1 and C-H1) showed increased ductility, which was thanks to the confinement of the FRPs with better post-peak loading performance. Comparing the ductility indexes of the specimens allowed the researchers to evaluate how the longitudinal FRP thickness affected the ductility. It should be noted that the ductility was reduced, as the FRP thickness was increased. Failure of the FRPs with larger thickness might be anticipated to result in more significant loading declines, lowering the ductility. In comparison with the specimens with a single circumferential or longitudinal GFRP reinforcement, the ductility was clearly enhanced for the specimens with the GFRP reinforcement (G-B2, G-B4, and G/C-B4). This was primarily due to the outer circumferential FRPs’ ability to postpone or even prevent delamination of the GFRP-steel interface while simultaneously confining the steel tube and anchoring the longitudinal GFRP [
102].
Feng et al. [
103] mentioned that for the specimens with the concrete compressive strengths of 32.0 MPa, 64.0 MPa, and 97.6 MPa, the ranges of the ductility indexes were 14.2–19.4, 6.7–7.2, and 1.0–3.1, respectively. In accordance with these findings, the ductility index was decreased, as the concrete compressive strength was increased. For the specimens with the comparable concrete compressive strength, the ductility index was improved slightly by the increase of the confinement ratio.
4.2. Stiffness
Fam and Rizkalla [
28] defined the maximum strength of the hybrid stubs divided by the strength of the unconfined concrete as the confinement effectiveness (f′
cc/f′
c). The strength and stiffness (E
t/R) of the tube in the hoop direction, which regulated the degree of the confinement, both had an impact on this ratio. Different stubs were chosen to investigate how the tube’s stiffness affected the efficiency of the confinement. The tubes were made up of fully filled GFRP tubes with the stiffness values ranging from 550 MPa to 1462 MPa.
The stiffness of the specimens was improved when the D/t ratio was enhanced from 32 to 54. The stiffness was not, however, remarkably increased when the ratio changed from 20 to 32. On the other hand, when the D/t ratio was decreased, the strain hardening portion of the curve grew. The strain hardening portion of the curve for D/t = 54 was somewhat shorter than the other specimens, as measured from the end of the linear section to the load decrease [
97].
Reddy and Sivasankar [
100] observed that the tubes which have suffered from corrosion should be wrapped with the GFRP jackets since this is thought to be an efficient way to increase stiffness.
Fang et al. [
101] reported that stiffness deteriorations were seen in all the specimens. The secant stiffness first experienced a large loss at a quick rate of deterioration as a result of increasing lateral drift. When the secant stiffness reached the range between 19% and 56% of the initial stiffness, the increase was slowed down and became more gradual. They also interestingly clarified that the specimen G-N2-S7 and comparable control specimen S-N2-S7 had similar secant stiffness degradation rates. This suggested that the GFRP outer tube had little impact on the stiffness degradations of the RAC-filled GFRP-steel composite tube columns.
Parvati and Joanna [
104] experimentally obtained the initial stiffness of the concrete-filled double skin tubes wrapped with GFRP (WCFDSTs) which was on average 4634.47 N/mm, whereas the initial stiffness of the CFSTs wrapped with GFRP (WCFSTs) was 3454.40 N/mm. While the specimen WCFST2 achieved 50% of its original stiffness in the fourth cycle at Δ/Δ
y = 1.7, the specimen WCFST1 did so in the fifth cycle. In the fourth cycle, both WCFDST1 and WCFDST2 specimens attained their 50% initial stiffness at Δ/Δ
y = 1.14 and Δ/Δ
y = 1.29, respectively. When compared with the WCFSTs, the WCFDSTs displayed higher initial stiffness. All the specimens’ stiffness deteriorations followed the same course. In comparison with the WCFSTs, the WCFDSTs indicated 16% more ductility.
4.3. Compressive Strength
Fam and Rizkalla [
28] explained that while the capacity of the steel/concrete system, tube 7, was increased by just 18%, the measured strength of the GFRP/concrete hybrid system, tube 1, was 41% greater than the combined load capacities of the unconfined concrete and GFRP tube. This behavior was because of the fact that the steel tube took more axial load than the GFRP tube did at the same amount of the axial strain, primarily because steel had a larger elastic modulus in the axial direction than the GFRP. Also, the thickness of the steel tube was 1.59 times greater than that of the GFRP tube.
It was clear how the CCFST specimen set, which had D/t = 54 and high concrete compressive strength, varied from the other sets [
97]. Compared with the other CCFST specimens, these specimens had an unusual behavior. The testing machine data for the CCFST f
60D
167t
3.1-1 and CCFST f
60D
167t
3.1-3 showed continuous declines in loading after reaching the maximum capacity rather than an explosive rupture or even steel tube buckling. The behaviors of the CFST components at various D/t ratios were displayed in relation to the impacts of the concrete compressive strength. For instance, when the compressive strength of the concrete infill was increased by 36.4%, the CCFST specimens’ ultimate axial capacity was enhanced by 2.4%. The ductility or toughness of the CCFST specimens with D/t = 20 did not seem to improve. On the other hand, when f′
c was increased, there was a small development in the specimens’ ductility. Further, compared with the HSC infill, the load decrease in the CCFST specimens with regular concrete infill was larger.
Divya and Anima [
98] compared the performance of experimentally tested coir fiber-reinforced CFSTs (CFRCFSTs) with the GFRP-CFSTs. Eighteen specimens were casted in glass and coir fibers with different volume percentages of 0.00, 0.50, 0.75, 1.00, and 1.25. It was found that the GFRP-CFSTs performed best at the ratio of 0.75% (
Table 10). In comparison with the control specimen, the ultimate stresses on the GFRP-CFSTs and CFRCFSTs were greater. The use of the fibers improved the composite action between the steel tube and concrete core by increasing the strength of the concrete core.
Table 11 and
Figure 5 depict the increases in the ultimate compressive loads of the columns including the control columns [
100].
Table 11 also provides the improvements in the ultimate compressive loads as percentages when the GFRP confined tubes are compared with the normal tubes. The ultimate compressive load of the specimen CCFST-1L (one layer) was 713 kN, and the gain percentage compared with the control specimen was 5.32%. In comparison with the control specimen, the ultimate compressive load measured for the specimen CCFST-2L (two layers) was 734 kN, which was 8.42% greater. Similar to this, the specimen CCFST-3L (three layers) had the compressive strength of 746 kN and the gain over the control specimen was 10.19%. Using more GFRP layers enhanced the ultimate compressive load of all the confined specimens. Between the GFRP layers, resin broke down. In comparison with the control specimens, generally there was an increase in the ultimate compressive loads.
Parvati and Joanna [
104] declared that while the WCFST2 specimen had the maximum load of 28.35 kN at the displacement of 31.9 mm, the WCFST1 specimen had the maximum load of 42 kN with the displacement of 38.85 mm. At the displacements of 32.85 mm and 37.55 mm, the WCFDST specimens (WCFDST1 and WCFDST2) had the maximum loads of 39.55 kN and 32.2 kN, respectively. The WCFDST specimens were found to have almost the same load-carrying capacity as the WCFST specimens.
The GFRP confinement remarkably increased the axial load-carrying capacity of the columns. With the GFRP wraps, the capacity of the specimen G3-4.0-a, with 3 layers of the GFRP, was improved by 63%. The capacity and ductility of the columns could be enhanced by adding more layers of the GFRP wraps. The yield and ultimate loads were significantly improved as the steel tube thickness was increased. Increasing the concrete compressive strength had little effect on the ductility, although it could enhance the columns’ ultimate loads [
105].
Results of the columns tested by Parvati and Joanna [
106] are given in
Table 12. The average peak load of the CFST columns (CS1 and CS2) was 895.02 kN, while the average peak load of the concrete-filled double skin tube (CFDST) columns with inner PVC tube was 713.2 kN. The CFDST columns with inner PVC tube and wrapped with GFRP had an average peak load of 894.33 kN, while the CFST columns with GFRP wrapping had an average peak load of 910.91 kN. The axial compression was applied to eight columns, including four CFDST columns and four CFST columns. Two CFDSTs and two CFSTs were covered with 3 mm thick GFRP jackets. All the tubes of the columns were made of cold-formed steel and were 700 mm tall and 3 mm thick. The outer tube of the CFDST columns was a square hollow section measuring 100 mm by 100 mm in cross section, while the inner tube was a polyvinyl chloride (PVC) pipe measuring 50 mm in diameter and 3 mm in thickness. M30-grade fly ash concrete, in which 40% of cement was replaced by fly ash, was used to fill the area between the two tubes.
4.4. EA Capacity
In accordance with Fang et al. [
101], the specimen G-N2-S7 had better hysteretic EA behavior compared with the control specimen S-N2-S7. The ultimate viscous damping ratio of the specimen G-N2-S7 had two times higher final results than the specimen S-N2-S7, even though the latter’s drift was less. It was clear that as compared with the specimen GN2-S5, both specimens G-N2-S7 and G-N2-S10 had smaller final viscous damping ratio values but noticeably larger EA curves. This outcome was in line with E
sum’s findings. Additionally, the impact of the axial compression ratio led to a rise in the rate of the EA. The axial compression ratio could be affected by the aspect ratio. The ultimate value of the viscous damping ratio was enhanced as the axial compression ratio was increased for the specimens with lower aspect ratio (G-N1-S5 and G-N2-S5). However, the EA capacity of the specimens with larger aspect ratio (i.e., G-N2-S7, G-N3-S7, and G-N4-S7) was accelerated by increasing axial compression ratio until the drift ratio reached almost 3.6%. The specimen G-N3-S7 illustrated a greater EA capacity than the other two specimens.
The EA capacity of the composite tubes was assessed by Zhu et al. [
102] using the EA coefficient and equivalent damping coefficient (h
e). For each specimen, the hysteretic loop with summit loading was utilized to compute the EA and h
e. The EA value of the specimen C-H1, with one layer fully covered circumferential FRP, was greater than that of the ordinary CFST (BE), indicating that a more effective strategy to enhance the composite columns’ EA was to better restrict local buckling of the steel tube. The EA values of the specimens C-L1, C-L2, C-B2, and C-B4 were much lower than those of the BE, displaying that the EA capacity would significantly be reduced by the longitudinal CFRP reinforcing. It was clear that the specimens G-B2 and G-B4 had much higher EA values compared with the specimen BE. Given that the circumferential GFRP reinforcement only marginally increased the EA value of the specimen G-H1, it was reasonably deduced that the enhanced EAs of the specimens G-B2 and G-B4 were mostly brought by the longitudinal GFRP reinforcement. It may be concluded that the longitudinal GFRP aided in enhancing the EA. However, the specimens G-L1 and G-L2 with single longitudinal GFRP reinforcement did not achieve obvious enhancements in the EA values. This could be explained by assuming that the composite columns failed due to delamination at the GFRP-steel interface. Therefore, the reinforcing effect of the vertical FRP was not sufficiently exhibited. Restraining local buckling of thin-walled steel tubes and ductile bending reinforcement of the columns was the best strategy to improve their seismic performance.
Parvati and Jaonna [
106] calculated the EA capacities of the CFDST specimens up to 20-mm deformation.
Table 12 lists the various columns’ EA capacities. The WPVC specimens had the EA capacity of around 14% greater than the PVC specimens. As a consequence, when GFRP wrapping was utilized, the EA capacity was increased, proving that wrapping provided adequate confinement.
Hassanein et al. [
107] used the area under the load-deformation curve to compute the ductility, which was represented by the energy absorbed by the composite specimen (toughness). In comparison with the specimen B-1100-C80, the ductility values of the specimens B-1100-FC60 and B-1100-FC55 were increased by 20.6% and 15.8%, respectively. Glass fibers produced specimens with a 1400 mm span that were tougher than those with 1100 mm span. The EAs of the specimens B-1400-FC60 and B-1400-FC55 were greater by 34.7% and 45.2%, respectively, than that of the specimen B-1400-C80. However, the specimens B-1100-C80 and B-1400-C80 gave the lowest deformation values. With regard to both short-span (100 mm) and long-span (1400 mm) square steel tube specimens having the compressive strengths of C55 and C60, it could be concluded that the use of glass fibers increased the specimens’ overall toughness when compared with those containing high strength in-fill (i.e., C80) without fibers.
4.5. Failure Mode
Based on Wang and Zha [
99], concrete instantly crushed in the middle of the tube where the hoop fiber ruptured in the [±88]
5S GFRP-CFST specimen, owing to the lack of the confinement. The specimen split into two pieces and fractured in a brittle way. The failure mechanism of the [±65]
5S GFRP-CFST specimen was a brittle fracture with crushed concrete burst out from the crack of the GFRP tube. The encased concrete almost completely crushed by this GFRP fracture along the cylinder axis, except for the upper and lower cone shape blocks due to the shear failure. The [88
2 ± 45/88]
S GFRP-CFST specimen failed due to the rupture of the GFRP tube along the longitudinal axis and the cracking surface. In contrast to the brittle behavior described above, the GFRP-CFST with a fiber orientation of 45° demonstrated great ductility. The specimen was able to withstand the load even when deformed significantly, and only the resin was broken after the test. The hoop fibers in the [±88]
3S concrete-filled GFRP-reinforced steel tube (CFFST) specimen abruptly broke near the middle of the specimen as it achieved its peak load. The GFRP failure zone then gradually spread toward the whole tube. When the CFST lost the confinement of the fibers, the top, middle, and bottom of the steel tube buckled. A [±45]
3S GFRP-CFST specimen depicted buckling at the mid-height of the steel tube and cracks along the cylinder axis. The specimens’ failure was controlled by the glass fibers tensile failure, except for the specimens with the resin compressive failure and the specimens wrapped in a 45° fiber orientation.
Reddy and Sivasankar [
100] examined the control specimen which had no wrapping and failed due to top-located local buckling. Although the GFRP fibers did not change the actual mechanism of the failure, they could delay buckling and allow crushing stresses to reach higher values, leading to an increase in the load-carrying capacity. All constrained tubes’ abilities to buckle were successfully resisted by the GFRP. The results indicated that the GFRP adhered to corroded columns effectively. It was also noted from the failure patterns that all the confined columns collapsed due to the GFRP rupture, not because of the fibers’ delamination. All the confined tubes had a sharp decrease in load following the fibers rupture.
Zhu et al. [
102] investigated various failure modes of the specimens and resulted that the longitudinal GFRP specimens had some ductile behavior, because the high glass fibers elongation ratio allowed the specimens to have more deformation. The examined longitudinal CFRP-reinforced specimens, on the other hand, presented a clear brittleness. In terms of the FRP confinement, the CFRP confined the steel tubes more successfully, improving the columns’ seismic performance. Furthermore, it would be clear to draw the conclusion that the reinforcing design including the longitudinal GFRP combined with hoop CFRP may accomplish the best reinforcing effect for enhancing the seismic performance of the columns.
Feng et al. [
103] observed that when steel–concrete–FRP–concrete (SCFC) specimens were exposed to a monotonically axial compression, they generally depicted comparable structural characteristics. Within 0 mm to 3 mm of the axial displacement, no remarkable lateral deformation was first noticed. Small local buckling then occurred slightly outward on the steel tubes surface. Following the second loading procedure, there were clear lateral deformations, and a loud noise indicated the inner FRP tubes had ruptured. The square steel tubes illustrated symmetrical dilatation at the same time, changing the sections’ shape to a circle. The CFFT specimens’ failure was subsequently brought on by the FRP rupture after observation of the loading processes which revealed a symmetrical lateral deformation without any obvious local outward deformation. The FRP tubes in the SCFC specimens only partially burst in contrast to the failure modes, as opposed to the overall rupture seen in the CFFT specimens, which was linked to a more brittle and explosive failure mode.
Parvati and Jaonna [
106] presented that the CFST columns with GFRP wrapping, the WCS1 and WCS2 in
Table 12, could have a steadily increasing load with a sharp yield point and a plastic zone after it. De-bonding of the GFRP from the steel tube in the WCS1 resulted in a bulge forming at the top of the column. With the rupture of the GFRP, WCS2 displayed bulge development at the midpoint of the column. The load–deflection relation patterns of the CFDST columns with inner PVC tube and wrapped with GFRP, the WPVC1 and WPVC2, were slightly different. The WPVC2 column’s load–deflection curve had a sharp yield point and a plastic zone, like WCS1 and WCS2. At the top of the CFDST columns with inner PVC tube, the PVC1 and PVC2, an elephant-foot buckling type was witnessed.
Mirmiran et al. [
108] discussed that the compressive failure was required to utilize the confinement in the specimens efficiently. With up to 6% reinforcement, the CFFTs performed just as well in the compression control zone as their corresponding conventional RC columns. Failure of the CFFTs was gradual. Moreover, toughness and ductility measurements of the CFFTs were very similar to those of their corresponding conventional RC sections. The CFFTs were undoubtedly more beneficial at greater axial stress values.
Nearly 10 million tons of glass debris are not recycled annually in China, according to a sector study made public by the Ministry of Commerce [
109]. Inspired by the RAC, if the glass waste could be processed to substitute sand and stone materials for the manufacture of concrete, it would recycle a significant quantity of waste glass and conserve natural resources, which also aligns with the idea of sustainable low-carbon development. On the basis of this theory, Zeng et al. [
109] carried out an experimental study on the compressive performance of the recycled glass aggregate concrete (RGAC) specimens that were enclosed in the CFRP. The test variables used in the study were the replacement rate for recycled glass aggregate, stiffness of the CFRP, and the curing age.
4.6. Summary of GFRP Addition
After reviewing many published articles on the GFRP addition and their important considerations, the following outcomes can be summarized. In general, wrapping of the columns with the GFRP jackets could be an interesting idea for the performance improvement of the columns.
For specimens having unidirectional GFRP reinforcement, as opposed to only a single circumferential or longitudinal reinforcement, the ductility was considerably enhanced.
The ultimate compressive strengths of the reinforced columns were increased by adding extra GFRP layers.
Since the GFRP jacketing was found to be an effective method to enhance stiffness, the corrosion-damaged tubes should be wrapped with them.
The EA capacity was significantly improved when the GFRP wrapping was done, demonstrating that wrapping offered sufficient confinement.
Failure characteristics showed that the confined columns failed completely because of the GFRP rupture rather than the fiber delamination.
The GFRP fibers postponed buckling and enabled compressive strength to increase which led to the enhancement of the load-carrying capacity of the columns even if they did not alter the actual mechanism of the failure.


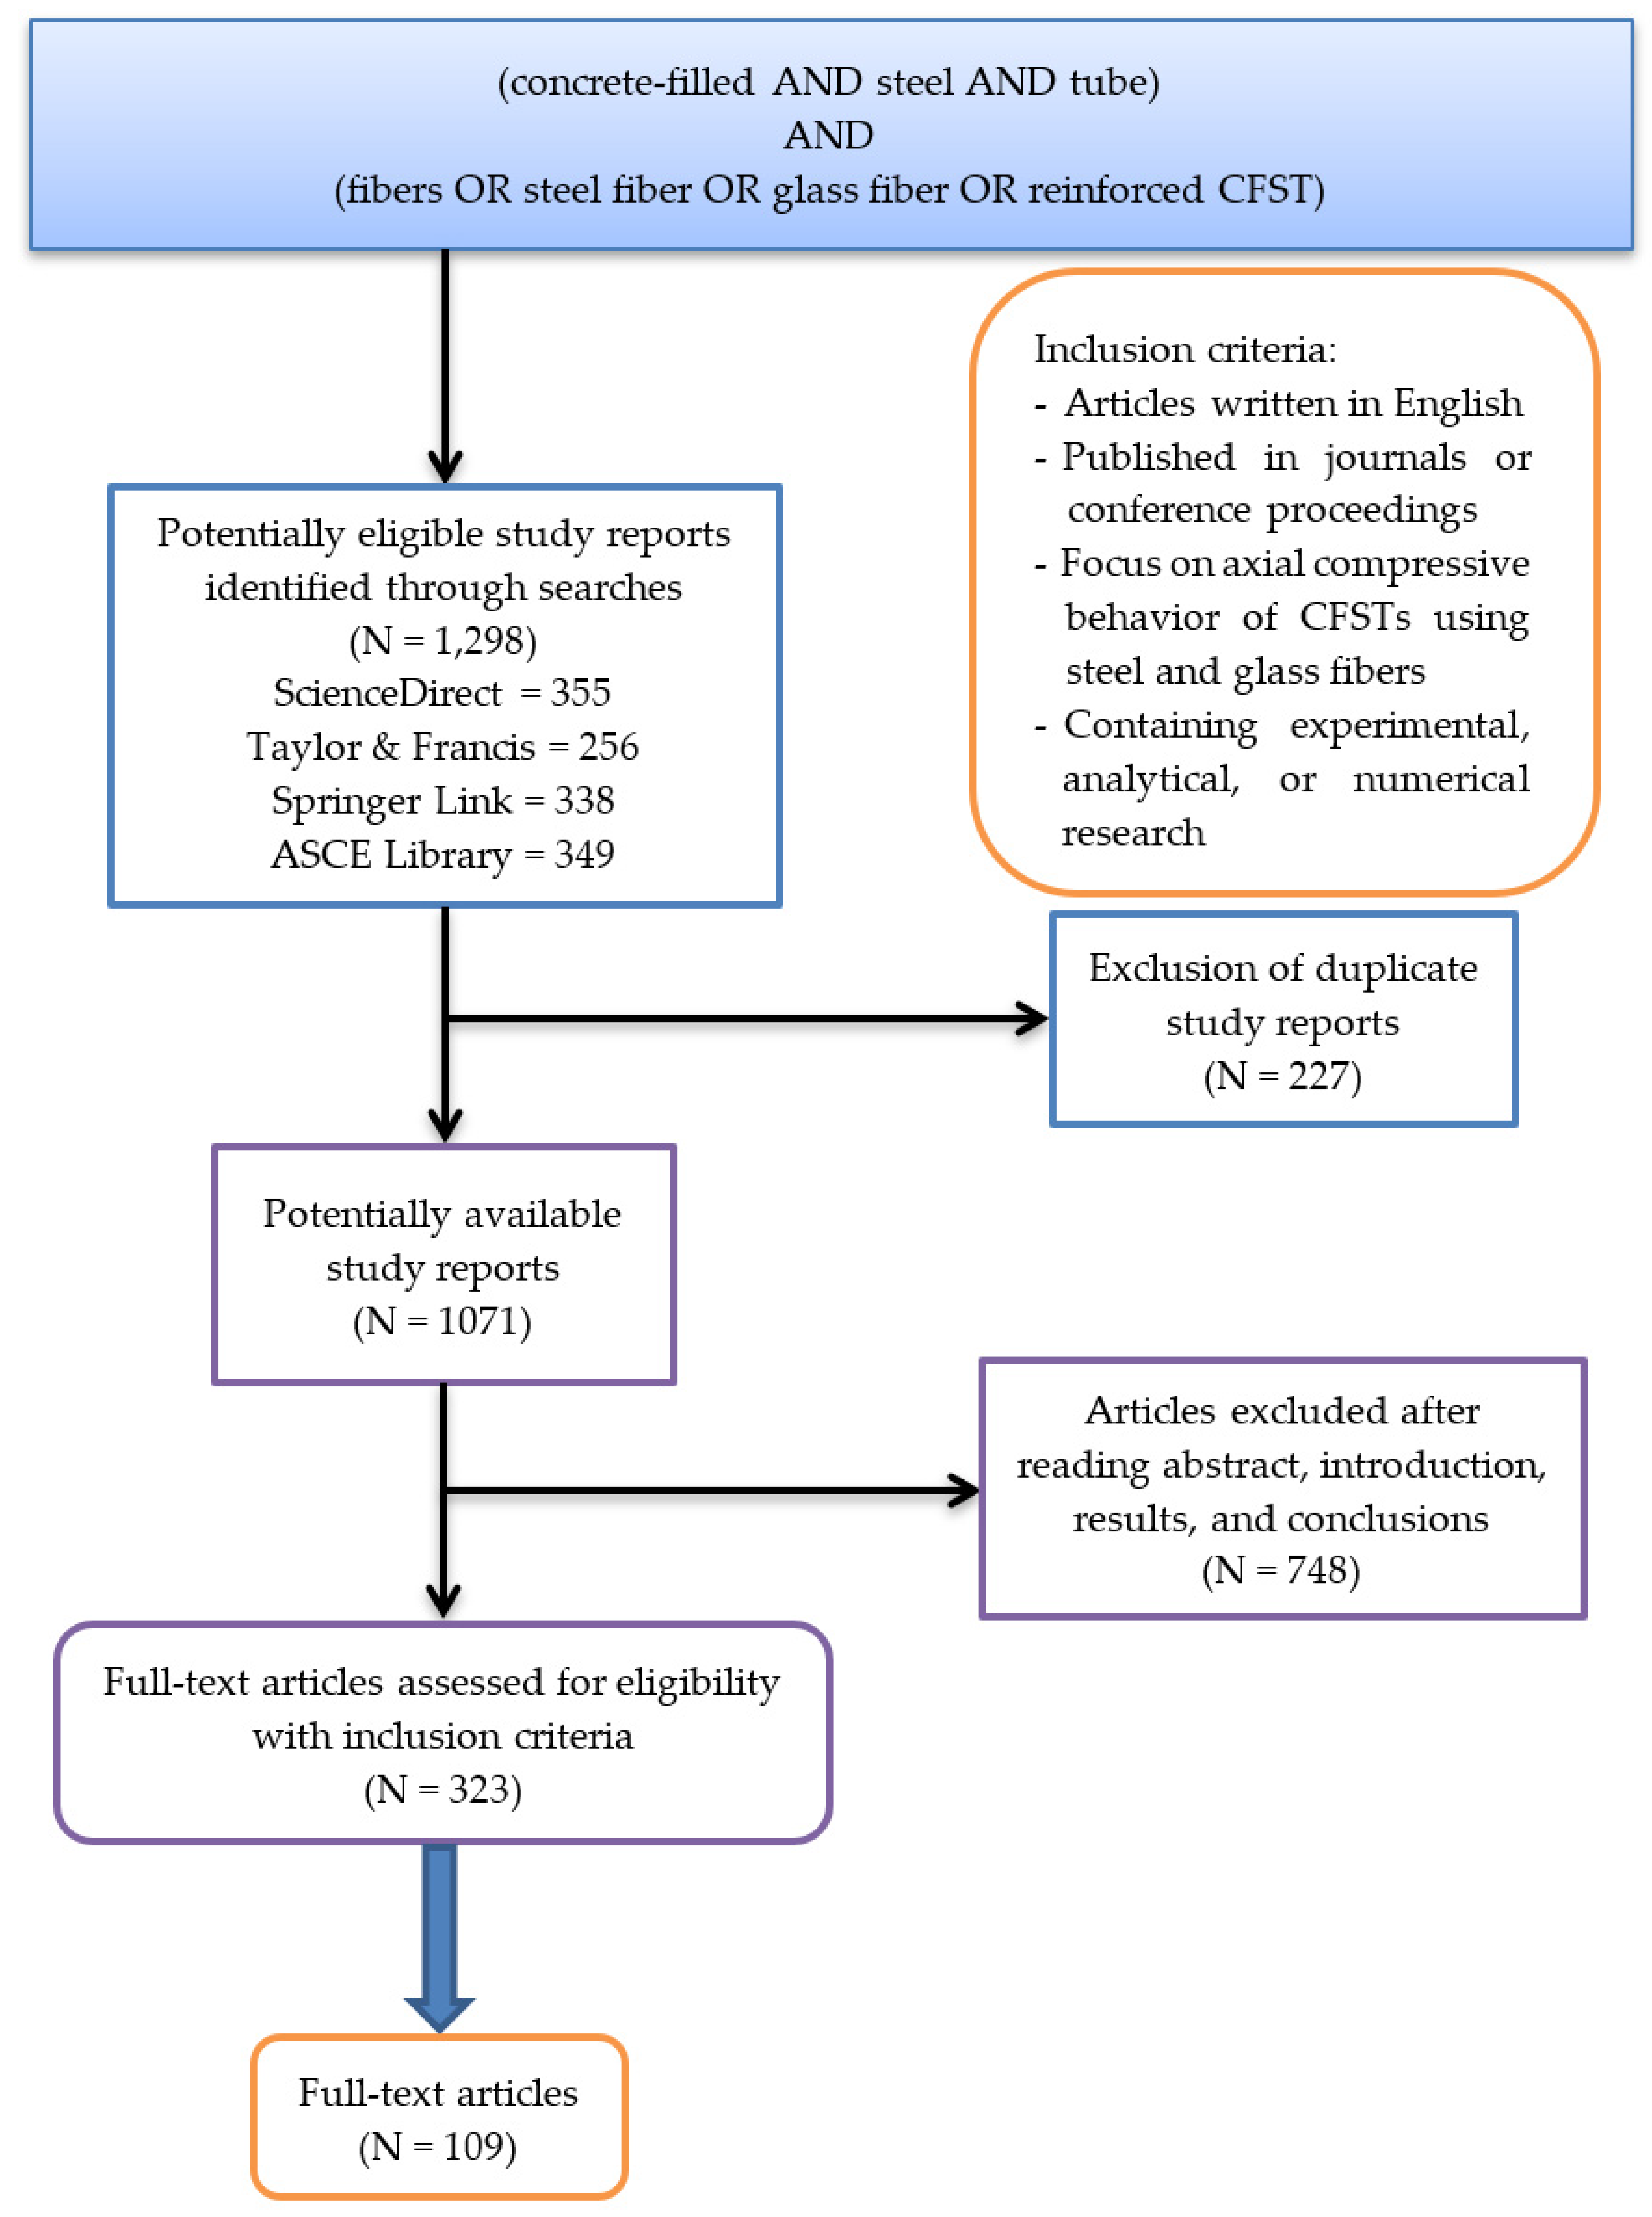
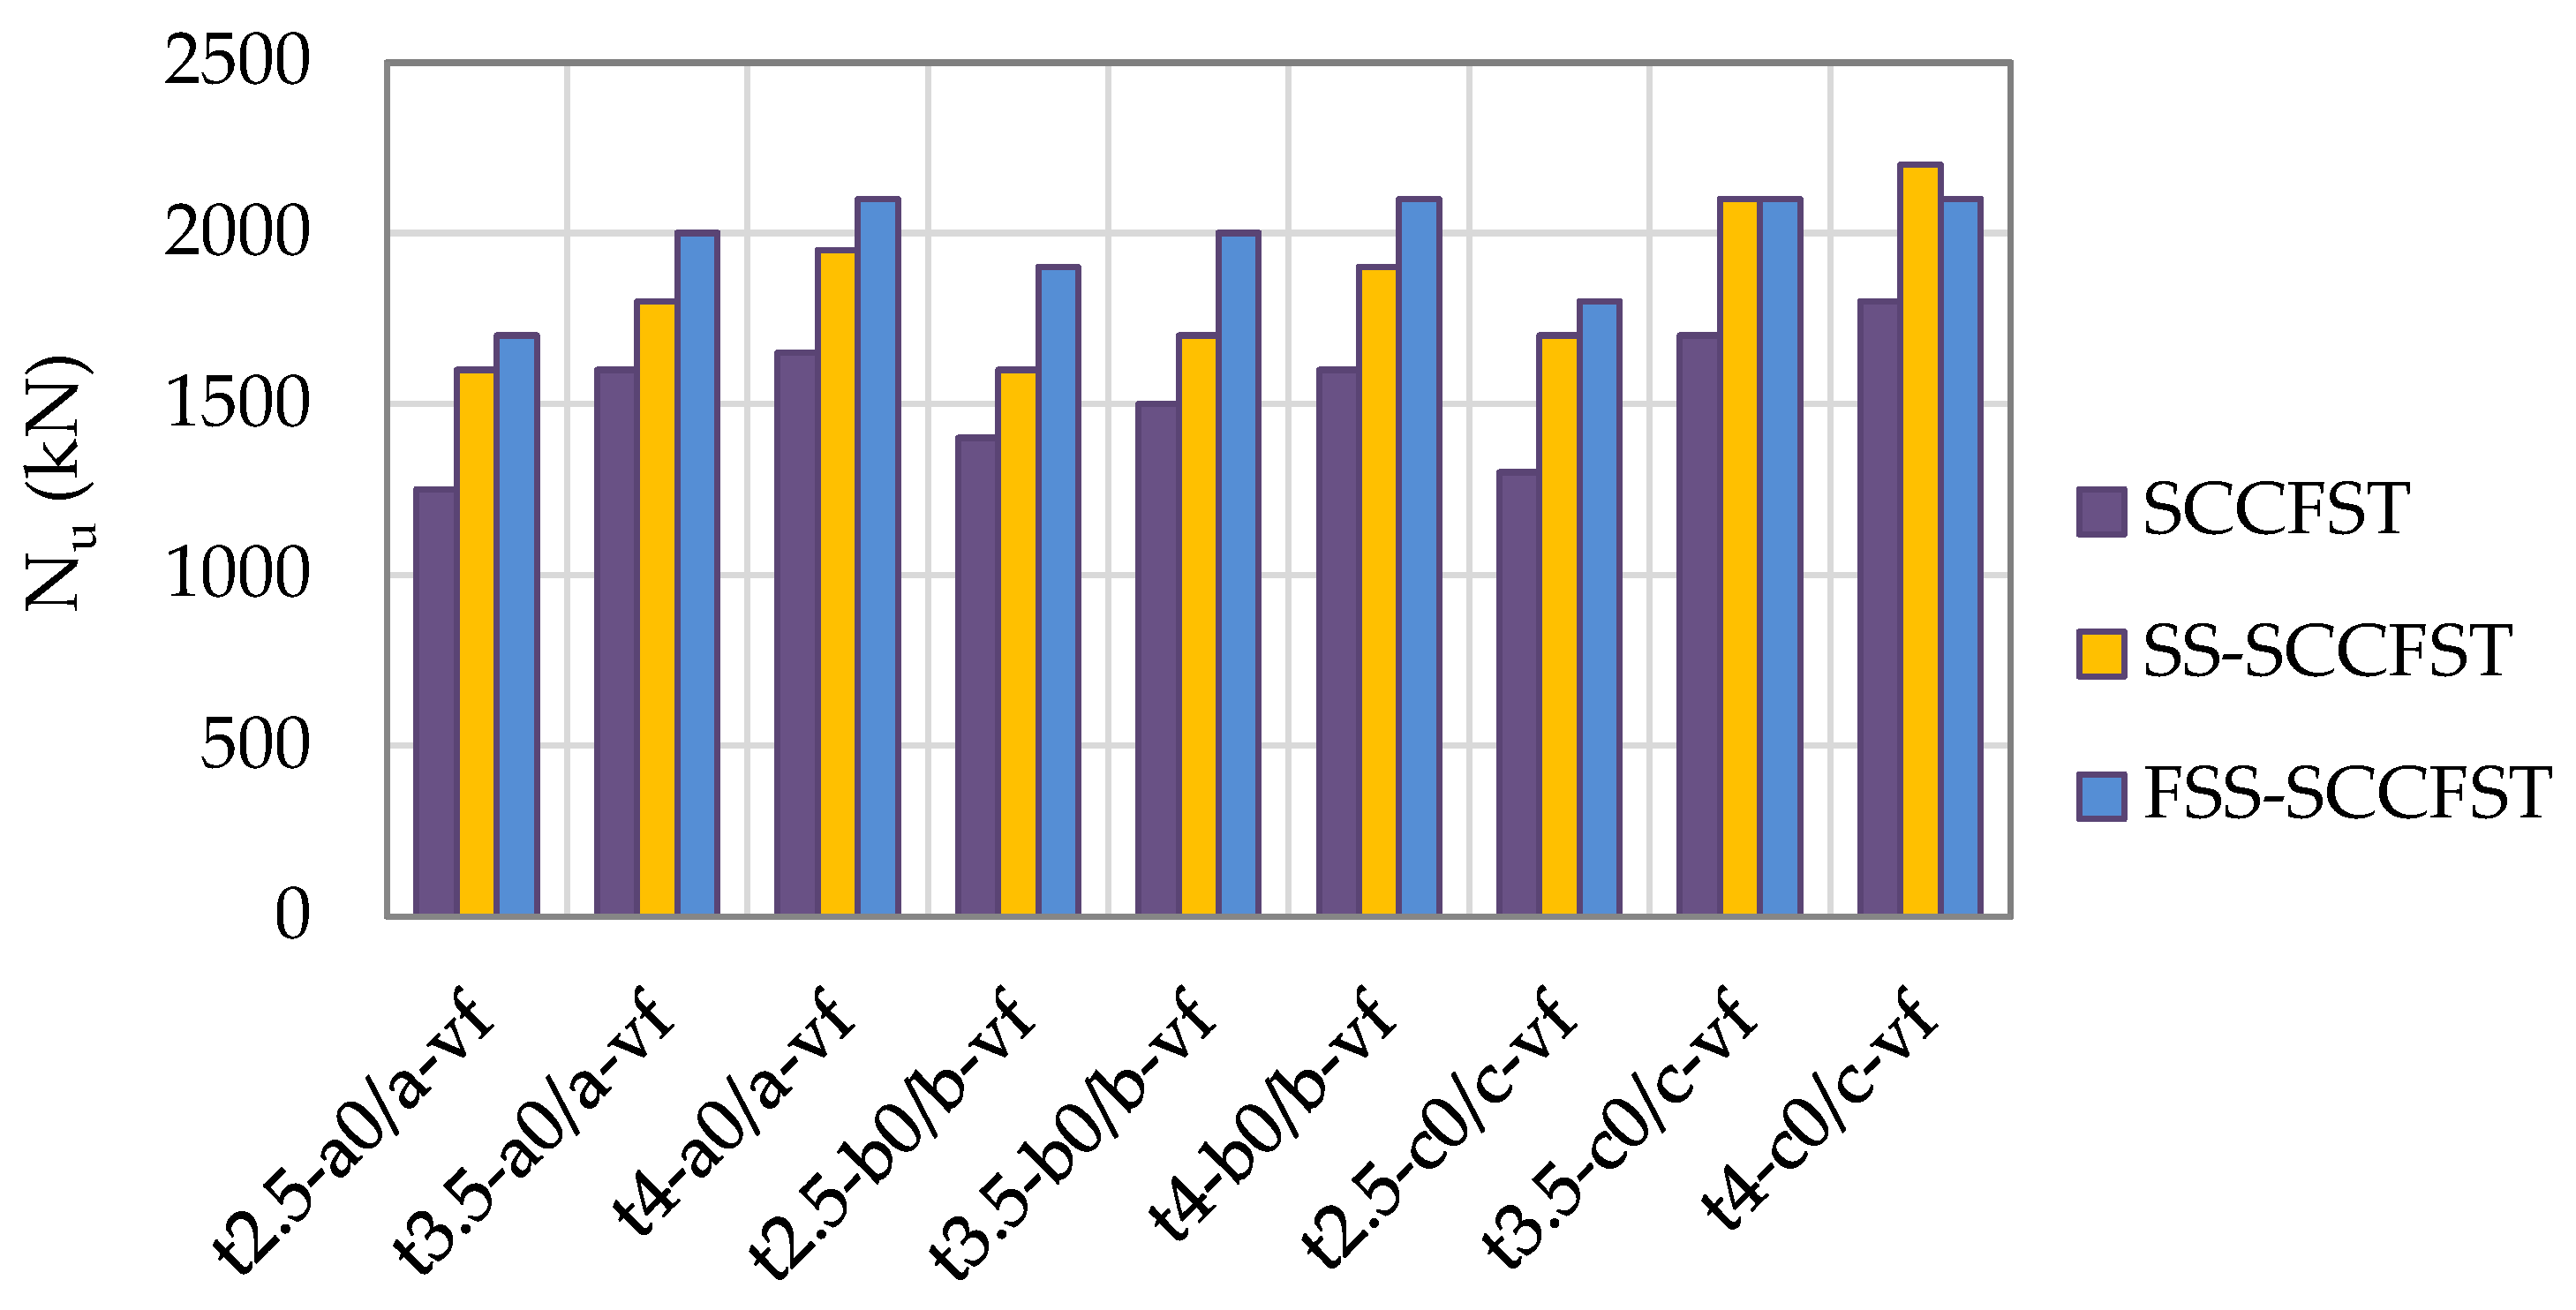
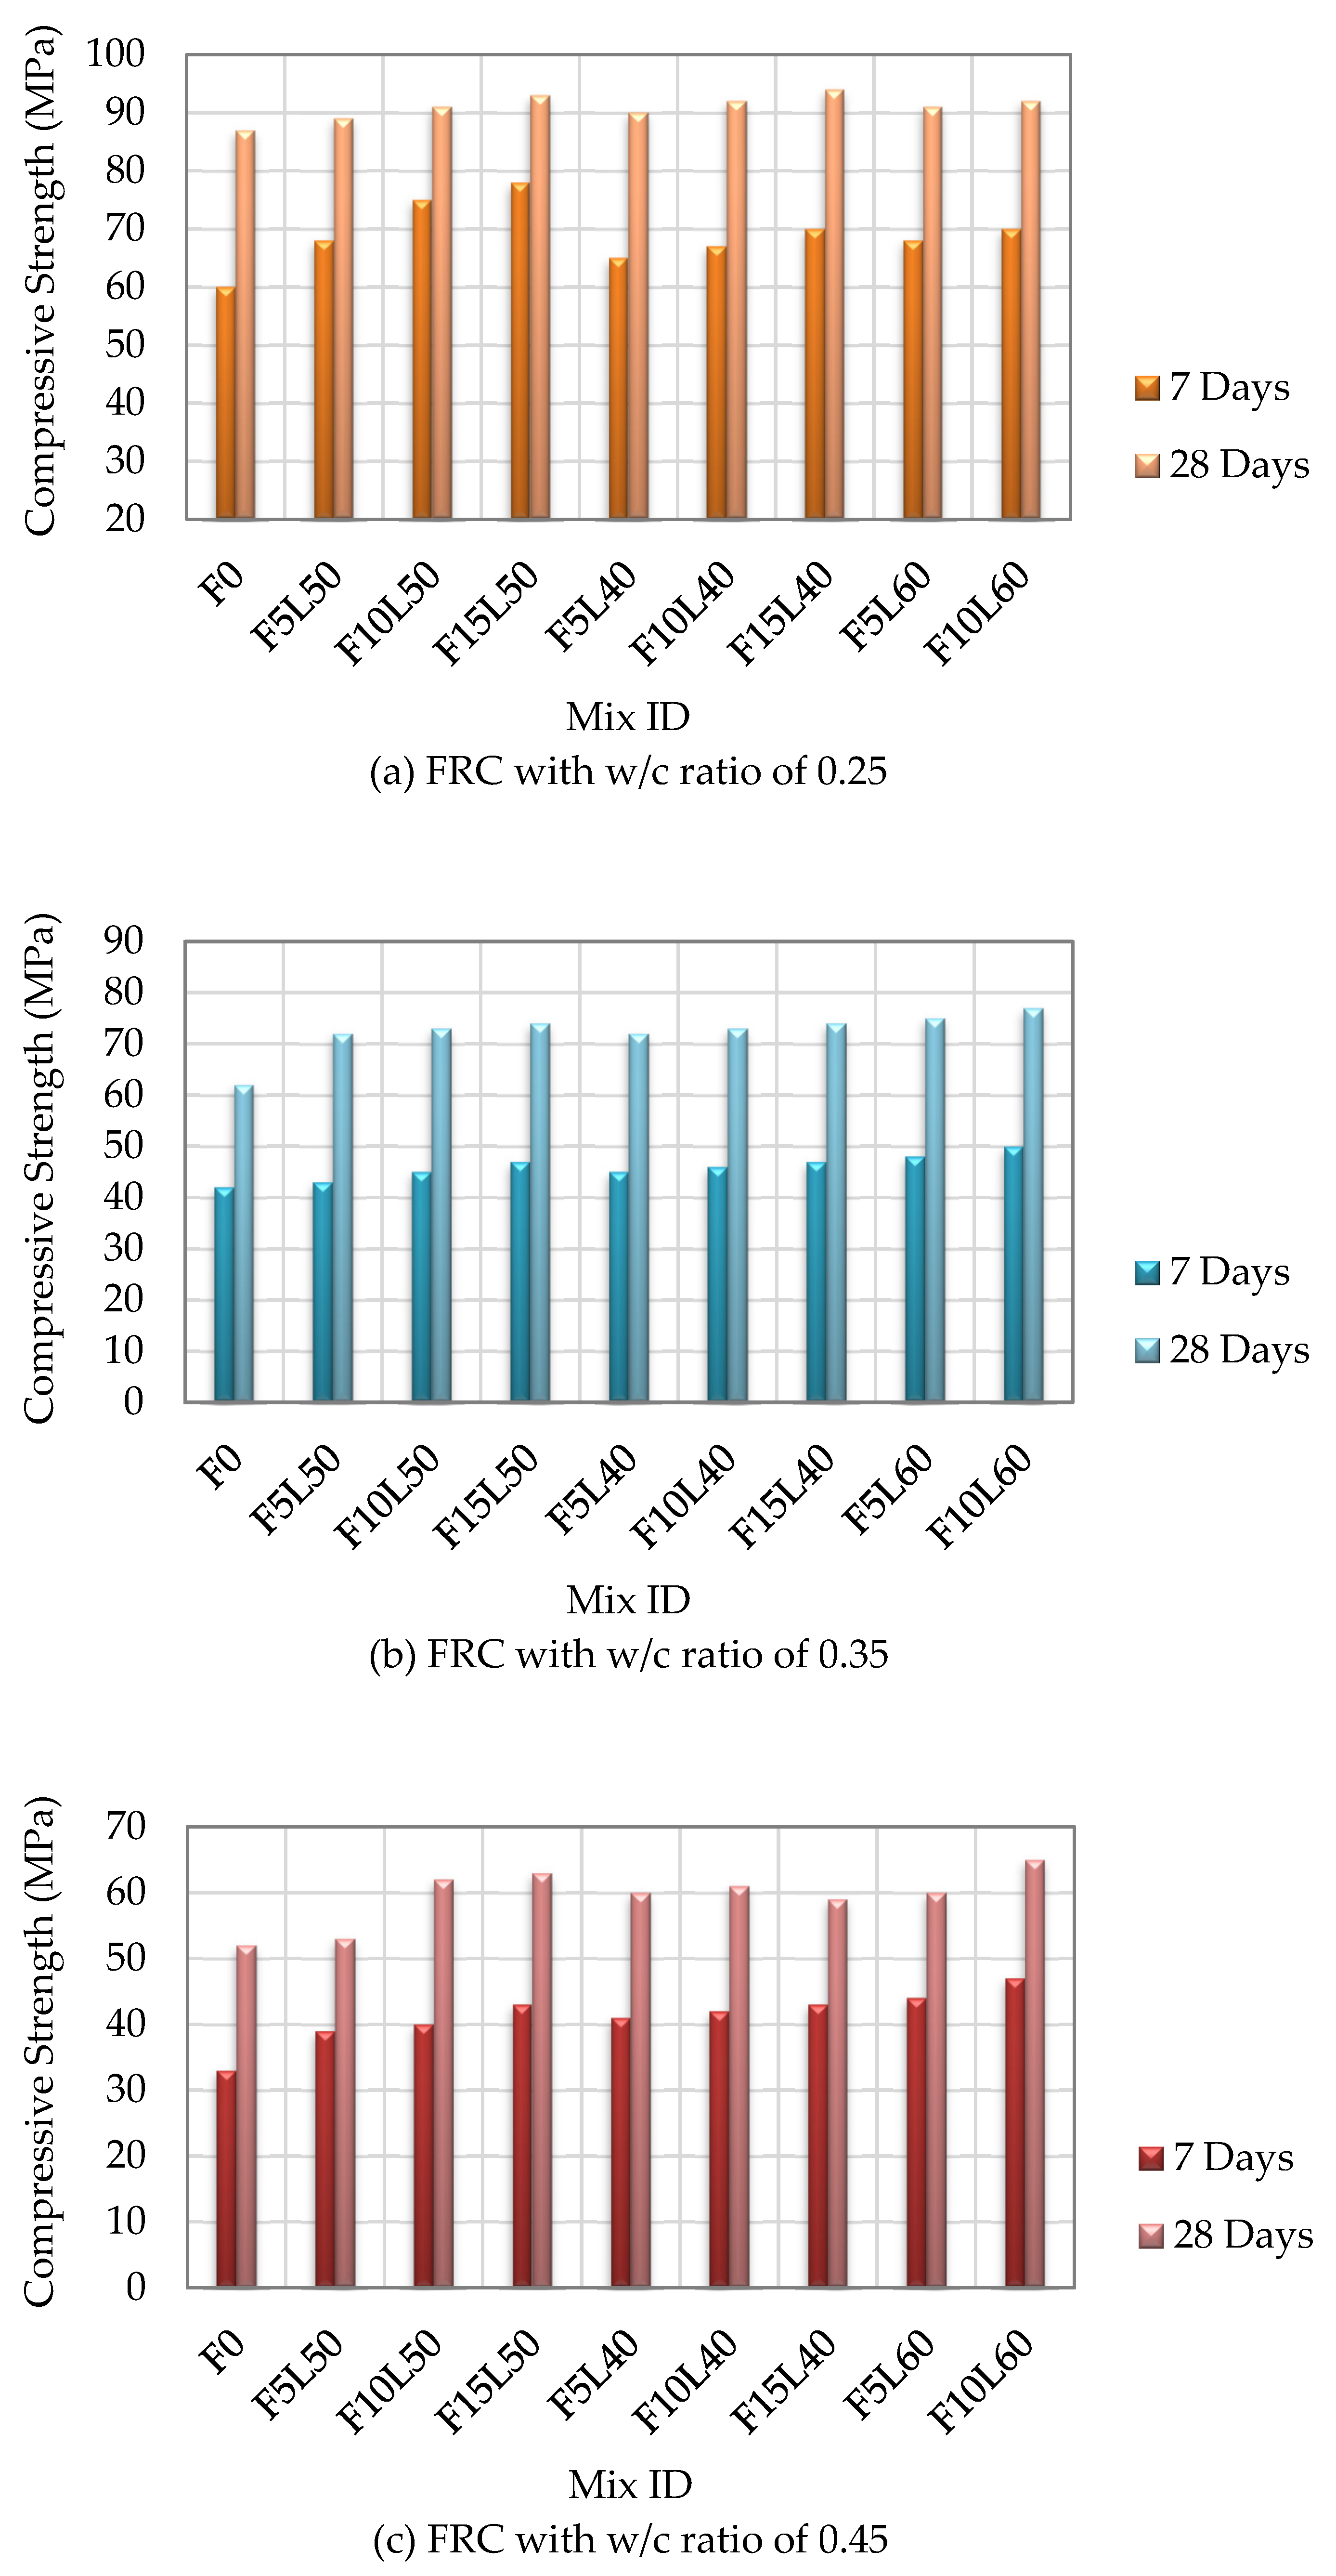
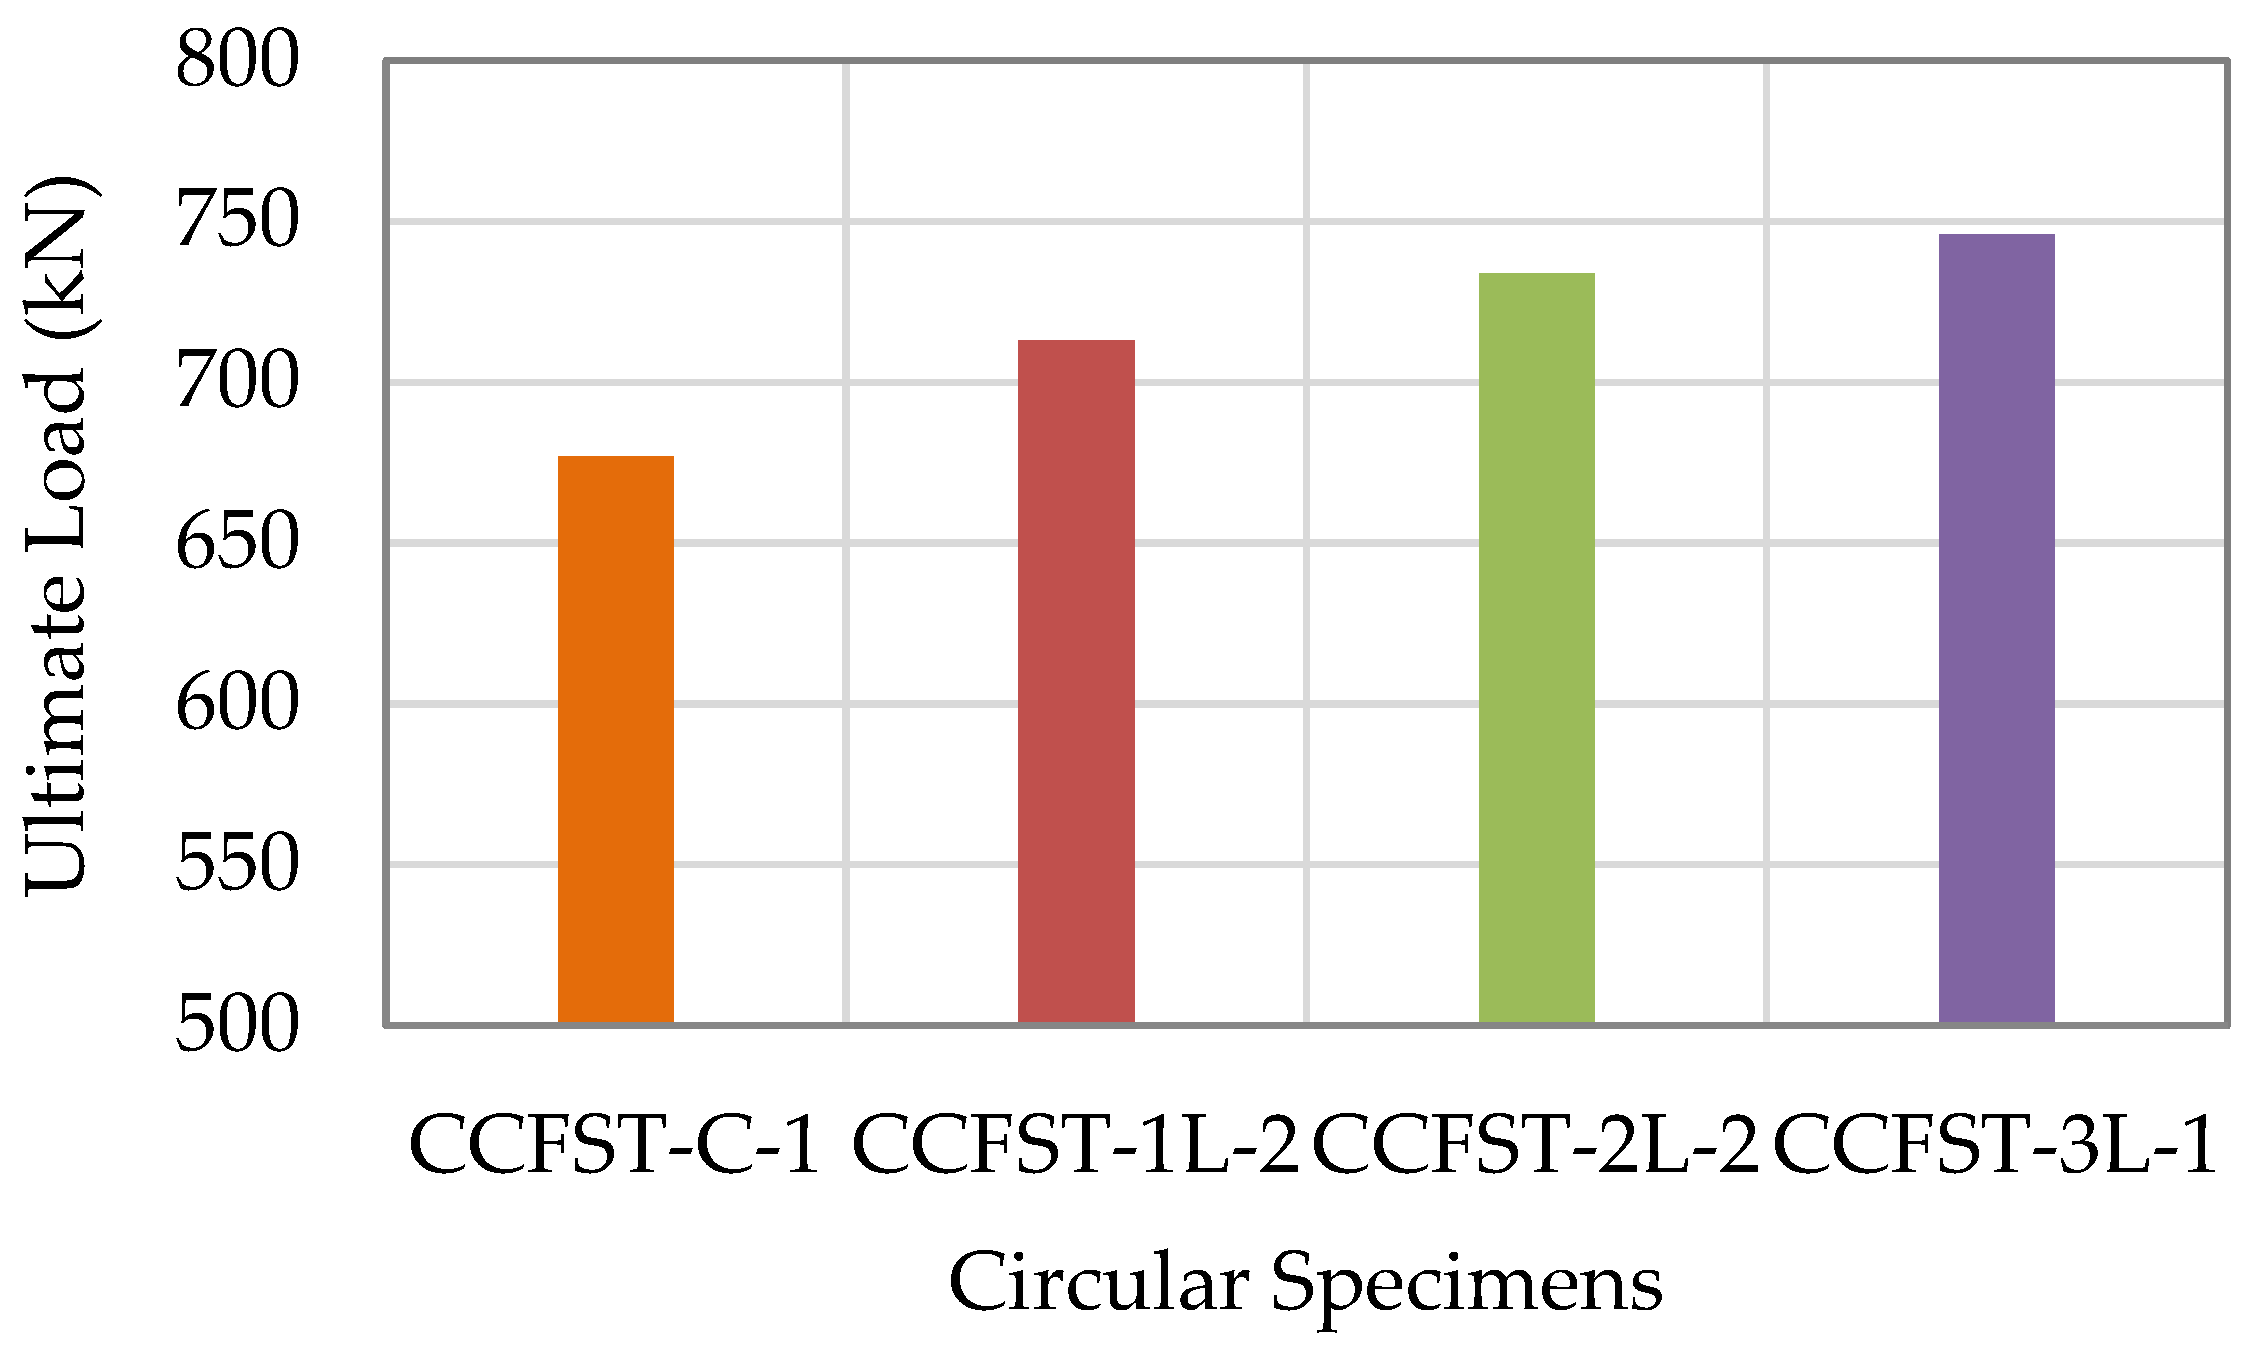