Article

Innovative Seismic Strengthening Techniques to Be Used in RC Beams’ Critical Zones

1
CERIS, Civil Engineering Department, Lisbon Superior Engineering Institute, Polytechnic Institute of Lisbon, ISEL/IPL, 1959-007 Lisbon, Portugal
2
CERIS, Civil Engineering Department, NOVA School of Science and Technology FCT NOVA, 2829-516 Caparica, Portugal
*
Author to whom correspondence should be addressed.
Buildings 2023, 13(1), 95; https://doi.org/10.3390/buildings13010095
Submission received: 8 October 2022 / Revised: 24 November 2022 / Accepted: 24 December 2022 / Published: 30 December 2022
(This article belongs to the Special Issue Emerging Challenges for Building Materials and Systems)

Abstract

:
The seismic performance of a structural frame system can be enhanced by strengthening the RC beams’ critical zones. In this paper is presented an experimental study on the improvement of the beam behaviour, subjected to an alternative cyclic procedure which considers the gravity loads reflecting the real demands on the beams’ critical zone. Two strengthening solutions are presented: unbounded post-tension (PT) tendon strengthening to increase resistance and limit residual deformations, and unbounded post-tensioning with jacketing of the RC beam with unidirectional fibre mat reinforced grout (UFRG) to limit compression damage, improving section confinement, thus delaying concrete crushing and buckling of longitudinal reinforcement. The original UFRG material was developed within this study, to apply as a small thickness jacketing material for strengthening RC structures. The main idea was that the steadiness provided by preplacing continuous fibre mats into the mould reduced the fibres’ segregation tendency during the high-performance grout pouring and allowed for the optimisation of their percentage and alignment, attaining a higher tensile strength. The experimental response of the tested Specimens is presented and evaluated through performance parameters that are properly discussed and adjusted to the alternative cyclic procedure. Finally, theoretical predictions are presented, and an adjustable multilinear model is proposed to estimate the strengthening solution’s response.

1. Introduction

Inadequate structural seismic performance can be associated with design, execution, or exploration errors, but also with new usage demands.
The structural capacity to accommodate earthquake demands can be assessed in terms of the level of energy, displacement, or damage sustained.
The intervention to improve the seismic structural behaviour can be attained by decreasing the earthquake demand on the structural element (1) or increasing its energy dissipation capacity (2). The first approach involves a stiffness or strength modification of the structure, aiming at an alteration of the global structural. The second purpose is to enhance the elements’ deformation capacity through local strengthening techniques, such as steel or reinforced concrete jacketing, externally bonded steel plates, fibre reinforced polymer composites (FRP), etc. In some cases, structure retrofitting can include both approaches (fib Bulletin nº.24, 2003 [1]). Eurocode 8—Part 3 (2005) [2] recommends several local or global interventions.

2. Significant Research Studies

The main purpose of this study was to improve the seismic behaviour of frame systems through a local improvement of the elements’ hysteretic behaviour. In frame systems, the energy is mostly dissipated in the critical zones in the elements’ ends (CEB BI nº. 220, 1994 [3]). Thus, assuming a strong-column–weak-beam seismic principle (Eurocode 8—Part 1, 2004 [4]), the study remains focused on the beam’s critical zone strengthening.
Typically, structural seismic behaviour improvement is attained through vertical element (columns and shear walls) modifications [1]. Experience from past earthquakes shows that considerable local damage in vertical elements can induce inadequate global seismic behaviours. For instance, the inappropriate concentration of plastic hinges in vertical elements can cause a soft storey failure mechanism. Additionally, due to the presence of the slab, beam strengthening is more difficult to execute than a column one. Thus, in this field, the scientific research has been focused on the improvement of the hysteretic behaviour of the vertical elements.
However, enhancing the seismic structural behaviour can also involve strengthening the beam’s critical zone. In the few existing research works on this topic, several deficiencies are mentioned that are associated with the inadequate seismic design of RC beams, such as the lack of bottom steel bar continuity through the joints (common in beams designed for gravity loads) and the reduced compression capacity of the beam. Another problem concerns the steel bars within the effective flange width near the joints, which provides additional strength to the beams. In a weak beam-strong column approach, this additional resistance can lead to the formation of plastic hinges in the columns, inducing an expected soft-storey mechanism (Bracci [5]; Et-Attar [6] and Calvi [7]).
The present experimental research aims to suppress the absence of research work on the beams’ plastic hinge behaviour in the presence of gravity loads, and to study the improvement of the beam behaviour under seismic actions.
Thus, the experimental campaign is focused on the plastic behaviour of the beam, leaving out the influence of factors such as the beam-column joint and the column behaviour. The need to upgrade the beam critical zone may occur in DC Medium design frame structures (according to EC8 [2]), structures with sufficiently thick columns, and existing structures in which the columns have already been subject to a strengthening intervention.
The reference specimen is a reinforced concrete T-beam (as detailed in Section 3.1). The Specimens were subjected to quasi-static cyclic tests. As already mentioned, the existing research work is mainly focused on the behaviour of the beams’ plastic hinges. The conventional quasi-static cyclic test procedure consists of the imposition of a reverse cyclic displacement history, in which the failure criteria are pre-established ECCS [8], ACI [9], and ATC 24 [10]. In the present work, an alternative RC cyclic test procedure was used (Gião et al., 2014 [11]), which simulates the beams’ critical zone demands. This test protocol involves a reverse cyclic displacement history starting from the gravity load effects, resulting in an asymmetrical loading history. Failure is attained when the beam is not able to resist the gravity load or when the beam rotation reaches specified limits.
With the purpose of improving the seismic structural behaviour, some innovative approaches, solutions, and concepts should be mentioned. For instance, PRESSS—Precast Seismic Structural Systems—which, in the precast industry, involved one of the first damage limitation approaches to attain high seismic performance structural systems by, for example, using post-tensioning technique to reduce the residual displacements (Priestley [12,13,14]; Conley [15]; Nakaki [16]).
Another interesting concept is the selective technique approach used in order to improve the overall structural behaviour through strategic strength, stiffness or ductility modifications in the structural elements. Pinho and Elnashai (1998) [17] presented an experimental work on the seismic improvement of RC walls. Pampanin (2006) [18] presented the alternative concept for a seismic retrofit strategy—a selective weakening approach—aimed at earthquake demand reduction and the prevention of an undesirable seismic response through weakening strategically. Ireland et al. (2006) [19] presented another experimental study to eliminate undesirable shear mechanisms in structural walls, proposing a vertical cut of the wall to lead to the development of a ductile failure mechanism. Pampanin (2005) [20] suggests the use of recently developed technologies in building systems, such as rocking behaviour and self-centering to correct the global structural behaviour. Kam et al. (2010) [21] present a research study proposing this type of approach to attain a ductile failure mode and prevent failure associated with non-ductile RC beam-column joints. In the paper, a separation at the interface beam/column followed by the eventual introduction of post-tensioning is suggested.
Several authors observed the deficiencies of the ductile frames, comparing these structures with the ones designed according to the Damage Avoidance principle, highlighting the crucial importance of the reduction of residual deformations, the remaining stiffness, repair cost, and building downtime (Kam et al., 2011 [22,23] and Leon et al., 2012 [24]).
Research works emphasise the significant improvements in the seismic behaviour of RC sub assemblages by increasing the compressive zone deformation capacity, such as the use in beam-column joints of HPFRC—High Performance Fibre Reinforced Concrete—Dogan [25]; Ficher [26]; Parra-Montesinos [27]; Shannag [28,29]; Konstantinos [30]; Chalioris [31,32]; Kalogeropoulos [33]; Bencardino [34]; Fares [35]. Muhaj (2020) [36] presented an experimental study of seismically reinforced concrete beams strengthened with post-tensioning with anchorages by bonding, which presented reduced residual deformation and anenhanced load capacity.

3. Experimental Program

The experimental campaign involved the analysis of a full-scale RC beam (Specimen S1). Two strengthening solutions were developed, applying a selective technique approach which consisted of strength and ductility modifications: first, unbounded post-tension tendons were used (Specimen S2); next, in addition to the post-tension system, a small thickness jacketing with an unidirectional fibre reinforced grout (UFRG), developed within this study, was added (Specimen S3) (see details in Gião et al. [37]). As mentioned above, the Specimens were submitted to an experimental cyclic test procedure with the gravity load effects.

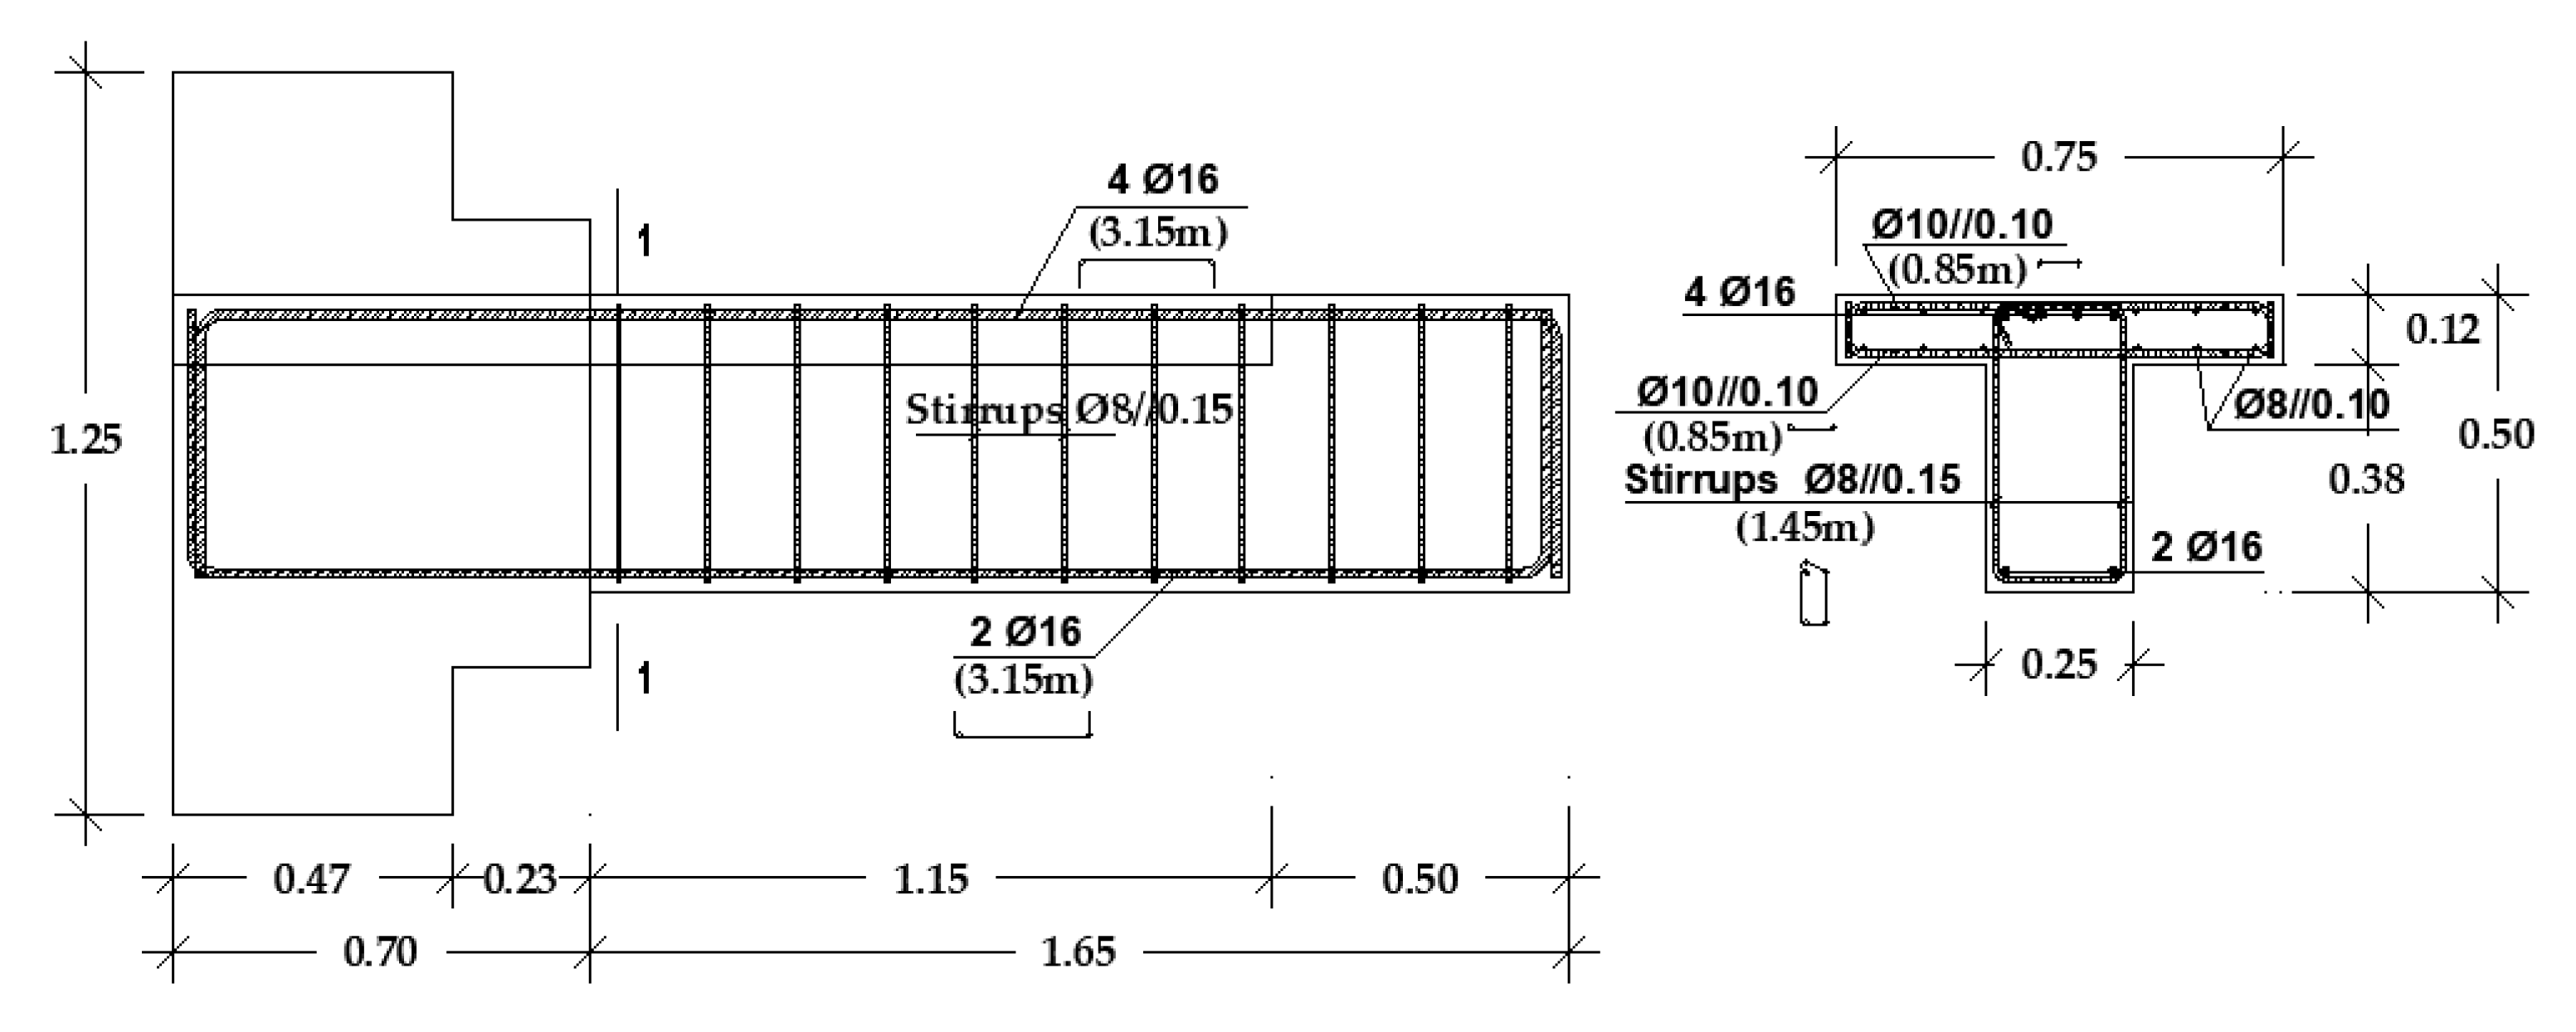
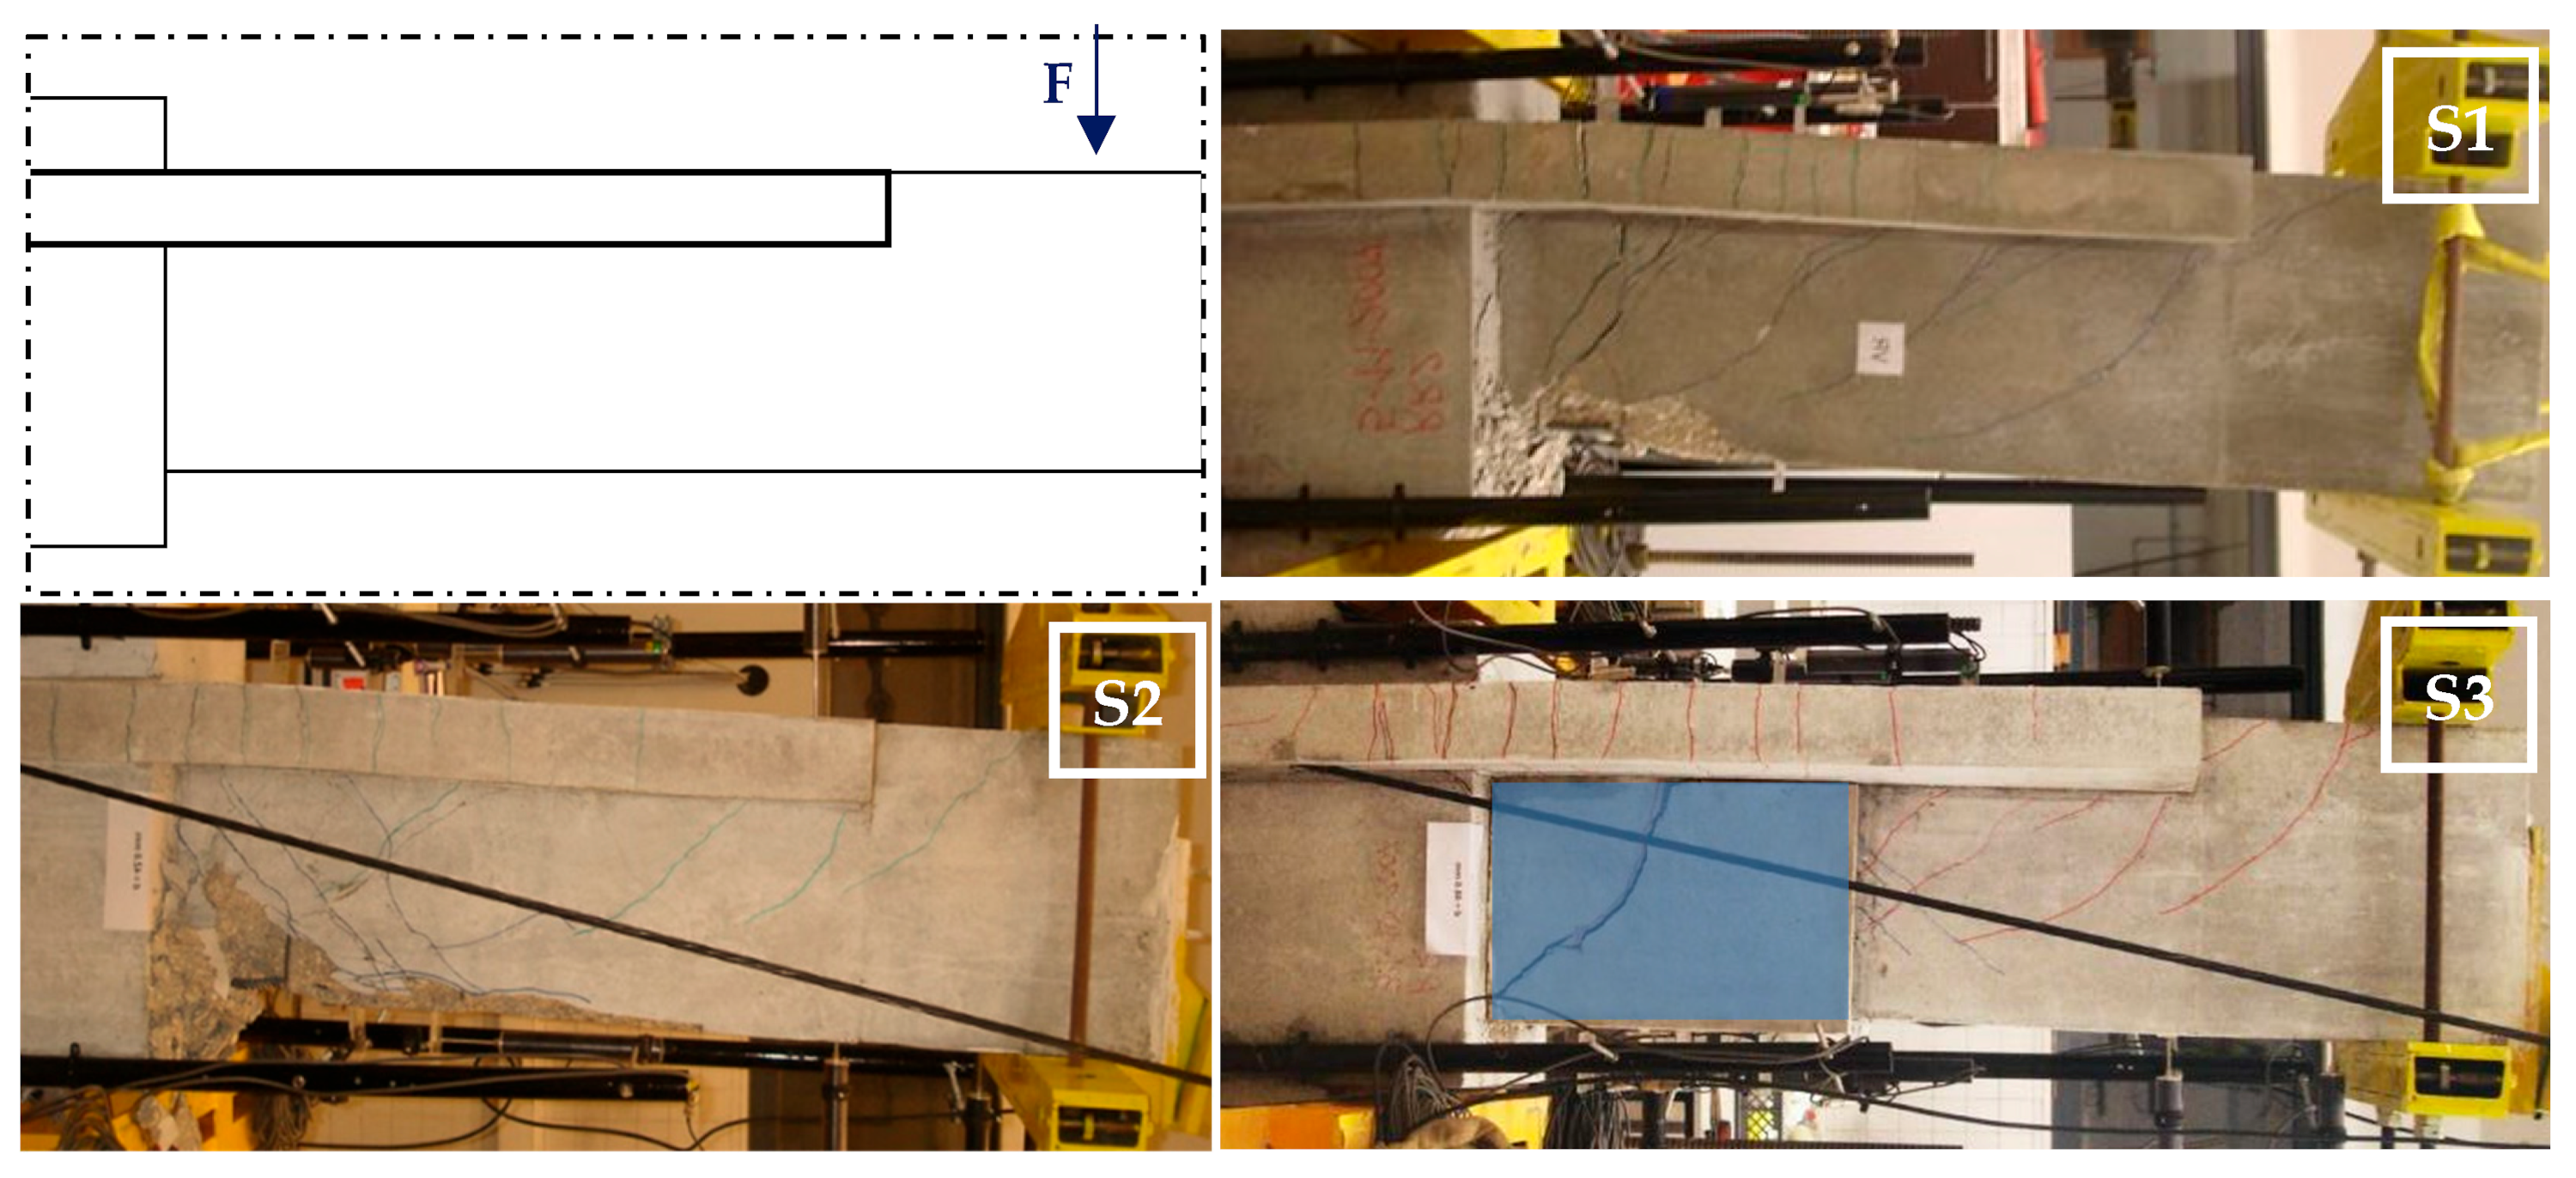
3.1. Specimens’ Description

Acknowledging a weak beam–strong column approach [4], critical zones were assumed in the beam. Thus, the experimental study was limited to the beam behaviour. The reinforced concrete benchmark specimen was an asymmetrical geometry and reinforcement T-beam with a 250 × 500 (mm) cross-section, designed to normal ductility level (Figure 1).
The compressive strengths were 44.80 MPa (Specimen S1), 41.70 MPa (Specimen S2), and 43.10 MPa (Specimen S3). The yield stress of the longitudinal reinforcing bars was 473 MPa.
The Specimens were cantilever T-beams, which reproduce approximately one third of the beam’s clear span. The column was simulated by a rigid concrete block. The T-beam reinforcement detailing is shown in Figure 1.

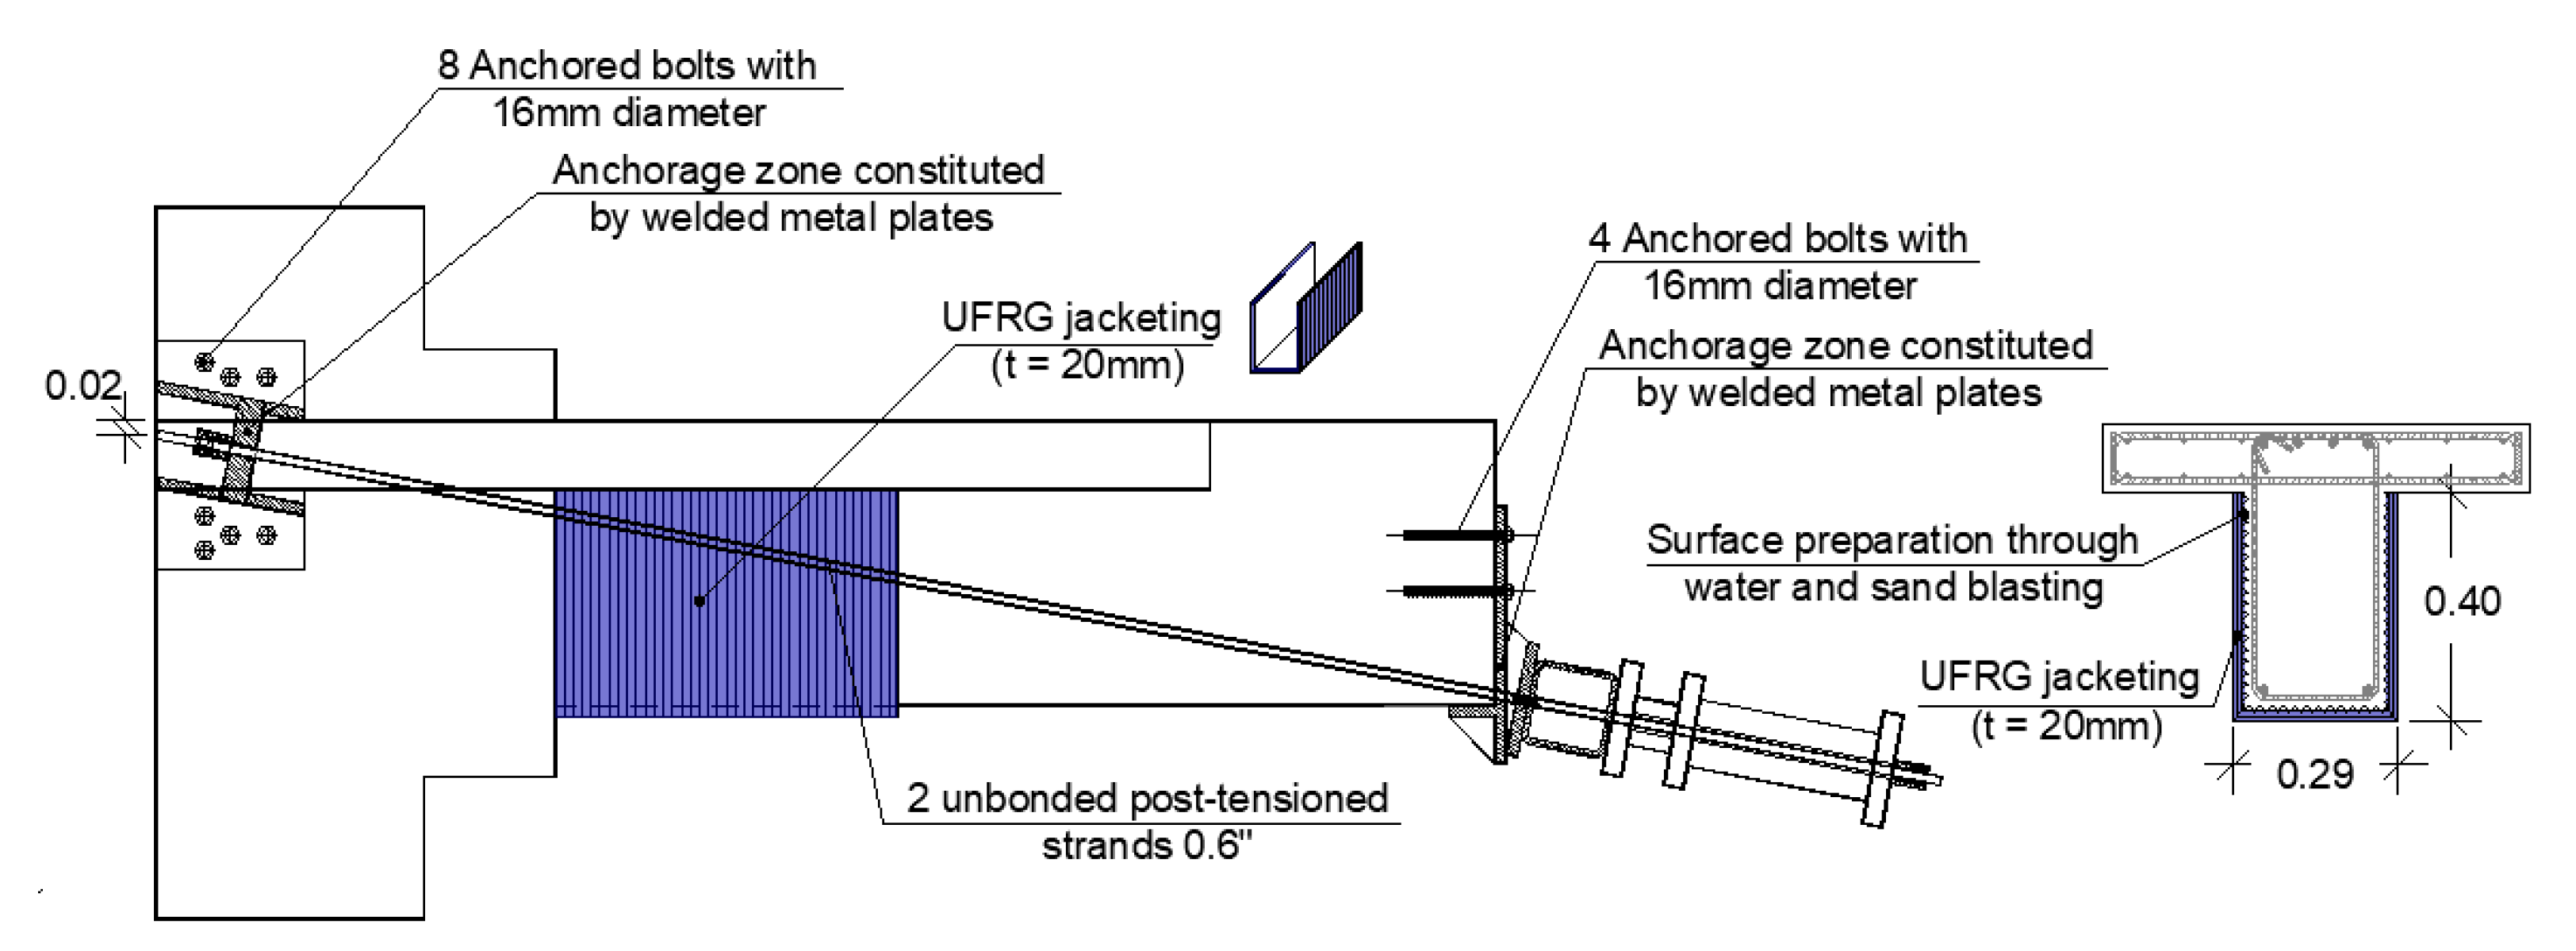
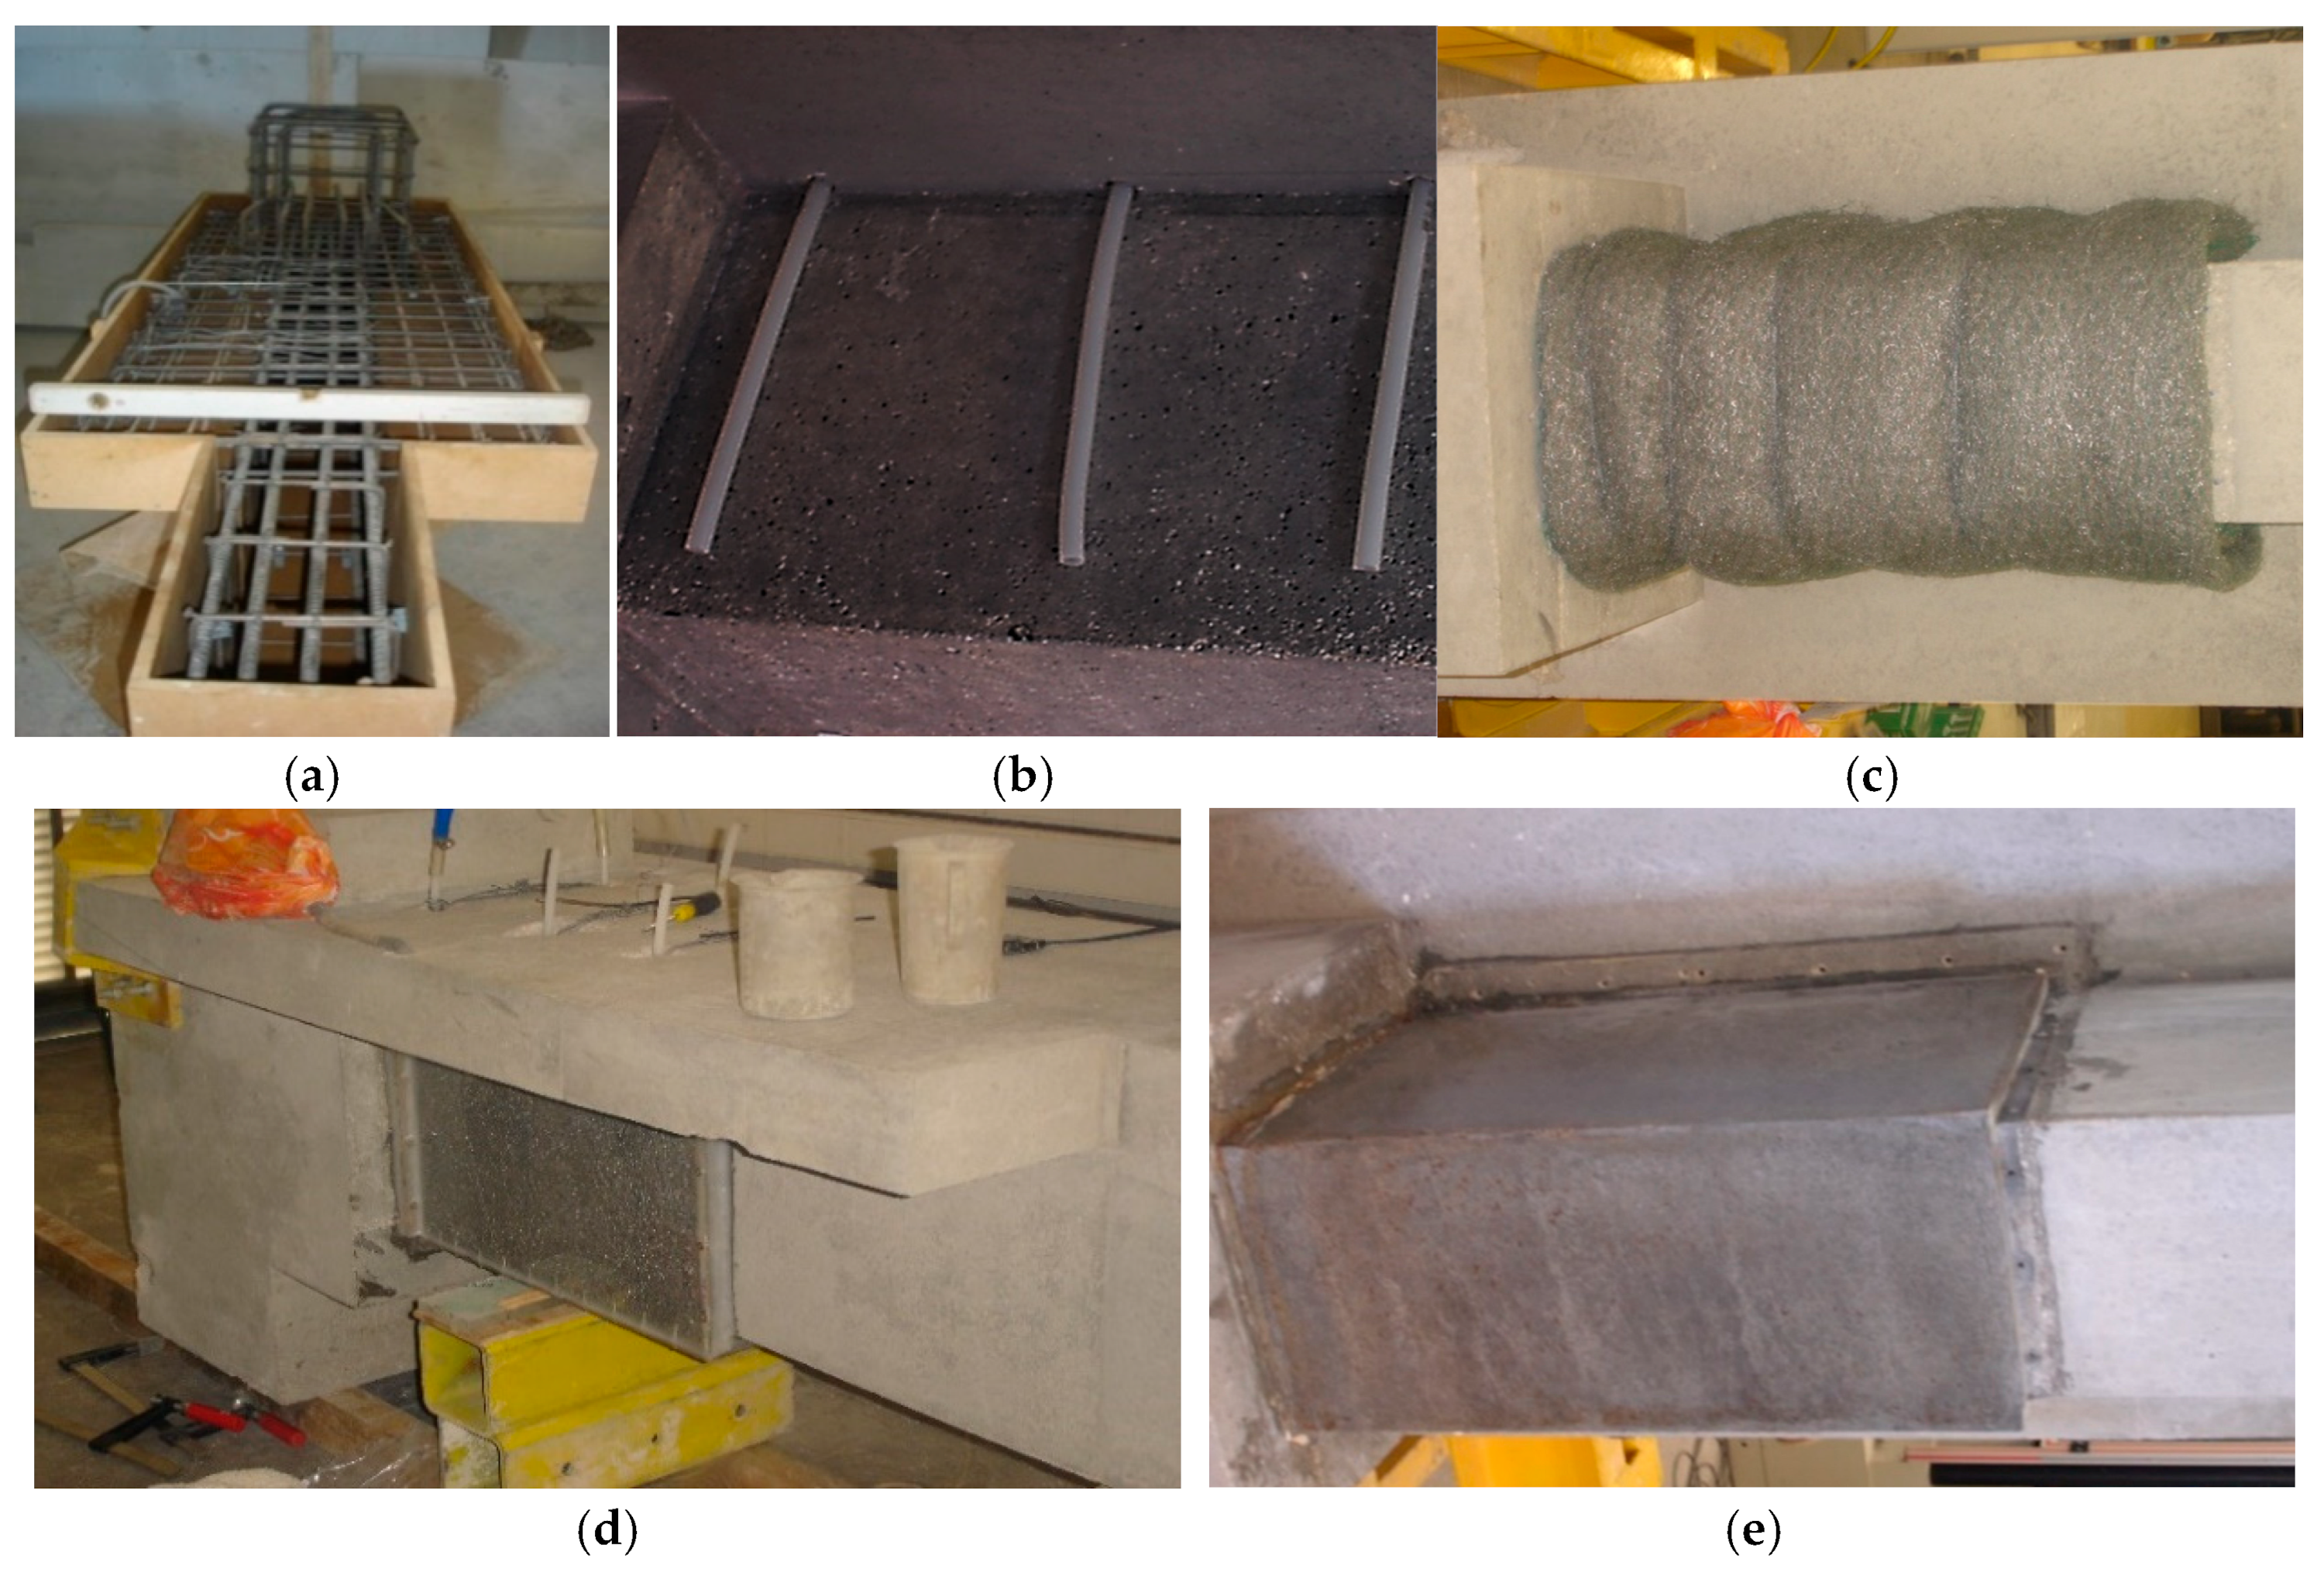
3.2. Strengthened Specimens’ Description
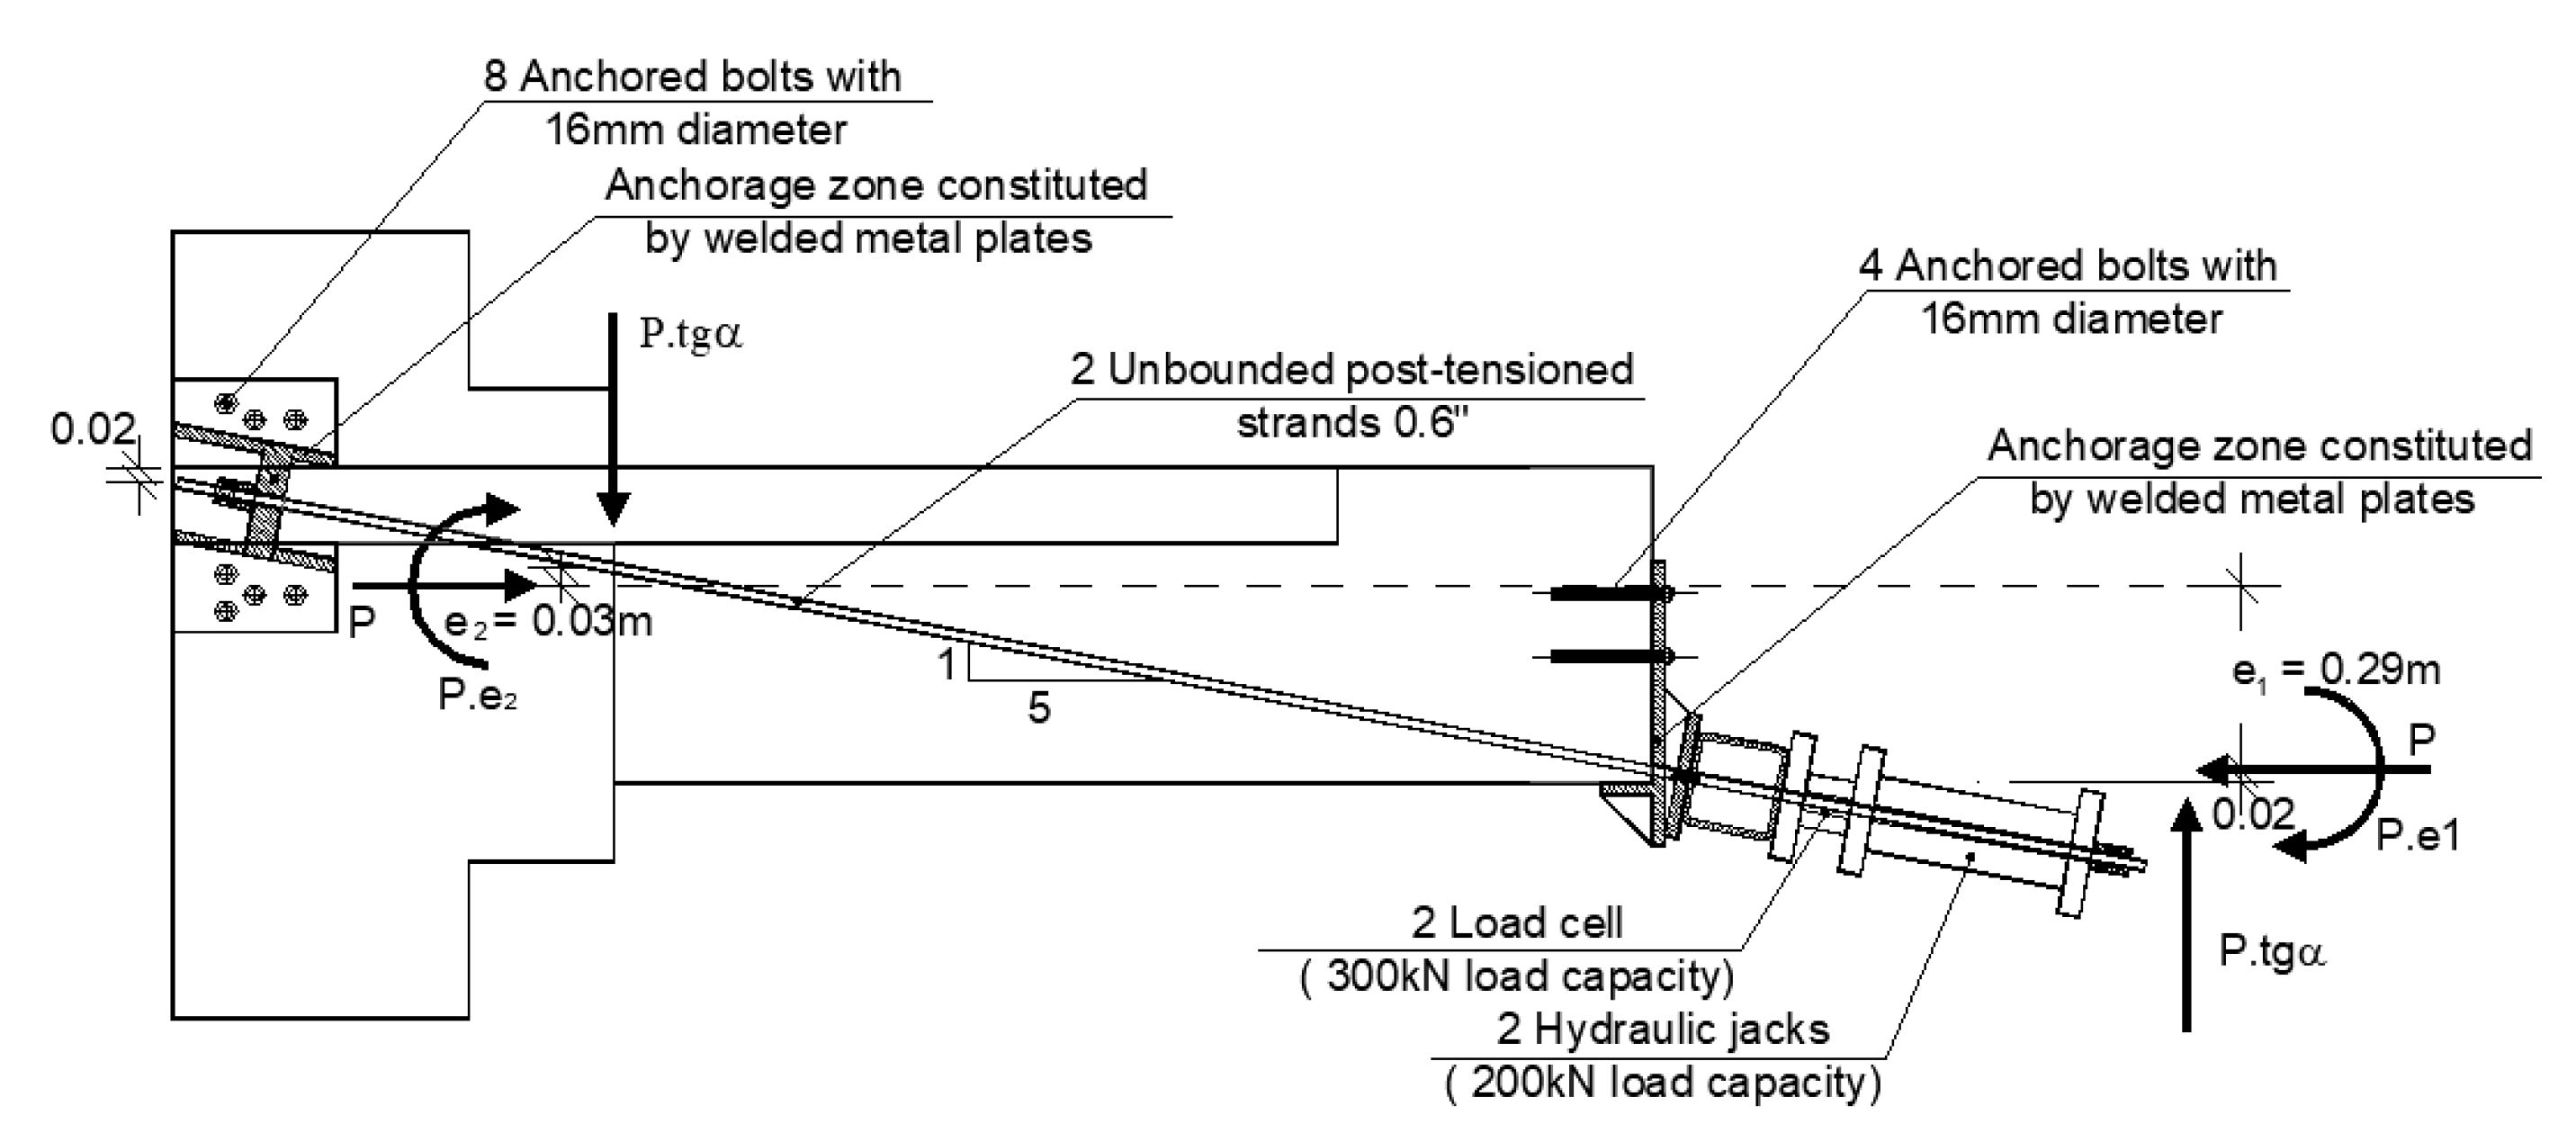
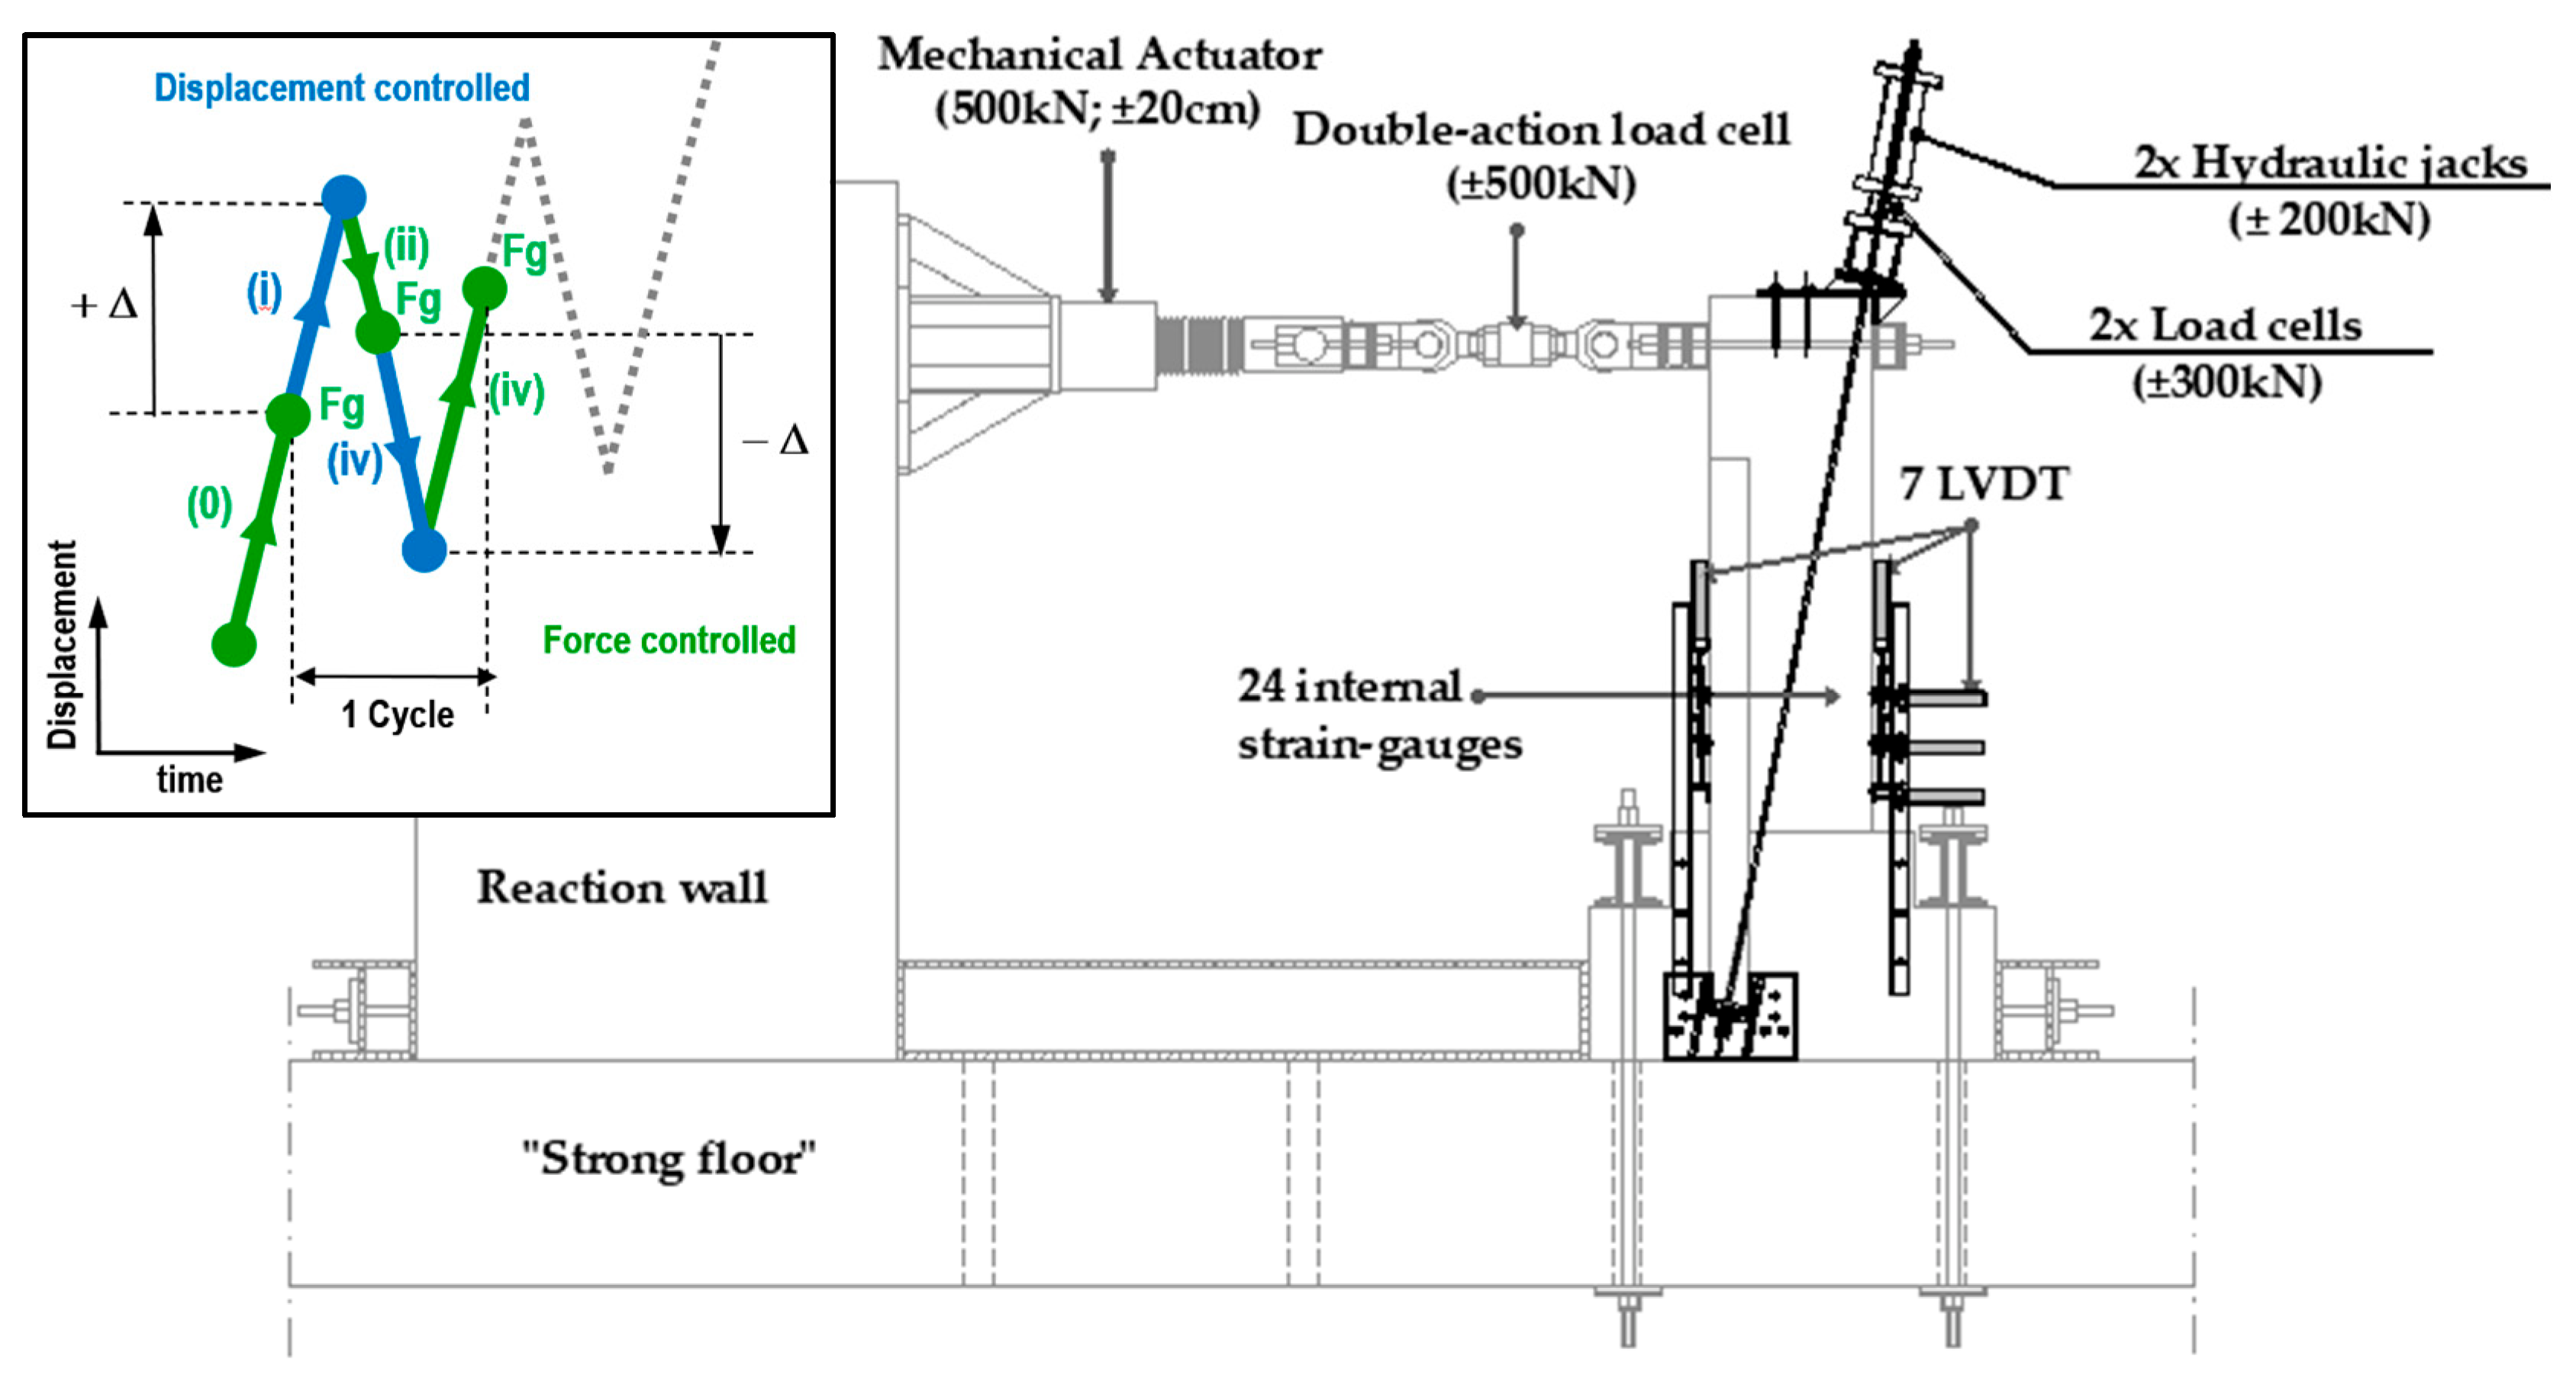
The first step was to decrease the residual deformations and enhance strength. For that purpose, two external post-tensioned (PT) strands were used to strengthen the specimen. The prestressing steel strands used were seven-wire 0.6-inch strands (with 15.2 mm nominal diameter) of grade Y 1860 S7, with a section area of 139 mm2. The prestressing steel mechanical characteristics are a modulus of elasticity (Ep) of 195 GPa, ultimate strength (fu) of 1860 MPa, and proof strength of 0.2% (fpk,0.2) of 1728 MPa.
The aim was to enhance strength capacity with the post-tensioning and dissipated energy provided by the ordinary reinforcement yielding. Assuming a 1:5 inclination of the strands and a small eccentricity at the intersection with the column (see Figure 2), the PT strand profile was designed to keep the post-tension steel in the elastic regime until it reaches a beam rotation of 3.5%. The initial prestressing value force per strand was set as 150 kN to remain elastic at the maximum beam rotation.
The post-tensioning system implementation involved the design of the anchorage zones next to the beam-column joint and in the span. The anchorage zones were conceived through a set of welded metal plates fixed to the concrete with anchored bolts, ensuring the strands’ position, application, and correct transfer of the post-tensioning force to the RC beam. Figure 2 shows Specimen S2—strengthening solution with unbounded post-tensioning system—along with the post-tensioning application system.
Next, in addition to the two unbounded post-tensioning strands, a 20 mm thick jacketing of UFRG with 3% fibre volume was used. The steel fibre mat used, provided by Favir, constituted a unidirectional continuous non-woven mat formed of steel filaments obtained through a lamination process from a 3.1 mm diameter steel wire (for more details, see Gião et al., 2017 [38]).
Detailing of the UFRG jacketing and unbounded strand post-tensioning system (Specimen S3) and post-tensioning application system are presented in Figure 3.
The jacketing solution aimed to provide confinement of the compressed beam section, consequently delaying concrete crushing and longitudinal reinforcement buckling.
The jacketing with a grout reinforced with a unidirectional and continuous steel fibre mat is more efficient than the current reinforced concrete solutions since it allows for higher strengths for smaller thickness jackets. The UFRG exhibited a 66.0 MPa compressive strength and 12.3 MPa tensile strength.
Figure 4 illustrates the construction of RC beams’ (Figure 4a) strengthening solution with a small thickness UFRG jacketing. The strengthening execution involved preparing the concrete surface with water and sandblasting (Figure 4b) to improve concrete and strengthen bonding. The cast was carried out against the concrete surface (Figure 4c), pouring the grout into the pre-placed fibres with exterior vibration (Figure 4d,e)).
A description of the tested beams is presented in Table 1.

3.3. Test Setup

The tests performed in Laboratory of Structures of the UNL. The test setup included a mechanical actuator with a load capacity of ±500 kN and a displacement range of 400 mm (±200 mm), a double action load cell (FIMEI CS-24), and 7 displacement transducers with limit of 100 mm (CDP100 TML)—Figure 5b). The data acquisition was carried out by four data loggers (HBM Spider8, each with 8-channel)—Figure 5b). The load was imposed by reacting against the vertical wall. Therefore, the experimental model was placed and tested in a vertical position.
In Specimens S2 and S3, the post-tensioning strands and the respective end anchorages were installed before the test. Then the post-tensioning force, 150 kN/strand, was applied gradually. The prestress force was applied using two Enerpac hydraulic jacks ENERPAC CDT 6343 with a load capacity of 200 kN. The load was imposed by a hydraulic jack and monotonised by two load cells of 300 kN. The experimental results were obtained with a data logger. Figure 2 and Figure 3 show the post-tensioning application system and the anchorage zones, while Figure 5b) shows the integrated test setup.

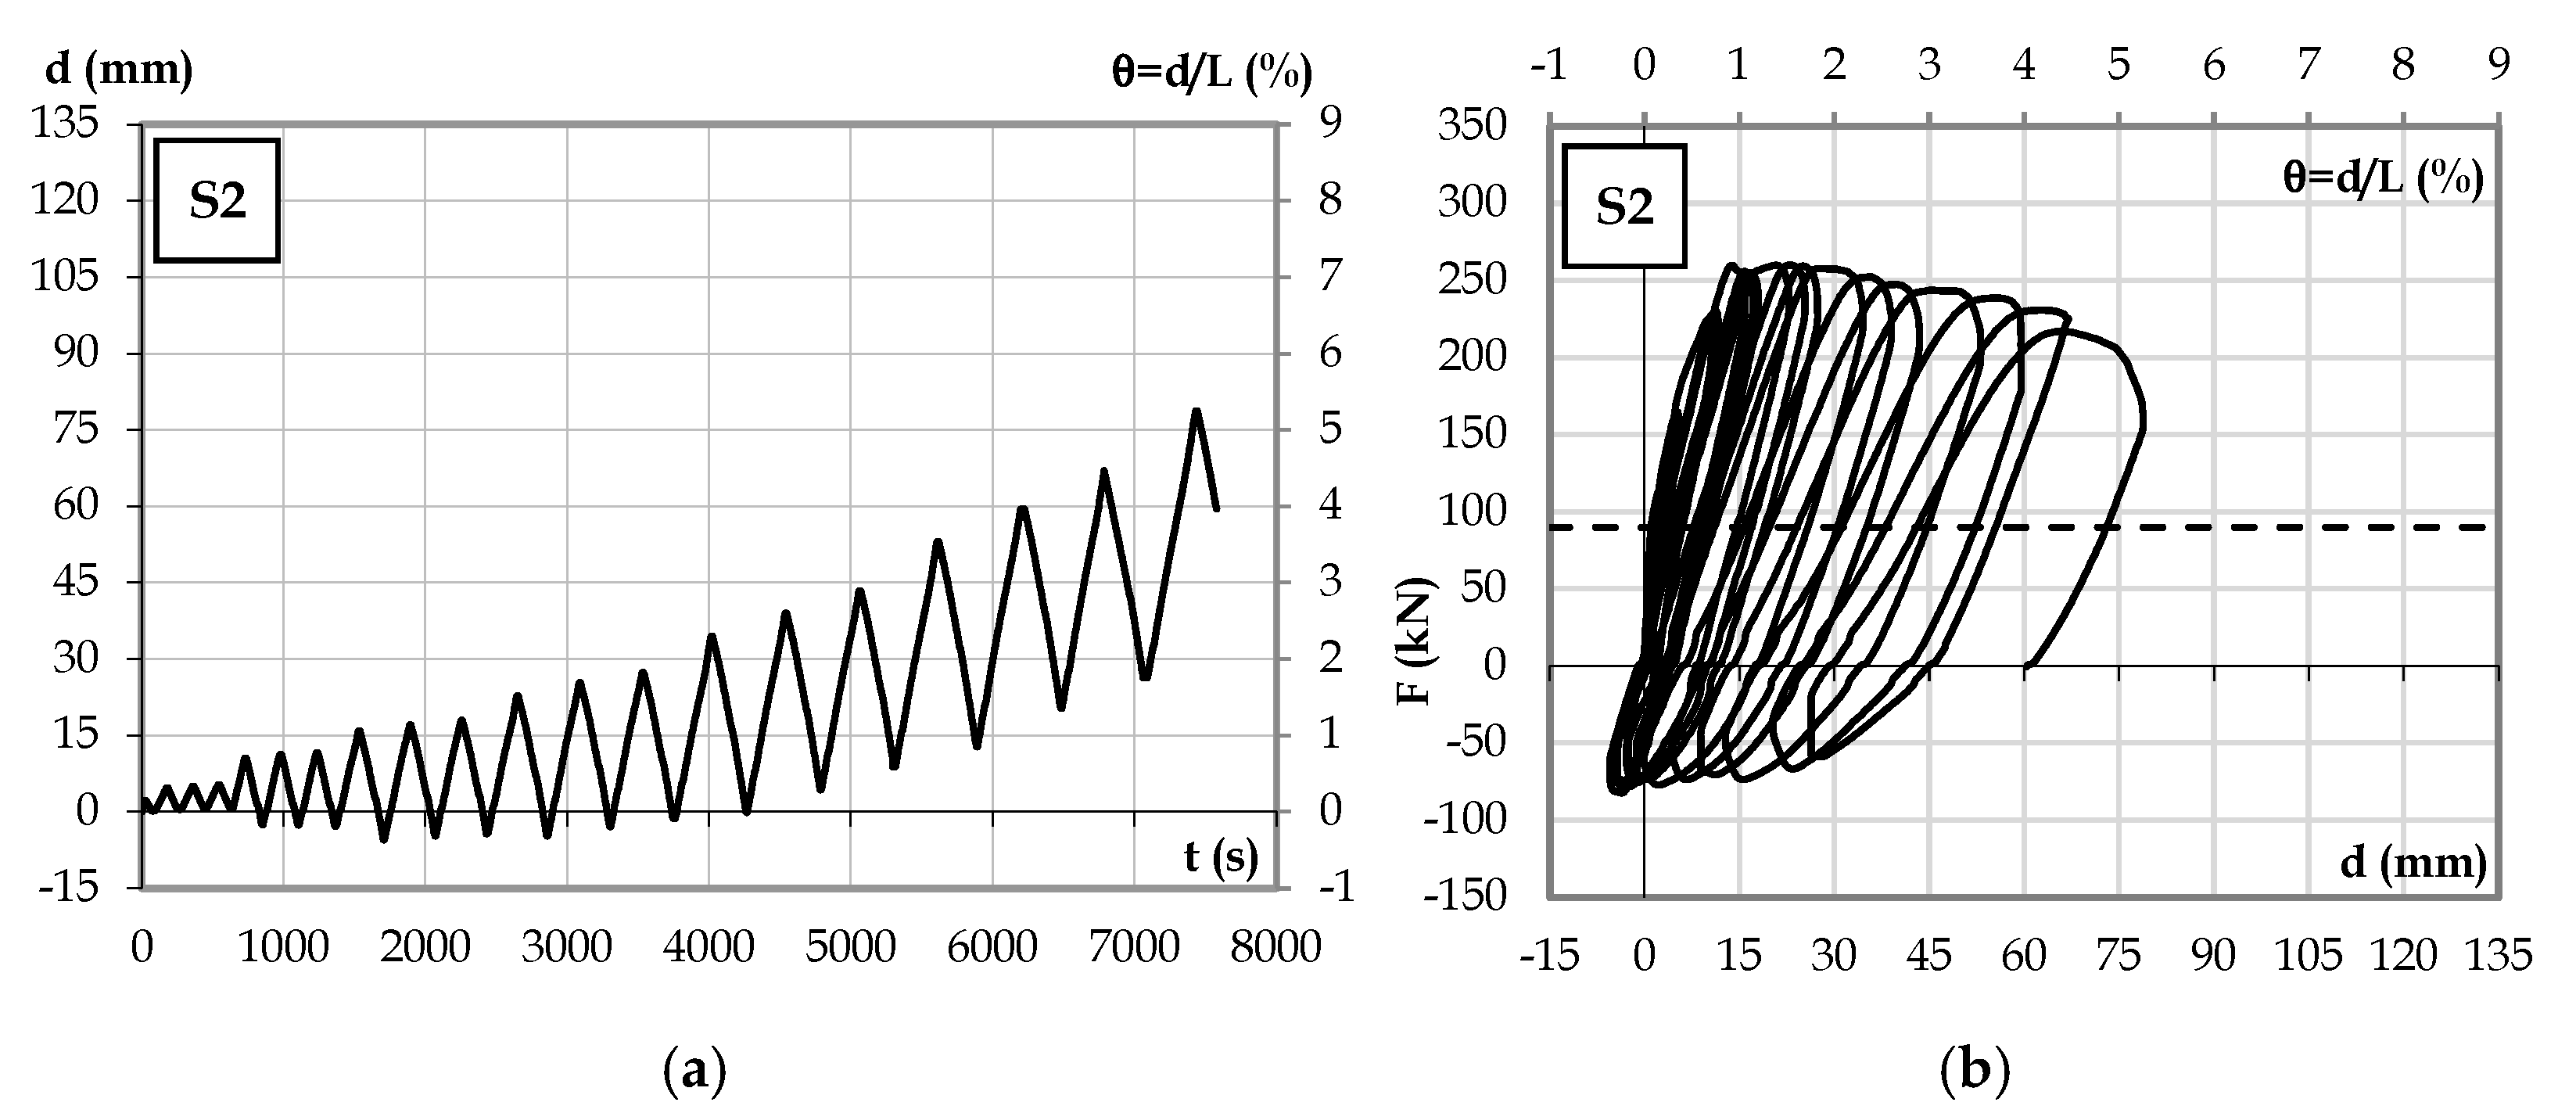
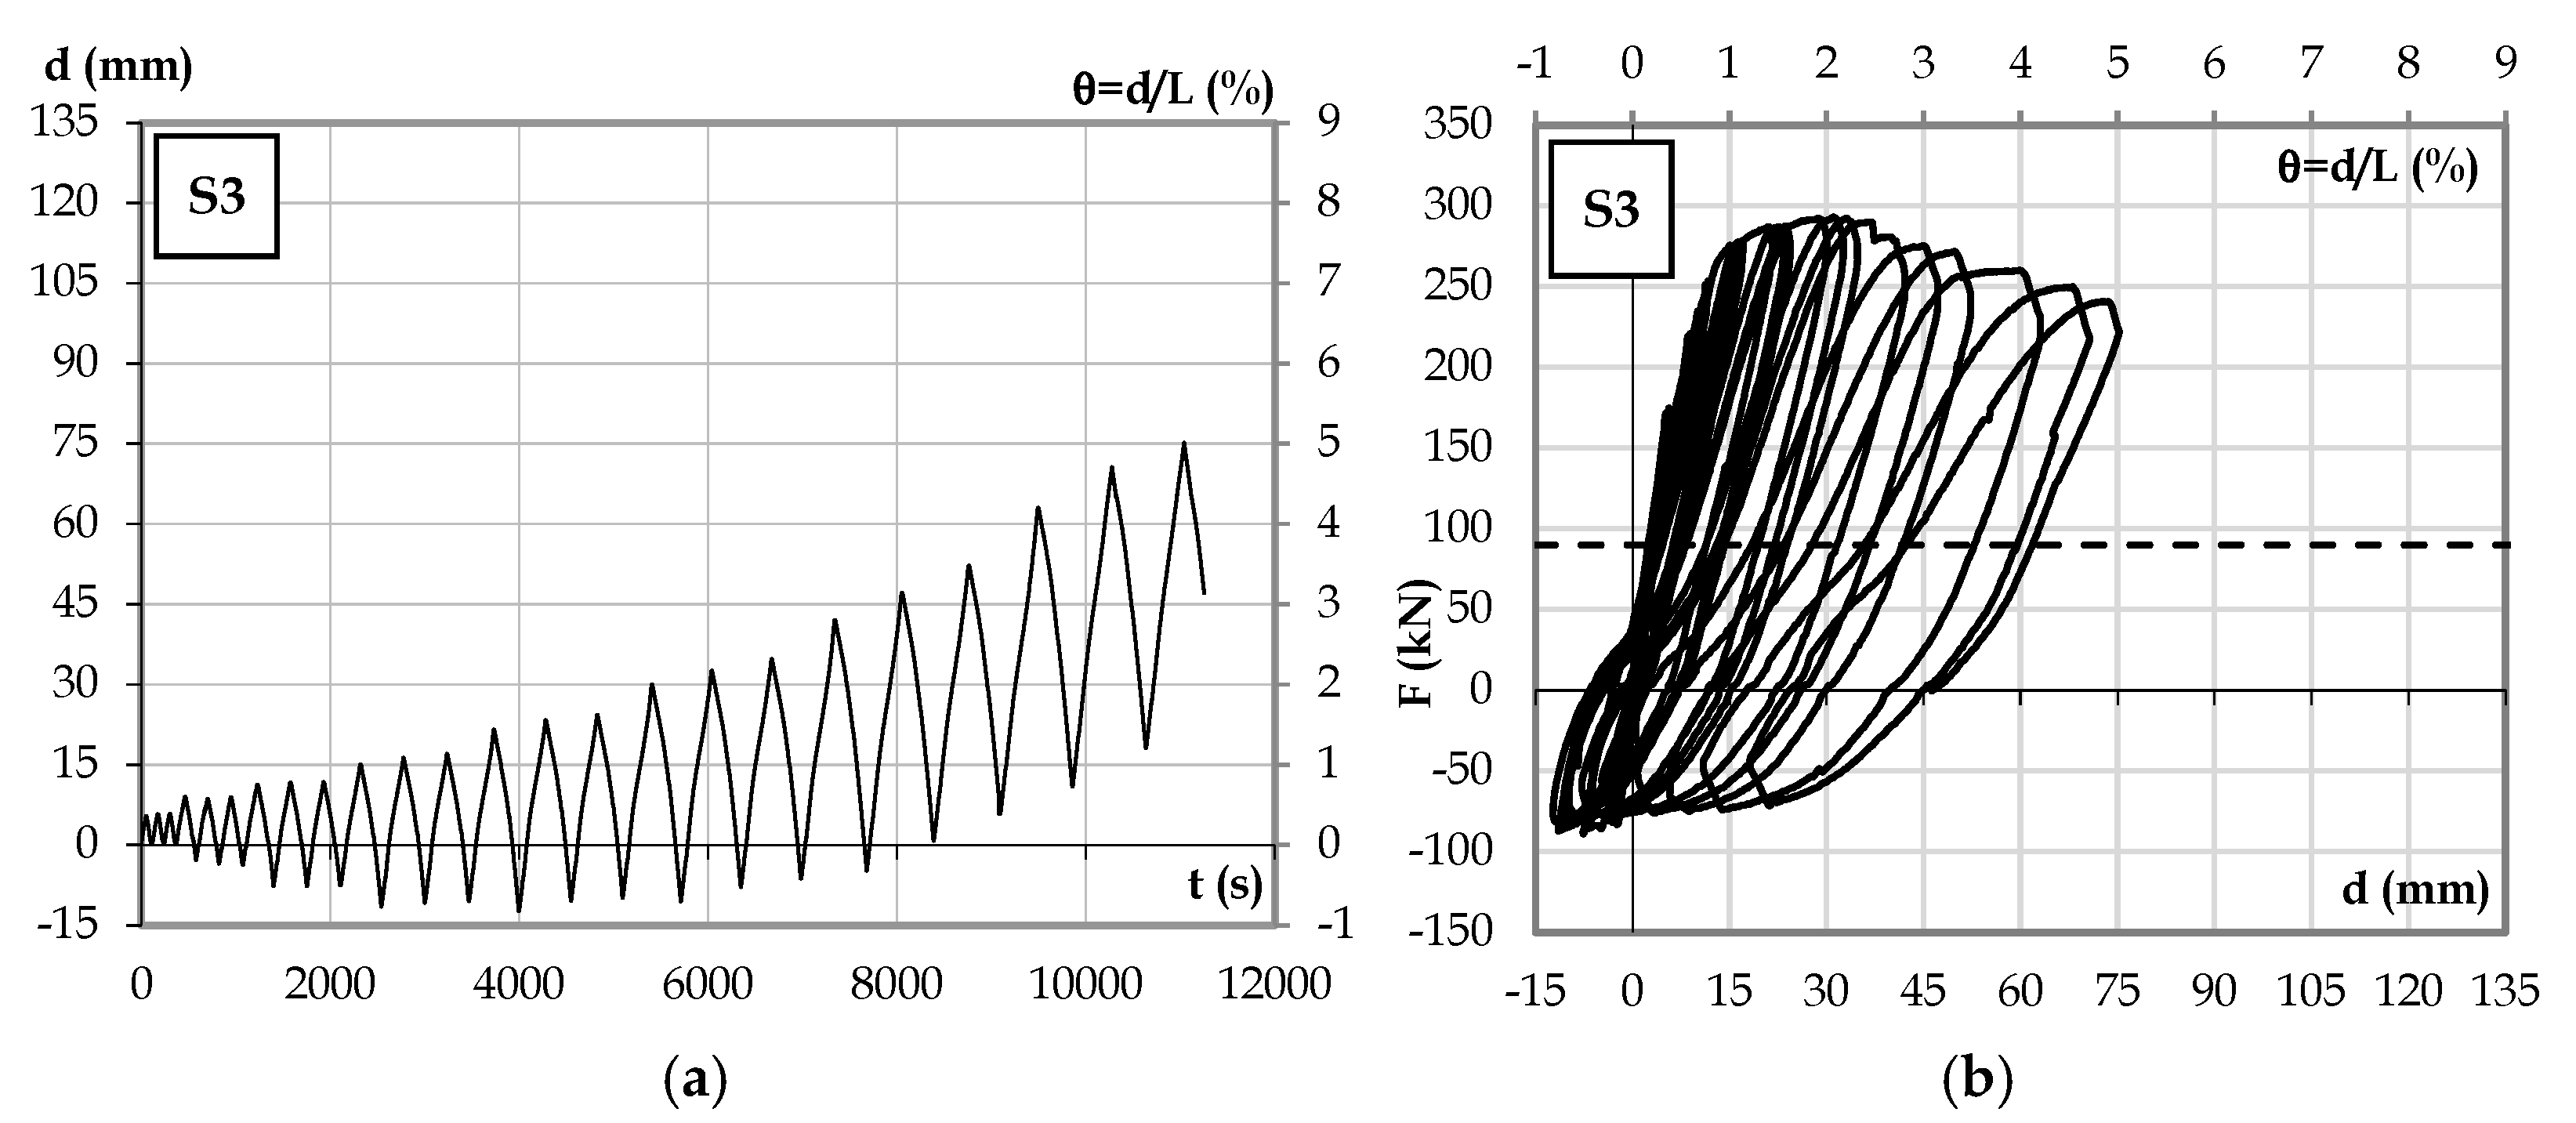
3.4. Displacement History
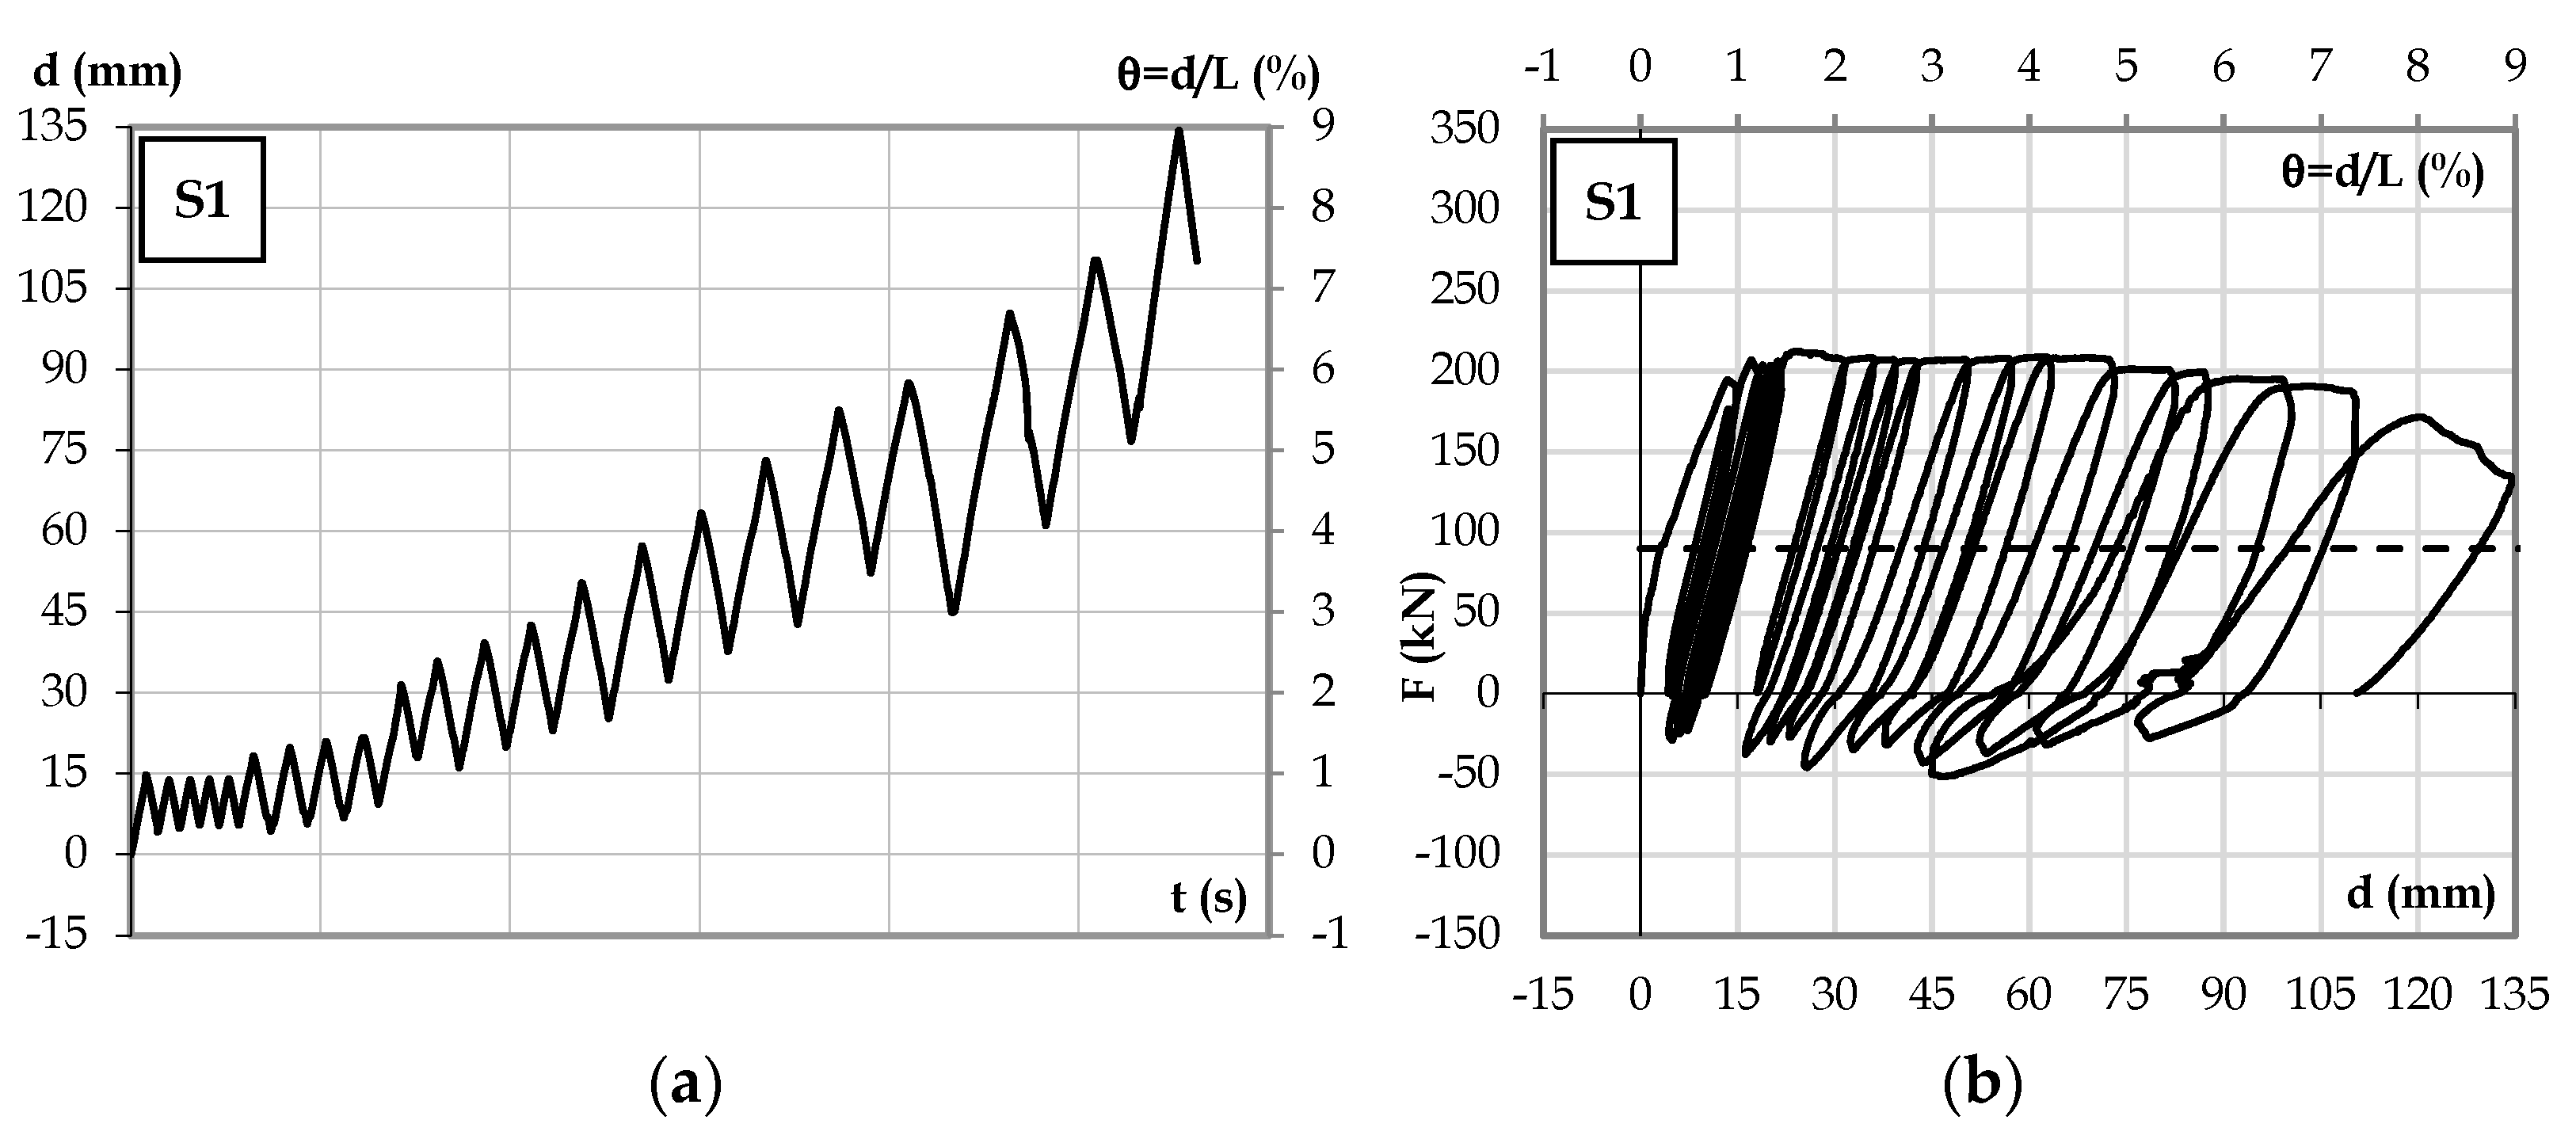
As mentioned above, the quasi-static test protocol included the gravity load, which was assumed as 50% of the force that induces yielding in the top reinforcement, wherein Fg = 90 kN.
The displacement history consisted of a reverse cyclic displacement history with an increasing amplitude of ±Δ = ±1xd0, ±2xd0, ±3xd0, ±4xd0, ±5xd0, ±6xd0, and ±7xd0 (where the base displacement, d0 = 6 mm), with 3 cycles for each amplitude, starting from the displacement where the gravity load is attained. Failure was established when the beam does not resist the imposed gravity load (for more details see Gião et al., 2014 [11]). Figure 5a) illustrates a typical displacement cycle in the test procedure, starting from the force-controlled step until the pre-established value of the idealised gravity load was attained (stage 0). This was followed by the imposition of a required displacement +Δ (Stage I), force-controlled unloading until the gravity load value is restored (Stage II), imposition of a displacement −Δ (Stage III), and, finally, force-controlled loading until the gravity load value is re-established (Stage IV).

4. Test Results

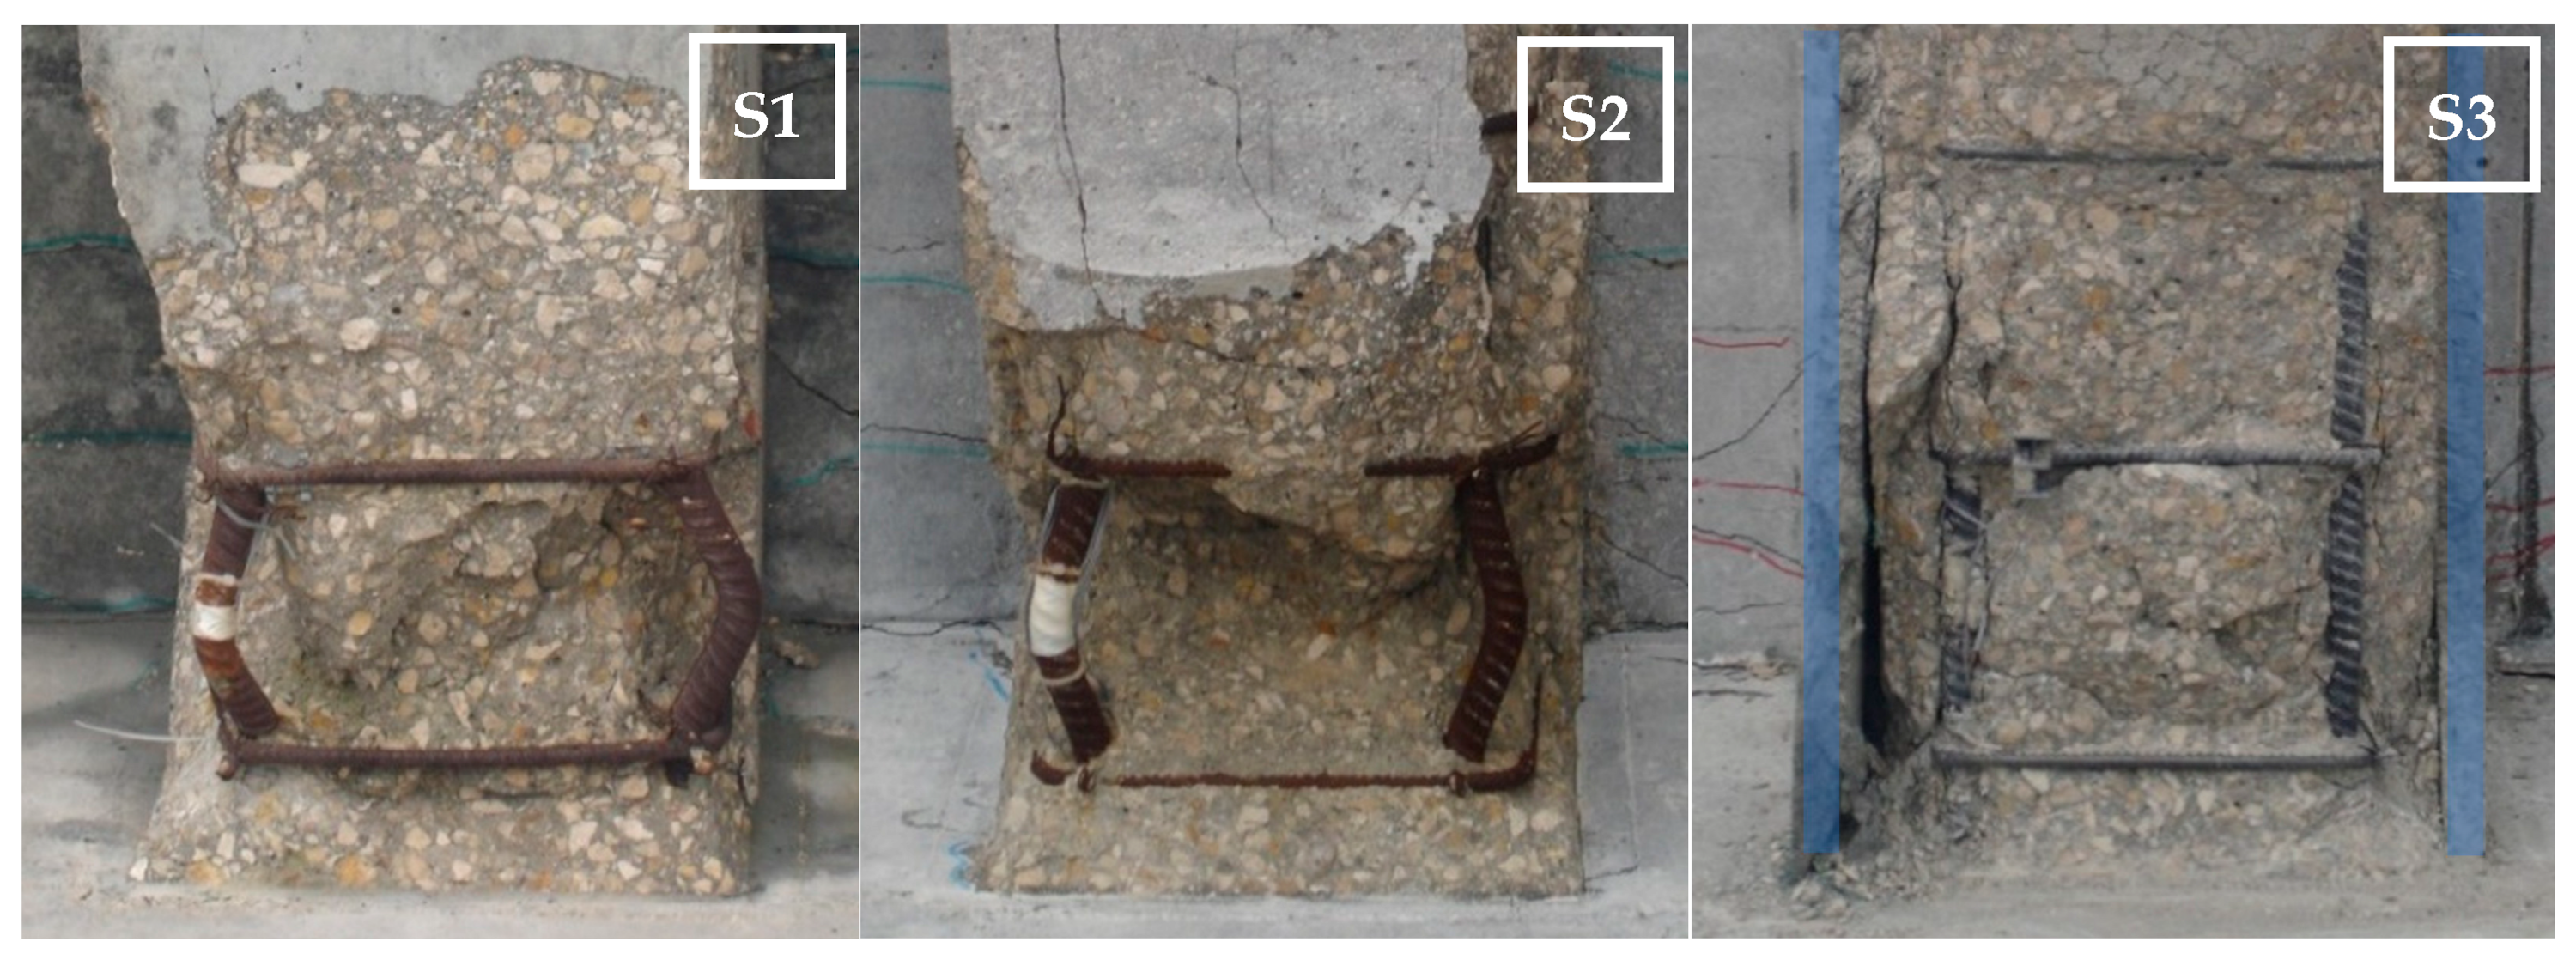
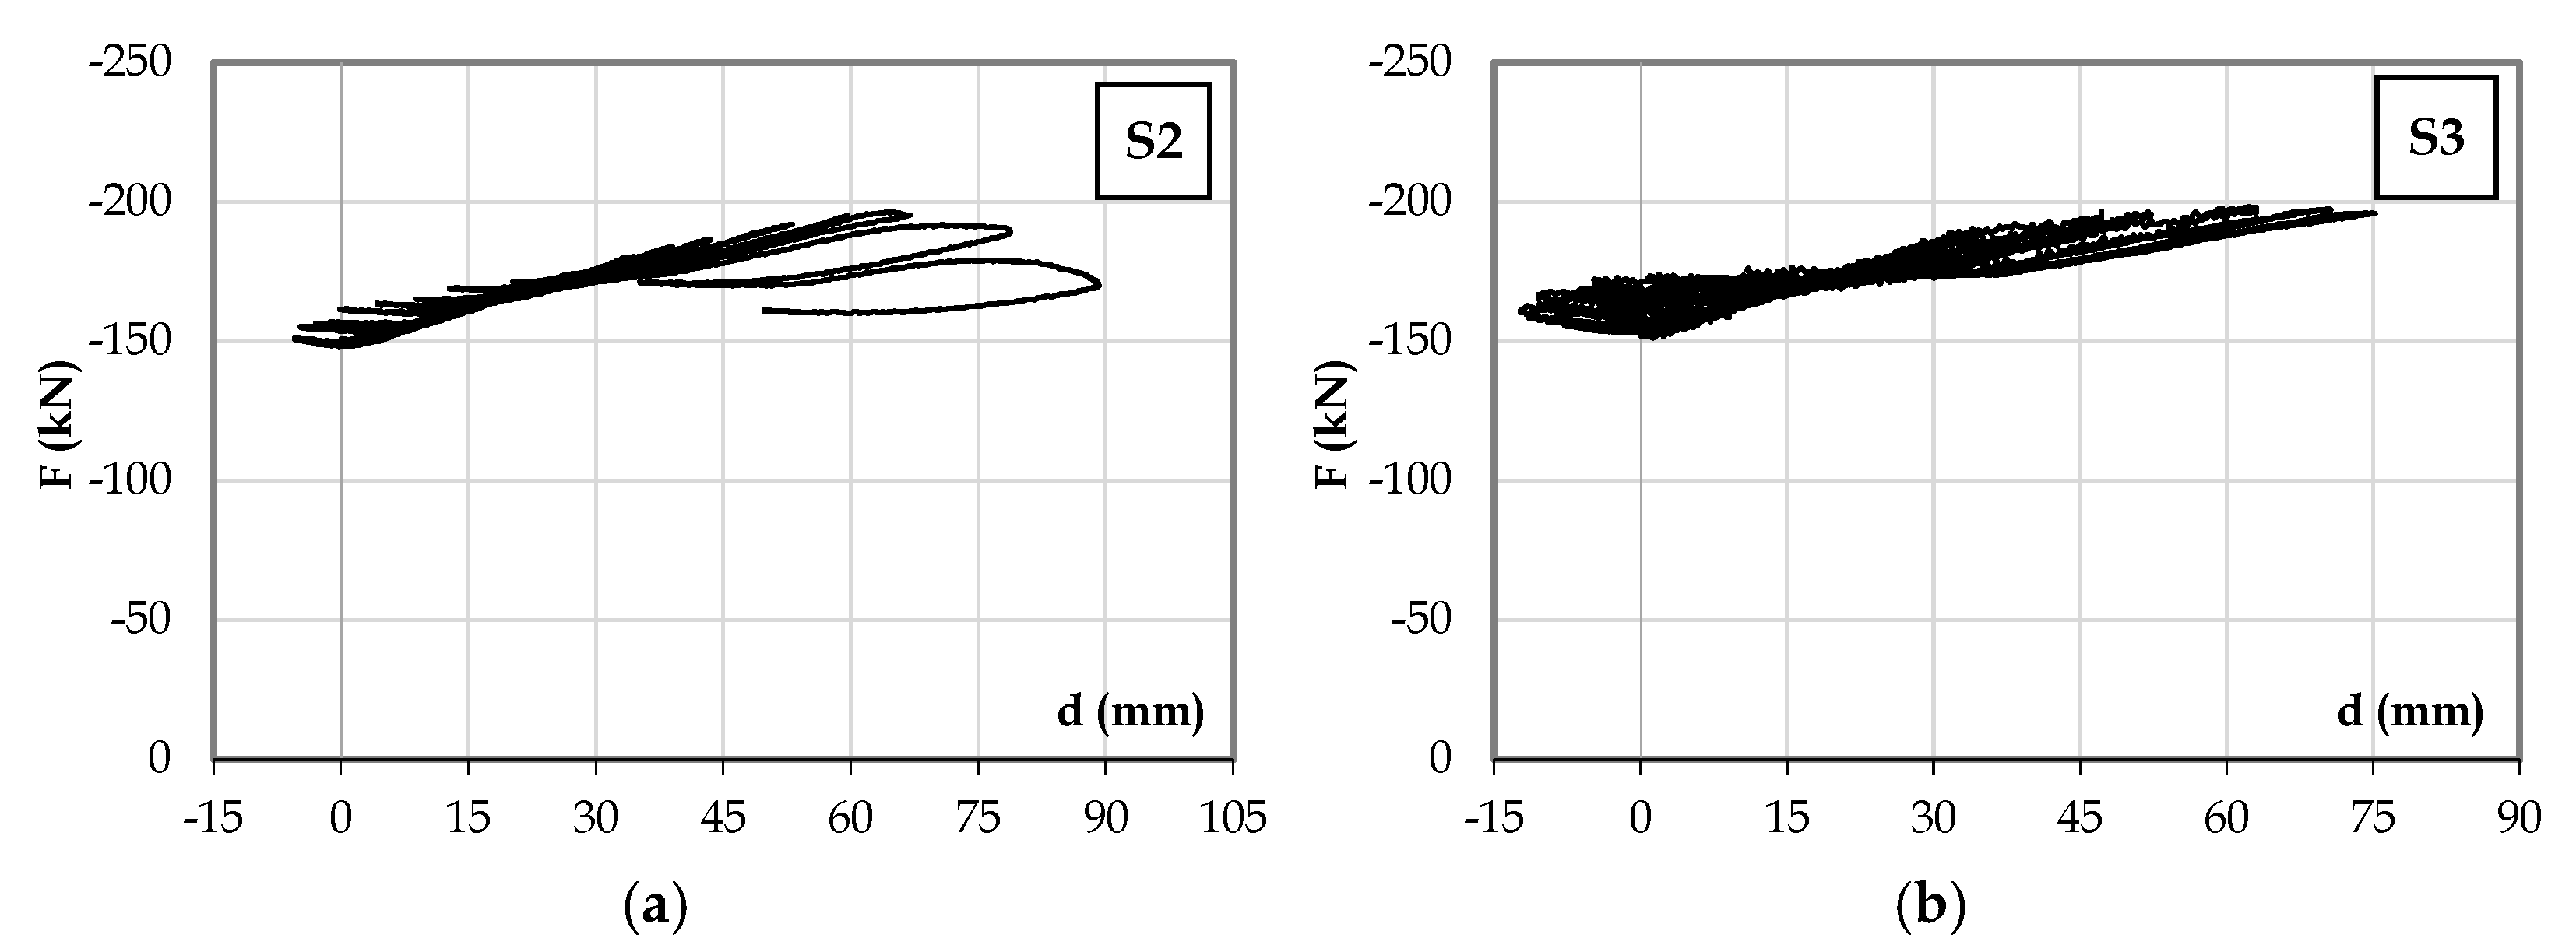
4.1. Failure Mechanisms

All three Specimens’ failure mechanisms were associated with the formation of a plastic hinge near the column support joint, as shown in Figure 6 and Figure 7.
In Specimen S1, the failure mode was characterised by gradual deterioration of the compressed concrete; subsequently, spalling of the concrete cover and buckling of the bottom longitudinal reinforcement occurred (Figure 7—S1). The test procedure which included the gravity load effects, Fg, induce to a deformation increase in the gravity direction, while the longitudinal bottom bars maintained an elastic behaviour in tension. This phenomenon is associated with the pre-established gravity negative moment. Thus, the bottom bars do not yield during the reverse loading cycle. The top cracks remained open and no significant “pinching” effects were observed.
The failure mode of Specimen S2 was prompted by the progressive deterioration of the bottom compression zone, cover spalling, and buckling of the bottom longitudinal reinforcement (Figure 7—S2). Specimen S2 presented considerable damage at its rupture.
In Specimen S3, less damage was observed. The UFRG jacketing delayed the concrete crushing and compressive longitudinal reinforcement buckling. S3’s failure mode was associated with the split of the jacketing material at the bottom surface of the beam (Figure 7—S3).

4.2. Experimental Results

The displacement history and force-displacement response of Specimen S1 are shown in Figure 8.
The displacement history and the force-displacement diagram of Specimen S2 are shown in Figure 9. A maximum load of 260.10 kN and 5.30% beam rotation were attained. In relation to Specimen S1, this beam showed a higher strength capacity and lower residual deformation.
The displacement history and force-displacement diagram of Specimen S3, presented in Figure 10, show a maximum load of 293.00 kN and a 5.0% beam rotation. The load-displacement hysteretic diagram shows that the post-tensioning system led to less residual deformation and a higher strength capacity. The UFRG jacketing led to a more stable response with less damage. The strengthened beams presented an improvement towards a more balanced behaviour.
The strands’ post-tensioning force level follows the increasing amplitude of the imposed cyclical displacement. Figure 11 shows that the post-tensioning force increases through the test. This phenomenon may be associated with residual deformations. The disturbances close to failure, observed in the diagrams, are associated with post-tensioning losses due to beam degradation near failure.

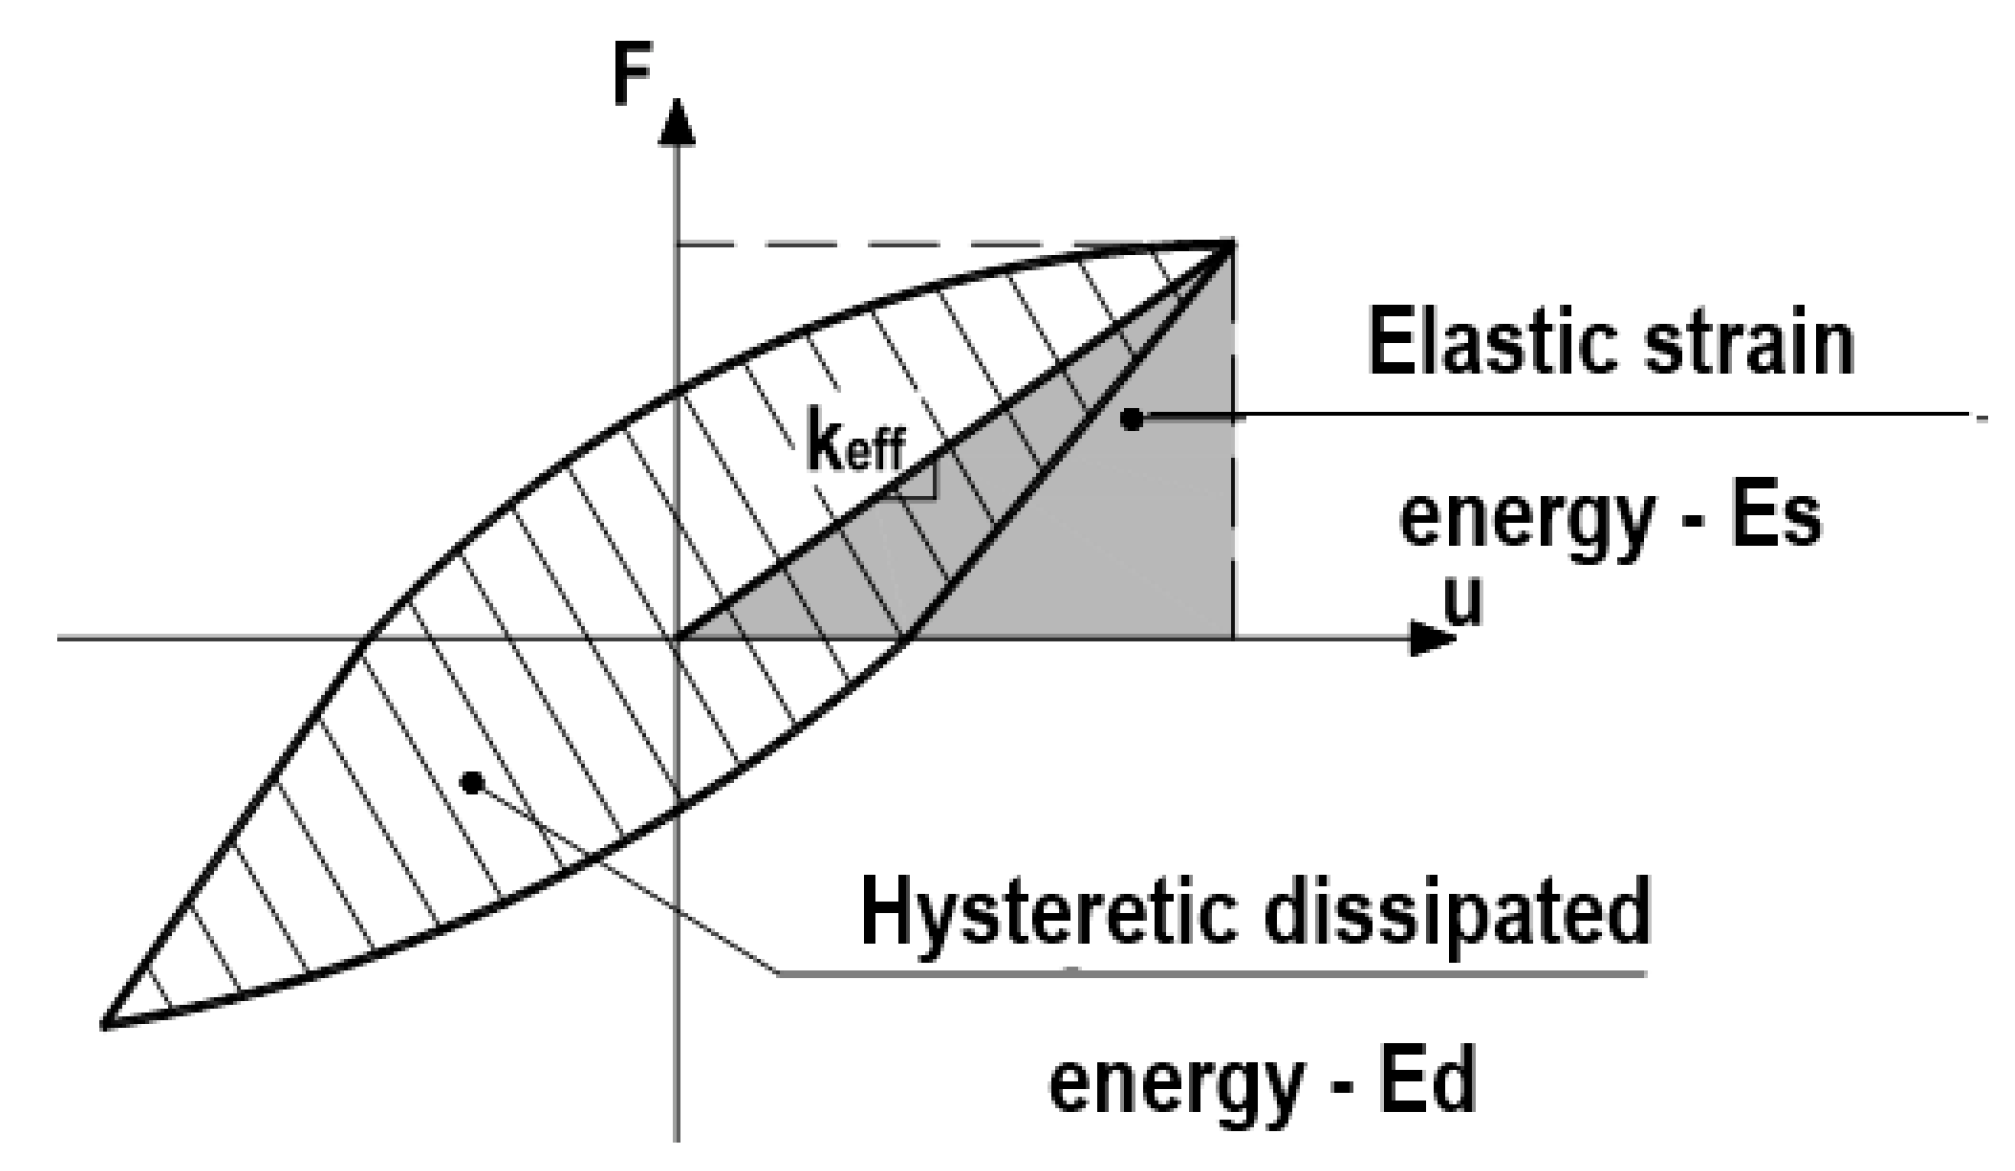
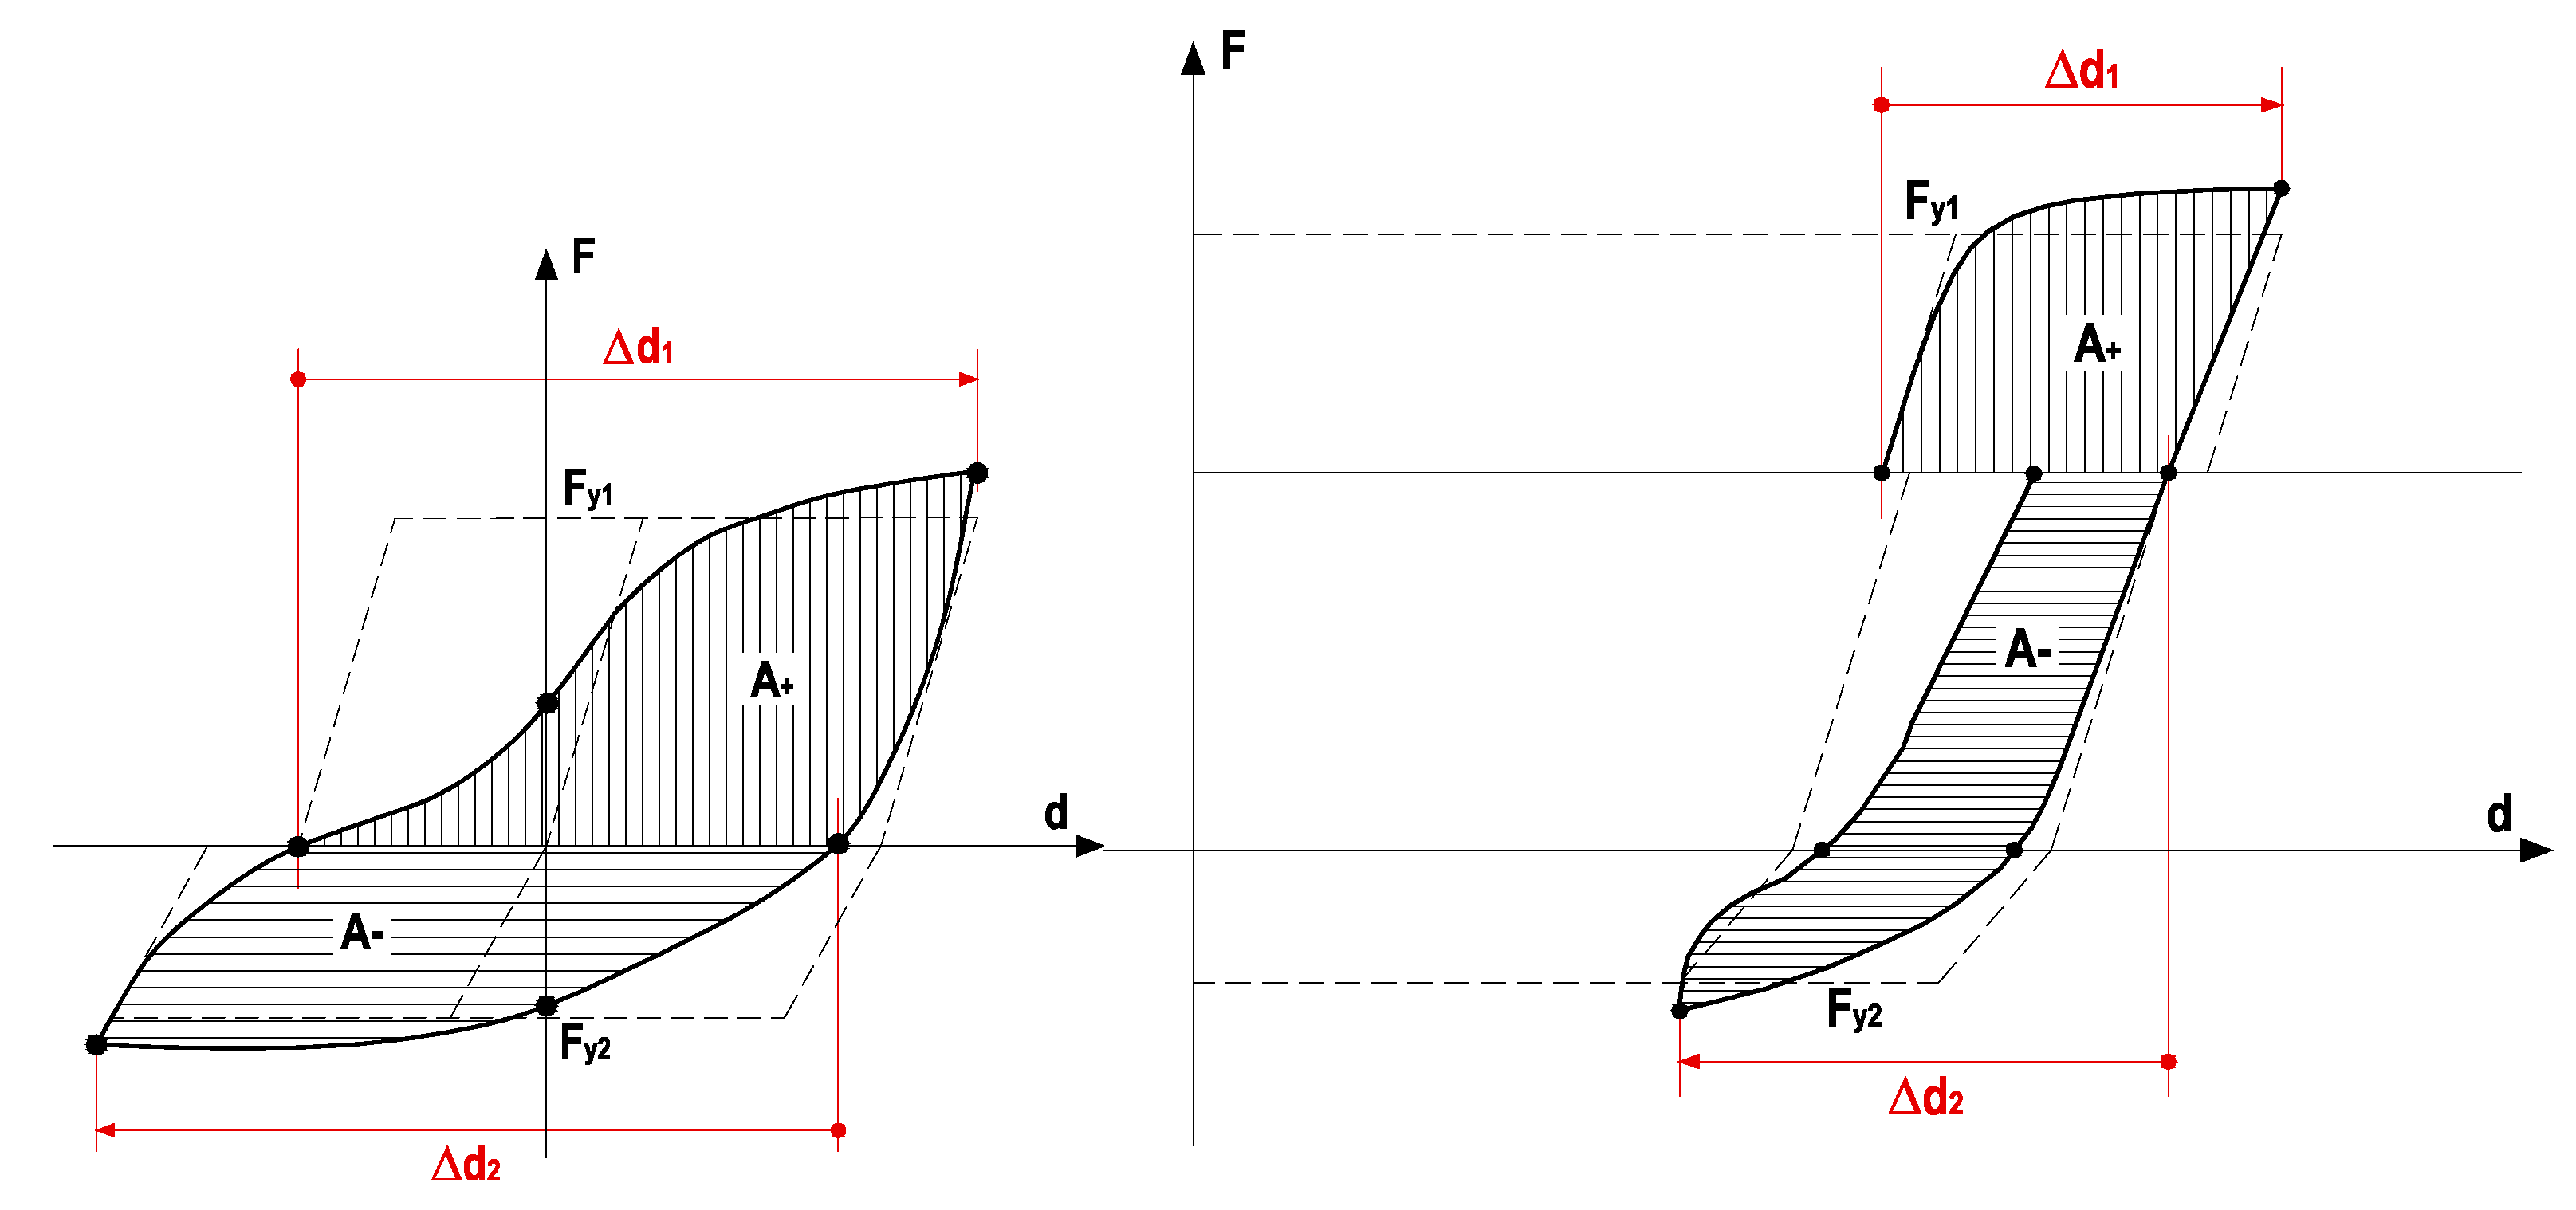
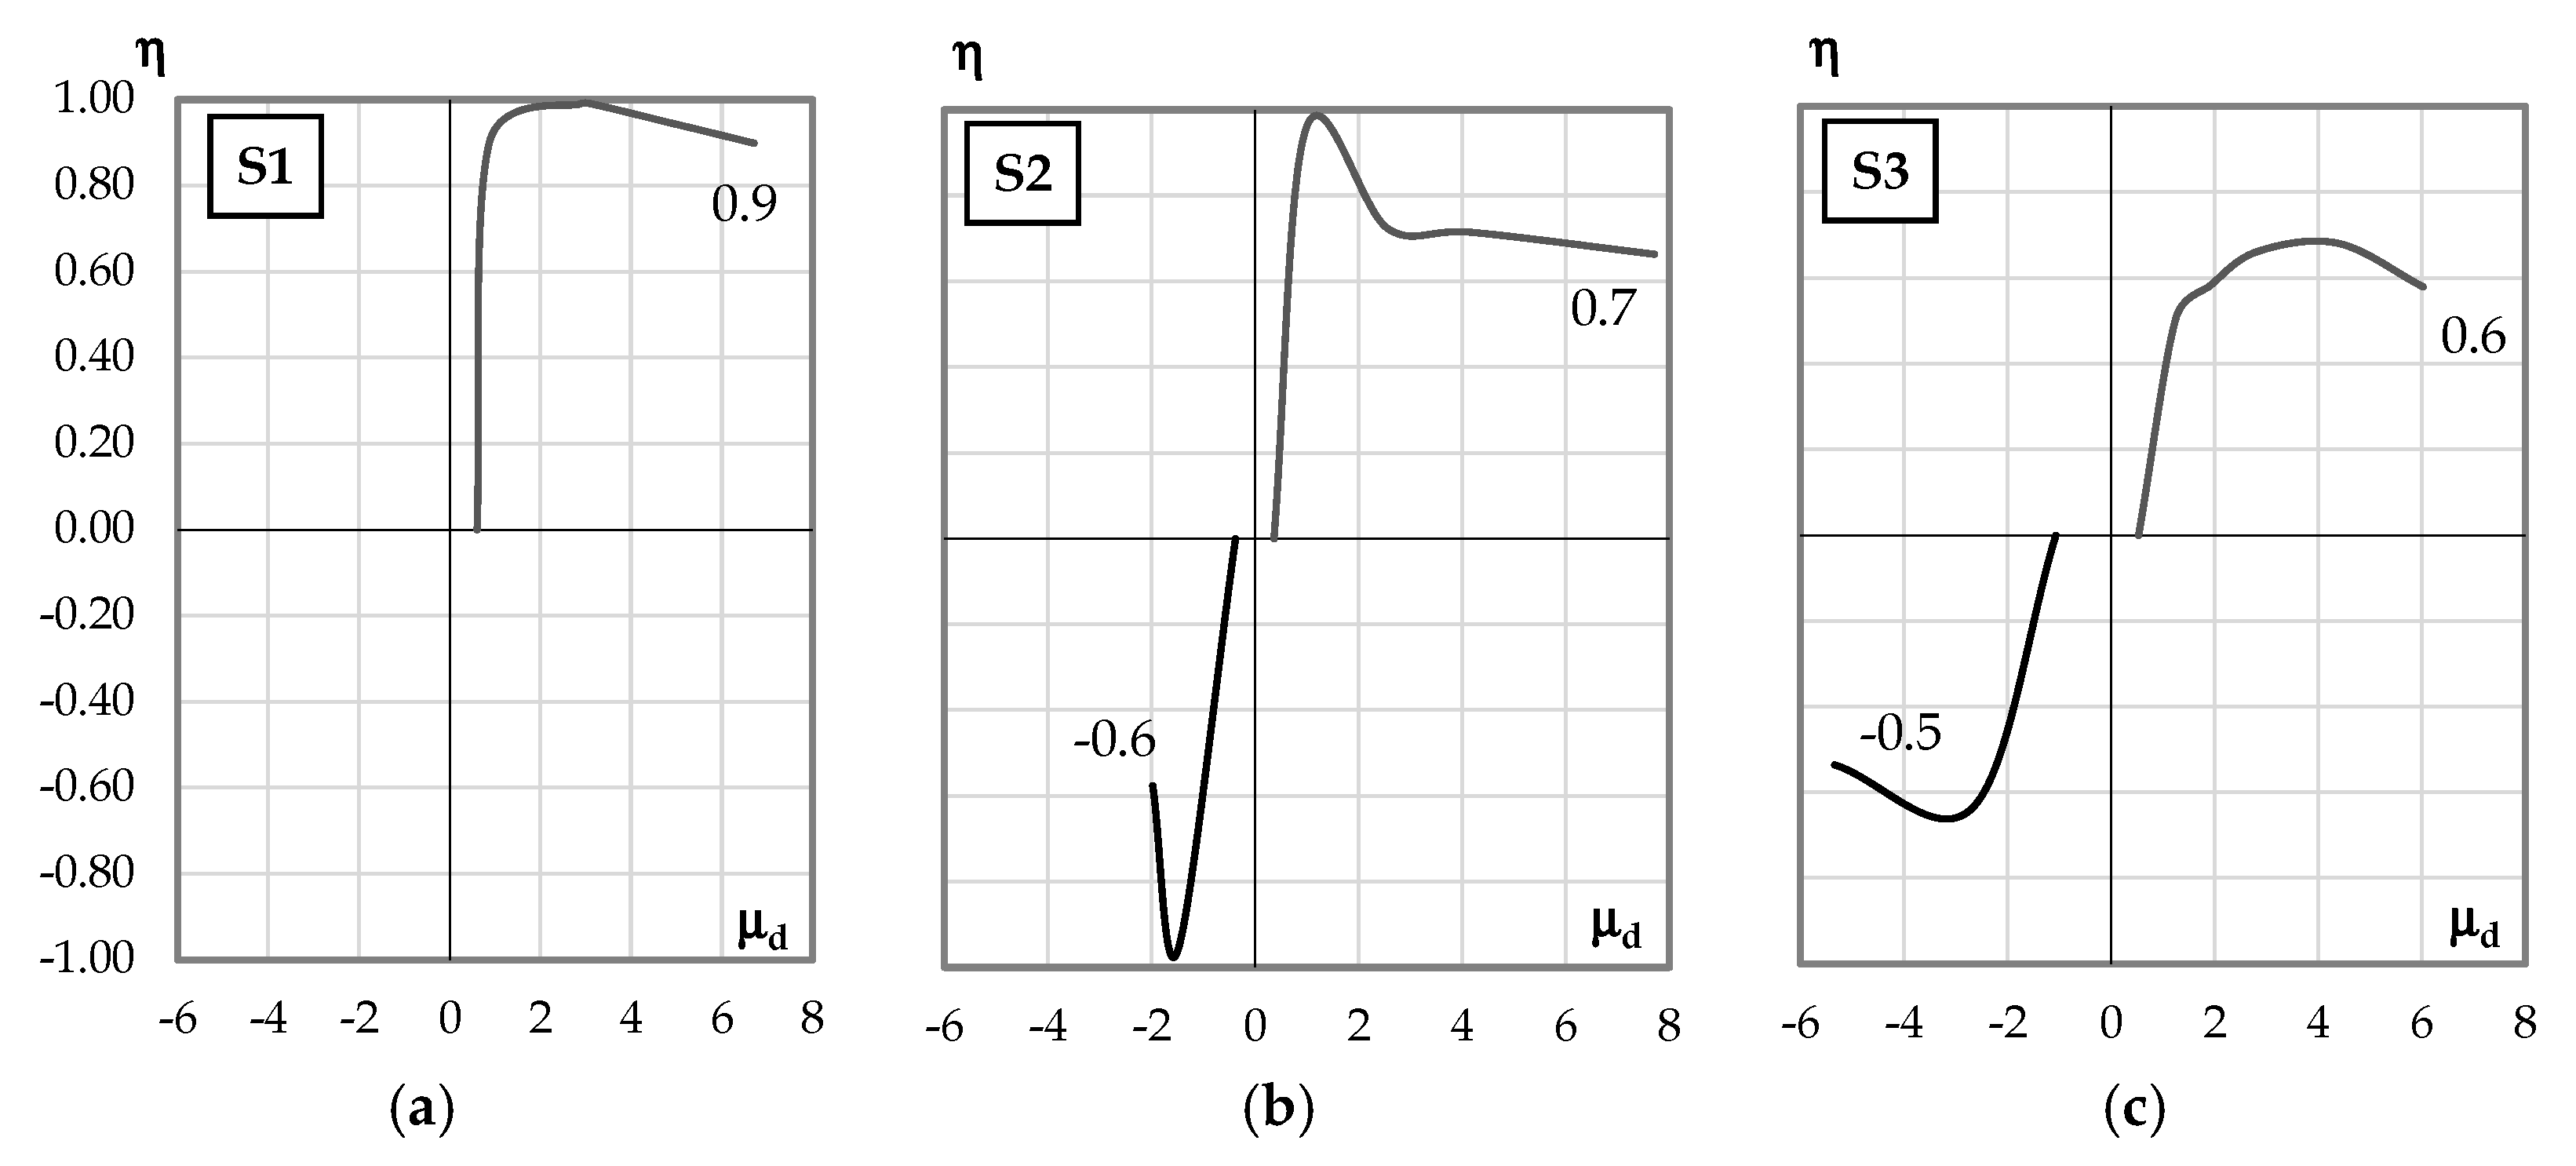
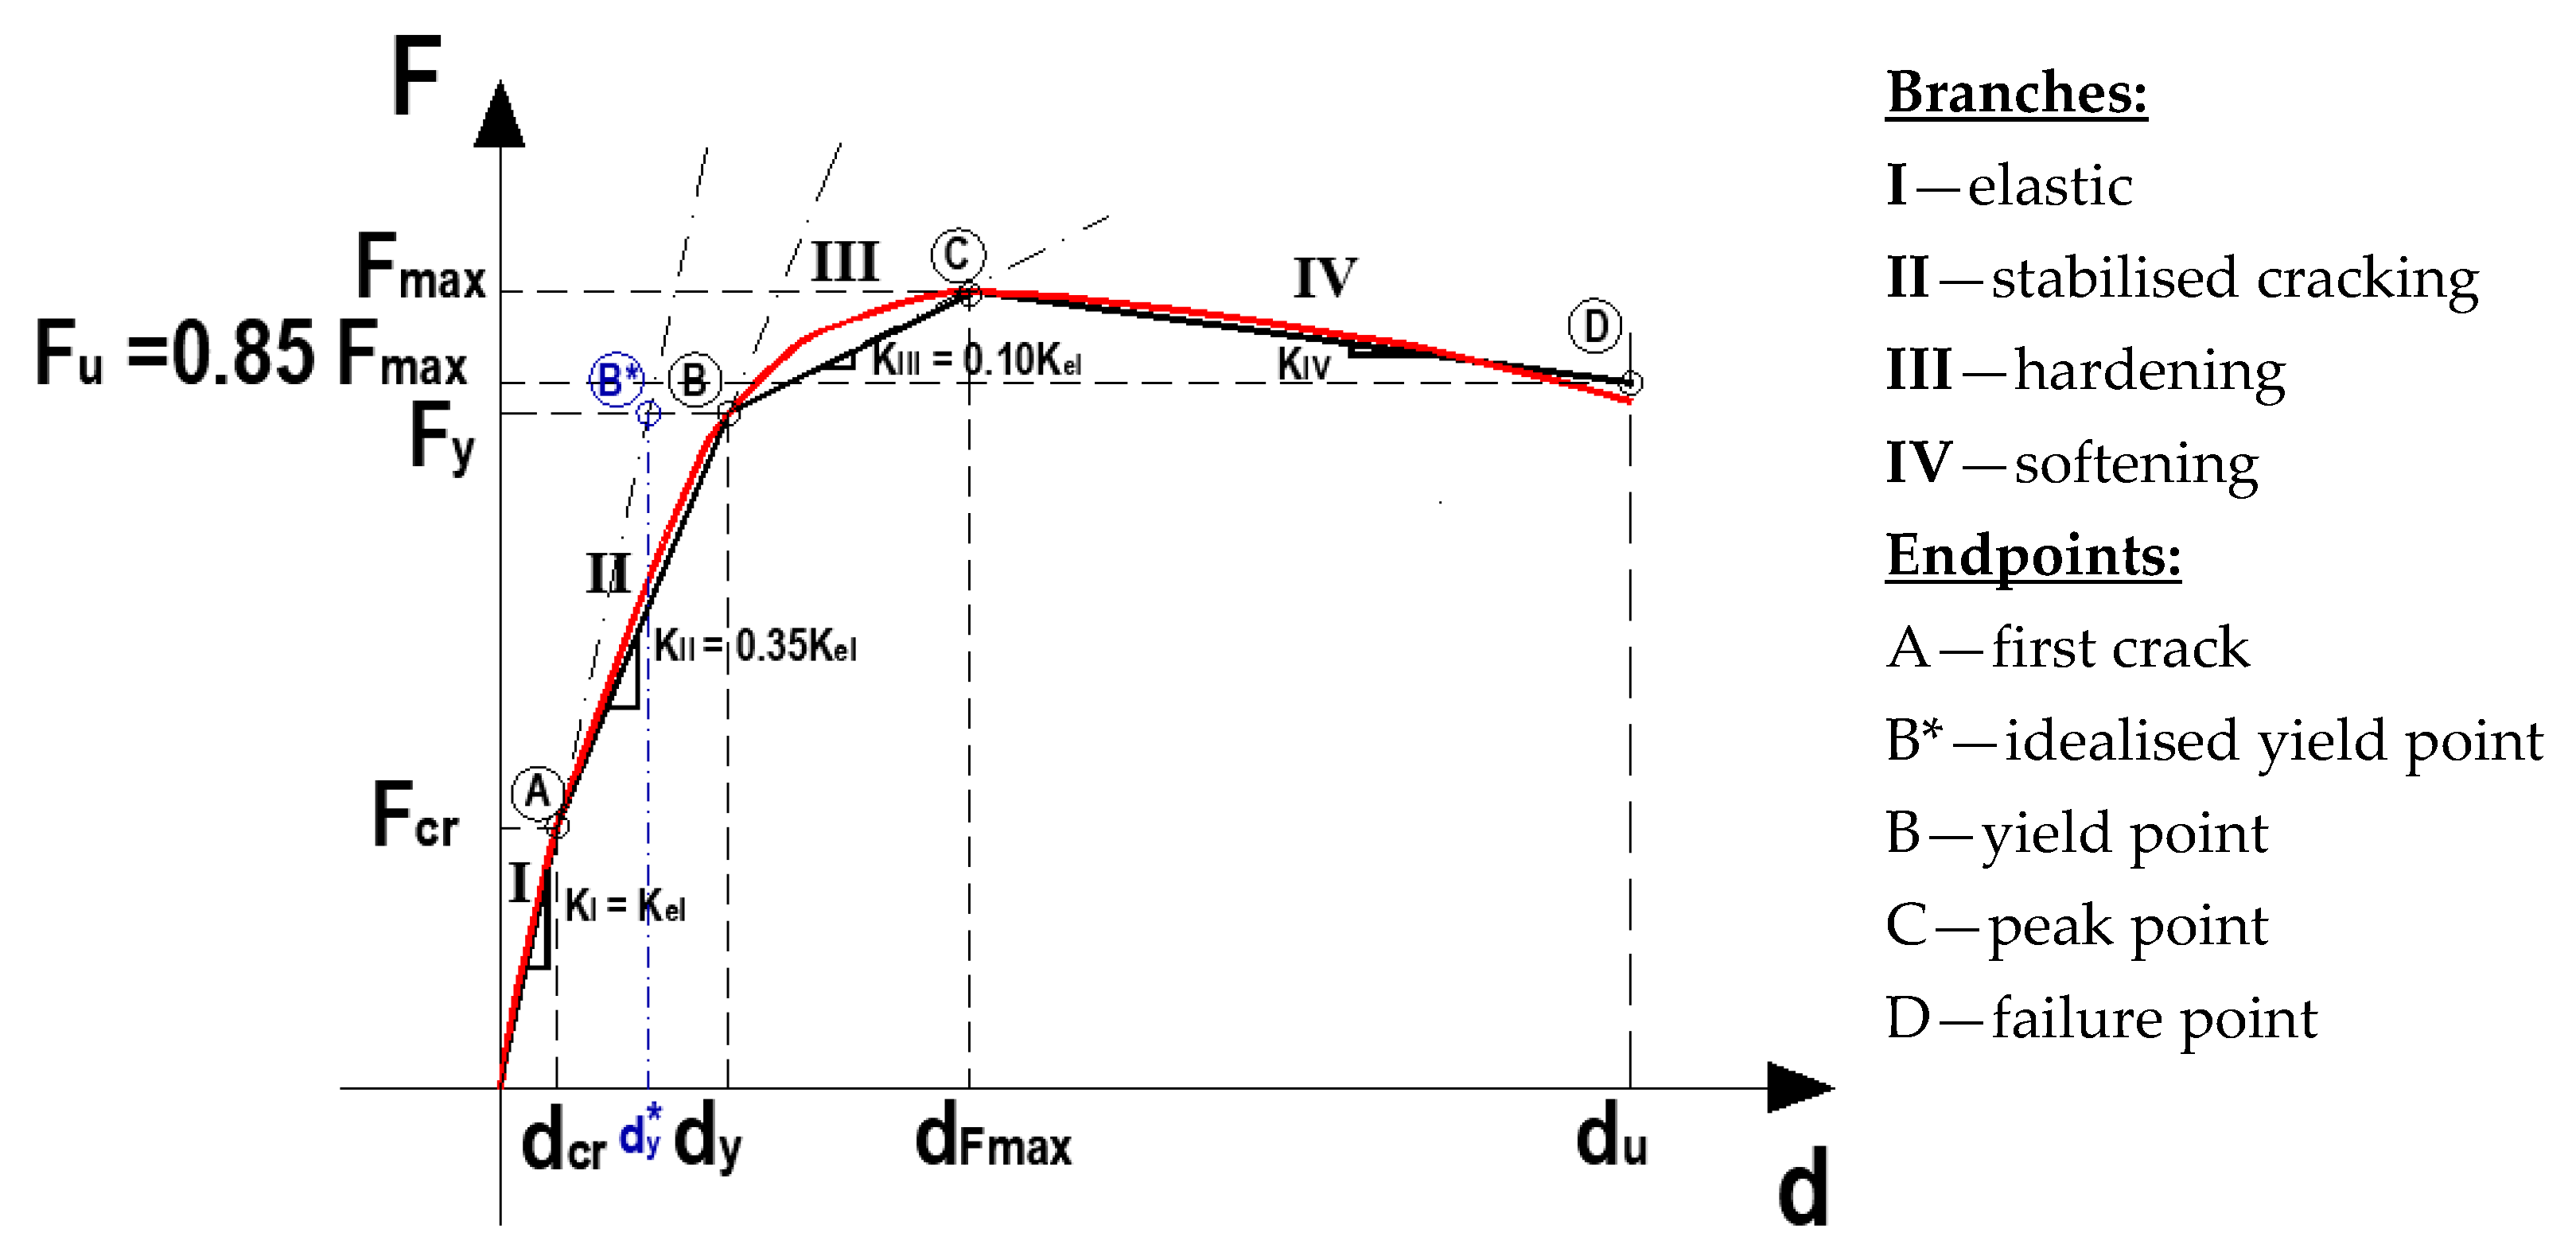
4.3. Performance Evaluation

The assessment of the strengthening solutions was carried out through the evaluation of the displacement ductility (µ), the energy dissipation (W), the residual displacement (dr), and the absorbed energy index (η).
The displacement ductility, µ, corresponds to the relation between the ultimate (du) and yielding displacement (dy). The energy dissipation (W) corresponds to the area under the load-displacement diagram.
The parameters obtained for the three Specimens are presented in Table 2.
The Fmax/FS1 relation corresponds to the resistance capacity increase in comparison with the Specimen S1. The Specimen S2 (strengthened with external PT) (S2) presented a 22% strength increase. The strengthening solution with the additional UFRG jacketing (S3) reached 1.4 times the resistance capacity of the reference specimen.
The W/WS1 ratio represents the dissipated energy gain in the strengthening solutions. The strengthening solutions attained a considerable dissipated energy increase. The beam strengthened only with external PT (S2) had a 53% increase in the energy dissipation and, for the one with the additional UFRG jacketing (S3), a 100% energy dissipation increment was attained.
Specimen S1 exhibited deformation accumulation in the gravity direction. In the reverse direction, bottom reinforcement exhibited an elastic behaviour during the test. The strengthening Specimen S2, showed a more balanced behaviour in both directions. However, the ductility mobilised in the hogging direction is larger than in the sagging direction. The addition of the UFRG jacketing in the second strengthening solution (S3) allows for a gain of stability on the bottom side of the beam and, consequently, similar ductility exploitation in both directions, leading to a more recentred behaviour of the strengthened beam.
The dr/drS1 ratio shows that a significant reduction in the residual deformation was attained with both strengthening solutions. The beam with external post-tensioning (S2) presented a decrease in deformation when compared with the reference specimen’s of, approximately, 40%. The beam with external PT and UFRG jacketing (S3) had a residual deformation decrease of, approximately, 50%. These observations indicate a more recentred behaviour.
There was a gain in terms of the dissipated energy and strength capacity and a residual deformation decreasing in the strengthened beams, leading to more recentred and balanced behaviour in both directions.
To accurately assess the strengthening solutions, a damage parameter or index should be considered. The Park and Ang (1985) [38] index has extensive applications, resulting from its simplicity and extensive experimental calibration. It is a combined damage index that considers the response effects in terms of displacement and dissipated hysteretic energy, is dimensionless concerning an elastoplastic system, and can be obtained by Expression (1), as illustrated in Figure 12:
Figure 12. Energy dissipated in an elastoplastic system.
Buildings 13 00095 g012
D I P A = d u , a c u m d u ,   m o n + β E h F y · d u ,   m o n
where DIPA—Damage index;
du,mon—ultimate displacement deformation under monotonic loading;
du,acum—ultimate accumulated deformation;
Fy—yield strength;
Eh—dissipated hysteretic energy;
β—a semi-empiric parameter, which reflects reinforced concrete degradation.
Despite being a widely used damage index due to its simplicity and extensive experimental calibration, Cosenza et al. (1993) [39] point out some limitations, such as the damage index assuming a zero value, translating into an absence of damage. However, for an elastic response, where the dissipated energy is null and the displacement corresponds to yielding, as it can be observed, Expression (1) returns a non-zero value. In the same way, failure should correspond to a value of the damage index equal to one. However, for a monotonic response, the index can present values greater than one. The author also refers to the fact that the parameter reflecting cyclic degradation (β) is not loaded path-dependent.
Another widely used parameter is the equivalent viscous damping ratio, ξeq. This parameter describes the relationship between the elastic strain energy stored in an equivalent linear elastic system, Es, and the hysteretic dissipated energy, Ed (corresponding to the area contained by the inelastic force-displacement response curve), as shown in Figure 13 and given by Expression (2).
ξ e q = 1 4 π E d E s
However, this parameter is determined by assuming the energy dissipated during one cycle of vibration of simple harmonic motion. That is not the case with the tested specimen, which can not be compared with a simple harmonic motion since exhibited a large accumulation of deformation. Thus, the observed behaviour cannot be simulated through an equivalent linear elastic system with a simple harmonic motion that assumes a repetitive motion back and forth through a central position or an equilibrium where the maximum displacement on one side of the position is equivalent to the maximum displacement of the other side.
Therefore, the chosen parameter was the absorbed energy parameter, η, which corresponds to the ratio between the dissipated energy in a negative and positive semi-cycle (starting from the instant in which the gravity load is installed) and the stored energy in an elastoplastic system—Figure 14.
η i + / = A i + / F y + / · Δ d i + / d y + /  
In Figure 15, the absolved energy parameter versus ductility for Specimens S1 (a), S2 (b), and S3 (c) is presented. It should be mentioned that the negative (−) and positive (+) semi-cycle are respectively related to the negative (hogging) and positive (sagging) moments bending the direction of the beam.
This parameter also reflects the ability to simulate the hysteretic response observed using an elastoplastic model.
The absorbed energy parameter, η, for a given cycle i, can be obtained with Expression (3), and Figure 14 illustrates the variables involved.
The absorbed energy parameter versus ductility reflects the relationship between the energy dissipated and the energy stored in an idealised elastoplastic system, for a given level of ductility. For example, with a displacement ductility of 4 in the hogging direction, the reference Specimen (S1) will dissipate a level of energy similar to that of the elastoplastic system, while the strengthened Specimens S2 and S3 dissipate approximately 70% of the energy of an elastoplastic system. This parameter is an indicator of the shape of the hysteretic diagram.

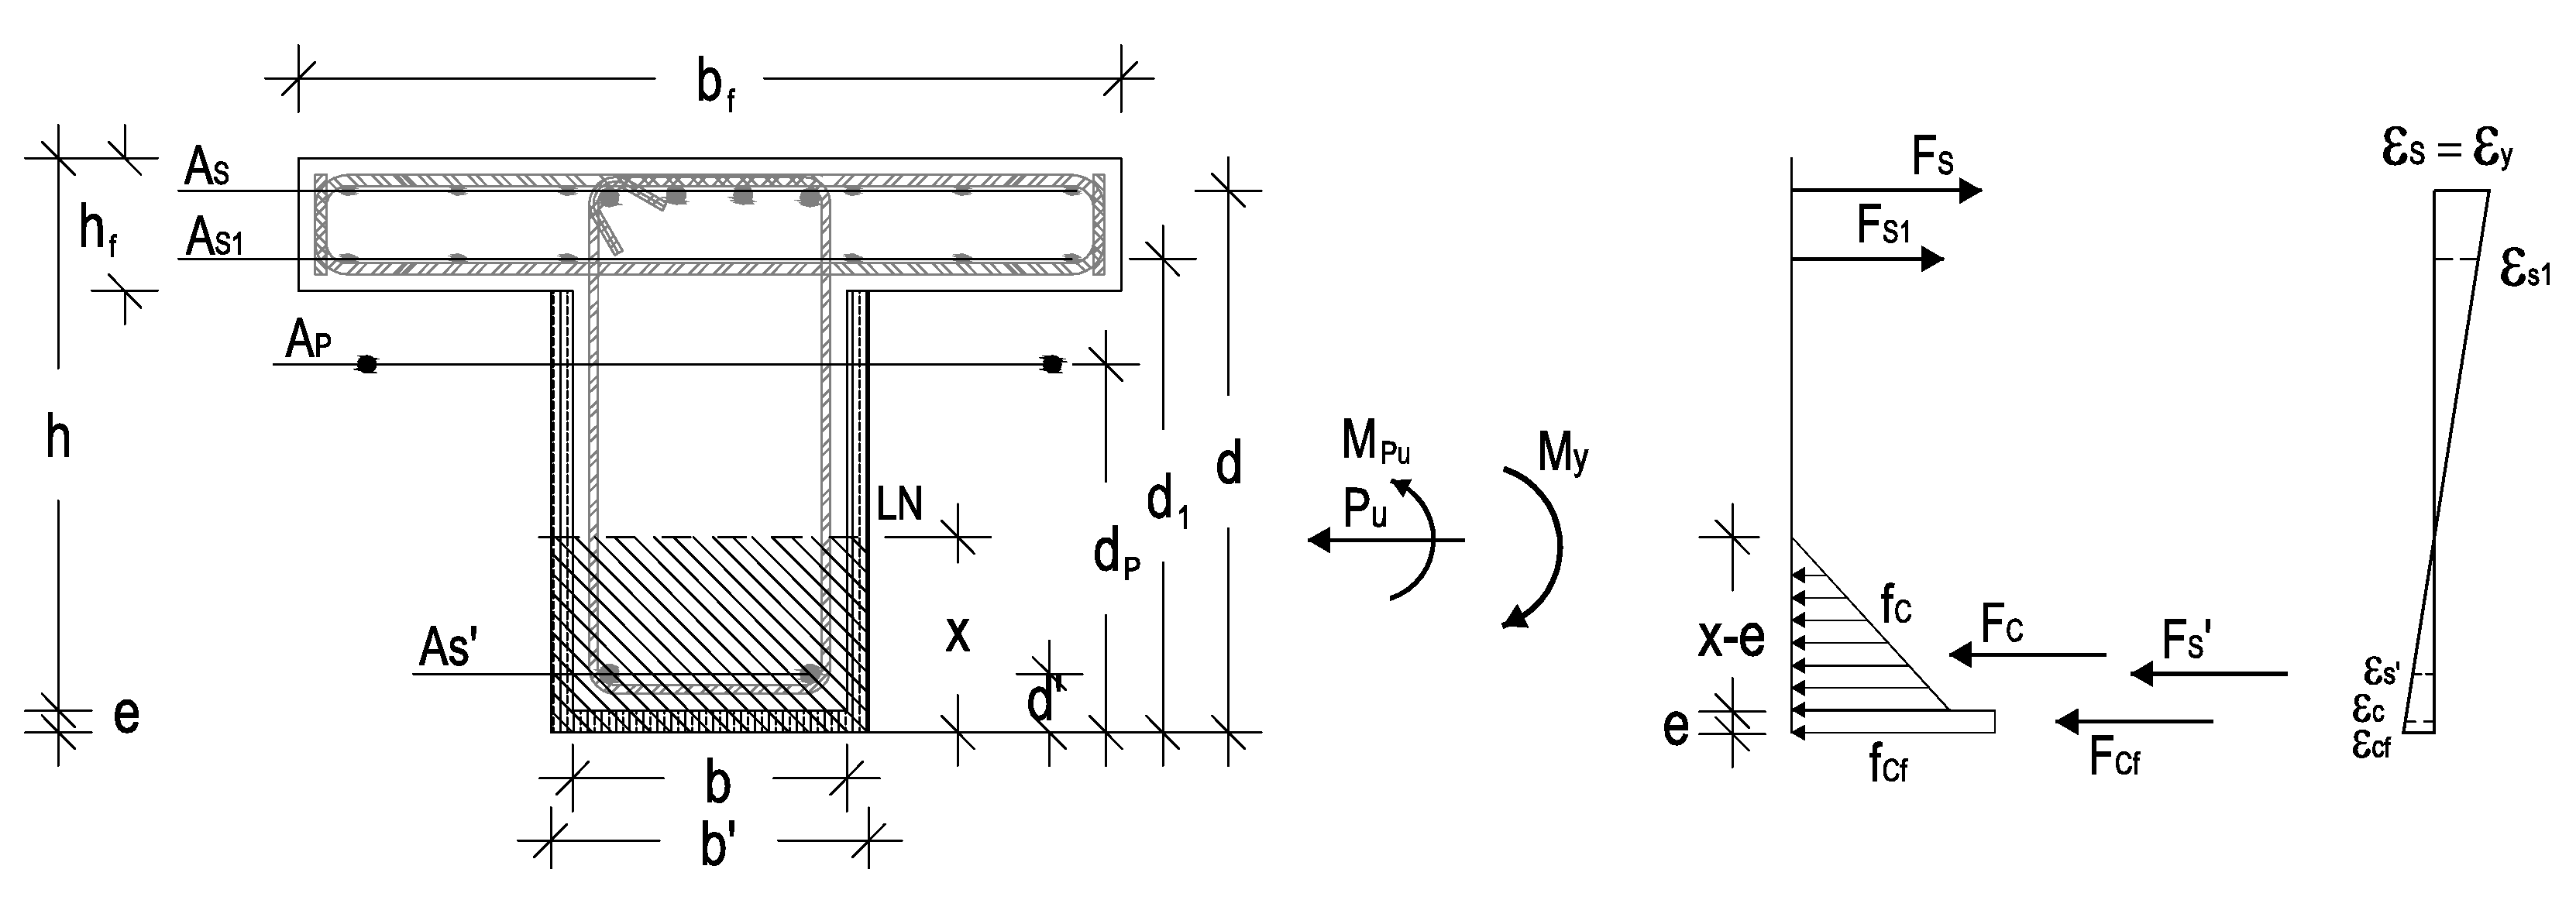
5. Theoretical Prediction

A theoretical prediction to estimate the strength and deformation capacity of the strengthening solutions is presented. With this purpose, the following assumptions are considered: the prestressing force is an external force; the concrete ultimate compressive strain is 3.5‰; the concrete tensile strength is neglected; the concrete confinement, provided by the UFRG jacketing, wasn’t considered; and the reinforcement maximum strain is 6% (value proposed in Eurocode 8—part 3 [2]).
Afterwards, in Section 5.1 and Section 5.2, the yield and peak bending capacity, My and Mmax, are determined from the imposition of the section force equilibrium and strain compatibility conditions. In Section 5.3, the determination of the deformation capacity is performed, assuming that the beam element exhibits approximately a rigid body plastic rotation around the plastic hinge centre. The idealised yielding displacement, dy*, is obtained based on the bilinear behaviour. Admitting to a bilinear moment-curvature relation and constant plastic curvature along the plastic hinge length, the ultimate displacement, du, is estimated through Park and Paulay’s expressions [40].
Finally, in Section 5.4, a multilinear force-displacement model, which describes a generic envelope response, is presented.

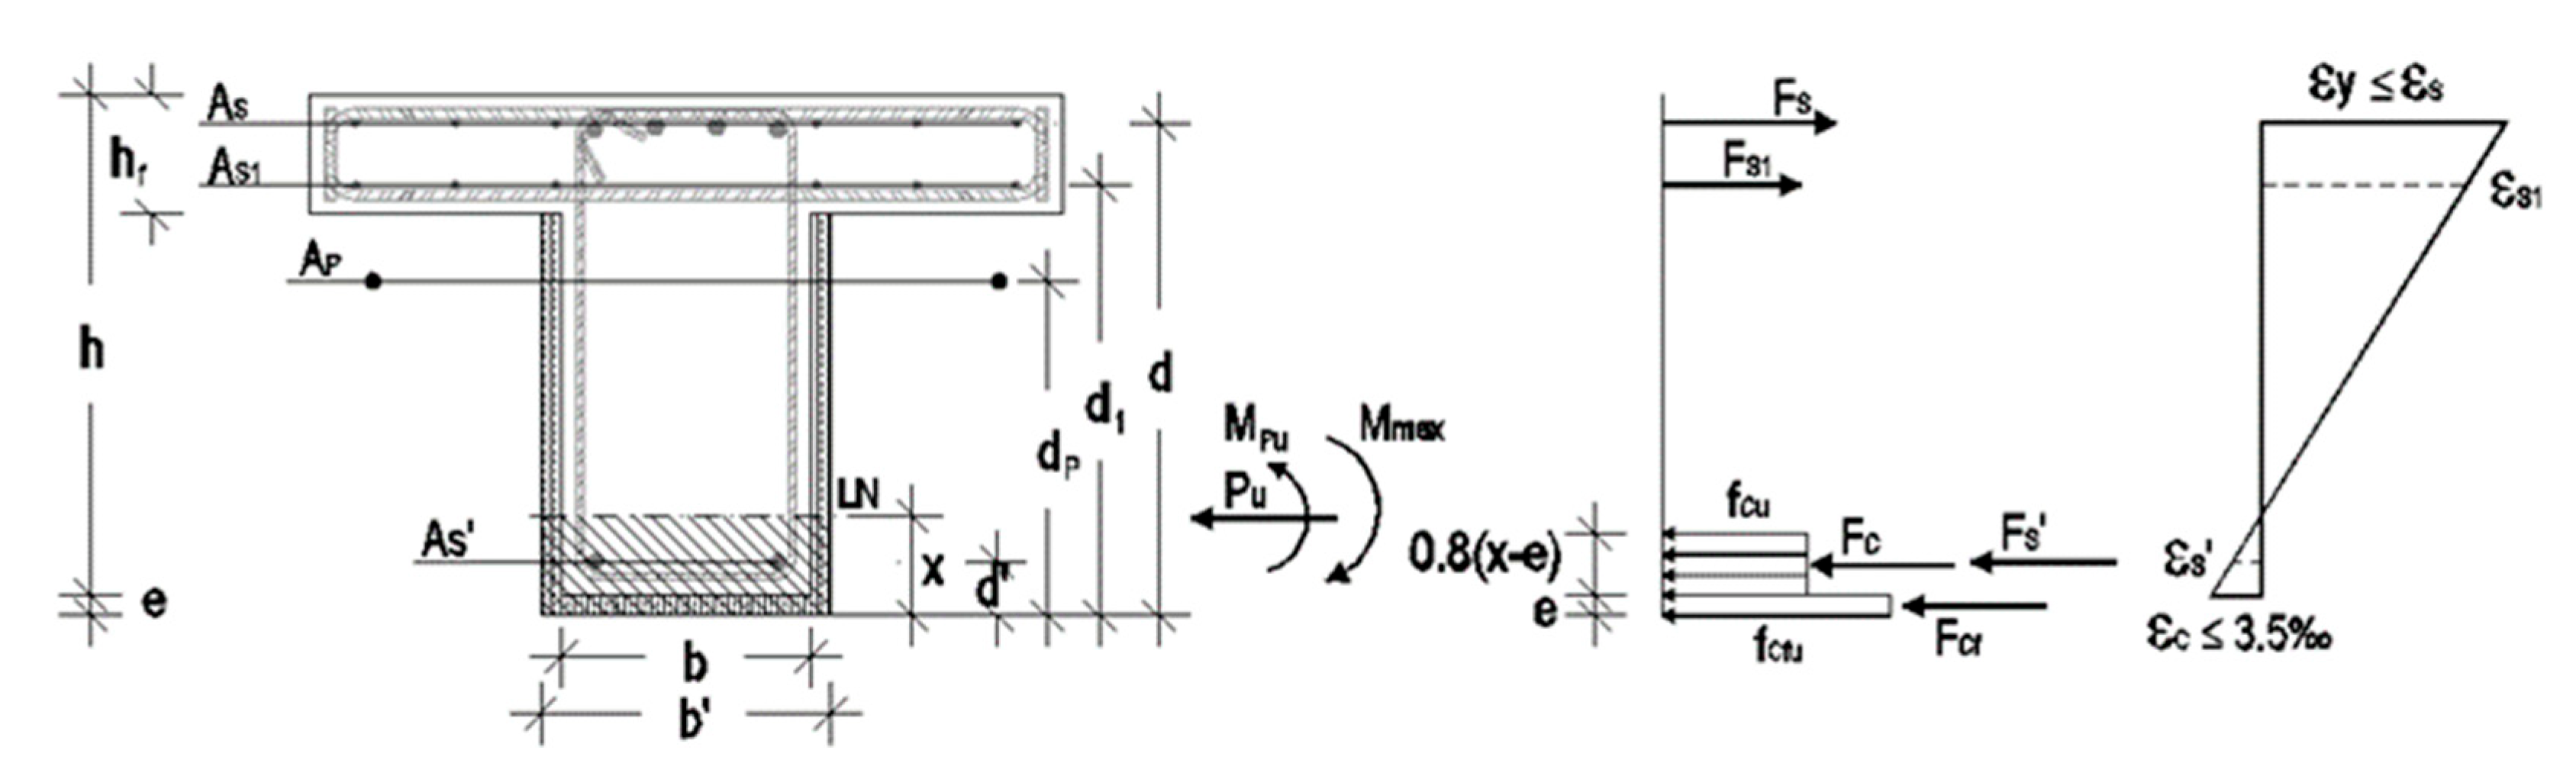
5.1. Determination of the Yield Bending Capacity

To calculate the yield moment, which corresponds to the first yielding in the cross-section (εs = εy), the position of the neutral axis was determined through the section force equilibrium and strain’s compatibility conditions, as illustrated in Figure 16 and expressed in Equations (4) and (5).
Figure 16. Section force equilibrium—yield moment.
Buildings 13 00095 g016
F = P u F s + F s 1 F c F s F c f = P u x
ε y d x = ε S 1 d 1 x ; ε y d x = ε S d x ; ε y d x = ε c x e ; ε y d x = ε C f x
where Pu—prestressing force;
Fs—tensile force in the top reinforcement;
Fs1—tensile force in the flange bottom reinforcement;
Fs—compression force in the compressed bottom reinforcement;
Fc—compression force in the compressed concrete;
Fcf—compression force in the CRFU jacketing.
The yield moment is obtained through the section moment equilibrium, according to Equation (6):
M y = F s · d e x e 3 + F s 1 · d 1 e x e 3 + F s · x e 3 + e d + + F c f · x e 3 + e 2 + P u · d P e x e 3
Table 3 presents the estimated values of the neutral axis position (x), the concrete maximum compressive strain (εc), the yield bending capacity (My), and the respective experimental values (My,exp) for Specimens S1, S2, and S3.
The difference between the yield moment obtained experimentally and analytically, Δ, presented in Table 3, is acceptable. The discrepancies can be related to the fact that the experimental yield moment was obtained, not in the instant associated with the beginning of the yielding longitudinal reinforcement, but through an idealised elastoplastic force-displacement diagram (wherein the area under the curve is comparable to the envelope obtained experimentally).

5.2. Determination of the Peak Bending Moment Capacity

For the determination of the peak bending moment, Mmax, an equivalent rectangular stress block for compressed concrete was used—this is shown in Figure 17.
Considering the abovementioned hypotheses for the material’s constitutive relationship, and assuming a conventional failure in concrete as a design hypothesis, the position of the neutral axis was determined through Equations (3) and (4). Subsequentially, the peak bending moment is determined through the section moment equilibrium expressed in Equation (7):
M m a x = F s · d e 0.4 · x e + F s 1 · d 1 e 0.4 · x e + F s · 0.4 · x e + e d + + F c f · 0.4 · x e + e 2 + P u × d P e 0.4 · x e
Table 4 shows an acceptable difference, Δ, between the peak moment obtained in the strengthened specimen’s experimental test (Mmax,exp) and the respective estimated value (Mmax). The position of the neutral axis (x) and the tensile strain in the reinforcement (εs) are also shown.

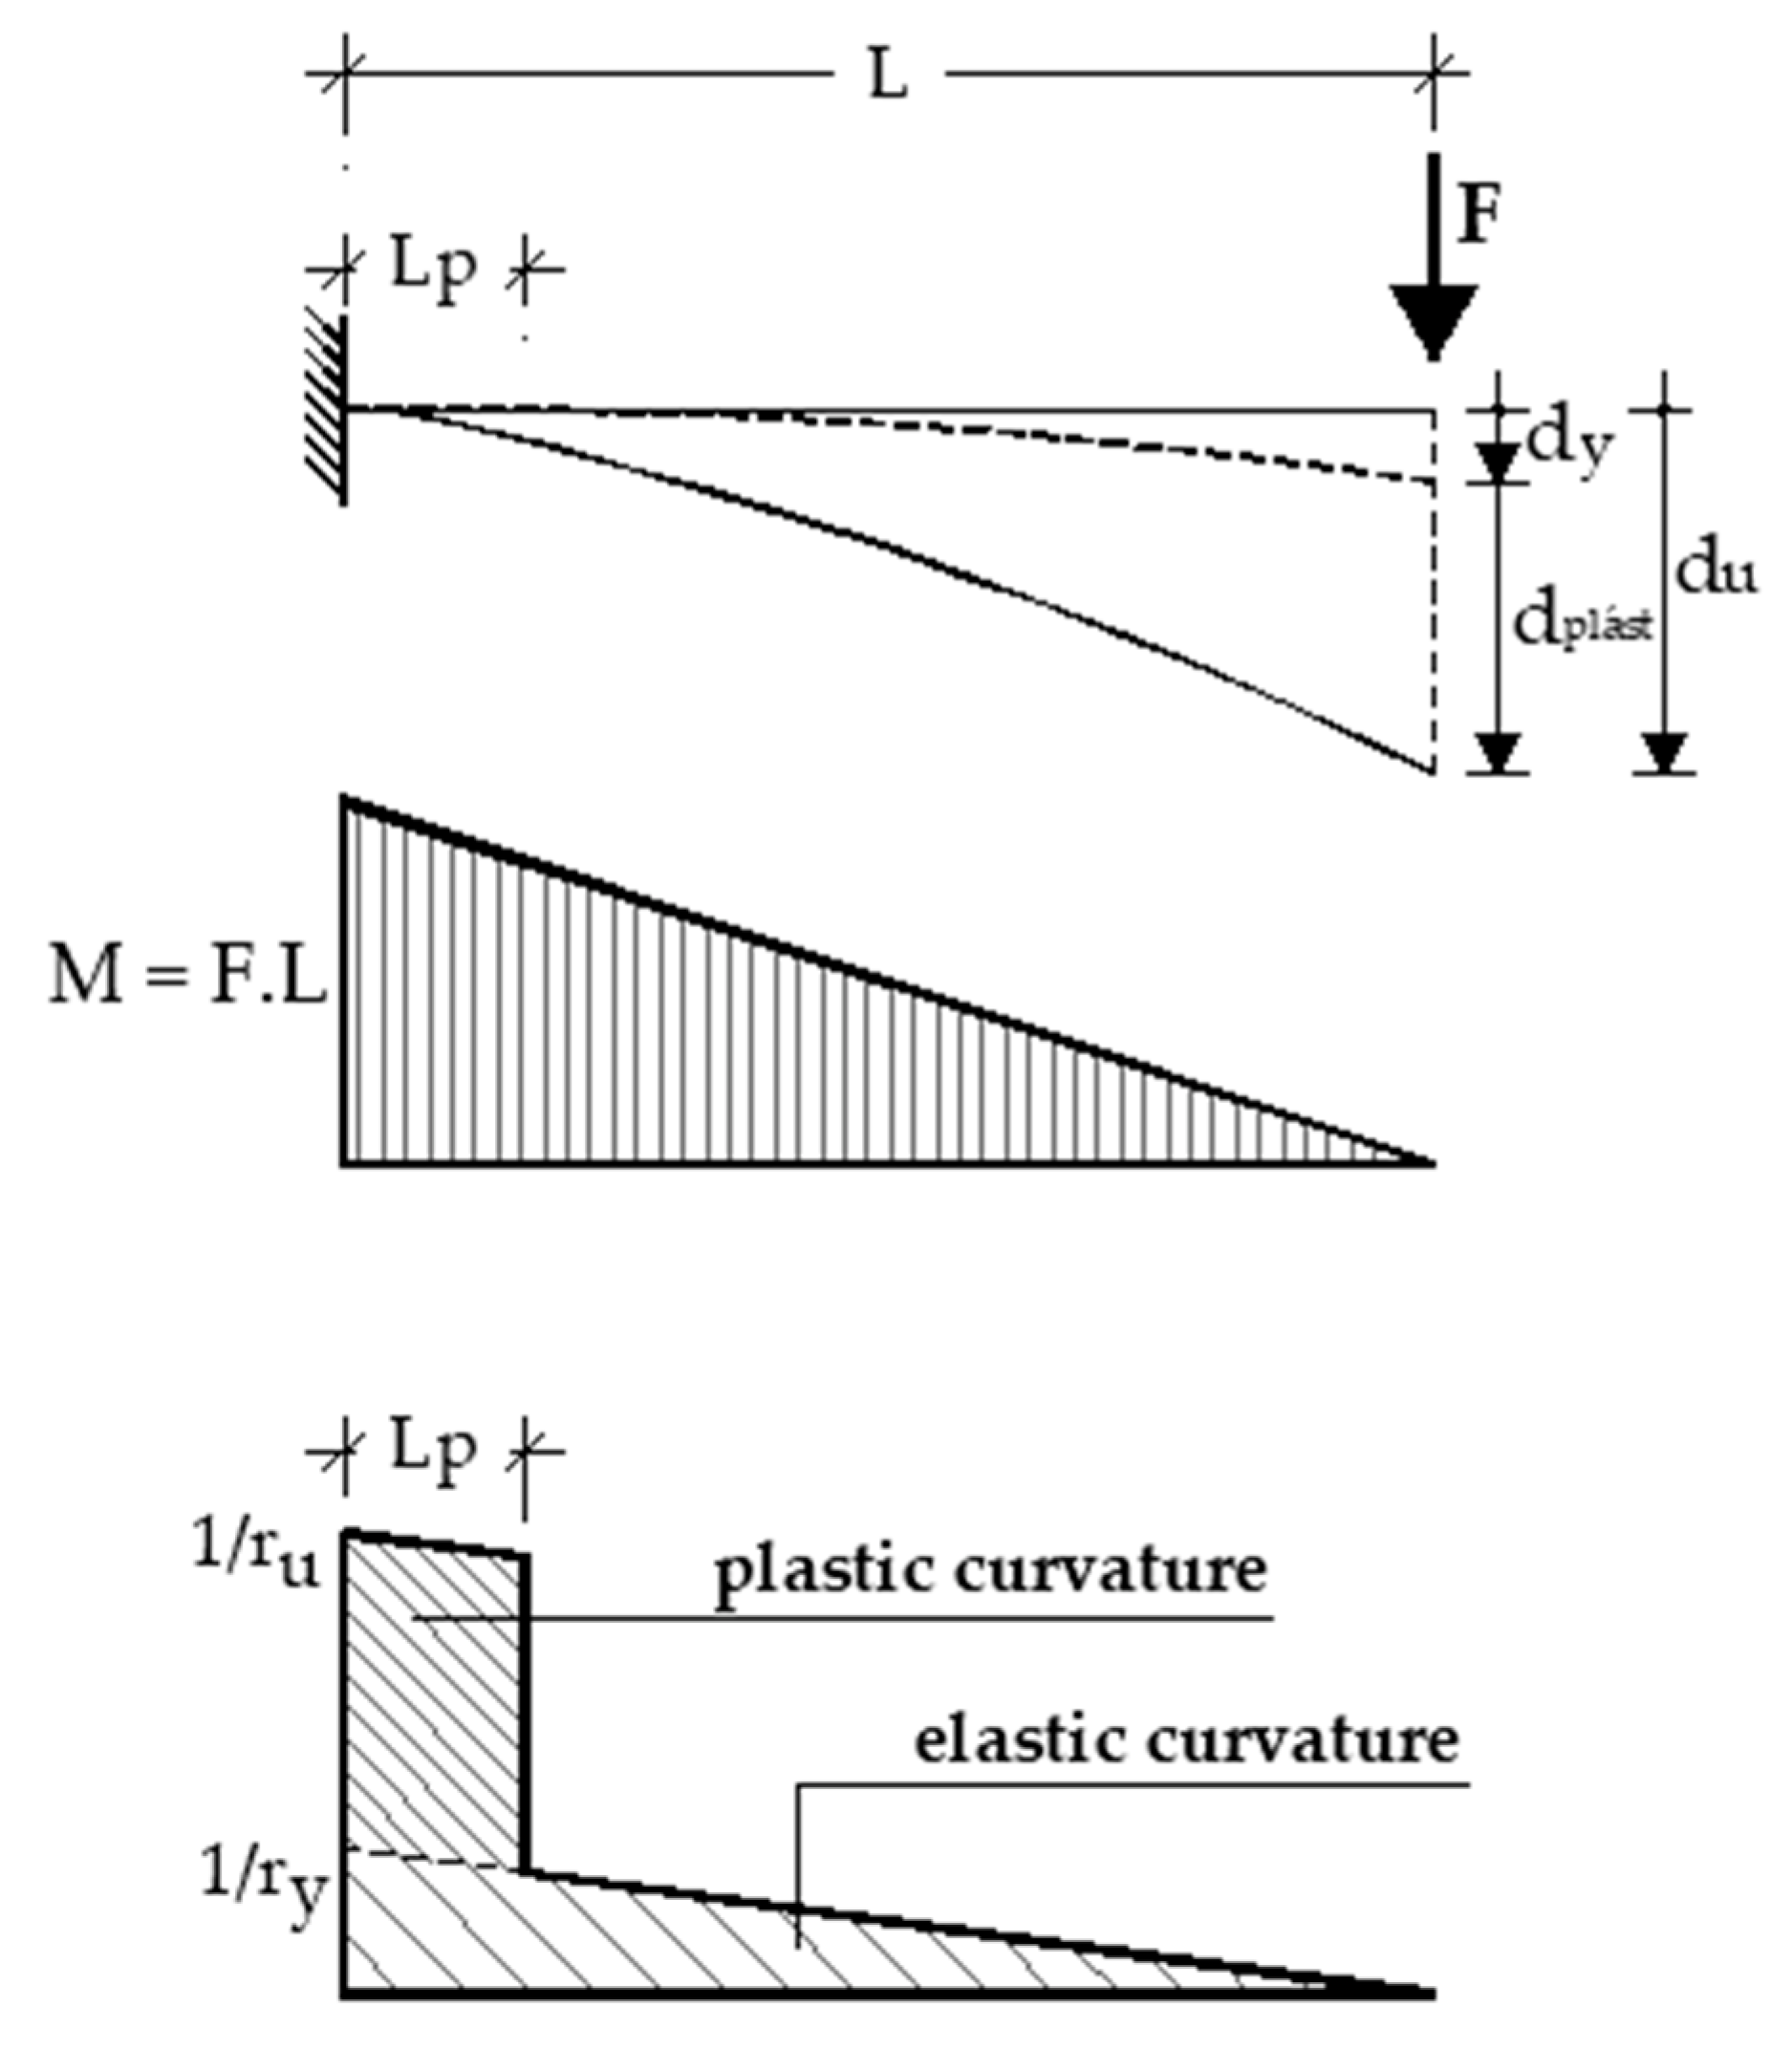
5.3. Determination of the Deformation Capacity

The ultimate deformation capacity, du, was obtained by noting that the beam element exhibits approximately a rigid body plastic rotation around the plastic hinge centre (Figure 18) starting from the idealised yielding displacement, dy*, which was estimated by assuming elastoplastic behaviour.
Considering the bilinear moment-curvature relation and constant plastic curvature along the plastic hinge length, the ultimate displacement, du, can be estimated using the Expressions (8)–(10) (Park and Paulay, 1975 [40]):
d u = d y * + d p l á s t
d y * = 1 3 · 1 r y · L 2
d p l á s t = 1 r u 1 r y · L p · L 0.5 · L p
where du—ultimate displacement;
Lp—plastic hinge length, considered equal to 0.5 h;
h—section height;
1/ru—ultimate curvature;
1/ry—yield curvature.
The yield curvature can be obtained through Expression (11), and the position of the neutral axis (x) is shown in Table 3.
1 r y = ε y d x
Failure is associated with excessive deformation and damage, exhibiting progressive degradation of the compressed zone, cover spalling, and reinforcement buckling. Thus, for estimative purposes, at failure, it was noted that the position of the neutral axis does not change significantly and the ultimate admissible strain of the longitudinal reinforcement (εsu) is 6% (Eurocode 8—part 3 [2]). The ultimate curvature can be obtained using Expression (12), and the position of the neutral axis (x) is shown in Table 5:
1 r u = ε s u d x
Table 5 shows the estimated values for the deformation capacity of the strengthened Specimens.
Experimentally, the reference Specimen (S1) exhibits an excessive level of deformation near failure (* in Table 5)—see Figure 8—greater than the estimated value (presented in Table 5). It should be noted that, during the experimental test, the level of strain in the longitudinal reinforcement exceeded the value used for design purposes (εsu = 6%), eventually, due to the damage accumulation phenomenon associated with the repetition of successive cycles. Thus, the ultimate deformation obtained from the proposed analytical model corresponds to a value consistent with the imposed criterion, recommended in Eurocode 8—part 3 [2], which corresponds to limiting the level of strain in the longitudinal reinforcement to 6%.
Nevertheless, for the strengthening solutions, the discrepancies between experimental and numeric rotation values are acceptable. A design criterion that limits the longitudinal reinforcement strain to 6% is shown to be adequate. In Table 5, a reduction in the plastic deformation from Specimen S2 to S3 can be observed, due to the presence of the additional UFRG jacketing.

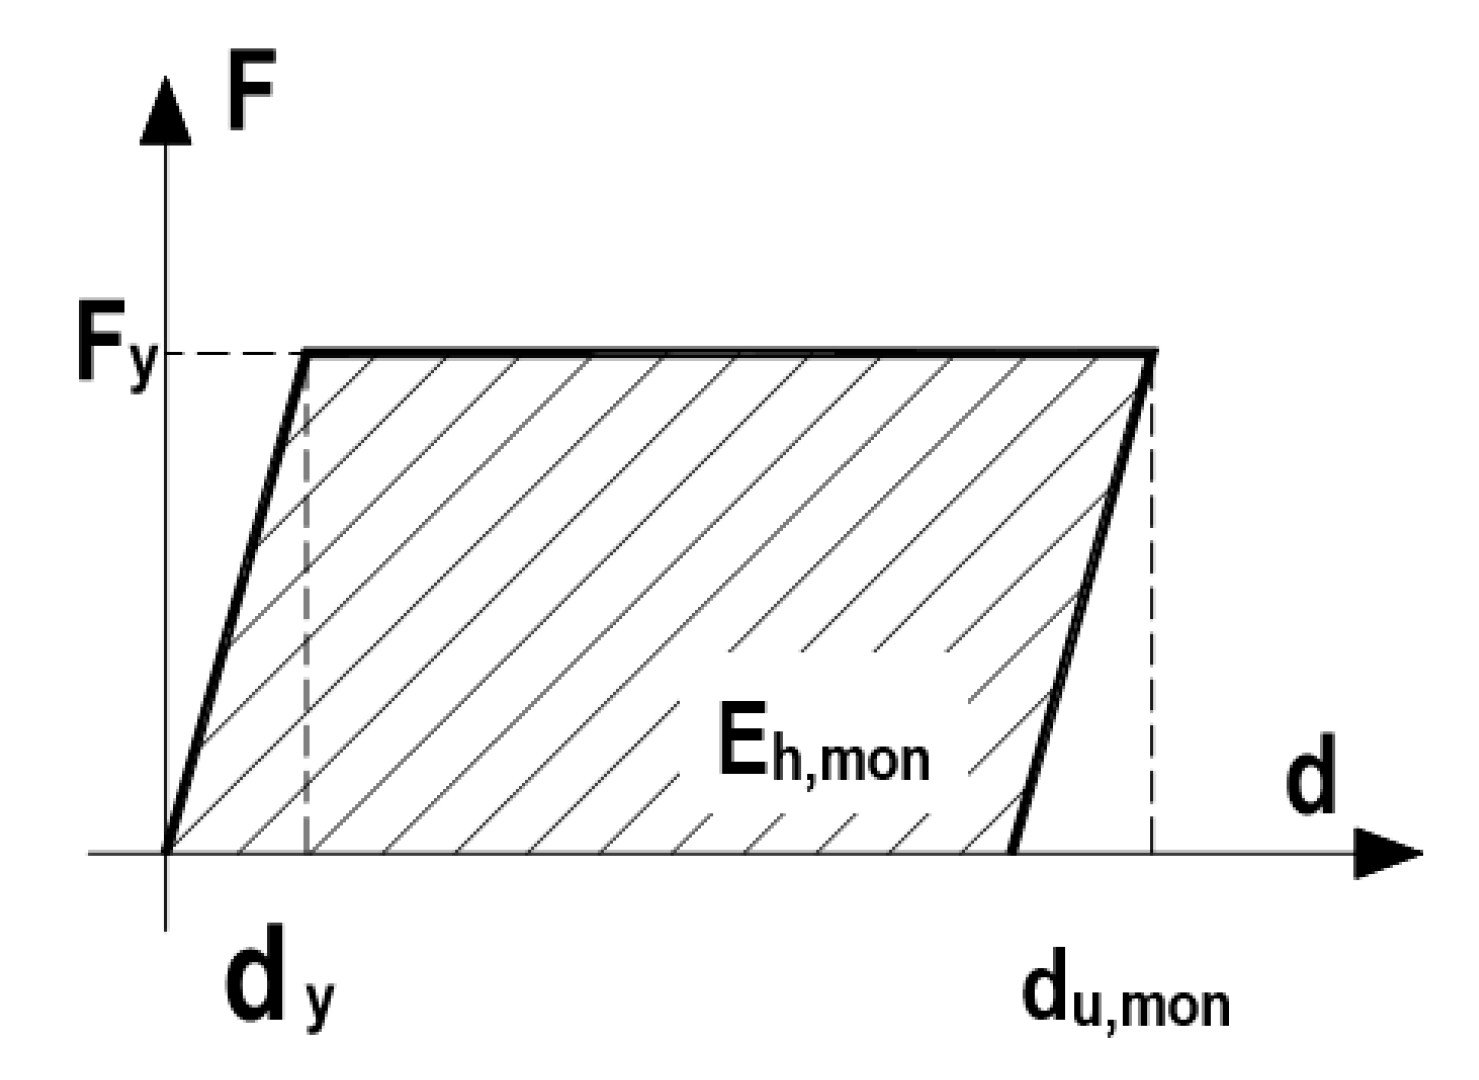
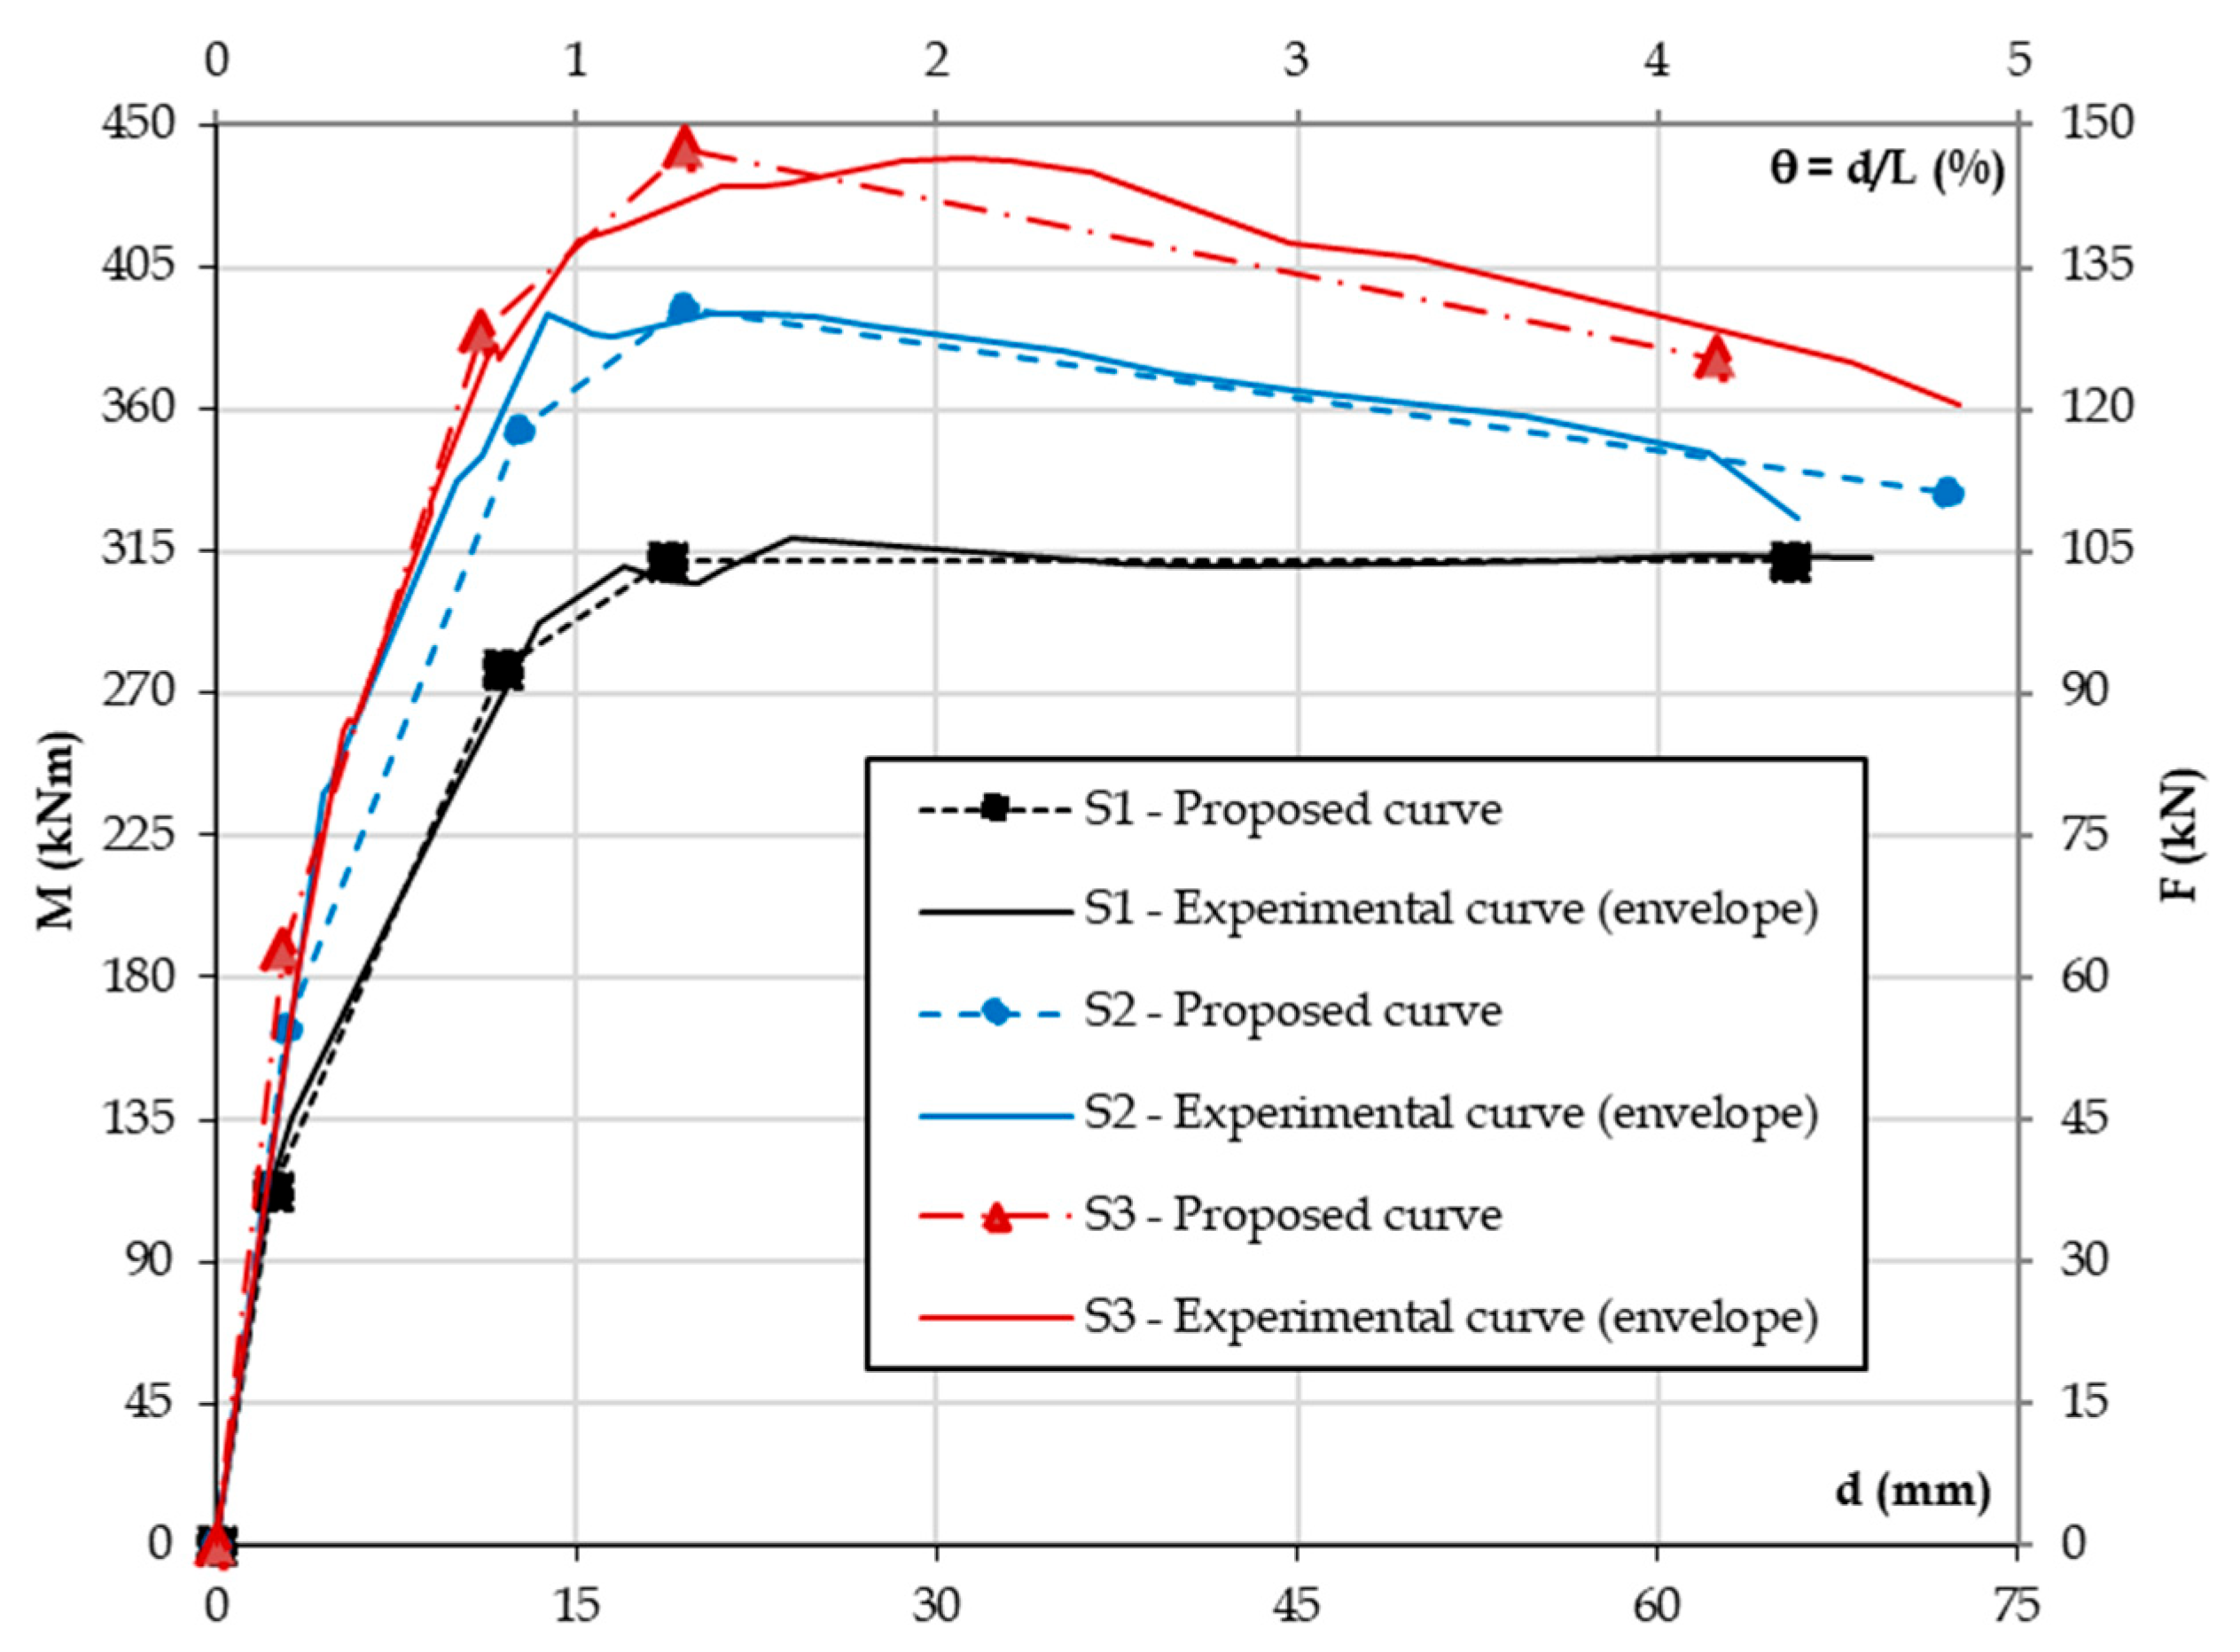
5.4. Proposed Multilinear Model

A multilinear force-displacement model, which describes a generic envelope response, is proposed—see Figure 19. The model assumes an initial elastic behaviour—branch I—established based on the idealised yielding displacement, dy* (see Section 5.3); this is followed by stiffness degradation mostly due to cracking—branch II—from the first crack point (A) to the yield point (B); hardening stiffness due to steel hardening—branch III—until the peak point (C), when the maximum force is attained; finally, a decreasing slope or one near zero due to the steel softening—branch IV—until the failure point (D) corresponds to a strength loss until the conventional failure criterion of 85% of the strength capacity is reached.
The proposed multilinear curve corresponds to a four-branch function which can be obtained through Expression (13):
F ( d ) = { K I · d d d c r F c r + K I I · ( d d c r ) d c r d d y F y + K III · ( d d y ) d y d d F max F max + K IV · ( d d F max ) d F max d d u
where KI—elastic stiffness ( K I = K e l = F y d y * , obtained considering a bilinear relation in Park and Paulay [41]—see Section 5.1 and Section 5.3);
Fcr—cracking force;
dcr—displacement corresponding to cracking force (dcr = Fcr/KI);
KII—cracked stiffness (KII = CII.KI);
Fy—yielding force (taken as F y = M y L , where L is the beam span and My is determined from Equation (6));
dy—displacement corresponding to yielding force (obtained from d y = d c r + F y F c r K I I ;
KIII—hardening stiffness (KIII = CIII.KI);
Fmax—maximum force (taken as F m a x = M m a x L , where L is the beam span and Mmax is determined obtained from Equation (7));
dFmax—displacement corresponding to maximum force (obtained from d F m a x = d y + F m a x F y K I I I ;
Fu—failure force (85% Fmax);
du—ultimate displacement (obtained from Equation (8));
KIV—softening stiffness (can be obtained from K I V = F m a x F u d F m a x d u .
The coefficients CII and CIII can be taken as 0.35 and 0.10, respectively, according to the experimental tests carried out.
Figure 20 shows the evaluation between the experimental envelope response and the proposed multilinear diagram for the reference (S1) and strengthened Specimens (S2 and S3). It can be concluded that the proposed model provides a reasonable approximation of the experimental response.

6. Conclusions

The present study focuses on the seismic strengthening selective approach of RC beams’ critical zones to improve the structural global response. In a selective approach, the strengthening strategy’s purpose should be previously defined. As the reference specimen exhibited an excessive deformation, associated with its excessively large drifts for an overall frame system’s behaviour, it was intended to attain an ultimate deformation reduction with the proposed strengthening solution. Thus, the objective was to reduce the residual deformation and to enhance the strength capacity. It should be mentioned that, in a structural frame system, the beam strength increase, by itself, may induce an inversion of the desirable failure mechanism, leading to the formation of hinges in the columns. As mentioned above, the study remained limited to the beam behaviour. Thus, it was acknowledged that in a real structure, if necessary, the columns would also be subject to a strengthening intervention to avoid an undesirable soft-storey failure mechanism.
Two strengthening solutions were designed, executed, and tested: unbonded PT tendon strengthening (S2), and unbonded post-tensioning with UFRG jacketing on the bottom and lateral faces of the beam (S3).
The strengthened beams showed a gradual strength increase of, approximately, 20% from Specimen S1 to S2 and from S2 to S3. Specimen S2 had an energy dissipation enhancement of nearly 50%, and S3’s was enhanced by 100%. The solution with UFRG jacketing presents a ductility exploitation that is similar in both directions. The residual deformation reduction in Specimens S2 and S3 was around 40% and 50%, respectively. Therefore, it can be concluded that the strengthening of the RC beam’s critical zone with external PT improves the elements’ hysteretic behaviour, exhibiting a higher energy dissipation capacity, higher strength capacity, and lower residual deformation. This strengthening solution presented a more recentred hysteretic behaviour.
The strengthening solution, along with the additional UFRG jacketing (S3) and external post-tensioned, allowed for the delay of the bottom concrete crushing and longitudinal reinforcement buckling. Therefore, this beam presents a more balanced response with a lesser extent of damage.
Finally, a theoretical analytical model is proposed to design and estimate the response of the strengthening solutions that provides a reasonable approximation of the experimental response. This model is a multilinear diagram that considers the stiffness degradation due to cracking (Branch II), hardening stiffness (branch III), and steel ductility (branch IV) up to the point of failure. The design criterion, which is based on the limitation of the longitudinal reinforcement strain, εsu, to 6% (the value proposed by Eurocode 8—part 3 [2]), is shown to be adequate.

Author Contributions

All the authors are responsible for the conceptualisation and methodology; R.G. collected the database and analysed the data; R.G., V.L. and C.C. discussed the results and the analytical model; all the authors contributed to writing the paper. All authors have read and agreed to the published version of the manuscript.

Funding

This research received no external funding.

Acknowledgments

The authors acknowledge the partial financial support from the FCT (Portuguese Foundation for Science and Technology) through the CERIS research centre (UIDB/04625/2020).

Conflicts of Interest

The authors declare no conflict of interest.

References

  1. Comité Européen du Béton-Fédération Internationale du Béton (CEB-FIB). Seismic Assessment and Retrofit of Reinforced Concrete Buildings, CEB-FIB Bulletin No. 24; State-of-art Report, Task Group 7.1: 2003; International Federation for Structural Concrete (fib): Lausanne, Switzerland, 2003. [Google Scholar]
  2. CEN EN 1998-3; Eurocode 8: Design of Structures for Earthquake Resistance—Part 3: Assessment and Retrofitting of Buildings. CEN: Brussels, Belgium, 2005.
  3. CEB Bulletin D’Information Nº. 220. Behaviour and Analysis of Reinforced Concrete Structures under Alternate Actions Inducing Inelastic Response; Volume 2: Frame Members; Comité Euro-Internacional du Béton (CEB): Lausanne, Switzerland, 1994.
  4. CEN EN 1998-1; Design of Structures for Earthquake Resistance—Part 1: General Rules, Seismic Actions and Rules for Buildings. CEN: Brussels, Belgium, 2004.
  5. Bracci, J.M.; Reinhorn, A.M.; Mander, J.B. Seismic Resistance of Reinforced Concrete Frame Structures Designed for Gravity Loads: Performance of Structural System. ACI Struct. J. 1995, 92, 597–609. [Google Scholar]
  6. El-Attar, A.G.; White, R.N.; Gergely, P. Behavior of Gravity Load Designed Reinforced Concrete Buildings Subjected to Earthquakes. ACI Struct. J. 1997, 94, 133–145. [Google Scholar]
  7. Calvi, G.M.; Magenes, G.; Pampanin, S. Experimental test on a three storey RC frame designed for gravity only. In Proceedings of the 12th European Conference of Earthquake Engineering, London, UK, 9–13 September 2002; p. 727. [Google Scholar]
  8. ECCS. Recommended Testing Procedure for Assessing the Behaviour of Structural Steel Elements under Cyclic Loads. Technical Working Group 1.3—Seismic Design, Nº 45; European Convention for Constructional Steelwork (ECCS): Brussels, Belgium, 1985. [Google Scholar]
  9. ACI T1.1-01; Acceptance Criteria for Moment Frames Based on Structural Testing. American Concrete Institute (ACI): Farmington Hills, MI, USA, 2001.
  10. Applied Technology Council. Guidelines for Seismic Testing of Components of Steel Structures; ATC Report Nº 24; Applied Technology Council: Redwood City, CA, USA, 1992. [Google Scholar]
  11. Gião, A.R.; Lúcio, V.; Chastre, C. Assessing the Behaviour of RC Beams subject to significant gravity loads under cyclic loads. Eng. Struct. 2014, 59, 512–521. [Google Scholar] [CrossRef]
  12. Priestley, M.J.N. Overview of the PRESSS Research Programme. PCI J. 1991, 36, 50–57. [Google Scholar] [CrossRef] [Green Version]
  13. Priestley, M.J.N. The PRESSS Program—Current Status and Proposed Plans for Phase III. PCI J. 1996, 41, 22–40. [Google Scholar] [CrossRef]
  14. Priestley, M.N.; Sritharan, S.; Conley, J.R.; Pampanin, S. Preliminary Results and Conclusions from the PRESSS Five Story Precast Concrete Test Building. PCI J. 1999, 44, 42–67. [Google Scholar] [CrossRef]
  15. Conley, J.; Sritharan, S.; Priestley, M.J.N. Precast seismic structural systems PRESSS-3: The Five-Story Precast Test Building. Vol. 3–5: Wall Direction Response. Final Report Submitted to the Precast/Prestressed Concrete Institute Department of Structural Engineering University of California, San Diego, La Jolla, California. 92093-0085. 2002. [Google Scholar]
  16. Nakaki, S.D.; Englekirk, R.E. PRESSS Industry Seismic Workshops: Concept Development. PCI J. 2014, 36, 54–61. [Google Scholar] [CrossRef]
  17. Pinho, R.; Elnashai, A.S. Repair and retrofitting of RC walls using selective techniques. J. Earthq. Eng. 1998, 2, 525–568. [Google Scholar]
  18. Pampanin, S. Controversial Aspects in Seismic Assessment and Retrofit of Structures in Modern Times: Understanding and Implementing Lessons from Ancient Heritage. Bull. New Zealand Soc. Earthq. Eng. 2006, 39, 120–133. [Google Scholar] [CrossRef] [Green Version]
  19. Ireland, M.G.; Pampanin, S.; Bull, D.K. Concept and Implementation of a Selective Weakening Approach for the Seismic Retrofit of R.C. Buildings; University of Canterbury, Civil Engineering: Christchurch, New Zealand, 2006; Volume 1, pp. 1–9. [Google Scholar]
  20. Pampanin, S. Emerging Solutions for High Seismic Performance of Precast Prestressed Concrete Buildings. J. Adv. Concr. 2005, 3, 207–223. [Google Scholar] [CrossRef] [Green Version]
  21. Kam, W.Y.; Pampanin, S.; Bull, D. Selective weakening retrofit for existing R.C. structures—Concept, validation and design example. In Proceedings of the 9th US National and 10th Canadian Conference on Earthquake Engineering: Reaching Beyond Borders, Toronto, ON, Canada, 25–29 July 2010; pp. 25–29. [Google Scholar]
  22. Kam, W.Y.; Pampanin, S. The seismic performance of RC buildings in the 22 February 2011 Christchurch earthquake. Struct. Concr. 2011, 12, 223–233. [Google Scholar] [CrossRef]
  23. Kam, W.Y.; Pampanin, S.; Elwood, K. Seismic performance of reinforced concrete buildings in the 22 February Christchurch (Lyttelton) earthquake. Bull. New Zealand Soc. Earthq. Eng. 2011, 44, 239–278. [Google Scholar] [CrossRef] [Green Version]
  24. Leon, R.T.; Kam, W.Y.; Pampanin, S. Performance of beam-column joints in 314 the 2010–2012 Christchurch earthquakes, Special Publication. Am. Concr. Inst. 2012, 296, 47–66. [Google Scholar]
  25. Dogan, E.; Krstulovic-Opara, N. Seismic retrofit with continuous slurry-infiltrated mat concrete jackets. ACI Struct. J. 2003, 100, 713–722. [Google Scholar]
  26. Fischer, G.; Li, V.C. Intrinsic Response Control of Moment-Resisting Frames Utilizing Advanced Composite Materials and Structural Elements. ACI Struct. J. 2003, 100, 166–176. [Google Scholar]
  27. Parra-Montesinos, G. High Performance Fibre Reinforced Cement Composites: An Alternative for Seismic Design of Structures. ACI Struct. J. 2005, 102, 668–675. [Google Scholar]
  28. Shannag, M.J.; Alhassan, M.A. Seismic Upgrade of Interior Beam-Column Subassemblages with High-Performance Fibre-Reinforced Concrete Jackets. ACI Struct. J. 2005, 102, 130–138. [Google Scholar]
  29. Shang, X.-Y.; Yu, J.-T.; Li, L.-Z.; Lu, Z.-D. Strengthening of RC Structures by Using Engineered Cementitious Composites: A Review. Sustainability 2019, 11, 3384. [Google Scholar] [CrossRef]
  30. Konstantinos, K.; Manos, G.; Papakonstantinou, C. Seismic Retrofit of R/C T-Beams with Steel Fiber Polymers under Cyclic Loading Conditions. Buildings 2019, 9, 101. [Google Scholar] [CrossRef] [Green Version]
  31. Chalioris, C.E.; Kosmidou, P.-M.K.; Karayannis, C.G. Cyclic Response of Steel Fiber Reinforced Concrete Slender Beams: An Experimental Study. Materials 2019, 12, 1398. [Google Scholar] [CrossRef] [Green Version]
  32. Chalioris, C.E.; Zapris, A.G.; Karayannis, C.G. U-Jacketing Applications of Fiber-Reinforced Polymers in Reinforced Concrete T-Beams against Shear—Tests and Design. Fibers 2020, 8, 13. [Google Scholar] [CrossRef] [Green Version]
  33. Kalogeropoulos, G.; Tsonos, A.-D. Seismic Performance Enhancement of RC Columns Using Thin High-Strength RC Jackets and CFRP Jackets. Fibers 2021, 9, 29. [Google Scholar] [CrossRef]
  34. Bencardino, F.; Nisticò, M. Evaluation of the Maximum Strain for Different Steel-FRCM Systems in RC Beams Strengthened in Flexure. Fibers 2022, 10, 67. [Google Scholar] [CrossRef]
  35. Fares, S.; Fugger, R.; De Santis, S.; de Felice, G. Strength, bond and durability of stainless-steel reinforced grout. Constr. Build. Mater. 2022, 322, 126465. [Google Scholar] [CrossRef]
  36. Muhaj, H. Seismic Strengthening of Reinforced Concrete Beams by Post-Tensioning with Anchorages by Bonding. Ph.D Thesis, Universidade Nova de Lisboa, Lisbon, Portugal, 2020. [Google Scholar]
  37. Gião, R.; Lúcio, V.; Chastre, C.; Brás, A. UFRG—Unidirectional Fibre Reinforced Grout as strengthening material for reinforced concrete structures. In Proceedings of the 8th RILEM International Symposium on Fibre Reinforced Concrete: Challenges and Opportunities-BEFIB, Guimarães, Portugal, 19–21 September 2012. [Google Scholar]
  38. Gião, A.R.; Lúcio, V.; Chastre, C. Characterisation of unidirectional fibre reinforced grout as a strengthening material for RC structures. Constr. Build. Mater. 2017, 137, 272–287. [Google Scholar] [CrossRef]
  39. Park, Y.J.; Ang, A.H. Mechanistic seismic damage model for reinforced concrete. J. Struct. Eng. ASCE 1985, 111, 722–739. [Google Scholar] [CrossRef]
  40. Cosenza, E.; Manfredi, G.; Ramasco, R. The Use of Damage Functionals in Earthquake-Resistant Design: A Comparison Among Different Procedures. Earthq. Eng. Struct. Dyn. 1993, 22, 855–868. [Google Scholar] [CrossRef]
  41. Park, R.; Paulay, T. Reinforced Concrete Structures; John Wiley & Sons: Hoboken, NJ, USA, 1975. [Google Scholar]
Figure 1. Specimen S1—geometry and reinforcement detail.
Buildings 13 00095 g001
Figure 2. Specimen S2—Strengthening solution with two unbonded post-tensioning strands.
Buildings 13 00095 g002
Figure 3. Specimen S3—UFRG jacketing and unbonded strand post-tensioning system.
Buildings 13 00095 g003
Figure 4. Execution of the UFRG jacketing. (a) Casting of the reinforced concrete beam; (b) Concrete surface prepared with water and sandblasting, and casting holes; (c) Application of the unidirectional and non-woven steel fibre mat; (d) Formwork setting for gravity casting with external vibration; (e) Specimen final aspect.
Buildings 13 00095 g004
Figure 5. Experimental test setup and post-tensioning system with the typical imposed displacement cycle in the test procedure.
Buildings 13 00095 g005
Figure 6. Specimens S1, S2, and S3 failure modes—lateral elevation.
Buildings 13 00095 g006
Figure 7. Specimens S1, S2, and S3 failure modes—bottom view of the beam’s critical zone.
Buildings 13 00095 g007
Figure 8. Specimen S1: (a) displacement history; (b) force-displacement hysteretic diagram.
Buildings 13 00095 g008
Figure 9. Specimen S2: (a) displacement history; (b) force-displacement hysteretic diagram.
Buildings 13 00095 g009
Figure 10. Specimen S3: (a) displacement history; (b) force-displacement hysteretic diagram.
Buildings 13 00095 g010
Figure 11. Diagram of post-tensioning force evolution versus imposed displacement: (a) Specimen S2 and (b) Specimen S3.
Buildings 13 00095 g011
Figure 13. Hysteretic and elastic strain dissipated energy in a cycle.
Buildings 13 00095 g013
Figure 14. Absorbed energy parameter for one cycle with and without gravity load.
Buildings 13 00095 g014
Figure 15. Absorbed energy parameter versus ductility for Specimens S1 (a), S2 (b), and S3 (c).
Buildings 13 00095 g015
Figure 17. Section force equilibrium vs the peak moment.
Buildings 13 00095 g017
Figure 18. Ultimate, yield and plastic deformation.
Buildings 13 00095 g018
Figure 19. Experimental envelope response (red) and proposed multilinear curve (black).
Buildings 13 00095 g019
Figure 20. Experimental envelope response and proposed multilinear diagram—Specimen S1, S2, and S3.
Buildings 13 00095 g020
Table 1. Description of the beam Specimens.
SpecimenDescriptionInitial Post-Tensioning Force (kN)UFRG Jacketing
S1Reference --
S2Strengthened with external PT300-
S3Strengthened with UFRG jacketing + external PT 30020 mm thickness
Table 2. Performance evaluation parameters.
DescriptionFmax (kN)Fmax/
FS1
Displacement DuctilityResidual
Deformation
Energy
Dissipation
µ (*)µ+ (*)dr (mm)dr/drS1W (kNm)W/WS1
S1Reference212.50-10.40-126.20-28.60-
S2PT260.101.227.702.4071.200.5643.801.53
S3PT + UFRG293.001.386.406.1058.700.4757.202.00
Note: (*) −negative moments direction (hogging)/+ positive moments direction (sagging).
Table 3. Estimated and experimental yield bending capacity.
x (m)εc (‰)My (kNm)My, exp (kNm)D (%)
S10.151.10277.80303.308
S20.181.50353.70375.306
S30.171.10384.60413.607
Table 4. Estimated and experimental peak bending capacity.
x (m)εS (%)Mmax (kNm)Mmax,exp (kNm)D (%)
S10.071.90311.70318.802
S20.101.20392.30390.20−1
S30.082.40425.00439.503
Table 5. Estimated and experimental yield and ultimate deformation capacity.
1/ry (m−1)1/ru (m−1)dy* (m)dplast (m)du (m)θ = d/L (%)θexp (%)
S10.00750.1550.0050.0600.0654.48.0 (*)
S20.00840.1710.0060.0660.0724.85.3
S30.00760.1480.0060.0570.0634.25.0
Disclaimer/Publisher’s Note: The statements, opinions and data contained in all publications are solely those of the individual author(s) and contributor(s) and not of MDPI and/or the editor(s). MDPI and/or the editor(s) disclaim responsibility for any injury to people or property resulting from any ideas, methods, instructions or products referred to in the content.

