Article

Feasibility of Planting Trees around Buildings as a Nature-Based Solution of Carbon Sequestration—An LCA Approach Using Two Case Studies

Department of Building, Civil, and Environmental Engineering, Concordia University, Montreal, QC H3G 1M8, Canada
*
Author to whom correspondence should be addressed.
Buildings 2023, 13(1), 41; https://doi.org/10.3390/buildings13010041
Submission received: 5 November 2022 / Revised: 7 December 2022 / Accepted: 16 December 2022 / Published: 24 December 2022
(This article belongs to the Section Building Energy, Physics, Environment, and Systems)

Abstract

:
In response to Canada’s commitment to reducing greenhouse gas emissions and to making pathways to achieve carbon neutral buildings, this paper presents two real case studies. The paper first outlines the potential of trees to absorb CO2 emissions through photosynthesis, and the methods used for the estimation of their annual carbon sequestration rates. The net annual carbon sequestration rate of 0.575 kgCO2eq/m2 of tree cover area is considered in our study. Then, this paper presents the carbon life cycle assessment of an all-electric laboratory at Concordia University and of a single-detached house, both located in Montreal. The life cycle assessment (LCA) calculations were performed using two software tools, One Click LCA and Athena Impact Estimator for Buildings. The results in terms of Global Warming Potential (GWP) over 60 years for the laboratory were found to be 83,521 kgCO2eq using One Click LCA, and 82,666 kgCO2eq using Athena. For the single-detached house that uses natural gas for space heating and domestic hot water, the GWP was found to be 544,907 kgCO2eq using One Click LCA, and 566,856 kgCO2eq using Athena. For the all-electric laboratory, a garden fully covered with representative urban trees could offset around 17% of the total life cycle carbon emissions. For the natural gas-powered single-detached house, the sequestration by trees is around 3% of the total life cycle carbon emission. This paper presents limits for achieving carbon neutral buildings when only the emissions sequestration by trees is applied, and discusses the main findings regarding LCA calculations under different scenarios.

1. Introduction

It is unequivocal that human activities have contributed to the warming of our planet [1]. Extreme climate events are becoming more frequent, more intense, and longer lasting all over the world [2]. There are warning signs in every continent, showing unprecedented and irrefutable evidence that our climate is rapidly changing [1].
The Spanish Institute of Health Carlos III (ISCIII) has estimated that there have been 510 deaths attributable to high temperatures within one week in July 2022, during another recent record-breaking heat wave [3]. With temperatures above 43 °C, ‘Zoe’ became the world’s first heat wave to be officially named by the Seville’s new program for the monitoring and ranking of extreme heat waves [4]. The same kind of event was experienced by British Columbia, Canada, in late June 2021, leading to 619 heat-related deaths [5].
In February 2022, multiple floods and landslides ravaged the city of Petropolis, Rio de Janeiro, Brazil, when a heavy rainfall reached 260 mm in less than 3 h, killing 233 people and leaving a track of destruction all over the city [6]. A similar disaster has also occurred in China’s Henan Province, in July 2021. The province’s capital, Zhengzhou, recorded a 201.9-mm rainfall within an hour, resulting in floods that submerged entire neighborhoods, trapped passengers in subway cars, caused landslides, and overwhelmed dams and rivers [7].
Unless society works together to deeply reduce greenhouse gas (GHG) emissions in the coming decades, global warming of 1.5 °C and 2 °C above pre-industrial levels will be exceeded well before the end of the 21st century [1], intensifying not only climate events, but also social/migratory issues, as some places might become uninhabitable. In this alarming context, the construction industry can play a critical role in achieving GHG emissions reductions. Currently, buildings are responsible for 39% of global energy-related GHG emissions, with 11% due to materials and construction processes (embodied emissions), and 28% due to operational emissions, which include heating, cooling, and general energy use of buildings [8].
Among the multiple environmental impacts brought about by buildings, energy consumption has always been one of the major concerns [9]. This led many countries to implement new standards for Net-Zero Energy Buildings [10,11], and boosted the development of different certificate programs addressing energy efficiency performance (e.g., Energy Star, LEED).
However, the design and assessment of Net-Zero Energy Buildings (ZEB) commonly focus exclusively on the operational phase, ignoring the environmental impacts of embodied emissions in materials and equipment over the building life cycle [12]. Therefore, a new awareness on accounting for whole building life cycle carbon emissions has refocused the construction industry on developing Net-Zero Carbon Buildings (ZCB) [13], also referred to as carbon neutral buildings.
A Net-Zero Carbon Building is a highly efficient building, operated using 100% fossil-free renewable energy [14], that is designed following best practice sustainable construction [15]. The term ‘best practice sustainable construction’ stands for a number of strategies to reduce carbon emissions in buildings, such as promoting energy savings and the wellbeing of occupants through passive design, maximizing the use of recycled and nature-based materials, minimizing energy use in all stages of a building’s life cycle, and also creating new green spaces [16]
At the city level, becoming ‘net-zero’ means exerting zero impact on the environment. Cities like Montréal, New York City, Paris, and Toronto have developed climate and environmental action plans, such as creating parks and planting trees to recover GHG-absorbing potentials formerly destructed by the built environment [17].
Aligned with commitments set by the Paris Agreement in 2015, this study aims to contribute to the efforts for achieving carbon neutral buildings, by establishing a framework to evaluate the feasibility of using urban trees around buildings as a way to sequestrate carbon emissions and mitigate part of its life cycle embodied and operational emissions. To demonstrate this approach, the life cycle assessment (LCA) of two real case studies in Montreal were performed using two LCA software tools specific to the environmental impact assessment of buildings.

2. Literature Review

2.1. Keyword Search in Databases

Relevant publications were selected if they contained information on:
  • Real case studies, with details about design solutions, materials, energy consumption, and energy sources;
  • Results about life cycle carbon balance, based on LCA calculations;
  • Methods, software tools, and databases used for the assessment of carbon emission;
  • The carbon sequestration potential of vegetation applied to the building context;
  • The estimation of annual carbon sequestration rates of trees and vegetation.
The main research databases used in the literature review were Scopus and Elsevier Engineering Village, which has Compendex, Inspec, and GEOBASE subsets, covering all engineering disciplines. Although most publications were selected in the period 2010–2022, some previous studies with relevant information were also included. The following keywords and terms were used:
Carbon neutral building AND case study; Zero carbon buildings AND case study; Life cycle assessment AND embodied emissions AND operational emissions; Carbon neutral buildings AND carbon sequestration; Carbon sequestration AND vegetation AND buildings; Carbon sequestration AND trees AND buildings; Life cycle assessment AND green roofs.
Since previous studies have not addressed some key issues, the current paper contributes two items to the discussion about carbon neutral buildings:
  • An assessment of the positive impacts of planting urban trees near buildings as a nature-based solution to offset buildings’ life cycle embodied and operational GHG emissions, by considering direct carbon sequestration potential;
  • A discussion of the quality and completeness of whole building life cycle carbon analysis, with applications for real case studies.

2.2. Low-Carbon Design and Vegetation

Progress has been made towards designing and constructing carbon neutral buildings, but there is still no consensus either on their practical large-scale application for achieving carbon neutrality, or on the reliability of available tools for estimating a building’s life cycle carbon emissions. Pomponi and Moncaster [18] reported that most of life cycle assessment (LCA) studies are cradle-to-gate analyses, which disregard what happens with the materials after they leave the manufacturing plants. Some LCA case studies reported only structural and envelope materials in calculations [19,20] neglecting the environmental impacts related to the manufacturing of building components such as mechanical systems, photovoltaic (PV) panels, and internal partitions, which have high embodied energy and carbon emissions.
Most of the reviewed papers considered the on-site PV electricity production as the main strategy to balance carbon emissions and reach carbon neutrality [19,21,22]. This approach might be consistent for those places where the grid-purchased electricity is not generated by renewables sources (e.g., the province of Alberta, Canada, where 90% of all electricity production is based on natural gas and coal burning [23]. However, for places like Quebec, Canada, where the energy grid profile is based on hydropower [24], the positive impacts of the PVs do not have the same potentials. Thus, it seems that if society achieves a zero-carbon grid in the future, the on-site electricity generated by PVs will no longer represent an avoided emission when calculating a building’s life cycle carbon balance [13].
Some projects have been integrating green areas and trees to the design as a way to improve user comfort [25,26,27]. When planted near buildings, trees can indirectly mitigate carbon emissions by moderating the local microclimate, reducing the required amount of energy related to space-cooling in the summer, as well as protecting buildings from strong winds, reducing air infiltration rates and heating loads in winter [28,29]. As shown by Botallico et al. [30], the urban green infrastructure can contribute to improving urban air quality by abating ozone (O3) and particulate matter (PM10), which are highly detrimental pollutants to human health. Furthermore, the development and conservation of urban forests can also contribute to public well-being by reducing noise pollution, and creating a desired soundscape, stimulating for example the pleasantness of perceived birdsongs, as presented in studies by Hong et al. [31].
However, there is only a small number of papers [32,33] applying the direct carbon sequestration potential of greeneries among the strategies to abate part of a building’s life cycle CO2eq emissions. Liu [34] studied a low-carbon dwelling built on Kinmen, Taiwan, and reported a total CO2eq reduction of 416.5 kg/year provided by a garden with 481 m2 of lawn and 16 units of 20-year-old urban trees (240.5 kg/year from lawn and 176 kg/year from trees). The author based her estimations on studies from Lin et al. [35] and Lin et al. [36] which considered the carbon sequestration rates applicable for a period of 40 years; Kuittinen et al. [33] assessed the life cycle carbon emissions of different buildings in Finland, and found that the carbon sequestered in the biomass of shrubs and trees could mitigate around 12% of the total emissions related to a single-detached house. Their approach was based on data from literature, but also included basic field samples, in order to identify the different species of vegetation.
Some papers assessing the annual carbon sequestration rates of particular types of vegetation used in green roofs, living walls, and urban gardens were found in literature for different countries [32,37,38,39,40,41,42,43]. However, these studies do not provide an assessment of the share of the contribution of greeneries in relation to the total life cycle GHG emissions of a case study building, which is the objective of the current paper.
For instance, Heusinger and Weber [37] measured the CO2 surface–atmosphere exchange of an unirrigated, extensive green roof composed of sedum species and herbaceous plants over a full annual cycle. They found that the 9 cm-depth green roof was able to sequestrate 0.313 kgCO2eq/m2 per year. Getter et al. [42] conducted a two-year study on an extensive green roof composed of four different sedum species with a substrate depth of 6 cm. The results after two years showed that the entire system sequestered 1.37 kgCO2eq/m2, compared with the initial conditions. Luo et al. [32] assessed the carbon sequestration potential of different irrigated green roofs using a mixed-sewage-sludge substrate (MSSS) over a year. The best configuration in their study was found with a 25 cm-depth MSSS with Ligustrum vicary vegetation that resulted in an annual carbon sequestration of 25.8 kgCO2eq/m2. This high rate of carbon sequestration is due to soil treatment and greater substrate depth. Seyedabadi et al. [39] implemented a green roof on a four-story building and assessed the performance of different plants in a cold and dry climate by measuring the plant’s dry weight biomass increase over one year. They found that the annual carbon sequestration rates ranged from 0.513 kgCO2eq/m2 to 7.59 kgCO2eq/m2 of green roof area. Additionally, they estimated through an energy simulation that the green roof could indirectly mitigate up to 28.16 kgCO2eq/m2year as a result of an 8.5% reduction of energy consumption.
However, all these measurements were based on short-time observations, for green roofs aging from 1 to 6 years. After the green roof’s vegetation has reached a grown stage, it is very likely that the direct amount of carbon taken in by photosynthesis will just balance out the amount of carbon emitted by the decay of plant material [44].
Different from trees that keep growing for decades, the long-term direct carbon sequestration performance of green roofs is still uncertain [45]. In urban areas, trees are stimulated by the increased concentration of CO2, which provides a fertilizing effect, rendering a more efficient carbon sequestration potential [46]. Therefore, it seems that urban trees can provide a more reliable and longer-lasting contribution to the achievement of carbon neutral buildings.

2.3. Life Cycle Assessment in Canadian Context

Despite the credibility of many available certifications worldwide, and all the efforts from different Green Building Councils on providing standards and design guides for sustainable constructions, there are still some gaps on their approach regarding the scope of LCA calculations. The most recent version of the Design Standard for Zero Carbon Building (v.03), released by the Canadian Green Building Council in June 2022, only requires for carbon emissions assessment related to structure materials, and envelope and operational energy use [14]. As a result, important building elements such as internal partitions, finishes, and mechanical/electrical equipment (e.g., HVAC, PV system) have been excluded from the LCA analysis in several of LEED- and ZCB-Performance-certified projects. This limitation can lead to an underestimation of 19% to 34% of a project’s material-related embodied CO2 emissions, depending on the type of building [47].
Moreover, the environmental impact assessment of a building can be very sensitive to the assumptions and limitations related to the LCA tool considered for calculations. In North America, Athena Impact Estimator for Buildings and One Click LCA are commonly used softwares, with regionalized inventory databases for USA and Canada.
Both tools are compliant with ISO 14044 [48]/ISO 14040 [49] and EN 15978 [50]/EN 15804 [51] standards, and both provide a cradle-to-grave LCA of a building, as presented in Table 1.
The main difference is the list of materials available in each software. Athena has a concise inventory, based on common local practice. One Click LCA has a more comprehensive database, including generic and manufacturer-specific material options, based on Environmental Product Declarations (EPDs). The calculations performed by these tools include (i) embodied emissions related to raw material extraction, manufacturing, transportation, use, replacements and disposal, and (ii) operational emissions related to the use of local grid-purchased energy. The benefits beyond a building’s life (referred to as ‘module D’ on life cycle stages) related to the positive impacts of biogenic carbon stored in wood products is not mandatory in cradle-to-grave approaches according to EN 15978 [50], and therefore it is presented separately from other stages.
Athena’s inventory database does not provide options for HVAC and PVs, which are items that carry high embodied impacts. For that reason, when necessary, we incorporated One Click’s results for those elements into Athena’s results.

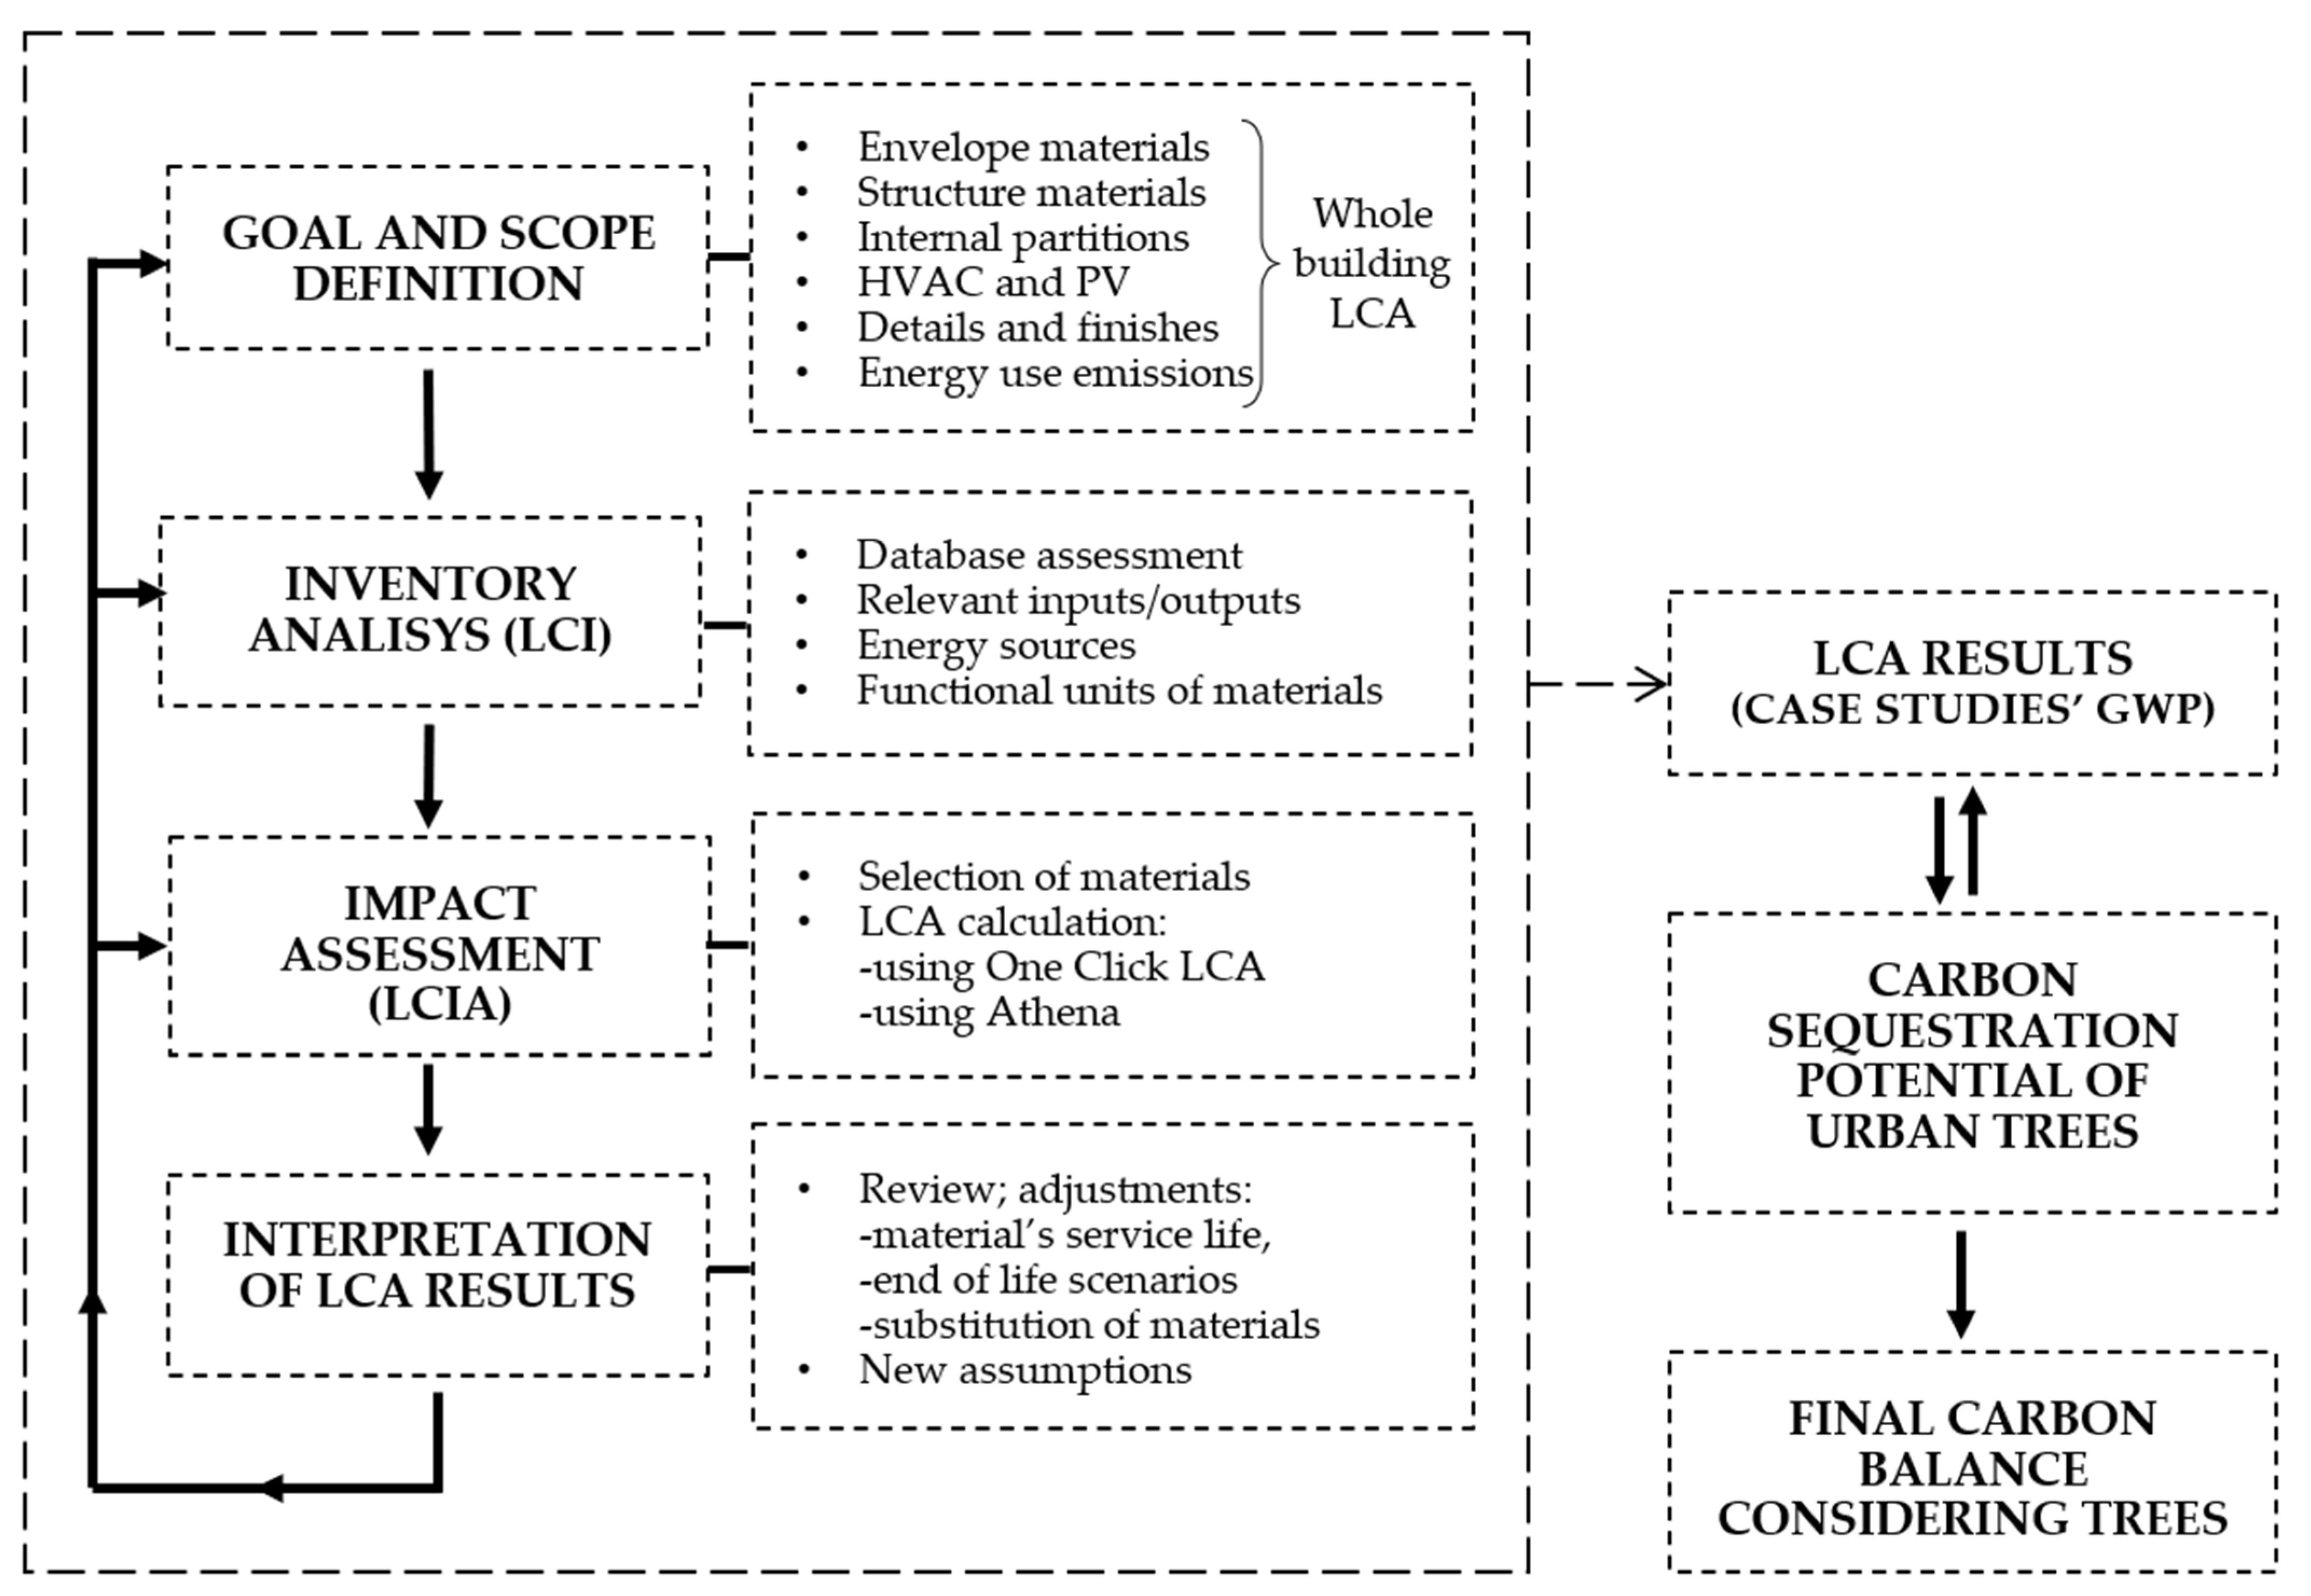
3. Materials and Methods

3.1. Overview

This paper focuses on the feasibility of planting urban trees around buildings as a nature-based solution to mitigate part of the life cycle carbon emissions related to two real case studies located in Montreal. The environmental impacts (i.e., Global Warming Potential, GWP) of each case study was quantified using two LCA tools commonly used for buildings in North America, One Click LCA (v.0.5.2) and Athena Impact Estimator for Buildings (v.5.4). The carbon sequestration rate of standardized urban trees was estimated based on the studies of Nowak et al. [53,54,55] for USA, and Pasher et al. [52] for Canada. The GWP results related to each case study are presented for different scenarios, before and after considering the direct carbon sequestration potential from urban trees.
Indirect benefits of vegetation (e.g., energy savings) and scenarios including other greeneries (e.g., green roofs, living walls) were out of the main scope of the current work.
To demonstrate this approach, we performed the carbon LCA of two real buildings in Montreal: a recently constructed research facility at Concordia University, the Future Buildings Laboratory (FBL); and a single-detached house, not energy efficient, built in 1967. The selection of materials in each software was carefully made to best represent the case studies’ design specifications, using only locally regionalized data for Canada. A time horizon of 60 years was assumed in LCA calculations, since this is the lifespan considered as the benchmark in EN 15978 [50], which is one of the standards followed by both software tools. The results provided by each software were compared in terms of life cycle environmental impacts, as well as their background assumptions, calculations, and inventory limitations.
Once the GWP was estimated for both case studies, we presented the total amount of carbon that could be removed if each case study had their garden area fully covered by representative units of urban trees (410 m2 garden at FBL, and 505 m2 at the single-detached house). The passive (indirect) effects related to vegetation on moderating local microclimate (by reducing air infiltration, reflecting heat, providing shading, and therefore reducing energy consumption), and other types of greeneries were out of the scope of this paper.
Figure 1 shows the framework developed for this paper, starting with the life cycle assessment of the case studies (resulting in GWP values), followed by the application of carbon sequestration potential of urban trees, leading to a net final carbon balance.

3.2. Estimation of Building’s Environmental Impacts

The impact assessment started with the list of materials for each case study, according to their respective design specifications. This list, organized by building assembly, was mapped within the LCA software where each designed material was linked to an inventory data point. When necessary, information about thickness, density, and other material properties was also provided. The second input was the annual energy consumption, that was estimated by energy simulation. The GWP results, expressed in kgCO2eq, are presented for each life-cycle stage, considering a 60-year calculation period.

3.3. Carbon Sequestration Potential of Urban Trees

This section presents an overview of the estimation of annual carbon sequestration rates of urban trees by Nowak et al. [53,54,55] for USA context, and adapted by Pasher et al. [52] to the Canadian climate. These papers include items such as countrywide conditions, size and types of urban trees, as concluded into a unique value of annual potential carbon sequestration rate per unit of tree cover area (kgC/m2TC.year). This procedure is followed to estimate the carbon sequestration potential of the garden areas of the two case studies (410 m2 for FBL, and 505 m2 for single-detached house), and quantify the maximum offset of the corresponding life cycle emissions.
In the USA context, Nowak et al. [55] provided field data collection, high resolution photointerpretation, and computer models to determine the country’s urban forest structure. Twenty-eight cities in six different states were randomly sampled in plots of 0.04 and 0.067 ha, and each tree inside the sampled boundary was analyzed in terms of species, stem diameter at 1.37 m above the ground (DBH), tree cover area, tree height, crown height, crown width, light exposure, leaf area, and crown’s general state of life. The tree dry weight biomass for each measured tree (with a minimum size of 2.54 cm diameter at DBH) was calculated using different allometric equations from literature [56,57,58,59], as shown by Equations (1) and (2):
Y = a × ( DBH ) b
Y = Exp ( a + ( b ln DBH ) )
where Y is the tree biomass (kg dry weight), a and b are regression factors varying with the species and dependent on tree height and age, and DBH is the stem diameter at 1.37 m above the ground. Equations predicting only the aboveground biomass were converted to whole tree biomass based on a root-to-shoot ratio of 0.26 [60]. Carbon accounts for approximately 50% of whole tree dry weight biomass [61].
Once the total biomass of each sampled area was calculated, the next step was to estimate how much this biomass would increase in one year. To do that, measured growth rates for street, park, and forest trees from Frelich [62], De Vries [63], and Smith and Shifley [64] were standardized to the length of growing season for each sample location, based on Equation (3):
SG = measured   growth   rate   × 153   ( days   of   growing   season   of   sample     s   location )  
where SG is the standardized growth rate (cm per year) at the DBH, and 153 days is the minimum length of the growing season (frost-free days) from the measured data—and therefore it was used as the reference length [55]. This calculation is made for different species and different growing locations (street, park, forest). For different species of street trees, the average SG was equal to 0.83 cm/year [54].
Then, standardized growth rates (SG) of trees of the same species were compared to determine the average difference between standardized growth rates for street trees (0.83 cm/year) and standardized growth for park and forest trees. The difference between a ‘street’ tree from a ‘park’ or ‘forest’ tree is related to the number of sides/top exposed to sunlight: 0–1 sides/top to represent forest growth condition, 2–3 sides/top to represent park tree, 4–5 sides/top to represent street tree. This information is used to calculate the local base growth rates (BG), which is defined in Equation (4):
BG = { S G ÷ 2.29   F o r e s t   t r e e s S G ÷ 1.78 P a r k   t r e e s S G   ÷ 1.00 S t r e e t   t r e e s
The local base growth rate (BG) is adjusted with Equation (5), according to the trees’ state of life condition (which takes into account the color of leaves and other appearance/disease factors) in order to determine the final growth rate. Base growth (BG) rates were multiplied by 1 (no adjustment) for trees in fair to excellent conditions, representing no dieback. For trees in poor conditions, base growth rates were multiplied by 0.62 (26–50% dieback); trees in critical conditions by 0.37 (51–75% dieback); dying trees by 0.13 (76–99% dieback); and dead trees by 0 (100% dieback) [54].
BG adjusted = { BG × 1.00   fair   to   excellent   conditions   ( no   adjustment ) BG × 0.62   trees   in   poor   conditions   ( 26   to   50 %   dieback ) BG × 0.37   trees   in   critical   conditions   ( 51   to   75 %   dieback ) BG × 0.13   trees   in   daying   conditions   ( 79   to   99 %   dieback ) BG × 0.00   for   those   trees   that   are   dead   ( 100 %   dieback )
It is important to point out that SG, local BG, and adjusted local BG are related to growth rates (size increase of tree DBH from year (x) to year (x+1), in centimeters). After estimating the final base growth rates of each tree within each sampled area, it is possible to calculate the increase of biomass from year (x) to year (x+1) for each tree sampled, by using again the biomass equations aforementioned. In a sample level, total biomass of year (x+1) minus total biomass of year (x) is equal to gross annual biomass increase in the sample [55].
Gross annual increase of biomass is translated to carbon contents, and represents the annual carbon that was sequestrated in each sampled area over one year. The samples’ total variation of carbon is divided by the total samples’ tree cover area, estimated using photo-interpretation and i-Tree methodology (www.itreetools.org/, accessed on 13 August 2022), in order to provide the average gross sequestration rate in units of kgC/m2 of tree cover per year.
Once this procedure was applied for all sampled trees, the overall average annual value for USA gross carbon sequestration rate was found to be 0.277 kgC/m2 of tree cover, and for net sequestration, 0.205 kgC/m2 of tree cover. The net sequestration rate considers the dieback of trees, which incurs GHG emissions due to decomposition of organic matter. Therefore, net sequestration rate averages 74% of the gross sequestration rate [55]. To convert a quantity of carbon (C) into an equivalent quantity of carbon dioxide (CO2), we multiplied the values of C by 3.67, which represents the ratio of the atomic mass of a CO2 molecule to the atomic mass of a C atom (44:12) [65]. The converted values for USA gross and net CO2 sequestration are 1.015 kgCO2eq/m2TC year and 0.751 kgCO2eq/m2TC year, respectively.
While a Canadian specific standardized growth rate did not exist, Pasher et al. [52] assumed that information derived from USA datasets was consistent for Canadian cities, as long as the average value of annual gross carbon sequestration from Nowak (0.277 kgC/m2TC) was adjusted for a shorter length of growing season in Canada (133 frost-free days). As a result, the annual gross carbon sequestration rate of Canadian urban trees is equal to 0.212 kg C/m2TC. To calculate net sequestration rates, Pasher et al. [52] also considered the 74% of gross carbon sequestration from Nowak’s works, which resulted in 0.156 kg C/m2TC year. In terms of CO2eq, the converted values are 0.777 kgCO2eq/m2TC year for gross sequestration and 0.575 kgCO2eq /m2TC per year for net sequestration.
In conclusion, a net carbon sequestration potential of 0.575 kgCO2eq/m2 of tree cover area per year is used in this paper.

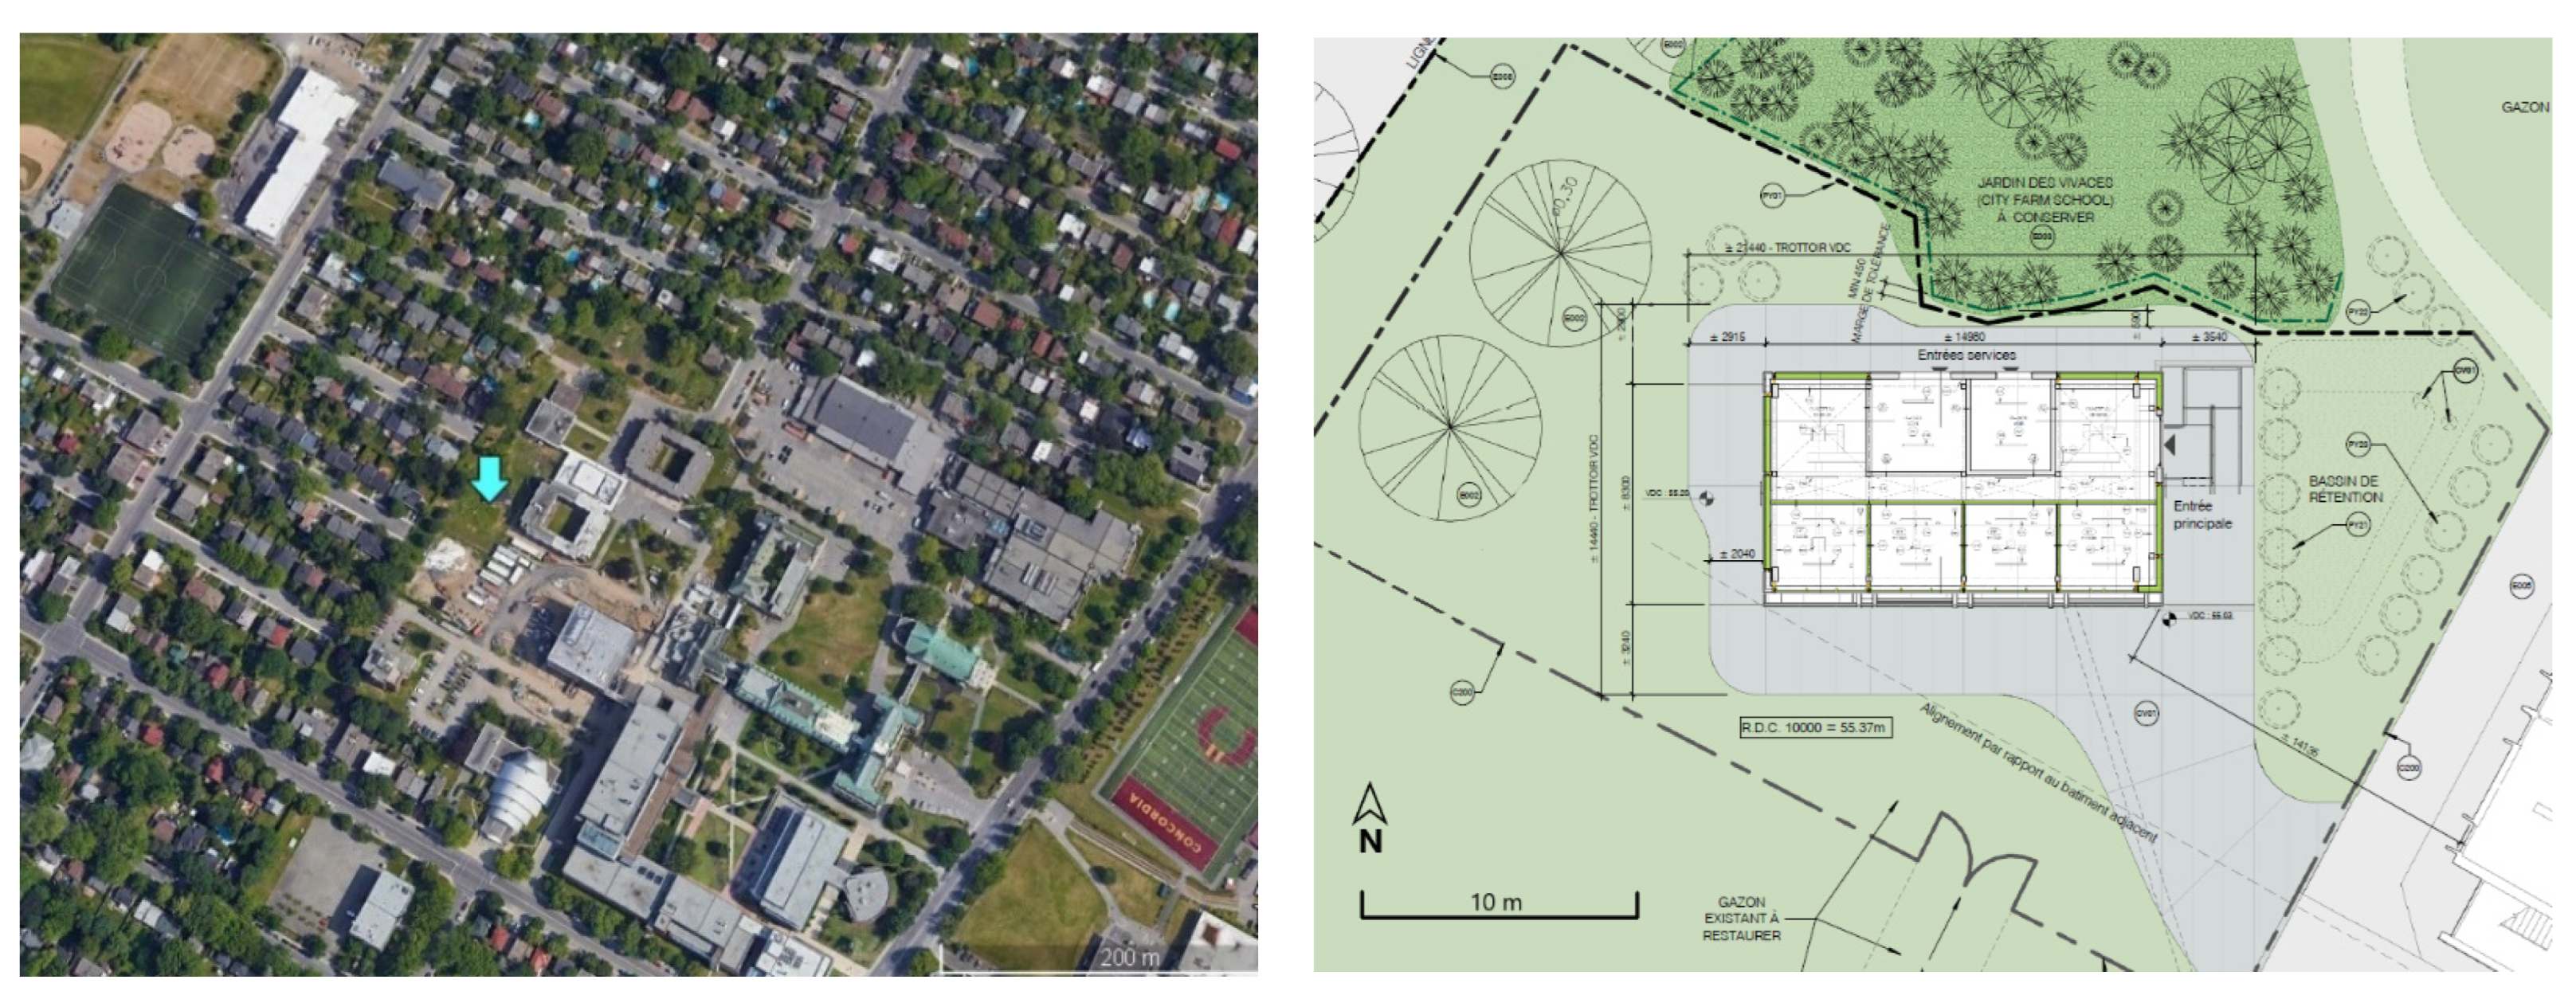
3.4. Case Study 1: Future Buildings Laboratory

Opened in 2021, the Future Buildings Laboratory (FBL) is a research facility located at Concordia University’s Loyola Campus, in Montreal. The 125 m2 all-electric lab was designed with a focus on the development of advanced concepts for carbon neutral buildings. The facility is prepared for testing building-integrated photovoltaics (BIPV), motorized shading devices, urban wind energy, and many other technologies. Its envelope incorporates large removable parts, allowing the replacement of approximately 60% of the exterior walls for the assessment of performance of various types of wall assemblies, their hygrothermal performance, effects on indoor environmental conditions, interaction with mechanical systems, and renewable energy.
The building is composed of a concrete slab-on-grade foundation, engineered wood structure made of glued laminated timber, metallic system for the roof, insulated wood frame walls with wood cedar painted cladding, plywood sheathing, insulation, gypsum boards, and finishes. The HVAC system is an air-source heat pump, air-handling unit (with heat recovery), including humidifier and electric heater. Currently the four test cells on the south façade have building-integrated photovoltaic/thermal (BIPV/T) and semi-transparent PV curtain wall systems installed, but the systems have been used just for research purpose, and not yet to generate electricity for the operation of the facility. Thus, its potential to displace carbon emissions from grid-purchased electricity is not considered in this work. Further information about the building is provided in Figure 2, Figure 3 and Figure 4.
To simulate the annual electricity consumption related to HVAC system, equipment, and interior lighting, the building was modeled in Design Builder (Energy Plus) (v7.0.2.004, 2022) following the design specifications (Table 2 and Table 3).
The simulated annual electricity consumption is 8868 kWh/year, which is equivalent to 70.94 kWh/m2 of heated floor area per year and 11.42 kWh/3 of heated internal volume per year.
Table 4 lists the bill of materials used in each LCA software for the calculation of environmental impacts related to FBL. The specifications were retrieved from project drawings, and total quantities are related to the construction of the building (software inputs). Additional replacement of materials throughout the buildings’ life cycle is automatically calculated by the software based on material’s service life defined in these programs, as will be discussed in results section.

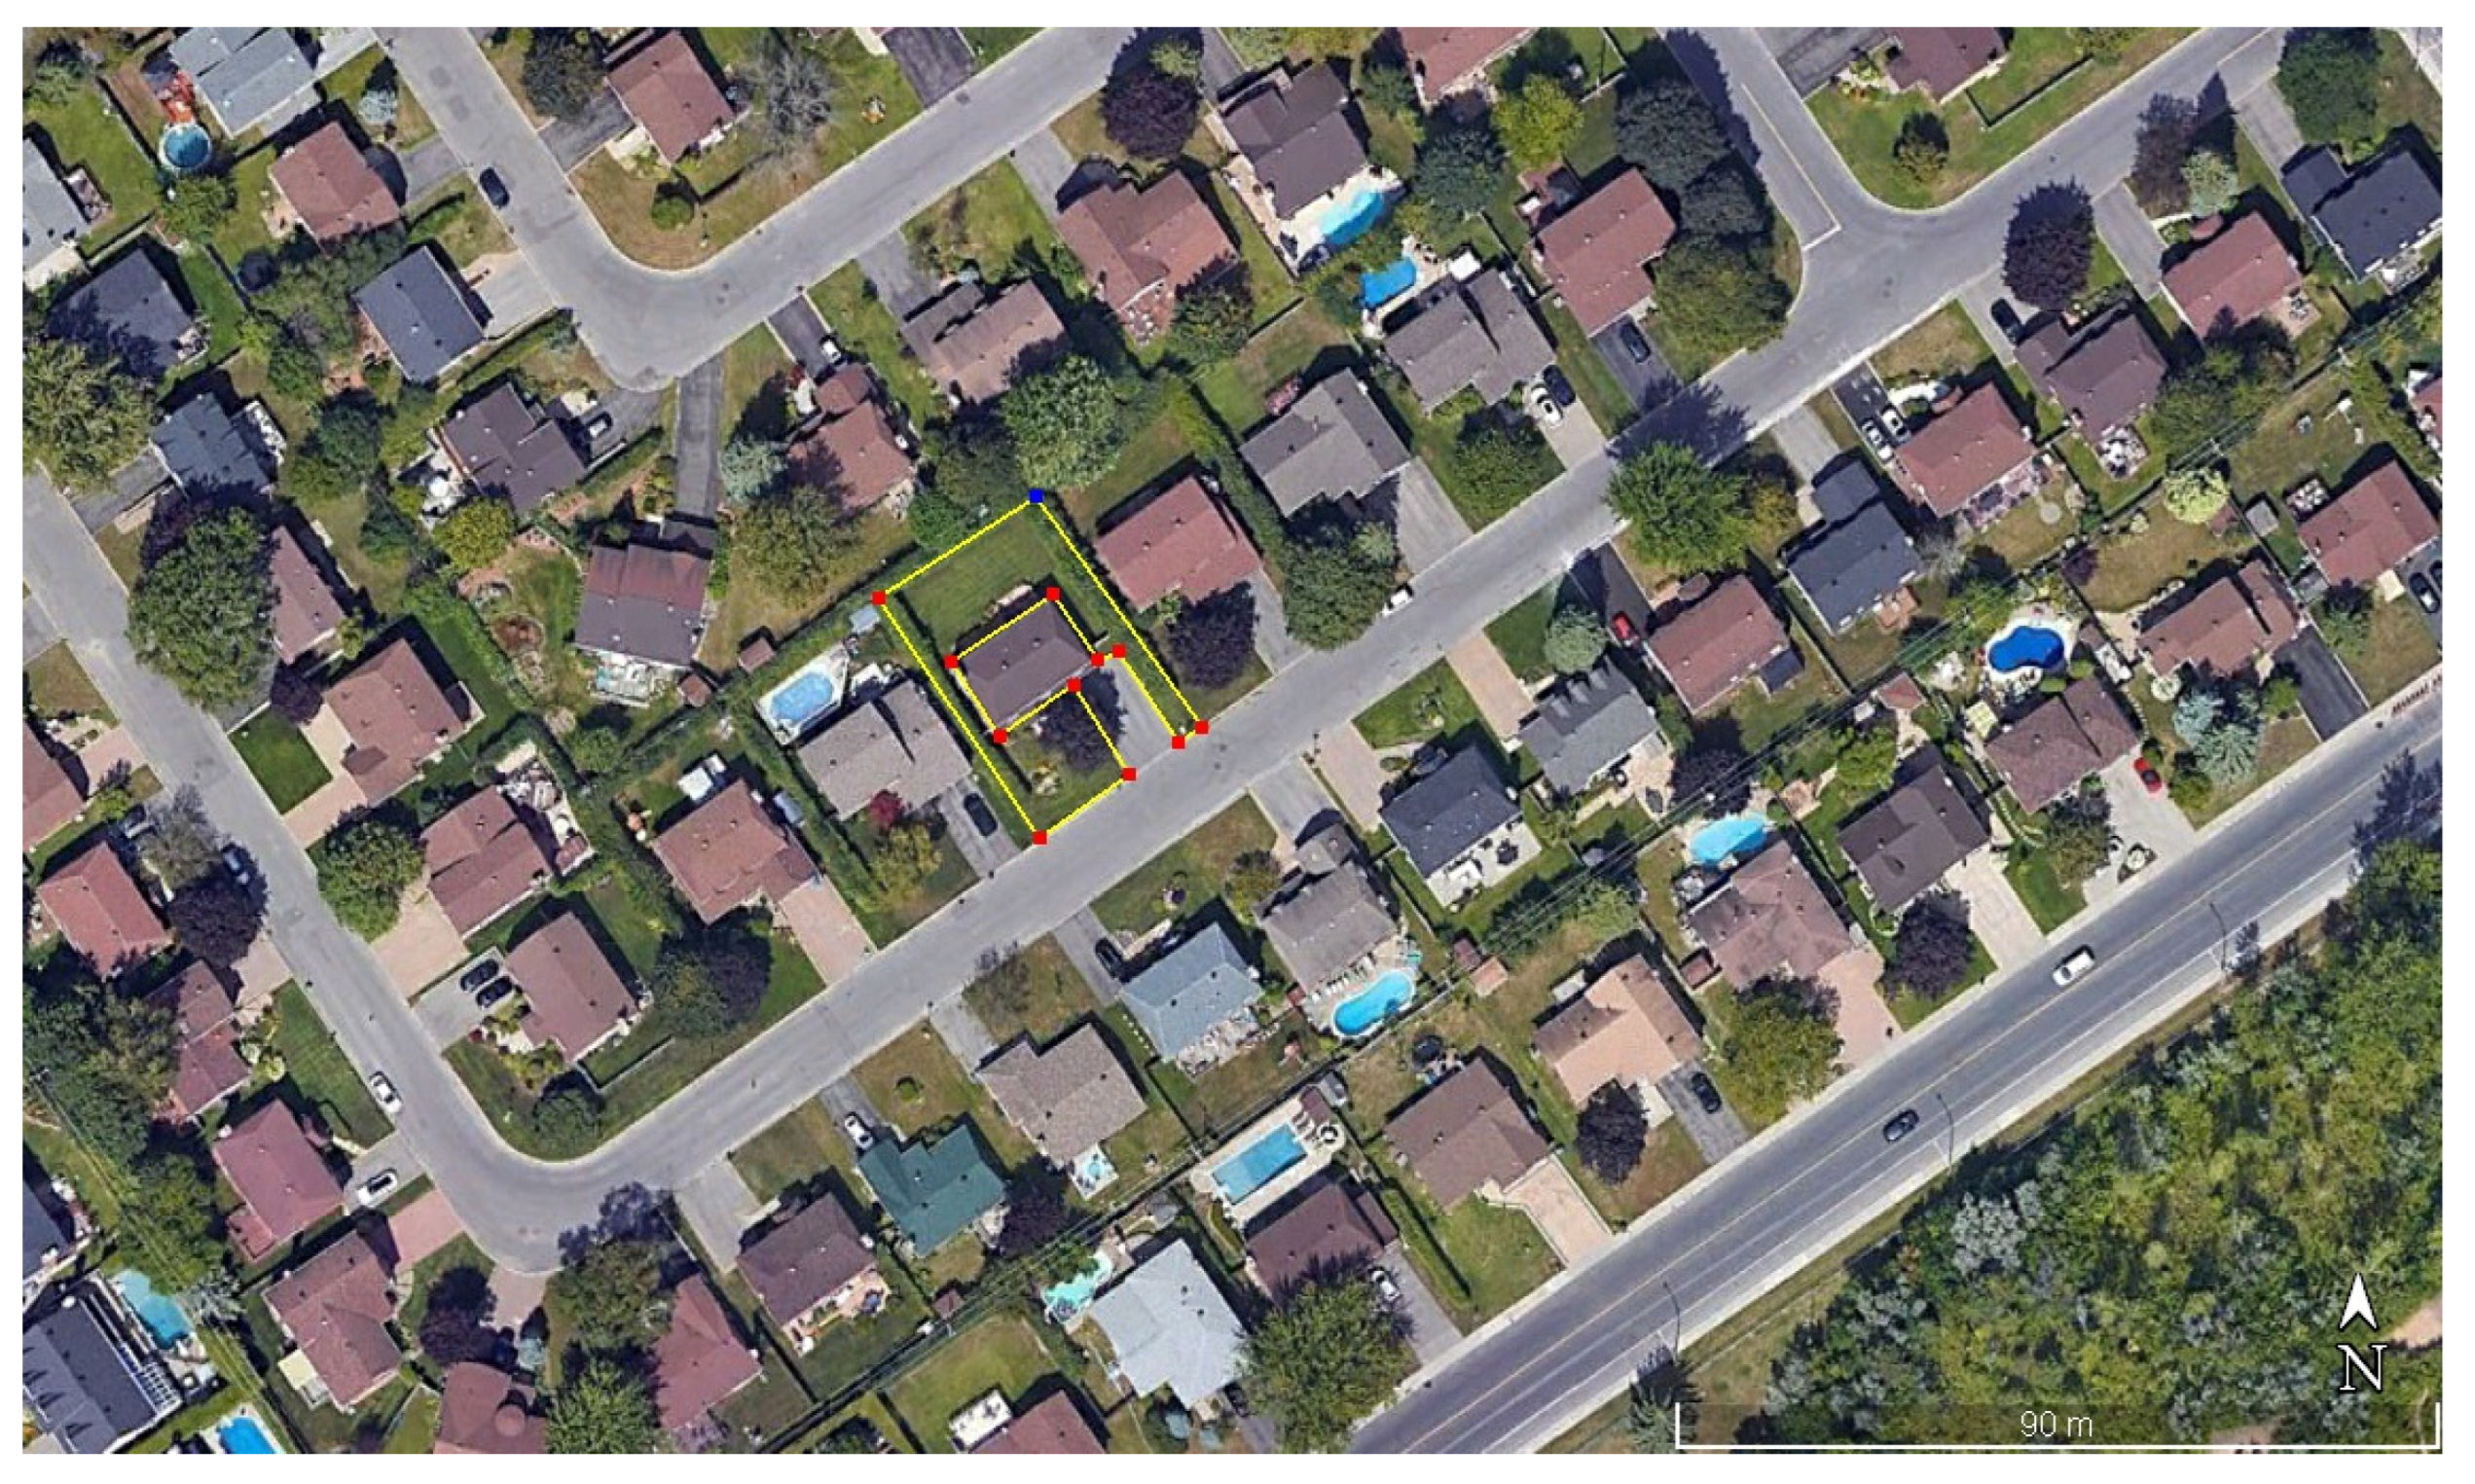
3.5. Case Study 2: Single-Detached House

The second case study is a single-detached house built in 1967, not energy-efficient, located in Dollard-des-Ormeaux (near Montreal). The information about the house was retrieved from Baouendi [66]. The house has 258 m2 of heated floor area, and encompasses 14 rooms that are distributed on one main floor and a basement. It has a typical wood frame envelope, with brick veneer in the above ground exterior walls, reinforced concrete in the basement walls and foundations and double-glazed aluminum frame windows. The annual energy consumption was simulated using the HOT2000 software [66]. Natural gas is used for space heating and domestic hot water (DHW) (3561.3 m3, equivalent to 13.83 gas/m2/year), and electricity is used for lighting and electric appliances (9725 kWh, equivalent to 37.7 kWh/m2/year). No air conditioning is used. The basic simulation inputs are presented in Table 5.
In order to highlight the high environmental impact of natural gas, an alternative setup was proposed by converting the energy provided by natural gas to an energy equivalent value of electricity. 13 of natural gas is equivalent to 10.7330 kWh [67]. Thus, for this alternative setup, the total electricity consumption (general use, plus heating and DHW) is 47,950 kWh/year (equivalent to 185 kWh/m2/year).
The garden area of 505 m2 represents the typical landscape of single-detached houses in Dollard-des-Ormeuax, as shown in Figure 5. The bill of materials inputted in the LCA softwares to calculate the life cycle GWP is presented in Table 6.

4. Results and Discussion

4.1. LCA Results: Future Buildings Laboratory

The life cycle CO2eq emissions for the FBL are presented in Table 7, as obtained from the two softwares, One Click LCA and Athena Impact Estimator, considering a 60-years’ time horizon. The baseline scenario considers all life cycle stages (A1–A5, B4–B6, C1–C4), except for module D (biogenic carbon in wood products). For the baseline scenario, the total GWP, without considering the carbon sequestration potential of trees, is equal to 83,521 kgCO2eq (calculated using One Click LCA) and 82,666 kgCO2eq (using Athena). The share of emissions from each life cycle stage for this scenario is presented in Figure 6. In terms of annual CO2eq emissions per heated floor area (125 m2), the results are 11.13 kgCO2eq/m2 (using One Click) and 11.02 kgCO2eq/m2 (using Athena).
The second scenario includes module D, which is not mandatory in the cradle-to-grave approach according to EN 15978 [50]. The GWP estimated for this scenario, without vegetation contribution, is equal to 47,363 kgCO2eq (calculated using One Click LCA) and 55,112 kgCO2eq (using Athena). In terms of annual CO2eq emissions per heated floor area, the results are 6.31 kgCO2eq/m2 (using One Click LCA) and 7.34 kgCO2eq/m2 (using Athena).
There are a few aspects related to software calculations and material inventory options that need to be discussed regarding the FBL’s LCA results:
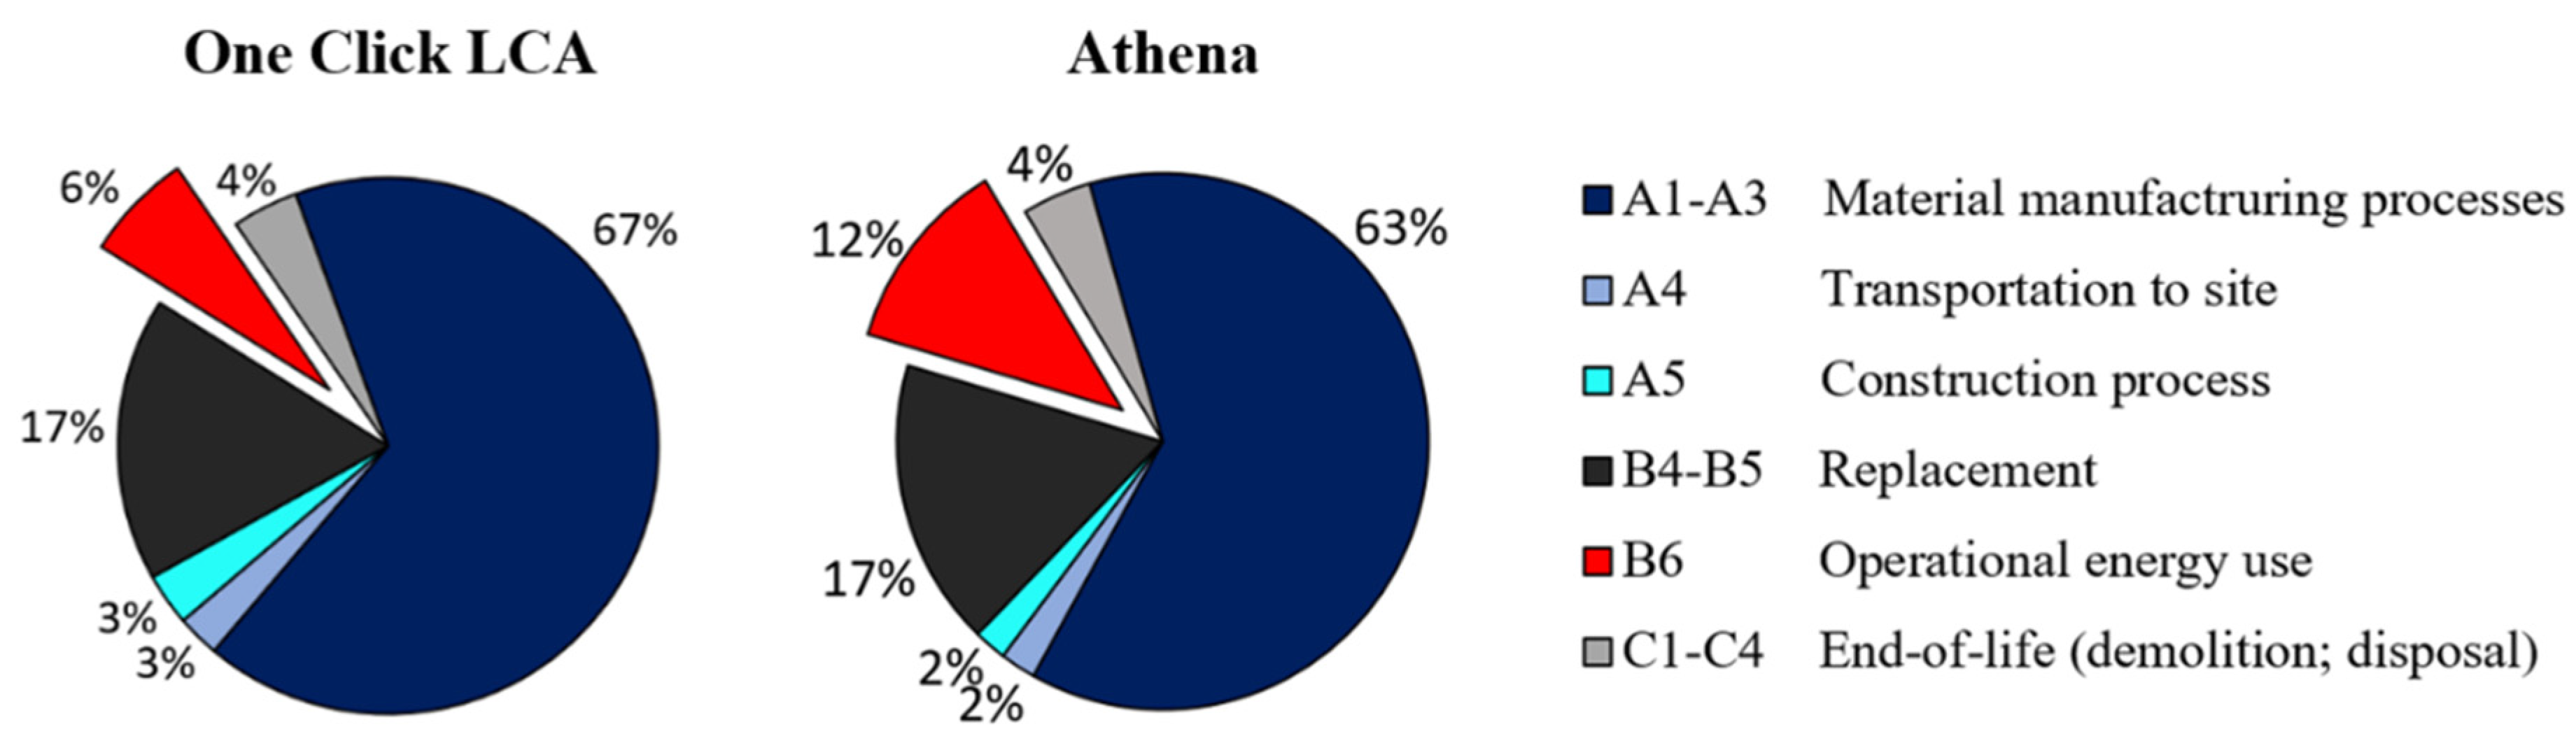
  • Although the operational emissions (module B6) are only dependent on two inputs (building location and annual energy consumption by type of fuel), the result provided by Athena for this module (9737 kgCO2eq) is almost 80% higher than the results from One Click LCA (5445 kgCO2eq). The reason is that Athena contains highly specific data for North American regions, which means that city-level geographic relevance is critical, especially for operational emissions. According to Athena’s Transparency Document [68] and customer support service, starting with version v.5.4, the source data for electricity profiles for Canadian provinces has been changed to Ecoinvent 3.4-2017, which is very likely to include factors for biogenic decay in hydro reservoirs (rotting vegetation emitting CO2 and methane (CH4)), and other impacts related to transmission processes, which results in a multiplier factor of 0.018302 kgCO2eq per kWh. For One Click LCA, the operational electricity use emissions are calculated considering a factor of 0.010234 kgCO2eq per kWh of electricity. Based on the information presented from reading data-cards available in the One Click LCA browser, the calculation is done according to an internally verified LCA study for country-specific electricity mixes (Quebec/Canada) based on the International Energy Agency (IEA) and Ecoinvent databases from 2020.
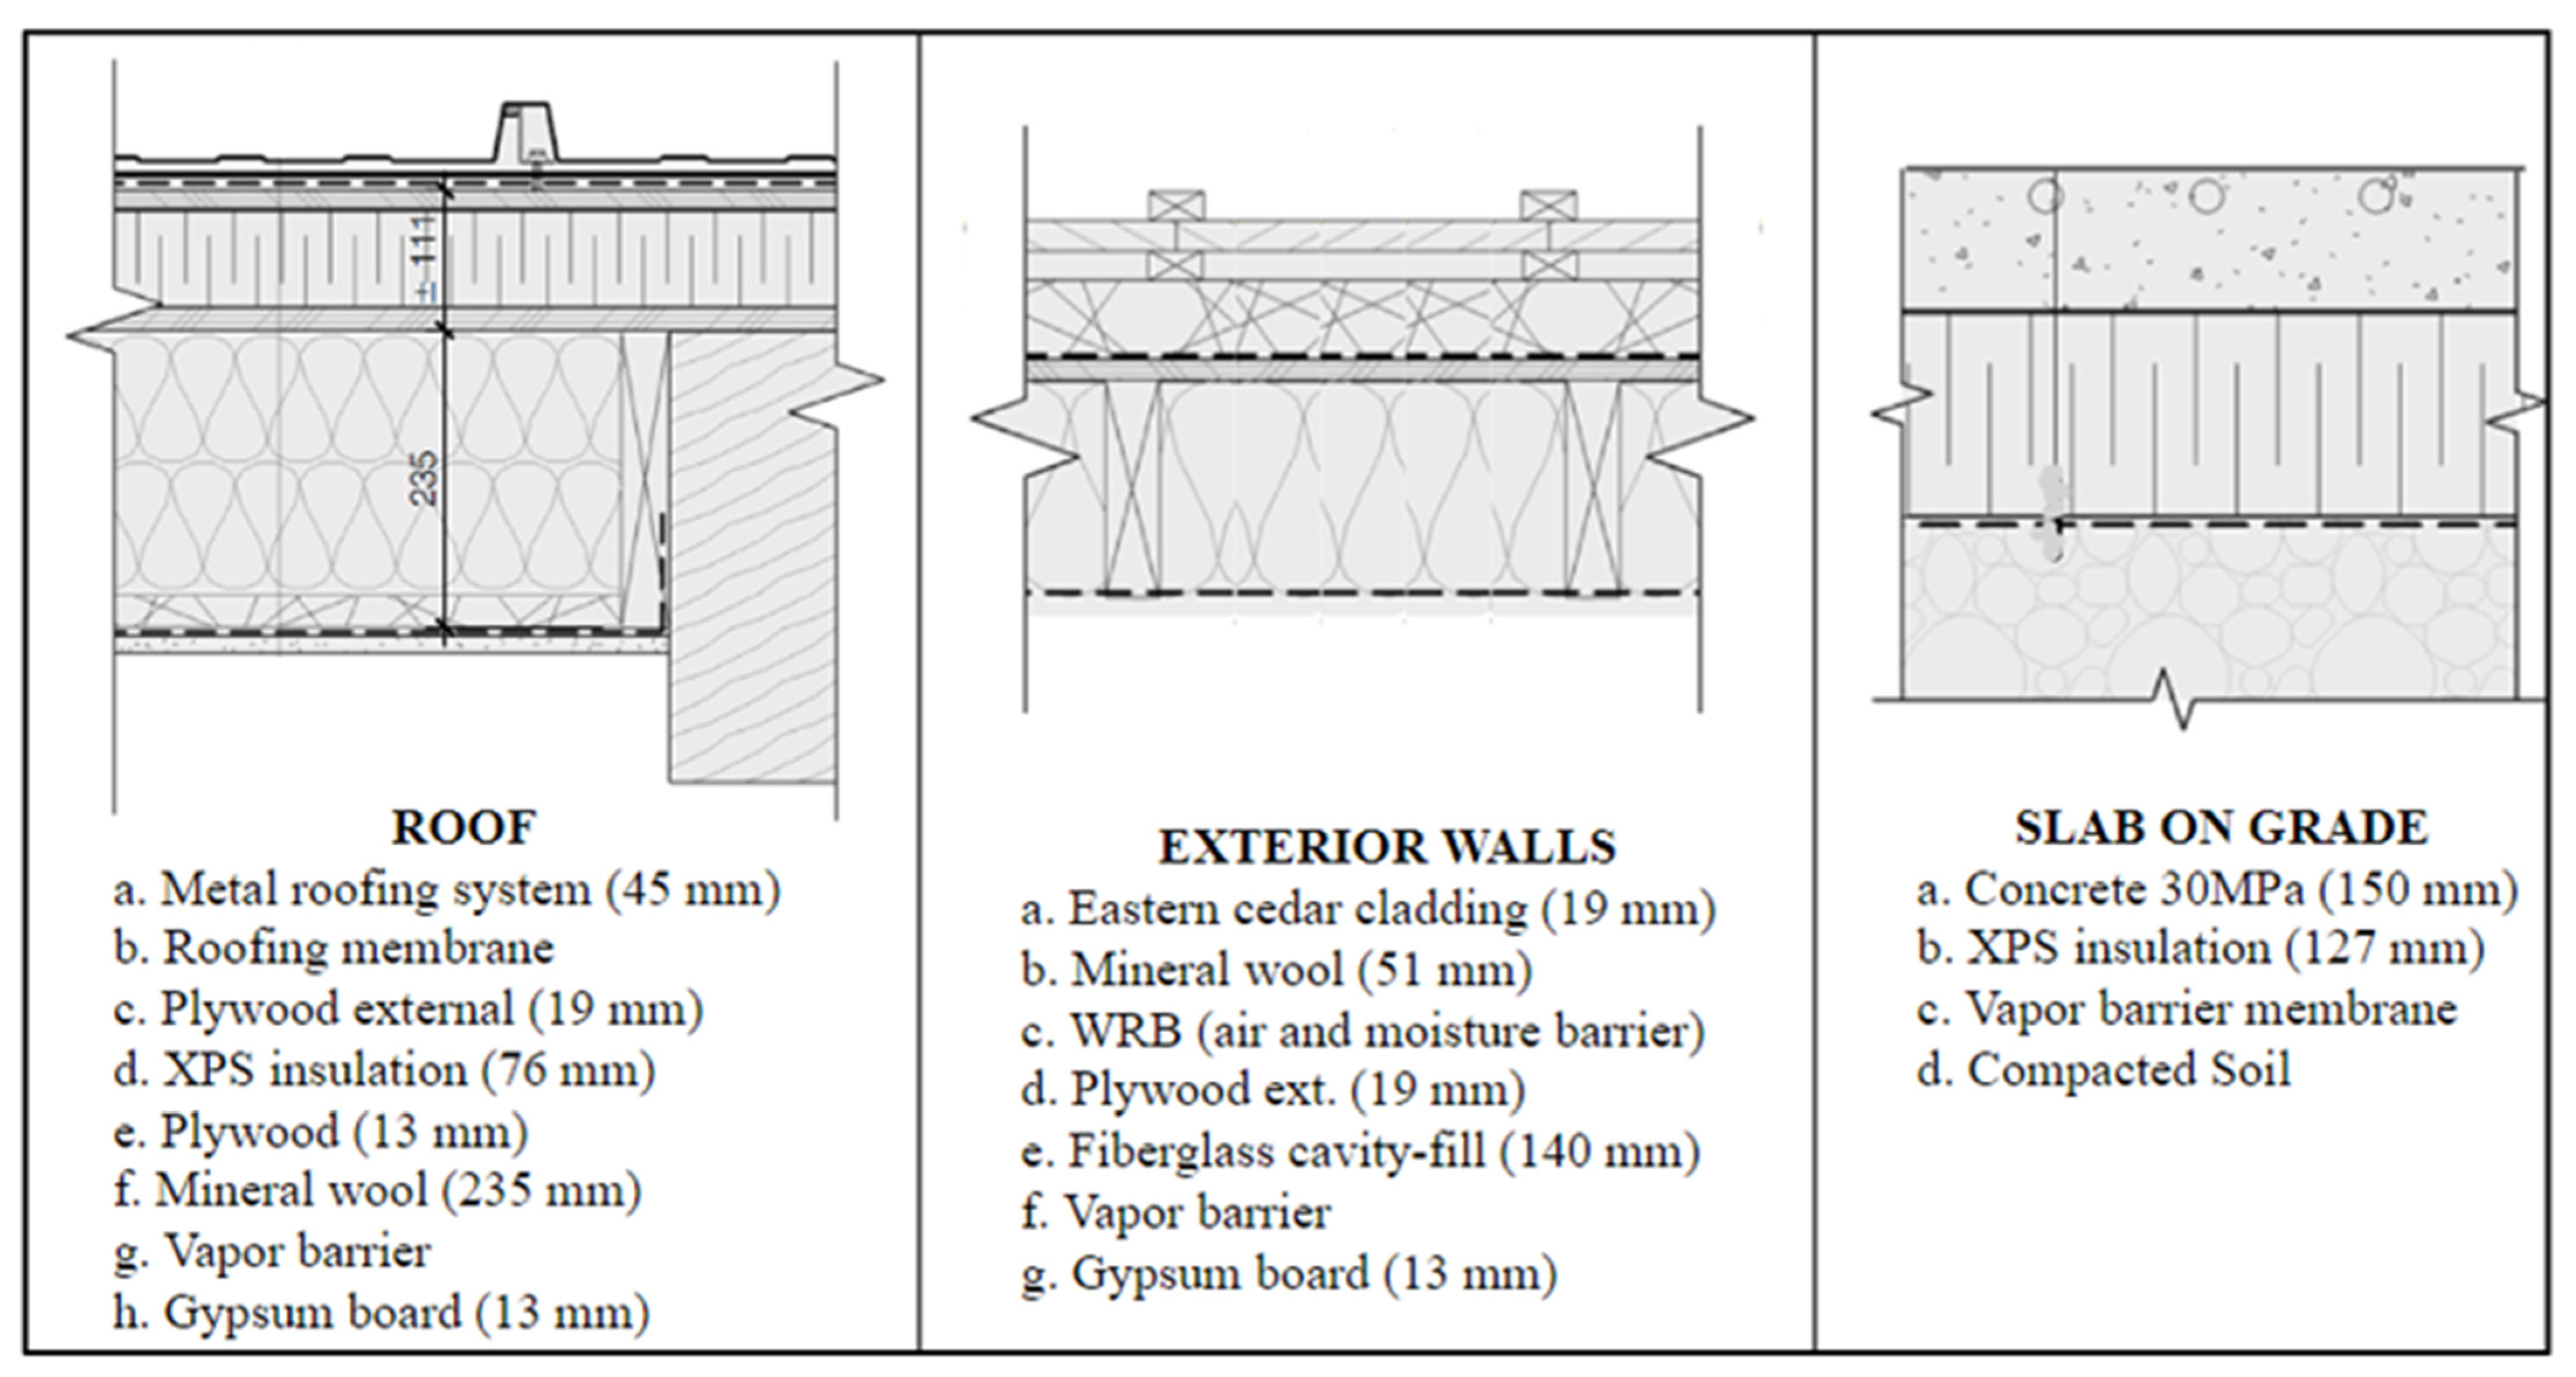
  • There is a high environmental impact due to the use of Extruded Polystyrene (XPS) insulation materials, which is the type of insulation specified for the FBL’s foundation and roof. The impact of XPS exceeds any other materials, carrying a GWP of around 20,700 kgCO2eq, which represents 25% of the total life cycle emissions for the baseline scenario (modules A to C). Both softwares use data from publicly available Environmental Product Declarations (EPDs) from Owens Corning and Dupont to estimate life cycle CO2eq emissions impacts. The raw material extraction and manufacturing processes of XPS are the highest contributing modules, including emissions from electricity, natural gas and liquefied petroleum gas combustion, as well as blowing agent emissions from the trimming, cutting, and profiling of the XPS boards. The chart presented in Figure 7 adapted from One Click LCA to demonstrate the total GWP contribution related to the most impactful materials considered in this case study.
3.
The life cycle stage “replacement; refurbishment” (modules B4 and B5) also represents a relevant burden on the final LCA results. It contributes around 14,300 kgCO2eq, representing 17% of the FBL’s emissions, calculated using both softwares. The service life determines how long the product is in use before it is replaced. Foundation materials, for example, are never replaced. Insulation materials usually have a service life of 75 years, as defined in different EPDs, which is longer than the 60-years’ service life assumed for the case studies in this paper. Equipment such as HVAC and PV have a shorter service life (20 to 25 year); taking the PVs as example, it carries embodied emission of around 3000 kgCO2eq due to manufacturing processes (A1–A5), and 6000 kgCO2eq more due to two events of replacement (at building age of 20 years and 40 years).
4.
Default scenarios are assumed for End-of-Life stages. The default inputs are based on the processing chain defined in EPDs, or local common practice. In One Click LCA, it is possible to alternate those scenarios that impact the results for modules C2 to C4, and also for module D, if applicable. Examples of end-of-life treatments are landfill (for inert materials), wood incineration, plastic-based material incineration, steel recycling, gypsum recycling, and glass-containing and metal-containing product recycling.

4.2. LCA Results: Single-Detached House

Following the same approach adopted in the first case study, the baseline scenario for the single-detached house also considers a 60-years’ service life, and includes all life cycle stages, except for module D. As presented in Table 8, the total GWP calculated using One Click LCA is equal to 544,907 kgCO2eq, and using Athena is equal to 566,856 kgCO2eq. In terms of annual CO2eq emissions per heated floor area (258 m2), the results are 35.20 kgCO2eq/m2 (using One Click LCA) and 36.62 kgCO2eq/m2 (using Athena).
The second scenario includes module D, benefits beyond a building’s life, which brings benefits from the biogenic carbon stored in wood products. For this scenario, the GWP results are 518,823 kgCO2eq with One Click LCA, and 541,119 kgCO2eq with Athena. In terms of annual CO2eq emissions per heated floor area, the results are 33.51 kgCO2eq/m2 (using One Click LCA) and 34.95 kgCO2eq/m2 (using Athena).
This case study house uses natural gas for heating and domestic hot water supply, which results in a high GWP related to the operational use stage (module B6), accounting for about 90% of total LCA carbon emissions, as shown in Figure 8. If we consider a gas-free setup (scenario 03, A to C), where the natural gas has been converted to an energy equivalent value for electricity, the house’s total life cycle GWP calculated using One Click LCA results in 82,456 kgCO2eq (5.32 kgCO2eq/m2.year), and using Athena, it results in 95,697 kgCO2eq (6.18 kgCO2eq/m2.year).
Regarding the individual result of module B6 (operational energy use emissions) for this gas-free scenario, it drops from 491,894 kgCO2eq to 29,443 kgCO2eq (One Click LCA), and from 523,812 kgCO2eq to 52,654 kgCO2eq (Athena). Table 9 presents information about the calculation of operational emissions, and Figure 8 presents a comparison between the share of embodied and operational emissions for this situation.
This situation illustrates the importance of shifting to all-electric buildings in places like Quebec, Canada, where the electricity grid is based on renewable sources (i.e., hydro power). In Table 9, if we divide the total life cycle operational emissions related to the use of natural gas in the real scenario 01 by its equivalent (converted) value of electricity consumption in the gas-free scenario 03 (38,225 kWh/year, over 60 years), the results are around 0.211 kgCO2eq emitted per kWh consumed (with One Click), and 0.223 kgCO2eq/kWh with Athena. Those values are 10 to 20 times higher than the CO2eq emissions per kWh from electricity, which are equal to around 0.0102 kgCO2eq/kWh (One Click) and 0.0183 kgCO2/kWh (Athena) in the case of Montreal.

4.3. Final Balance: Potential for Carbon Sequestration Using Urban Trees

Until this point, the results provided and discussed were about the LCA calculations, which did not include the potential of planting trees around the case study buildings to sequestrate CO2 and reduce their carbon footprints.
The final balance is the difference between the total life cycle CO2eq emissions (GWP) related to each building and the total CO2eq captured by the trees in their respective gardens. If we consider that the garden areas (410 m2 for the FBL, and 505 m2 for the single-detached house) are fully covered by representative urban trees without canopy overlap, then the carbon sequestration potential at the FBL is equal to 235.7 kgCO2eq/year (annual sequestration rate of 0.575 kgCO2eq/m2 of tree cover area multiplied by 410 m2 garden), and at the single-detached house is 290.3 kgCO2eq/year (0.575 kgCO2/m2TC × 505 m2 of garden). Supposing that those trees will not grow or die, and that the annual sequestration rates will remain constant during the 60-years calculation period, the life cycle carbon sequestration potential of these gardens is equal to 14,145 kgCO2eq for the FBL, and 17,418 kgCO2eq for the single-detached house.
In the case of the FBL’s baseline scenario 01 (modules A to C), the final balance resulted in 69,377 kgCO2eq (One Click) and 68,521 kgCO2eq (Athena). Therefore, this set of representative urban trees has the potential to offset 16.9% and 17.1% of the FBL’s total life cycle emissions calculated using One Click LCA and Athena, respectively.
When we apply those potentials to the baseline scenario of the single-detached house (which has natural gas as part of its energy source), the CO2 removals from the trees can offset only 3.2% of the total emissions (One Click LCA), and 3.1% (Athena). However, if we consider the alternative setup for the single-detached house (scenario 03) where natural gas is converted to an energy equivalent value of electricity, the carbon removals from the trees would have the potential to offset 21.1% of the total emissions (One Click LCA results), and 18.2% for Athena. The results for those and other scenarios are presented in Table 10.
Alternatively, in a scenario where only the operational use stage is considered (module B6), the relative contribution provided by the trees would be much more effective applied to cases of all-electric buildings. For places like Quebec, with the energy grid generation based on renewable sources, it would be feasible to achieve carbon neutrality by including urban trees around buildings.
As shown in Table 11, in the FBL, the operational use stage is responsible for 5445 kgCO2eq emissions (calculated using One Click) and 9737 kgCO2eq (using Athena), while the total potential of the trees to sequestrate carbon is 14,145 kgCO2eq. Therefore, carbon neutrality of the operational use stage would be achieved, resulting in a balance equal to –8700 kgCO2eq (One Click) and –4408 kgCO2eq (Athena).
For the detached house (gas-free scenario), the operational use stage is responsible for 29,443 kgCO2eq emissions (One Click) and 52,654 kgCO2eq (Athena), while the total carbon sequestration potential due to the garden full of trees is 17,418 kgCO2eq. Therefore, the balance would be 12,025 kgCO2eq (One Click) and 35,235 kgCO2eq (Athena). Although this is not enough to offset 100% of the operational use stage emissions, it can contribute towards reducing 59% and 33% of operational emissions, considering One Click and Athena’s results. It is important to remember that the FBL is a state-of-the-art construction, projected with a focus on energy performance, while the single-detached house is a typical construction from the 1960s with several issues of air leakage. Renovation strategies would be required to improve the final carbon balance.
Although it might not be possible to reach a net-zero carbon balance by just considering the direct carbon sequestration potential of trees when accounting for total life cycle emissions (embodied and operational), our estimations disregarded many benefits related to the use of vegetation around buildings. For example, the effect of greeneries on moderating the local microclimate and their indirect contribution to reducing heating and cooling loads, and therefore providing energy savings, were out of the scope of this paper. Regarding the LCA calculations, several premises aiming at conservative results were adopted. The biogenic carbon stored in wood products and their benefits beyond building life (module D) were not accounted for in the baseline scenario; the environmental impact related to manufacture and replacements of the PV system in the FBL was included in the LCA calculations, but the system is currently used for research purposes only, and the electricity generation as a renewable energy source was not counted yet. There is also available space to install a green roof, providing additional direct carbon sequestration.

4.4. Aditional Scenarios and Directions for Future Work

As presented in Table 12, we used the LCA results from the FBL’s baseline scenario (83,522 kgCO2eq calculated with One Click) to demonstrate a complete set of strategies that could be considered in order to reach a net-zero carbon balance. The complete set includes biogenic carbon in wood products, urban trees planted around the building, on-site PV generation, and a green roof.
As discussed, in the FBL, the biogenic carbon in wood products could reduce the final GWP by 35,885 kgCO2eq over 60 years (see Table 7). In addition to that, the carbon sequestration potential of a garden full of urban trees could offset an additional 14,145 kgCO2eq over 60 years (see Table 10). In addition, we can roughly estimate the annual on-site electricity generation related to the PV system that is already installed on the façade, and calculate the respective CO2eq emissions displaced from the energy grid. Based on solar data from NRC [69], the estimated photovoltaic potential (kWh/kWp) considering vertical panels under southern Quebec’s climate conditions is equal to 873 kWh/kWp. The 15 m2 PV system on FBL’s façade has an installed capacity of 1.6320 kWp, which means that it can produce up to 1425 kWh/year. In One Click LCA, each kWh of electricity generated in Quebec incurs 0.010234 kgCO2eq emissions; therefore, over 60 years, the PV system would be able to offset an additional 875 kgCO2eq. Finally, if we also include in our approach a properly fertilized and irrigated green roof of 130 m2 removing 25.8 kgCO2eq/m2 per year for 10 years, as reported by Luo et al. [32], this solution could offset an additional 33,540 kgCO2eq.
Putting all these CO2eq removals together, the total offset would be equal to 84,445 kgCO2eq. Thus, the final carbon balance applied to the FBL’s baseline scenario would result in () 893 kgCO2eq, which means that carbon neutrality could be achieved for this scenario.

5. Conclusions

This paper presents a framework and general approach, applied to real case studies, to address the feasibility of planting trees around buildings as a nature-based solution to achieve carbon neutral buildings using life cycle carbon analysis. This work shows that, for those buildings that still consume fossil fuels (such as the single-detached house), or for those places where the electricity grid is not yet based on renewable sources, it is not feasible to reach carbon neutrality considering just the sequestration potential of trees. However, in the case of all-electric buildings (such as the FBL), it has been shown that this solution could mitigate 16.9% to 17.1% of the building’s life cycle carbon emissions without considering on-site electricity generation.
Based on the analysis of the different scenarios and assumptions presented in this paper, it seems to be possible to achieve a carbon balance closer to net-zero when expanding the strategies with approaches including other types of green solutions and on-site electricity generation. Coupling those strategies with the indirect benefits of vegetation (i.e., energy savings), the use of nature-based materials, and the use of recyclable/reusable materials is definitely a consistent pathway towards the design and operation of carbon neutral buildings.
The analysis presented in this work has also shown that LCA studies can be very sensitive to decisions made during the calculation process, although LCA results are still very useful for indicating the relative importance of a process in the different life cycle stages, or for estimating the expected magnitude of the impacts related to a specific material. The framework developed in this paper will be applied to investigate the contribution of urban greeneries to carbon neutral buildings and neighborhoods including both new constructions and retrofits for various building types in our future work.

Author Contributions

Conceptualization, H.G. and R.Z.; methodology, H.G., R.Z. and F.G; formal analysis, F.G. and F.B; investigation, F.G. and F.B., resources, H.G. and R.Z.; data curation, F.G.; writing—original draft preparation, F.G.; writing—review and editing, H.G., R.Z. and F.G.; supervision, H.G. and R.Z.; funding acquisition, H.G. and R.Z. All authors have read and agreed to the published version of the manuscript.

Funding

We acknowledge the financial support from the Natural Sciences and Engineering Research Council (NSERC) Discovery Grants (Grant no. RGPIN/6994-2001 and RGPIN/N00271), and the Gina Cody School of Engineering and Computer Science of Concordia University.

Conflicts of Interest

The authors declare no conflict of interest.

References

  1. Masson-Delmotte, V.; Zhai, P.; Pirani, A.; Connors, S.L.; Péan, C.S.; Zhou, B. Intergovernmental Panel on Climate Change (IPCC), 2021. In Climate Change 2021: The Physical Science Basis: Contribution of Working Group I to the Sixth Assessment Report of the Intergovernmental Panel on Climate Change; Cambridge University Press: Cambridge, UK; New York, NY, USA, 2021; in press; Available online: https://www.ipcc.ch/report/ar6/wg1/downloads/report/IPCC_AR6_WGI_FrontMatter.pdf (accessed on 15 August 2022).
  2. United States Environmental Protection Agency (US-EPA), 2021. Climate Change Indicators: Weather and Climate. Available online: https://www.epa.gov/climate-indicators/weather-climate (accessed on 15 August 2022).
  3. El País. 2022. El Cálculo de Muertes por la Ola de Calor en España se Cifra en 510 Entre el 10 y el 16 de Julio. [The Calculation of Deaths from the Heat Wave in Spain is Estimated at 510 between July 10 and 16]. Available online: https://elpais.com/sociedad/2022-07-18/la-ola-de-calor-deja-510-muertes-en-espana-entre-el-10-y-el-16-de-julio.html (accessed on 14 August 2022).
  4. ProMETEO Sevilla. 2022. ¿Qué Es Una Ola de Calor? [What Is a Heat Wave?]. Available online: https://prometeosevilla.com/olas-de-calor/que-es-una-ola-de-calor/ (accessed on 14 August 2022).
  5. British Columbia Coroners Service (BCCS), 2022. Extreme Heat and Human Mortality: A Review of Heat-Related Deaths in B.C. in Summer 2021. Report to the Chief Coroner of British Columbia, 7 June 2022. Available online: https://www2.gov.bc.ca/assets/gov/birth-adoption-death-marriage-and-divorce/deaths/coroners-service/death-review-panel/extreme_heat_death_review_panel_report.pdf (accessed on 15 August 2022).
  6. Senado Federal. Relatório Final—Comissão Temporária Externa, Petrópolis/RJ—2022; 2022 [Federal Senade. 2022. Final Report—External Temporary Comission, Petropolis/RJ. Available online: https://legis.senado.leg.br/comissoes/mnas?codcol=2506&tp=4 (accessed on 17 August 2022).
  7. Munroe, T.; Beijing Newsroom. Reuters. 2021. Death Toll from FLoods in China’s Henan Province Rises to 302. Available online: https://www.reuters.com/world/china/death-toll-flooding-chinas-henan-province-rises-302-2021-08-02/ (accessed on 17 August 2022).
  8. World Green Building Council (WorldGBC). 2019. Bringing Embodied Carbon Upfront: Coordinated Action for the Building and Construction Sector to Tackle Embodied Carbon. Available online: https://www.worldgbc.org/sites/default/files/WorldGBC_Bringing_Embodied_Carbon_Upfront.pdf (accessed on 18 August 2022).
  9. Chen, X.; Yang, H.; Lu, L. 2015. A comprehensive review on passive design approaches in green building rating tools. Renew. Sustain. Energy Rev. 2015, 50, 1425–1436. [Google Scholar] [CrossRef]
  10. United States Environmental Protection Agency (US-EPA), 2007. Summary of the Energy Independence and Security Act: Public Law 110-140 (2007). Available online: https://www.epa.gov/laws-regulations/summary-energy-independence-and-security-act (accessed on 20 August 2022).
  11. European Union (EU). European Parliament, Directive 2010/31/EU of the European Parliament and of the Council of 19 May 2010 on the Energy Performance of Buildings. Off. J. Eur. Union 2010, 13–35. [Google Scholar]
  12. Lützkendorf, T.; Foliente, G.; Balouktsi, M.; Wiberg, A.H. Net-zero buildings: Incorporating embodied impacts. Build. Res. Inf. 2015, 43, 62–81. [Google Scholar] [CrossRef]
  13. Grinham, J.; Fjeldheim, H.; Yan, B.; Helge, T.D.; Edwards, K.; Hegli, T.; Malkawi, A. Zero-carbon balance: The case of HouseZero. Build. Environ. 2022, 207 Pt B, 108511. [Google Scholar] [CrossRef]
  14. Canada Green Building Council (CaGBC). Zero Carbon Building—Design Standard Version 3; 2022; Ottawa, ON, Canada; Canada Green Building Council ISBN 978-1-7781454-1-4. Available online: cagbc.org/ZCBDesign (accessed on 10 August 2022).
  15. World Green Building Council (WorldGBC). 2021. Advancing Net Zero Whole Life Carbon. Available online: https://www.worldgbc.org/sites/default/files/WorldGBC%20Advancing%20Net%20Zero%20Whole%20Life%20Carbon_PUBLICATION.pdf (accessed on 20 August 2022).
  16. World Green Building Council (WorldGBC). 2021. How Can We Make Our Buildings Green? Available online: https://www.worldgbc.org/how-can-we-make-our-buildings-green (accessed on 14 September 2022).
  17. City of Montreal. 2020. Climate Plan 2020–2030—Executive Summary. Available online: https://montreal.ca/en/articles/montreal-climate-plan-objective-carbon-neutral-2050-7613 (accessed on 14 September 2022).
  18. Pomponi, F.; Moncaster, A. Embodied carbon mitigation and reduction in the built environment—What does the evidence say? J. Environ. Manag. 2016, 181, 687–700. [Google Scholar] [CrossRef] [PubMed] [Green Version]
  19. Bhavsar, R.; Cupido, A.; Arriaga, M. Mohawk College’s net zero energy and zero carbon building: A living lab for high efficiency and renewable energy technologies in buildings. J. Green Build. 2020, 15, 185–214. [Google Scholar] [CrossRef]
  20. Humber College. 2019. Building NX, “Zero Carbon Building Design Certification Report”. Available online: https://portal.cagbc.org/cagbcdocs/zerocarbon/CaGBC_Humber_College_Case_Study_EN.pdf (accessed on 20 September 2022).
  21. Oreskovic, L.; Gupta, R.; Strong, D. In-use energy and carbon performance of a true zero carbon housing development in England. Sci. Technol. Built Environ. 2021, 27, 1425–1439. [Google Scholar] [CrossRef]
  22. Evolv-1, Office Building from The Cora Group Real Estate. ZCB-Design Certification in April 2018/ZCB-Performance Certification in April 2020; LEED Platinum: Waterloo, ON, Canada, 2018. Available online: https://portal.cagbc.org/cagbcdocs/zerocarbon/CaGBC_evolv1_Case_Study_EN.pdf (accessed on 19 September 2022).
  23. Canada’s Energy Regulator (CER). 2021. Canada’s Energy Future 2021: Provincial and Territorial Energy Profiles—Alberta. Available online: https://www.cer-rec.gc.ca/en/data-analysis/energy-markets/provincial-territorial-energy-profiles/provincial-territorial-energy-profiles-alberta.html (accessed on 22 September 2022).
  24. Canada’s Energy Regulator (CER). 2021. Canada’s Energy Future 2021: Provincial and Territorial Energy Profiles—Quebec. Available online: https://www.cer-rec.gc.ca/en/data-analysis/energy-markets/provincial-territorial-energy-profiles/provincial-territorial-energy-profiles-quebec.html (accessed on 22 September 2022).
  25. Perini, K.; Bazzocchi, F.; Croci, L.; Magliocco, A.; Cattaneo, E. The use of vertical greening systems to reduce the energy demand for air conditioning. Field monitoring in Mediterranean climate. Energy Build. 2017, 143, 35–42. [Google Scholar] [CrossRef]
  26. Pan, L.; Wei, S.; Chu, L.M. Orientation effect on thermal and energy performance of vertical greenery systems. Energy Build. 2018, 175, 102–112. [Google Scholar] [CrossRef]
  27. Cascone, S.; Coma, J.; Gagliano, A.; Pérez, G. The evapotranspiration process in green roofs: A review. Build. Environ. 2019, 147, 337–355. [Google Scholar] [CrossRef]
  28. Akbari, H.; Konopacki, S. Calculating energy-saving potentials of heat-island reduction strategies. Energy Policy 2005, 33, 721–756. [Google Scholar] [CrossRef]
  29. Zhao, M.; Kong, Z.-H.; Escobedo, F.J.; Gao, J. Impacts of urban forests on offsetting carbon emissions from industrial energy use in Hangzhou, China. J. Environ. Manag. 2010, 91, 807–813. [Google Scholar] [CrossRef] [PubMed]
  30. Bottalico, F.; Chirici, G.; Giannetti, F.; De Marco, A.; Nocentini, S.; Paoletti, E.; Salbitano, F.; Sanesi, G.; Serenelli, C.; Travaglini, D. Air Pollution Removal by Green Infrastructures and Urban Forests in the City of Florence. Agric. Agric. Sci. Procedia 2016, 8, 243–251. [Google Scholar] [CrossRef] [Green Version]
  31. Hong, X.-C.; Wang, G.-Y.; Liu, J.; Song, L.; Wu, E.T.Y. Modeling the impact of soundscape drivers on perceived birdsongs in urban forests. J. Clean. Prod. 2021, 292, 125315. [Google Scholar] [CrossRef]
  32. Luo, H.; Liu, X.; Anderson, B.C.; Zhang, K.; Li, X.; Huang, B.; Li, M.; Mo, Y.; Fan, L.; Shen, Q.; et al. Carbon sequestration potential of green roofs using mixed-sewage-sludge substrate in Chengdu World Modern Garden City. Ecol. Indic. 2015, 49, 247–259. [Google Scholar] [CrossRef]
  33. Kuittinen, M.; Moinel, C.; Adalgeirsdottir, K. Carbon sequestration through urban ecosystem services: A case study from Finland. Sci. Total Environ. 2016, 563–564, 623–632. [Google Scholar] [CrossRef]
  34. Liu, H.-Y. Building a dwelling that remains carbon-neutral over its lifetime—A case study in Kinmen (Tawian). J. Clean. Prod. 2019, 208, 522–529. [Google Scholar] [CrossRef]
  35. Lin, J.-C.; Jeng, M.-R.; Liu, S.-F.; Lee, K.J. Economic benefit evaluation of the potential CO2 sequestration by the national reforestation program. Taiwan J. For. Sci. 2002, 17, 311–321. [Google Scholar]
  36. Lin, H.-T.; Lin, T.-P.; Tsay, Y.-S. Green Building Evaluation Manual e Basic Version; Architecture and Building Research Institute, Ministry of the Interior: Taipei, Taiwan, 2015; ISBN 978-986-04-2013-5. (In Chinese) [Google Scholar]
  37. Heusinger, J.; Weber, S. Extensive green roof CO2 exchange and its seasonal variation quantified by eddy covariance measurements. Sci. Total Environ. 2017, 607–608, 623–632. [Google Scholar] [CrossRef]
  38. Marchi, M.; Pulselli, R.M.; Marchettini, N.; Pulselli, F.M.; Bastianoni, S. Carbon dioxide sequestration model of a vertical greenery system. Ecol. Model. 2015, 306, 46–56. [Google Scholar] [CrossRef]
  39. Seyedabadi, M.R.; Eicker, U.; Karimi, S. Plant selection for green roofs and their impact on carbon sequestration and the building carbon footprint. Environ. Chall. 2021, 4, 100119. [Google Scholar] [CrossRef]
  40. Leigh, J.; Whittinghill, D.; Rowe, B.; Schutzki, R.; Cregg, B.M. Quantifying carbon sequestration of various green roof and ornamental landscape systems. Landsc. Urban Plan. 2014, 123, 41–48. [Google Scholar] [CrossRef]
  41. Jo, H.-k. Impacts of urban greenspace on offsetting carbon emissions for middle Korea. J. Environ. Manag. 2002, 64, 115–126. [Google Scholar] [CrossRef] [PubMed]
  42. Kristin, L.; Getter, D.; Bradley Rowe, G.; Robertson, P.; Cregg, B.M.; Andresen, J.A. Carbon Sequestration Potential of Extensive Green Roofs. Environ. Sci. Technol. 2009, 43, 7564–7570. [Google Scholar] [CrossRef]
  43. Cai, L.; Feng, X.-P.; Yu, J.-Y.; Xiang, Q.-C.; Chen, R. Reduction in Carbon Dioxide Emission and Energy Savings Obtained by Using a Green Roof. Aerosol Air Qual. Res. 2019, 19, 2432–2445. [Google Scholar] [CrossRef]
  44. Sailor, D.; Sohn, E. Green Roofs Offset Global Warming, Study Finds. NBC News, 6 October 2009. Available online: https://www.nbcnews.com/id/wbna33198790 (accessed on 22 September 2022).
  45. Shafique, M.; Xue, X.; Luo, X. An overview of carbon sequestration of green roofs in urban areas. Urban For. Urban Green. 2020, 47, 126515. [Google Scholar] [CrossRef]
  46. Fares, S.; Paoletti, E.; Calfapietra, C.; Mikkelsen, T.N.; Samson, R.; Le Thiec, D. Carbon Sequestration by Urban Trees. In The Urban Forest. Future City; Springer: Cham, Switzerland,, 2017; Volume 7, Chapter 4; pp. 31–39. [Google Scholar] [CrossRef]
  47. London Energy Transformation Initiative (LETI). 2020. LETI Climate Emergency Design Guide: How New Buildings Can Meet UK Climate Change Targets. Available online: https://www.leti.london/cedg (accessed on 21 September 2022).
  48. ISO 14044; Environmental Management—Life Cycle Assessment—Requirements and Guidelines. ISO: Geneva, Switzerland, 2006.
  49. ISO 14040; Environmental Management—Life Cycle Assessment—Principles and Framework. ISO: Geneva, Switzerland, 2006.
  50. EN 15978; Sustainability of Construction Works. Assessment of Environmental Performance of Buildings. Calculation Method EN-BN: London, UK, 2011; (accessed on 10 August 2022).
  51. EN 15804 + A2; Sustainability of Construction Works—Environmental Product Declarations—Core Rules for the Product Category of Construction Products. EN-BN: London, UK, 2019; (accessed on 10 August 2022).
  52. Pasher, J.; McGovern, M.; Khoury, M.; Duffe, J. Environment Canada—Carbon storage and sequestration by Canada’s urban forests using high resolution earth observation data. Urban For. Urban Green. 2014, 13, 484–494. [Google Scholar] [CrossRef]
  53. Nowak, D.J. Atmospheric carbon dioxide reduction by Chicago’s urban forest. In Chicago’s Urban Forest Ecosystem: Results of the Chicago Urban Forest Climate Project; USDA Forest Service General Technical Report NE-186; McPherson, E.G., Nowak, D.J., Rowntree, R.A., Eds.; United States Department of Agriculture: Radnor, PA, USA, 1994; pp. 83–94. Available online: https://www.nrs.fs.fed.us/pubs/gtr/gtr_ne186.pdf (accessed on 20 September 2022).
  54. Nowak, D.J.; Hoehn, R.E.; Crane, D.E.; Stevens, J.C.; Walton, J.T.; Bond, J. A ground-based method of assessing urban forest structure and ecosystem services. Arboric. Urban For. 2008, 34, e347–e358. Available online: https://www.fs.usda.gov/treesearch/pubs/19526 (accessed on 20 September 2022). [CrossRef]
  55. Nowak, D.J.; Greenfield, E.J.; Hoehn, R.E.; Lapoint, E. Carbon storage and sequestration by trees in urban and community areas of the United States. Environ. Pollut. 2013, 178, 229–236. [Google Scholar] [CrossRef] [Green Version]
  56. Tritton, L.M.; Hornbeck, J.W. Biomass Equations for Major Tree Species of the Northeast; Gen. Tech. Rep. NE-69; U.S. Department of Agriculture, Forest Service, Northeastern Forest Experiment Station: Broomall, PA, USA, 1982; 26p. [Google Scholar]
  57. Wenger, K.F. Forestry Handbook; John Wiley and Sons: New York, NY, USA, 1984; 1335p. [Google Scholar]
  58. Stanek, W.; State, D. Equations Predicting Primary Productivity (Biomass) of Trees, Shrubs and Lesser Vegetation Based on Current Literature; Publ. BC-X-183; Canadian Forest Service: Victoria, BC, Canada, 1978; 58p. [Google Scholar]
  59. Clark, A.; Phillips, D.R.; Hitchcock, H.C. Predicted Weights and Volumes of Scarlet Oak Trees on the Tennessee Cumberland Plateau; Res. Pap. SE-214; U.S. Department of Agriculture, Forest Service, Southeastern Forest Experiment Station: Ashville, NC, USA, 1980. [Google Scholar]
  60. Cairns, M.A.; Brown, S.; Helmer, E.H.; Baumgardner, G.A. Root biomass allocation in the world’s upland forests. Oecologia 1997, 111, 1–11. [Google Scholar] [CrossRef]
  61. United States Department of Agriculture (USDA). Forest Carbon FAQs Biomass to Carbon Contents Conversion on Trees. Available online: https://www.fs.usda.gov/sites/default/files/Forest-Carbon-FAQs.pdf (accessed on 25 September 2022).
  62. Frelich, L.E. Predicting Dimensional Relationships for Twin Cities Shade Trees; Department of Forest Resources, University of Minnesota: St. Paul, MN, USA, 1992; p. 33. [Google Scholar]
  63. De Vries, R.E. A Preliminary Investigation of the Growth and Longevity of Trees in Central Park. Master’s Thesis, Rutgers University, New Brunswick, NJ, USA, 1987. [Google Scholar]
  64. Smith, W.B.; Shifley, S.R. Diameter Growth, Survival, and Volume Estimates for Trees in Indiana and Illinois; Res. Pap. NC-257; U.S. Department of Agriculture, Forest Service, North Central Forest Experiment Station: St. Paul, MN, USA, 1984; p. 10. [Google Scholar]
  65. United States Environmental Protection Agency (US-EPA), 2022. Greenhouse Gas Equivalencies Calculator. Available online: https://www.epa.gov/energy/greenhouse-gas-equivalencies-calculator#results (accessed on 25 September 2022).
  66. Baouendi, R. Development of a Prototype Tool for the Evaluation of the Sustainability of Canadian Houses. Master’s Thesis, Concordia University, Montreal, QC, Canada, 2003. [Google Scholar]
  67. Natural Resources Canada (NRC). 2015. Natural Gas: A Primer, Energy Sources and Distribution: Approximate Natural Gas Conversions. Available online: https://www.nrcan.gc.ca/energy/energy-sources-distribution/natural-gas/natural-gas-primer/5641#conversion (accessed on 20 September 2022).
  68. Athena Impact Estimator for Buildings. In User Manual and Transparency Document—Impact Estimator for Buildings v.5; IE4B v.5.4.0101; Athena Sustainable Materials Institute: Ottawa, ON, Canada, 2019; Available online: https://calculatelca.com/wp-content/uploads/2019/05/IE4B_v5.4_User_Guide_May_2019.pdf (accessed on 5 August 2022).
  69. Natural Resources Canada (NRC). 2020. Photovoltaic Potential and Solar Resource Maps of Canada. Available online: https://www.nrcan.gc.ca/our-natural-resources/energy-sources-distribution/renewable-energy/solar-photovoltaic-energy/tools-solar-photovoltaic-energy/photovoltaic-potential-and-solar-resource-maps-canada/18366 (accessed on 30 October 2022).
Figure 1. Research framework overview.
Buildings 13 00041 g001
Figure 2. Situation/location plan, and landscape boundaries/floor plan.
Buildings 13 00041 g002
Figure 3. Future Buildings Laboratory.
Buildings 13 00041 g003
Figure 4. Typical sections of the envelope assemblies.
Buildings 13 00041 g004
Figure 5. Typical landscape and garden of single-detached house in Dollard-des-Ormeaux. Source: Google Earth, 2022.
Buildings 13 00041 g005
Figure 6. Emissions contribution of each life cycle stage for FBL’s baseline scenario (A to C), using One Click LCA and Athena.
Buildings 13 00041 g006
Figure 7. Life Cycle GWP contribution by material type (and energy use, in red), for baseline scenario, using One Click LCA.
Buildings 13 00041 g007
Figure 8. Comparison between real situation (scenario 1) and gas-free (scenario 3) for the single-detached house.
Buildings 13 00041 g008
Table 1. Life cycle stages available in the LCA tools used in current work.
ModulesLife Cycle StagesIncluded
A1–A3Raw material supply; Transport; Manufacturing
A4Transport from manufacturing plant to construction site
A5Construction–installation process (equipment energy use)
B1Installed product in use
B2Maintenance
B3Repair 1
B4–B5Replacement; Refurbishment (according to materials’ service life)
B6Operational energy use
B7Operational water use
C1–C4De-construction/demolition; Transport; Waste Processing; Disposal
DBenefits beyond building life (biogenic carbon in wood products) 2
1 Results for “Repair” could be included manually on One Click (times/year), but are not considered in current work; 2 Results for “benefits beyond building life” are presented separately.
Table 2. U-values (W/m2.K) for FBL.
Building ElementsU-Value
Slab-on-grade foundations0.13
Exterior walls0.22
Roof0.14
Windows1.30
Doors1.40
Table 3. Energy simulation inputs for FBL.
InputsValueUnit
Occupancy20.0m2/person
Lighting power density5.0W/m2
Appliances and plug loads8.0W/m2
Heating setpoint22.0°C
Heating setback18.0°C
Cooling setpoint23.0°C
Coefficient of performance (summer)3.5-
Coefficient of performance (winter)2.0-
Ventilation rate (per person)5.0L/sec/person
Ventilation rate (per area)0.9L/sec/m2
Air change rate (per hour, at 50 Pa)0.8ACH
Table 4. Bill of materials according to Future Buildings Lab’s design specs, and correspondent material option chosen in One Click LCA and Athena.
Project SpecificationOne Click LCAAthena
m326.04Concrete 30 MPa—15 cm slab + bordersReady-mix concrete, 30 Mpa Industry Average Benchmark (CRMCA)Concrete Benchmark CAN 30 MPa
kg1953.6Steel bars (mesh) d = 10 mm, 10 × 10 cmReinforcement steel (rebar), 7850 kg/m3 (Gerdau, Whitby plant)Rebar, Rod, Light Sections
m2198.40Insulation, RSI-3.42, rigid, XPS, 127 mm XPS insulation, 15 psi, R-10, 50.8 mm, Foamular XPS (Owens Corning)Extruded Polystyrene
m2156.75Insulation, RSI-2.59, rigid, XPS, 76 mm
m2197.90Insulation, RSI-4.29 cavity fill, FG, 140 mmGlass wool insulation panels, unfaced, generic, L = 0.031 W/mK, R = 3.23 m2 K/WFG LF Cavity Fill R22
m2197.90Insulation, RSI-1.41, semi-rigid, MW, 51 mmRock wool insulation board, R = 8.6, 50.8 mm, 88 kg/m2, (Rockboard 60)MW Batt R11-15
m2119.22Insulation, RSI-1.41, semi-rigid, MW, 89 mm
m2156.75Insulation, RSI-5.64, semi-rigid, MW, 235 mmMineral fiber batt insulation, 6.89 inMW Batt R30
m2124.10Gypsum board, fire resistant, 13 mmGlass-mat gypsum boards, fire/moisture., 12.7 mm, 10.15 kg/m2 (AGC)1/2″ Fire- Type X Gypsum Board
m2395.19Gypsum board, regular, 13 mmGypsum plaster board, regular, generic, 6.5–25 mm, 10.725 kg/m2 for 12.5 mm1/2″ Regular Gypsum Board
m2400.89Gypsum board, fiber-board, 16 mmGypsum plaster board, regular, generic, 6.5–25 mm, 10.725 kg/m2 for 12.5 mm5/8″ Gypsum Fibre Gypsum Board
m2197.90Plywood board, 13 mmSoftwood plywood, 477.33 kg/m3 (Canadian Wood Council)Softwood Plywood
m2156.75Plywood board, external, 19 mmSoftwood plywood, 709.79 kg/m3 (American/Can. Wood Council)
m223.12Plywood board, 19 mmSoftwood plywood, 477.33 kg/m3 (Canadian Wood Council)
m316.33Glued Laminated TimberGlue laminated timber (Glulam), 467.3 kg/m3 (Canadian Wood Council)GluLam Sections
m38.16Wood joists, glulam, 5 × 25 cm, 300 mm spI-joist, wood (FPInnovations)
m31.34Wood joints cover for cladding, 2 × 4 cmSoftwood lumber, kiln-dried, 19 mm, 460 kg/m3 (Can. Wood Council)Small Dim. Softwood Lumb, kiln-dried
m36.84Wood studs, 5 × 20 cm, 400 mm spacing
m2197.90Eastern cedar cladding, painted, 19 mmWestern red cedar bevel siding, painted, 1 × 6 in (W Red Cedar Lumber Assoc.)Cedar Wood Shiplap Siding
m2532.34Air/water barrier 6 milAir and water barrier system, mechanically fastened, 0.11 kg/m2, Tyvek (DuPont)Air Barrier
m2396.65Vapor barrier, dynamic, 6 milPolypropylene Scrim Kraft Vap. Ret. Cl
m2156.75Metal roofing syst (45 mm w/membrane)Hot-dip galvanized steel sheets, 0.4–3.0 mm, zinc coating, 0.28 kg/m2 Metal Roof Cladding—Resident. 30 Ga
m2156.75Impermeable membrane (roof)SPPR PVC roofing membrane, single-ply, 40 mil (Chemic.Fab. Film Assoc.)#30 Organic Felt
kg200.00Bolts, Fasteners, ClipsStructural steel profiles, generic, 40% recycled contentBolts, Fasteners, Clips
m226.00Windows aluminum frameAluminum frame windows, 37 kg/m2—30% Alum., 61% Glazing (AluQuébec)Aluminum Window Frame
m226.00Double Glazed Hard Coated ArgonDouble Glazed Hard Coated Argon
m30.20Doors/steel doorsGalvanized steel door w/ polystyrene, 44.5 mm, 41 kg/unit (De La Fontaine)Rough Lumber SFWP
m75.00Steel structure on roof to support BIPV/T Stainless steel crash rails with tube brackets, 10.84 kg/m (Constr.Specialties)Steel Tubing
m2120.00Industrial floor paint—Epoxy or similarWater-based epoxy floor and wall coating, 2.31 kg/m2 (SherWilliams)Solvent Based Alkyd Paint
Solvent Based Varnish
m2698.31Paint internRecycled latex paints, interior, 12 m2/L, 1.23 kg/L, 0.205 kg/m2, (Laurentide)Water Based Latex Paint
m223.12Vinyl cover, 12pprox. 3 mmVinyl tile flooring, 2.4–3.2 mm, 6.4–6.9 kg/m2 (Armstrong, Tarkett)Vinyl Siding
unit1.00HVAC (air src heat pump, 2.5 kW output, 47.5 MJ/h) + air handling unitGround source heat pump (excluding ground tubes), per 1 kW max output N/A—One Click’s results adopted
Air hand. Unit, w/ heat recovery, indirect liq. Circulation, 1000 m3/h, 92 kg/unit N/A—One Click’s results adopted
m215.00PV system 1.63 kWp (BIPV on south façade)PV polycrystalline panel, per m2, 14.5 kg/m2, 210 Wp (One Click LCA)N/A—One Click’s results adopted
Obs.: For insulation materials, software’ default thicknesses (provided in terms of functional unit) were adjusted to match the R-values defined in project specifications.
Table 5. Energy simulation inputs and parameters for the single-detached house.
Energy Simulation InputsValueUnitEnvelope AssembliesU-Value (W/m2.K)
Occupancy60.0m2/personBasement floor1.00
Temperature setpoint for heating19.0°CBasement walls0.48
Temperature domestic hot water55.0°CAbove ground walls 0.45
Forced-air natural gas furnace heating80MJ/hRoof and ceiling 0.18
Volumetric air flow rate210.0L/s
Air change rate (measured, at 50 Pa)7.76ACH
Obs.: U-values of walls include windows and doors.
Table 6. Bill of materials according to single-detached house design specs, and correspondent material option chosen in One Click and Athena.
Project SpecificationOne Click LCAAthena
m336.77Concrete 30 MpaReady-mix concrete, 30 MPa Industry Average Benchmark (CRMCA)Concrete Benchmark CAN 30 MPa
kg3991.24Steel rebars (double mesh) Reinforcement steel (rebar), generic, 80% recycled content, A615Rebar, Rod, Light Sections
m312.55Brick veneer, 10.9 mm thicknessClay brick, 2120 kg/m3 (several manufacturers)Ontario (Standard) Brick
m33.46Mortar (0.03 3 per m2 of brickwork)Lightweight mortar, single component, 3.625 kg/m2 (Mapei)Mortar
m2107.62Insulation RSI-4.94, FG, cavity fill, 89 mmInsulation, glass wool, loose, 30 m2 K/W, Industry average US (NAIMA)FG LF Cavity Fill R30
m2137.55Insulation RSI-3.53, FG, cavity fill, 152 mmGlass wool insulation panels, unfaced, generic, L = 0.031 W/mK, R = 3.23 m2 K/WFG LF Open Blow R13-20
m2137.55Insulation RSI-3.53 FG, continuous, 152 mm
m2958.57Gypsum board, 13 mmGypsum plaster board, regular, generic, 12.5 mm, 10.725 kg/m21/2” Regular Gypsum Board
m2594.63Plywood board, 13 mmSoftwood plywood, 477.33 kg/m3 (Canadian Wood Council)Softwood Plywood
m2497.88Polyethylene sheet, 6 milPVC-polyester waterproofing membrane (Chemical Fabrics and Film Association)6 mil Polyethylene
m2275.10Wood flooringSolid hardwood flooring, 19 mm, 12.35 kg/m2 (Wickham)Spruce Wood tongue/groove (closest option)
m36.88Wood studs 5 × 15 cmSoftwood lumber, kiln-dried, 460 kg/m3, (Canadian Wood Council)Small Dimension Softwood Lumber, kiln-dried
m38.80Wood studs 5 × 10 cm
m31.70Wood joists 5 × 10 cmGluLam Sections
m30.76Wood Doors Hardwood lumber (Quebec Wood Export Bureau)Rough Lumber SFWP
m217.00Windows aluminum frameAluminum frame windows, 37 kg/m2, 30% Alum., 61% Glazing (AluQuébec) Aluminum Window Frame
m217.00Double glazed unitsDouble Glazed Soft Coated Air
m2958.56Paint internRecycled latex paints, interior, colored, 0.205 kg/m2 (Laurentide re/sources)Water Based Latex Paint
m2204.36Asphalt shingleFiberglass asphalt shingle roofing system, 12.7 kg/m2 (ARMA)Organic Felt shingles 30 yr
m2204.36Organic feltSPPR PVC roofing membrane, 60 mil (Chemical Fabrics and Film Association)6 mil Polyethylene
kg200.00Bolts, Fasteners, ClipsStructural steel profiles, generic, 40% recycled content, I, H, U, L, and T sectionsBolts, Fasteners, Clips
unit1.00HVAC (forced-air nat gas furnace, 80 MJ/h)Air handling unit, w/ heat recovery, liquid circulation, 1000 m3/h, 92 kg/unit N/A—One Click results adopted
Obs.: For insulation materials, softwares’ default thicknesses (provided in terms of functional unit) were adjusted to match the R-values defined in project specifications.
Table 7. LCA results for Future Buildings Laboratory: Global warming potential (without contribution of trees).
ModulesLife Cycle StagesOne Click LCA
kgCO2eq over 60 yr
Athena
kgCO2eq over 60 yr
A1–A3Material manufacturing processes55,715.7651,692.01
A4Transportation to site2131.451793.95
A5Construction process2633.841647.87
B4–B5Replacement; Refurbishment14,282.1414,320.24
B6Operational energy use5445.389737.97
C1–C4End-of-life (demolition; disposal; waste processing)3313.143473.99
DBenefits beyond building’s life (biogenic carbon in wood products)−35,885.45−27,553.12
Scenario 1Total Emissions—Modules A to C—baseline scenario83,521.71 (11.13)82,666.02 (11.02)
Scenario 2Total Emissions—Modules A to D47,636.26 (6.31)55,112.90 (7.34)
Obs. 1: HVAC and PV are not available in Athena database. Thus, for these two items, the values from One Click were considered for Athena;
Obs. 2: Values between parenthesis (e.g., (9,28)) refers to the equivalent CO2eq emissions results per m2 of heated floor area per year.
Table 8. LCA results for the single-detached house: Global warming potential (without contribution of trees).
ModulesLife Cycle StagesOne Click LCA
kgCO2eq over 60yr
Athena
kgCO2eq over 60yr
A1–A3Material manufacturing processes36,404.7428,419.32
A4Transportation to site2845.622142.13
A5Construction process1968.341213.91
B4–B5Replacement; Refurbishment9812.949378.59
B6Operational energy use491,894/29,443 *523,812/52,654 *
C1–C4End-of-life (demolition; disposal; waste processing)1981.081889.72
DBenefits beyond building life (biogenic carbon in wood products)−26,084.30−25,736.74
Scenario 1Total Emissions (Modules A to C)—baseline scenario544,907.34 (35.20)566,856.35 (36.62)
Scenario 2Total Emissions (Modules A to D)518,823.04 (33.51)541,119.61 (34.95)
Scenario 3Total Emissions (Modules A to C)—natural gas converted to electricity82,456.32 (5.32)95,697.69 (6.18)
* Emissions from module B6 (operational energy use) considering the setup where natural gas was converted to electricity.
Obs. 1: HVAC and Boiler are not available in Athena’s database. Thus, for these two items, the values from One Click LCA were considered for Athena;
Obs. 2: Values between parenthesis (e.g., (35.20)) refers to the equivalent CO2eq emissions results per m2 of heated floor area per year.
Table 9. Energy consumption and operational emissions for the Single-detached house (scenarios #01 and #03).
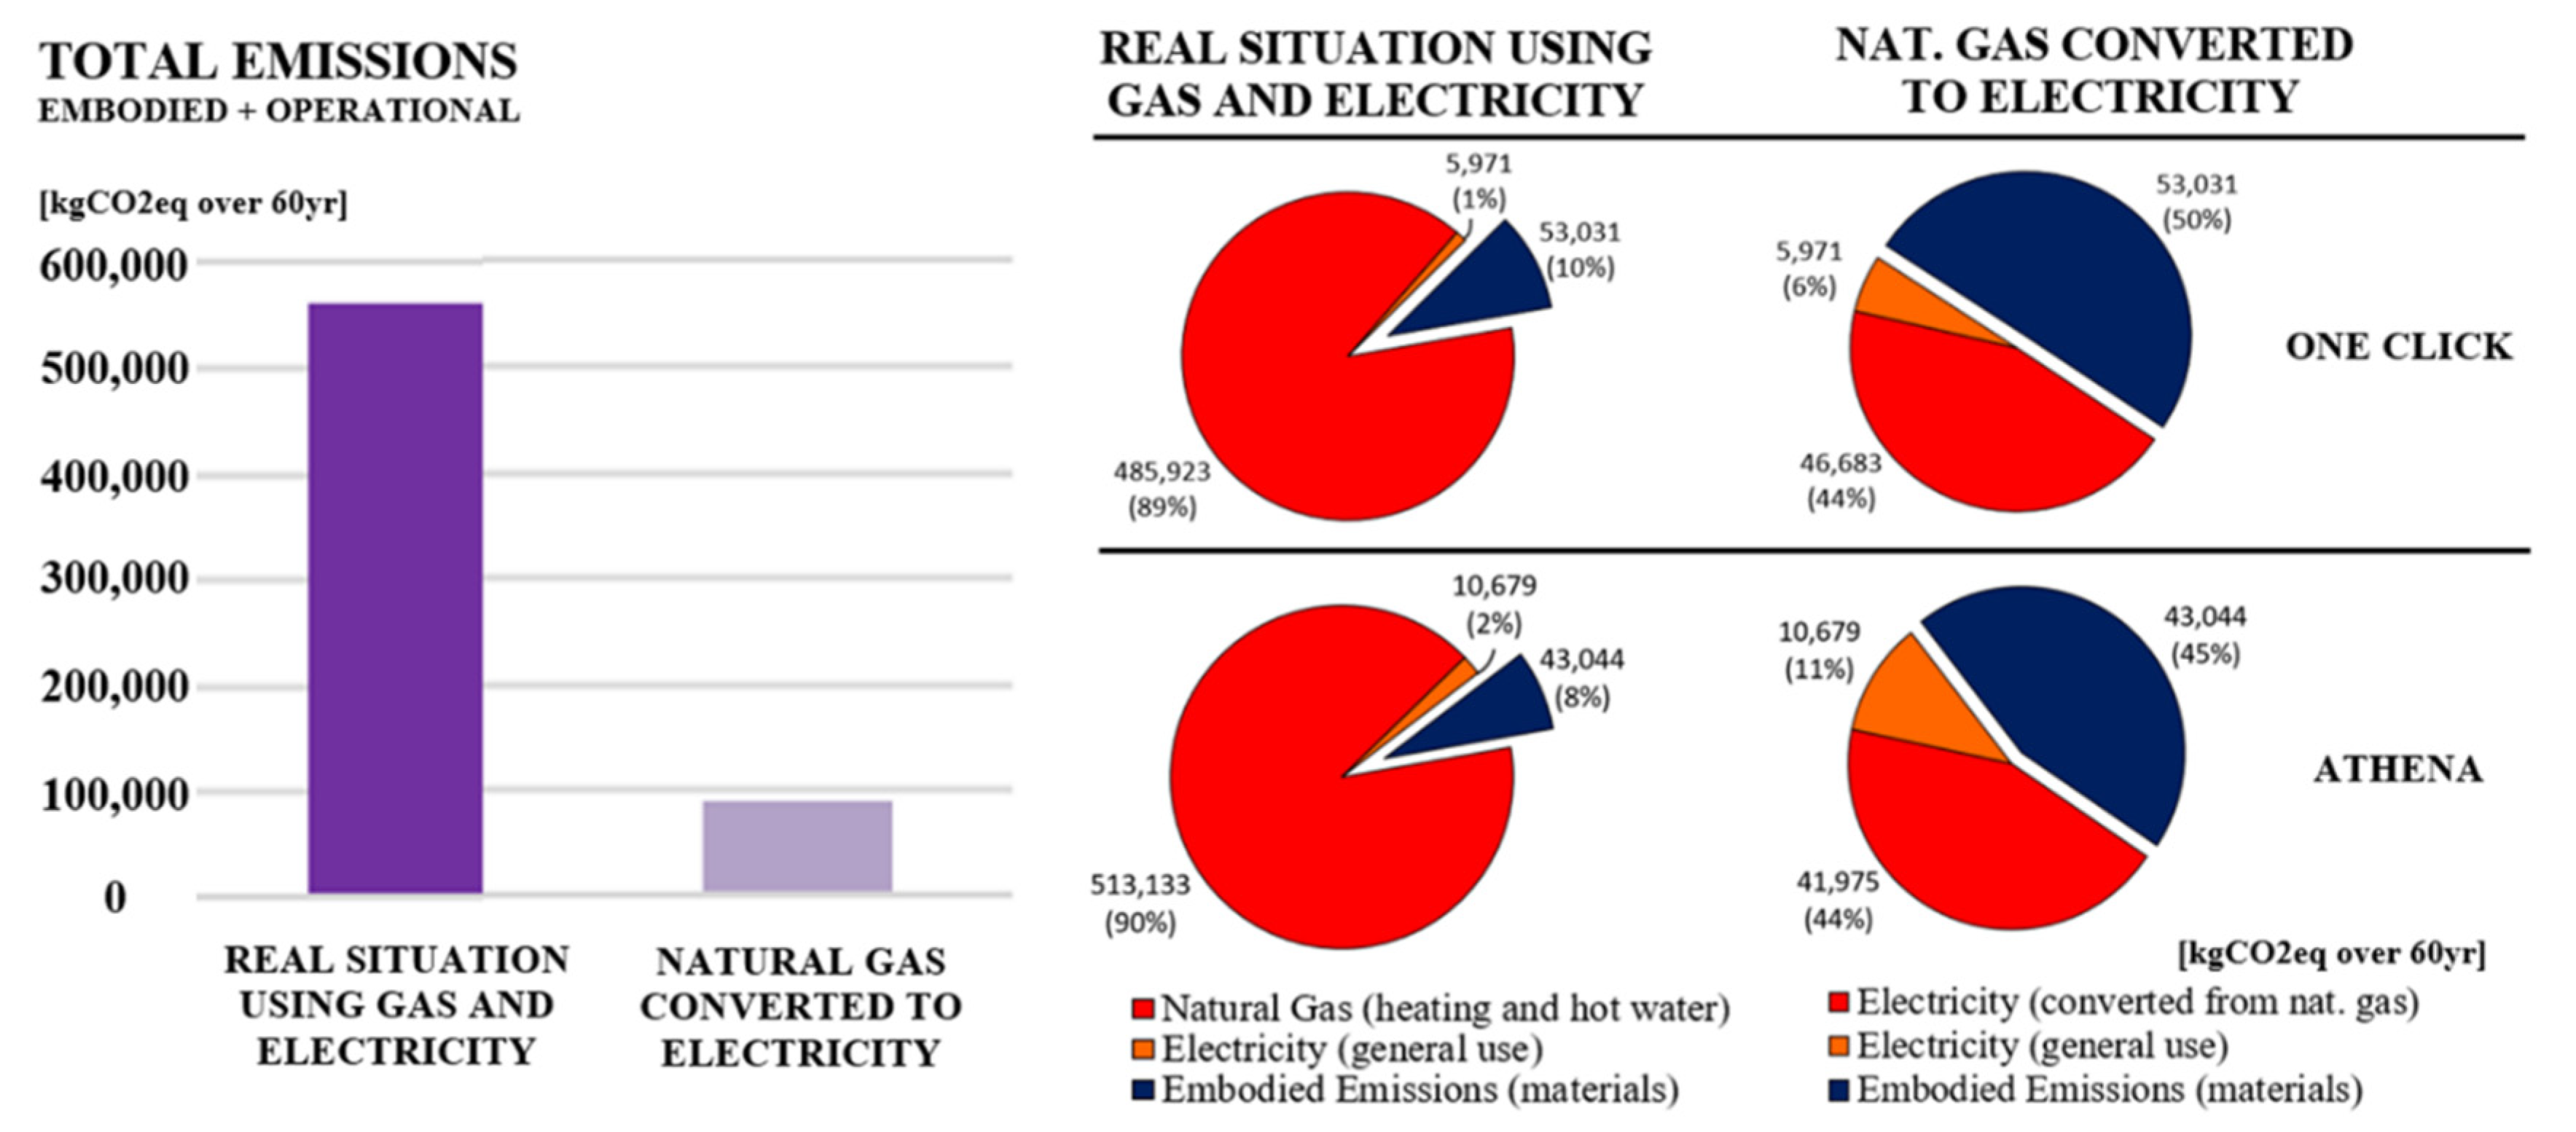
REAL SCENARIO 1 (electricity + natural gas)Energy Consumption
(Annual)
One Click LCA
kgCO2eq over 60yr
Athena
kgCO2eq over 60yr
Electricity 9725 kWh/year597110,679
Natural gas 3561.3 m3/year485,923513,133
Total Operational Emissions (module B6) 491,894523,812
SCENARIO 3 (natural gas converted to electricity)
Electricity9725 kWh/year597110,679
Electricity (from natural gas)38,225 kWh/year23,47241,975
Total Operational Emissions (module B6) 29,44352,654
Obs. 1: 13 of natural gas is equivalent to 10.7330 kW [67]
Obs. 2: Equivalent CO2 emissions per kWh from electricity: 0.010234 kgCO2eq/kWh (One Click) and 0.018302 kgCO2eq/kWh (Athena)
Obs. 3: Equivalent CO2 emissions per kWh from natural gas: 0.211869 kgCO2eq/kWh (One Click) and 0.223734 kgCO2eq/kWh (Athena)
Table 10. Summary of results and contribution of trees on reducing buildings’ life cycle carbon emissions.
Total Emissions
(without trees)
kgCO2eq over 60yr
Total CO2
Sequestration *
kgCO2eq
Final Carbon Balance
(with trees)
kgCO2eq over 60yr
Trees Contribution

[%]
OneClickAthenaper yearover 60yOne ClickAthenaOne ClickAthena
FUTURE BUILDINGS LAB
Scenario 01 (A to C)-baseline83,52267,531235.714,14569,37768,52116.9%17.1%
Scenario 02 (A to D)47,63639,97733,49140,96829.7%25.7%
SINGLE-DETACHED HOUSE
Scenario 01 (A to C)-baseline544,907566,856290.317,418527,489549,4383.2%3.1%
Scenario 02 (A to D)518,823541,120501,405523,7023.4%3.2%
Scenario 03 (A to C) - gas-free82,45695,69865,03878,28021.1%18.2%
* Calculated using annual CO2 sequestration rate of 0.575 kgCO2eq/m2TC, garden areas of 410 m2 (FBL) and 505 m2 (Single-detached house), and 60-year time horizon.
Table 11. Carbon balance considering only operational use stage.
Operational Emissions
(Module B6)
kgCO2eq over 60yr
Total CO2
Sequestration
kgCO2eq over 60yr
Carbon Balance
(Operational Stage)
net kgCO2eq
Trees
Contribution
[%]
One ClickAthenaFrom TreesOne ClickAthenaOne ClickAthena
Future Buildings Laboratory5445973714,145−8700−4408260%145%
Single-detached House *29,44352,65417,41812,02535,23659%33%
* Considering the scenario where natural gas has been converted to energy equivalent value of electricity.
Table 12. CO2 offset from additional strategies in FBL (kgCO2eq over life cycle).
Benefits beyond building’s life (Biogenic carbon in wood products)35,885
Garden fully covered by urban trees14,145
1.63 kWp vertical PVs system electricity generation 875
130 m2 irrigated and fertilized green roof * 33,540
Total emissions offset84,445
Final balance with addition solutions:      ** 83,522  –  84,445  =   – 893
* For the green roof, a 10y calculation period was assumed, since this kind of vegetation may have a shorter life cycle.
** See Table 7.
Disclaimer/Publisher’s Note: The statements, opinions and data contained in all publications are solely those of the individual author(s) and contributor(s) and not of MDPI and/or the editor(s). MDPI and/or the editor(s) disclaim responsibility for any injury to people or property resulting from any ideas, methods, instructions or products referred to in the content.

