Article

Axial Compression Behavior of Wall-like Reinforced Concrete Columns Retrofitted Using Different FRP Schemes

Chair of Research and Studies in Strengthening and Rehabilitation of Structures, Department of Civil Engineering, King Saud University, Riyadh 11421, Saudi Arabia
*
Author to whom correspondence should be addressed.
Buildings 2023, 13(1), 26; https://doi.org/10.3390/buildings13010026
Submission received: 15 November 2022 / Revised: 13 December 2022 / Accepted: 15 December 2022 / Published: 22 December 2022
(This article belongs to the Section Building Materials, and Repair & Renovation)

Abstract

:
Experimental and numerical investigations on the retrofitting of half-scale wall-like reinforced concrete (RC) columns were conducted. The axial compressive behavior of the control un-strengthened wall-like RC column (having a section aspect ratio of four) was compared with the strengthened columns. The columns were strengthened by employing external confinement through fiber-reinforced polymer (FRP) wraps and/or steel/FRP strips with/without modification of the column cross-section. The characteristics of axial load versus displacement and strain curves were discussed. The experimental results were also compared with the numerical models, which were first validated against the previous studies. A reasonably close agreement was achieved between the numerical and the test results with an error in prediction of less than 10% for the peak load. With the different schemes used for confinement, the enhancement in the load capacity of strengthened columns was in the range of 30–42% of the control column. In addition, significant ductility improvements were seen in schemes that employed the FRP wraps after shape modification.

Graphical Abstract

1. Introduction

The strengthening and/or rehabilitation of reinforced concrete (RC) columns often becomes mandatory for increasing their ductility and strength. It is used to meet the structural needs that result from an increase in loading, deficient design, a revision of the design code, or inappropriate construction techniques and degradation due to exposure conditions and aging. Generally, circular columns and columns with square/rectangular cross-sections were extensively strengthened by external confinement using fiber-reinforced polymer (FRP) wraps [1,2,3,4]. The external rebars, with and without the use of FRP wraps, in the form of steel/FRP strips, were also used in these columns. The confining action of the FRP wraps is dependent on the cross-section geometry of columns. Studies in the past have shown that the FRP jacketing of circular columns was most effective in providing confinement as fibers were equally stressed along the cross-section. For square columns, fibers near the corner areas were more stressed, thereby providing unequal confinement. Similarly, for rectangular columns, the confinement was heavily dependent on the dimensions of the two sides of cross-sections—the efficiency of FRP wraps reduces considerably as the aspect ratio (the ratio of the larger dimension to the shorter dimension of the cross-section) of the cross-section becomes greater than two [5]. Moreover, because of the nonuniform confining pressure and also due to the corner effects, the failure of FRP-strengthened rectangular columns occurs at low FRP strains [6,7,8,9,10].
For wall-like columns, columns with aspect ratios ≥ 3, experimental and numerical studies that deal with FRP confinement are rather limited. The limited research [11,12,13,14,15,16,17,18,19,20,21,22] conducted highlights the following points:
  • A combination of layers of glass FRP (GFRP) and/or carbon FRP (CFRP) was extensively used for strengthening.
  • The circumferential FRP combined with the longitudinal wraps of FRP help in enhancing the column strength.
  • The low effectiveness of FRP wraps could be increased by transforming the rectangular cross-sectional shape to an elliptical cross-section.
  • The addition of bolted steel plates along the column height in combination with the circumferential FRP wraps results in better confinement.
  • Anchored and unanchored circumferential FRP wraps with strengthened corners were used to increase the confinement.
  • The transformation of the shorter dimensions of the columns by use of semi-cylindrical attachments was effective in enhancing the column strength.
  • The buckling of main rebars could be delayed for columns strengthened with c-shaped FRP wraps around the corners.
Recently, Avossa et al. [23] investigated numerically the axial behavior of concrete wall-like columns upgraded with FRP. They compared the performance of available models for predicting the load-carrying capacity of FRP-strengthened RC columns tested by various researchers. Additionally, nonlinear FE modeling was conducted on eight FRP-strengthened RC wall-like columns tested in the literature using the commercial FE software ANSYS [24]. The predictions obtained from FE analysis were in reasonably good agreement with the test results, with prediction errors in axial capacity ranging from 9.8% to 12.3%. Finally, a simple model was developed to assess the load-carrying capacity of FRP-strengthened columns.
It is clear from the above studies that the confinement of wall-like columns received limited attention compared to the studies conducted on square and circular columns, which is mainly due to the involvement of enormous efforts and resources in such studies. Due to the size effect [25,26,27], studies in the recent literature, which were limited to the scaled columns due to the enormous cost involved in the preparation of test specimens and the limited capacity of test machines, were not sufficient to relate their behavior to that of actual column sizes. Moreover, a systematic comparative study that entails different schemes of strengthening is not available.
In this paper, the authors investigated the axial compressive behavior of strengthened RC wall-like columns in a systematic manner. Four strengthening schemes were employed. Columns with an aspect ratio of four were tested. The columns were strengthened by employing external confinement using FRP wraps and/or steel/FRP strips with/without modification of the column cross-section. The characteristics of axial load versus displacement and strain curves were discussed. The experimental results are also compared with the numerical results, which were first validated against the previous studies. With the different schemes used for confinement, the enhancement in the strength of strengthened columns was in the range of 10–80% of the control column. Significant ductility improvements were seen in schemes that employed the FRP wraps after shape modification.

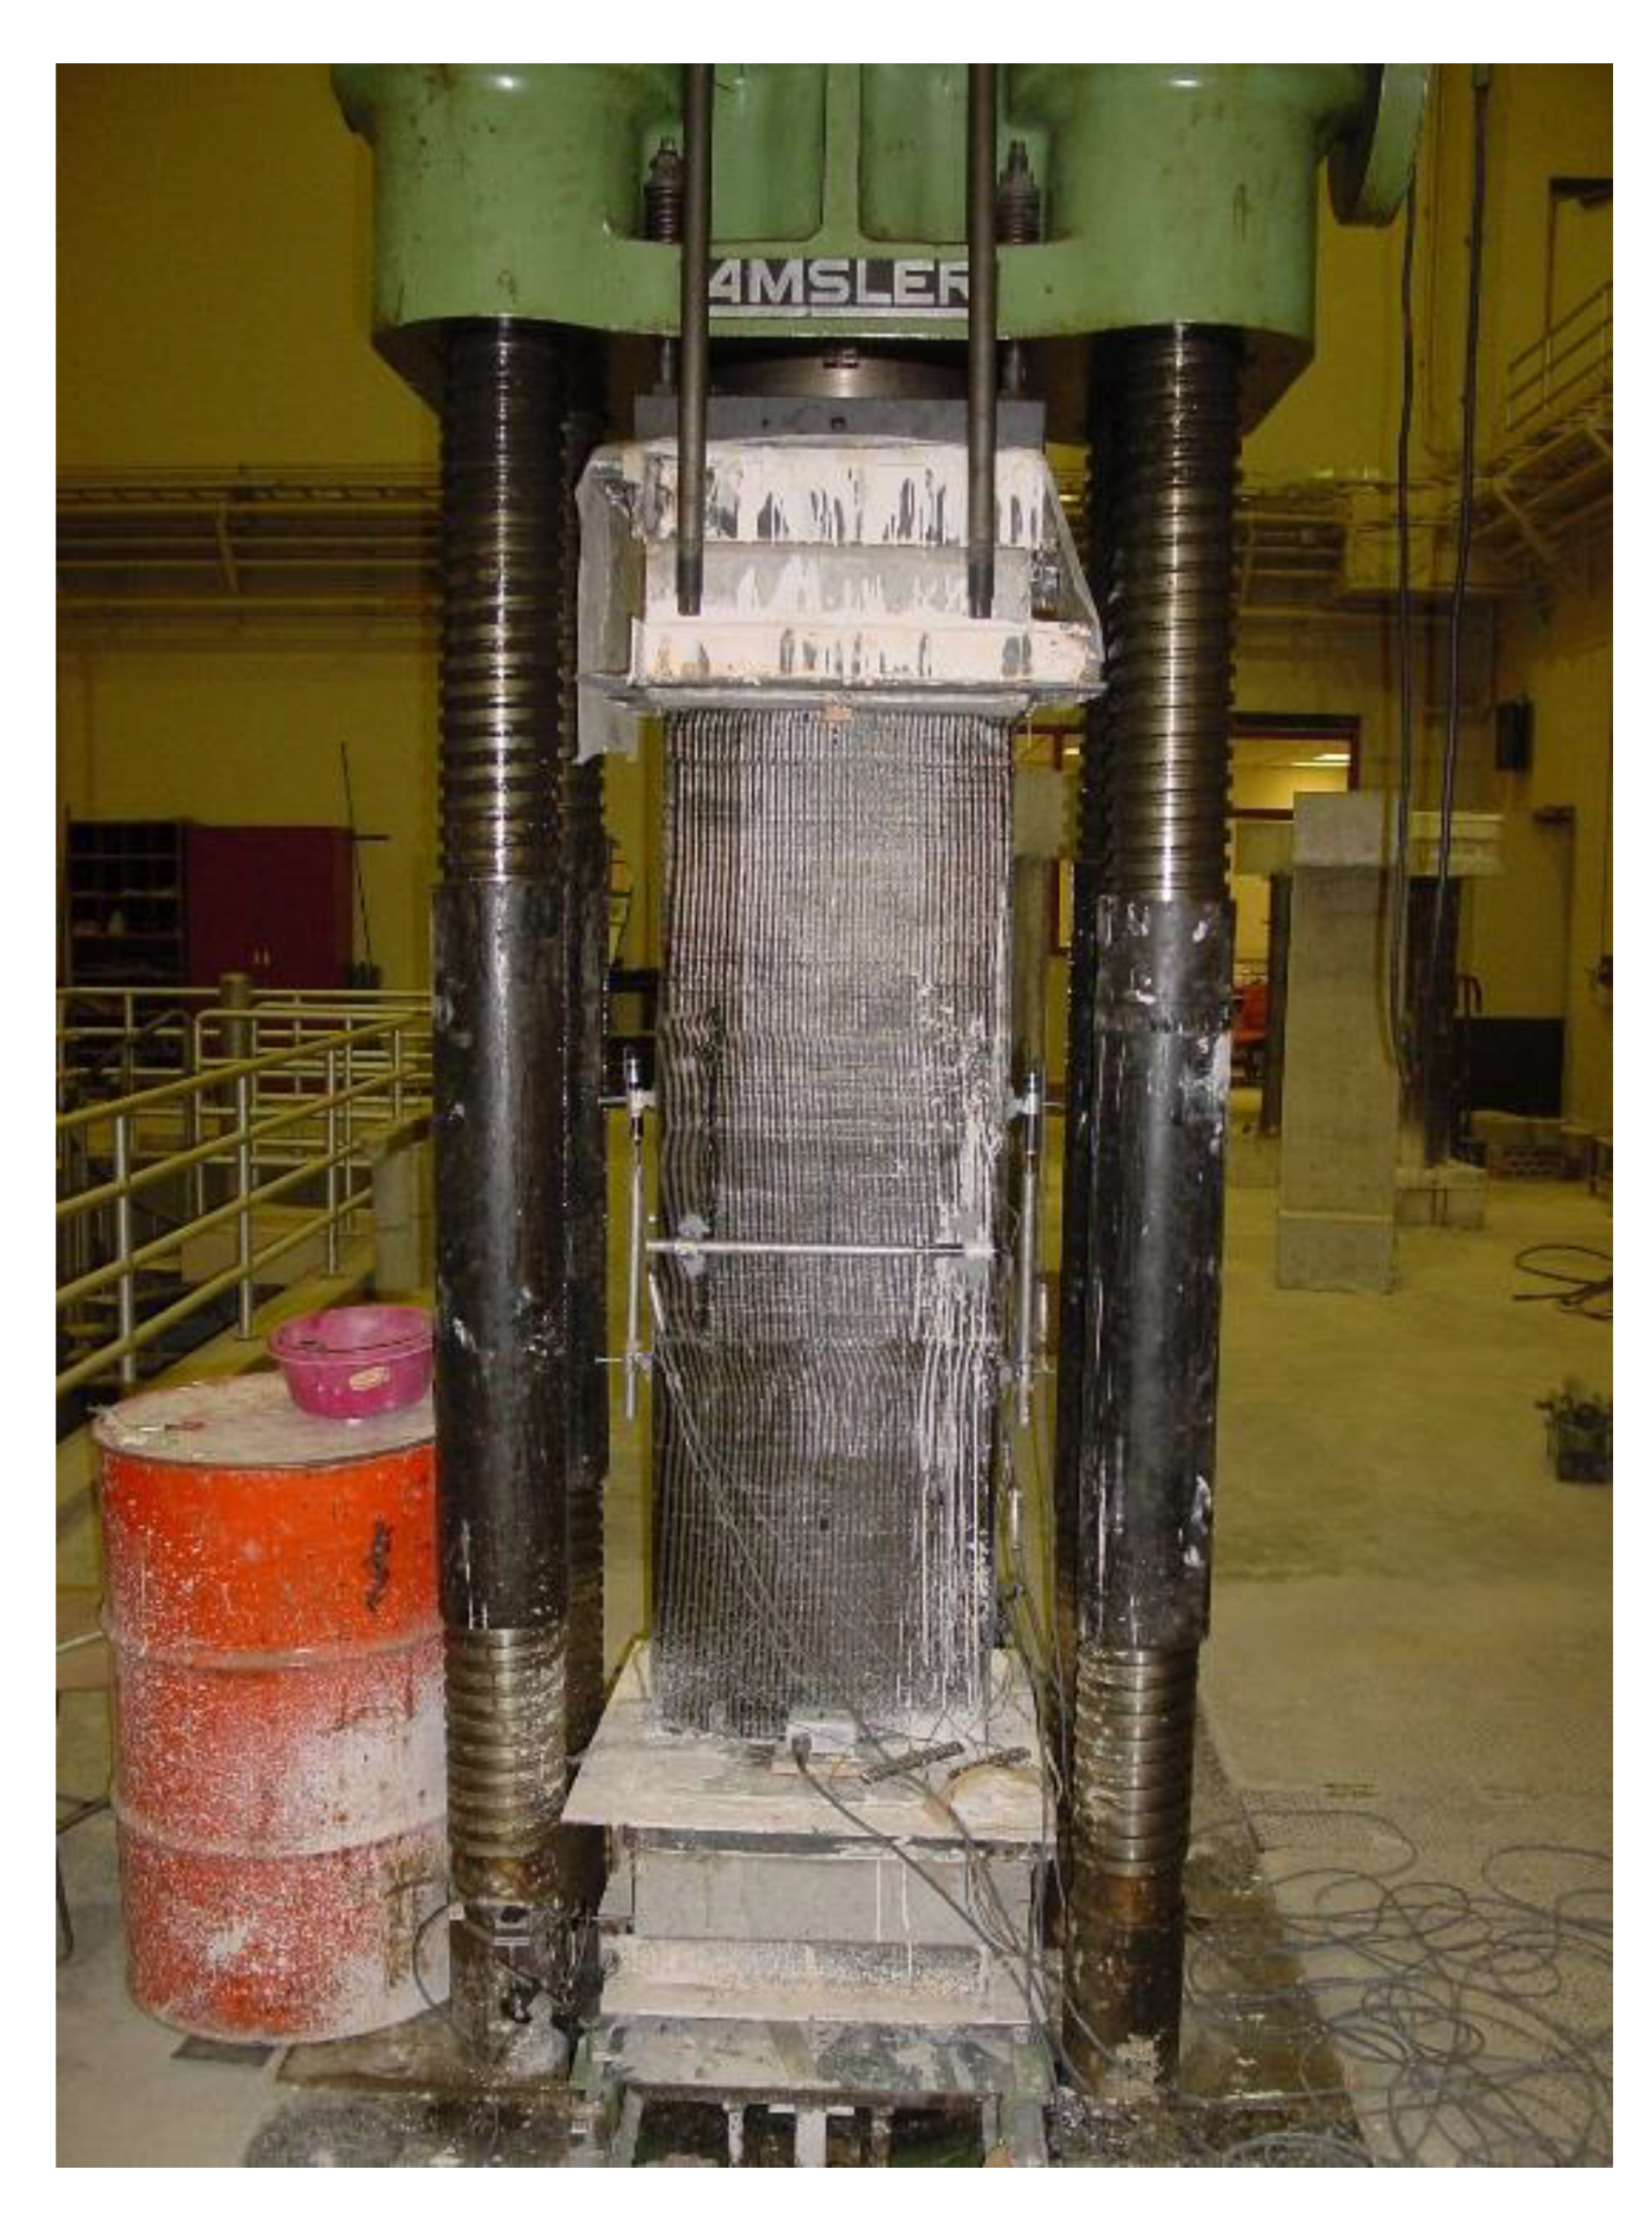
2. Experimental Program

The experiments were performed with the objective of investigating the effectiveness of different strengthening schemes involving CFRP/GFRP wraps and/or steel/FRP strips (with/without modifying the column section) on the compression performance of rectangular wall-like concrete columns with a large aspect ratio. Four schemes for the strengthening of wall-like concrete columns were investigated.

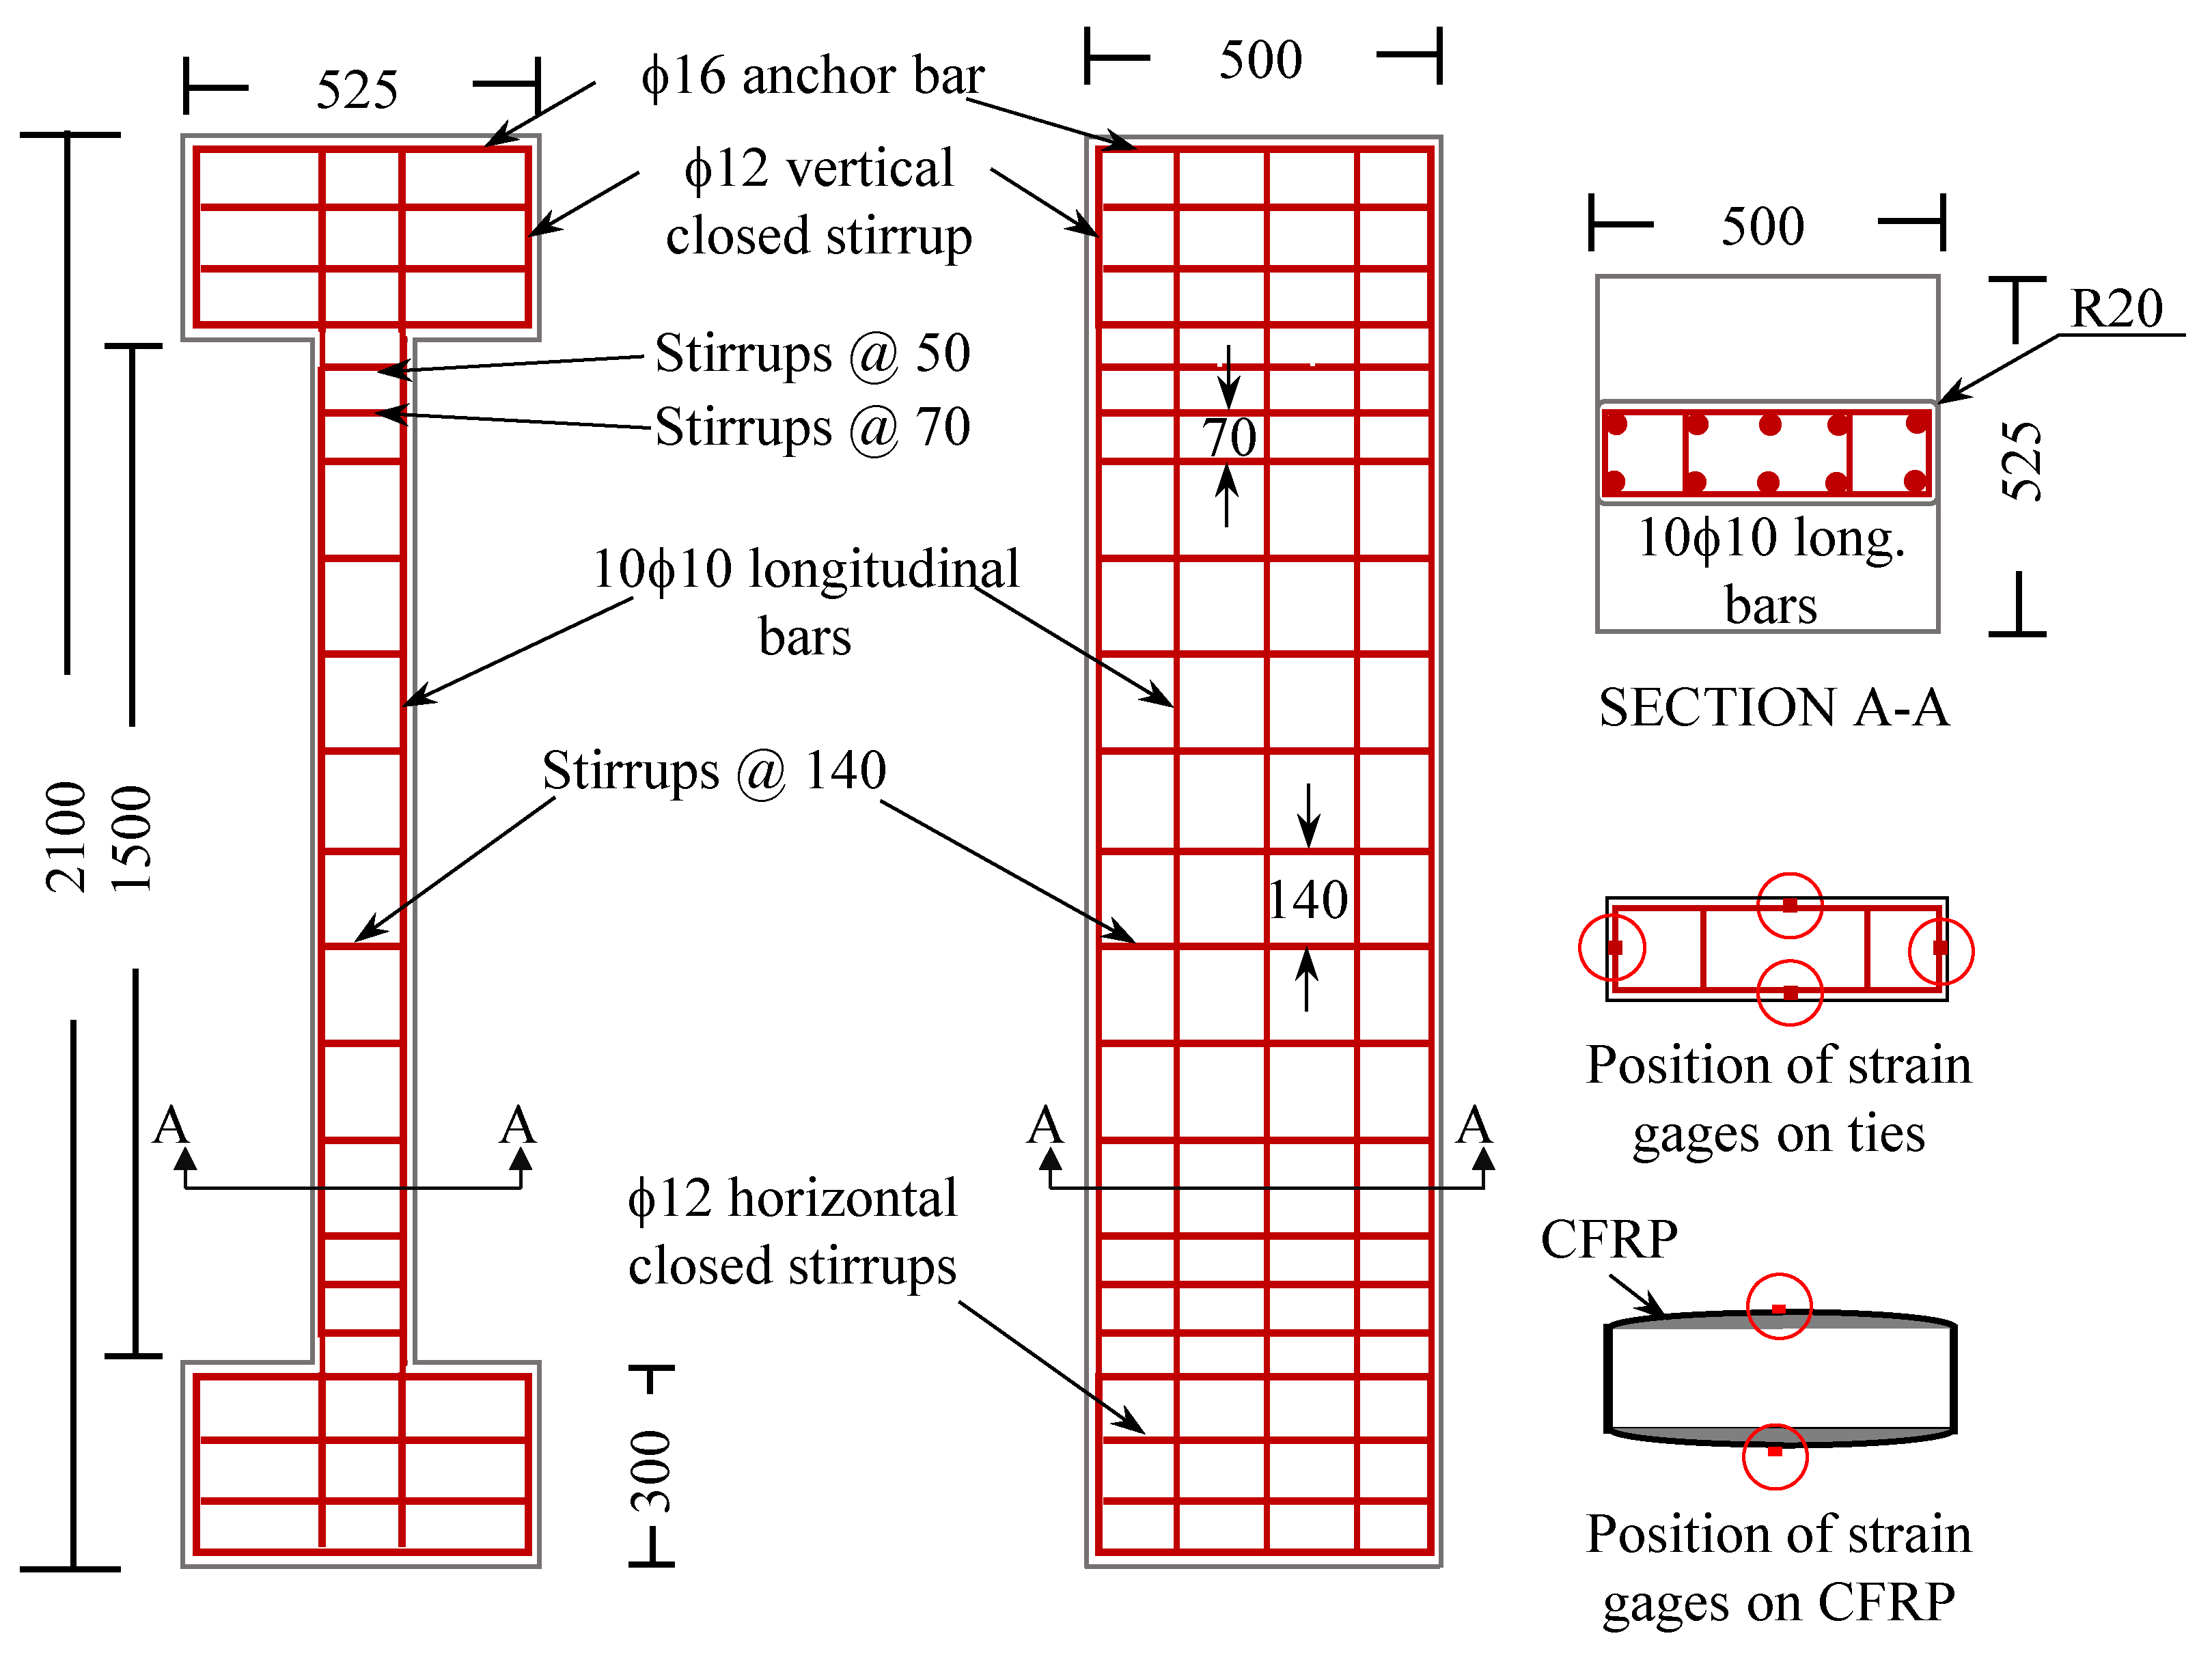
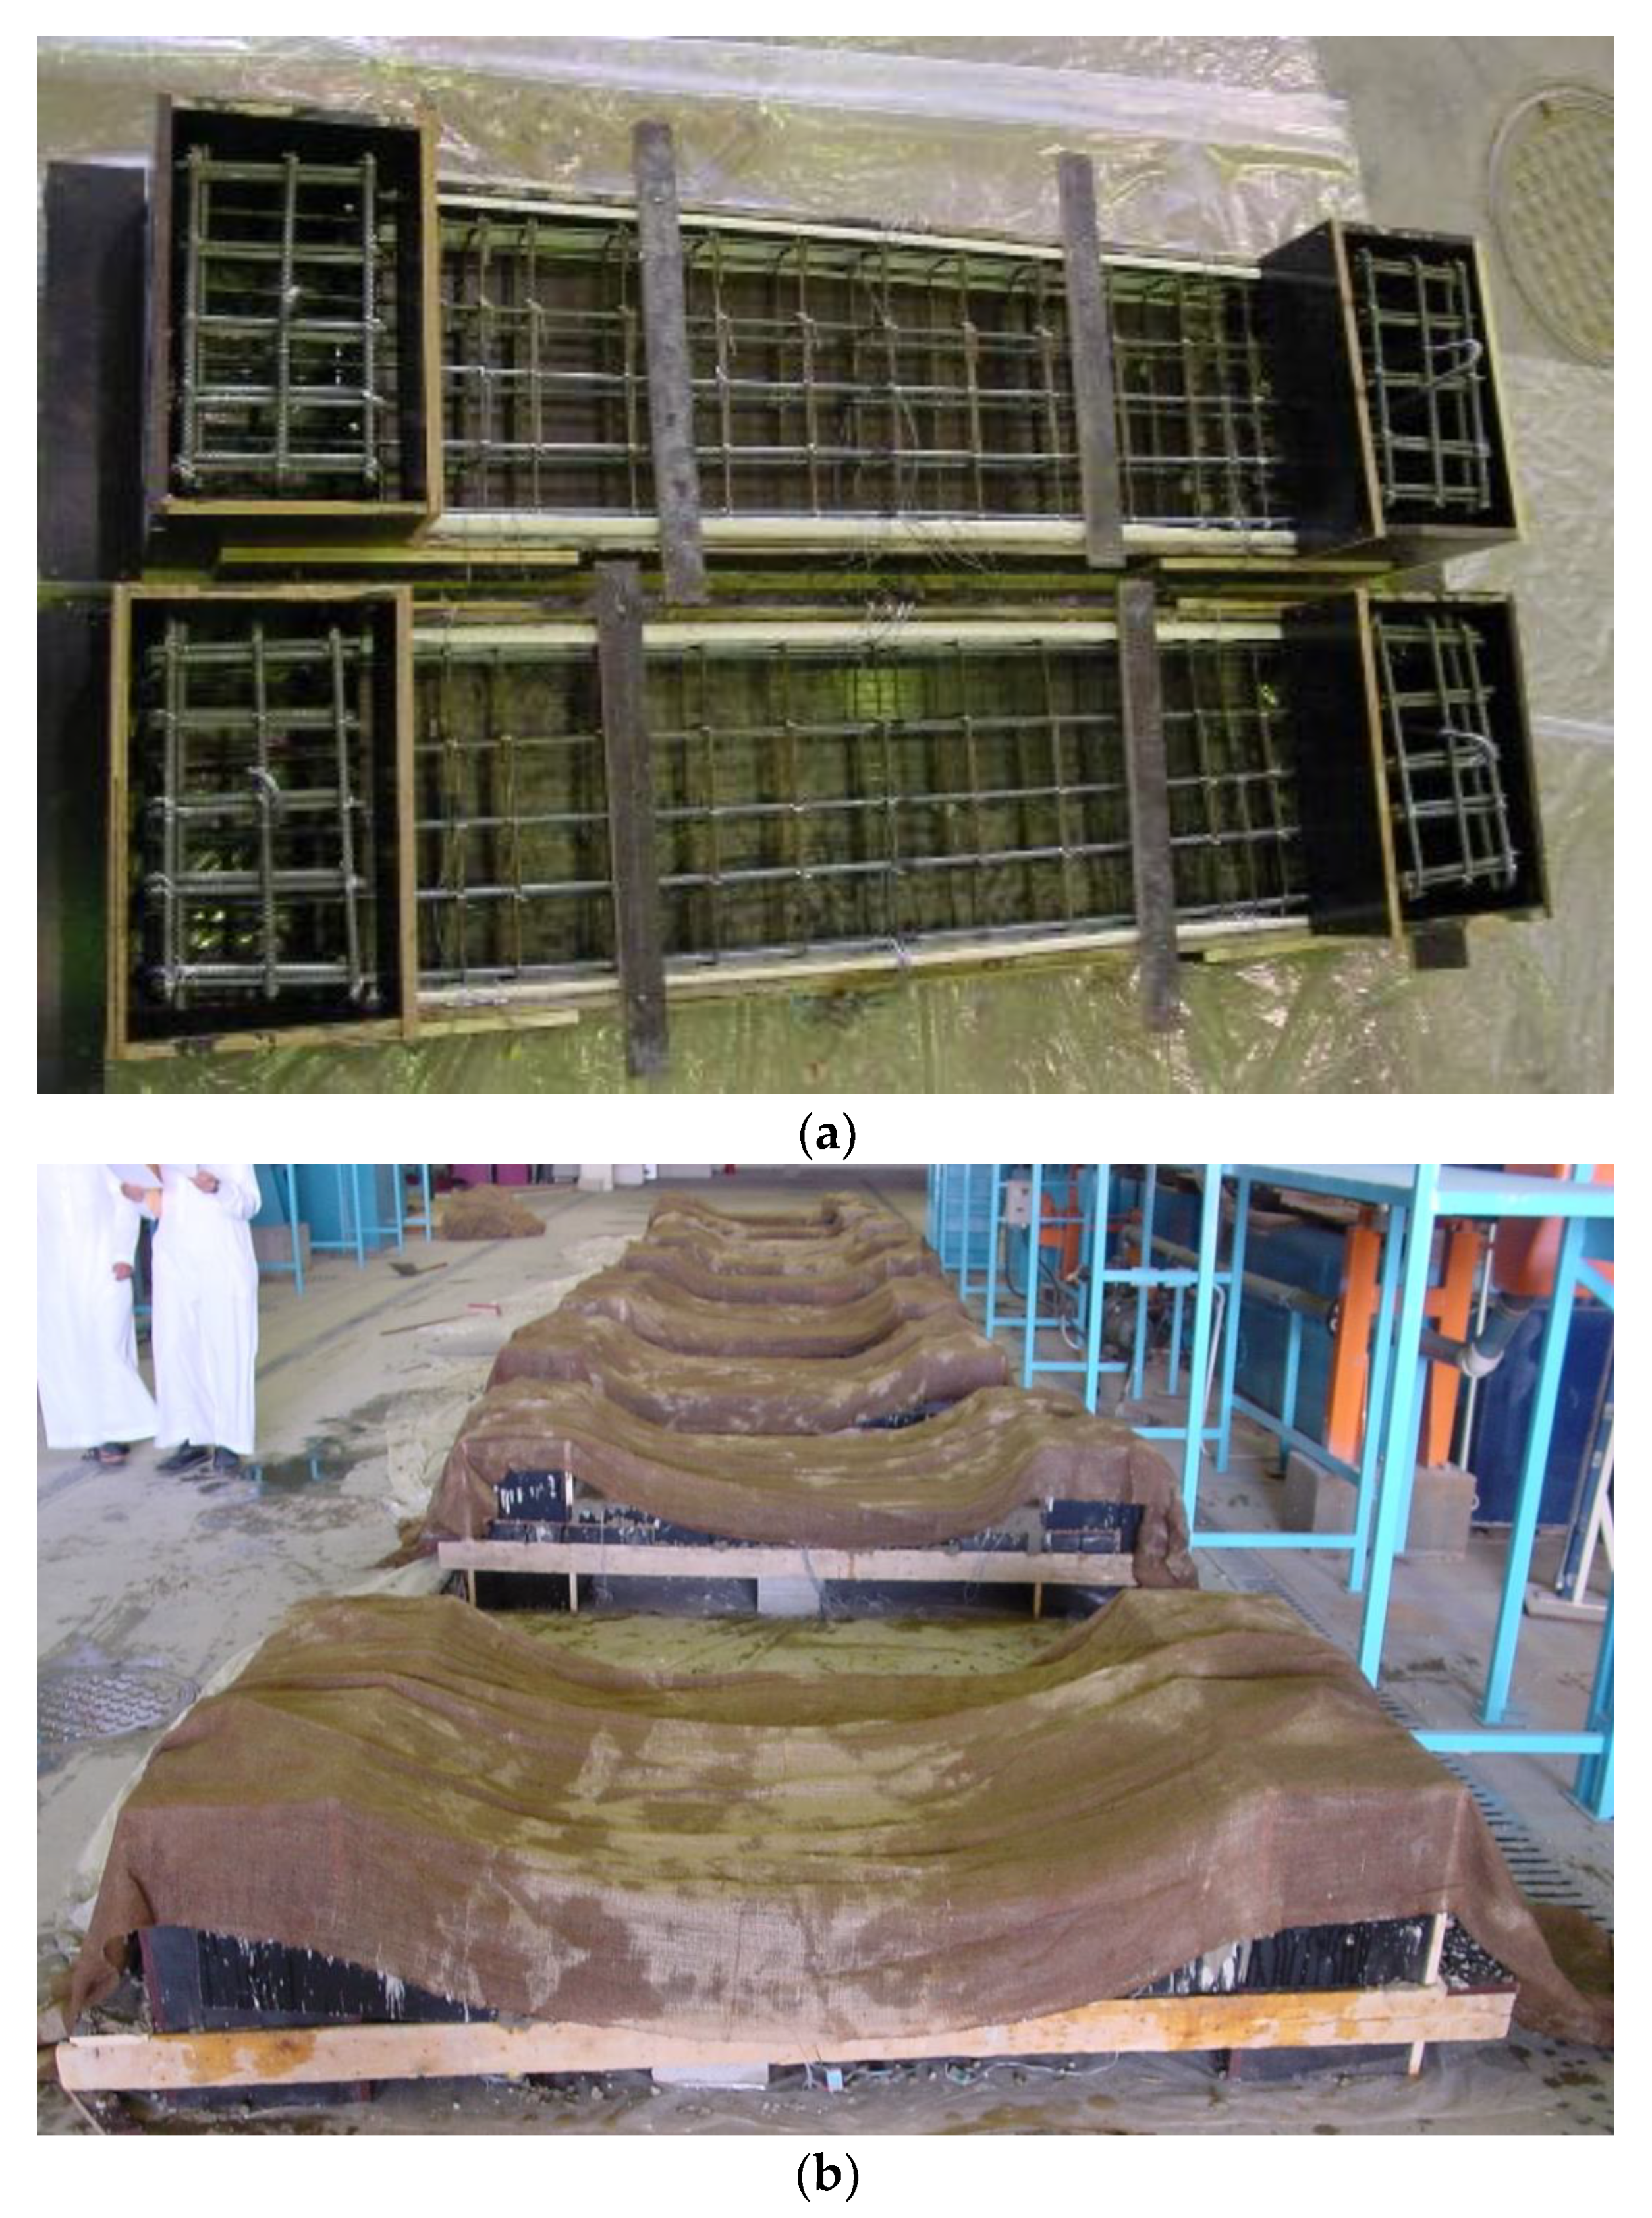
2.1. Specimen Details

The test matrix comprised five half-scale RC wall-like columns. One column was un-strengthened, and it was used as a control, whereas the other four columns were retrofitted using different FRP systems. The RC columns had a 125 × 500 mm section and 1500 mm height. The columns were reinforced using 10 rebars of 10 mm as longitudinal reinforcement, and 6 mm rebars were used for transverse reinforcement. An enlarged cross-section measuring 500 × 525 and 300 mm high was provided at the column ends for ensuring proper compressive load distribution, as shown in Figure 1. In order to avoid the premature damage of FRP sheets at sharp corners, the corners were rounded. The average diameter of the rounded edges was 20 mm. The steel cage prepared outside was lowered in the wooden form and aligned for keeping a uniform concrete cover. Figure 2 shows the steel cage and column cast and cured in a horizontal position. Although the casting procedure adopted does not truly simulate the actual practice of casting columns in the vertical position, the columns were cast in the horizontal position (in one layer) for:
  • Avoiding casting in two or more layers when done in the vertical position, which could have resulted in construction joints.
  • Having good quality control in placing and compaction of concrete, which was difficult to achieve in casting in the vertical position, especially due to the large size of the specimen and small width of the column.
  • The ease of casting.
All wall-like column test specimens were identical except for the strengthening schemes.

2.2. Material Characteristics

The steel bars employed as longitudinal reinforcement and ties were tested in direct tension following the ASTM test standard [28]. For transverse rebars of 6 mm diameter, the average values of yield and ultimate tensile strengths were found to be 345 and 425 MPa, respectively. However, for longitudinal steel of 10 mm diameter, the average yield and ultimate strengths were found to be 486 and 733 MPa, respectively. The compressive strength of concrete, f c , based on the compression testing of standard cylindrical specimens (150 × 300 mm) after 28 days of standard curing (as per ref. [29]), was 22.7 MPa. For both CFRP and GFRP sheets, tensile tests according to ref. [30] were carried out on test coupons, and the average values are reported in Table 1.

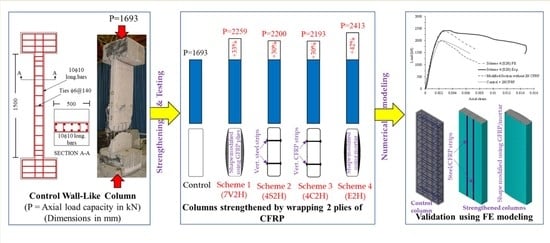
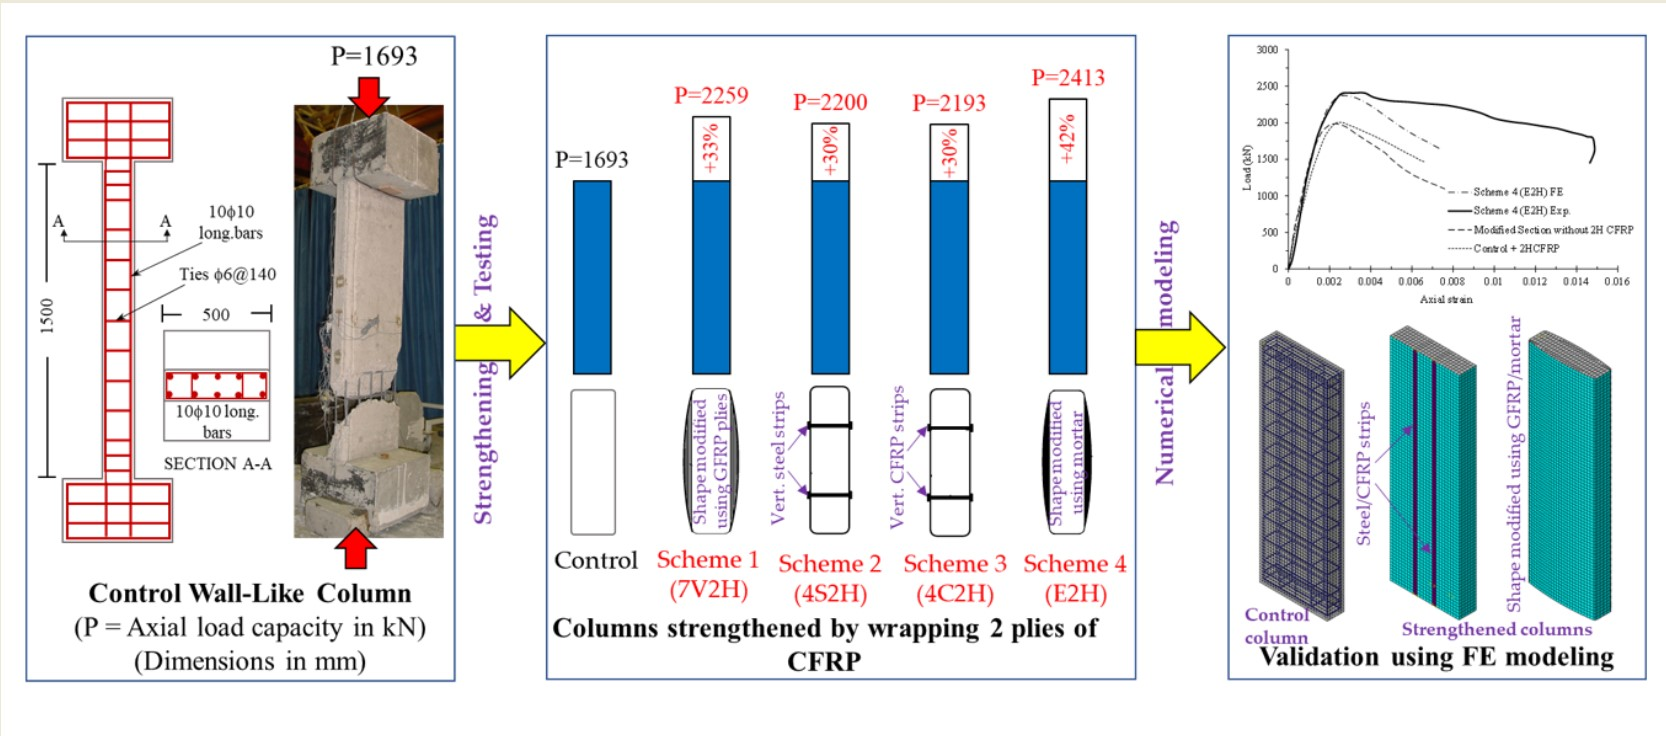
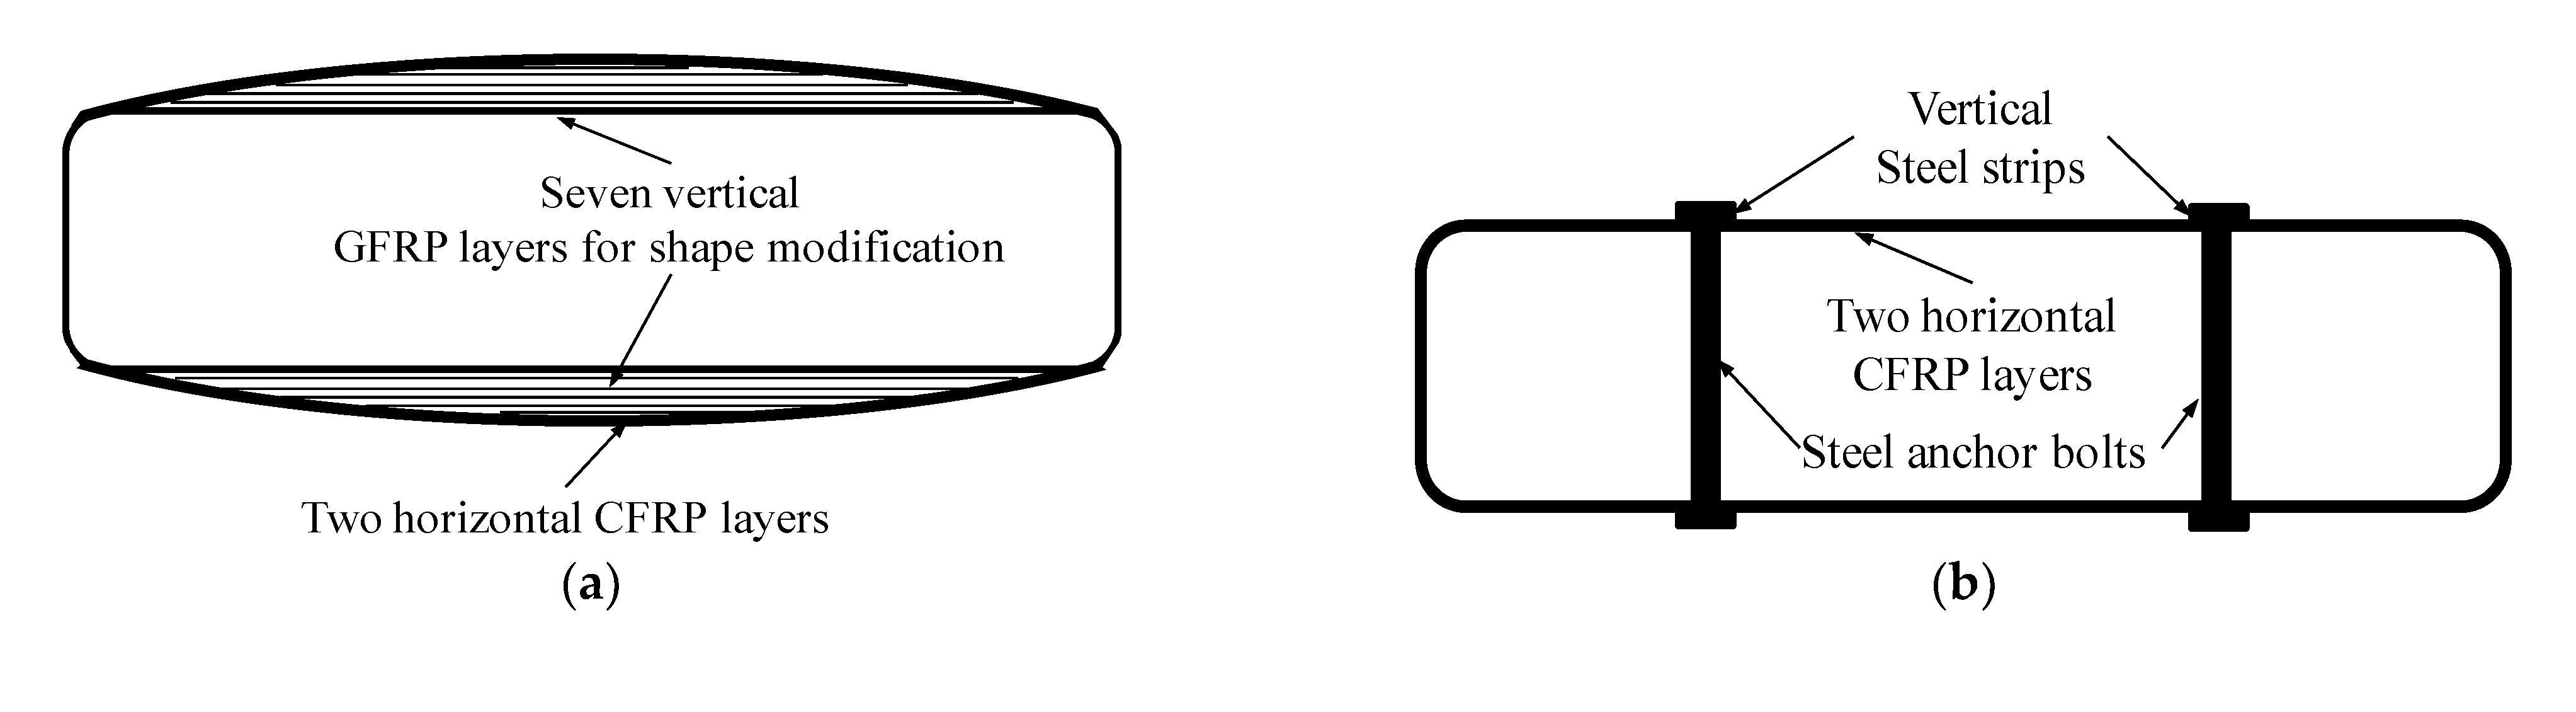
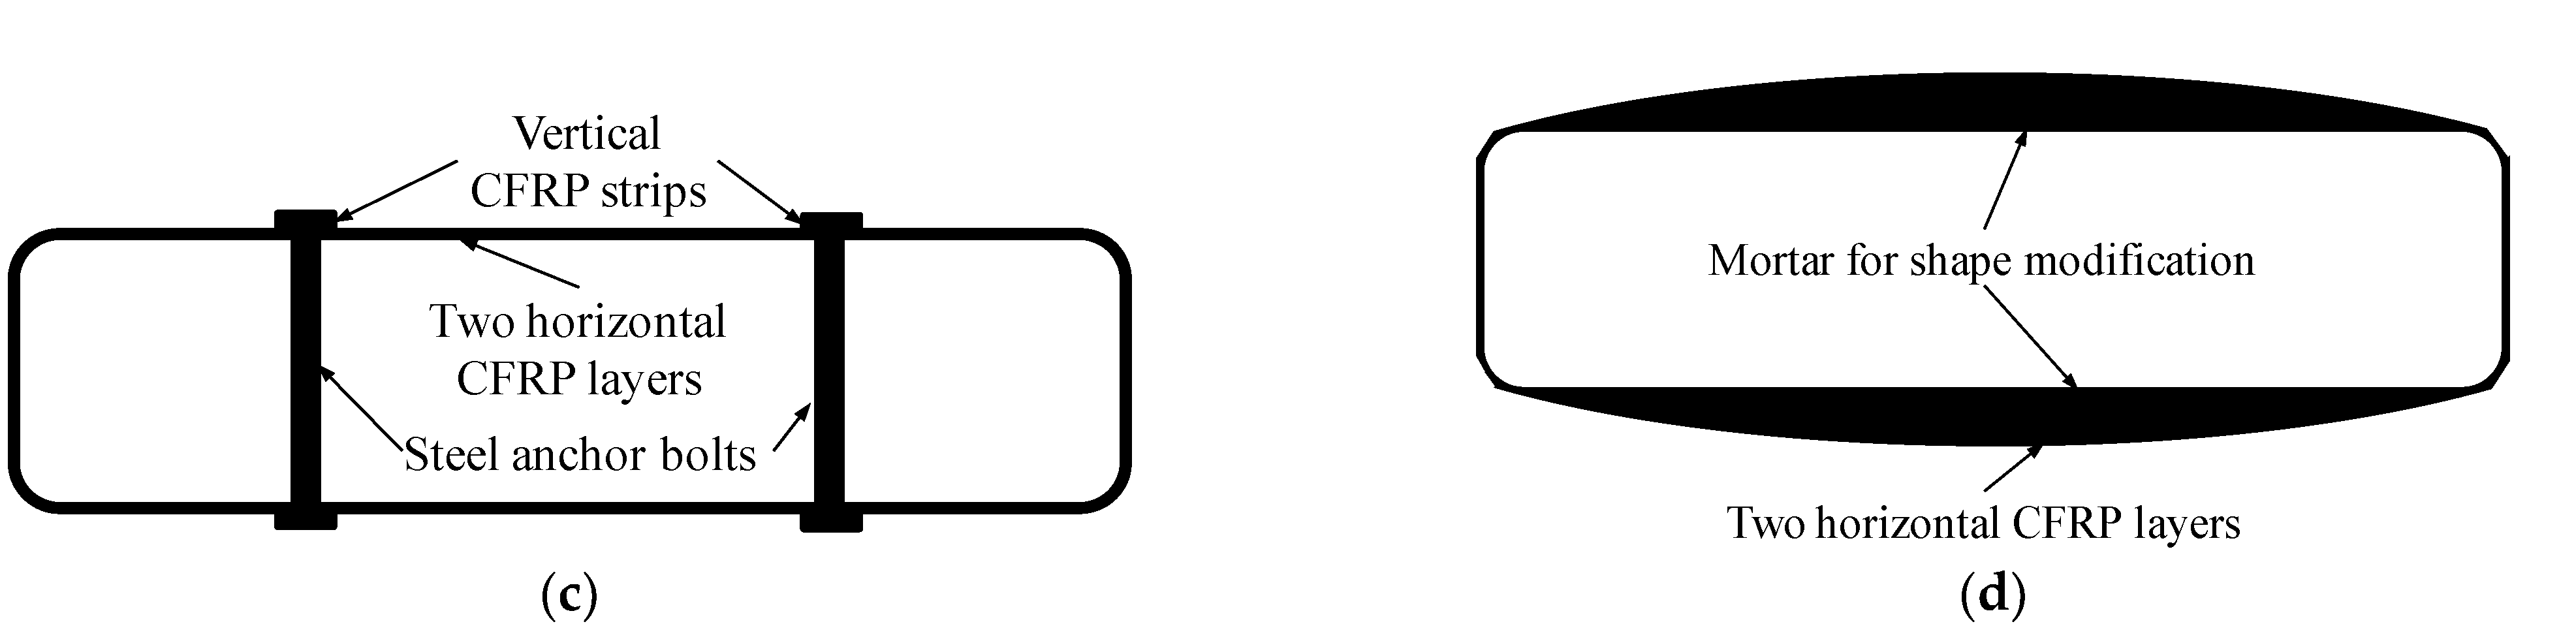
2.3. Strengthening Schemes

Four strengthening schemes were investigated to study the strength and ductility of wall-like rectangular concrete columns. In all the schemes, two plies of CFRP (horizontally oriented fibers) were used for providing confinement. These schemes were chosen so that the role of different parameters, namely—bolted/anchored strips of FRP/steel material with underlying FRP layers and the shape modification; on the confinement of wall-like columns, could be analyzed. The details of the investigated strengthening schemes are as follows:
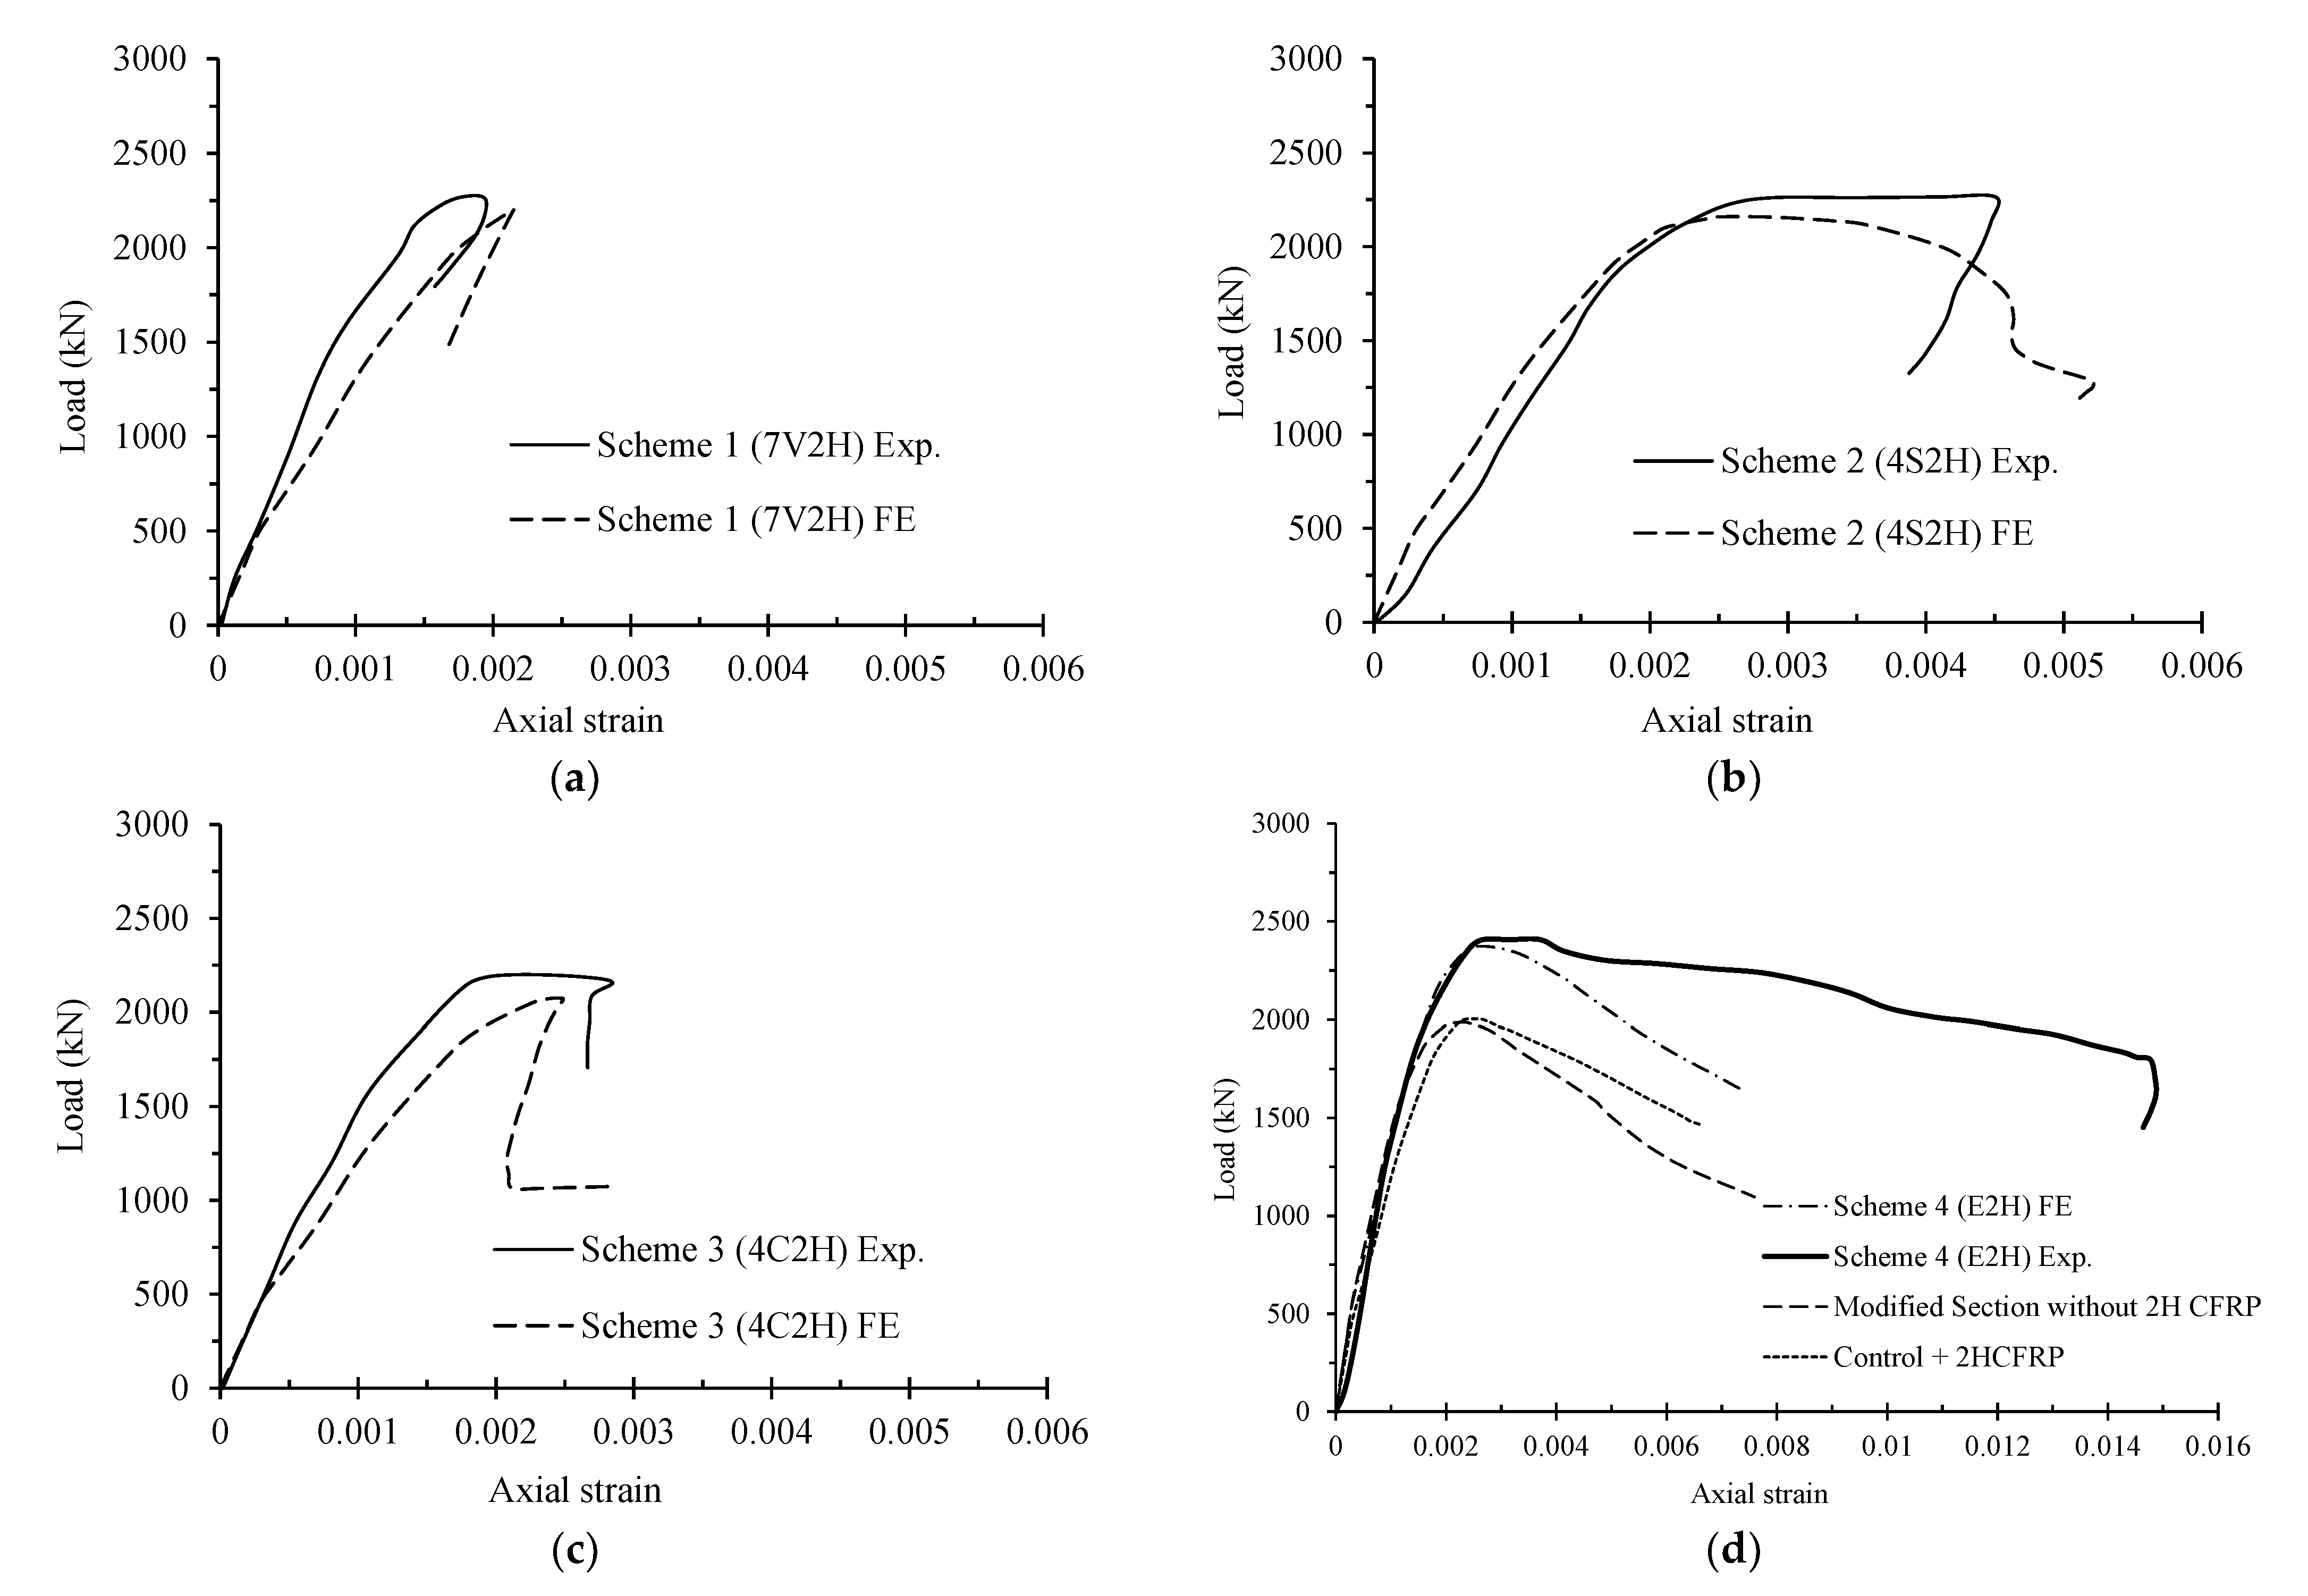
  • Scheme 1 (7V2H): The column specimen was strengthened using seven plies of GFRP with fibers oriented vertically, and then two plies of CFRP (horizontally oriented fibers) were wrapped. The vertical plies were used for converting the rectangular column section to the elliptical shape for improving the confinement provided by CFRP sheets.
  • Scheme 2 (4S2H): The column was drilled with twelve holes of 15 mm in diameter. Two CFRP sheets were wrapped horizontally. Four 30 mm wide steel strips of 5 mm thickness, two on each face and 138 mm apart, were then anchored using twelve bolts of 15 mm diameter.
  • Scheme 3 (4C2H): Same as Scheme 2, except for the use of seven layers of CFRP strips with fibers oriented vertically in place of steel strips. The strips were anchored with the column using twelve bolts of 15 mm diameter.
  • Scheme 4 (E2H): The column section was modified to the elliptical shape by applying mortar on the wider dimension of the column section. The strength of the mortar was approximately the same as that of the column concrete. The mortar thickness at the mid-width of the column was 20 mm, which was reduced gradually to zero at the vertical edges. The transformed column was wrapped after the hardening of mortar with two horizontal layers of CFRP sheet. The test results of this scheme have been reported in the authors’ earlier publication [19]. However, this scheme is being reported briefly for the sake of completeness.
The details of the four strengthening schemes are displayed in Figure 3.

2.4. Instrumentation

Figure 4 displays the test setup for the wall-like column specimens. The instrumentation layout is also depicted in this figure. As seen in Figure 4, an AMSLER test machine with a compression capacity of 10,000 kN was employed for testing the RC columns. The LVDTs were used for measuring the displacements. For recording the strains in main rebars, strain gages were affixed in all rebars at the mid-height of the column. For stirrups, four strain gages were used in the middle stirrup, as shown in Figure 1. Additionally, four strain gages were employed for measuring the strain at the top and bottom stirrups (Figure 1). Two strain gages were affixed on the outer surface of CFRP for measuring lateral strains at the mid-height of columns (Figure 1). For measuring the vertical and horizontal strains in concrete, eight strain gages (60 mm gage length) on the four faces of the column (four each for vertical and horizontal displacements, respectively) were used. Four LVDTs (400 mm gage length) were used in the middle of the concrete to measure axial and lateral displacements, and two LVDTs were used for measuring total piston displacement. Two potentiometers were employed between the heads of the columns for measuring the change in the distance between the two column heads. A low rate of loading (0.5 mm/min) was employed for testing columns in compression. Test data were recorded every second using a data logger. Extensive attention was paid to ensuring concentrically applied loading on the specimens by providing gypsum capping at ends in contact with the AMSLER machine.

3. Discussion of Experimental Results

3.1. Modes of Failure of Columns

Figure 5 illustrates the modes of failure of the control and strengthened wall-like columns. The control columns failed in a brittle mode as the failure was sudden after reaching the peak load. The failure in the column occurred in the lower half height of the column (Figure 5a). The failure of columns strengthened using Schemes 1 (7V2H), and 4 (E2H) was similar as it was caused by the bulging of CFRP sheets and its consequent fracture. However, the column strengthened using Scheme 4 continued to take the load for sufficient deformation after reaching the peak load. The failure of columns strengthened using Schemes 2 (4S2H) and 3 (4C2H) was also similar as it was caused by the buckling of steel or CFRP strips, which resulted in the loss of restraint provided by the vertical steel/CFRP strips. Consequently, the restraint to the expansion of CFRP was only provided by the bolts, which resulted in the excessive expansion of CFRP sheets at the location of bolts and led to the rupture of CFRP sheets.

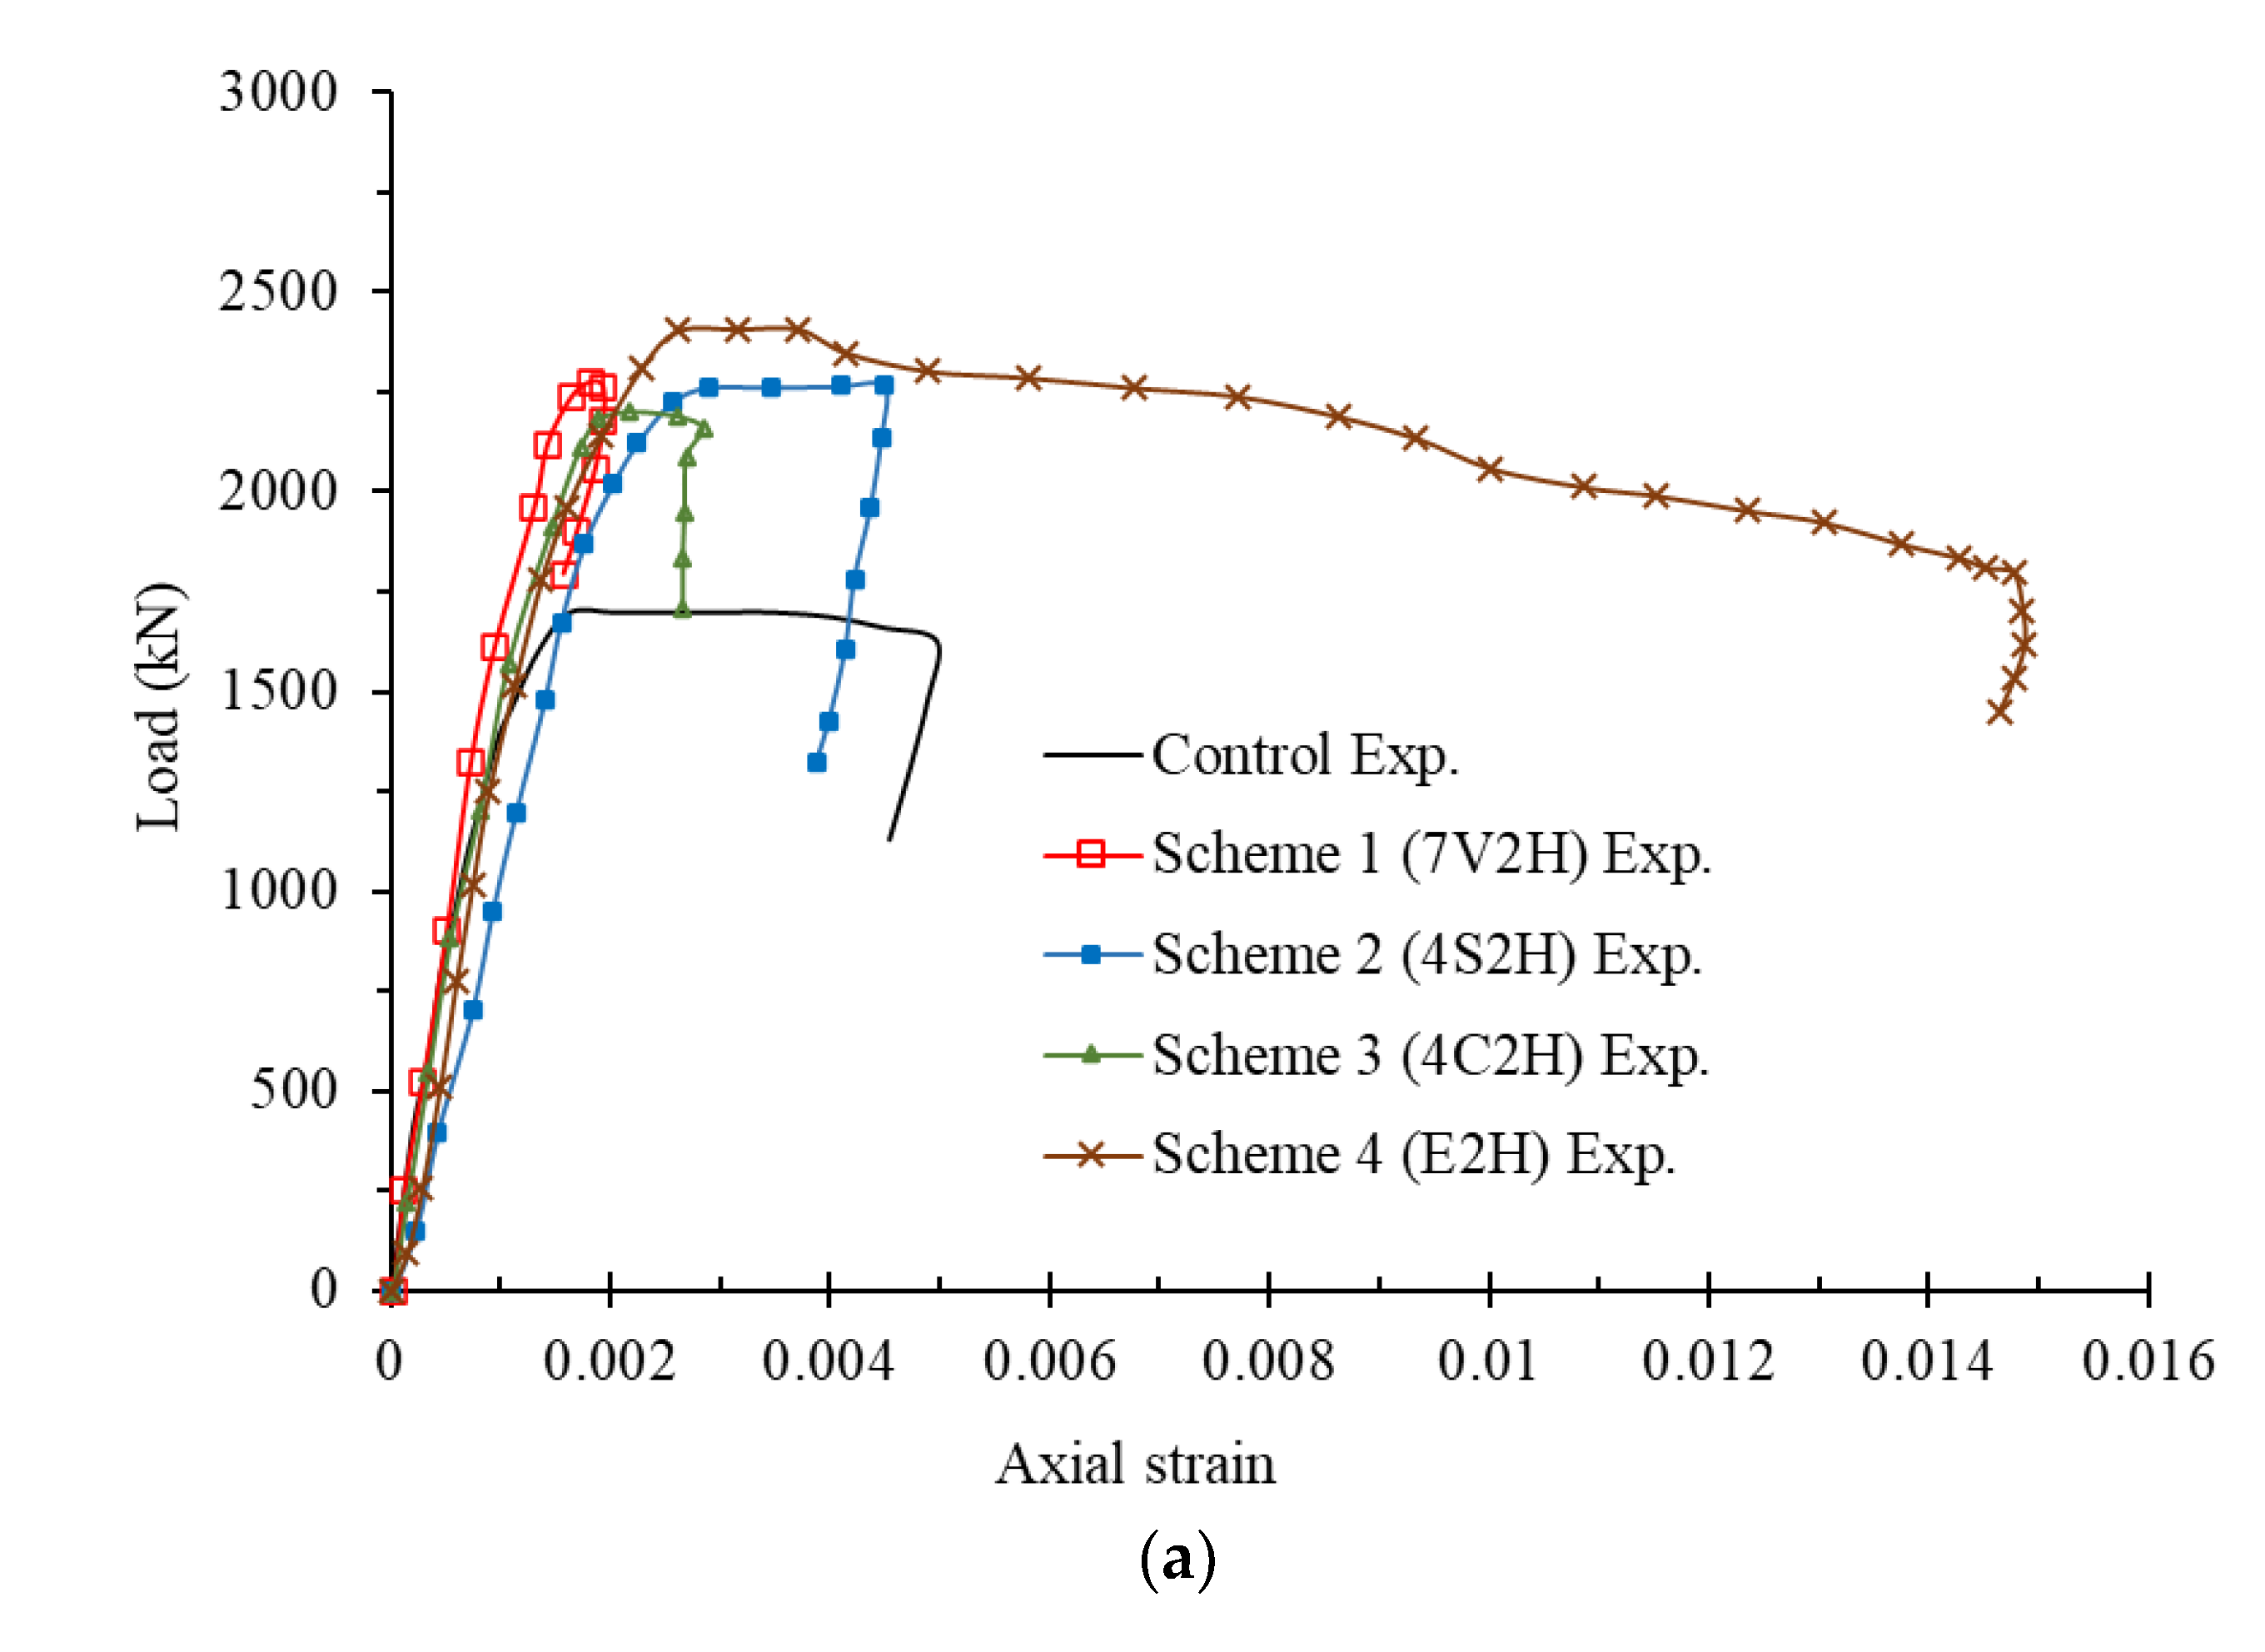
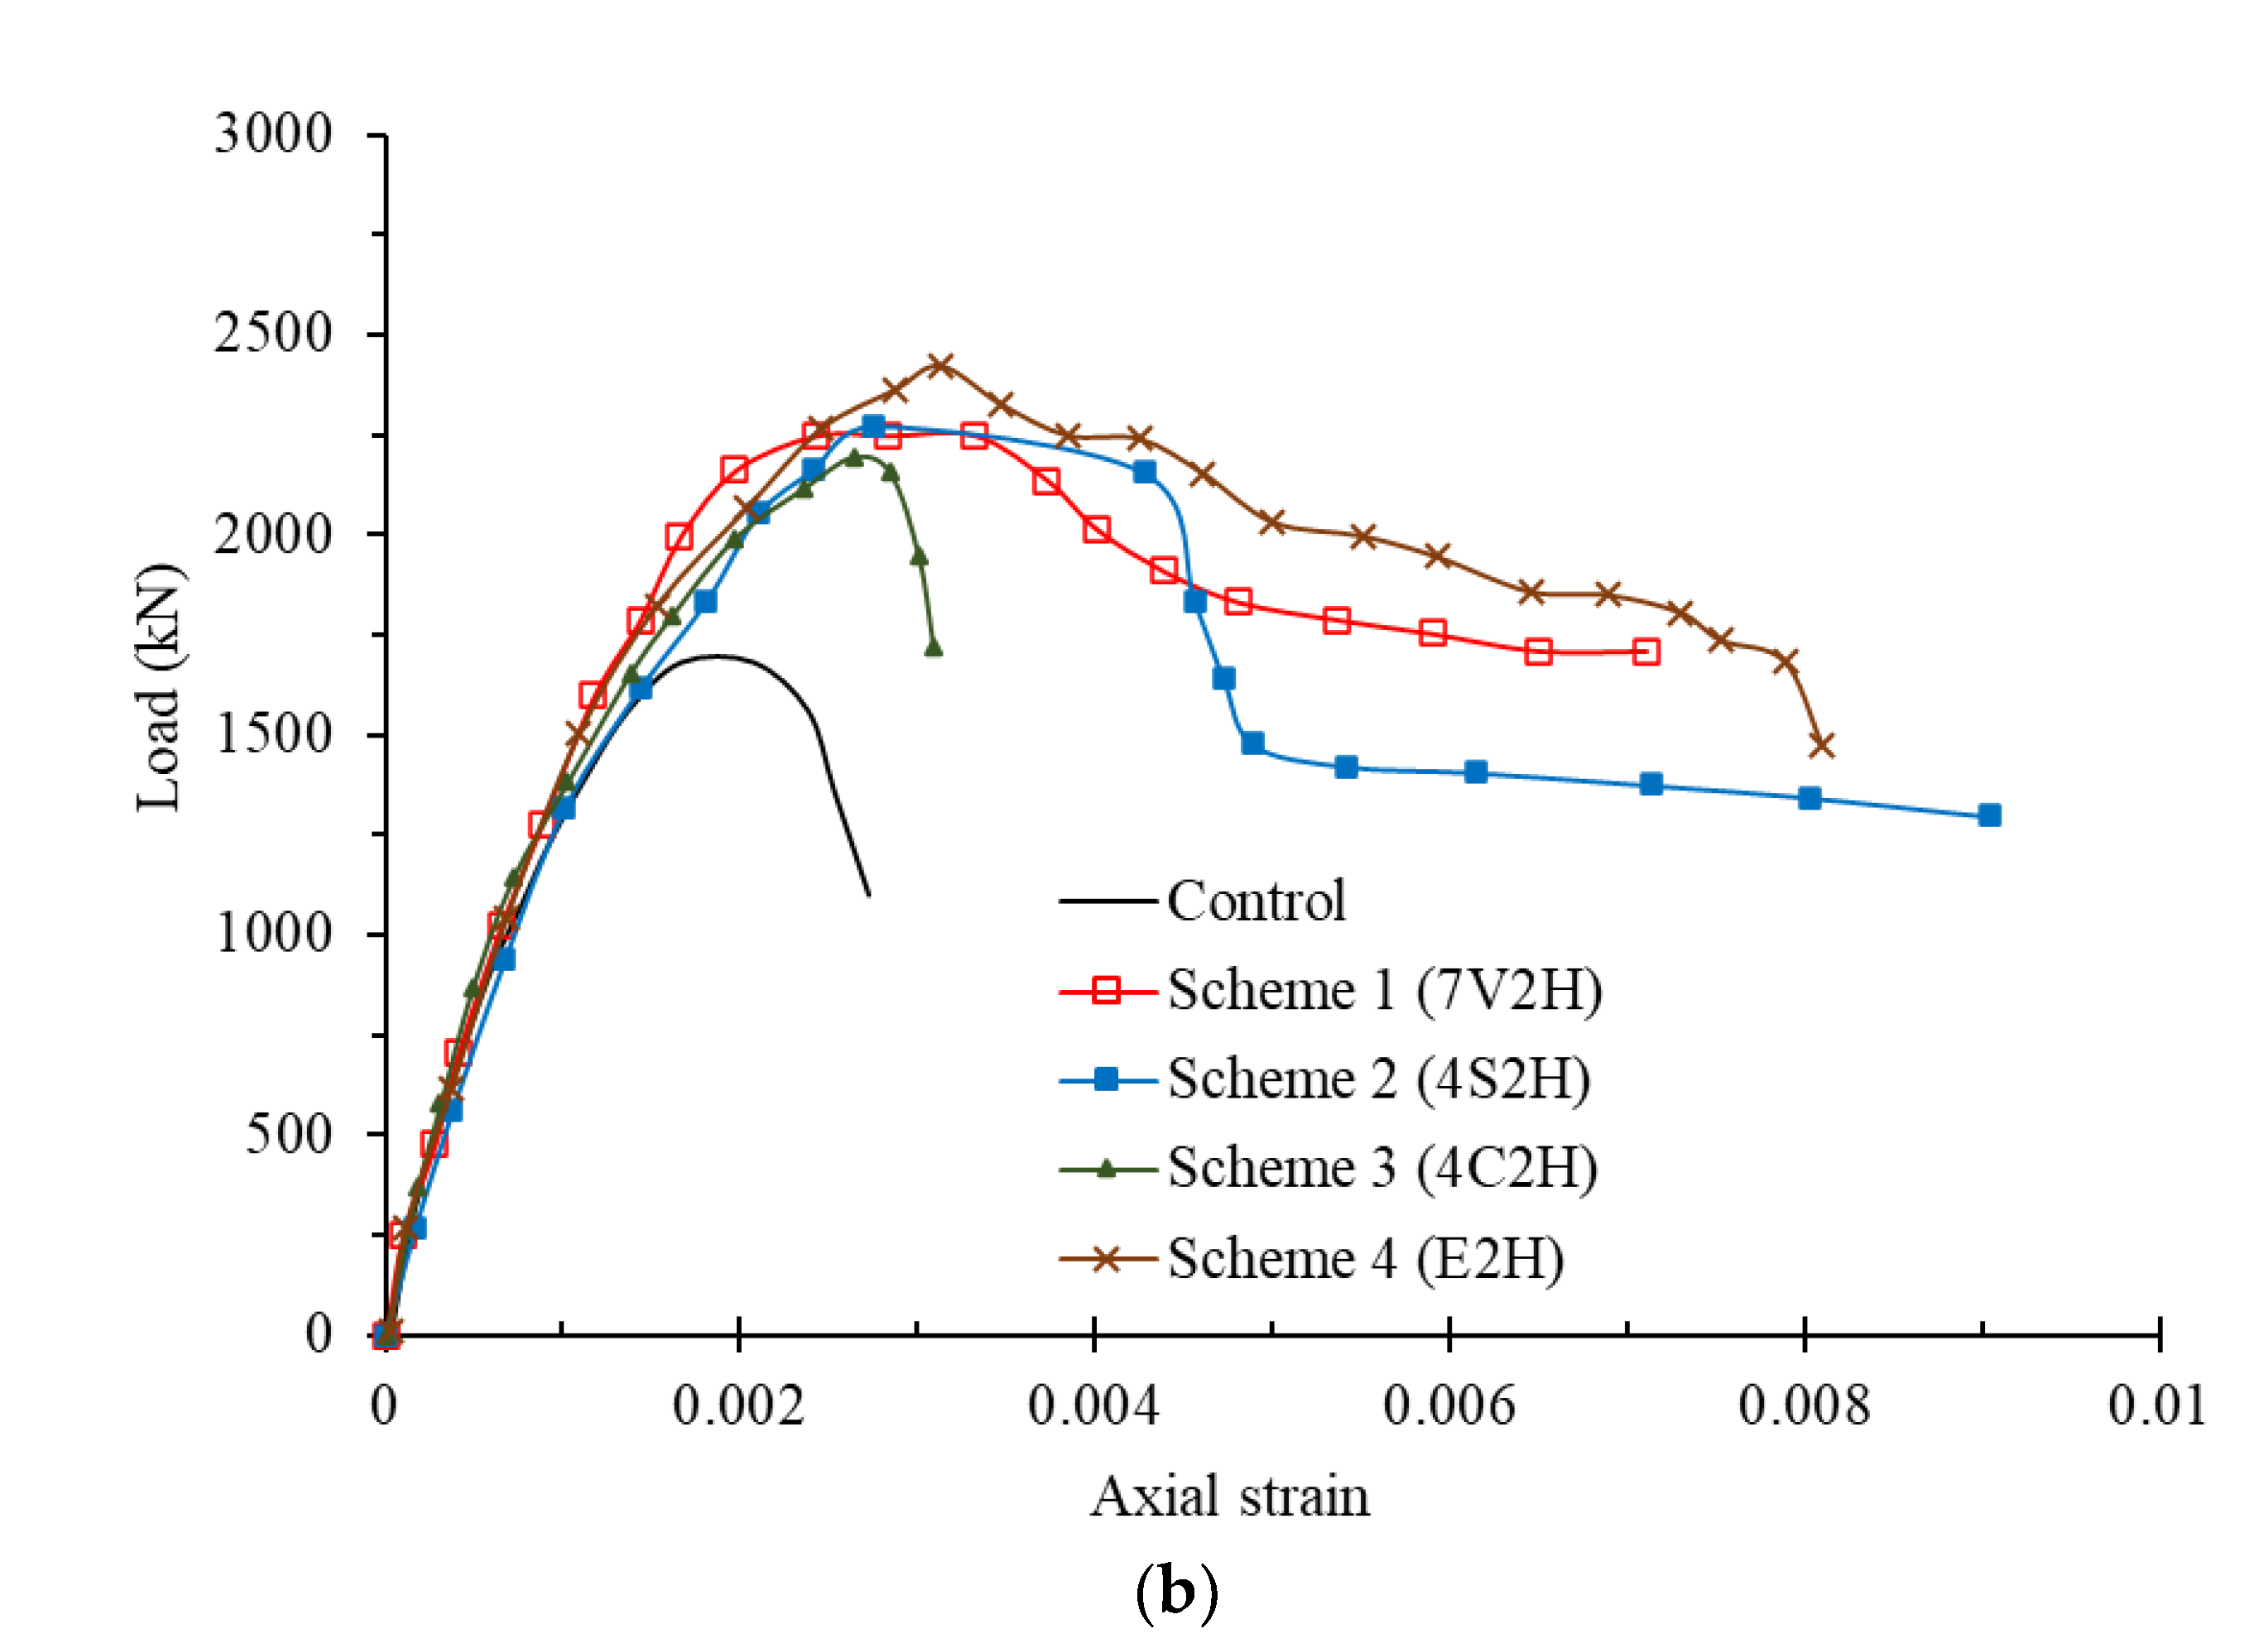
3.2. Axial Compression Behavior of Columns

The axial load versus mid-height rebar strain curves are plotted in Figure 6a. The spacing of stirrups at the mid portion of the column (140 mm) was more compared to that at the end portion (50 mm). The increased spacing of stirrups increases the chances of buckling of main bars at the mid-portion of columns. The effect of different FRP strengthening schemes on the initial linear elastic portion of the load-compression curve is minimal. All columns show almost the same stiffness; however, after the loading value reaches about 30% of the ultimate load in the pre-peak region, an enhancement in the stiffness of the strengthened columns was observed. For the load versus displacement plots shown in Figure 6b, the non-linearity in the pre-peak branch of the plots is due to the cracking of concrete. As can be seen from Figure 6, the control column did not have enough ductility and failed directly after reaching the ultimate load.
At the peak load, Schemes 2 and 4 showed an almost horizontal load-strain relationship in axial load versus mid-height rebar strain curves. No plateau region was observed in Scheme 1 and Scheme 3. The plateau region for Scheme 4 was significantly longer than that of Scheme 2. The GFRP layers with vertical fiber orientation used in Scheme 1 were used as fillers only and could not carry compressive loads. Similar is the case for Scheme 3, as the CFRP strips, with vertically oriented fibers, were not effective in compression. Moreover, the ultimate tensile strain of CFRP strips was low (~1.5% strain). Steel strips used in Scheme 2 were also effective in compressive loads, thereby delaying the global buckling of the column. In the case of Scheme 4, probably due to the maximum decrease in the slenderness ratio of the column because of section enhancement, the plateau region was the largest. The post-peak response was significantly influenced by the strengthening schemes of columns. This is because the role of the strengthening system starts after large axial deformation of the column.
The effect of different FRP schemes on the performance of the wall-like columns was recorded. A summary of the percentage change in the yield and ultimate loads relative to the control column is presented in Table 2. The yield load is defined as the load at which the strain in the main bars of the column reaches the yield strain. Strains in the longitudinal rebar at mid-height of columns at the yield load, ultimate load, and failure load are also reported in Table 2. The failure load is taken as the point in the post-peak zone of the stress-strain curve where a 15% drop in the load occurs, or when the test was terminated for protecting the measuring instruments due to the occurrence of excessive deterioration/deformation, whichever was earlier. The failure load for Schemes 1, 2, and 3 are not reported because of the absence of the post-peak load-strain curve (Figure 6a). The post-peak curve recorded in Figure 6a is not the same as in Figure 6b because of the global column compression plotted in this figure.
The results presented in Table 2 clearly show the advantage of the different schemes considered in this study to enhance the performance of the wall-like column under axial compressive load. With no exception, a higher load was observed at the failure point of all strengthened columns than that of the control column.
As can be observed from Table 2, the strengthening of columns resulted in a significant increase in column strength. For the control column, the peak axial load was 1693 kN, whereas, for the strengthened columns, the peak axial load ranged from 2193 kN to 2413 kN. Thus, the enhancement in the peak load was in the range of 30% to 43%. Transforming the column to the elliptical shape using mortar (Scheme 4) increased the axial load capacity to 2413 kN, which represents an increase of 43% over the control column. Strengthening the column with four anchored strips of steel or CFRP overlaying two layers of horizontally wrapped CFRP sheets (Schemes 2 and 3) increased the axial load capacity by about 30%.
The results shown in Table 2 show that the wrapping of the column with FRP sheets significantly delayed the occurrence of the yielding and had an appreciable effect on the peak load of the column. The increase in the yield load of strengthened columns ranges from 24% to 45%, with the maximum enhancement achieved in Scheme 4. The increase in failure load for Scheme 4, the only scheme for which it could be calculated, is 25%.
The increase in strain corresponding to the ultimate load demonstrates enhancement due to the FRP strengthening, with the exception of Scheme 4, for which a 10% reduction in the ultimate strain was observed. The reduction in strain in Scheme 4 may be due to the prevention of column buckling or because of the relieving of stress in longitudinal rebars due to the increase in the concrete area.
It is to be noted that the ultimate load in Schemes 1 to 3 corresponds to the buckling of longitudinal rebars, which could not be prevented in these schemes. The buckling of rebars caused the detachment of concrete cover at a higher magnitude of loads. It is due to this reason that the load-strain curves do not show the post-peak curve for these schemes (Figure 6a). Scheme 4 recorded a 116% increase in the failure strain. The increase in strain in Scheme 4 is because of the confinement provided by the mortar and FRP layer to the longitudinal rebar, which helps in delaying the buckling of longitudinal rebars. Additionally, the increased cross-section in Scheme 4 prevented global buckling of the column, thereby helping the longitudinal rebars in taking more strain.
It is worth noting that the strengthening process used for Scheme 4, i.e., the wrapping of two layers of CFRP sheets after the modification of the column cross-section to the elliptical section with the help of cement mortar, was the most economical and the easiest method among all strengthening schemes used in this study.

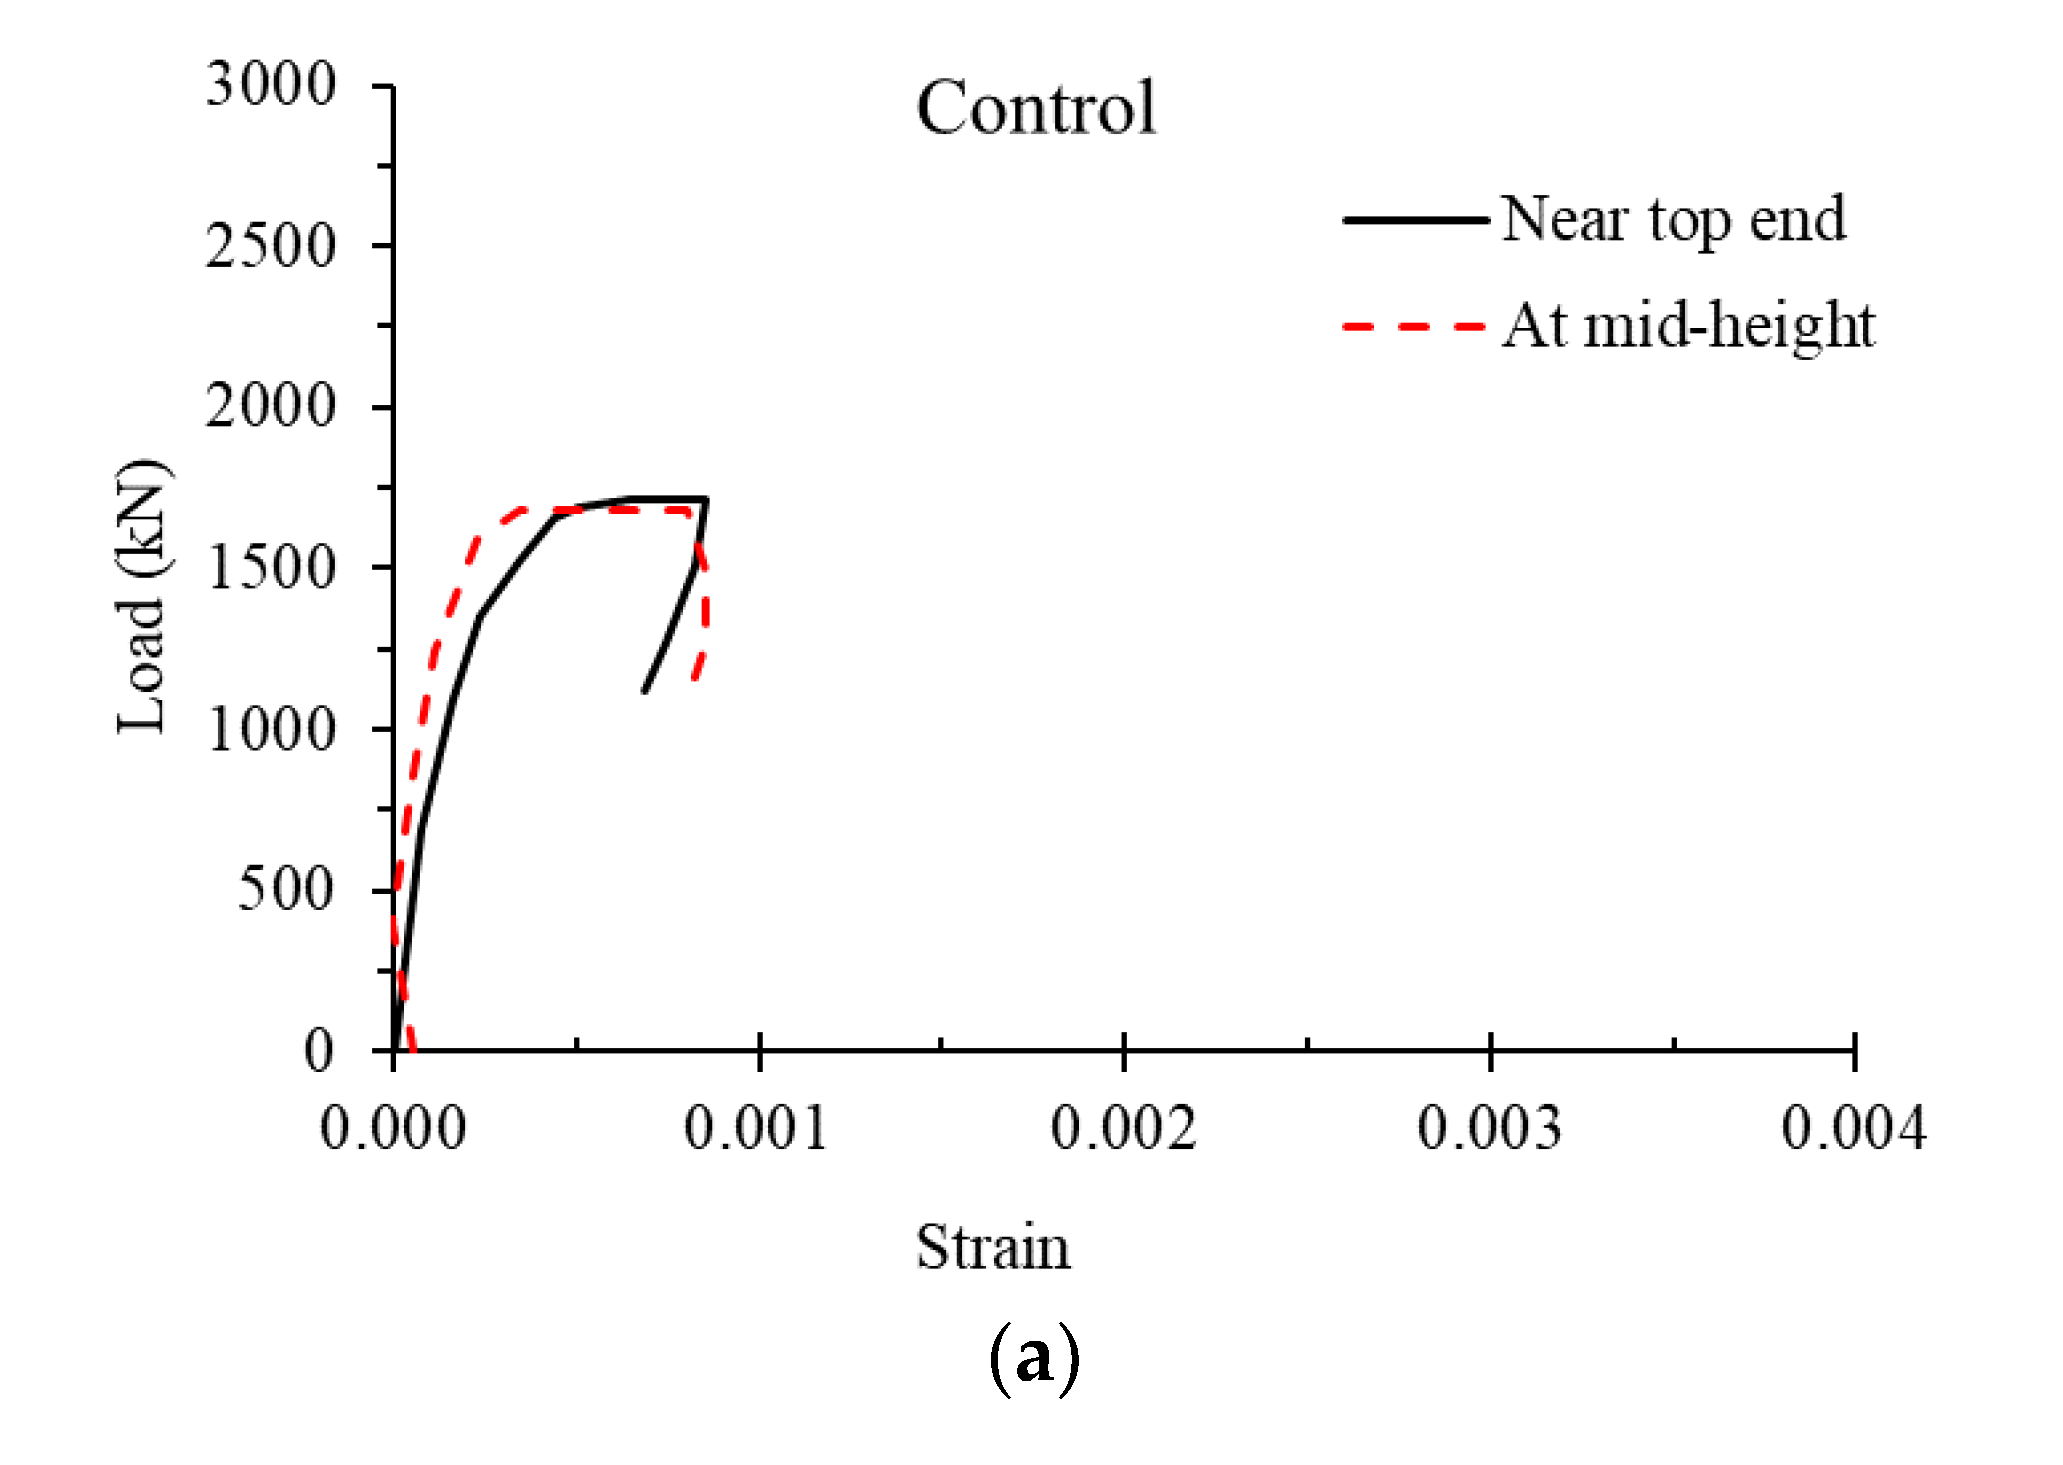
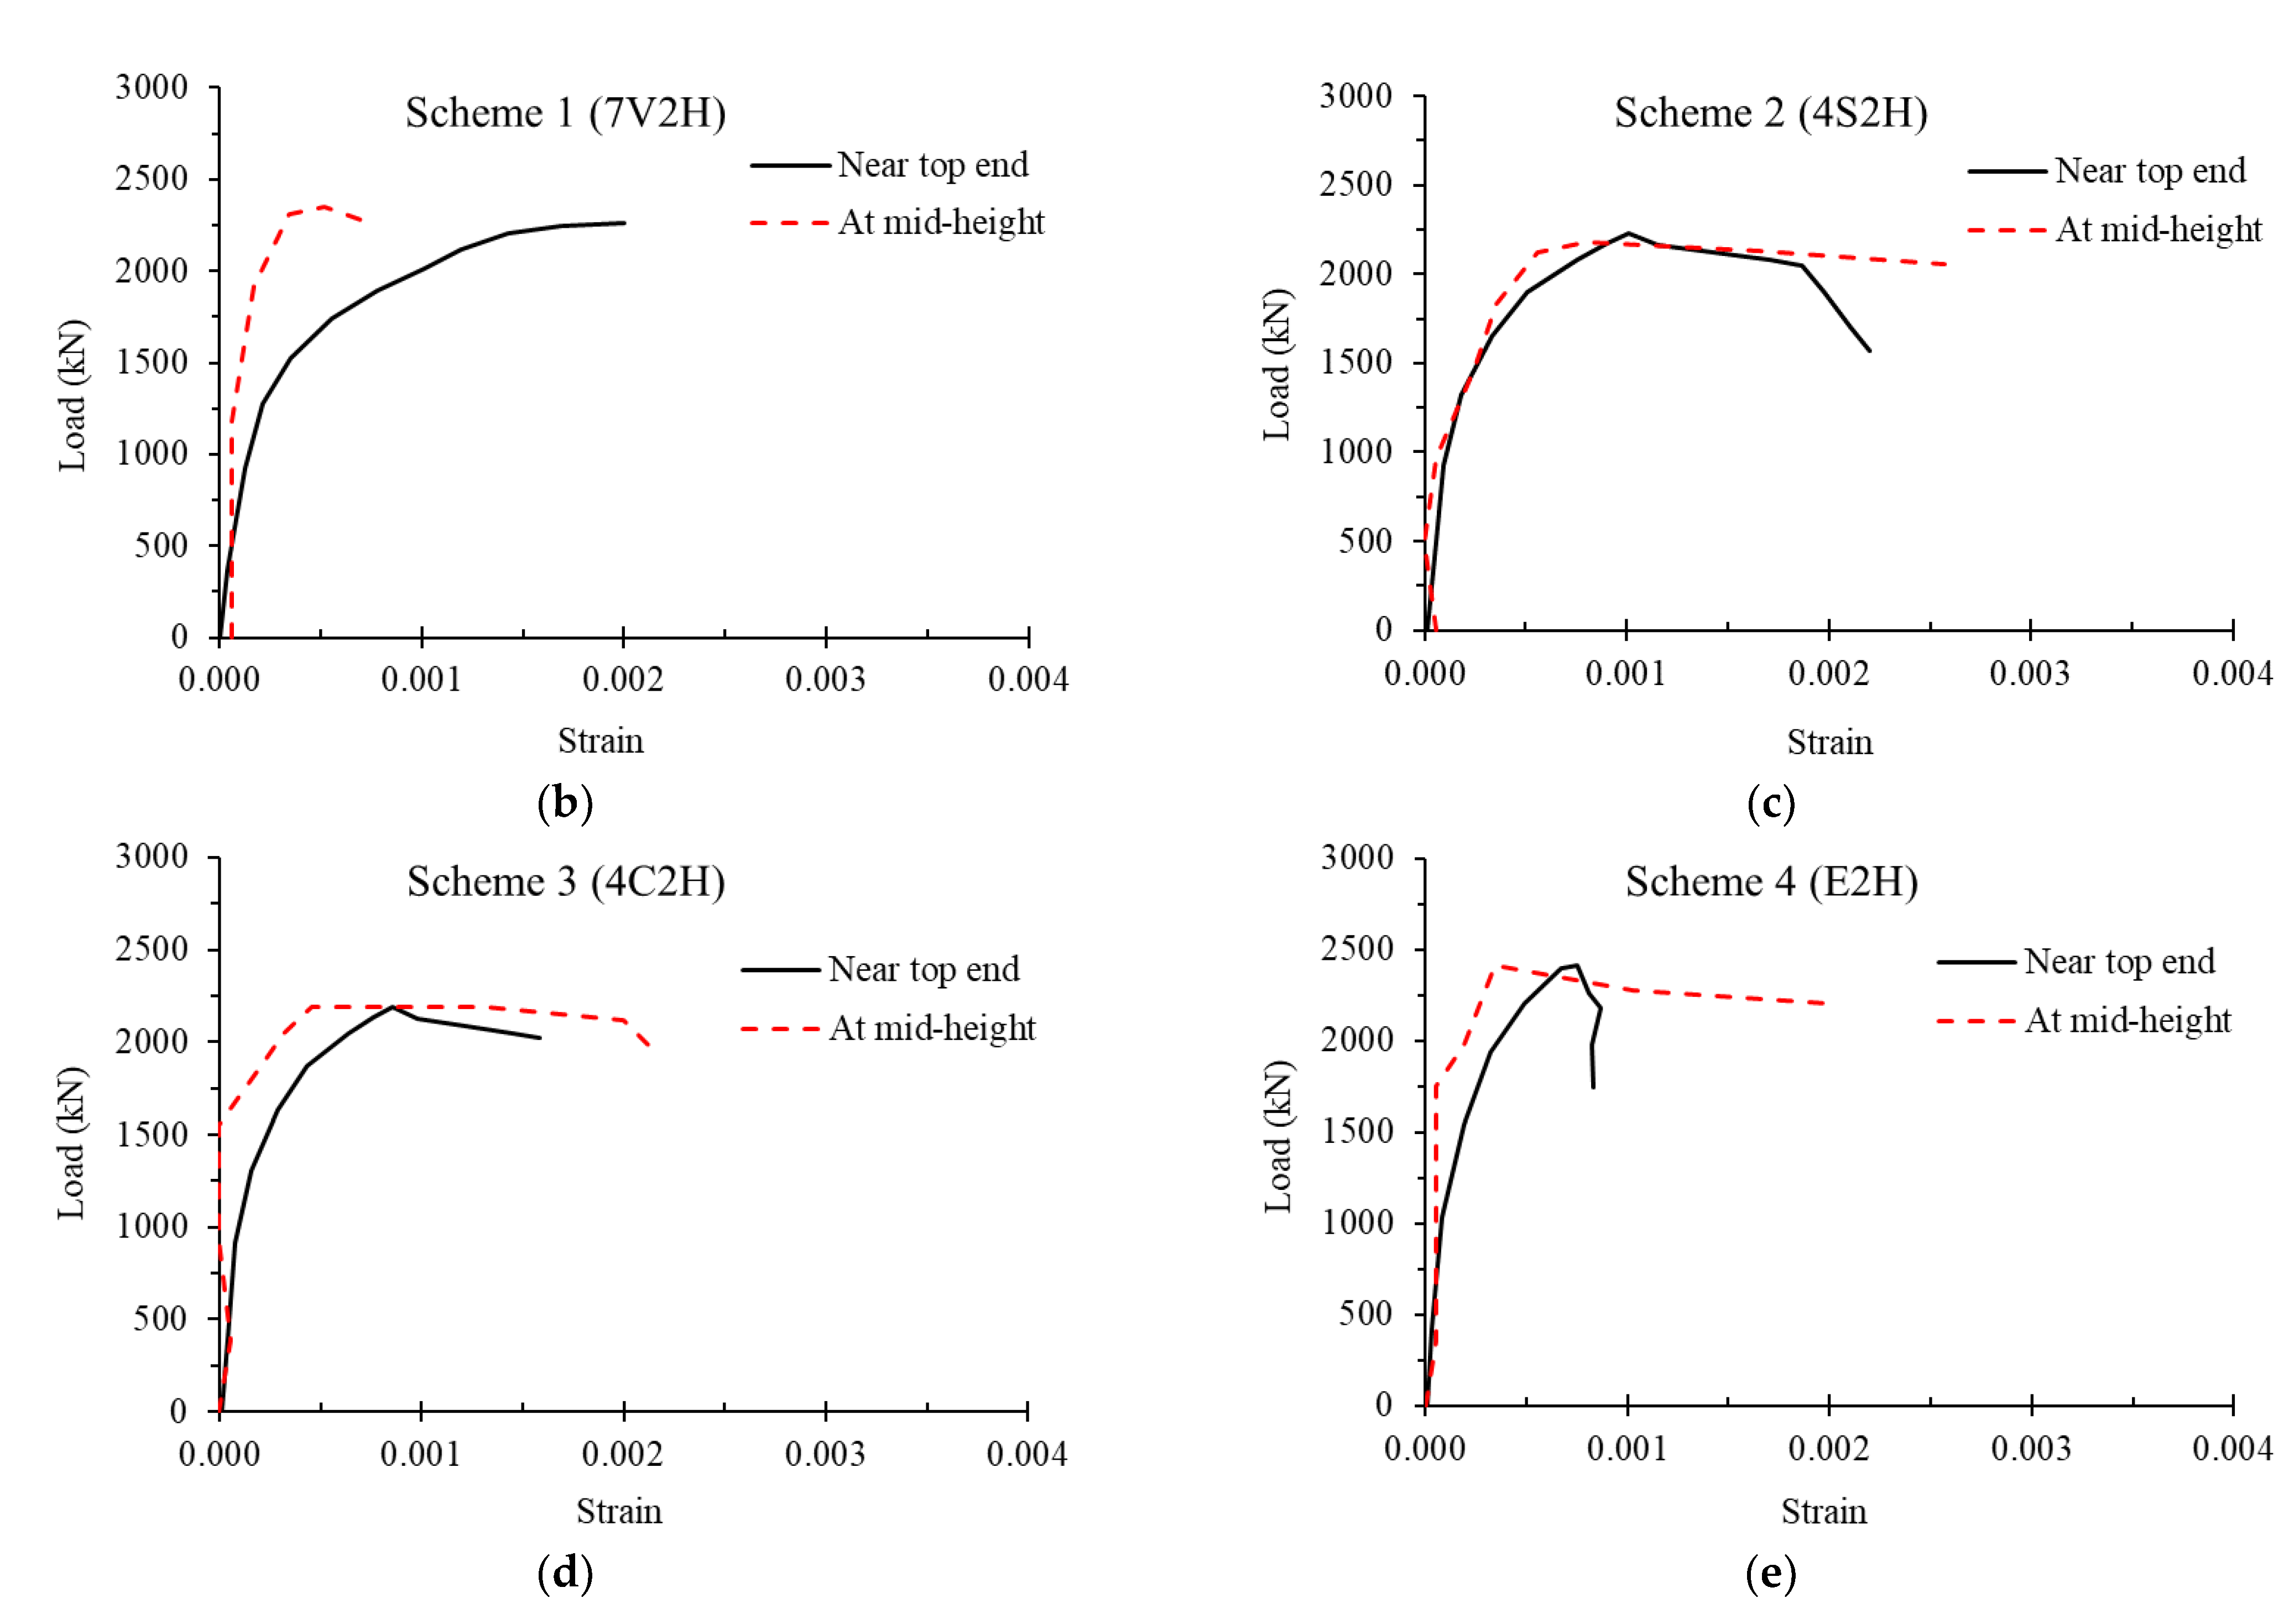
3.3. Axial Strain of Columns

The results presented above deal with the axial compression behavior of the column with respect to the strain in the longitudinal rebar. However, the overall column deformation behavior was not covered. Three other column deformation measurements were taken, which included concrete strain gage, LVDTs (considering the mid 400 mm of the columns), and potentiometers. The concrete strain gages and LVDTs were located at the mid-height of the column (Figure 4). Although the concrete strain gages and LVDTs show local axial compressive strain, potentiometers give total axial strain in the column.

3.4. Dialation (Lateral Strains)

The axial compression of the column develops lateral strains. For all the columns tested, lateral ties were instrumented for the measurement of strain in ties at the middle and ends of the column. The strains in lateral ties were recorded using strain gages fixed to the lateral ties. The plots of axial compressive load versus strain in top and mid-height column ties are shown in Figure 7. Lateral strains in concrete/FRP were also measured using strain gages. Table 3 presents the summary of strains in ties and on the surface of concrete/FRP at peak and failure loads.
At the peak load, the strain in ties at the column ends increases for all strengthening schemes due to the increase in the ultimate load. The highest increase is observed for Scheme 1, and the lowest is for Scheme 4. The lowest increase for Scheme 4 was due to the layer of mortar and confinement effect of FRP, which relieved the stress in lateral ties. The strain in Scheme 2 was less than in Scheme 1 because of the resistance to lateral concrete expansion provided by steel bolts in Scheme 2.
The effect of the spacing of lateral ties in providing confinement to concrete is clearly evident in the difference in the strains in lateral ties at column ends (spacing of ties = 50 mm) and at the middle (spacing of ties = 140 mm), which increases with increase in column load. The middle portion of the strengthened columns carried a higher axial load due to the scheme adopted for their strengthening. However, the confinement to concrete due to the close spacing of lateral ties helped in carrying the extra load due to the higher confined compressive strength of concrete. It is to be noted that the strengthening schemes are not equally effective in strengthening the column ends. Among the four schemes, Scheme 4 is relatively more effective in strengthening the column ends, due to which the enhancement in strain in lateral ties of this scheme is less. Although the increase in the column section due to the mortar layer and FRP confinement is effective at the column ends, the gap between the bolts used for anchoring the steel or CFRP strips and the column head makes this zone ineffective in resisting additional load.
The enhancement in strain in lateral ties at mid-height of the strengthened column of Scheme 2 is because of the confinement provided by horizontal wraps of CFRP sheets to the zone of concrete between the ties, which is not effectively confined by lateral ties. The confinement provided by CFRP wrap to this concrete zone (including concrete cover) permits it to carry more load, thereby causing expansion of concrete, thus enhancing strain in lateral ties. The increase in strain in CFRP (Table 3) also indicates its role in providing confinement to concrete. On the other hand, an almost negligible increase in strain in lateral ties of Scheme 3 indicates the ineffectiveness of CFRP wrap. However, the enhancement in the strength of column of Scheme 3 is because of the avoidance of column buckling by the vertical strips of CFRP.
The enhancement in strain in lateral ties at failure load also gives an idea about the role of confinement provided by CFRP wraps adopted in the strengthening schemes. This enhancement also provides an estimate of the ductile behavior of columns. The enhancement in strain for Scheme 1 being less than the control, the failure of the column is brittle, which is also evident from Figure 6. The enhancement in the strain of lateral ties in the remaining strengthening schemes (i.e., 2, 3, and 4) demonstrates the ductile behavior of the column at failure. The highest strain enhancement for Scheme 4 shows that the scheme is the most effective among the four schemes investigated in this study.

4. Numerical Modeling

The RC wall-like columns tested in this study were numerically modeled using the finite element (FE) method in the ABAQUS software [31]. Eight-noded brick elements were used in modeling the concrete. The reinforcement and ties were modeled with the help of two-node truss bar elements. Embedded element constraint was used for modeling the interface between the bars and concrete. For strengthened columns, the shell elements were employed for modeling FRP sheets and steel strips. The FE mesh of control and strengthened columns is shown in Figure 8. The mortar used in Scheme 4 was assumed to be perfectly bonded with the parent concrete in the rectangular section.

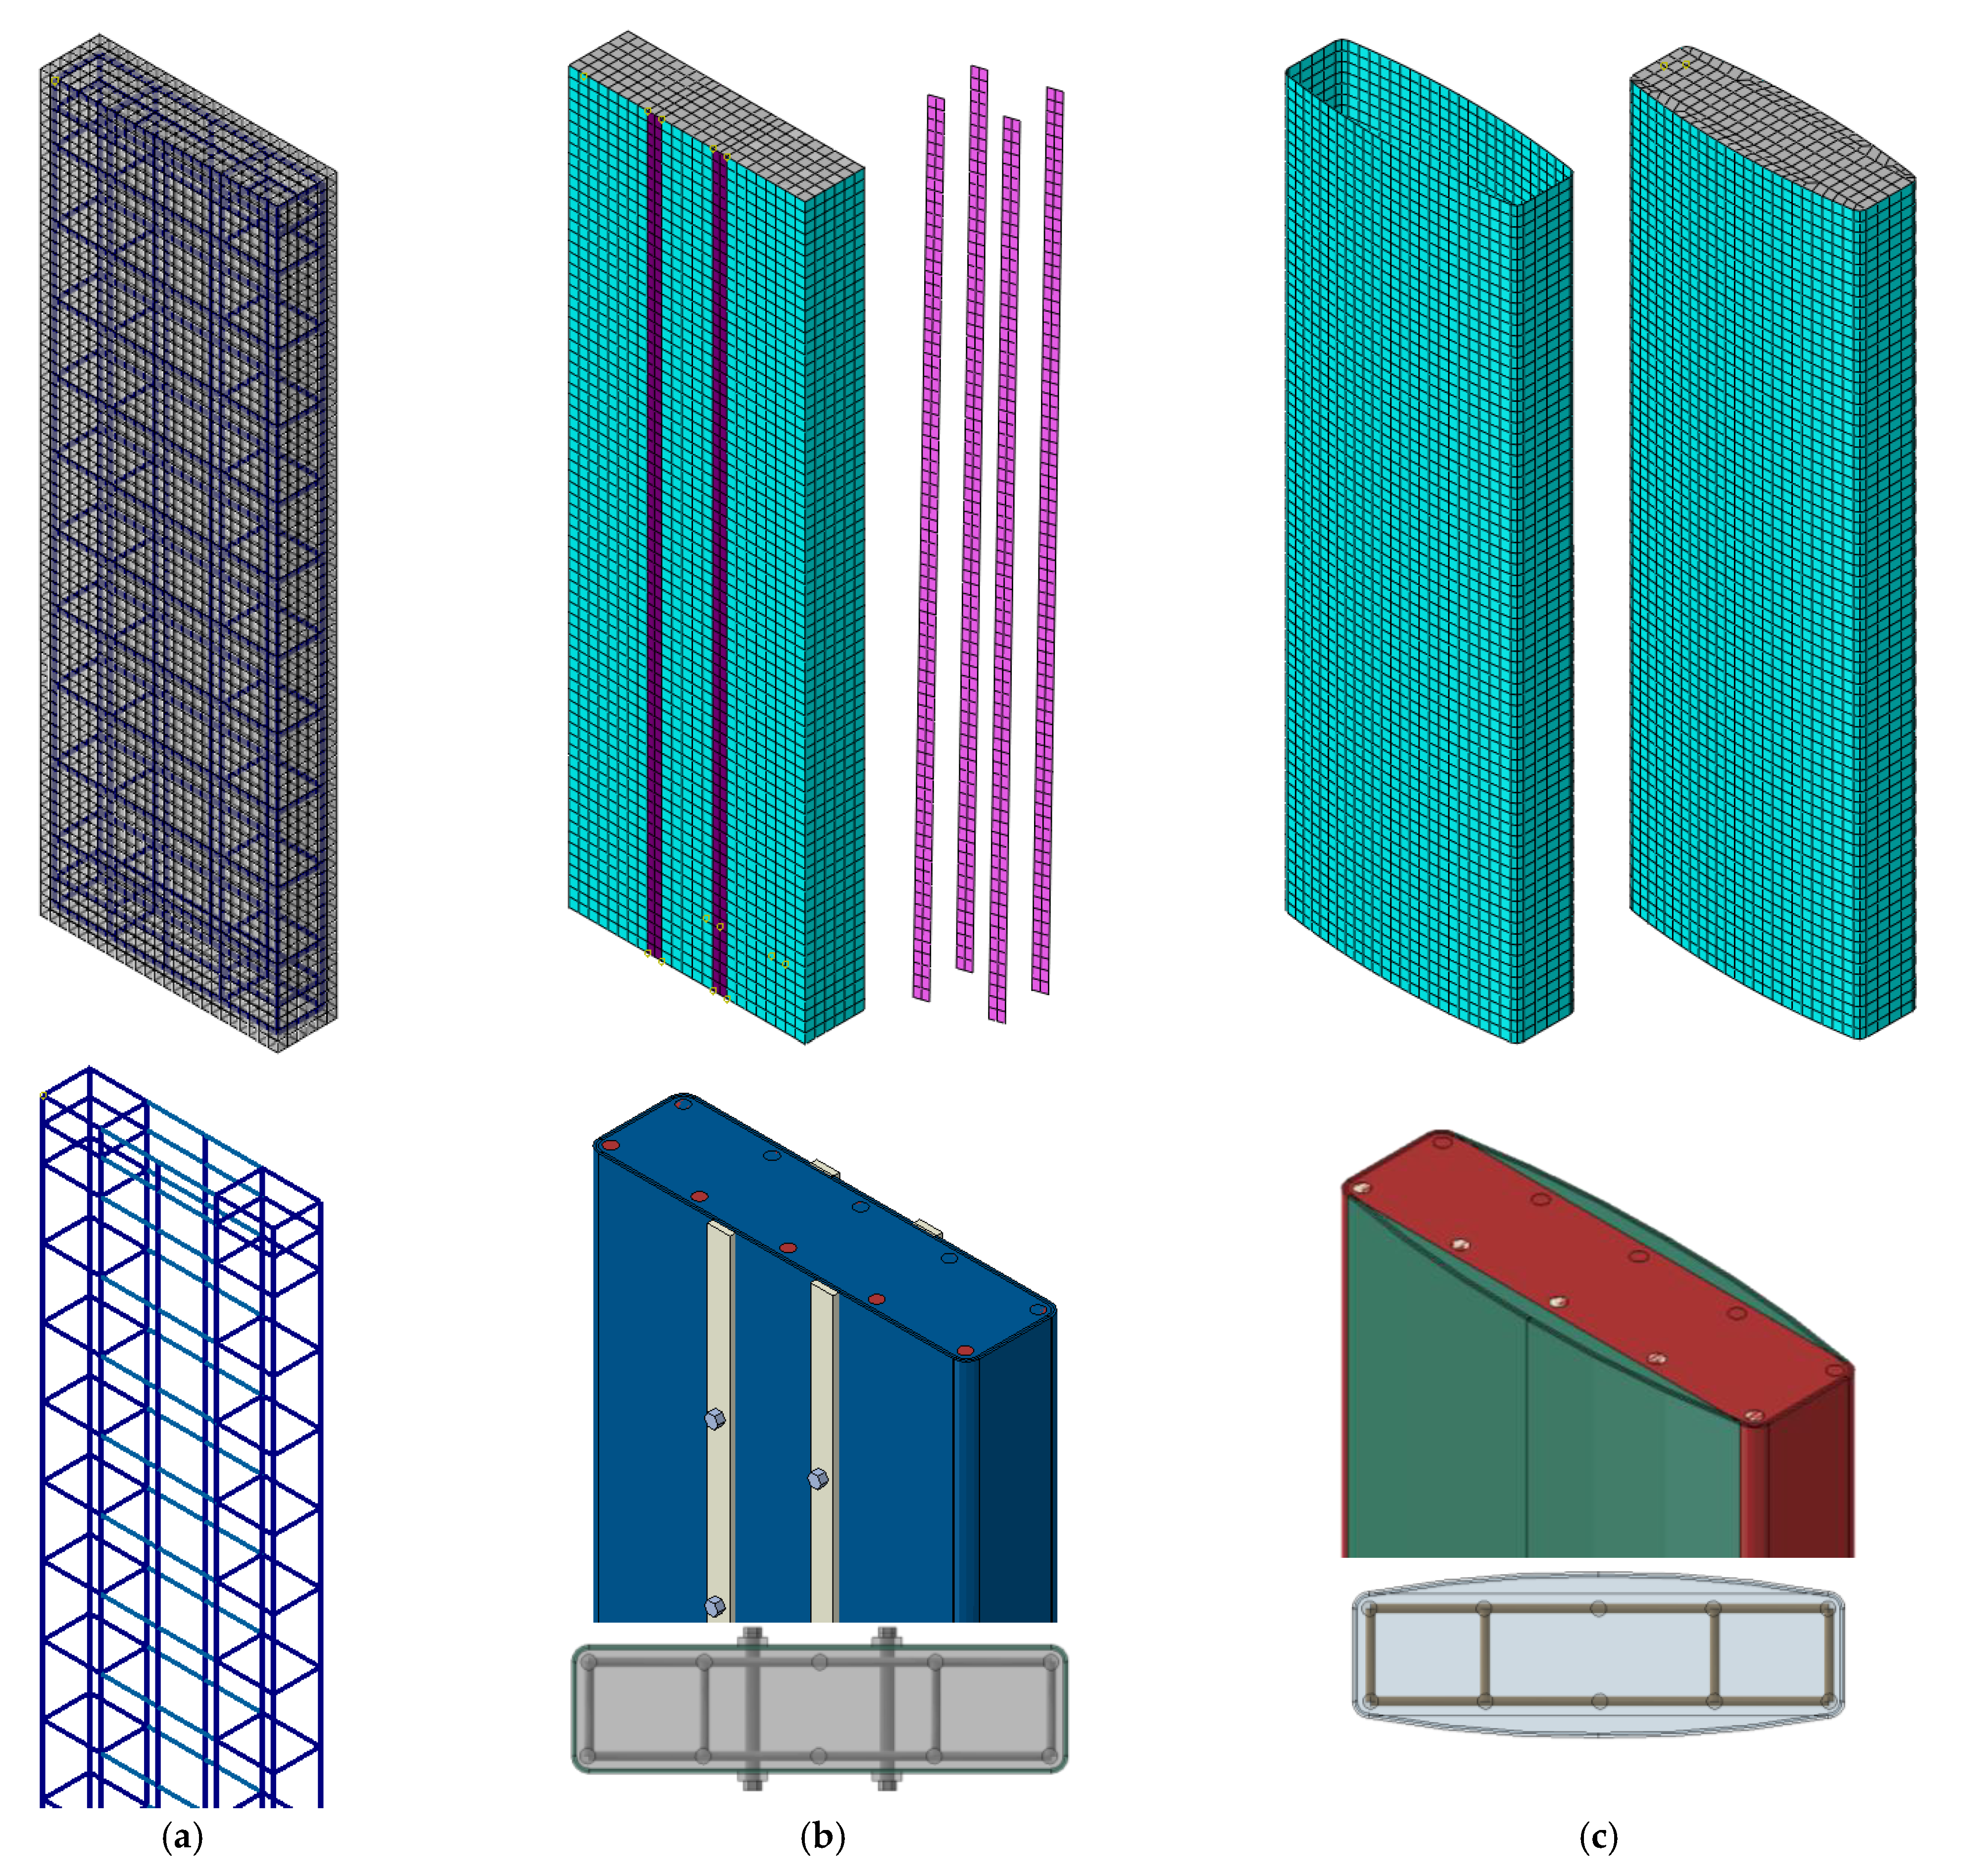
4.1. Details of Mesh Discretization

The details of finite element mesh used for the numerical modeling of wall-like columns are as follows:
(a)
Parent Concrete (Rectangular column section):
Total number of nodes: 14,196
Total number of elements: 11,550
Element type: Eight node hexahedral elements of type C3D8R
(b)
Mortar for the transformation of the column to the elliptical shape:
Total number of nodes: 4087
Total number of elements: 2604
Element type: Eight node hexahedral elements of type C3D8R
(c)
Steel Reinforcement
Total number of nodes: 1564
Total number of elements: 1722
Element type: Two node line elements of type T3D2
(d)
FRP Laminates
Total number of nodes: 5148
Total number of elements: 5082
Element type: Four node quadrilateral elements of type S4R
The maximum size of concrete elements was chosen as 20 mm. A similar size mesh was chosen for reinforcing steel and FRP sheets. The mesh sizes were selected based on the authors’ previous study [19], in which a mesh sensitivity study was conducted, and it was found that more mesh refinement beyond that illustrated in Figure 8 has a minor impact on the outputs; nevertheless, it may unfavorably increase the solution time. The embedded constraint was used for concrete and reinforcing bars. No slip condition and a perfect bond were assumed between the FRP layer and concrete. The extreme bottom nodes of each specimen were restrained from the displacement in the three global directions to represent the boundary conditions of the experiments. Nevertheless, for the extreme top nodes, the displacements in the plane of the column section were only restrained in order to allow for vertical displacement. A prescribed vertical displacement-time history curve was assigned for the extreme top nodes of the column to represent the displacement-controlled loading used in the experiments.

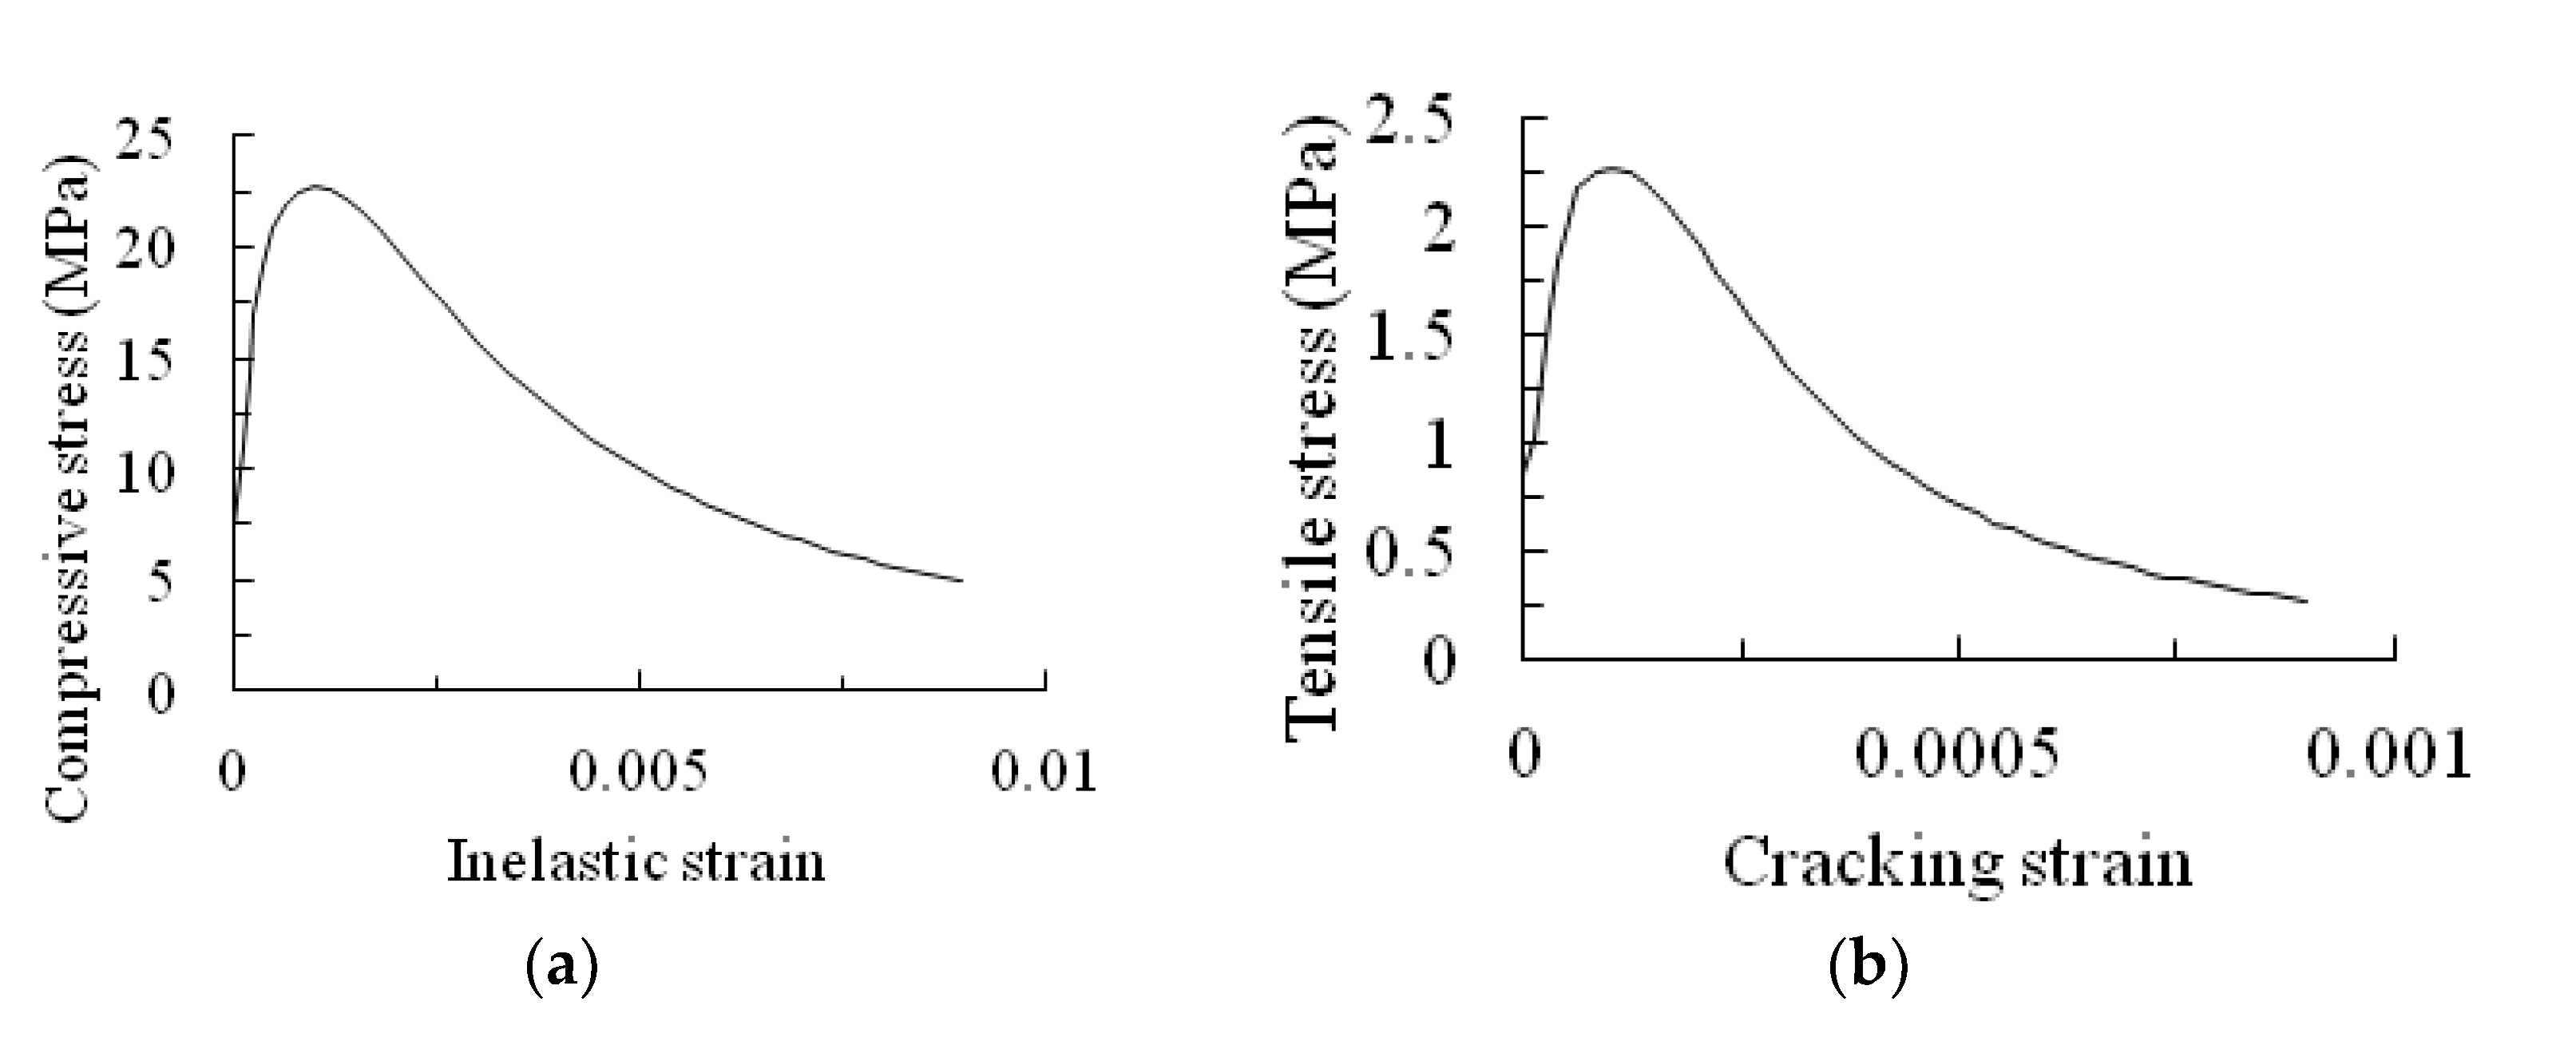
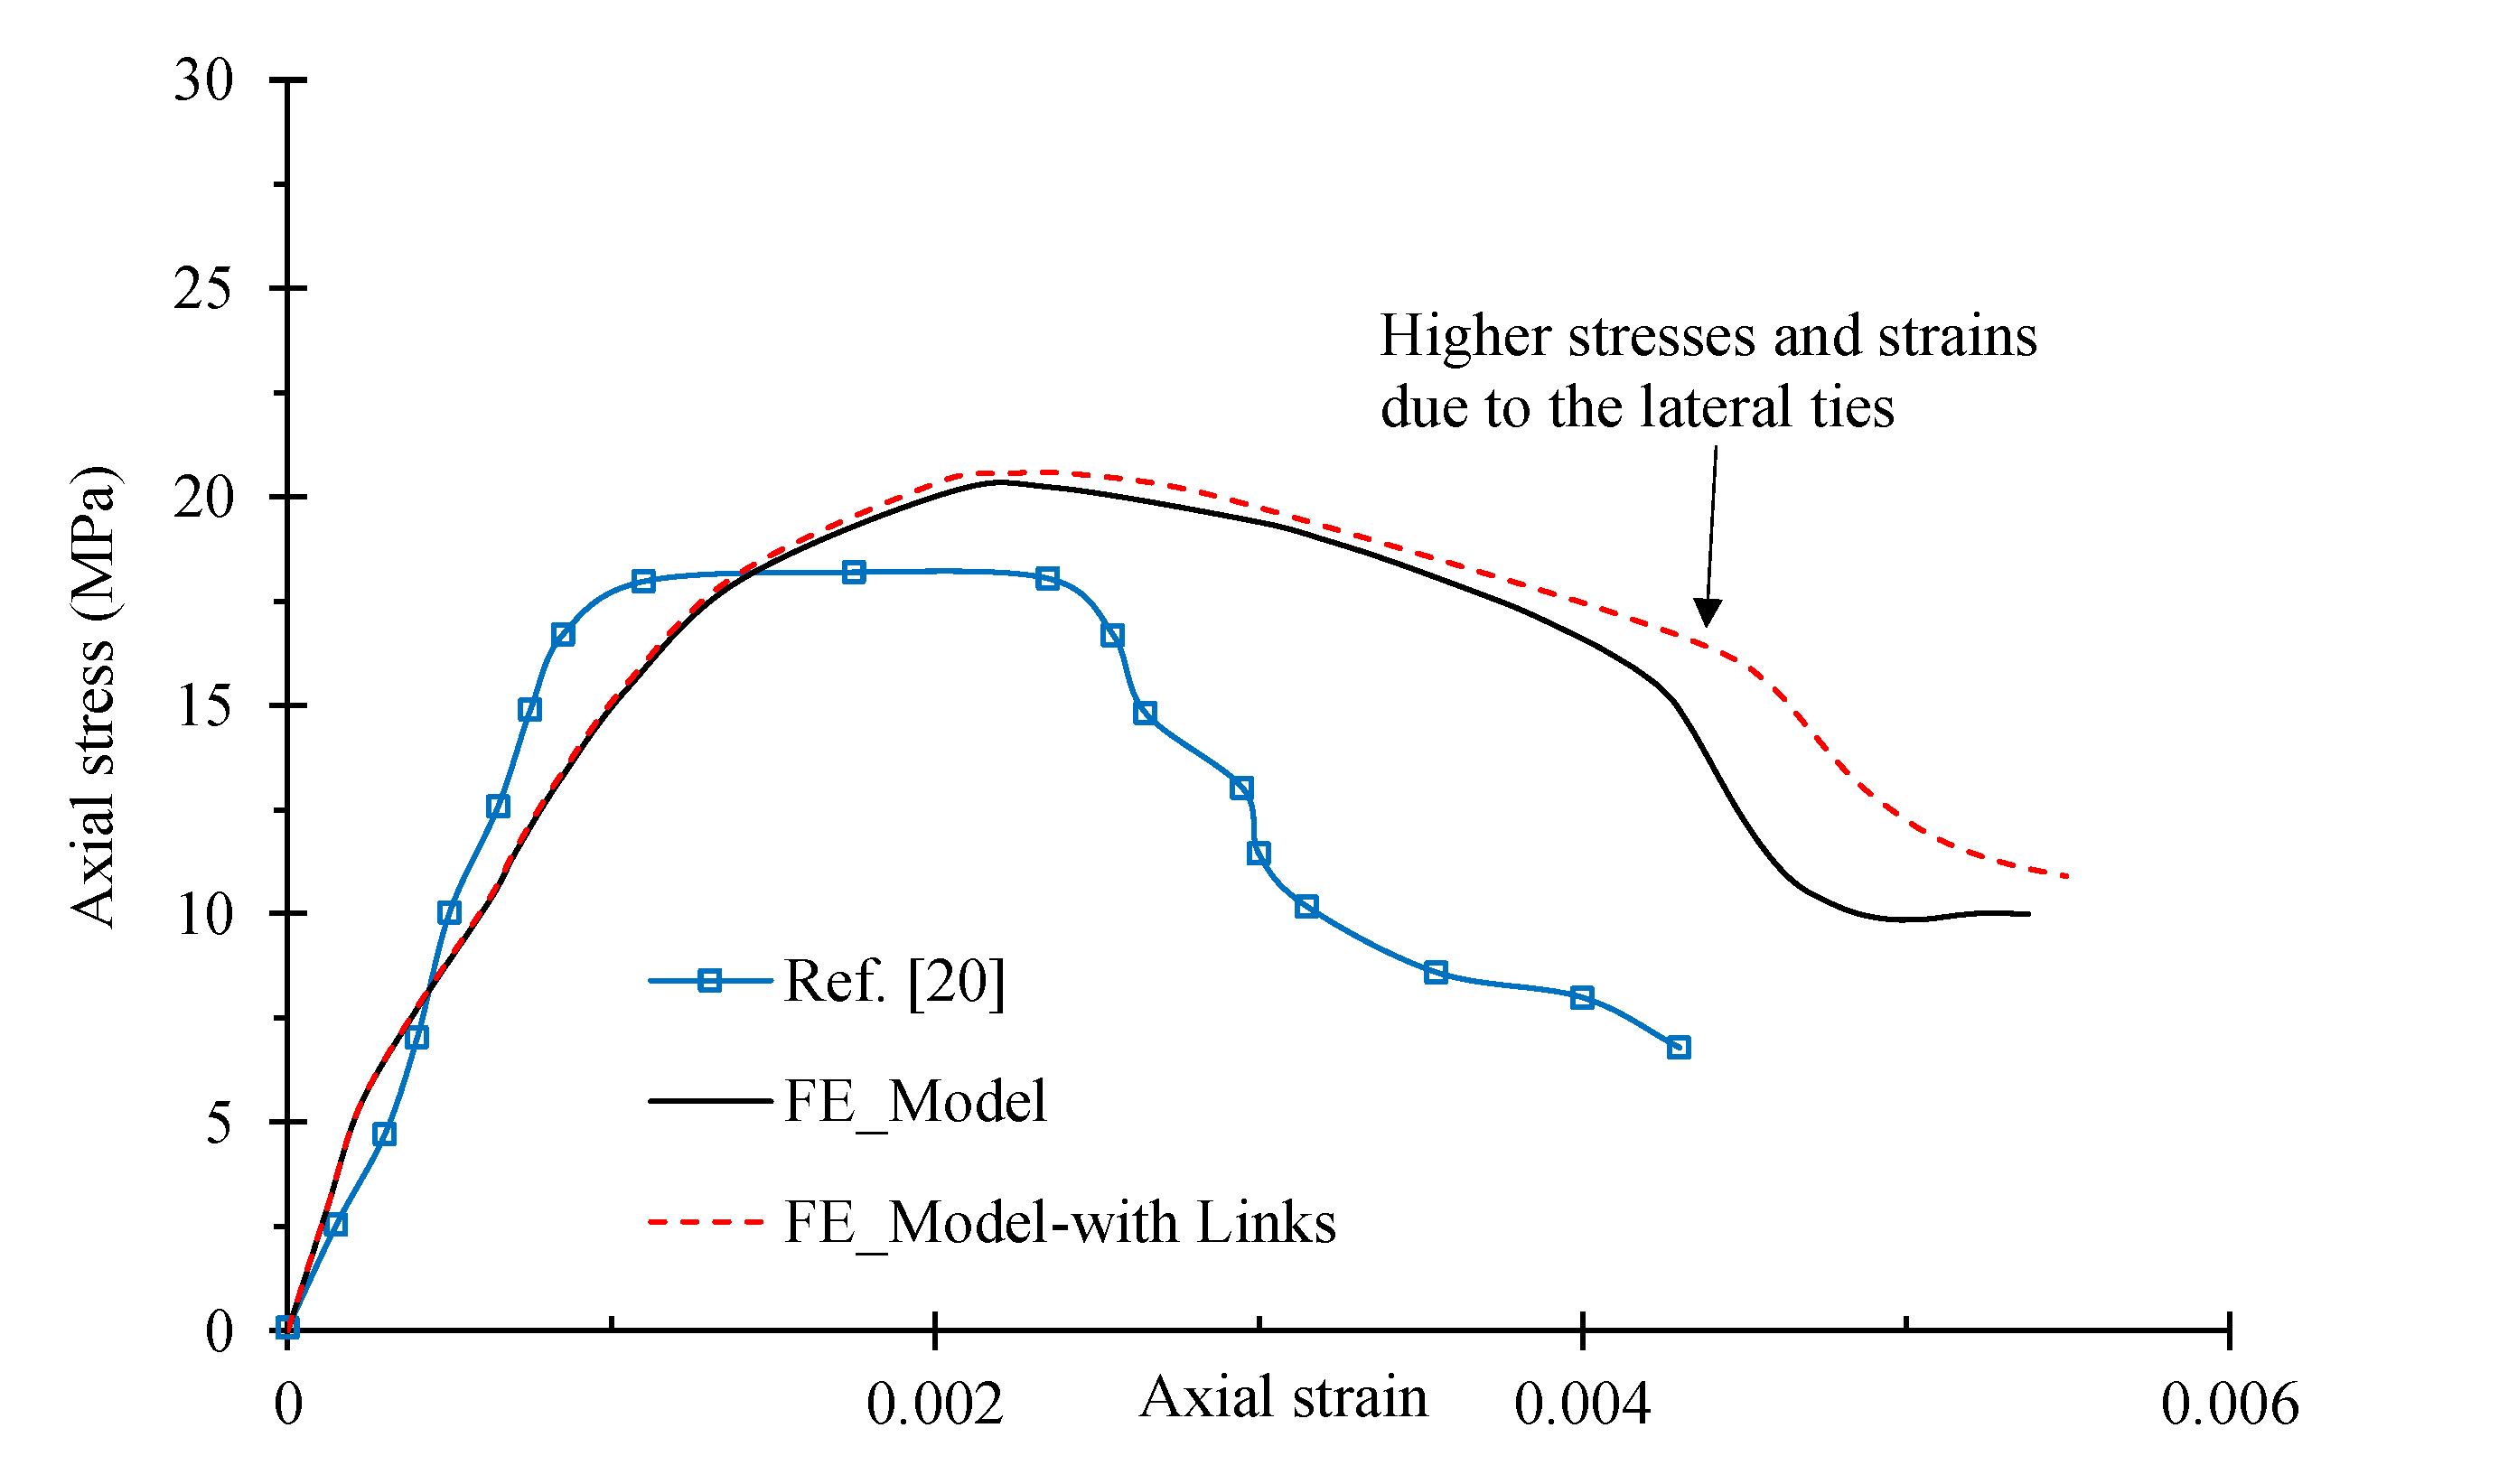
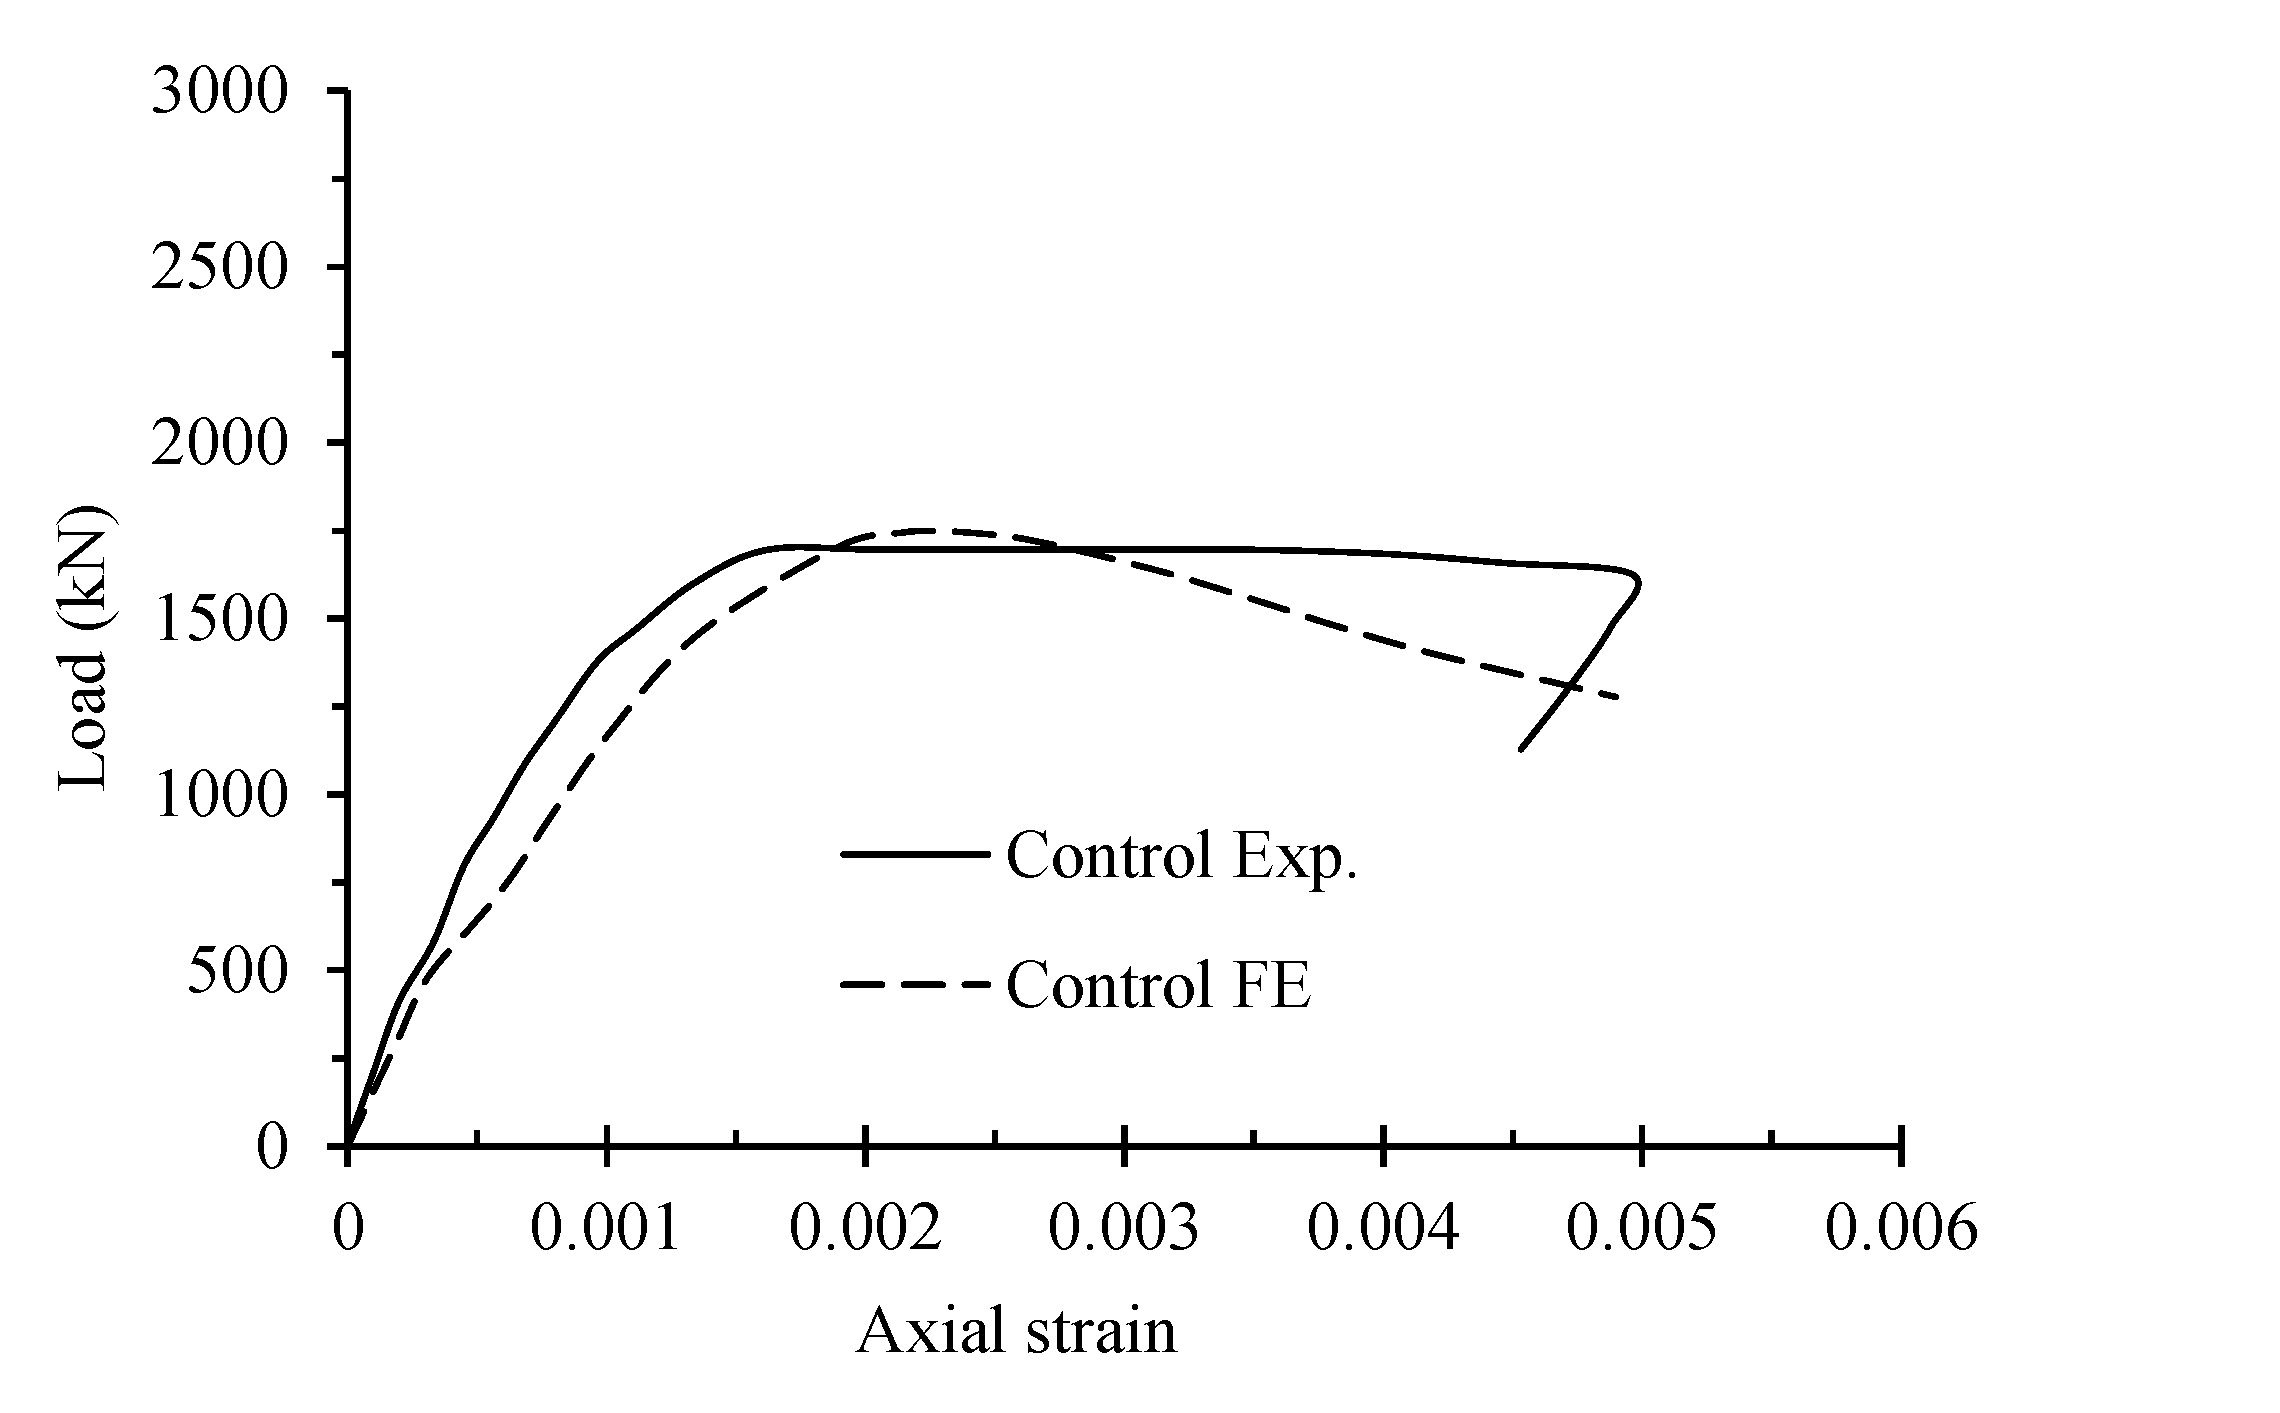
4.2. Details of Concrete Model and Validation

Table 4 depicts the properties of materials utilized in the FE analysis. The kinematic hardening plasticity model was used to model the material behavior of reinforcing bars and stirrups. The concrete damage plasticity (CDP) model was employed for modeling the material behavior of column concrete. The CDP model uses the concepts of damage mechanics and effective stress-based plasticity. Since the testing was pseudo-static in the ambient laboratory environment, the CDP model was used without using the strain-rate and temperature-dependent data. The plasticity parameters employed for the present model are given in Table 4. The compression behavior of concrete used in the present study was first validated with the help of the stress-strain variation of concrete proposed earlier [32]. After validation, the yield stress versus inelastic strain values was input in the CDP model. Assuming 10% as the maximum limit for tensile strain, the tensile behavior (i.e., the plot between yield strength versus cracking strain) was then input in the CDP model. Assuming approximate damage limit of almost 80% under compression, the curve between the damage parameter and inelastic strain was obtained. For tension, 90% damage limit was used. The yield stress versus cracking strain and the damage parameter versus cracking strain curves are plotted in Figure 9 and Figure 10.
The FE model developed herein was first validated with the study of Triantafillou et al. [20]. The experimentally obtained curve, as well as the finite element model, are compared in Figure 11. The model shows a good comparison. It is appropriate to mention here that the study conducted in reference [20] tested wall-like columns without the provision of lateral ties for anchoring inner longitudinal rebars. The lateral anchoring ties, especially for wide columns, are necessary for ductility requirements. Therefore, finite element analysis for the same columns with the addition of lateral ties was also carried out and plotted in Figure 11, and a considerable increase in the post-peak response is observed for columns with lateral ties.

4.3. Discussion of Numerical Results

The finite element model developed herein was validated with the test results obtained for control and strengthened columns. The plots for axial compressive load versus rebar axial strains for different schemes are plotted in Figure 12 and Figure 13 for control and retrofitted columns, respectively. The difference in values of the peak load predicted by the FE analysis and the experimental values of the columns was found to be within 10%. The predicted peak load for the control column was 1747 kN compared to the experimentally observed load of 1696 kN. The comparison presented in Figure 13a for Scheme 1 reveals that the peak load predicted by FE analysis was only 5% less than the experimentally observed peak load. For Scheme 2, the difference between the FE and test results of peak load was around 9%. The error in predicting the peak load of Scheme 3 was 6%, whereas the peak load predicted by FE analysis for Scheme 4 matches very well with the experimentally observed values.
From Figure 12 and Figure 13, a slight quantitative difference between the numerical and experimental values of the pre-peak and post-peak branches of the axial load versus rebar strain plots was observed. In the FE analyses plots, more softening behavior was seen compared to the experimental results, whereas for the case of Scheme 3, plots shown in Figure 13c show more hardening than the experimental ones. For the Scheme 4 plots shown in Figure 13d, the pre-peak branch predicted by the FE analysis matches quite well with the experimental results. However, a small quantitative difference was apparently seen in the post-peak response.
Since the experimental as well as the FE analysis results for Scheme 4 present the highest increase in the values of the peak loads and the failure strains, further analysis was carried out. FE analysis was carried out for a column similar to Scheme 4 but without the CFRP wraps, thus representing a column that was transformed from the rectangular section to the elliptical cross-section column only. The plot between the axial load versus the rebar strains for Scheme 4 without CFRP wraps is depicted in Figure 13d. It is observed from Figure 13d that by transforming the column section from rectangular to an elliptical one, the peak load increased from 1747 to 1987 kN, thus representing an increase of about 12%. It means that an enhancement in the area of the column section by 18% while converting the rectangular section to the elliptical shape was mainly responsible for only a 12% increase in the peak load of the column. Another analysis was carried out for control columns wrapped with two horizontal plies of CFRP. The axial load versus rebar strain plot is shown in Figure 13d. It was found that for this case, the enhancement in the peak load was 12% when compared to that of the control column. However, the enhancement in the peak load for Scheme 4 was 38% compared to the reference column. This enhancement in the peak load was mainly because of the better confinement of concrete by the CFRP wraps due to the elliptical shape of the column section.
The strains corresponding to the peak loads predicted by the FE analysis show slightly higher values compared to the experimentally observed longitudinal rebar strains. The softening response of the FE plots may be the reason for the prediction of the higher values of strains corresponding to the peak loads. Table 5 shows the stress and corresponding strain in rebars at different load levels (i.e., typical locations in the pre-peak branch, at peak load, and typical locations in the post-peak branch).
It can be seen from Table 5 that initially, for all the schemes (load values ≤ 30% of peak load), the stresses, as well as the corresponding strains in rebars and ties, were almost similar and quite minimal. For the control column, when the load increased from 27% to 67% of the peak load, the longitudinal rebar stresses increased by almost 150%. At peak load, the rebar stress was just below the yield strength of rebars. However, in the post-peak portion, the increase in the column deformation results in an increase in rebar stresses which even exceed the yield strength of rebars. The ultimate failure of the control column was because of the crushing of concrete, followed by the buckling of rebars in the zone of concrete crushing.
For Scheme 1, no yielding of rebars was observed (neither in the pre-peak branch nor in the post-peak branch of the load-deformation curve). The maximum longitudinal rebar stress occurred at the peak load, which was almost 14% less than the yield strength. Additionally, for Scheme 2, no yielding was observed. However, at the peak load, the stresses were only 1% less than the yield strength of rebars. The final failure of the strengthened column was because of the concrete crushing. For Scheme 3, the buckling of longitudinal bars was observed at the peak load. Additionally, in Scheme 3, in the post-peak portion of the load versus axial deformation curve, buckling was observed. In Scheme 4, the yielding of rebars was observed at the initiation of the post-peak portion of the load versus the axial deformation curve. The failure of the Scheme 4 column was because of concrete crushing accompanied by the buckling of the longitudinal steel bars.

5. Conclusions

Investigations on the axial compression behavior of half-scale strengthened RC wall-like columns were carried out. Wall-like columns with an aspect ratio of four were tested. Four confinement/strengthening schemes were employed. The columns were strengthened by employing external confinement using two layers of CFRP wraps and/or steel/FRP strips with/without modification of the column cross-section using mortar or GFRP laminates. The experimental results were also compared with the numerical results, which were first validated against the previous studies. On the basis of the test results of this study, the major conclusions drawn are as follows:
  • The study validated that RC wall-like columns can be strengthened using FRP confinement. Based on the experimental results, wrapping wall-like columns subjected to compression loading FRP sheets delays the occurrence of yielding in longitudinal rebars.
  • For strengthened or un-strengthened columns, failure was attributed to concrete cover delamination and concrete crushing, followed by the buckling of the main steel bars.
  • The maximum carrying capacity of the wall-like columns can be increased by more than 30% by adding vertical and horizontal FRP sheets around the column surface.
  • The type of failure of the FRP-strengthened columns can be improved by: (i) anchoring the FRP sheets along the wide side of the column with a steel plate; or by (ii) modifying the shape of the column from rectangular to elliptical using mortar underneath the FRP sheets.
  • The validation of the experimental and FE results reveals the significance of the numerical modeling that can be employed for predicting the deformation characteristics of both un-strengthened and retrofitted concrete wall-like columns. A low magnitude of prediction errors of less than 10% shows a reasonably close prediction. This demonstrates that the numerical modeling approach may be utilized in future studies to investigate additional strengthening schemes for RC wall-like columns. However, the convergence of the numerical model with experimental results needs to be further improved, especially for future numerical studies involving shear-strengthening.

Author Contributions

Conceptualization, methodology, validation, formal analysis, writing—original draft, writing—review and editing, H.A., S.M.I., H.E. and N.A.-H.; funding acquisition, Y.A.-S., H.E. and H.A.; supervision, investigation, writing—review and editing, Y.A.-S. and T.A. All authors have read and agreed to the published version of the manuscript.

Funding

This work is based on the Project funded by the National Plan for Science, Technology and In-novation (MAARIFAH), King Abdulaziz City for Science and Technology, Kingdom of Saudi Arabia, Award Number (13-ADV858-02-R).

Data Availability Statement

Not applicable.

Acknowledgments

This work is based on the Project funded by the National Plan for Science, Technology and Innovation (MAARIFAH), King Abdulaziz City for Science and Technology, Kingdom of Saudi Arabia, Award Number (13-ADV858-02-R).

Conflicts of Interest

The authors declare no conflict of interest.

References

  1. Al-Salloum, Y.A.; Almusallam, T.H.; Elsanadedy, H.M.; Iqbal, R.A. Effect of elevated temperature environments on the residual axial capacity of RC columns strengthened with different techniques. Constr. Build. Mater. 2016, 115, 345–361. [Google Scholar] [CrossRef]
  2. Al-Salloum, Y.A.; Al-Amri, G.S.; Siddiqui, N.A.; Almusallam, T.H.; Abbas, H. Effectiveness of CFRP strengthening in improving cyclic compression response of slender RC columns. J. Compos. Constr. 2018, 22, 04018009. [Google Scholar] [CrossRef]
  3. Siddiqui, N.; Abbas, H.; Almusallam, T.; Binyahya, A.; Al-Salloum, Y. Compression behavior of FRP-strengthened RC square columns of varying slenderness ratios under eccentric loading. J. Build. Eng. 2020, 32, 101512. [Google Scholar] [CrossRef]
  4. Siddiqui, N.A.; Alsayed, S.H.; Al-Salloum, Y.A.; Iqbal, R.A.; Abbas, H. Experimental investigation of slender circular RC columns strengthened with FRP composites. Constr. Build. Mater. 2014, 69, 323–334. [Google Scholar] [CrossRef]
  5. Harajli, M.H.; Hantouche, E.; Soudki, K. Stress-strain model for fiber-reinforced polymer jacketed concrete columns. Struct. J. 2006, 103, 672–682. [Google Scholar]
  6. Mirmiran, A.; Shahawy, M.; Samaan, M.; Echary, H.E.; Mastrapa, J.C.; Pico, O. Effect of column parameters on FRP-confined concrete. J. Compos. Constr. 1998, 2, 175–185. [Google Scholar] [CrossRef]
  7. Al-Salloum, Y.A. Influence of edge sharpness on the strength of square concrete columns confined with FRP composite laminates. Compos. Part B Eng. 2007, 38, 640–650. [Google Scholar] [CrossRef]
  8. Wang, L.M.; Wu, Y.F. Effect of corner radius on the performance of CFRP-confined square concrete columns: Test. Eng. Struct. 2008, 30, 493–505. [Google Scholar] [CrossRef]
  9. Prota, A.; Manfredi, G.; Cosenza, E. Ultimate behavior of axially loaded RC wall-like columns confined with GFRP. Compos. Part B Eng. 2006, 37, 670–678. [Google Scholar] [CrossRef]
  10. Wang, Y.C.; Restrepo, J.I. Investigation of concentrically loaded reinforced concrete columns confined with glass fiber-reinforced polymer jackets. Struct. J. 2001, 98, 377–385. [Google Scholar]
  11. Tan, K.H. Strength enhancement of rectangular reinforced concrete columns using fiber-reinforced polymer. J. Compos. Constr. 2002, 6, 175–183. [Google Scholar] [CrossRef]
  12. Tanwongsval, S.; Maalej, M.; Paramasivam, P. Strengthening of RC wall-like columns with FRP under sustained loading. Mater. Struct. 2003, 36, 282–290. [Google Scholar] [CrossRef]
  13. Maalej, M.; Tanwongsval, S.; Paramasivam, P. Modelling of rectangular RC columns strengthened with FRP. Cem. Concr. Compos. 2003, 25, 263–276. [Google Scholar] [CrossRef]
  14. Pan, J.L.; Xu, T.; Hu, Z.J. Experimental investigation of load carrying capacity of the slender reinforced concrete columns wrapped with FRP. Constr. Build. Mater. 2007, 21, 1991–1996. [Google Scholar] [CrossRef]
  15. Kumutha, R.; Vaidyanathan, R.; Palanichamy, M.S. Behaviour of reinforced concrete rectangular columns strengthened using GFRP. Cem. Concr. Compos. 2007, 29, 609–615. [Google Scholar] [CrossRef]
  16. De Luca, A.; Matta, F.; Nanni, A. Behavior of full-scale glass fiber-reinforced polymer reinforced concrete columns under axial load. ACI Struct. J. 2010, 107, 589. [Google Scholar]
  17. Toutanji, H.; Han, M.; Gilbert, J.; Matthys, S. Behavior of large-scale rectangular columns confined with FRP composites. J. Compos. Constr. 2010, 14, 62–71. [Google Scholar] [CrossRef]
  18. De Luca, A.; Nardone, F.; Matta, F.; Nanni, A.; Lignola, G.P.; Prota, A. Structural evaluation of full-scale FRP-confined reinforced concrete columns. J. Compos. Constr. 2011, 1, 112–123. [Google Scholar] [CrossRef]
  19. Alsayed, S.H.; Almusallam, T.H.; Ibrahim, S.M.; Al-Hazmi, N.M.; Al-Salloum, Y.A.; Abbas, H. Experimental and numerical investigation for compression response of CFRP strengthened shape modified wall-like RC column. Constr. Build. Mater. 2014, 63, 72–80. [Google Scholar] [CrossRef]
  20. Triantafillou, T.C.; Choutopoulou, E.; Fotaki, E.; Skorda, M.; Stathopoulou, M.; Karlos, K. FRP confinement of wall-like reinforced concrete columns. Mater. Struct. 2016, 49, 651–664. [Google Scholar] [CrossRef]
  21. De Luca, A.; Nardone, F.; Lignola, G.P.; Prota, A.; Nanni, A. Wall-like reinforced concrete columns externally confined by means of glass FRP laminates. Adv. Struct. Eng. 2013, 16, 593–603. [Google Scholar] [CrossRef] [Green Version]
  22. Rasouli, M.; Broujerdian, V. 3D finite element modeling of FRP-confined rectangular short columns considering variation of Poisson’s ratio. Iran. J. Sci. Technol. Trans. Civ. Eng. 2019, 44, 449–461. [Google Scholar] [CrossRef]
  23. Avossa, A.M.; Picozzi, V.; Ricciardelli, F. Load-Carrying Capacity of Compressed Wall-Like RC Columns Strengthened with FRP. Buildings 2021, 11, 285. [Google Scholar] [CrossRef]
  24. Kohnke, P. ANSYS Theory Reference Manual; Ansys Inc.: Canonsburg, PA, USA, 2013. [Google Scholar]
  25. Hassan, M.; Chaallal, O. Fiber-reinforced polymer confined rectangular columns: Assessment of models and design guidelines. ACI Struct. J. 2007, 104, 693. [Google Scholar]
  26. Rocca, S.; Galati, N.; Nanni, A. Review of design guidelines for FRP confinement of reinforced concrete columns of noncircular cross sections. J. Compos. Constr. 2008, 12, 80–92. [Google Scholar] [CrossRef] [Green Version]
  27. Foster, S.J.; Attard, M.M. Experimental tests on eccentrically loaded high strength concrete columns. Struct. J. 1997, 94, 295–303. [Google Scholar]
  28. ASTM E8/E8M-16a; Standard Test Methods for Tension Testing of Metallic Materials. American Society for Testing and Materials: West Conshohocken, PA, USA, 2016.
  29. ASTM C39/C39M-17; Standard Test Method for Compressive Strength of Cylindrical Concrete Specimens. American Society for Testing and Materials: West Conshohocken, PA, USA, 2017.
  30. ASTM D3039/D3039M-14; Method for Tensile Properties of Polymer Matrix Composite Materials. American Society for Testing and Materials. American Society for Testing and Materials: West Conshohocken, PA, USA, 2014.
  31. Abaqus 6.17 Analysis User’s Guide, Section 12.9.3—Defining Damages; Dassault Systemes Simulia Corp.: Providence, RI, USA, 2017.
  32. Almusallam, T.H.; Alsayed, S.H. Stress–strain relationship of normal, high-strength and lightweight concrete. Mag. Concr. Res. 1995, 47, 39–44. [Google Scholar] [CrossRef]
Figure 1. Details of column specimen (all dimensions are in mm).
Buildings 13 00026 g001
Figure 2. Casting of columns: (a) steel cage in wooden form ready for casting in horizontal position; (b) curing of column specimens.
Buildings 13 00026 g002
Figure 3. Cross-section of wall-like columns for different strengthening schemes: (a) Scheme 1 (7V2H); (b) Scheme 2 (4S2H); (c) Scheme 3 (4C2H); and (d) Scheme 4 (E2H).
Buildings 13 00026 g003aBuildings 13 00026 g003b
Figure 4. Test setup.
Buildings 13 00026 g004
Figure 5. Modes of failure of: (a) control column; and columns strengthened using; (b) Scheme 1 (7V2H); (c) Scheme 2 (4S2H); (d) Scheme 3 (4C2H); and (e) Scheme 4 (E2H).
Buildings 13 00026 g005
Figure 6. Load versus axial strain curves: (a) longitudinal rebar strain at mid-height; and (b) total strain of columns (measured through potentiometer).
Buildings 13 00026 g006aBuildings 13 00026 g006b
Figure 7. Load versus tensile strain in column ties for: (a) control column; (b) column strengthened using Scheme-1; (c) column strengthened using Scheme-2; (d) column strengthened using Scheme-3; and (e) column strengthened using Scheme-4.
Buildings 13 00026 g007aBuildings 13 00026 g007b
Figure 8. Finite element mesh for different columns: (a) control column; (b) column strengthened using Schemes 2 and 3; and (c) column strengthened using Schemes 1 and 4.
Buildings 13 00026 g008
Figure 9. Input curves used in ABAQUS for: (a) compressive versus inelastic strain; (b) tensile stresses versus cracking strain.
Buildings 13 00026 g009
Figure 10. Input curves used in ABAQUS for damage evolution in: (a) compression; (b) tension.
Buildings 13 00026 g010
Figure 11. Comparison of finite element model with experimental results of a control column of reference [20].
Buildings 13 00026 g011
Figure 12. Comparison of load versus axial strain curve for control column.
Buildings 13 00026 g012
Figure 13. Comparison of experimental and numerical load versus axial strain curves for columns strengthened using: (a) Scheme 1; (b) Scheme 2; (c) Scheme 3; and (d) Scheme 4.
Buildings 13 00026 g013
Table 1. Mechanical characteristics of FRP sheets.
MaterialCFRPGFRP
Ultimate tensile strength in fiber direction (MPa)846456
Fracture strain0.0110.018
Elastic modulus in fiber direction (GPa)77.327.6
Shear capacity (MPa)4.24.4
Flexural capacity (MPa)670282.4
Flexural elastic modulus (GPa)47.514.6
Sheet thickness (mm)1.01.3
Table 2. Effect of strengthening schemes on ultimate, yield and failure load and the corresponding longitudinal rebar strains.
Scheme/SpecimenYield Load (kN)At PeakAt Failure
Load (kN)MicrostrainLoad (kN)Microstrain
Control16681693300016215100
Scheme 1 (7V2H)2240 (34%)2259 (33%)1939 (−35%)--
Scheme 2 (4S2H)2076 (24%)2200 (30%)4505 (+50%)--
Scheme 3 (4C2H)1839 (10%)2193 (30%)2850 (−5%)--
Scheme 4 (E2H)2413 (45%)2413 (42%)2620 (−12%)2020 (25%)11,000 (116%)
The strains reported above are the longitudinal rebar strains at mid-height of columns; value within parentheses is the increase as compared to the control column.
Table 3. Effect of strengthening schemes on lateral microstrains at ultimate and failure loads.
LocationControlScheme 1 (7V2H)Scheme 2 (4S2H)Scheme 3 (4C2H)Scheme 4 (E2H)
At peak load
Tie at top end of column530260010001030680
Tie at mid-height of column470400600490530
Lateral strain at surface of concrete/FRP380330500330740
At failure load
Tie at top end of column850
(60%)
2930
(14%)
2200
(120%)
1560
(51%)
870
(28%)
Tie at mid-height of column800
(70%)
750
(88%)
2600
(333%)
3030
(518%)
5000
(840%)
Lateral strain at surface of concrete/FRP380330500330740
Value within parentheses is the enhancement as compared to the value at the ultimate load.
Table 4. Material properties employed in FE modelling using ABAQUS 6.17.
Concrete
Material modelConcrete damage plasticity (CDP)
Unit weight (kg/m3)2320
Compressive strength—uniaxial (MPa)22.7
Ratio of initial biaxial compressive yield stress to initial uniaxial compressive yield stress, fb0/fc01.16
Dilation angle, ψ40
Eccentricity of the plastic potential surface, ε0.1
Ratio of the second stress invariant on the tensile meridian to compressive meridian at initial yield, Kc0.667
Viscosity parameter, μ0.001
Steel rebars
Material modelElastic-Plastic
Unit weight (kg/m3)7800
Elastic modulus (GPa)200
Poisson’s ratio0.3
Yield stress (MPa)486
FRP materialGFRPCFRP
Material modelAnisotropic Elastic (with fail strain)Anisotropic Elastic (with fail strain)
Unit weight (kg/m3)20002000
Plie thickness (mm)1.51.5
Elastic modulus in fiber direction (MPa)27,28077,280
Elastic modulus in transverse direction (MPa)400400
Fail Tensile strain (fiber direction)0.110.11
Fail Compressive strain (fiber direction)0.010.01
Fail Tensile strain (transverse direction)0.010.01
Fail Compressive strain (transverse direction)0.010.01
Fail Shear strain0.010.01
Table 5. Axial compressive stresses and strains at failure location in rebars and lateral ties.
SchemeLoad Deflection Curve LocationLoad Value (kN)Load Percent (%)Stress and Strain in Rebars
Longitudinal RebarTies
Stress (MPa)MicrostrainStress (MPa)Microstrain
ControlPre peak4752761306947
117367202101165324
Peak17471004662330179893
Post peak16159549130992611307
13988549639282811405
10696153855722881442
8284757267452681339
Scheme 1 (7V2H)Pre peak49422613061049
140964226113275377
2070943011506162808
Peak219210041621092021011
Post peak219910041323522121062
17678040823432121062
14896839322922241120
Scheme 2 (4S2H)Pre peak48522613071048
137664228113876379
1883873521759134670
Peak215810048124712221108
Post peak19959247031282461230
16267546635012881442
15287146735313071534
Scheme 3 (4C2H)Pre peak639319447025125
1798873381688135674
207510048624552311154
Peak19129246223662401199
Post peak17328344422792451226
13816741521302791396
10625141521313862649
Scheme 4 (E2H)Pre peak55123613071162
236710031315651551065
Peak237110047323632371701
Post peak236710048827912581951
23579949334142882437
22119352050983172962
0057969613483978
Disclaimer/Publisher’s Note: The statements, opinions and data contained in all publications are solely those of the individual author(s) and contributor(s) and not of MDPI and/or the editor(s). MDPI and/or the editor(s) disclaim responsibility for any injury to people or property resulting from any ideas, methods, instructions or products referred to in the content.

