
Energy Evolution and Damage Characteristics of Rock Materials under Different Cyclic Loading and Unloading Paths

1
School of Civil Engineering, University of South China, Hengyang 421001, China
2
School of Resources and Safety Engineering, Central South University, Changsha 410083, China
3
School of Resources Environment and Safety Engineering, University of South China, Hengyang 421001, China
*
Author to whom correspondence should be addressed.
Buildings 2023, 13(1), 238; https://doi.org/10.3390/buildings13010238
Submission received: 7 December 2022
/
Revised: 2 January 2023
/
Accepted: 11 January 2023
/
Published: 14 January 2023
(This article belongs to the Topic New Trends in Rock Materials Mechanics and Engineering Geology)
Abstract
:In order to study the deformation and failure characteristics of rocks under different cyclic loading and unloading paths, three stress path tests were conducted, and acoustic emission (AE) monitoring was conducted simultaneously. The mechanical characteristics and AE characteristics under different stress paths were analyzed, and the influences of the different stress paths on the energy dissipation and deformation damage were investigated. The law of energy evolution considering viscoelasticity under different stress paths was obtained. The concept of ultimate damage energy and its calculation method was proposed. The results show that the “hardening effect” of sandstone and granite under the constant lower limit (CLLCL) is the most significant in maximizing the mechanical property. The CLLCL imparts a stronger elastic property to rocks than the variable lower limit (VLLCL) does, while the VLLCL causes more damage to rocks than the CLLCL. A significant linear relationship between the proportion of damage energy and the proportion of elastic energy was discovered. Based on this linear relationship, the ultimate damage energy can be calculated for sandstone and granite. The evolution of the damage variable based on damage energy was compatible with the real damage condition, which validates the ultimate damage energy calculation method. The research results lay a theoretical foundation for the design and construction of geotechnical engineering.
1. Introduction
In geotechnical engineering activities, such as chamber excavation and tunnel boring, the surrounding rock containing a lot of joints and fissures is often in a state of cyclic loading and unloading, which may cause instability and a loss of employees and property [1,2,3,4]. When different excavation methods are applied, rocks are placed under different cyclic loading and unloading stress paths, leading to significant differences in the characteristics of rock failure [5]. The essence of rock failure, from a thermodynamic perspective, is the instability caused by energy evolution, and the deformation and failure of loaded rocks is an irreversible process of energy dissipation [6]. Consequently, studying the energy evolutions of rocks under different cyclic loading and unloading stress paths from the viewpoint of energy is beneficial for revealing the essential characteristics of rock failure and is of great importance to the stability analysis of geotechnical engineering.
At present, the existing research on rock energy may be divided into two areas: energy accumulation and dissipation characteristics, and energy failure criteria. In terms of energy accumulation and dissipation characteristics, Meng et al. [7] investigated the effect law of lithology and loading rate on the energy evolution process of loaded rocks and found that the energy density of three types of rocks showed a nonlinear evolution law when stress was under different loading and unloading rates. Zhao et al. [8] analyzed the energy of rocks with various height–diameter ratios and discovered that the stored elastic energy of rocks under the same load was directly related to the height–diameter ratio and inversely proportional to the energy storage limit. Liu et al. [9] studied the influences of cycle number and upper limit stress on the evolution of the dissipated energy of rocks and found that the dissipated energy per unit volume also showed an overall increasing trend with an increasing cycle number and stress level. In terms of energy failure criteria, Xie et al. [10] established rock strength and overall failure criteria based on the principle of energy dissipation and release. Gong et al. [11] proposed the calculation method of ultimate elastic energy at peak strength based on the linear energy storage law and established a new rockburst proneness criterion. Li et al. [12] revealed the characteristics of the shale energy conversion process and energy evolution under triaxial cyclic loading and established a rock strength failure criterion based on energy catastrophe. Munoz et al. [13] proposed a new brittleness index based on the fracture strain energy derived from stress–strain measurements of rock. The energy evolution of rock can truly and objectively reflect the deformation and failure process of rock [14,15,16,17]. Consequently, some researchers used the energy principle to establish damage models that revealed the characteristics of rock damage. Many researchers have argued that dissipated energy is the useful work that causes rock failure, and the damage variable of rock was established based on the dissipated energy [18,19,20,21,22]. In fact, during the loading process, friction between particles and viscosity between liquids make the rock show nonlinear hysteresis; thus, non-dry rock is a viscoelastic material [23,24,25]. If the viscoelasticity is not taken into account for non-dry rocks, then the calculation result of the damage variable will be larger than the real value [26]. Therefore, in order to reflect the real mechanical properties of rock, the viscoelasticity in rock should be considered. In addition, other researchers used the acoustic emission (AE) technique to study the deformation and failure characteristics during cyclic loading and unloading from a microscopic viewpoint. AE signals can reflect micro-crack development and change caused by the evolution of internal defects in rocks [27,28]. At present, there is abundant research on AE characteristics in the process of rock deformation and failure, including the evolution of AE parameters under uniaxial [29,30], triaxial [31,32], and shear [33,34] loading modes, and the relationship between stress, strain, AE parameters, and AE location before peak strength [35,36,37]. Utilizing AE monitoring technology effectively reveals the development process of rock cracks. By combining this with energy analysis, it is possible to forecast the condition and type of rock failure more accurately and reveal the mechanism of instability.
Currently, the impacts of different stress paths under cyclic loading and unloading are seldom considered in studies on the energy evolution of rock. This is crucial for the energy analysis of rock. Different loading and unloading paths have different effects on the energy evolution during rock deformation, and each deformation corresponds to one energy condition [38,39]. In addition, the viscoelasticity of rock has rarely been considered in energy analyses, and damping energy and damage energy within dissipative energy have rarely been distinguished. The damage energy is the useful work that causes rock failure; hence, it is crucial to calculate the damage energy at the peak strength, which cannot be calculated at present. In this paper, uniaxial cyclic loading and unloading tests under different stress paths were carried out. In order to improve the test procedure, AE monitoring was carried out at the same time to real-time monitor the microscopic defects of the rock materials. The characteristics of the mechanics, AE, and energy under different stress paths were investigated. Considering the viscoelasticity of rock, the dissipative energy was subdivided into damage energy and damping energy, and the energy evolution law was further analyzed. The concept of ultimate damage energy and its calculation method was proposed. In order to validate the calculation method of ultimate damage energy and study the rock damage characteristics, the damage variable was established based on the damage energy driving rock failure. The research results provide a theoretical grounding for further revealing the damage, deterioration, and instability mechanisms of rock under cyclic loading and unloading.
2. Materials and Methods
2.1. Specimen Preparation
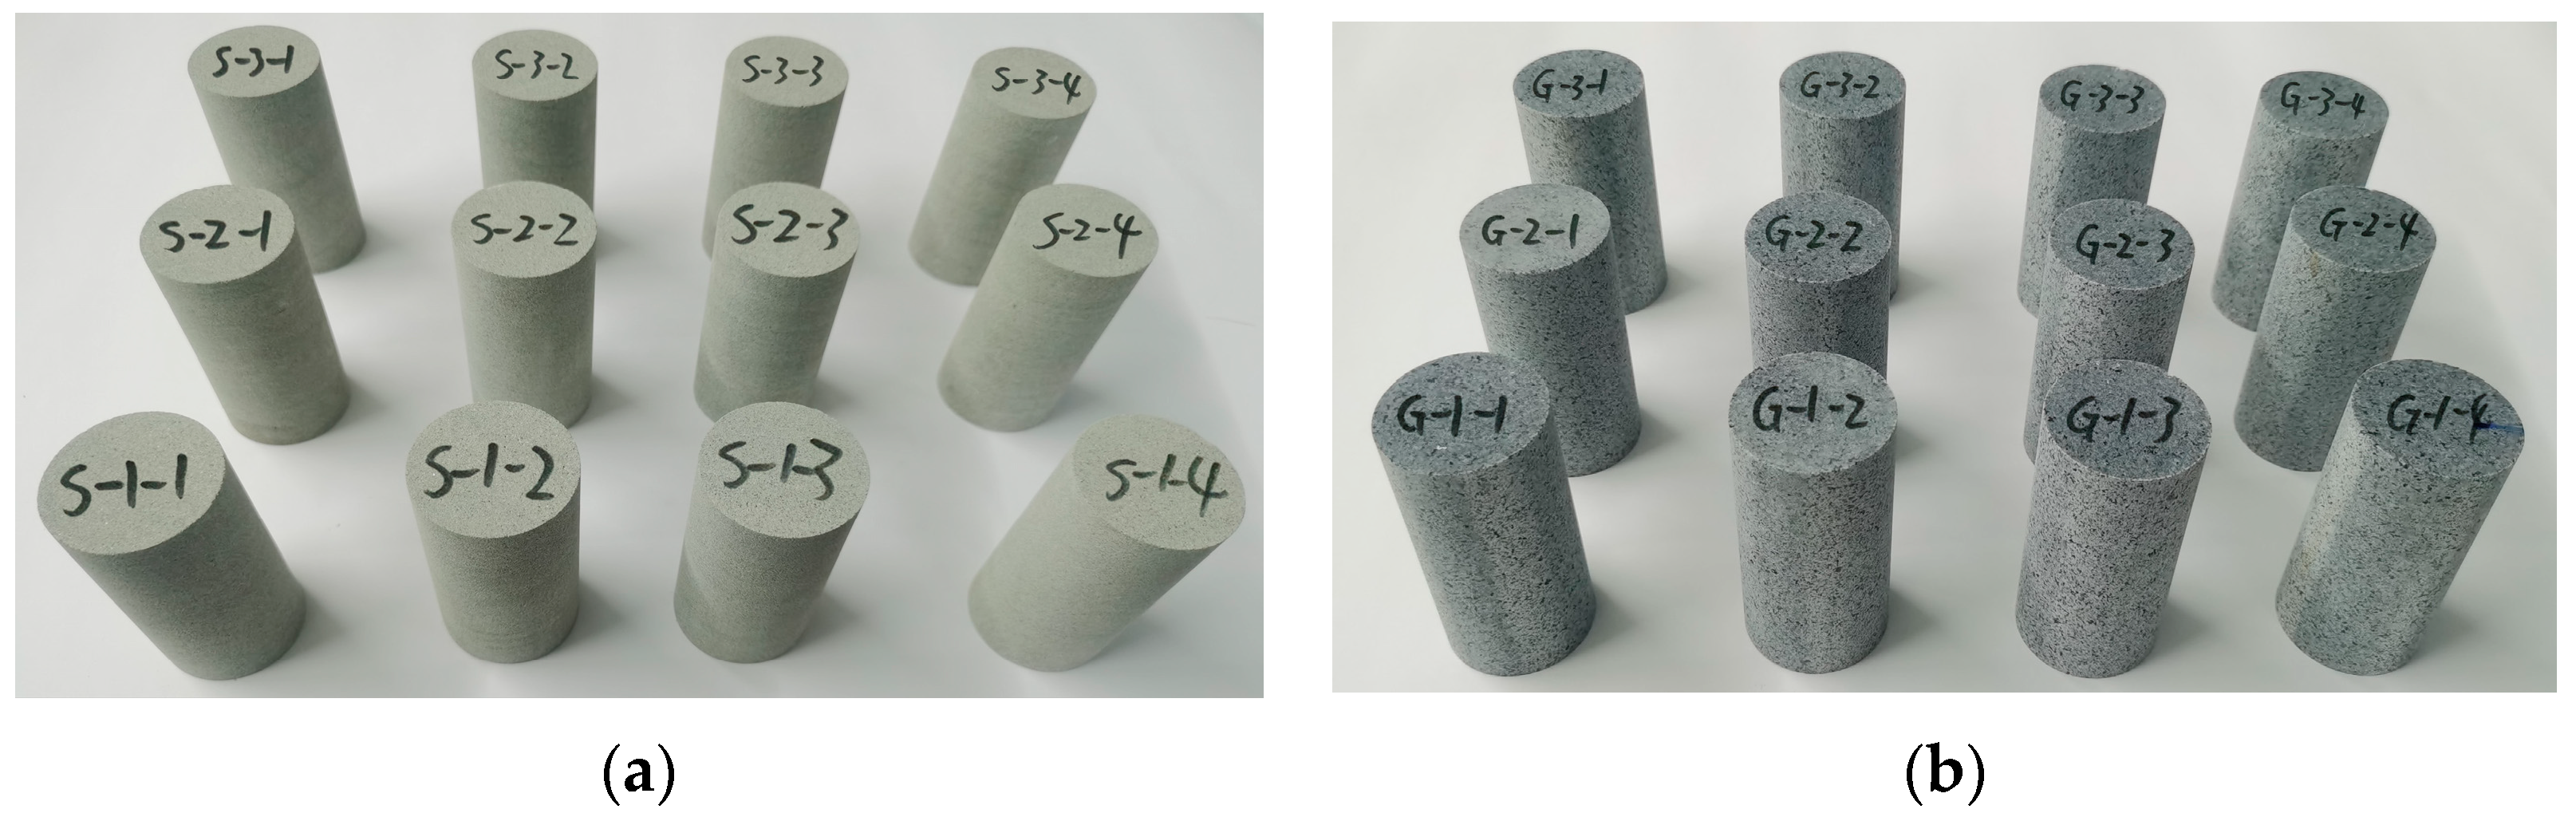
Sandstone and granite were selected for this test. These rock specimens were collected from the surrounding rock at a mining site in Hunan, which is often used in geotechnical engineering. According to the standard of the International Society for Rock Mechanics (ISRM), a cylinder of Φ50 mm × 100 mm was made. The discrepancy between the diameter and height of each rock specimen was less than 0.1 mm, the non-parallelism of the two end faces was less than 0.03 mm, and the margin of error in the vertical direction was between 0.25 and −0.25. In order to reduce the specimens’ discreteness as much as possible, a non-metallic ultrasonic detector was used to measure the wave velocity of the rock specimens. The specimens were named “rock type”, “stress path”, and “number of specimens”. The rock specimens of the prepared test are shown in Figure 1.
2.2. Testing Schemes
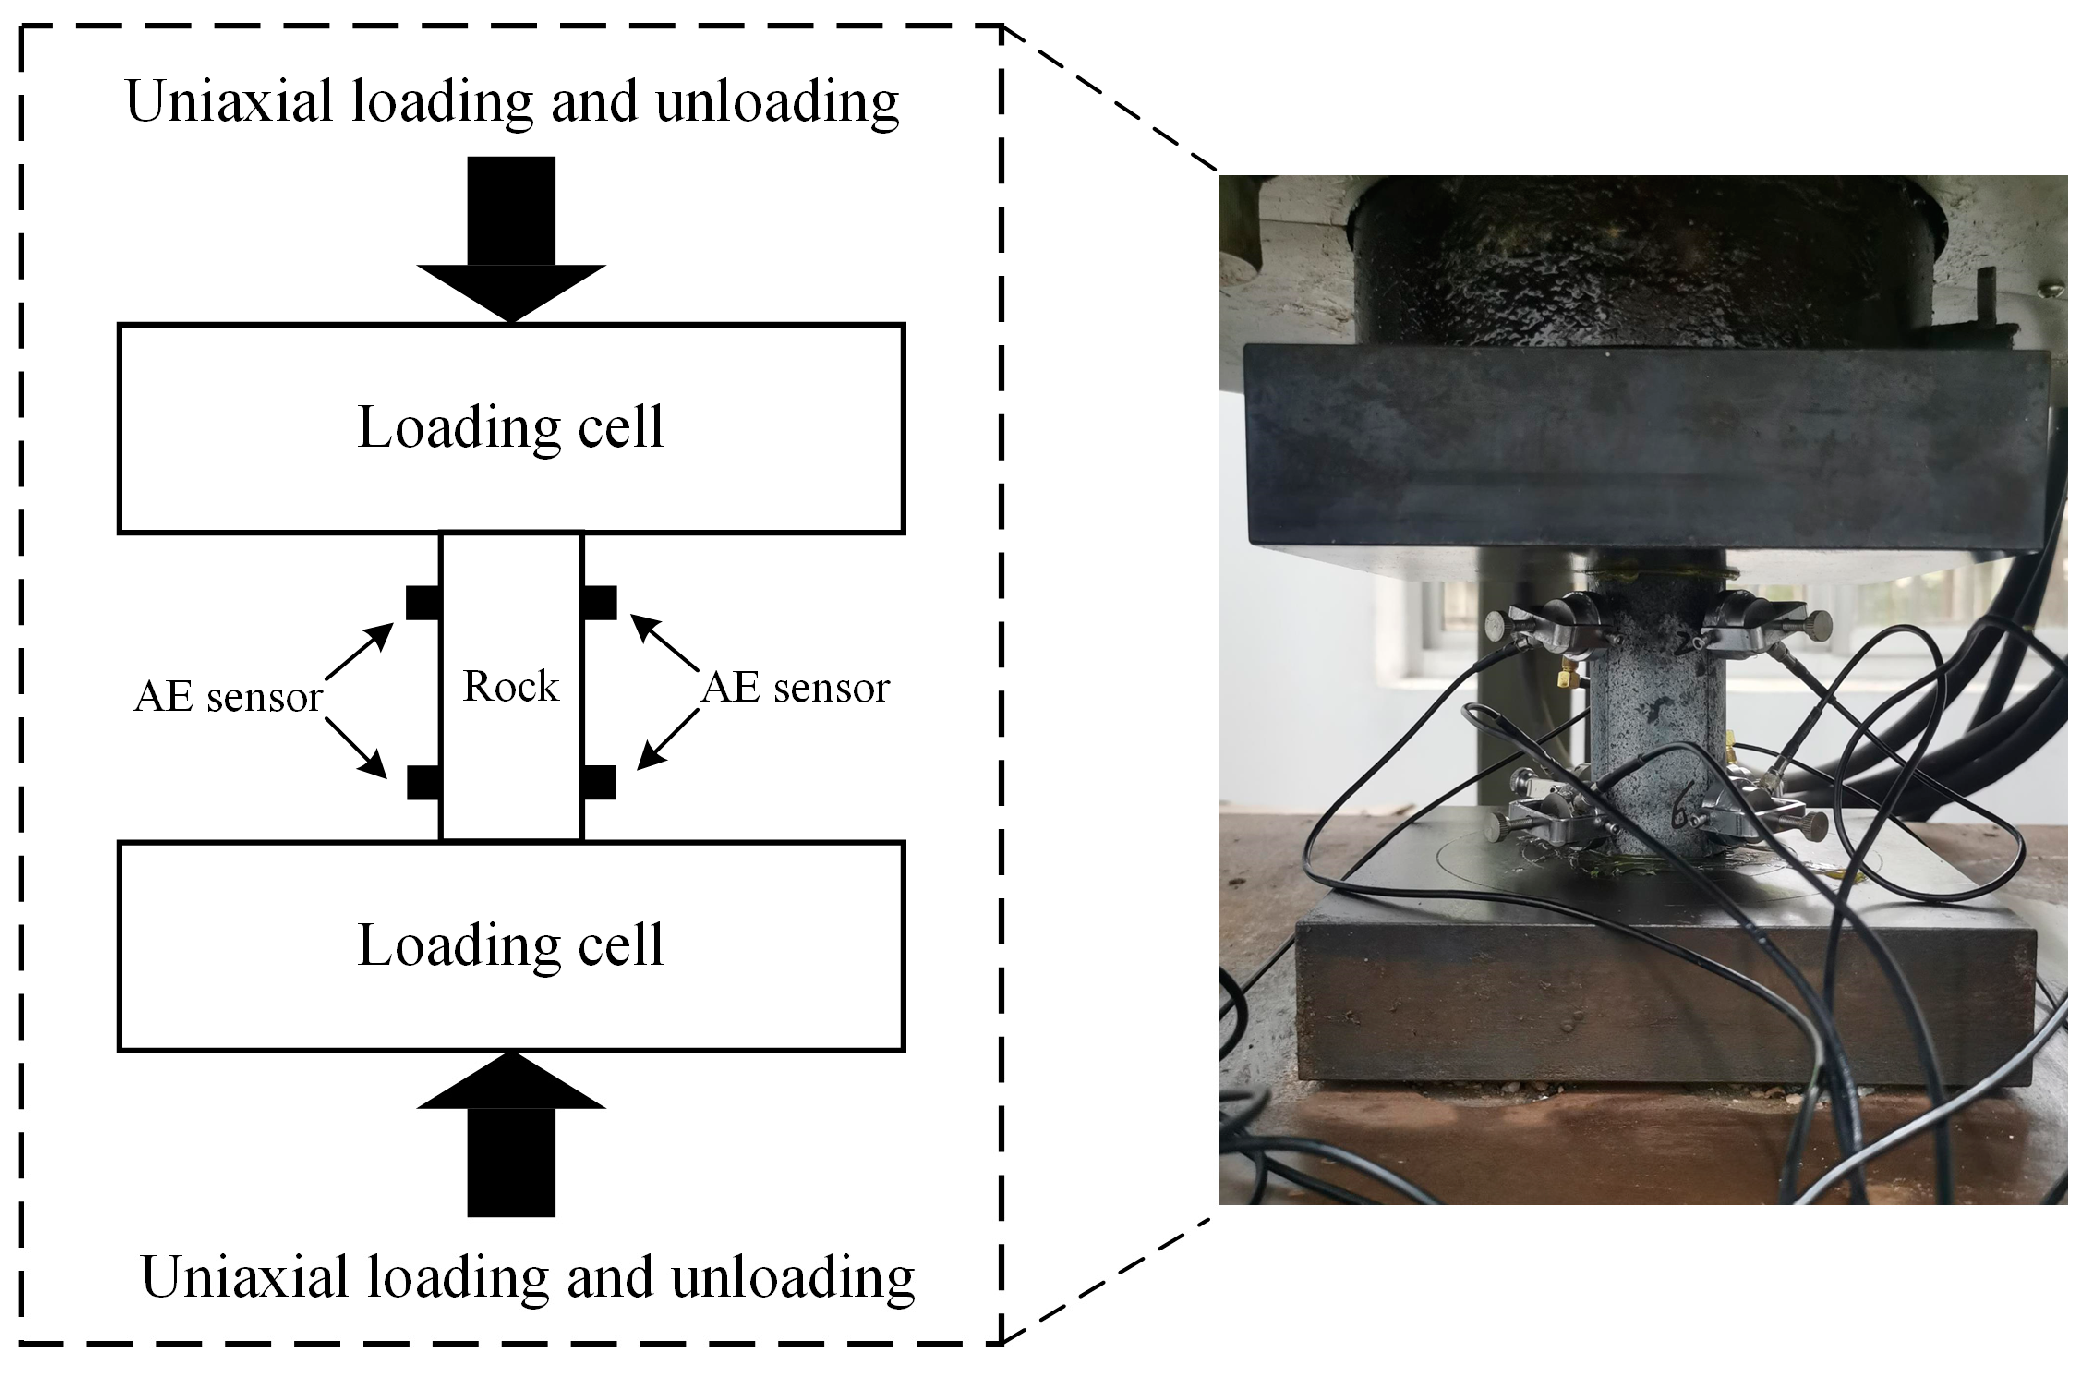
A WAW-1000C electro-hydraulic servo press was used in the uniaxial compression and uniaxial loading and unloading tests. The piston displacement ranged from 0 to 800 mm, the maximum bearing capacity was 1000 kN, and the measurement error was ±1%. Stress and strain data were able to be recorded in real-time. A DS5-8B acoustic emission monitoring system was utilized to automatically monitor and collect the AE signals. The system is sensitive to AE signals and offers a wide frequency response range of 1 kHz–3 MHz. The sensor’s acquisition rate was set to 1 MHz, and its threshold value was 40 dB. Eight AE sensors were equally distributed on the surface of each cylindrical specimen symmetrically with respect to the longitudinal axis. The schematic diagram of testing is shown in Figure 2.
In order to simulate the stress and deformation characteristics of a foundation rock mass subjected to the disturbance of seismic waves or construction, three stress paths were designed: uniaxial compression (UC), constant lower limit cyclic loading and unloading (CLLCL), and variable lower limit cyclic loading and unloading (VLLCL):
- (1)
- UC: Apply a 1 kN preload to the rock specimen and then load at a 1 kN/s loading rate until the rock specimen failure.
- (2)
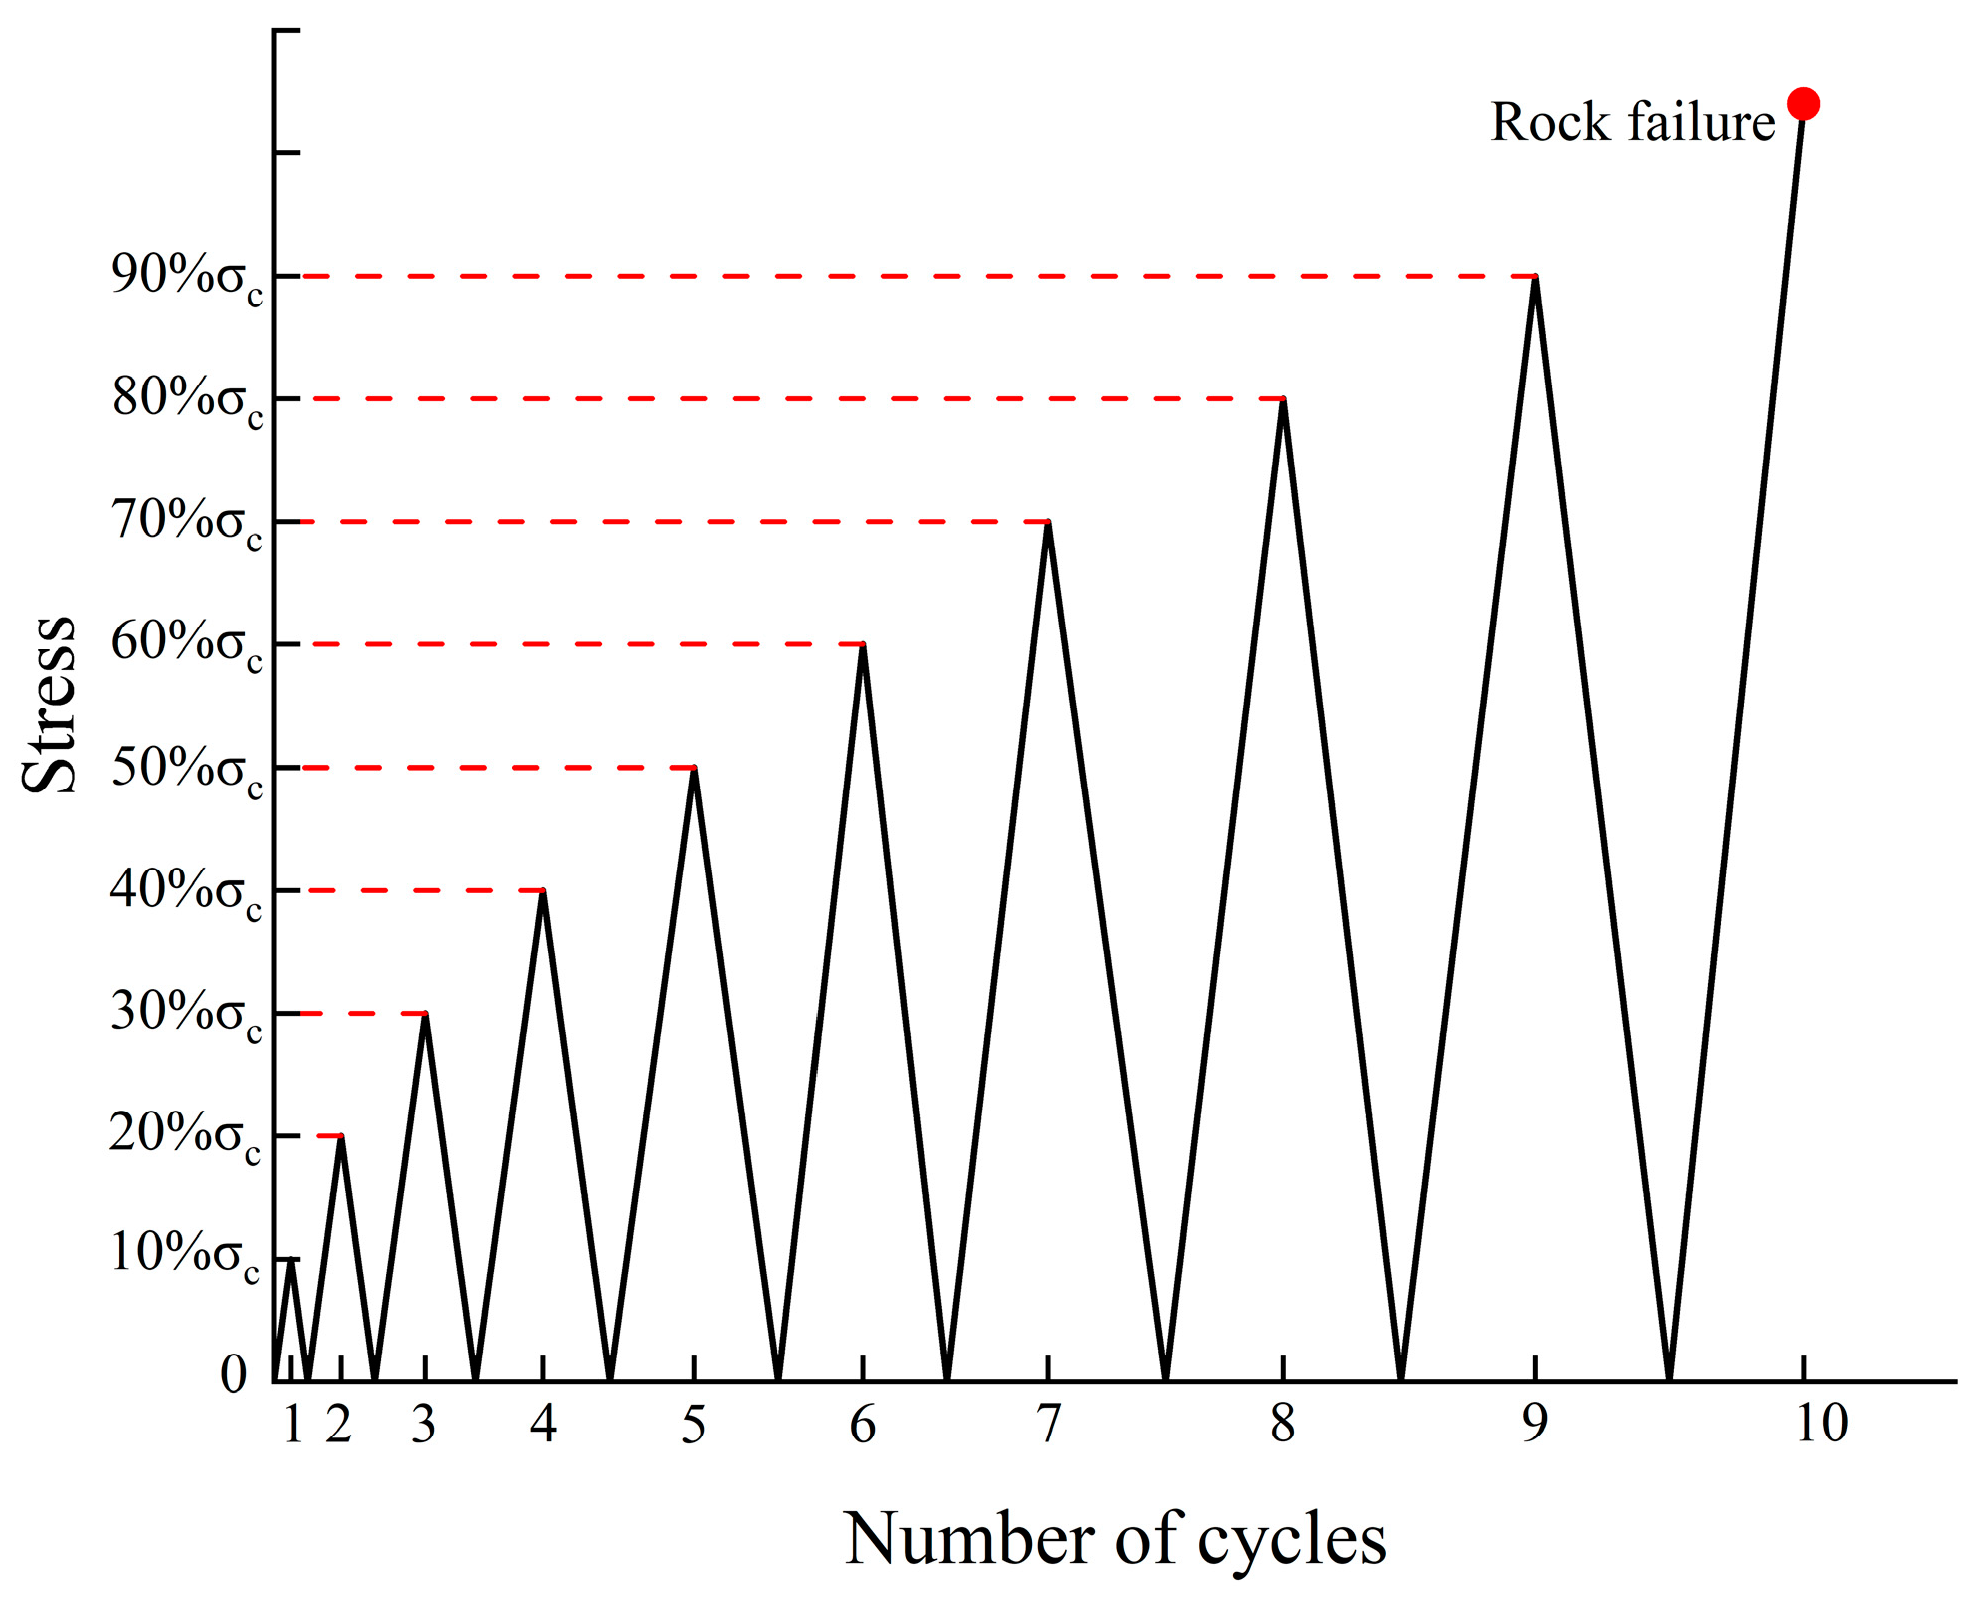
- CLLCL: Apply a 1 kN preload to the rock specimen and then load and unload at a ±0.5 MPa/s loading rate. When the load reaches 10%, 20%, 30%, 40%, 50%, 60%, 70%, 80%, and 90% of uniaxial compressive strength , it should be unloaded to 1 kN each time. After the ninth unloading, it should be directly loaded until the rock specimen failure. The stress path of CLLCL is shown in Figure 3.
- (3)
- VLLCL: Apply a 1 kN preload to the rock specimen and then load and unload at a ±0.5 Mpa/s loading rate. When the load reaches 10%, 20%, 30%, 40%, 50%, 60%, 70%, 80%, and 90% of uniaxial compressive strength , unload it to 1 kN for the first time and then each subsequent unloading should be up to the maximum value of the previous loading. After the ninth unloading, it should be directly loaded until the rock specimen failure. The stress path of VLLCL is shown in Figure 4.
3. Testing Results
3.1. Stress–Strain Characteristics
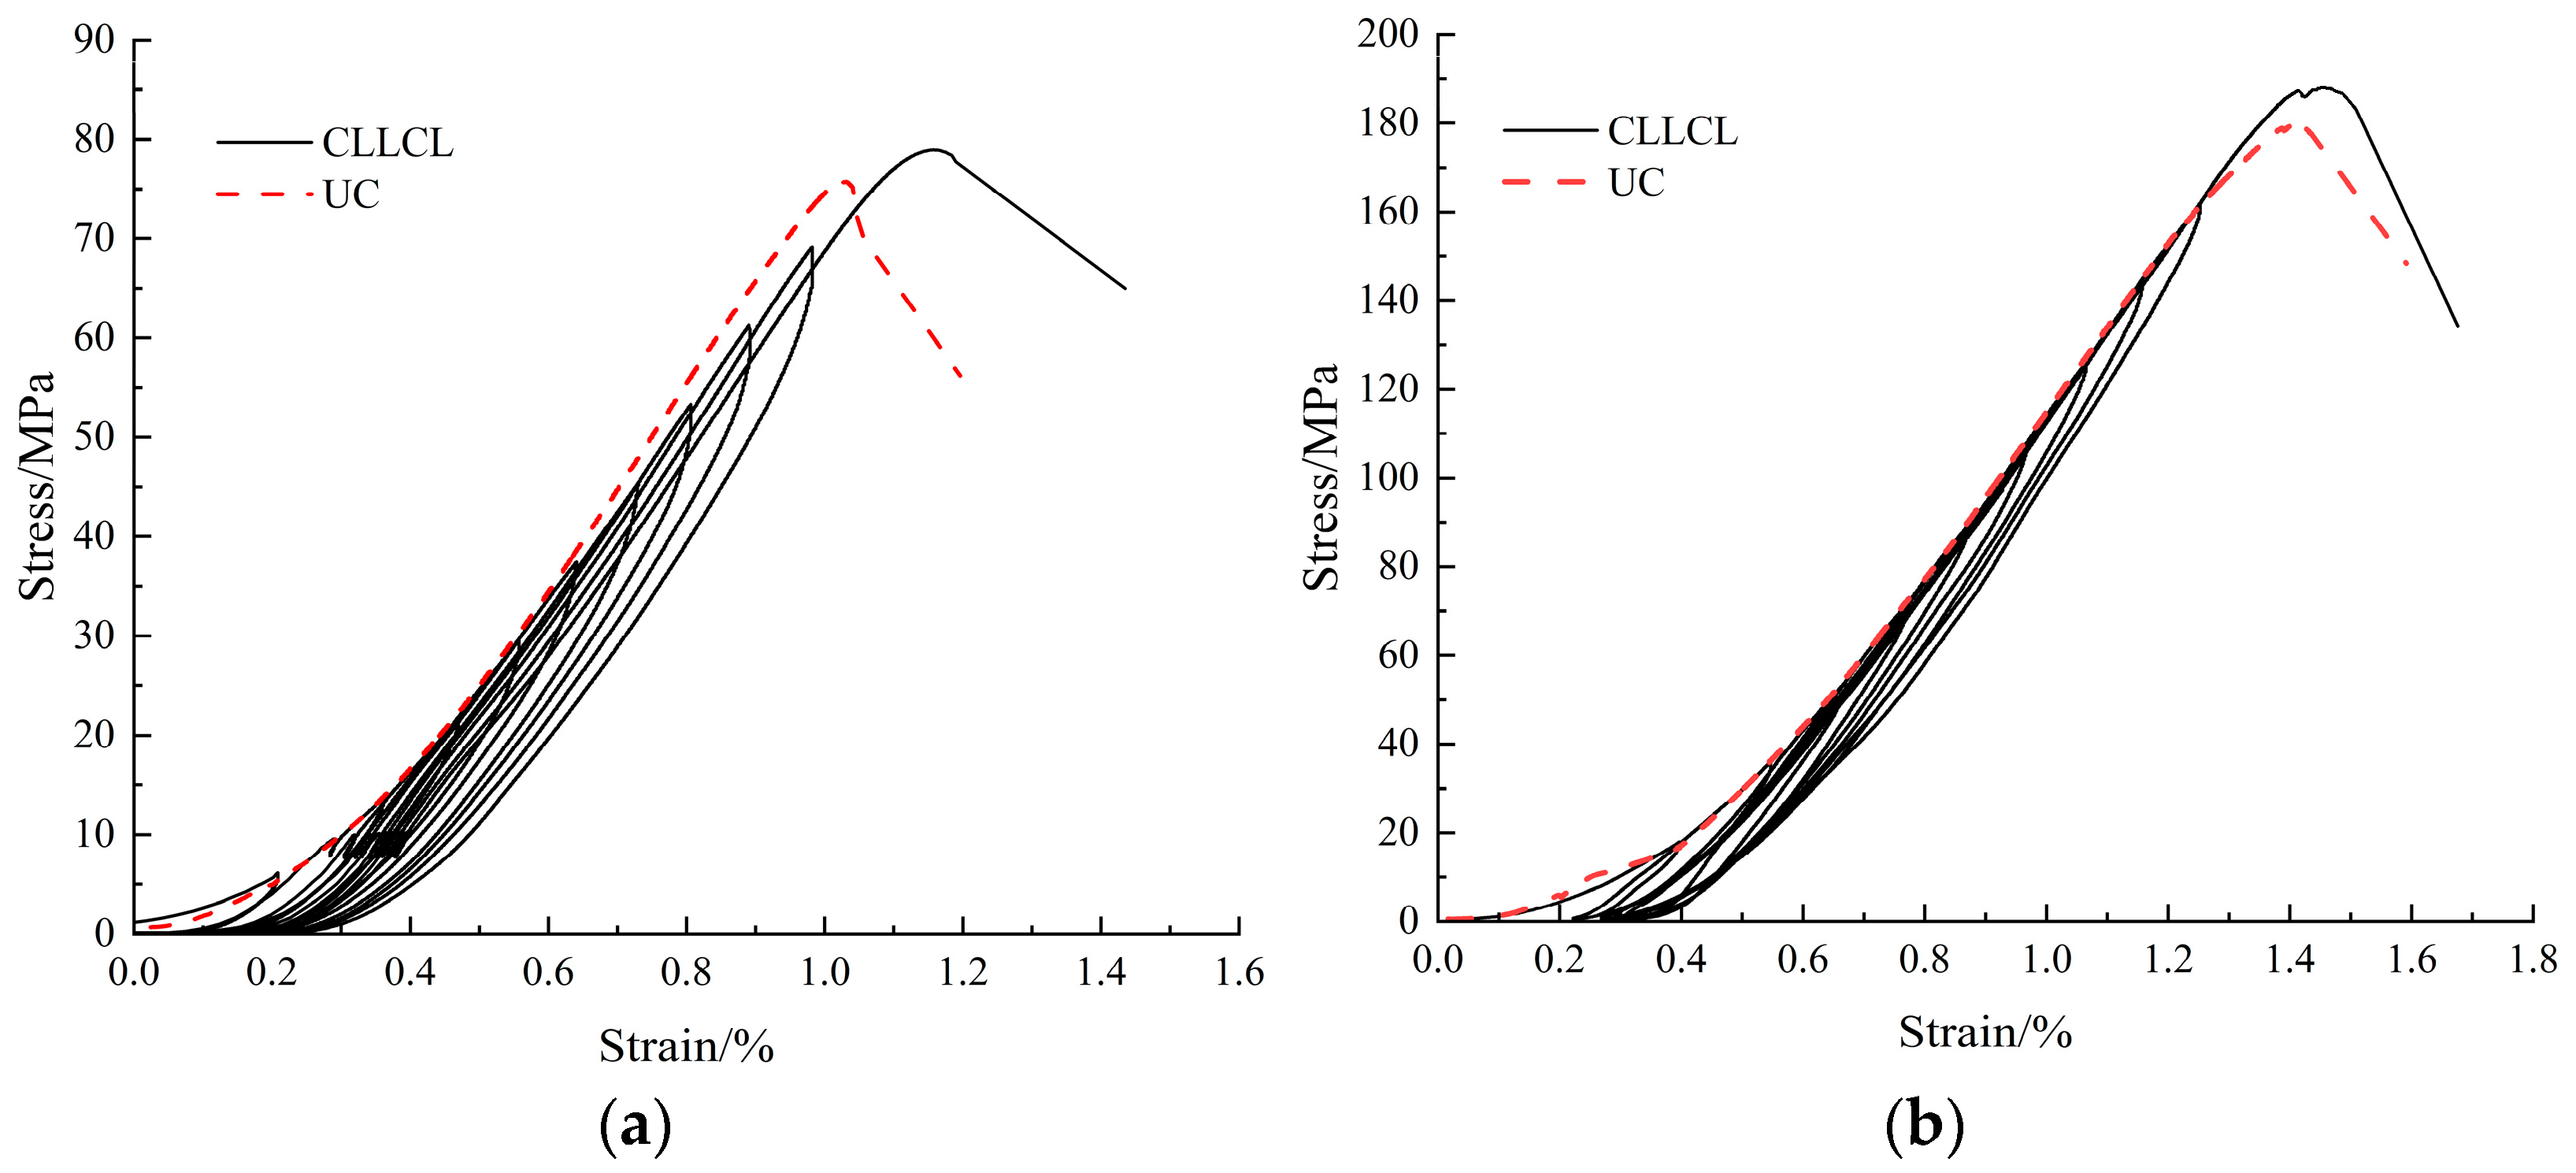
The stress–strain behaviors of rock describe the intrinsic physical and mechanical characteristics. The stress–strain curves for sandstone and granite under CLLCL are shown in Figure 5. The curve of stress–strain varies with the stress level. When the stress level at the point of unloading is low, the unloading curve basically returns to the origin, demonstrating elastic recovery. On the contrary, when the stress level at the unloading point is high, the unloading curve deviates from the original loading curve, resulting in irreversible plastic deformation. The unloading curve no longer returns to the origin but instead forms a hysteresis loop, which smoothly intersects the loading curve. Under UC and CLLCL, the stress–strain curves of the rock specimens exhibit a similar changing trend. They are quite close throughout the phases of compaction and elasticity, and the differences are tiny during the plastic stage. The stress sharply drops after it reaches the peak point, and the rock loses all its bearing capacity. The envelopes of the stress–strain curves under CLLCL and UC are basically coincided, which reflects the “memory effect” of rock materials. The average peak strengths of the rock specimens under two types of cyclic loading and unloading improve by 4.61% compared with , which shows a strength increase.
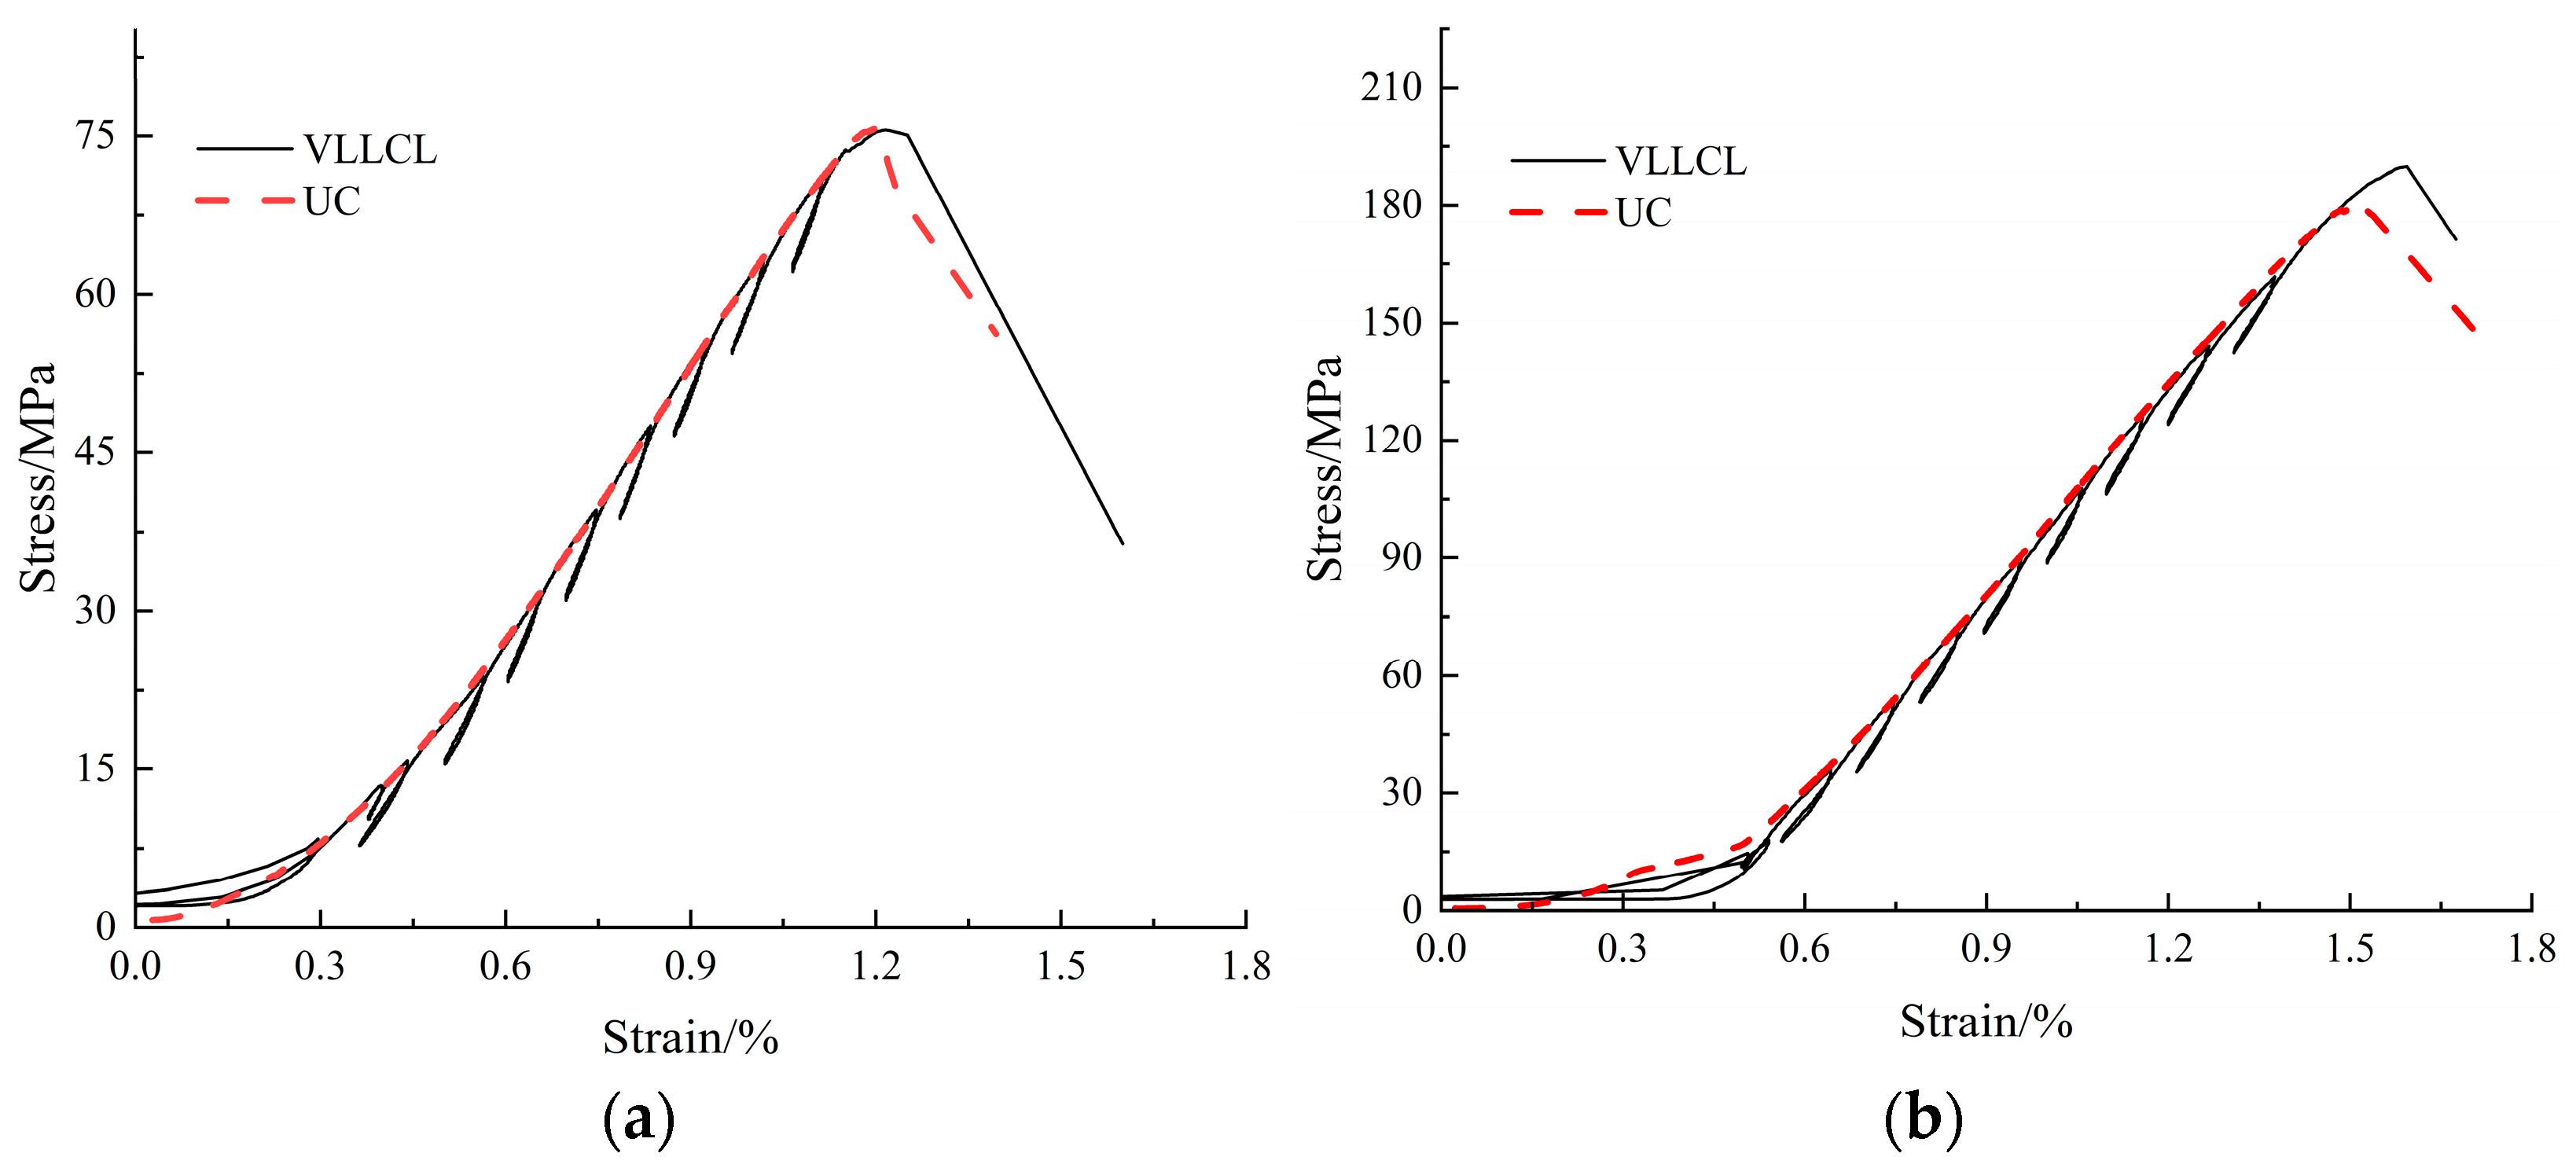
The stress–strain curves for sandstone and granite under VLLCL are shown in Figure 6. The stress–strain relationship varies with the stress level. As the loading and unloading amplitude at each level of the cyclic loading during VLLCL is only 10% of the , the strain created by loading and unloading is small. In the next loading process, the curve smoothly intersects with the previous unloading curve, forming a tiny hysteresis loop. Under UC and VLLCL, the stress–strain curves for the rock specimens exhibit a similar changing trend. Compared with CLLCL, the envelope of the curve under VLLCL is more consistent with the curve under UC, indicating that the “memory effect” of rock under VLLCL is more significant. The peak strengths of sandstone and granite under VLLCL are 3.90% greater than the , indicating that the rock strength under the stress path also increases but is not as significant as when under CLLCL.
3.2. Elastic Modulus Evolution
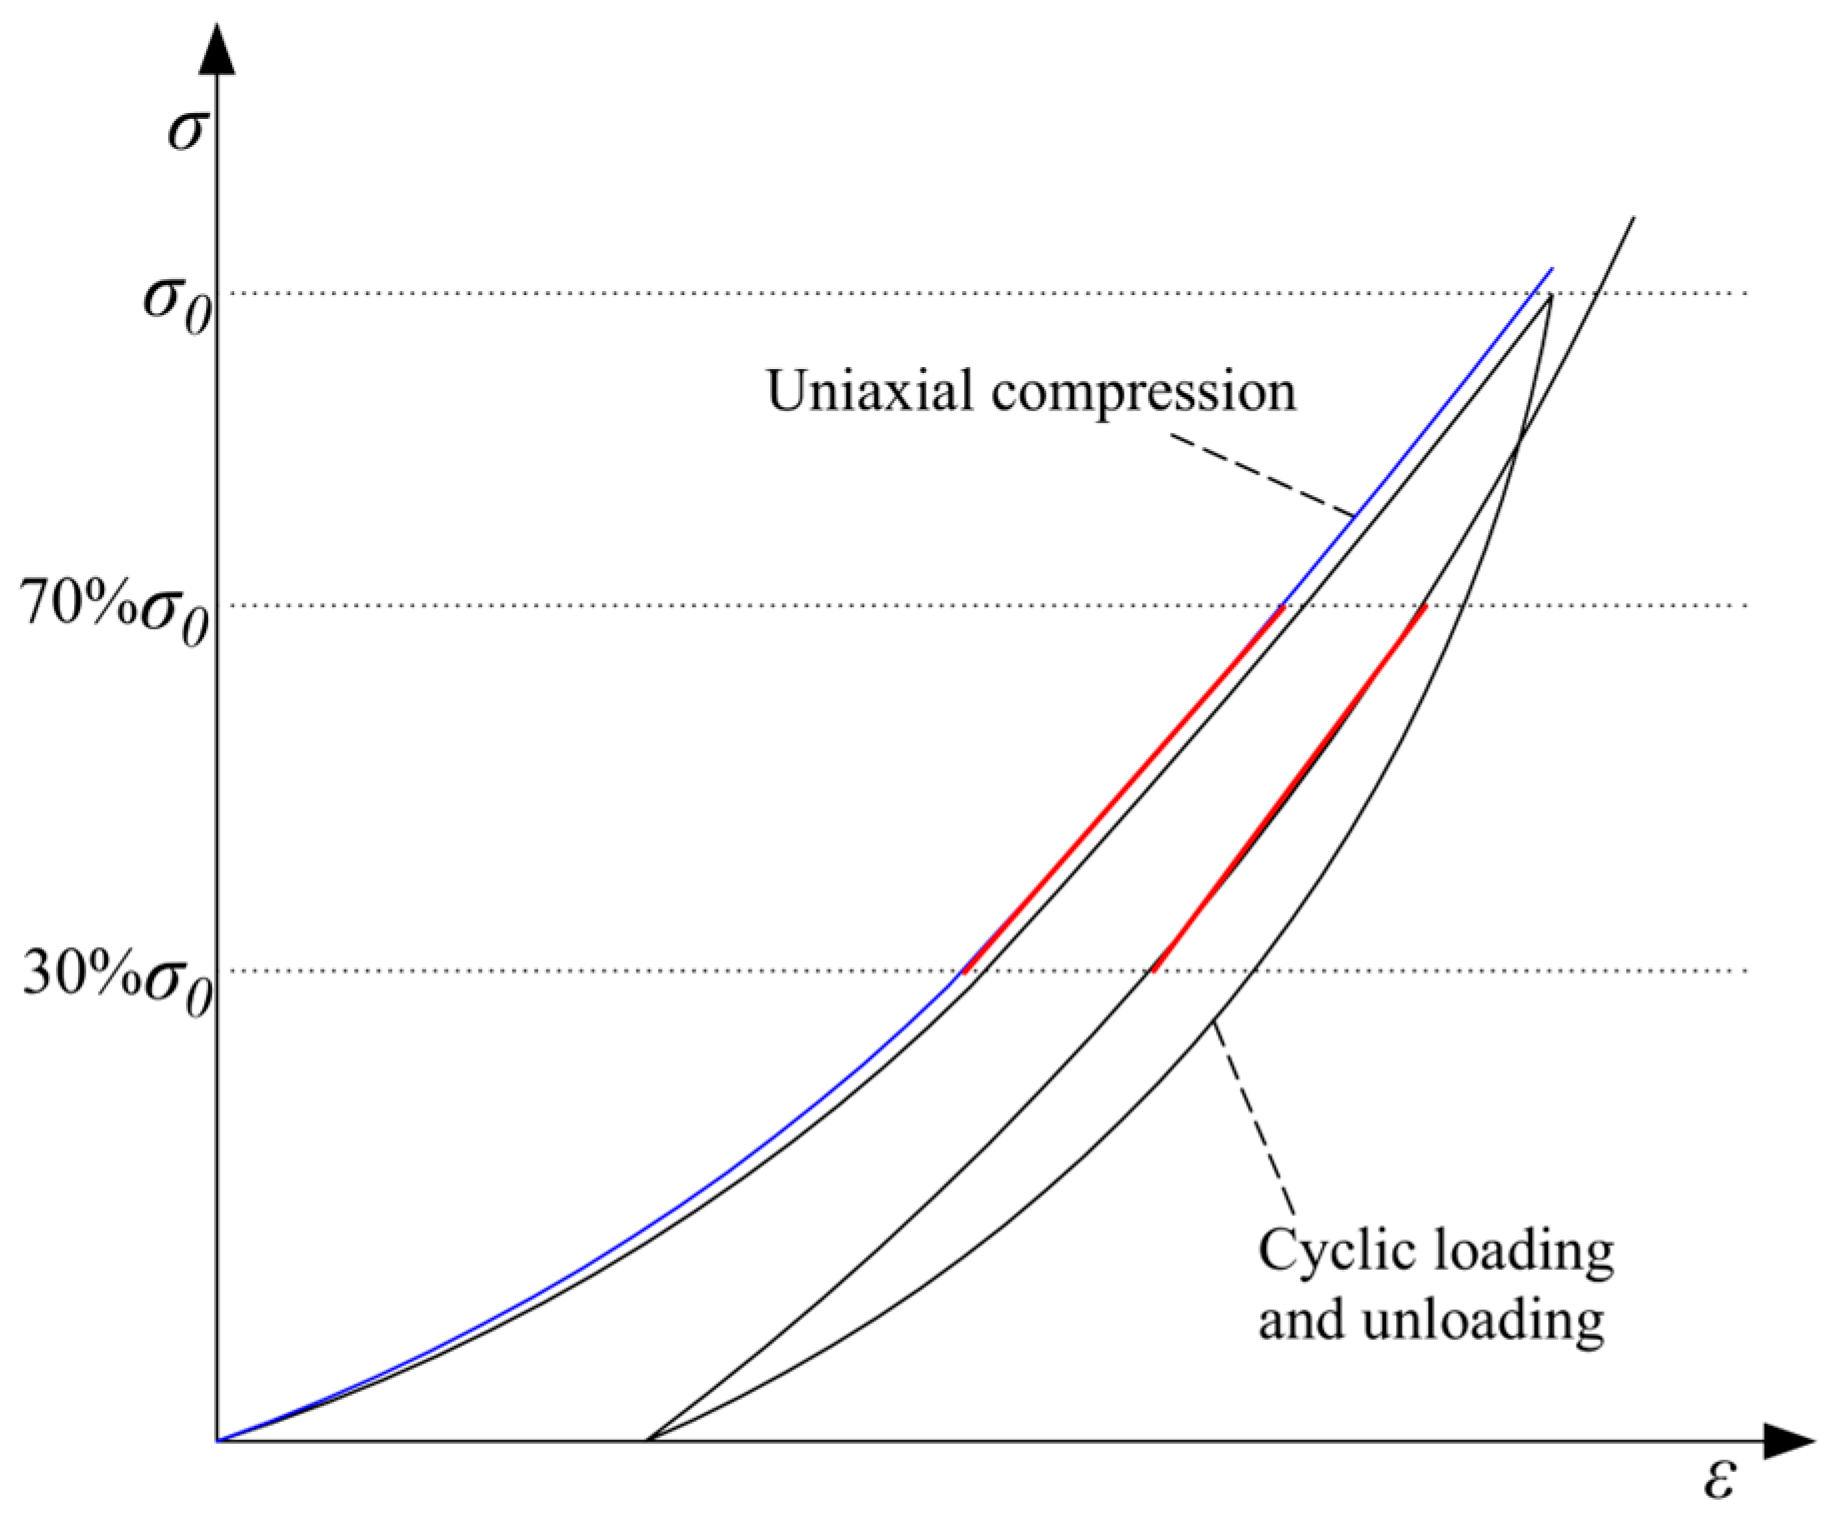
The elastic modulus (Young’s modulus) is an important parameter for rock deformation characterization, reflecting the deformation resistance of loaded rock specimens. In order to compare the deformation resistance of rock under uniaxial compression and cyclic loading and unloading, stress interval data points within the range of 30~70% at each loading and unloading level of the curve were linearly fitted, and, within the corresponding range, the stress interval data points of uniaxial compression were also linearly fitted. This is shown in Figure 7.
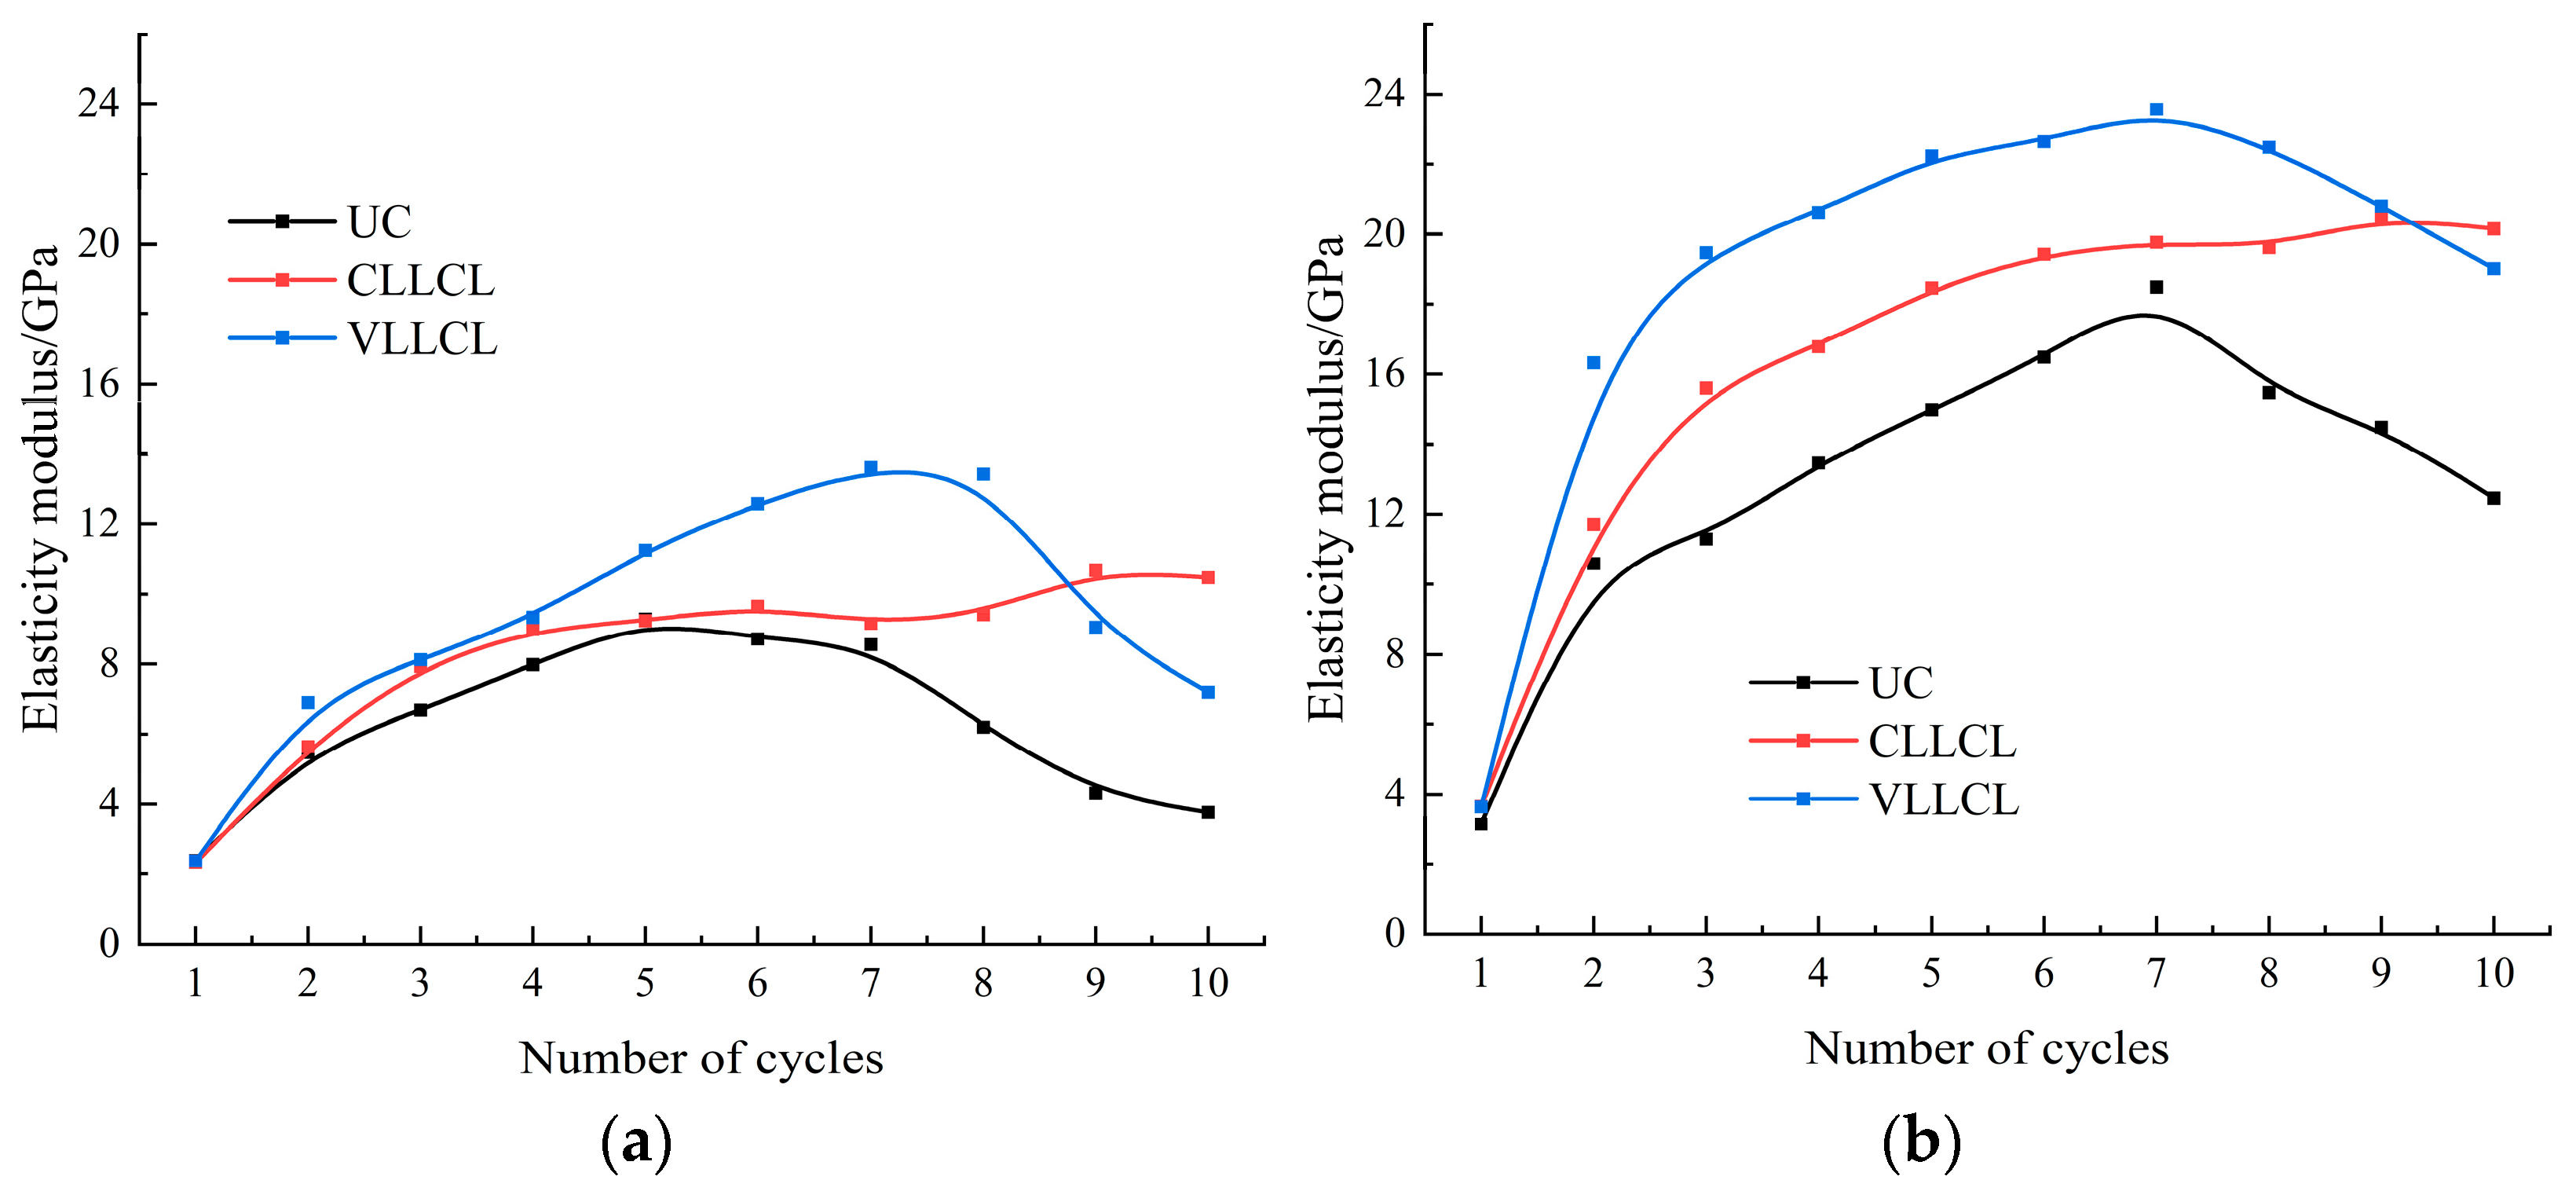
The relationship between the moduli of sandstone and granite and the number of cycles is shown in Figure 8. Under different stress paths, the modulus of sandstone ranges from 2.3 GPa to 13.4 Gpa, and the modulus of granite ranges from 3.1 Gpa to 23.6 Gpa, showing that granite is denser than sandstone and has more deformation resistance. The modulus evolutions of sandstone and granite under different stress paths have similar laws. In the late loading and unloading period, the elastic modulus of the two rocks under CLLCL still tends to increase. In the same period, under UC and VLLCL, the modulus curves of granite have a downward trend, while the curves of sandstone become flat and are close to the lowest value. Such a difference between granite and sandstone is due to the fact that the compactness of granite is better than sandstone. The moduli under cyclic loading and unloading are greater than under UC, indicating that the cyclic loading and unloading stress paths strengthen the rock deformation resistance. As the number of cycles increases from one to seven, the elastic moduli increase continually, yet the elastic moduli under VLLCL are always more than the elastic moduli under CLLCL and UC. After the seventh cycle, the elastic moduli under UC and VLLCL decrease exponentially, suggesting that the rocks reach the plastic stage and abundant micro-cracks start to develop, expand, and connect. However, the elastic moduli under CLLCL do not decrease at this stage; rather, they tend to gradually increase and exceed under VLLCL in the tenth cycle when rock failure is about to be observed. This demonstrates that the stress path not only increases the elastic moduli but also prolongs the elastic deformation stage, thus improving the mechanical properties.
The above research reveals that, compared with UC, the strength and modulus of rock under cyclic loading and unloading are increased. It can be inferred that the cyclic loading and unloading stress path improves the mechanical properties of sandstone and granite. This is known as the “hardening effect” of rock under cyclic loading and unloading. Thanks to the “hardening effect”, newly generated cracks are filled with rock debris, increasing the friction force among fissure planes and improving the strength and elastic properties of the rock [40].
3.3. AE Characteristics
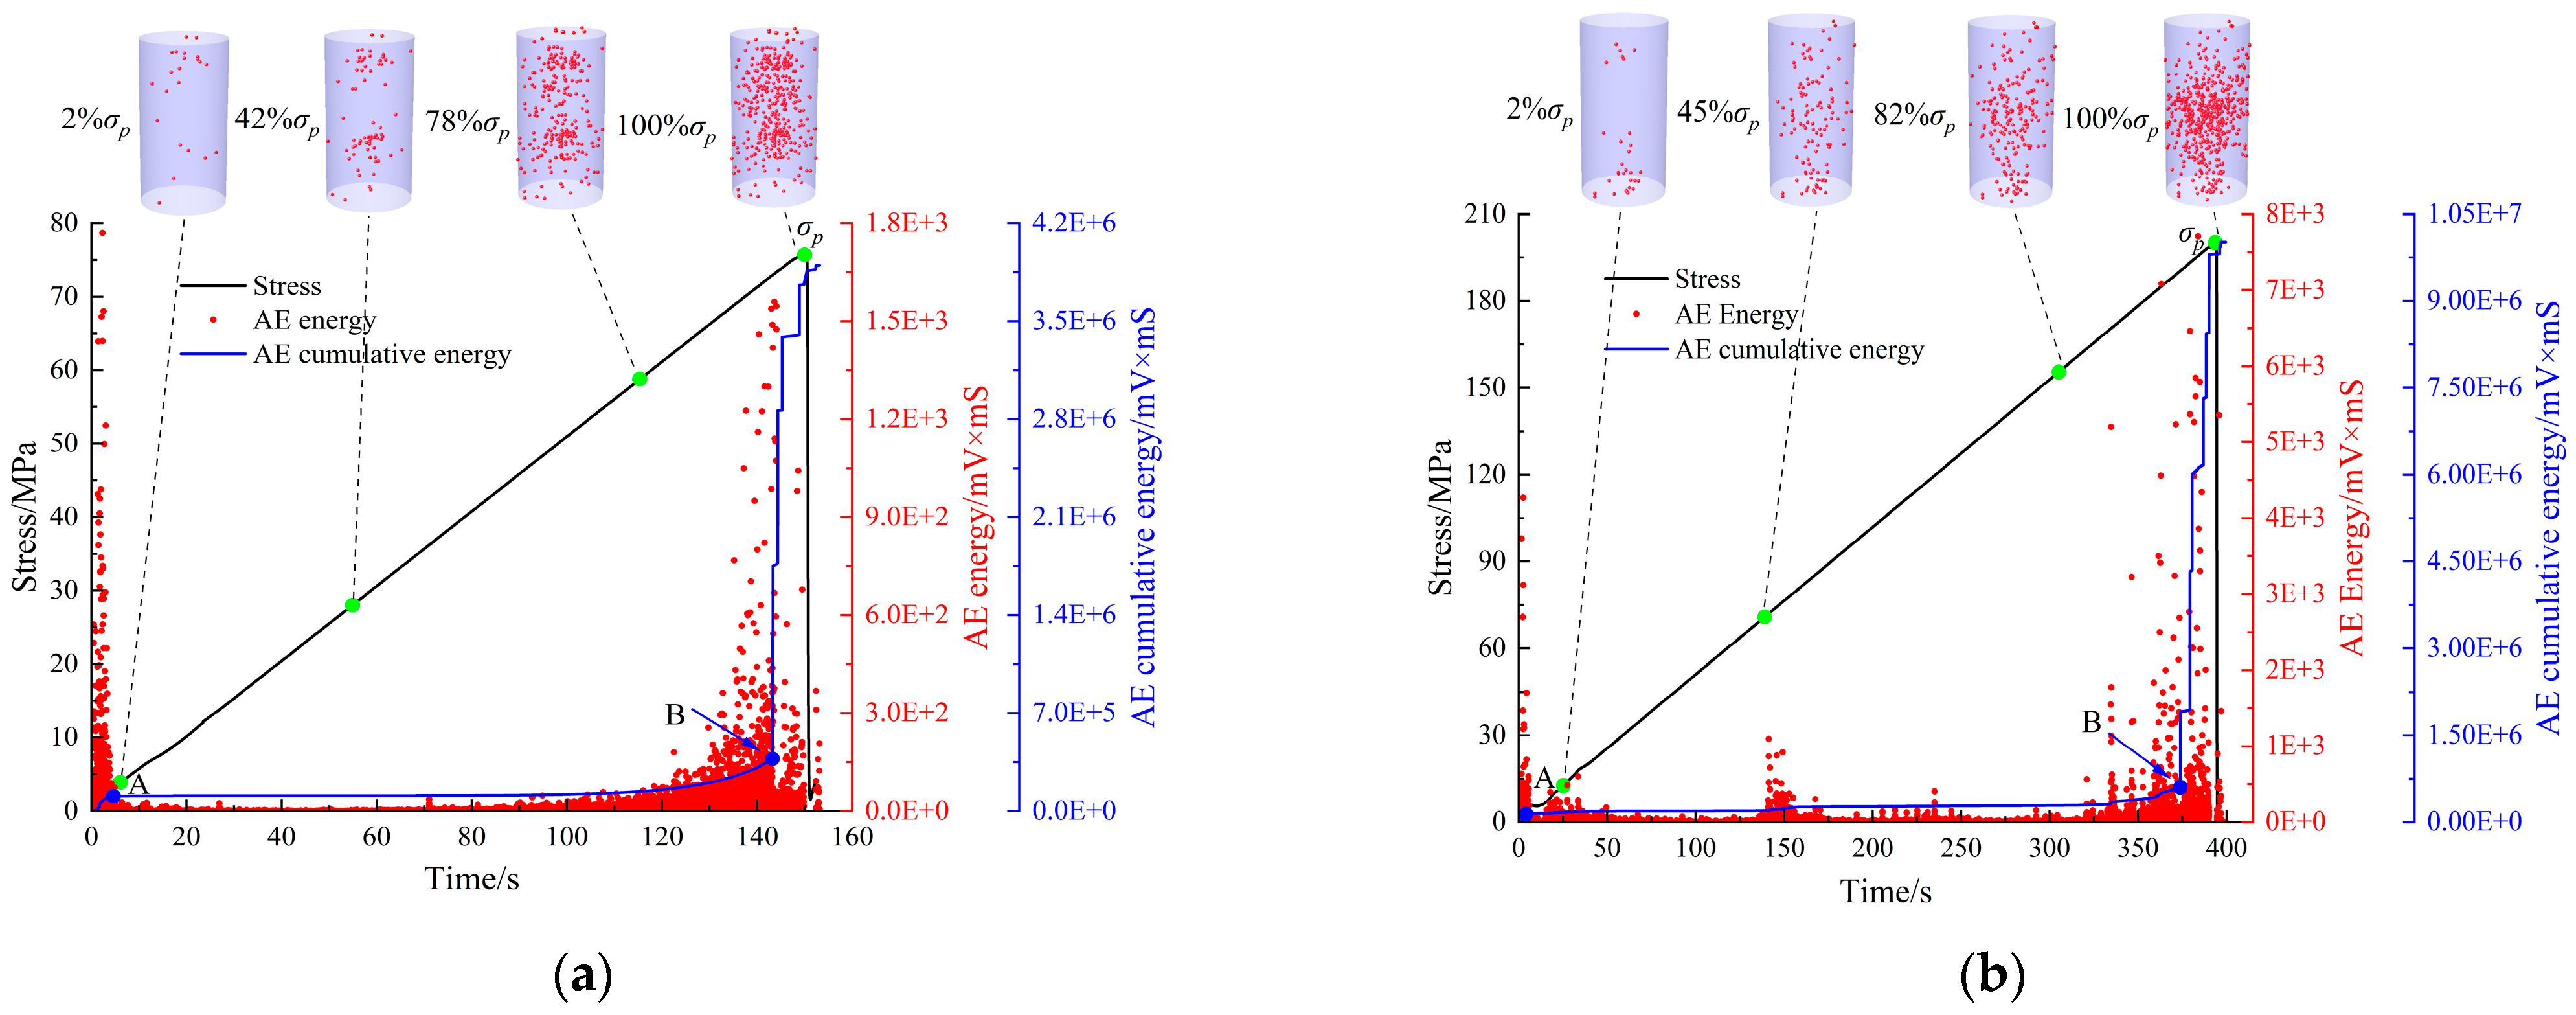
AE during rock loading is irreversible. AE sources not only indirectly reflect the deformation and failure process of rock but also point out the spatial locations of micro-crack initiation, propagation, and penetration [41,42]. The AE energy evolutions and locations of sandstone and granite under UC are shown in Figure 9. The characteristics of the AE energy evolution are used to classify the AE energy evolution process into three periods: the small increase period (before point A), the relatively quiet period (AB), and the active period (after point B). During the small increase period, the micro-cracks, joints, and pores of the rock are closed, the AE energy increases slightly, and AE sources are distributed randomly in the specimen. In the early relatively quiet period, the pressure on the rock specimens is insufficient to cause the formation of new cracks, resulting in little AE energy activeness. Essentially, the cumulative AE energy curves are horizontal. The number of AE location points increase slightly at about 40% (peak stress), indicating crack initiation. In the late relatively quiet period, AE location points gradually gather together and connect at about 80% , cracks begin to propagate, and small damages accumulate. In the active period, the number of AE location points increase dramatically, indicating continuous crack expansion and penetration accompanied by the generation of a large number of new cracks, and the AE source is extremely active. The cumulative AE energy curves show a sudden increase change approximate to a vertical line.
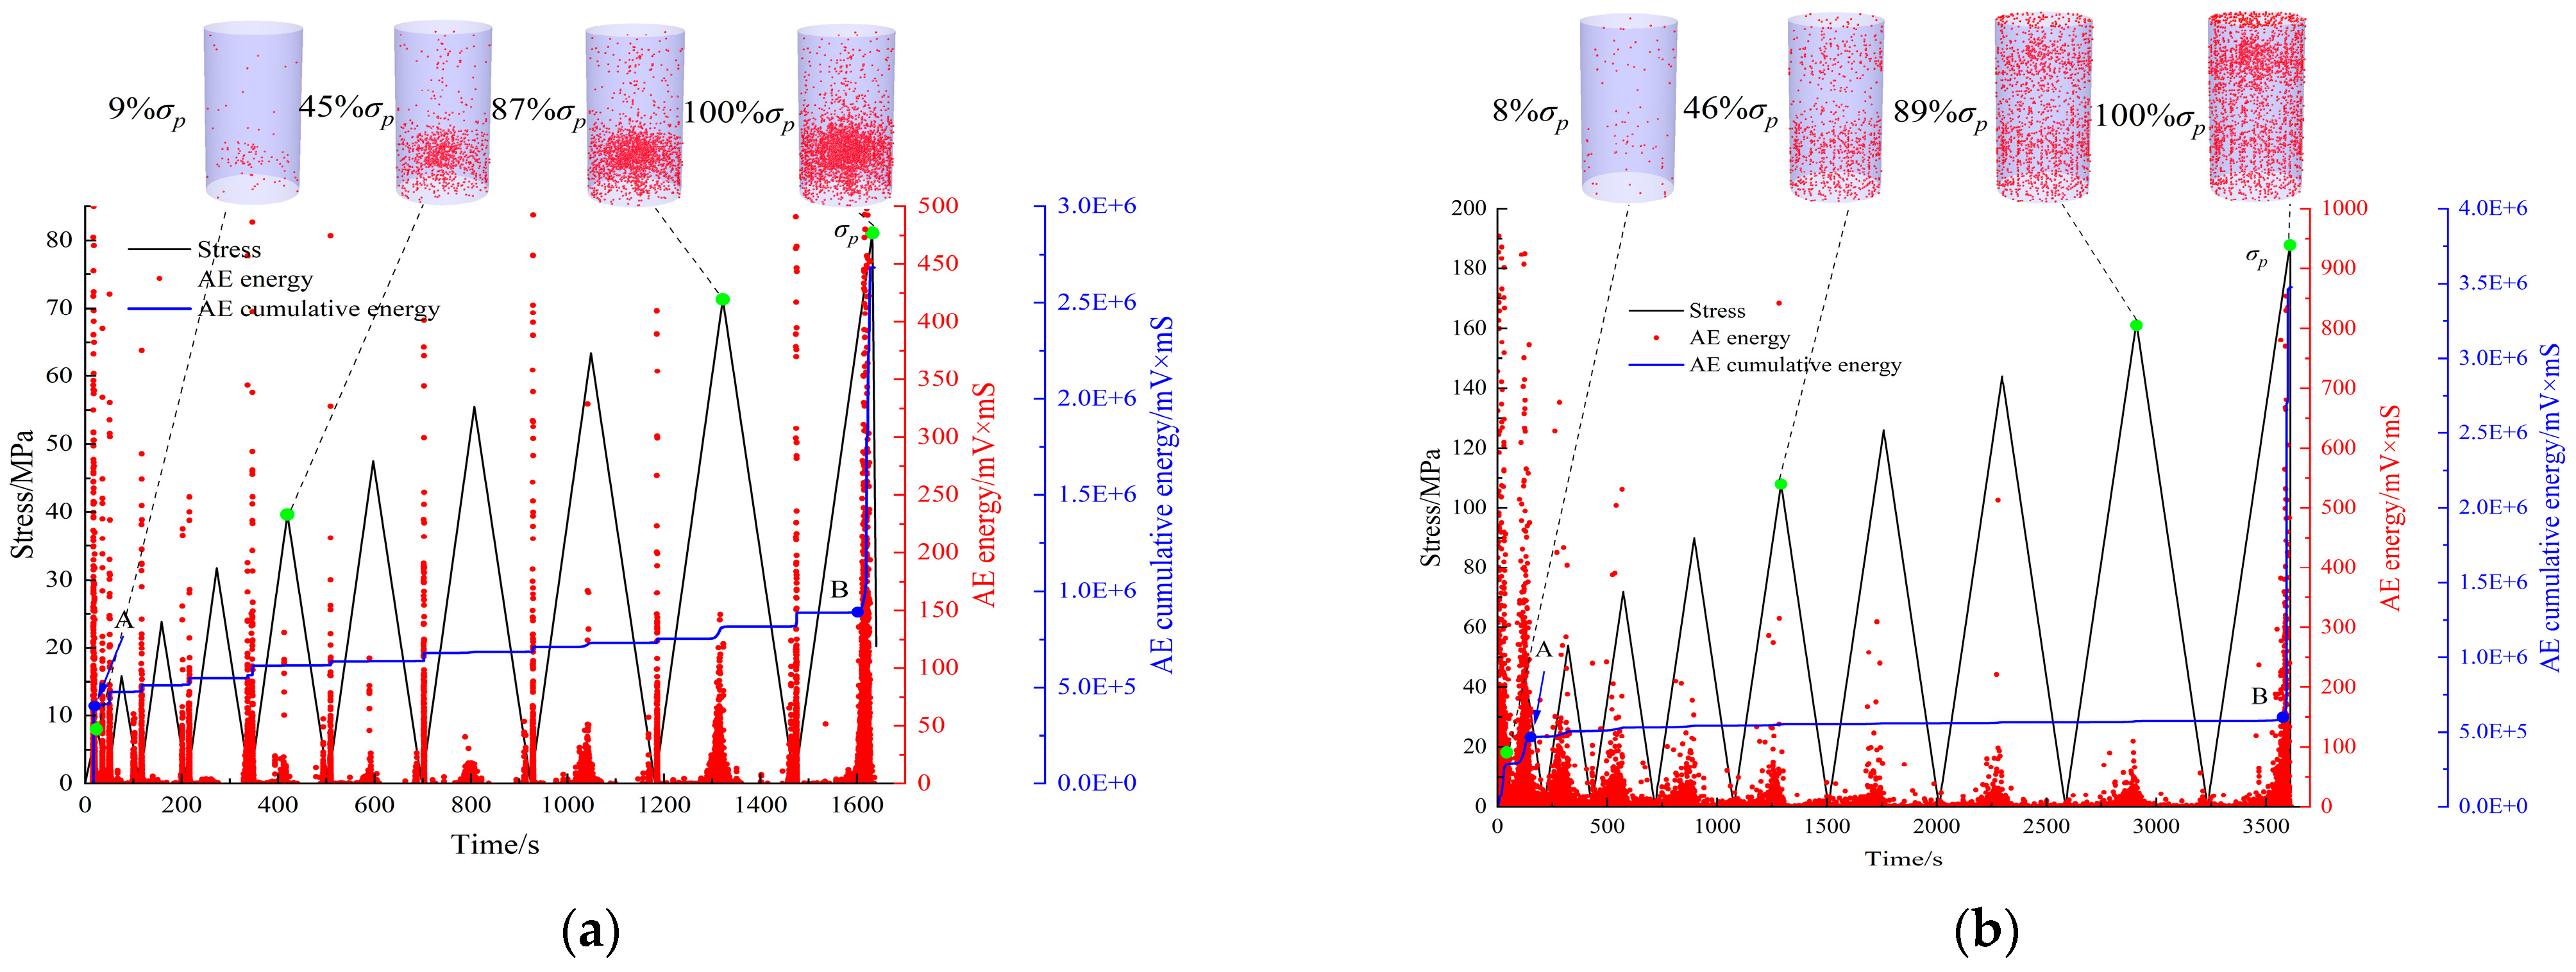
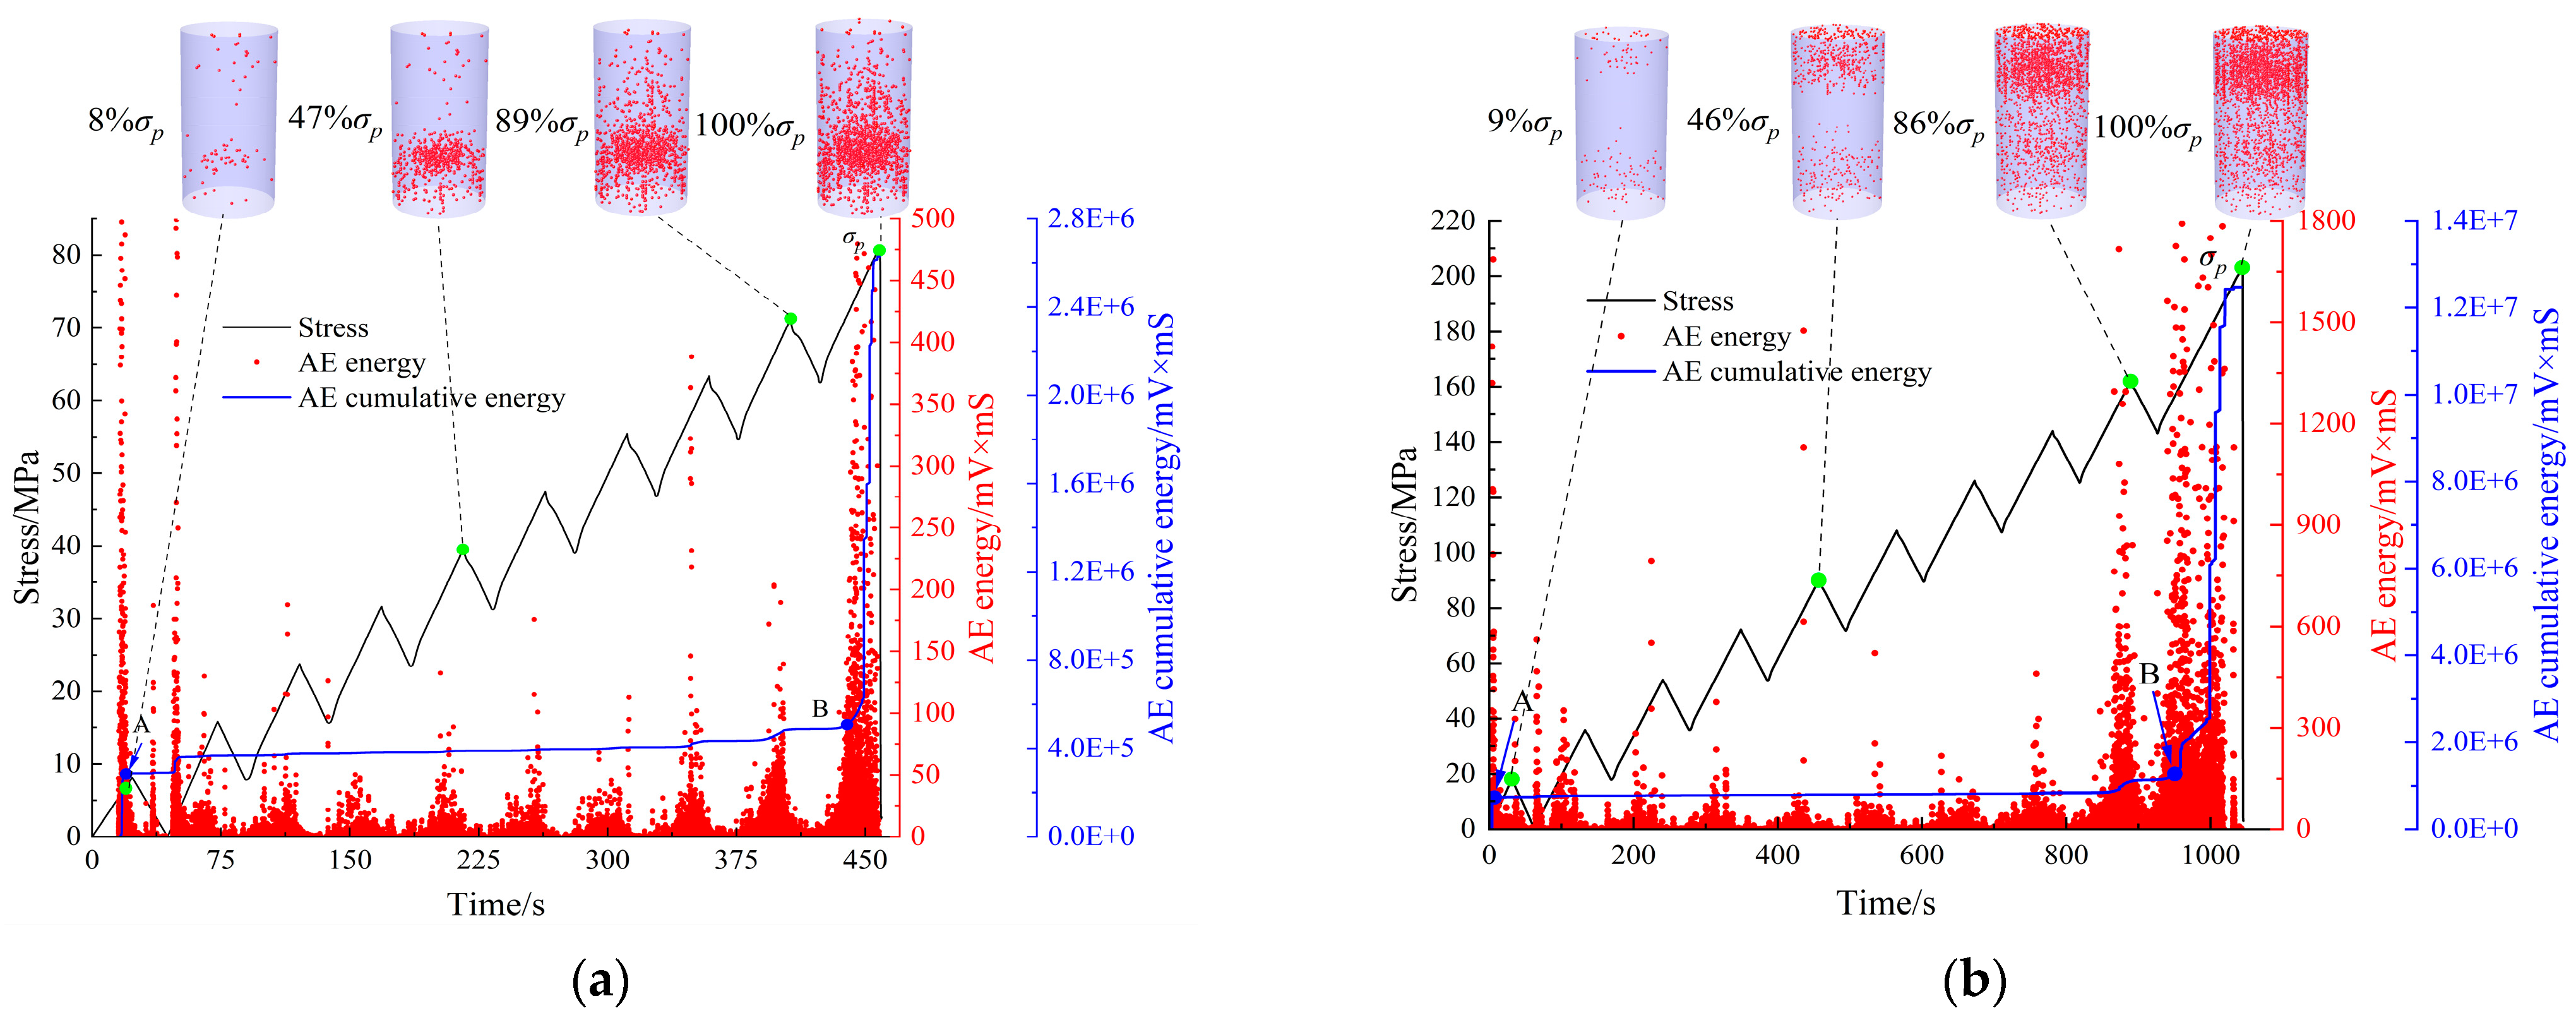
The AE energy evolutions and locations of sandstone and granite under CLLCL and VLLCL are shown in Figure 10 and Figure 11. The characteristics of the AE energy evolution also are used to classify the AE energy evolution process into three periods: the small increase period (before point A), the relatively quiet period (AB), and the active period (after point B). During the small increase period, AE sources are distributed randomly in the specimens, the micro-cracks, joints, and pores of the rock are closed, and the AE energy increases slightly. In contrast to that during UC, the AE energy under cyclic loading and unloading exhibits a progressive increase in the relatively quiet period as the number of cycles increases. In this period, because the grains of sandstone are loose, the sandstone debris generated in the last loading are loose and rub one another as soon as the next loading begins, so a small amount of high-energy AE energy under CLLCL is generated before loading turns to unloading and vice versa [43]. The sandstone under VLLCL does not generate high-energy AE energy. This is because the unloading amplitude of VLLCL is less than that of CLLCL, and the debris generated by the sandstone is not enough to be loose and rub one another, so no high-energy AE energy is generated. In the fourth cycle, the number of AE location points increases slightly, indicating crack initiation. During the ninth cycle, the AE location points start to gather and begin to be closely connected as new micro-cracks are created and the already existing ones are extended.
In the active period, the number of AE location points increase dramatically, the cracks expand and penetrate, accompanied by the generation of a large number of new cracks, and the AE source is extremely active. The cumulative AE energy curves show a sudden increase that approximates a vertical line.
The proportions of AE energy in the three AE periods under different stress paths are shown in Table 1. Under different stress paths, most of the AE energy is distributed in the active periods, the proportions of which are 91.3%, 60.4%, and 81.8%, respectively, and only a small part is distributed in the first two periods. This demonstrates that the failures of sandstone and granite show the burstiness. However, compared with UC, the cyclic loading unloading stress path inhibits the burstiness, and CLLCL has the strongest inhibition effect.
4. Energy Evolution
4.1. Traditional Energy Transformation Theory
Rock failure is an instability phenomenon driven by energy. Low energy (sound energy, heat energy, radiant energy, etc.) in energy conversion can be ignored. According to the first law of thermodynamics, input energy is transformed into elastic energy and dissipated energy during cyclic loading and unloading. The formula for calculating energy , , and is as follows [44]:
where and are the loading stress function and unloading stress function in the ith cycle, respectively.
4.2. Energy Transformation Theory of Rock Viscoelasticity Is Considered
Rock is a material that is heterogeneous, discontinuous, and anisotropic. The friction between rock particles and the liquid’s viscosity produces a nonlinear hysteresis effect in rock throughout the pressing process [26]. Consequently, it is required to consider the viscoelasticity of rock and to subdivide the dissipated energy into the damping energy needed to overcome the viscosity of rock and the damage energy used to initiate and propagate micro-cracks and plastic deformation in rock.
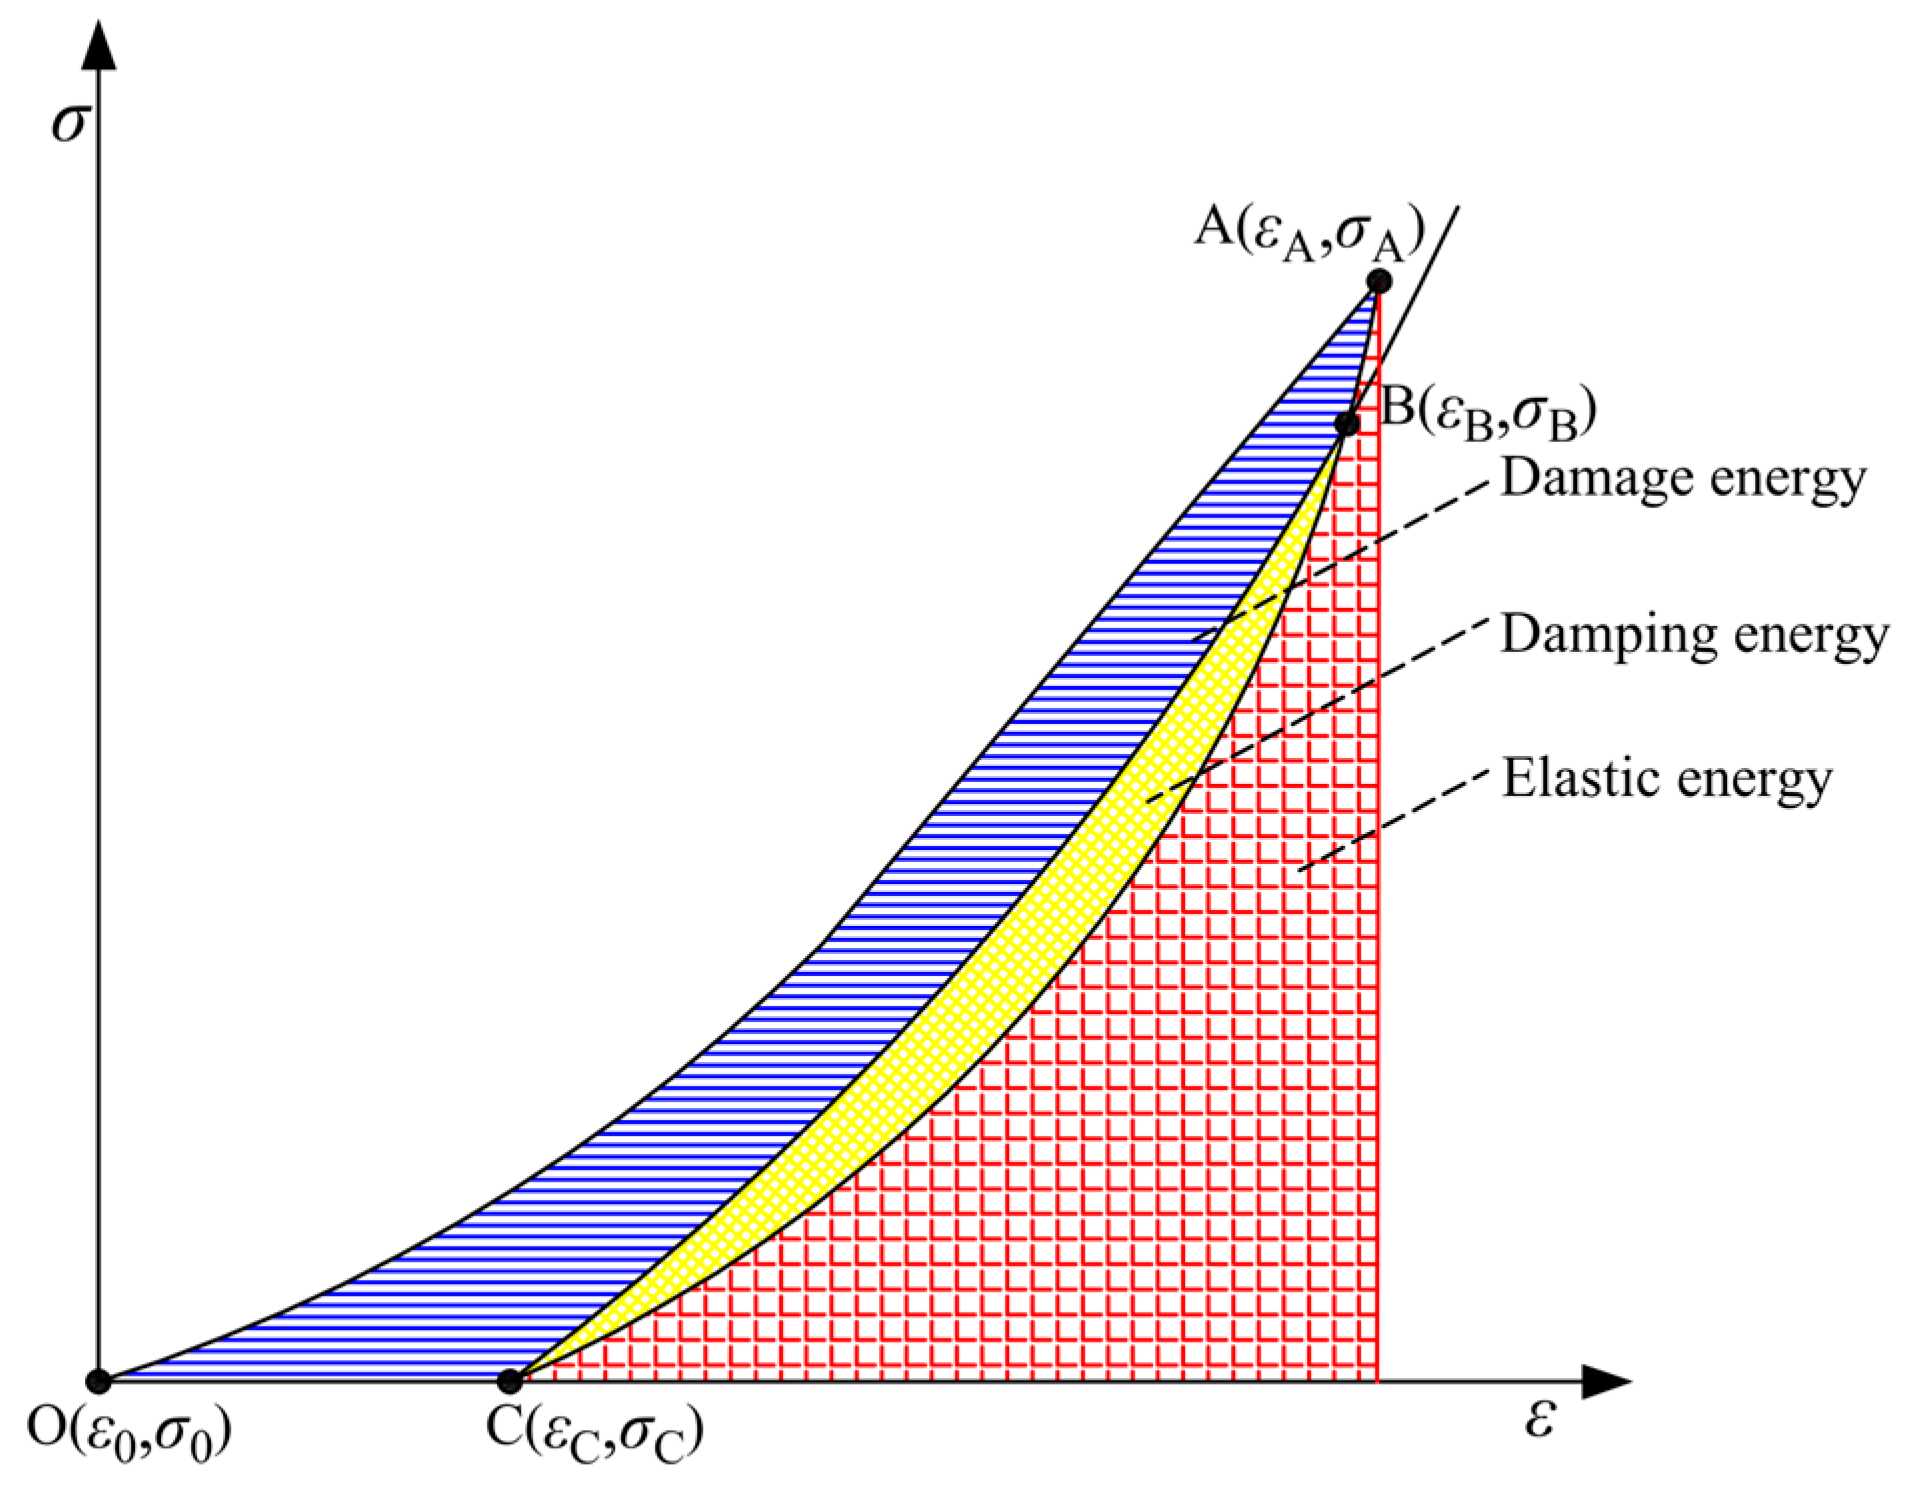
The energy calculation diagram is shown in Figure 12. At point B, the last unloading curve intersects the next loading curve, generating a closed hysteresis loop BCB. The viscosity and elasticity of the rock influence the geometry of the hysteresis loop. The resulting deformation is a viscoelastic deformation without plastic deformation. The elastic energy is not lost, and the energy loss in this period is caused by the damping force [26,45]. Therefore, the area of the hysteresis loop BCB indicates the damping energy dissipated to overcome the rock viscosity (including liquid viscosity and interface friction). The damage energy causes rock damage, and it can be calculated by subtracting the damping energy from the dissipation energy, and its formula is [26,46]
4.3. Analysis of Energy Evolution under Cyclic Loading and Unloading
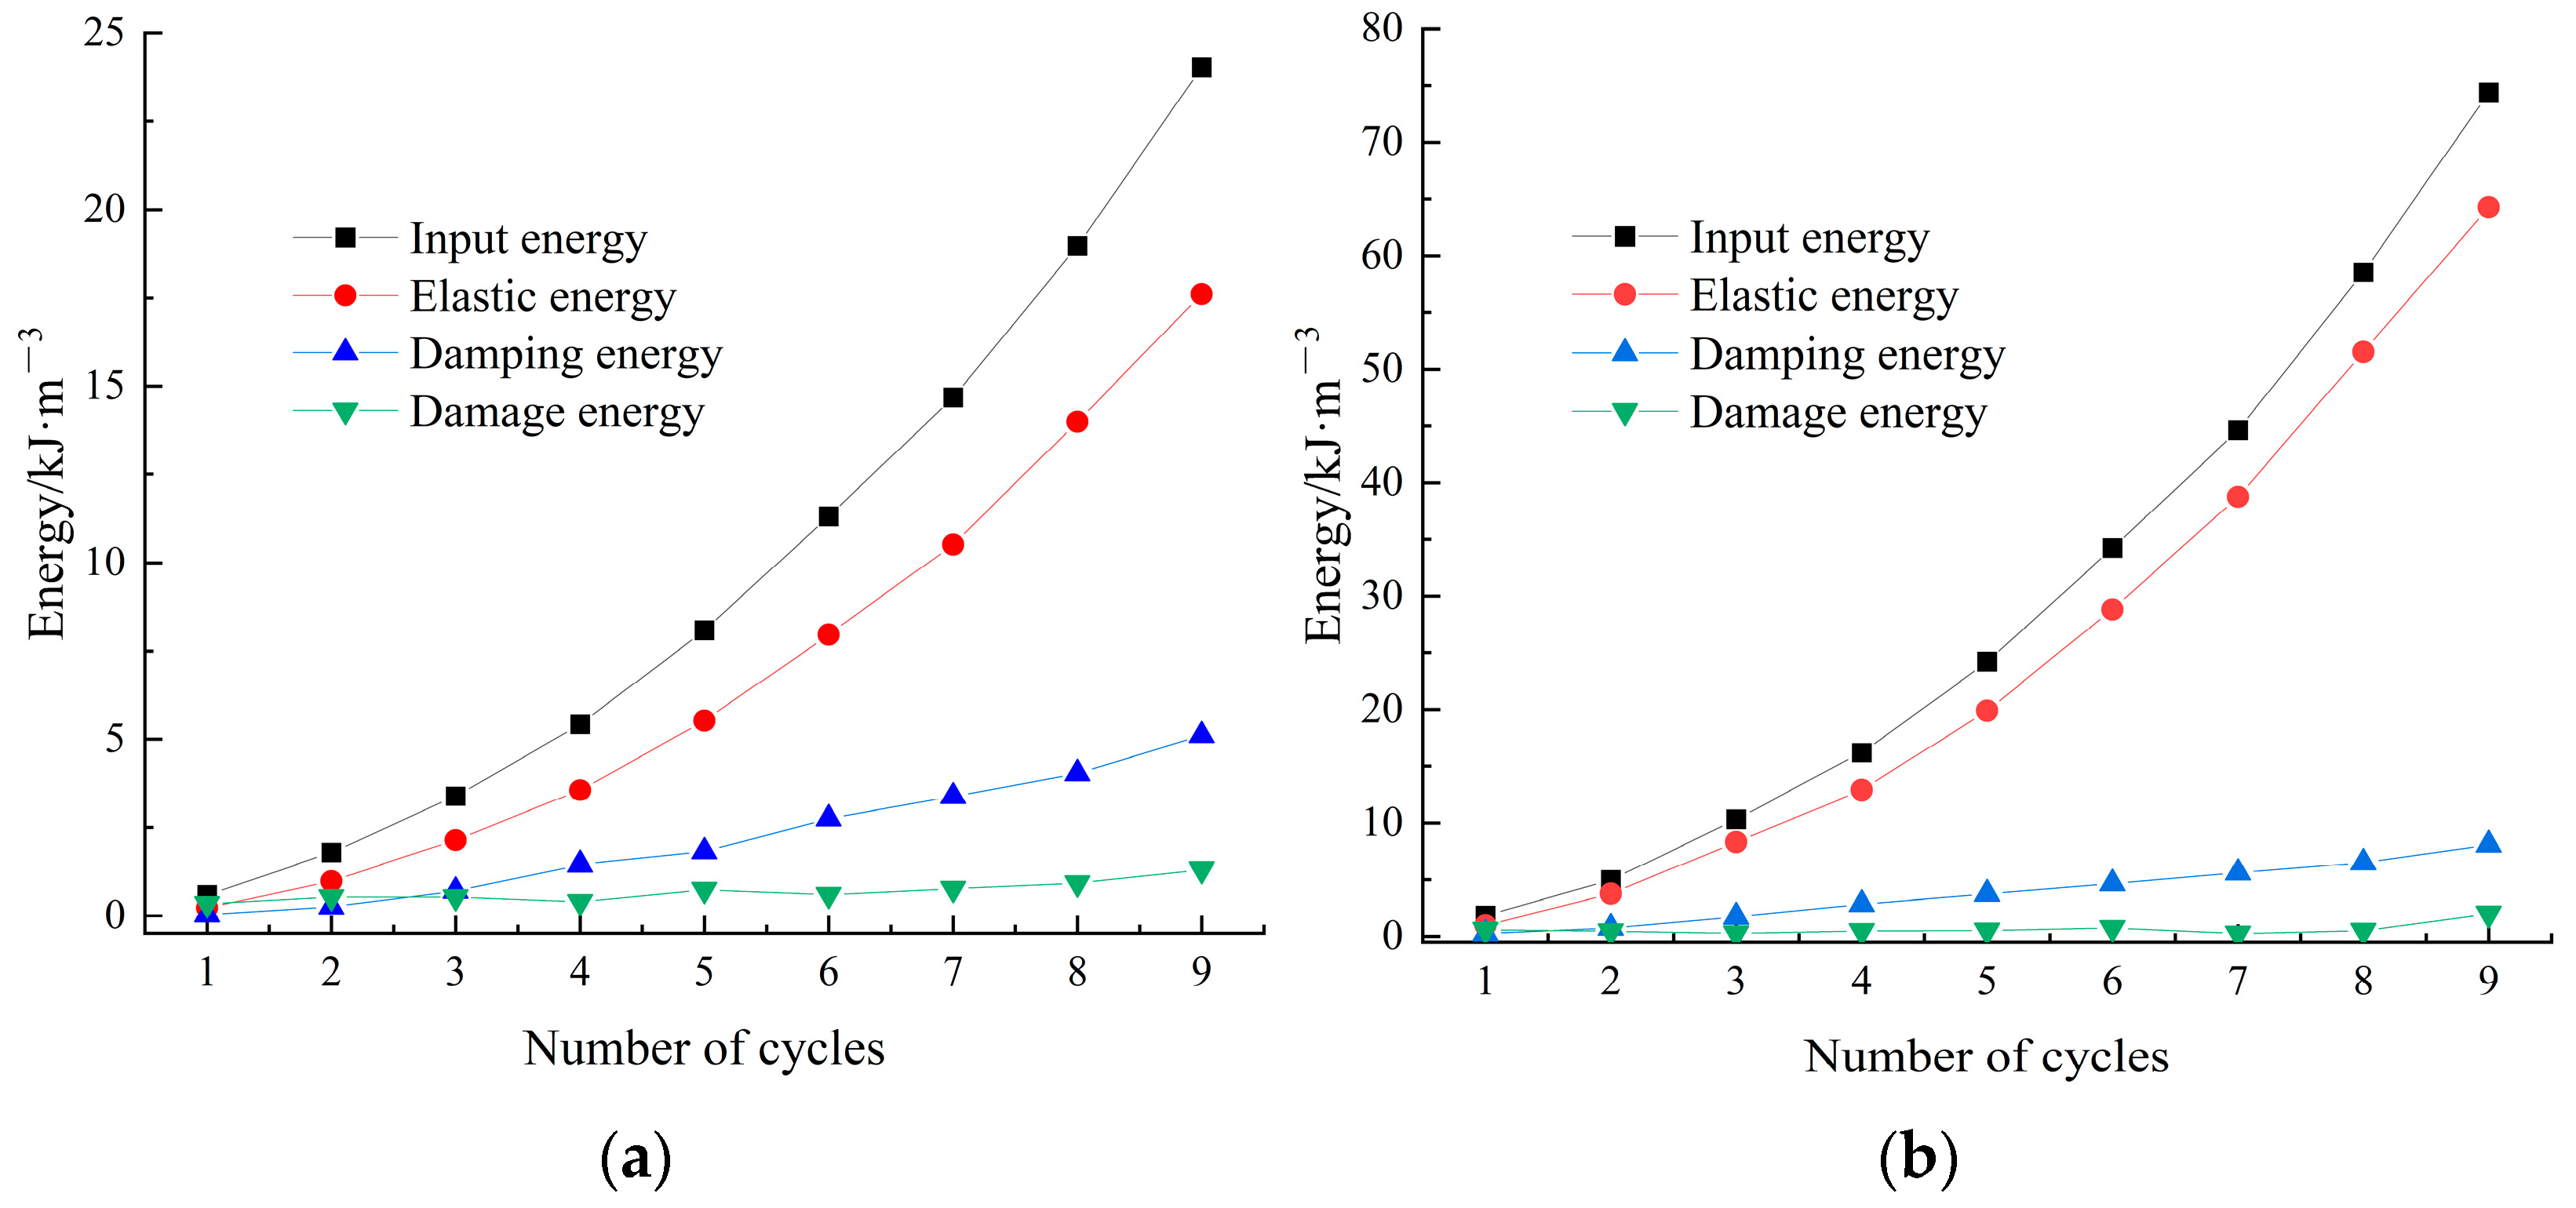
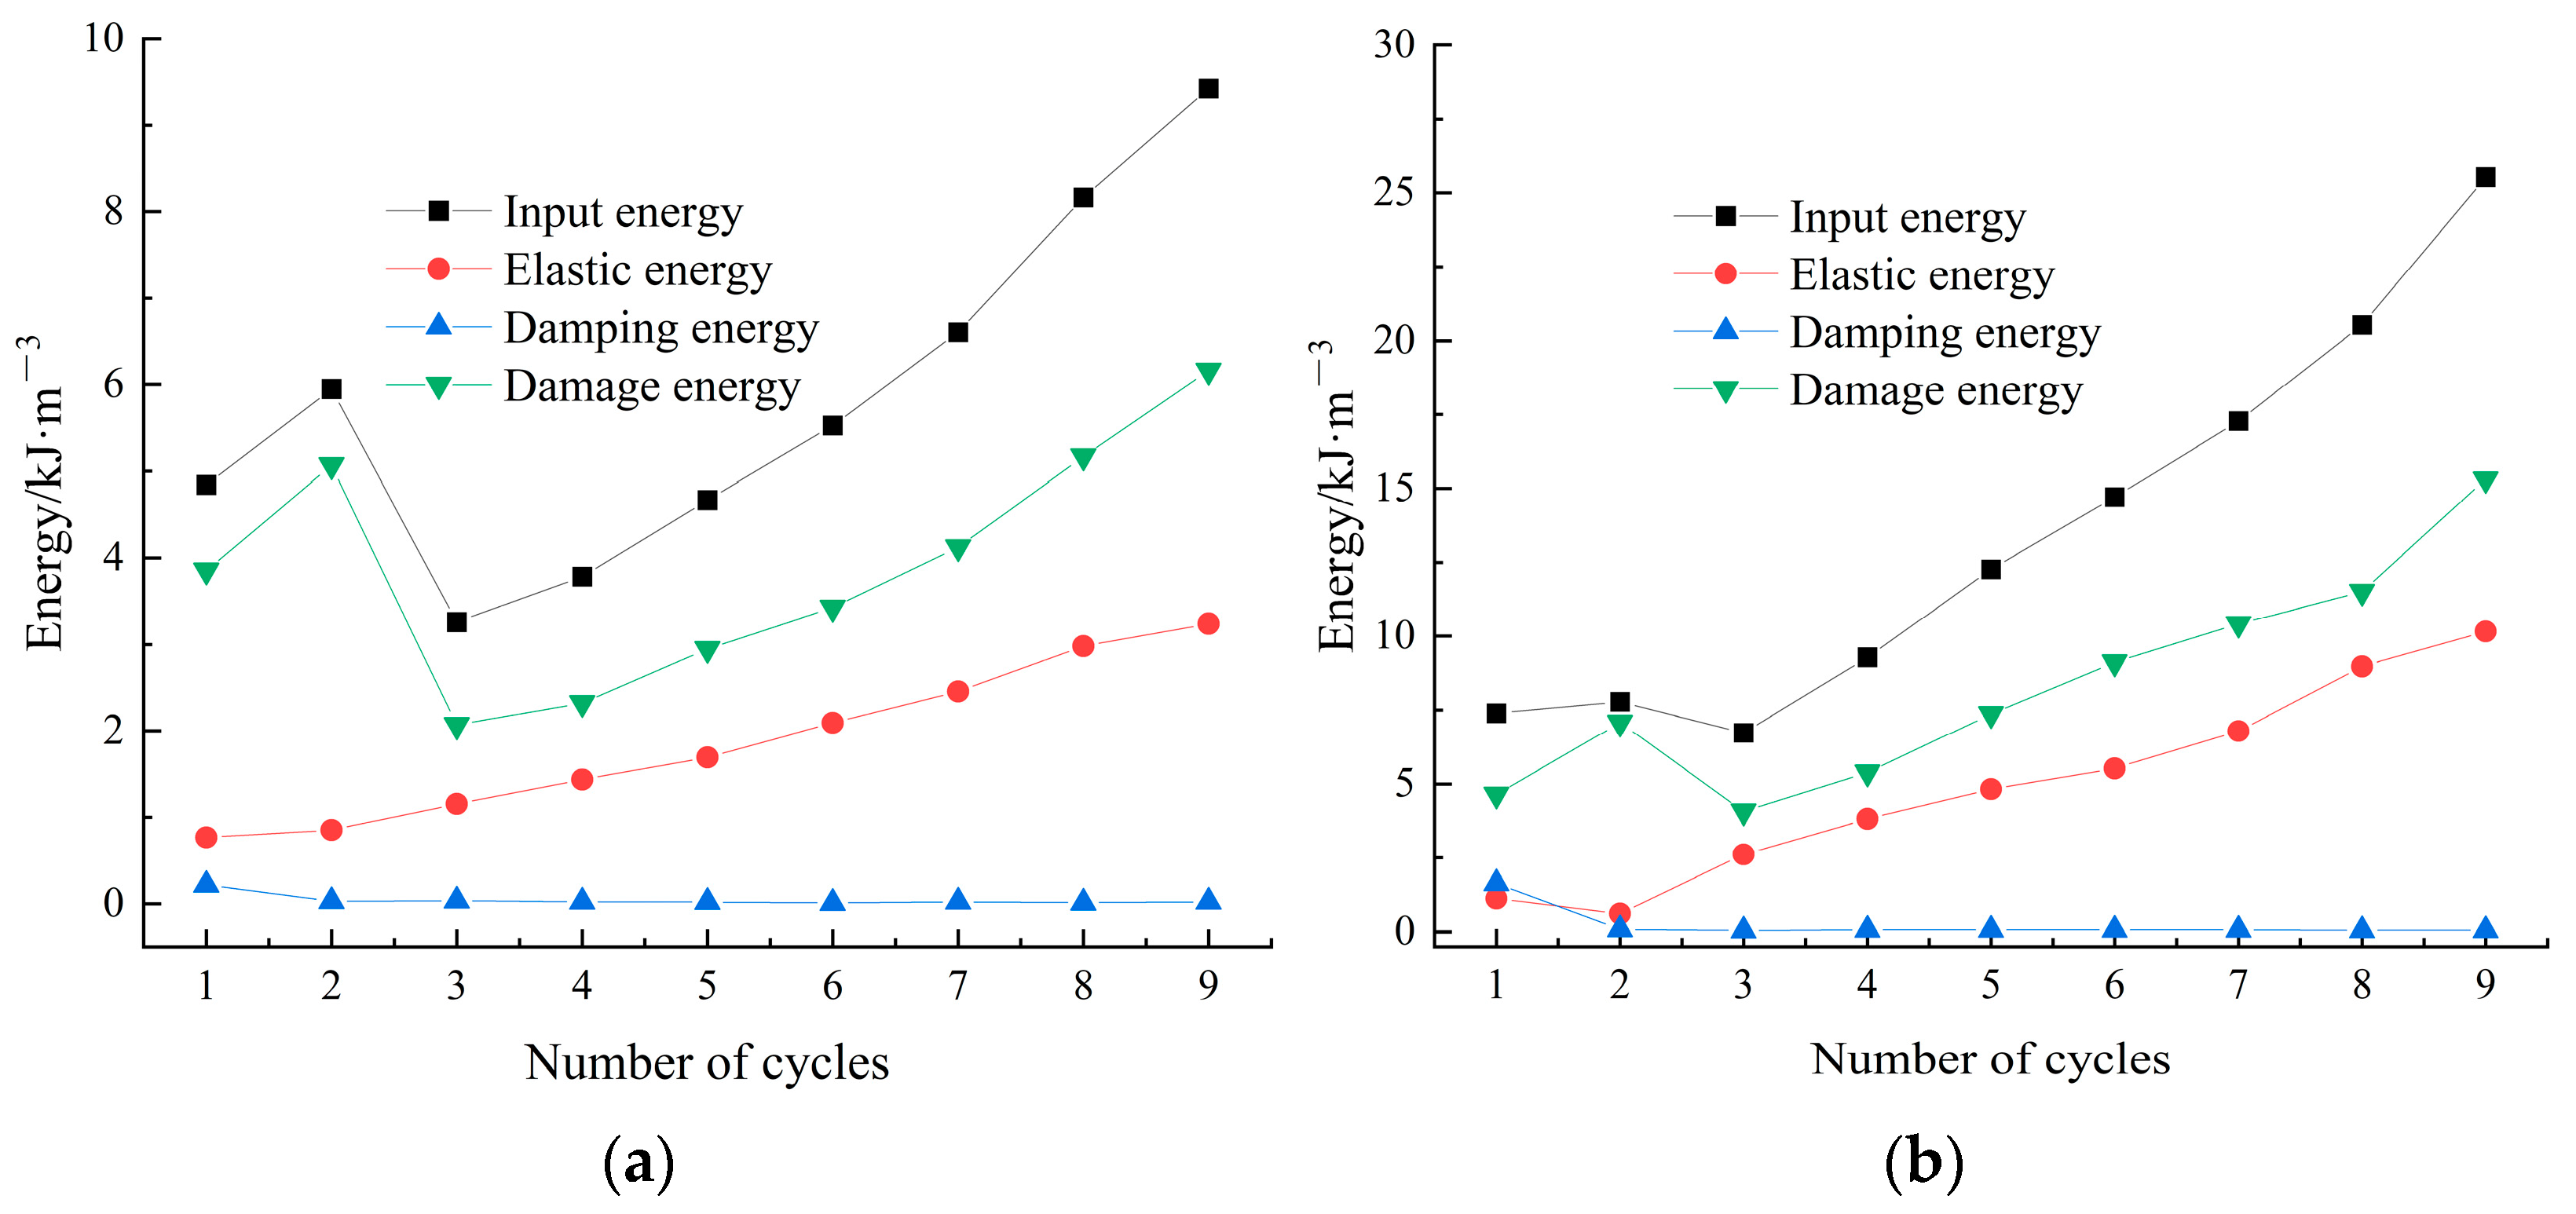
The relationship between the energy (input energy, elastic energy, damage energy, and damping energy) of sandstone and granite and the number of cycles is shown in Figure 13 and Figure 14. Figure 13 shows that, under CLLCL, the input energy and elastic energy of sandstone and granite increase continuously as the number of cycles increases, exhibiting evident nonlinear growth characteristics. The damping energy and damage energy increase relatively slowly, suggesting that there is less energy dissipation. Under CLLCL, as the number of cycles increases, the testing machine works on the rocks, leading to an increase in the input energy. A large proportion of the input energy is transformed into elastic energy and stored in the rock. A tiny proportion of the input energy is transformed into damping energy and damage energy, which are used to overcome the viscosity of rock and promote the start and development of micro-cracks, respectively.
It can be seen from Figure 14 that, under VLLCL, with an increase in the cycle number, the input energy and damage energy of the sandstone and granite first increase, then decrease, and then increase. The energy value in the second cycle is abnormal. This is due to the closure and compression of micro-cracks during the compaction stage, which increases rock deformation and requires more energy. As a result, compared with the first cycle, considerable increases in the input energy and damage energy are observed in the second cycle. The elastic energy increases as the number of cycles increases, showing that the elastic property of rock is improved; the damping energy decreases initially and tends to be stable after the second cycle. Under VLLCL, as the number of cycles increases, a large proportion of the input energy is transformed into damage energy, and a tiny proportion is transformed into elastic energy and damping energy. Thus, it can be concluded that in the three stress paths, the stress path of CLLCL makes the rock elastic property strongest, whereas the stress path of VLLCL causes the most damage to the rock.
With an increase in the number of cycles, the loading force increases correspondingly, which changes the internal structure of the rock and the energy distribution. To further examine the energy distribution and evolution law of rocks at each cycle level, the proportions of elastic energy, damage energy, and damping energy in the input energy at each cycle level were calculated, as seen in Figure 15 and Figure 16. It can be seen from Figure 15 that the proportion of elastic energy in sandstone and granite under CLLCL increases and finally increases to 73.27% and 85.32%, respectively. The proportion of damage energy increases as the number of cycles increases, whereas the proportion of elastic energy decreases, showing a reverse trend. This is because the rock deformation is obvious during the compaction stage, resulting in a greater damage energy, but the energy dissipation in the latter stage is mainly damping energy, while damage energy is at a very low level. The proportion of damping energy in sandstone increases first and then stabilizes, but in granite, it increases initially and then decreases gradually after reaching its maximum value in the fourth cycle. This is because granite is denser than sandstone, resulting in less debris during loading and unloading. In the later stages of loading and unloading, the debris and fractures are gradually compressed, and the amount of damping energy needed to overcome the fracture interface’s friction is gradually reduced.
Figure 16 demonstrates that under VLLCL, the proportion of damage energy in sandstone and granite increases and then decreases and finally stabilizes at 61.35~65.34% and 56.02~61.9%, respectively. The proportion of damping energy decreases first and then stabilizes at 0.13~0.45%. The proportion of elastic energy and the proportion of damage energy show a reverse trend, with the proportion of elastic energy increasing initially and then stabilizing at 34.39~41.29%. The evolution curve of rock energy proportion can reflect the energy distribution at each level of each cycle. Under CLLCL, elastic energy dominates each cycle, whereas damage energy dominates each cycle under VLLCL.
5. Ultimate Damage Energy
5.1. The Concept and Calculation Method of Ultimate Damage Energy
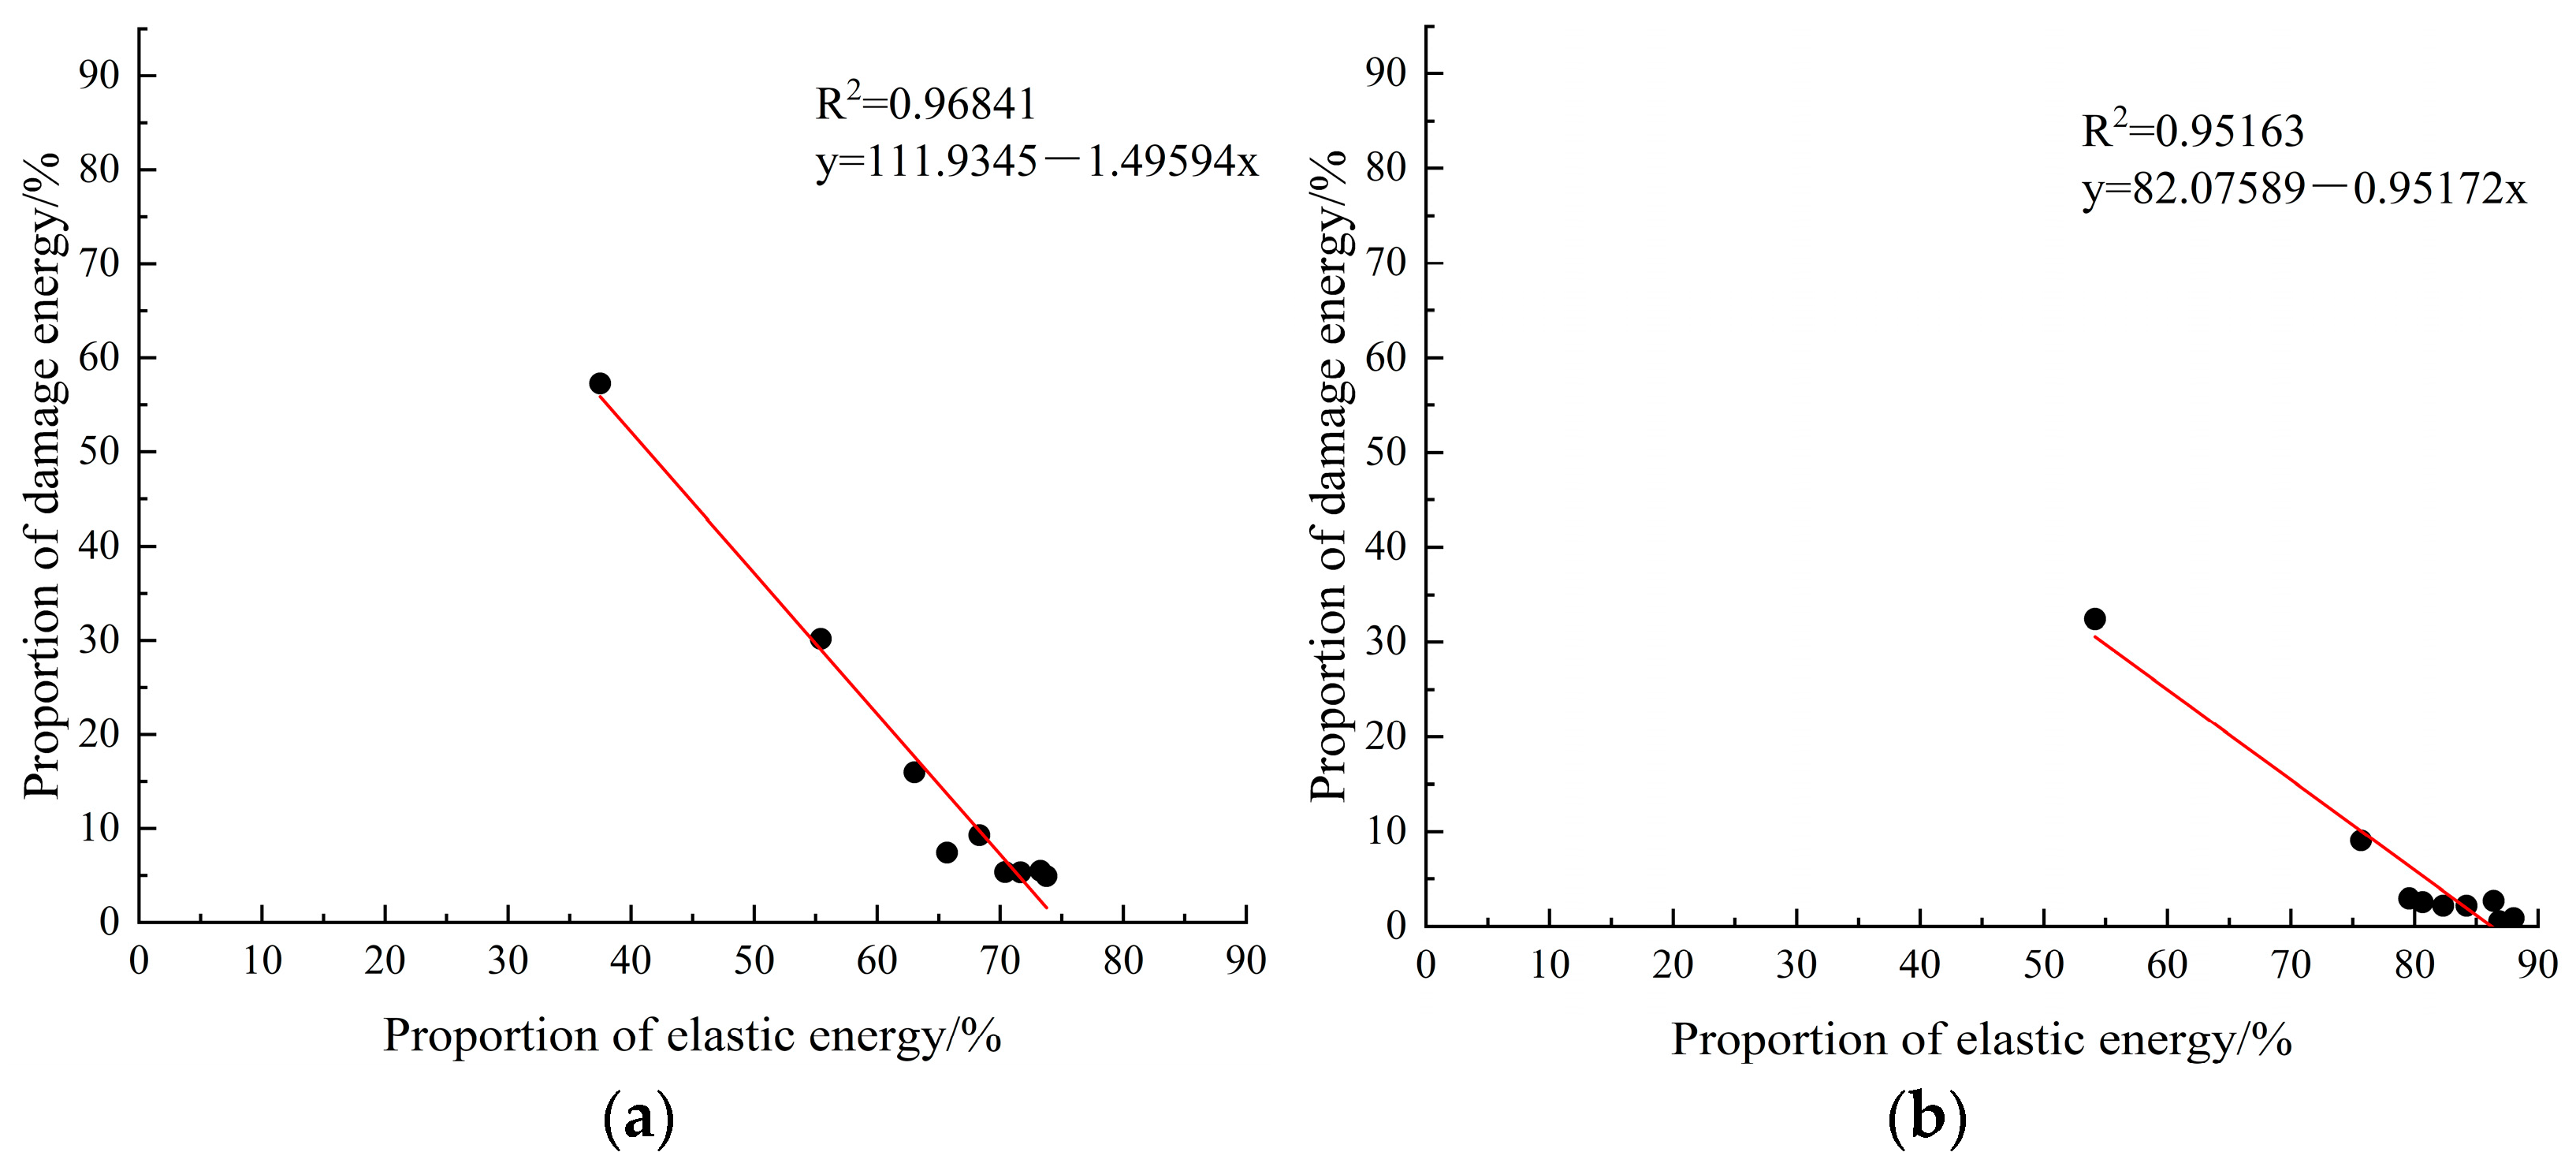
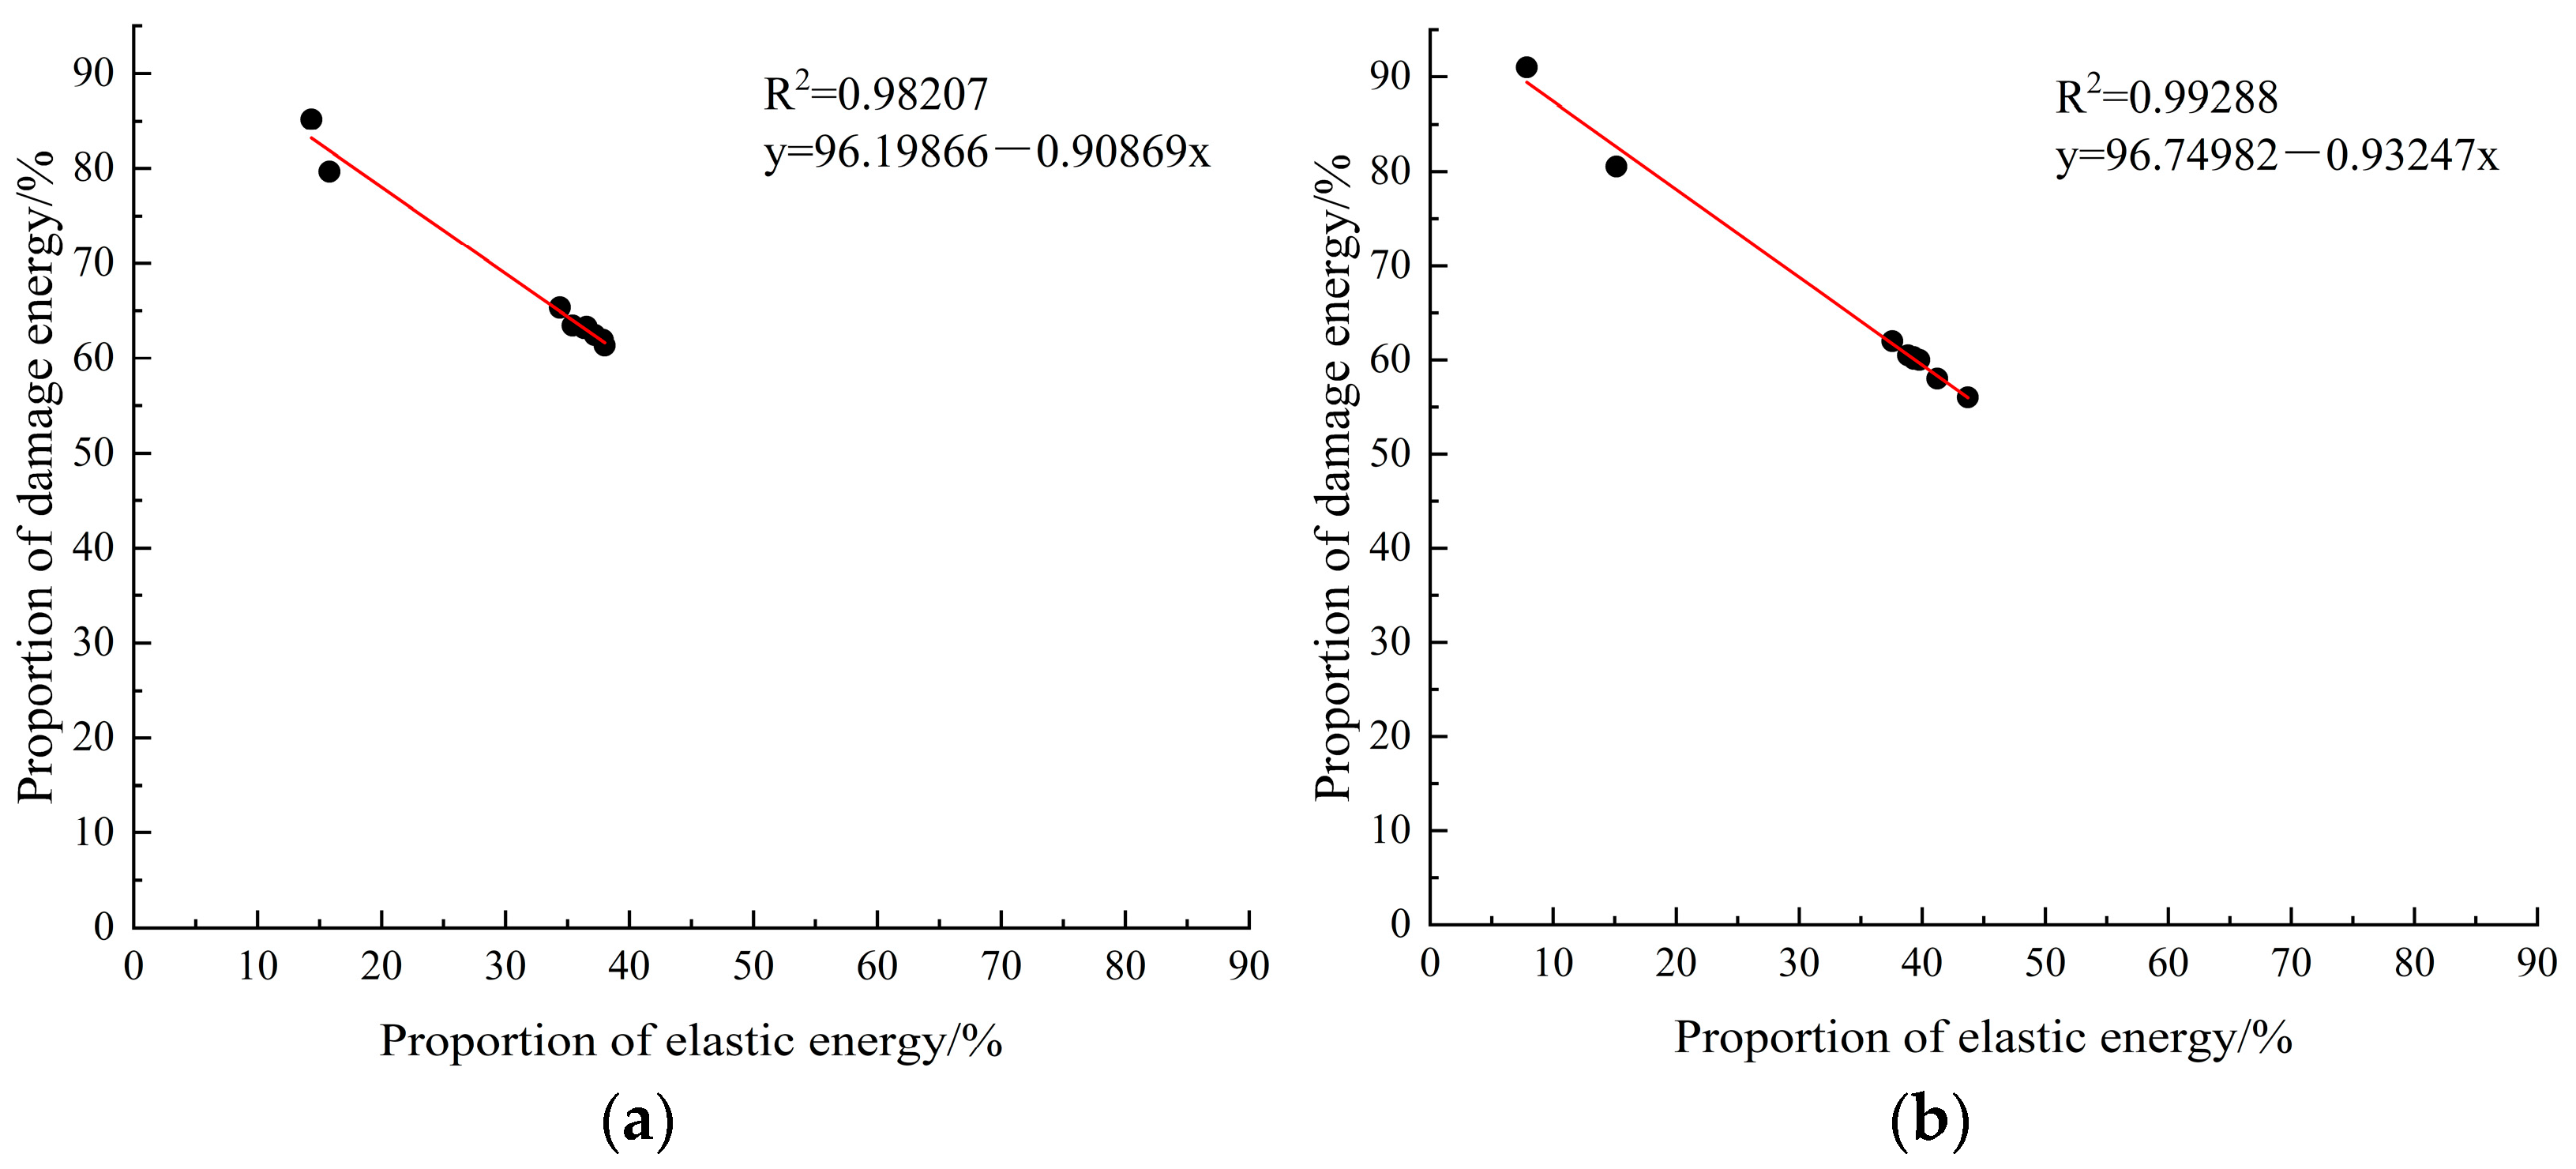
The damage energy in rock energy is the useful work that drives the failure of rock; hence, it is crucial to calculate the damage energy at the peak strength in order to predict rock failure. Nevertheless, there is currently no method for calculating the peak damage energy. Due to the heterogeneity and brittleness of rock, the strength of each rock specimen cannot be determined in advance. As a result, the unloading test of rock specimens at the peak strength is impossible, and the damage energy at the peak strength cannot be calculated. In order to solve this problem, the concept of ultimate damage energy is proposed for the first time, which is defined as the damage energy at the peak strength of rock. Based on Section 4.1’s study of energy evolution, it is known that the proportions of damage energy and elastic energy of rock under CLLCL or VLLCL show a reverse trend. Therefore, a linear fitting of the two kinds of energy proportion data was carried out to try to determine the relationship between the energy of each part in sandstone and granite, and then the ultimate damage energy was derived. The fitting results are shown in Figure 17 and Figure 18.
Figure 17 and Figure 18 reveal that the of the fitting curves is larger than 0.95, suggesting an adequate data fitting. Consequently, the linear fitting formula for the elastic energy proportion and the damage energy proportion can be calculated as follows:
where a and b are fitting parameters.
The relationships between damage energy, elastic energy, and input energy can be obtained from the transformation of Equation (6):
Substituting fitting coefficients a and b into Equation (7) yields the following relationships between damage energy, elastic property, and input energy for sandstone and granite under CLLCL and under VLLCL:
Elastic energy at peak strength can be expressed as [20]
where is the peak stress, and is the initial elastic modulus.
The simultaneous Equations (8) and (9) can be used to calculate the damage energy of rock at the peak strength (the ultimate damage energy). The ultimate damage energies of the rock specimens under different stress paths are shown in Table 2.
5.2. Damage Evolution Based on Damage Energy
Some researchers use the normalized dissipated energy to describe rock damage [18,19,20]. The former parts of this paper demonstrate, however, that the internal cause of plastic deformation in rock and promotion of micro-crack initiation and propagation is damage energy. Therefore, it is better to describe the damage evolution of rock based on the normalized damage energy.
Damage variable D [26] based on normalized damage energy can be expressed as
where is the ith cycle’s damage variable, is the ith cycle’s cumulative damage energy, and is the total damage energy. When D = 0, the rock is undamaged, and when D = 1, the peak strength has been reached and rock failure occurs.
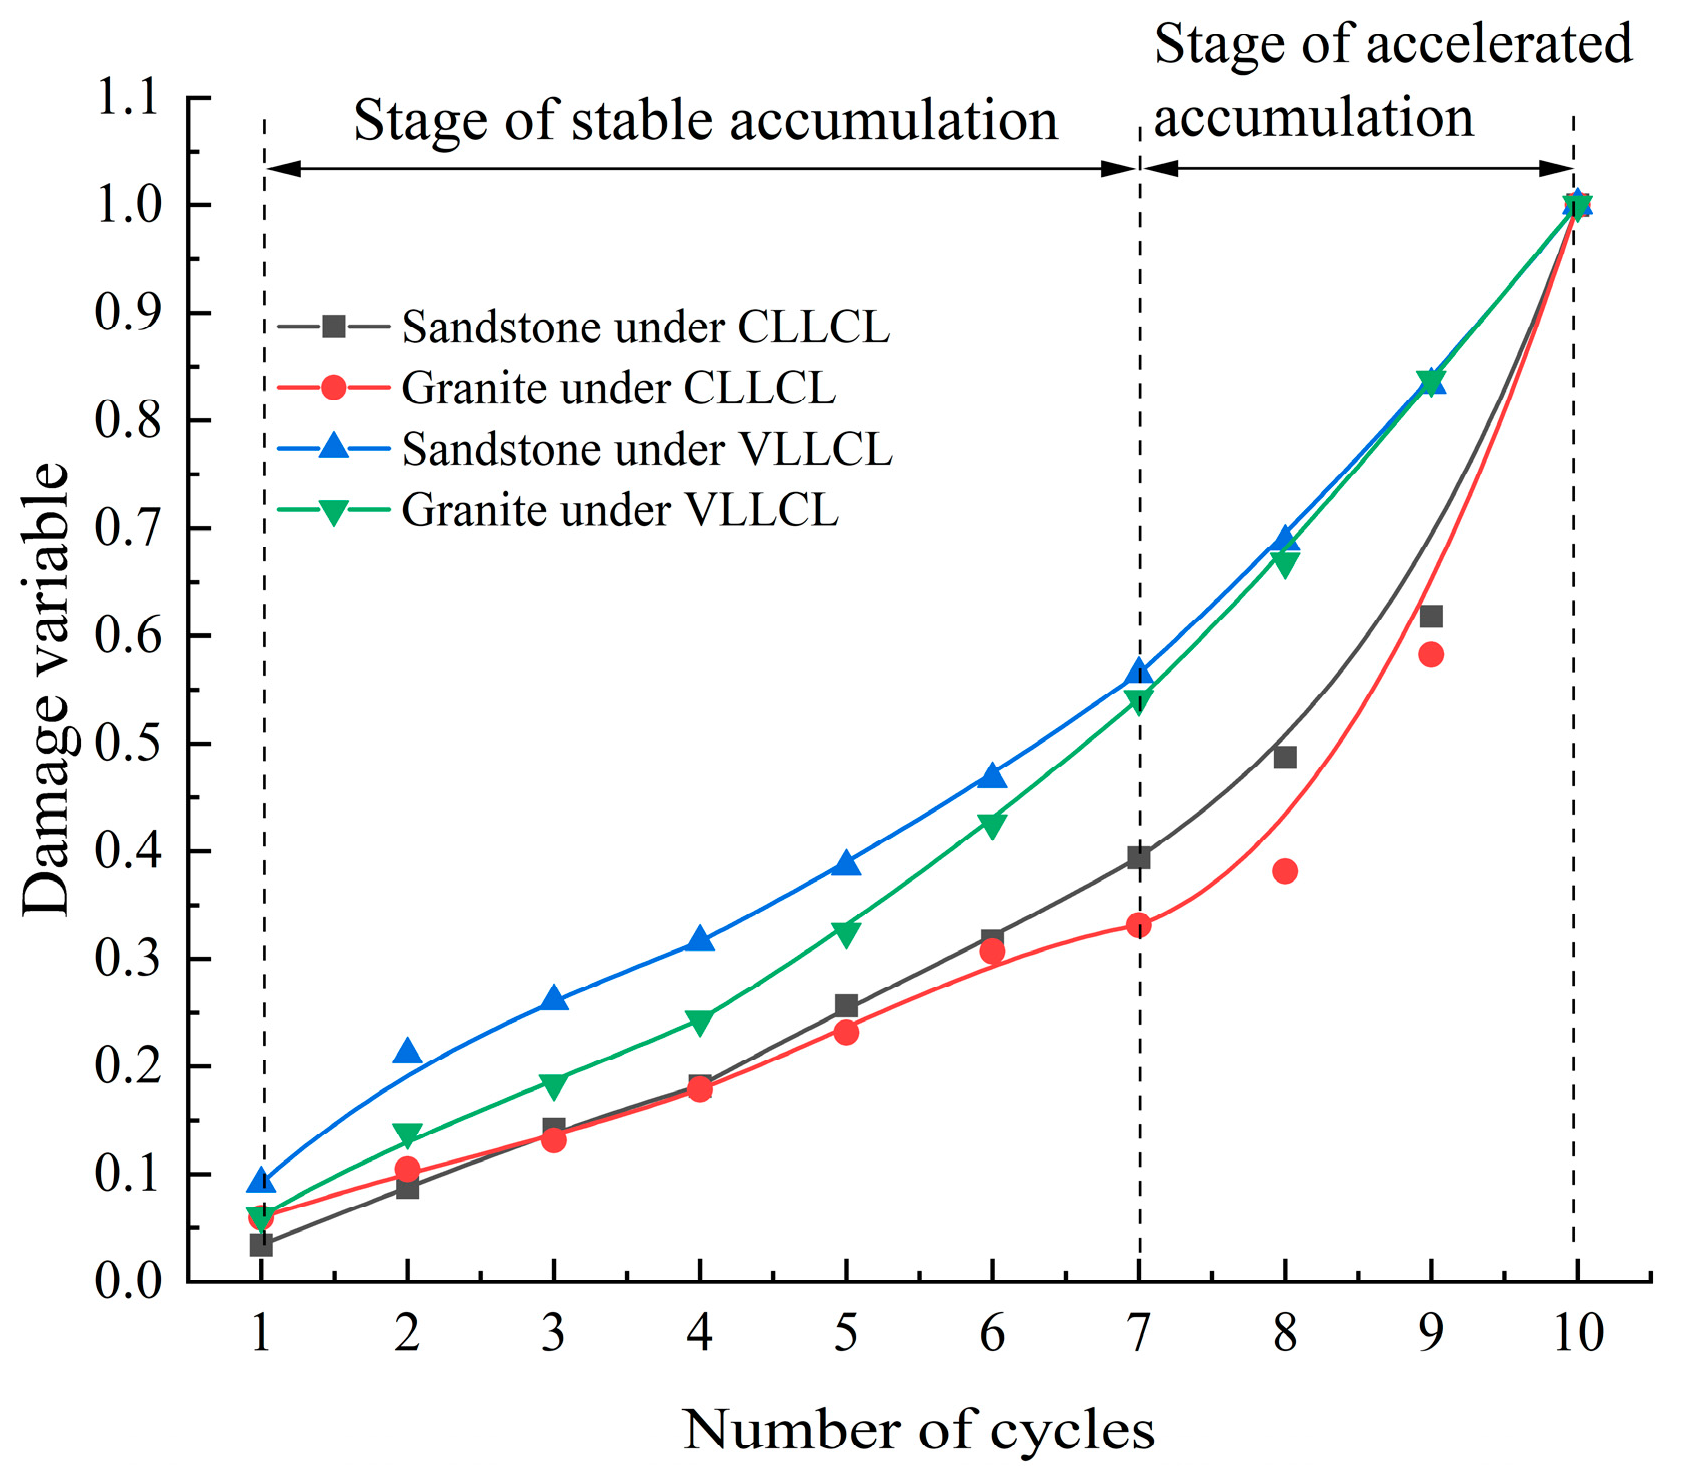
The damage evolutions of sandstone and granite under CLLCL and VLLCL are shown in Figure 19. The damage evolution of rock under different stress paths can be divided into two stages: stable accumulation and accelerated accumulation. In the stage of stable accumulation, the damage variable increases linearly with the number of cycles, and damage accumulation is slow. Under VLLCL, the initial damage and damage development rates of rock are somewhat greater than when rock is under CLLCL, resulting in a bigger damage variable. In the seventh cycle, it moves to the accelerated damage accumulation stage, wherein the rate of damage increases significantly and reaches the maximum value. Rock failure can almost be observed at this stage. Due to the accumulation of early damage, the damage of rock under VLLCL is greater than that under CLLCL at this stage. However, the increased rate of the damage variable under CLLCL is larger, indicating that the rate of micro-crack propagation and penetration is larger at this moment, and the macro-failure surface forms extremely rapidly. Throughout the entire damage evolution stage of rock, the damage variable under VLLCL is always greater than that under CLLCL, indicating that the stress path of VLLCL causes more damage to rock and a more pronounced decline in rock mechanical properties. This is consistent with the energy analysis conclusion that the stress path of VLLVL causes more damage to the rock. The damage characteristics were compatible with the real damage conditions in the rocks, which validates, to a certain degree, the validity of the calculation method for ultimate damage energy.
6. Conclusions
- (1)
- Due to the “hardening effect”, the strength of cyclic loading and unloading was slightly greater than that of uniaxial compression. The “hardening effect” of sandstone and granite under CLLCL was the most significant, maximizing the mechanical property.
- (2)
- Under different stress paths, the failures of sandstone and granite showed burstiness. Compared with UC, the cyclic loading–unloading stress paths had a certain degree of inhibition in the burstiness, and CLLCL had the strongest inhibition. The combination of AE source location and AE parameters can well reflect the micro-crack initiation, propagation, and penetration in the process of rock loading.
- (3)
- Each energy exhibited nonlinear evolution characteristics as the number of cycles increased. Under CLLCL, the elastic energy dominated, which illustrates sandstone and granite under CLLCL as having stronger elastic properties than when under VLLCL; under VLLCL, the damage energy dominated, which illustrates VLLVL as causing more damage to rock than CLLCL.
- (4)
- A strong linear relationship between the proportion of damage energy and the proportion of elastic energy was found. Based on this linear relationship, the concept of ultimate damage energy and its calculation method were proposed, which can solve the problem of the inability to calculate the damage energy at the peak strength.
- (5)
- The damage evolution curve based on damage energy can be divided into two stages: stable accumulation and accelerated accumulation. Throughout the whole damage evolution process, VLLCL caused more damage to the rocks than CLLCL. The damage characteristics were compatible with the damage conditions in the rocks, which validates, to a certain degree, the validity of the calculation method for ultimate damage energy.
Author Contributions
Conceptualization, B.S. and S.Z.; methodology, B.S. and H.Y.; validation, S.Z.; formal analysis, H.Y.; investigation, X.L. and J.F.; resources, B.S. and S.Z.; writing—original draft preparation, H.Y. and B.S.; writing—review and editing, H.Y. and S.Z.; visualization, H.Y.; supervision X.L. and J.F.; funding acquisition, B.S. All authors have read and agreed to the published version of the manuscript.
Funding
This work was supported by the Natural Science Foundation of Hunan Province, China (grant no. 2021JJ30575) and the National Natural Science Foundation of China (grant no. 51204098).
Institutional Review Board Statement
Not applicable.
Informed Consent Statement
Not applicable.
Data Availability Statement
Some or all data that support the findings of this study are available from the corresponding author upon reasonable request.
Conflicts of Interest
The authors declare no conflict of interest.
References
- Liu, J.; Zhao, Y.; Tan, T.; Zhang, L.; Zhu, S.; Xu, F. Evolution and modeling of mine water inflow and hazard characteristics in southern coalfields of China: A case of Meitanba mine. Int. J. Min. Sci. Technol. 2022, 32, 513–524. [Google Scholar] [CrossRef]
- Liu, Y.; Dai, F. A review of experimental and theoretical research on the deformation and failure behavior of rocks subjected to cyclic loading. J. Rock Mech. Geotech. Eng. 2021, 13, 1203–1230. [Google Scholar] [CrossRef]
- Yunpei, L.; Qican, R.; Quanle, Z.; Bichuan, Z.; Yang, H. Experimental study of mechanical behaviors and failure characteristics of coal under true triaxial cyclic loading and unloading and stress rotation. Nat. Resour. Res. 2022, 2, 971–991. [Google Scholar] [CrossRef]
- Zhao, Y.; Zhang, C.; Wang, Y.; Lin, H. Shear-related roughness classification and strength model of natural rock joint based on fuzzy comprehensive evaluation. Int. J. Rock Mech. Min. Sci. 2021, 137, 104550. [Google Scholar] [CrossRef]
- Xiao, F.; Jiang, D.; Wu, F.; Zou, Q.; Chen, J.; Chen, B.; Sun, Z. Effects of prior cyclic loading damage on failure characteristics of sandstone under true-triaxial unloading conditions. Int. J. Rock Mech. Min. Sci. 2020, 132, 104379. [Google Scholar] [CrossRef]
- Zhang, M.; Meng, Q.; Liu, S. Energy evolution characteristics and distribution laws of rock materials under triaxial cyclic loading and unloading compression. Adv. Mater. Sci. Eng. 2017, 2017, 5471571. [Google Scholar] [CrossRef] [Green Version]
- Meng, Q.; Zhang, M.; Zhang, Z.; Han, L.; Pu, H. Research on non-linear characteristics of rock energy evolution under uniaxial cyclic loading and unloading conditions. Environ. Earth Sci. 2019, 78, 650. [Google Scholar] [CrossRef]
- Zhao, G.; Liu, Z.; Meng, R.; Zhang, R.; Kao, S.; Qi, M. Energy accumulation and dissipation test and analysis method of height-diameter ratio sandstone. J. China Coal Soc. 2022, 47, 1110–1121. [Google Scholar]
- Liu, H.; Bie, P.; Li, X.; Wei, Y.; Wang, M. Mechanical properties and energy dissipation characteristics of phyllite under triaxial multi-stage cyclic loading and unloading conditions. Rock Soil Mech. 2022, 43, 265–274. [Google Scholar]
- Xie, H.; Ju, Y.; Li, L. Criteria for strength and structural failure of rocks based on energy dissipation and energy release principles. Chin. J. Rock Mech. Eng. 2005, 24, 3003–3010. [Google Scholar]
- Gong, F.; Yan, J.; Li, X.; Luo, S. A peak-strength strain energy storage index for rock burst proneness of rock materials. Int. J. Rock Mech. Min. Sci. 2019, 117, 76–89. [Google Scholar] [CrossRef]
- Li, Z.; Hu, G.; Huang, T.; Liu, Y. Variation of energy and criteria for strength failure of shale under traixial cyclic loading. Chin. J. Rock Mech. Eng. 2018, 37, 662–670. [Google Scholar]
- Munoz, H.; Taheri, A.; Chanda, E.K. Fracture energy-based brittleness index development and brittleness quantification by pre-peak strength parameters in rock uniaxial compression. Rock Mech. Rock Eng. 2016, 49, 4587–4606. [Google Scholar] [CrossRef]
- He, M.; Huang, B.; Zhu, C.; Chen, Y.; Li, N. Energy dissipation-based method for fatigue life prediction of rock salt. Rock Mech. Rock Eng. 2018, 51, 1447–1455. [Google Scholar] [CrossRef]
- Wang, Y.; Feng, W.K.; Hu, R.L.; Li, C.H. Fracture evolution and energy characteristics during marble failure under triaxial fatigue cyclic and confining pressure unloading (FC-CPU) conditions. Rock Mech. Rock Eng. 2020, 54, 799–818. [Google Scholar] [CrossRef]
- Wang, G.; Gong, S.; Li, Z.; Dou, L.; Cai, W.; Mao, Y. Evolution of stress concentration and energy release before rock bursts: Two case studies from xingan coal mine, Hegang, China. Rock Mech. Rock Eng. 2015, 49, 3393–3401. [Google Scholar] [CrossRef]
- Zhang, H.; Lu, C.; Liu, B.; Liu, Y.; Zhang, N.; Wang, H. Numerical investigation on crack development and energy evolution of stressed coal-rock combination. Int. J. Rock Mech. Min. Sci. 2020, 133, 104417. [Google Scholar] [CrossRef]
- Liu, Y.; Dai, F.; Dong, L.; Xu, N.; Feng, P. Experimental investigation on the fatigue mechanical properties of intermittently jointed rock models under cyclic uniaxial compression with different loading parameters. Rock Mech. Rock Eng. 2017, 51, 47–68. [Google Scholar] [CrossRef]
- Cheng, C.; Li, X. Cyclic Experimental studies on damage evolution behaviors of shale dependent on structural orientations and confining pressures. Energies 2018, 11, 160. [Google Scholar] [CrossRef] [Green Version]
- Li, T.; Pei, X.; Wang, D.; Huang, R.; Tang, H. Nonlinear behavior and damage model for fractured rock under cyclic loading based on energy dissipation principle. Eng. Fract. Mech. 2019, 206, 330–341. [Google Scholar] [CrossRef]
- Liu, Z.; Meng, X.; Zhao, G.; Zhang, R.; Liu, Z.; Kao, S.; Qi, M. Energy and damage analysis of sandstone under true triaxial compression. Chin. J. Rock Mech. Eng. 2022, 42, 1–15. [Google Scholar]
- Liu, X.S.; Ning, J.G.; Tan, Y.L.; Gu, Q.H. Damage constitutive model based on energy dissipation for intact rock subjected to cyclic loading. Int. J. Rock Mech. Min. 2016, 85, 27–32. [Google Scholar] [CrossRef]
- Singh, A.; Negi, A.; Verma, A.; Kumar, S. Analysis of stresses induced due to a moving load on irregular initially stressed heterogeneous viscoelastic rock medium. J. Eng. Mech. 2017, 143, 4017096. [Google Scholar] [CrossRef]
- Jiang, C.; Wei, C.; Duan, M.; Chen, Y.; Yu, T.; Li, Z. Hysteresis effect and damping characteristics of shale under saturated and natural state. Rock Soil Mech. 2020, 41, 1799–1808. [Google Scholar]
- He, M.; Zhang, Z.; Li, N. Experimental investigation and empirical model to determine the damping and shear stiffness properties of soft rock under multistage cyclic loading. Soil Dyn. Earthq. Eng. 2021, 147, 106818. [Google Scholar] [CrossRef]
- Li, X.; Yao, Z.; Huang, X.; Liu, Z.; Zhao, X.; Mu, K. Investigation of deformation and failure characteristics and energy evolution of sandstone under cyclic loading and unloading. Rock Soil Mech. 2021, 42, 1693–1704. [Google Scholar]
- Sun, B.; Tang, W.; Zeng, S.; Hou, S.; Fang, Y. Statistical analysis of rock acoustic emission energy and waiting time based on self-organized criticality theory. Rock Soil Mech. 2022, 43, 2525–2538. [Google Scholar]
- Cui, B.; Feng, G.; Bai, J.; Wang, K.; Shi, X.; Wu, H. Acoustic emission characteristics and damage evolution process of backfilling body–coal pillar–backfilling body composite structure. Bull. Eng. Geol. Environ. 2022, 81, 300. [Google Scholar] [CrossRef]
- Wang, T.; Wang, C.; Xie, F.; Wang, L.; Xiu, M. Study on acoustic emission and strain field evolution of red sandstone under different loading and unloading paths. Chin. J. Rock Mech. Eng. 2022, 41, 2881–2891. [Google Scholar]
- Bing, S.; Haowei, Y.; Sheng, Z.; Yu, L. Damage constitutive and failure prediction of artificial single-joint sandstone based on acoustic emission. Geotech. Geol. Eng. 2022, 40, 5577–5591. [Google Scholar] [CrossRef]
- Jia, Z.; Xie, H.; Zhang, R.; Li, C.; Wang, M.; Gao, M.; Zhang, Z.; Zhang, Z. Acoustic emission characteristics and damage evolution of coal at different depths under triaxial compression. Rock Mech. Rock Eng. 2020, 53, 2063–2076. [Google Scholar] [CrossRef]
- Zhang, R.; Liu, J.; Sa, Z.; Wang, Z.; Lu, S.; Lv, Z. Fractal characteristics of acoustic emission of gas-bearing coal subjected to true triaxial loading. Measurement 2021, 169, 108349. [Google Scholar] [CrossRef]
- Du, K.; Li, X.; Wang, S.; Tao, M.; Li, G.; Wang, S. Compression-shear failure properties and acoustic emission (AE) characteristics of rocks in variable angle shear and direct shear tests. Measurement 2021, 183, 109814. [Google Scholar] [CrossRef]
- Du, K.; Li, X.; Tao, M.; Wang, S. Experimental study on acoustic emission (AE) characteristics and crack classification during rock fracture in several basic lab tests. Int. J. Rock Mech. Min. Sci. 2020, 133, 104411. [Google Scholar] [CrossRef]
- Li, Z.; Zhou, M.; Gao, Z.; Chen, D.; Zhang, J.; Hu, J. Experimental study on acoustic emission characteristics before the peak strength of rocks under incrementally cyclic loading-unloading methods. Chin. J. Rock Mech. Eng. 2019, 38, 724–735. [Google Scholar]
- Liu, X.; Liu, Z.; Li, X.; Gong, F.; Du, K. Experimental study on the effect of strain rate on rock acoustic emission characteristics. Int. J. Rock Mech. Min. Sci. 2020, 133, 104420. [Google Scholar] [CrossRef]
- Bai, J.; Feng, G.; Wang, Z.; Wang, S.; Qi, T.; Wang, P. Experimental investigations on the progressive failure characteristics of a sandwiched coal-rock system under uniaxial compression. Appl. Sci. 2019, 9, 1195. [Google Scholar] [CrossRef] [Green Version]
- Li, D.; Sun, Z.; Xie, T.; Li, X.; Ranjith, P.G. Energy evolution characteristics of hard rock during triaxial failure with different loading and unloading paths. Eng. Geol. 2017, 228, 270–281. [Google Scholar] [CrossRef]
- Peng, K.; Wang, Y.; Zou, Q.; Cheng, Y.; Song, X. Experimental study of energy dissipation characteristics and crack coalescence modes of cracked sandstone under different cyclic loading paths. Bull. Eng. Geol. Environ. 2021, 80, 5881–5895. [Google Scholar] [CrossRef]
- Meng, Q.; Liu, J.; Ren, L.; Pu, H.; Chen, Y. Experimental study on rock strength and deformation characteristics under triaxial cyclic loading and unloading conditions. Rock Mech. Rock Eng. 2020, 54, 777–797. [Google Scholar] [CrossRef]
- Chen, W.; Wan, W.; Zhao, Y.; Peng, W. Experimental study of the crack predominance of rock-like material containing parallel double fissures under uniaxial compression. Sustainability 2020, 12, 5188. [Google Scholar] [CrossRef]
- Zhou, H.; Wang, Z.; Wang, C.; Liu, J. On acoustic emission and post-peak energy evolution in Beishan granite under cyclic loading. Rock Mech. Rock Eng. Sci. 2019, 52, 283–288. [Google Scholar] [CrossRef]
- Fan, Y.; Gu, F.; Ball, A. Modelling acoustic emissions generated by sliding friction. Wear 2010, 268, 811–815. [Google Scholar] [CrossRef]
- Munoz, H.; Taheri, A.; Chanda, E.K. Rock drilling performance evaluation by an energy dissipation based rock brittleness index. Rock Mech. Rock Eng. 2016, 49, 3343–3355. [Google Scholar] [CrossRef]
- Xiao, J.; Feng, X.; Ding, D.; Jiang, F. Study of hysteresis and damping effects of rock subjected to constant amplitude cyclic loading. Chin. J. Rock Mech. Eng. 2010, 29, 1677–1683. [Google Scholar]
- Nikolić, M.; Do, X.N.; Ibrahimbegovic, A.; Nikolić, Ž. Crack propagation in dynamics by embedded strong discontinuity approach: Enhanced solid versus discrete lattice model. Comput. Methods Appl. Mech. Eng. 2018, 340, 480–499. [Google Scholar] [CrossRef]
Figure 1.
Rock specimens. (a) Sandstone; (b) granite.

Figure 2.
Schematic diagram of testing.

Figure 3.
The stress path of constant lower limit cyclic loading and unloading (CLLCL).

Figure 4.
The stress path of variable lower limit cyclic loading and unloading (VLLCL).

Figure 5.
Stress–strain curves under CLLCL. (a) Sandstone; (b) granite.

Figure 6.
Stress–strain curves under VLLCL. (a) Sandstone; (b) granite.

Figure 7.
The calculation method of modulus.

Figure 8.
The relationship between the elastic modulus and the number of cycles. (a) Sandstone; (b) granite.
Figure 8.
The relationship between the elastic modulus and the number of cycles. (a) Sandstone; (b) granite.

Figure 9.
The AE energy evolution and location under UC. (a) Sandstone; (b) granite.

Figure 10.
The AE energy and location evolution under CLLCL. (a) Sandstone; (b) granite.

Figure 11.
The AE energy evolution and location under VLLCL. (a) Sandstone; (b) granite.

Figure 12.
Diagram of energy calculation.

Figure 13.
Rock energy evolution under CLLCL. (a) Sandstone; (b) granite.

Figure 14.
Rock energy evolution under VLLCL. (a) Sandstone; (b) granite.

Figure 15.
The evolution of rock energy proportion under CLLCL. (a) Sandstone; (b) granite.

Figure 16.
The evolution of rock energy proportion under VLLCL. (a) Sandstone; (b) granite.

Figure 17.
Fitting between the proportion of damage energy and proportion of elastic energy under CLLCL. (a) Sandstone; (b) granite.
Figure 17.
Fitting between the proportion of damage energy and proportion of elastic energy under CLLCL. (a) Sandstone; (b) granite.

Figure 18.
Fitting between the proportion of damage energy and proportion of elastic energy under VLLCL. (a) Sandstone; (b) granite.
Figure 18.
Fitting between the proportion of damage energy and proportion of elastic energy under VLLCL. (a) Sandstone; (b) granite.

Figure 19.
The damage evolution under different stress paths.


Table 1.
The proportions of AE energy in AE period under different stress paths.
| Stress Path | Small Increase Period | Relative Quiet Period | Active Period |
|---|---|---|---|
| UC | 1.8% | 6.9% | 91.3% |
| CLLCL | 14.2% | 25.4% | 60.4% |
| VLLCL | 6.6% | 11.6% | 81.8% |
Table 2.
The ultimate damage energies under different stress paths.
| Stress Path | Rock Type | Ultimate Damage Energy/kJ·m−3 |
|---|---|---|
| CLLCL | Sandstone | 3.84 |
| Granite | 4.16 | |
| VLLCL | Sandstone | 7.01 |
| Granite | 16.64 |
Disclaimer/Publisher’s Note: The statements, opinions and data contained in all publications are solely those of the individual author(s) and contributor(s) and not of MDPI and/or the editor(s). MDPI and/or the editor(s) disclaim responsibility for any injury to people or property resulting from any ideas, methods, instructions or products referred to in the content. |
© 2023 by the authors. Licensee MDPI, Basel, Switzerland. This article is an open access article distributed under the terms and conditions of the Creative Commons Attribution (CC BY) license (https://creativecommons.org/licenses/by/4.0/).
Share and Cite
MDPI and ACS Style
Sun, B.; Yang, H.; Fan, J.; Liu, X.; Zeng, S. Energy Evolution and Damage Characteristics of Rock Materials under Different Cyclic Loading and Unloading Paths. Buildings 2023, 13, 238. https://doi.org/10.3390/buildings13010238
AMA Style
Sun B, Yang H, Fan J, Liu X, Zeng S. Energy Evolution and Damage Characteristics of Rock Materials under Different Cyclic Loading and Unloading Paths. Buildings. 2023; 13(1):238. https://doi.org/10.3390/buildings13010238
Chicago/Turabian StyleSun, Bing, Haowei Yang, Junwei Fan, Xiling Liu, and Sheng Zeng. 2023. "Energy Evolution and Damage Characteristics of Rock Materials under Different Cyclic Loading and Unloading Paths" Buildings 13, no. 1: 238. https://doi.org/10.3390/buildings13010238
Note that from the first issue of 2016, this journal uses article numbers instead of page numbers. See further details here.