Article

Large-Scale Triaxial Testing of TDA Mixed with Fine and Coarse Aggregates

Department of Civil and Resource Engineering, Dalhousie University, Halifax, NS B3H 4R2, Canada
*
Author to whom correspondence should be addressed.
Buildings 2023, 13(1), 202; https://doi.org/10.3390/buildings13010202
Submission received: 13 December 2022 / Revised: 1 January 2023 / Accepted: 8 January 2023 / Published: 11 January 2023
(This article belongs to the Collection Advances in Sustainable Building Materials and Construction)

Abstract

:
The number of scrap tires discarded worldwide is increasing annually. Stockpiling these tires is not a viable option due to environmental concerns and space limitations. Landfilling is likewise unacceptable and is not permitted in many areas. Recycling these tires is the best alternative. Shredding scrap tires to create a product known as tire-derived aggregate (TDA) is one of the most environmentally friendly methods of recycling scrap tires. In the past few decades, TDA and TDA-soil mixtures have been used increasingly in civil engineering projects. Nevertheless, only limited research has so far been conducted on TDA and TDA mixed with soil. In addition, the majority of past research has focused on TDA particles that do not have steel wires and are small in size. In the present research, triaxial tests were performed on various mixtures of TDA with sand or gravel. Each sample was subjected to three different confining pressures. The results of the tests are presented and discussed, and empirical equations are proposed to match the laboratory results.

1. Introduction

The rapidly growing world population combined with a sharp increase in car usage has led to a surge in the number of discarded scrap tires. Each year, approximately 2 billion tires are discarded worldwide, including approximately 300 million in North America [1,2,3]. Stockpiling scrap tires is not a viable option since stockpiles can be a fire hazard and can serve as a breeding ground for mosquitos and rodents [4,5,6]. Likewise, for environmental reasons, disposing of scrap tires in landfills is not permitted in many areas. The recycling of scrap tires is a widely used environmentally friendly alternative to stockpiling and landfilling. The use of scrap tires in civil engineering projects has become increasingly widespread [1]. For use in civil engineering projects, scrap tires are usually shredded to create a tire-derived aggregate (TDA) product. Due to its versatile properties, TDA has diverse applications, ranging from the use as a fill and embankment material to enhance the soil beneath highways and other infrastructure used as a backfill over and around pipes and culverts [7,8,9,10,11,12,13,14,15,16,17,18,19,20,21,22,23,24]. Furthermore, TDA and TDA-soil mixtures have also been used in various dynamic loading applications to mitigate and control vibrations (e.g., [25,26,27,28,29,30,31]). Despite the recent increase in the use of TDA in civil engineering projects, research conducted on TDA has mainly been limited to small TDA particles or TDA without steel wires. In addition, only very limited information is available concerning the geotechnical properties of TDA mixed with soils.
It is crucial for engineers to know the physical properties of the materials they use in their designs. Many researchers have attempted to evaluate the properties of TDA mixed with soil by using conventional geotechnical tests, i.e., direct shear and triaxial tests. Foose et al. [32] performed a series of large-scale direct shear tests on mixtures of sand and tire shreds, with tire shred contents of 10% and 30% by volume. In the experiment, they used tire shreds with three different particle sizes: <50 mm, 50 mm to 100 mm, and 100 mm to 150 mm. They also experimented with the orientation of tire shreds in the sample. They obtained a maximum internal friction angle of 67° for a mixture containing 30% tire shreds with a larger particle size. To measure changes in the cohesion and internal friction angle of cohesive clayey soil mixed with increasing percentages of tire chips, Cetin et al. [33] conducted direct shear tests on various mixtures of tire chips and clayey soil. They used tire chips with two relatively small particle sizes: <0.425 mm and 2 mm to 4.75 mm, and reported on the geotechnical properties of mixtures with a percentage of tire chips ranging from 10% to 50%. Reddy et al. [34] utilized a large-scale square shear box apparatus to determine the optimum mixing ratio of sand and tire chips. All the tire chips used had dimensions of 20 mm by 10 mm, and the percentage of tire chips in the mixtures ranged from 10% to 70% by mass. The researchers concluded that the optimum mixing ratio of the tire chips with sand was in the range of 30% to 40%. To study the effects of TDA particle size on TDA-sand mixtures, El Naggar et al. [35] conducted a series of direct shear tests on TDA-sand mixtures, with TDA particle sizes ranging from 0.5 mm to 48 mm. They reported that mixtures with larger TDA particles exhibited greater shear strength and stiffness.
Direct shear tests can be performed more quickly and easily than triaxial tests. However, due to the limitations of direct shear tests, such as the predefined failure surface and inadequate control over confinement and saturation, many researchers attempt to determine the geotechnical properties of TDA-soil mixtures by using triaxial testing apparatus. Masad et al. [36] evaluated the engineering properties of TDA-soil mixtures by using triaxial testing apparatus with a sample diameter of 71.1 mm. In their experiment, they used tire shreds with the steel removed, with a maximum particle size of 4.75 mm. To examine the shear strength of tire chips mixed with sand, Lee et al. [37] carried out a series of triaxial tests on sand mixed with tire chips with a maximum particle size of 30 mm and no exposed steel belting. The mixtures were tested at confining pressures of 28 kPa, 97 kPa, and 193 kPa, and the results were compared with a numerical model. Youwai and Bergado [38] performed a series of tests on shredded rubber tires mixed with sand by using a triaxial apparatus and a sample diameter of 100 mm to study the effect of different rubber-sand mixing ratios. They used shredded rubber tires with a maximum particle size of 16 mm and reported peak internal friction angles ranging from 30° to 34°. To study the effect of the tire shred content and aspect ratio on the shear strength of mixtures of tire shreds and sand, Zornberg et al. [39] conducted a total of 15 consolidated drained triaxial tests. They used rectangular tire shreds with widths of 12.7 mm and 25.4 mm, and different aspect ratios of 1, 2, and 4. They reported that although the percentage of tire shreds in the samples had a significant influence on the sample shear strength, the effect of the aspect ratio was negligible. Apart from the deterministic studies conducted on the behavior of TDA, Strenk et al. [40] studied the stochastic variability of the material. This is an extension of the research undertaken by Chwała [41] and Savvides and Papadrakakis [42] to investigate the uncertainty in quantifying the shear strength parameters of cohesionless and cohesive soils, respectively. Their findings suggest that the variability of the TDA strength parameters is highly dependent on the normal stress range at which they are evaluated.
In the present study, a total of 33 consolidated drained triaxial tests were conducted on mixtures of sand, gravel, and TDA. The sand and gravel were used to represent fine and coarse aggregates, respectively. Tests were performed for each of the aggregates, with different percentages of TDA by weight. The TDA particle size used was the same as that utilized in many civil engineering applications, except that protruding parts of the steel belt were removed. Effects of the TDA content on the sample shear strength, stiffness, and volumetric strain are examined, and empirical equations are proposed to represent the laboratory results. Finally, a guideline for the overbuild required to obtain a desired layer thickness is presented for each of the mixtures.

2. Materials and Methods

The gravel, sand, and TDA used in this study were graded according to the ASTM standard C136/C136M-14 [40]. The gravel used in the experiment complied with the Nova Scotia Transportation and Public Works specification for type 1 gravel, with a curvature coefficient of Cc = 3.8 and a uniformity coefficient of Cu = 43.1. The sand used in the experiment was poorly graded sand (SP) in accordance with ASTM D2487-11 [41], with a curvature coefficient of Cc = 1 and a uniformity coefficient of Cu = 3.68. The TDA used in the study complied with the ASTM standards for type A TDA. The type A TDA standards specify not only that the scrap tires should be shredded to specific particle sizes, but also that the final product should be free of contamination, wood fragments, and other fibrous organic matter. In addition, according to the standards, the percentage of metal fragments in the TDA that are not at least partially encased in rubber must be less than 1% [42]. During the experiment, in order to protect the membrane enclosing the samples in the triaxial apparatus, the metal wires protruding from the TDA particles were clipped and removed. The particle size distributions of the TDA, gravel, and sand are presented in Figure 1a. The TDA particle sizes ranged from 13 mm to 63 mm. The particle size distributions of the TDA-gravel and TDA-sand mixtures are presented in Figure 1b,c, respectively. In Figure 1b, it can be seen that all the TDA-gravel mixtures studied had similar gradation characteristics due to the relatively small difference in the D 50 values of the TDA and gravel. Thus, the D 50 of TDA-gravel mixtures, G1 to G4, ranged from 10 mm to 15 mm. However, as shown in Figure 1c, the TDA-sand mixtures had a wider range of gradation characteristics, with D 50 ranging from 0.7 mm to 25 mm, because of the large difference in the D 50 values of the TDA and sand.

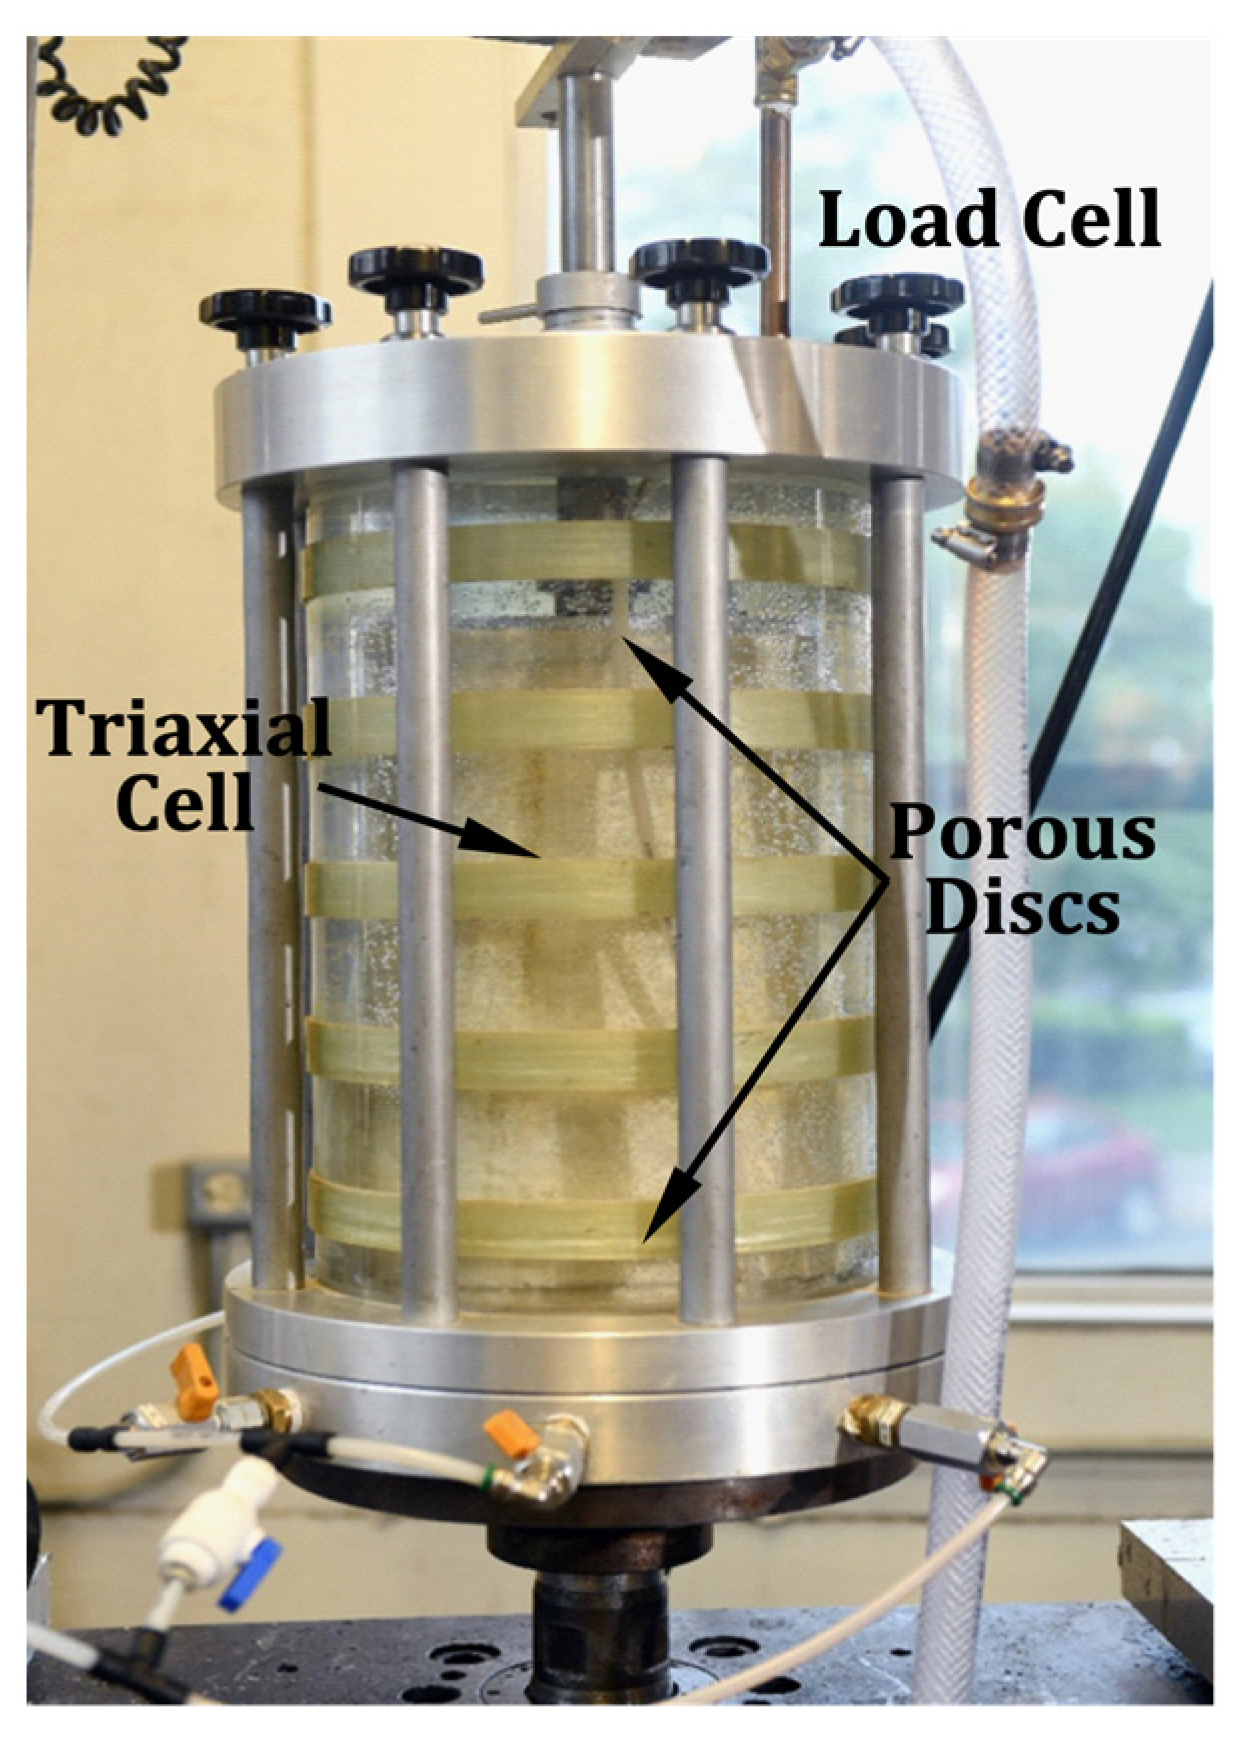
2.1. Triaxial Test Apparatus

A large-scale triaxial testing apparatus was utilized to conduct the triaxial tests. The shaft of the apparatus that applies axial loading was extended to accommodate the additional displacement exhibited by samples with a higher percentage of TDA. Figure 2 shows the triaxial apparatus used in the experiment. In all the tests, the samples had a diameter of 152 mm (6 inches) and a height of around 320 mm (12.6 inches). Thus, the height was approximately 2.1 times the diameter, which is within the range accepted by the ASTM D7181-11 standard [43]. During the tests, an Instron 8501 hydraulic load frame was used, and the sample loads and displacements were recorded at a frequency of 20 Hz. Two GDS Advanced Pressure/Volume Controllers (ADVDPC) were used in the experiments to control the pressure and to record the volume changes in the triaxial cell and the sample. To ensure the accuracy of the ADVDPCs, both ADVDPCs were calibrated before each test, and they were kept at the same height during the tests.

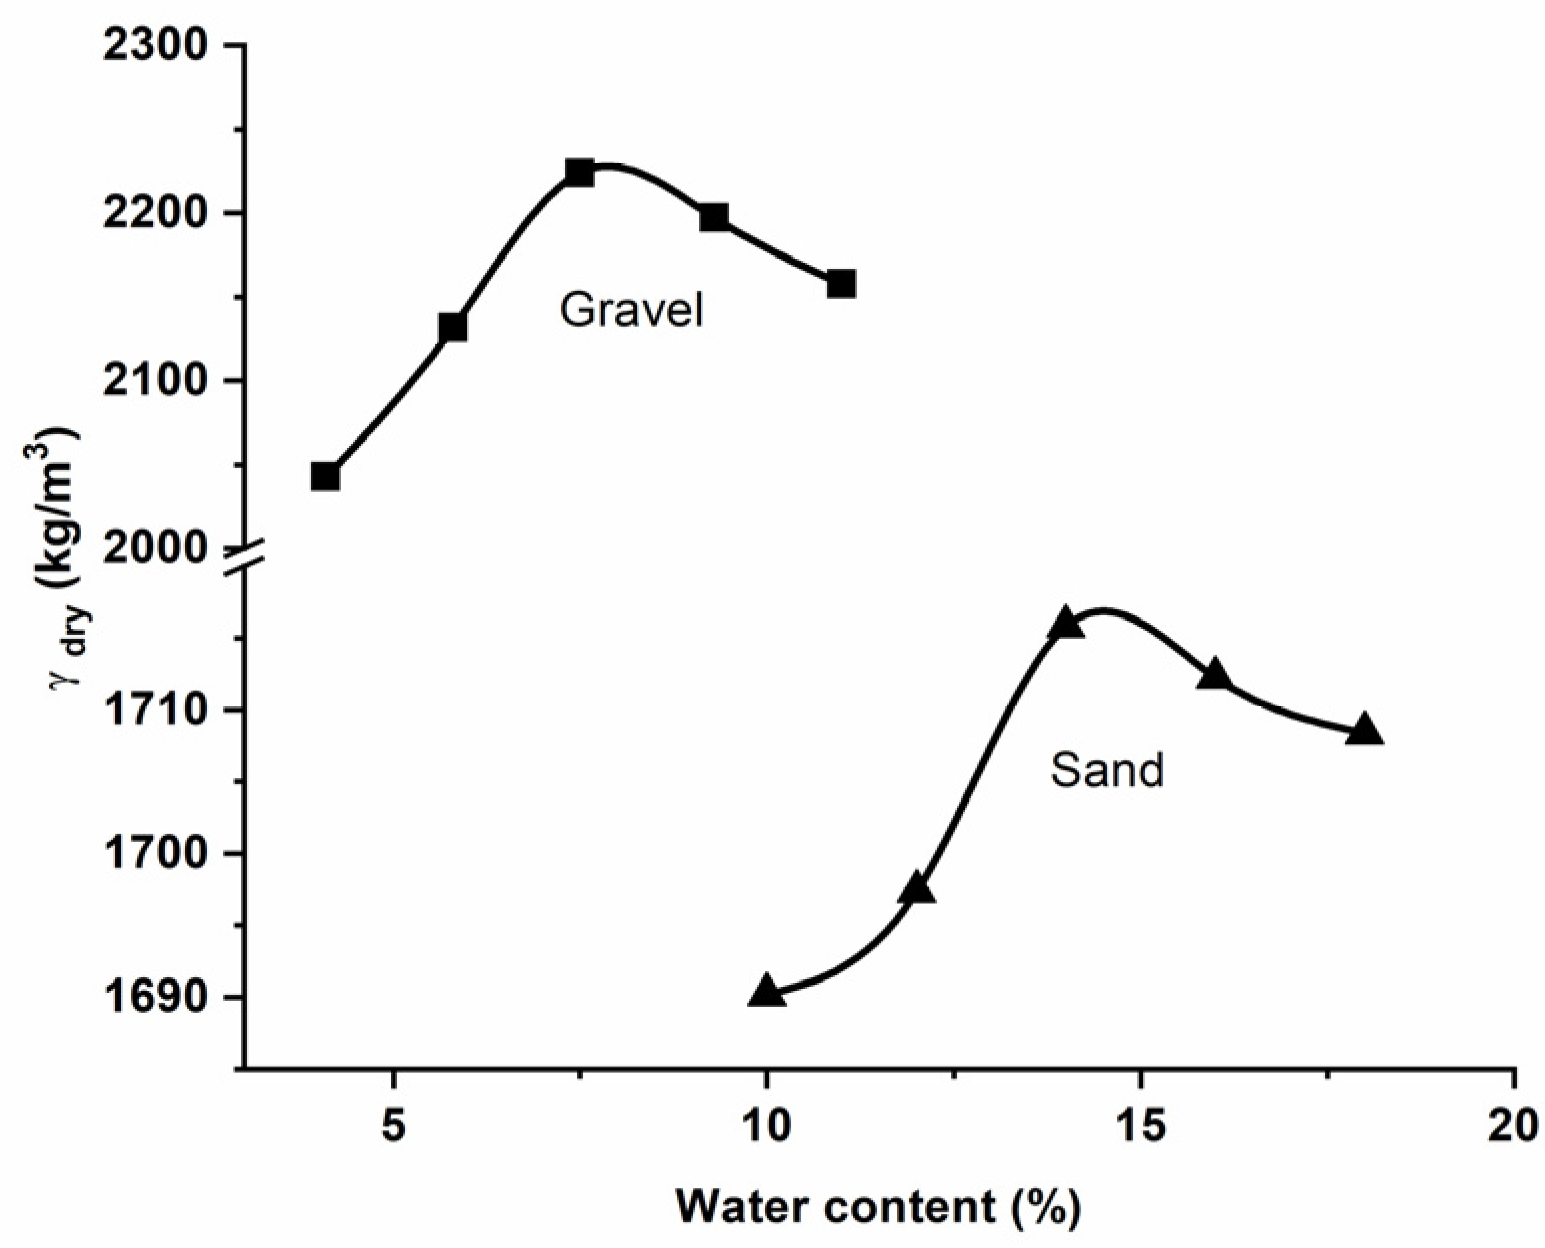
2.2. Sample Preparation

Before the samples were prepared, the optimum water content was obtained for gravel and sand in accordance with ASTM D698-12 [44]. Figure 3 shows the results of the optimum water content tests. To obtain these results, a compaction energy of 600 kJ/m3 was applied by using a manual rammer. The same compaction energy was later used to compact the samples that contained gravel or sand in five layers. For the sample containing pure TDA, the manual rammer proved ineffective since the TDA bounced back with each blow. The TDA samples were therefore compacted by tamping them with a steel rod. It has been shown by Humphry and Manion [9], and more recently by Kowalska [45], that introducing water to samples of pure TDA has an insignificant effect on the dry density of the samples. Thus, the samples containing 100% TDA were kept dry during compaction.
In this study, 33 specimens were prepared with 11 different compositions: four TDA-gravel mixtures with different percentages of TDA by weight, four TDA-sand mixtures with different percentages of TDA by weight, and three reference cases with pure TDA, pure gravel, and pure sand. In the experiment, specimens with each composition were tested at three different confining pressures. Table 1 shows the composition and average dry density of the specimens tested.
Before mixing the TDA with gravel or sand, water was added to obtain the optimum water content of the gravel or sand, but the TDA was kept dry. Although ASTM D6270-08 permits both oven and air drying of TDA, the authors observed a change in the physical characteristics of oven-dried TDA and hence used only air drying. The mixtures were prepared and mixed outside the triaxial mould and were then added to the mould and compacted in layers. During this process, no segregation of the TDA particles and soil was observed in the mixtures. TDA-gravel mixtures with up to 30% TDA were considered. In TDA-gravel mixtures with a TDA percentage exceeding 30%, there were problems with the consistency of the mixture, and segregation of the particles was noticeable. In the TDA-sand mixtures, a TDA percentage of about 50% was found to be possible. All the TDA particles used in the experiment were checked for protruding steel wire. When steel wire was found, only the parts of the steel not covered by rubber were clipped to protect the triaxial membrane. In the experiment, a membrane with a thickness of 0.635 mm (0.025 inches) was used, to improve the membrane resistance to being punctured by TDA. In addition, during compaction of the samples, special attention was paid to orienting the TDA particles to prevent the sharper edges of the particles from contacting the membrane.

2.3. Testing Procedure

In this study, 33 consolidated drained triaxial (CD) tests were performed. Each of the eleven different specimen compositions was tested at three confining pressures: 50 kPa, 100 kPa, and 200 kPa. These confining pressures were chosen to resemble the stress levels that may be encountered in a variety of scenarios, such as shallow and deep foundations, embankments, and retaining walls. Prior to the tests, the dimensions of each specimen were measured and recorded.
During the saturation stage, the triaxial chamber was filled with water, and the water was permitted to flow in all the pipes, while the drainage valve was opened to ensure that there were no trapped air bubbles in any of the lines. The chamber pressure was kept below 25 kPa to prevent prestressing of the specimen. The water movement from the bottom of the sample to the top cap was slow enough to prevent sample swelling. The last step in the saturation phase involved performing the pore water pressure parameter B-test. After the drainage valve was closed, a chamber pressure of 35 kPa was implemented and the backpressure was recorded. This process was repeated several times, and the B-value was calculated each time in accordance with ASTM D3999-11 [46]. All specimens tested achieved a B-value of 0.96 or higher. Because of the high permeability of the specimens, the saturation stage was relatively simple and fast. During the consolidation stage, the volume change and deformation of each specimen were recorded at specific time intervals, in accordance with the ASTM standard, to calculate the rate of axial loading. Samples with higher percentages of TDA exhibited a faster rate of volume change, possibly due to their higher void ratios. Table 2 shows the percentage volume change of each sample at different confining pressures.
The following equation represents the curve with the best fit to the values shown in Table 2. The equation was calculated by using a 3D regression method and shows the relation between the percentage volume change during the consolidation stage, the TDA content of the sample, and the confining pressure applied. The R2 value of the equation is 0.9655 for TDA-gravel mixtures and 0.9904 for TDA-sand mixtures. Thus,
V P = a w 2 + b w + c σ e d
where V P is the percentage volume change, σ 3 is the confining pressure of the sample (measured in kPa), and w is the percentage of TDA by weight in the sample. The values for a, b, c, and d are provided in Table 3.
During the axial loading stage of the test, the values for the load, displacement, and volume change of the sample were recorded. These values were used to adjust the deviatoric stress reported in this study in accordance with the ASTM standard.

3. Results and Discussion

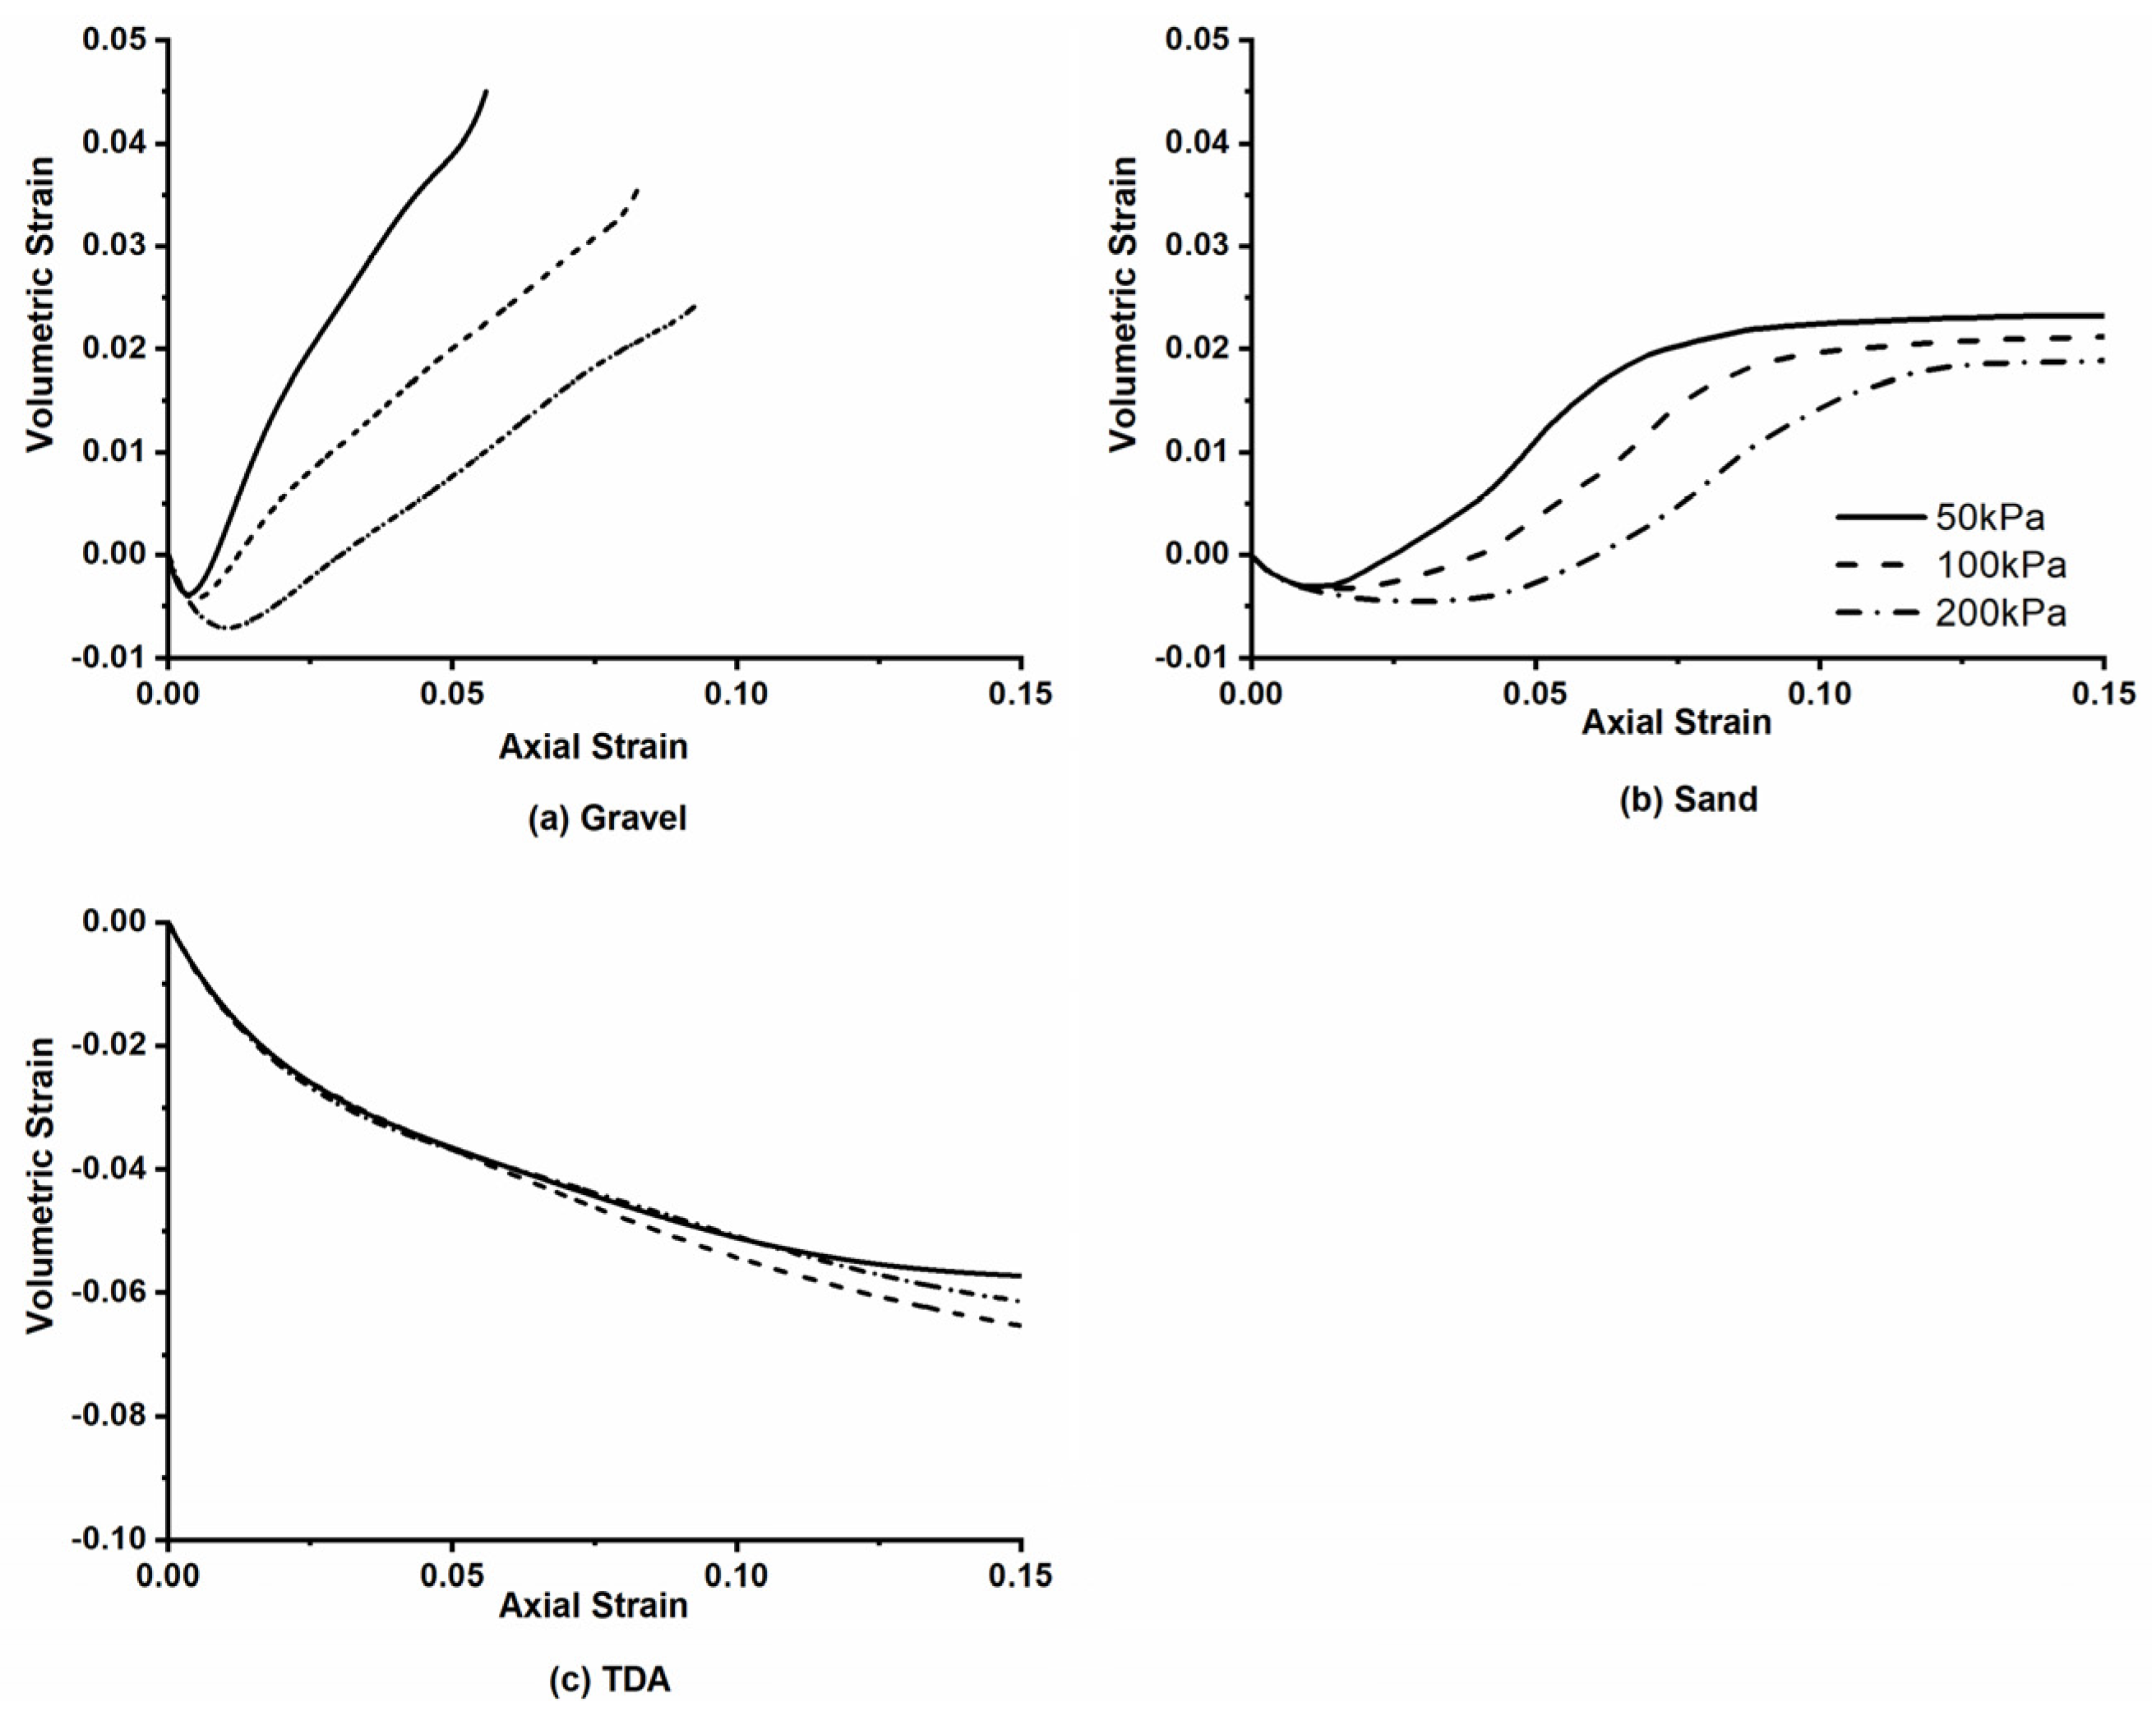
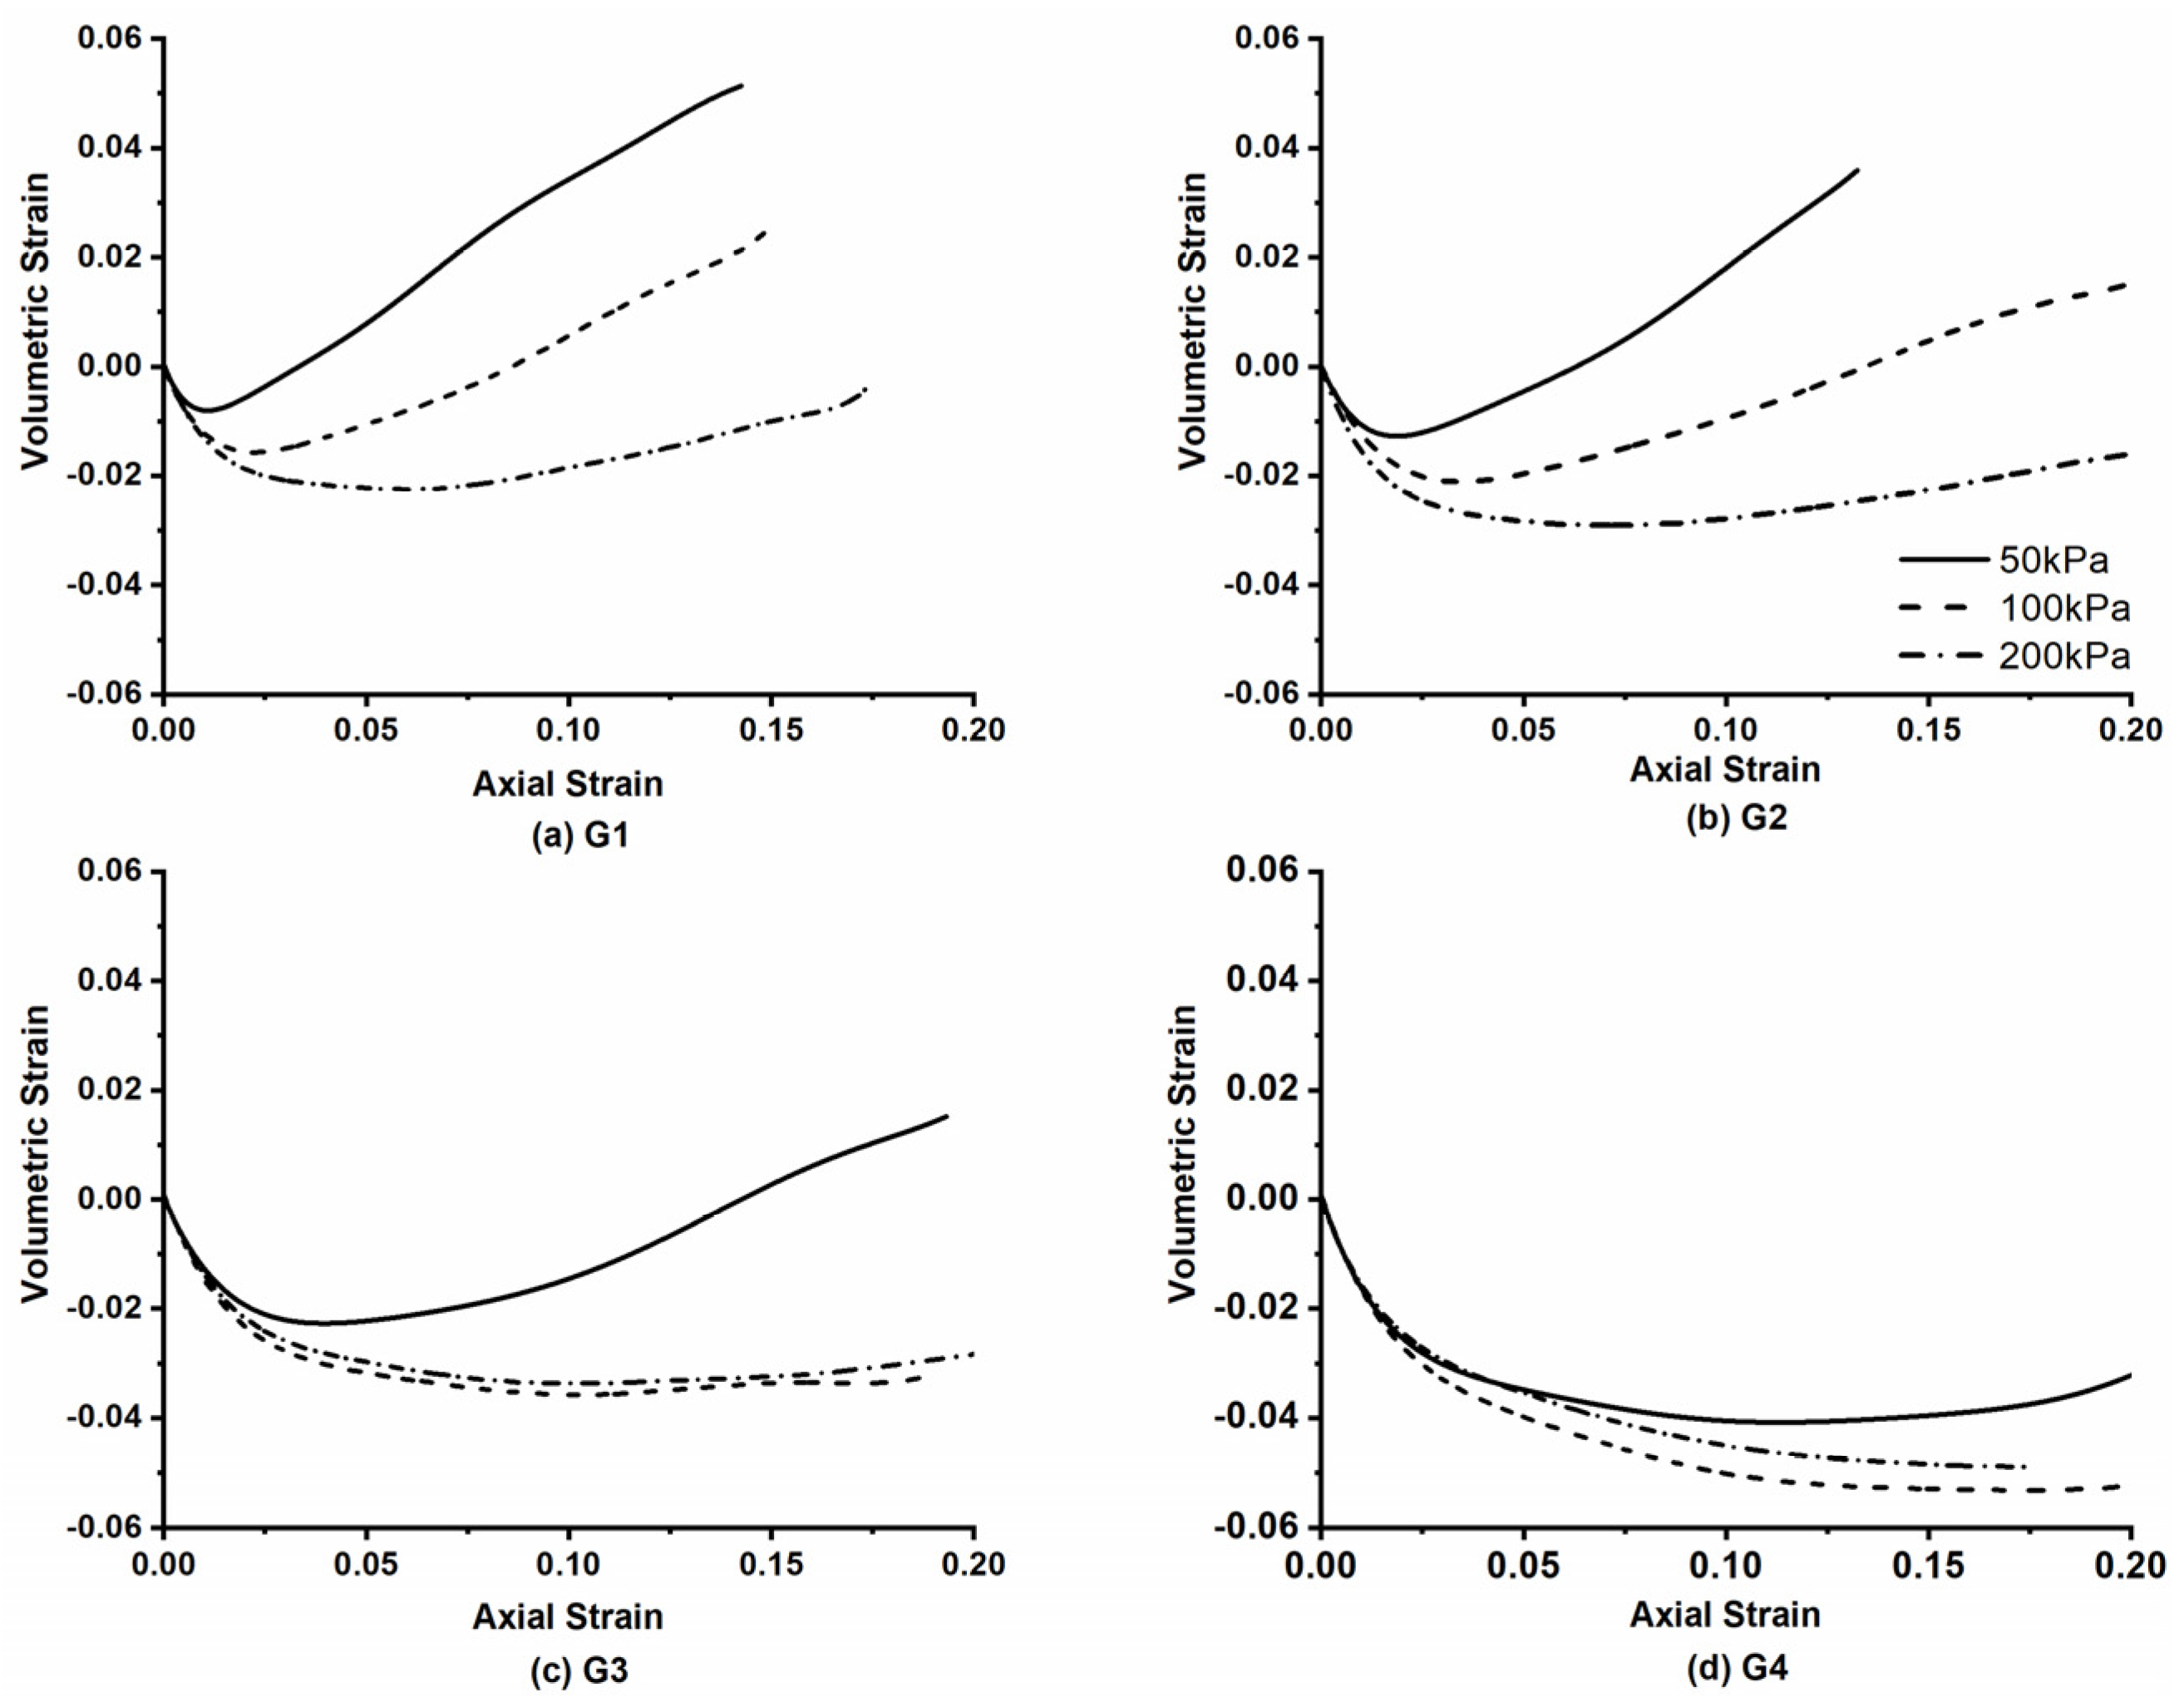
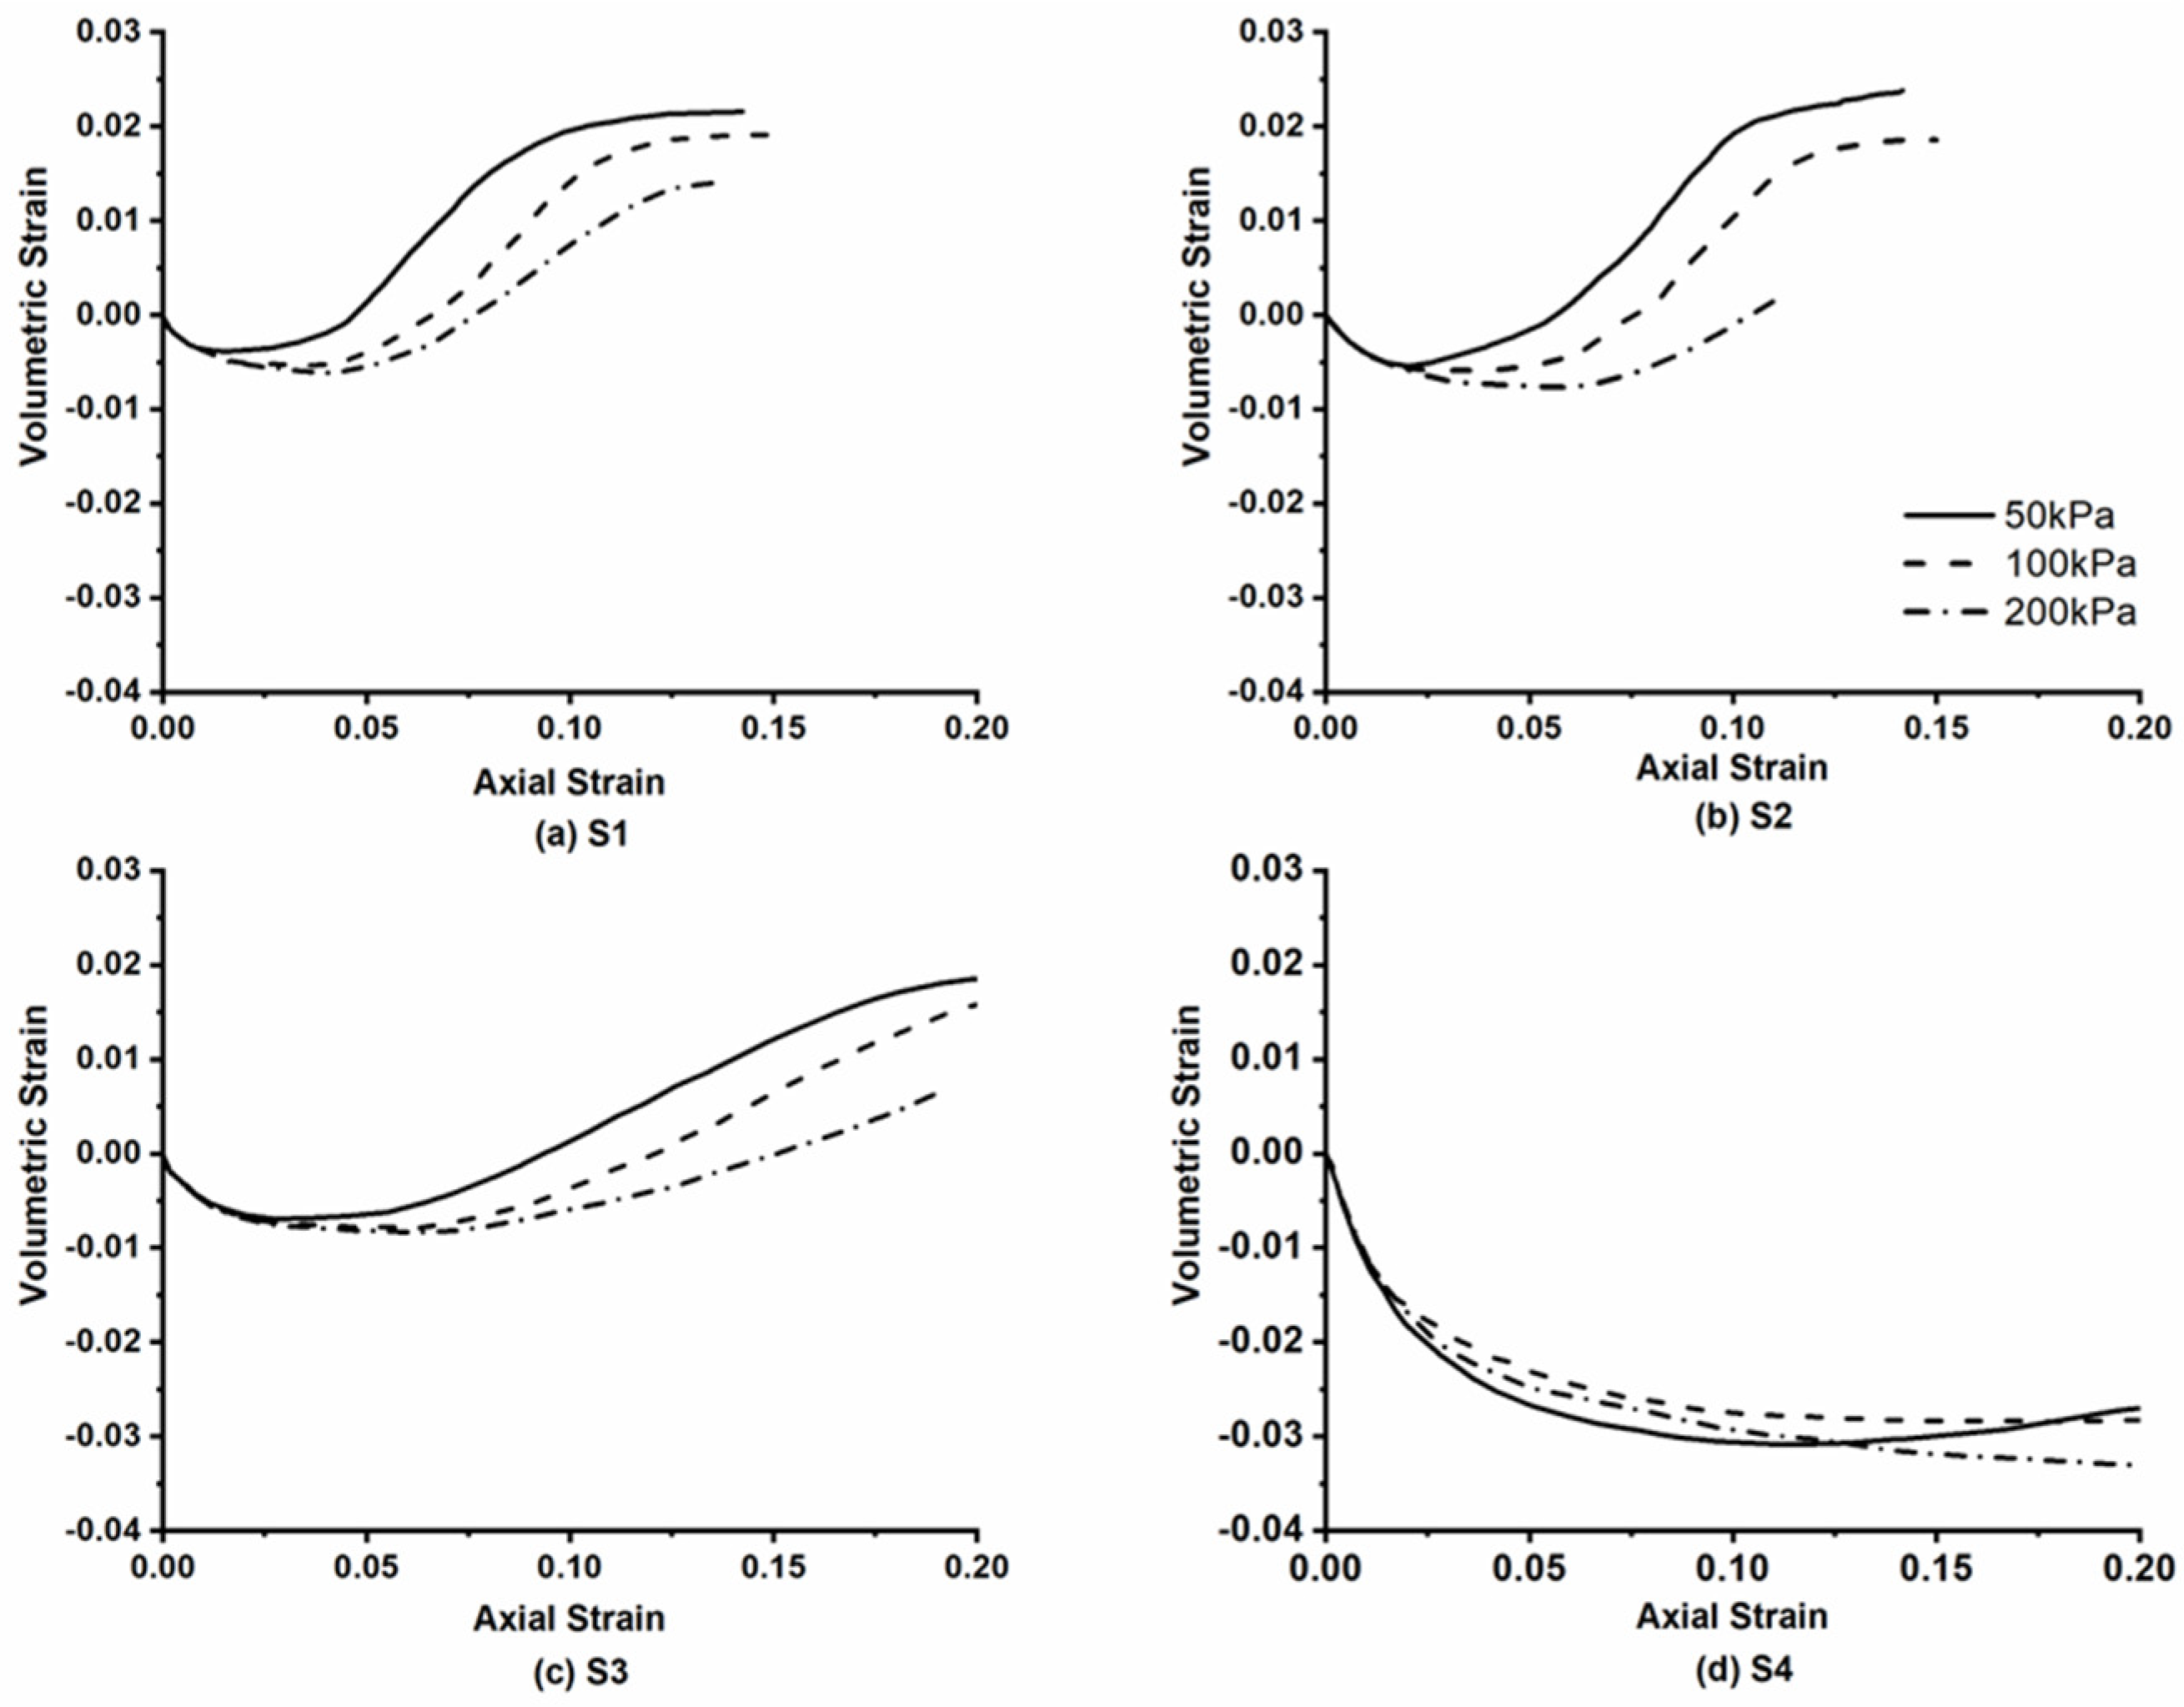
3.1. Volumetric Strain

As explained above, for each specimen composition, three tests were conducted at different confining pressures. During the tests, volume changes of the samples were recorded, which were subsequently used to calculate the volumetric strain of the samples. Figure 4 shows the volumetric strain versus axial strain for pure samples of the gravel, sand, and TDA used in this study at confining pressures of 50 kPa, 100 kPa, and 200 kPa. In Figure 4a,b, it can be seen that the volumetric strain behavior of the natural aggregates, gravel and sand, was initially contractive, followed by shear dilation. In contrast, the pure TDA samples exhibited contractive behavior under all the confining pressures applied, as shown in Figure 4c. Figure 5 shows the volumetric strain versus axial strain of the four TDA-gravel mixtures at confining pressures of 50 kPa, 100 kPa, and 200 kPa. It can be seen that the volumetric strain of mixtures with lower percentages of TDA resembles the volumetric strain of gravel. However, as the percentage of TDA increases, this resemblance is less evident. In addition, in the samples with lower percentages of TDA, the influence of the confining pressure on the volumetric strain is more noticeable, but as the percentage of TDA increases, this influence diminishes. This can be seen particularly in the G4 samples, with 30% TDA by weight as shown in Figure 5d. The volumetric strain of the TDA-sand mixtures exhibits the same trend as that of the TDA-gravel mixtures. Figure 6 shows the volumetric strain versus axial strain for the four TDA-sand mixtures at confining pressures of 50 kPa, 100 kPa, and 200 kPa.

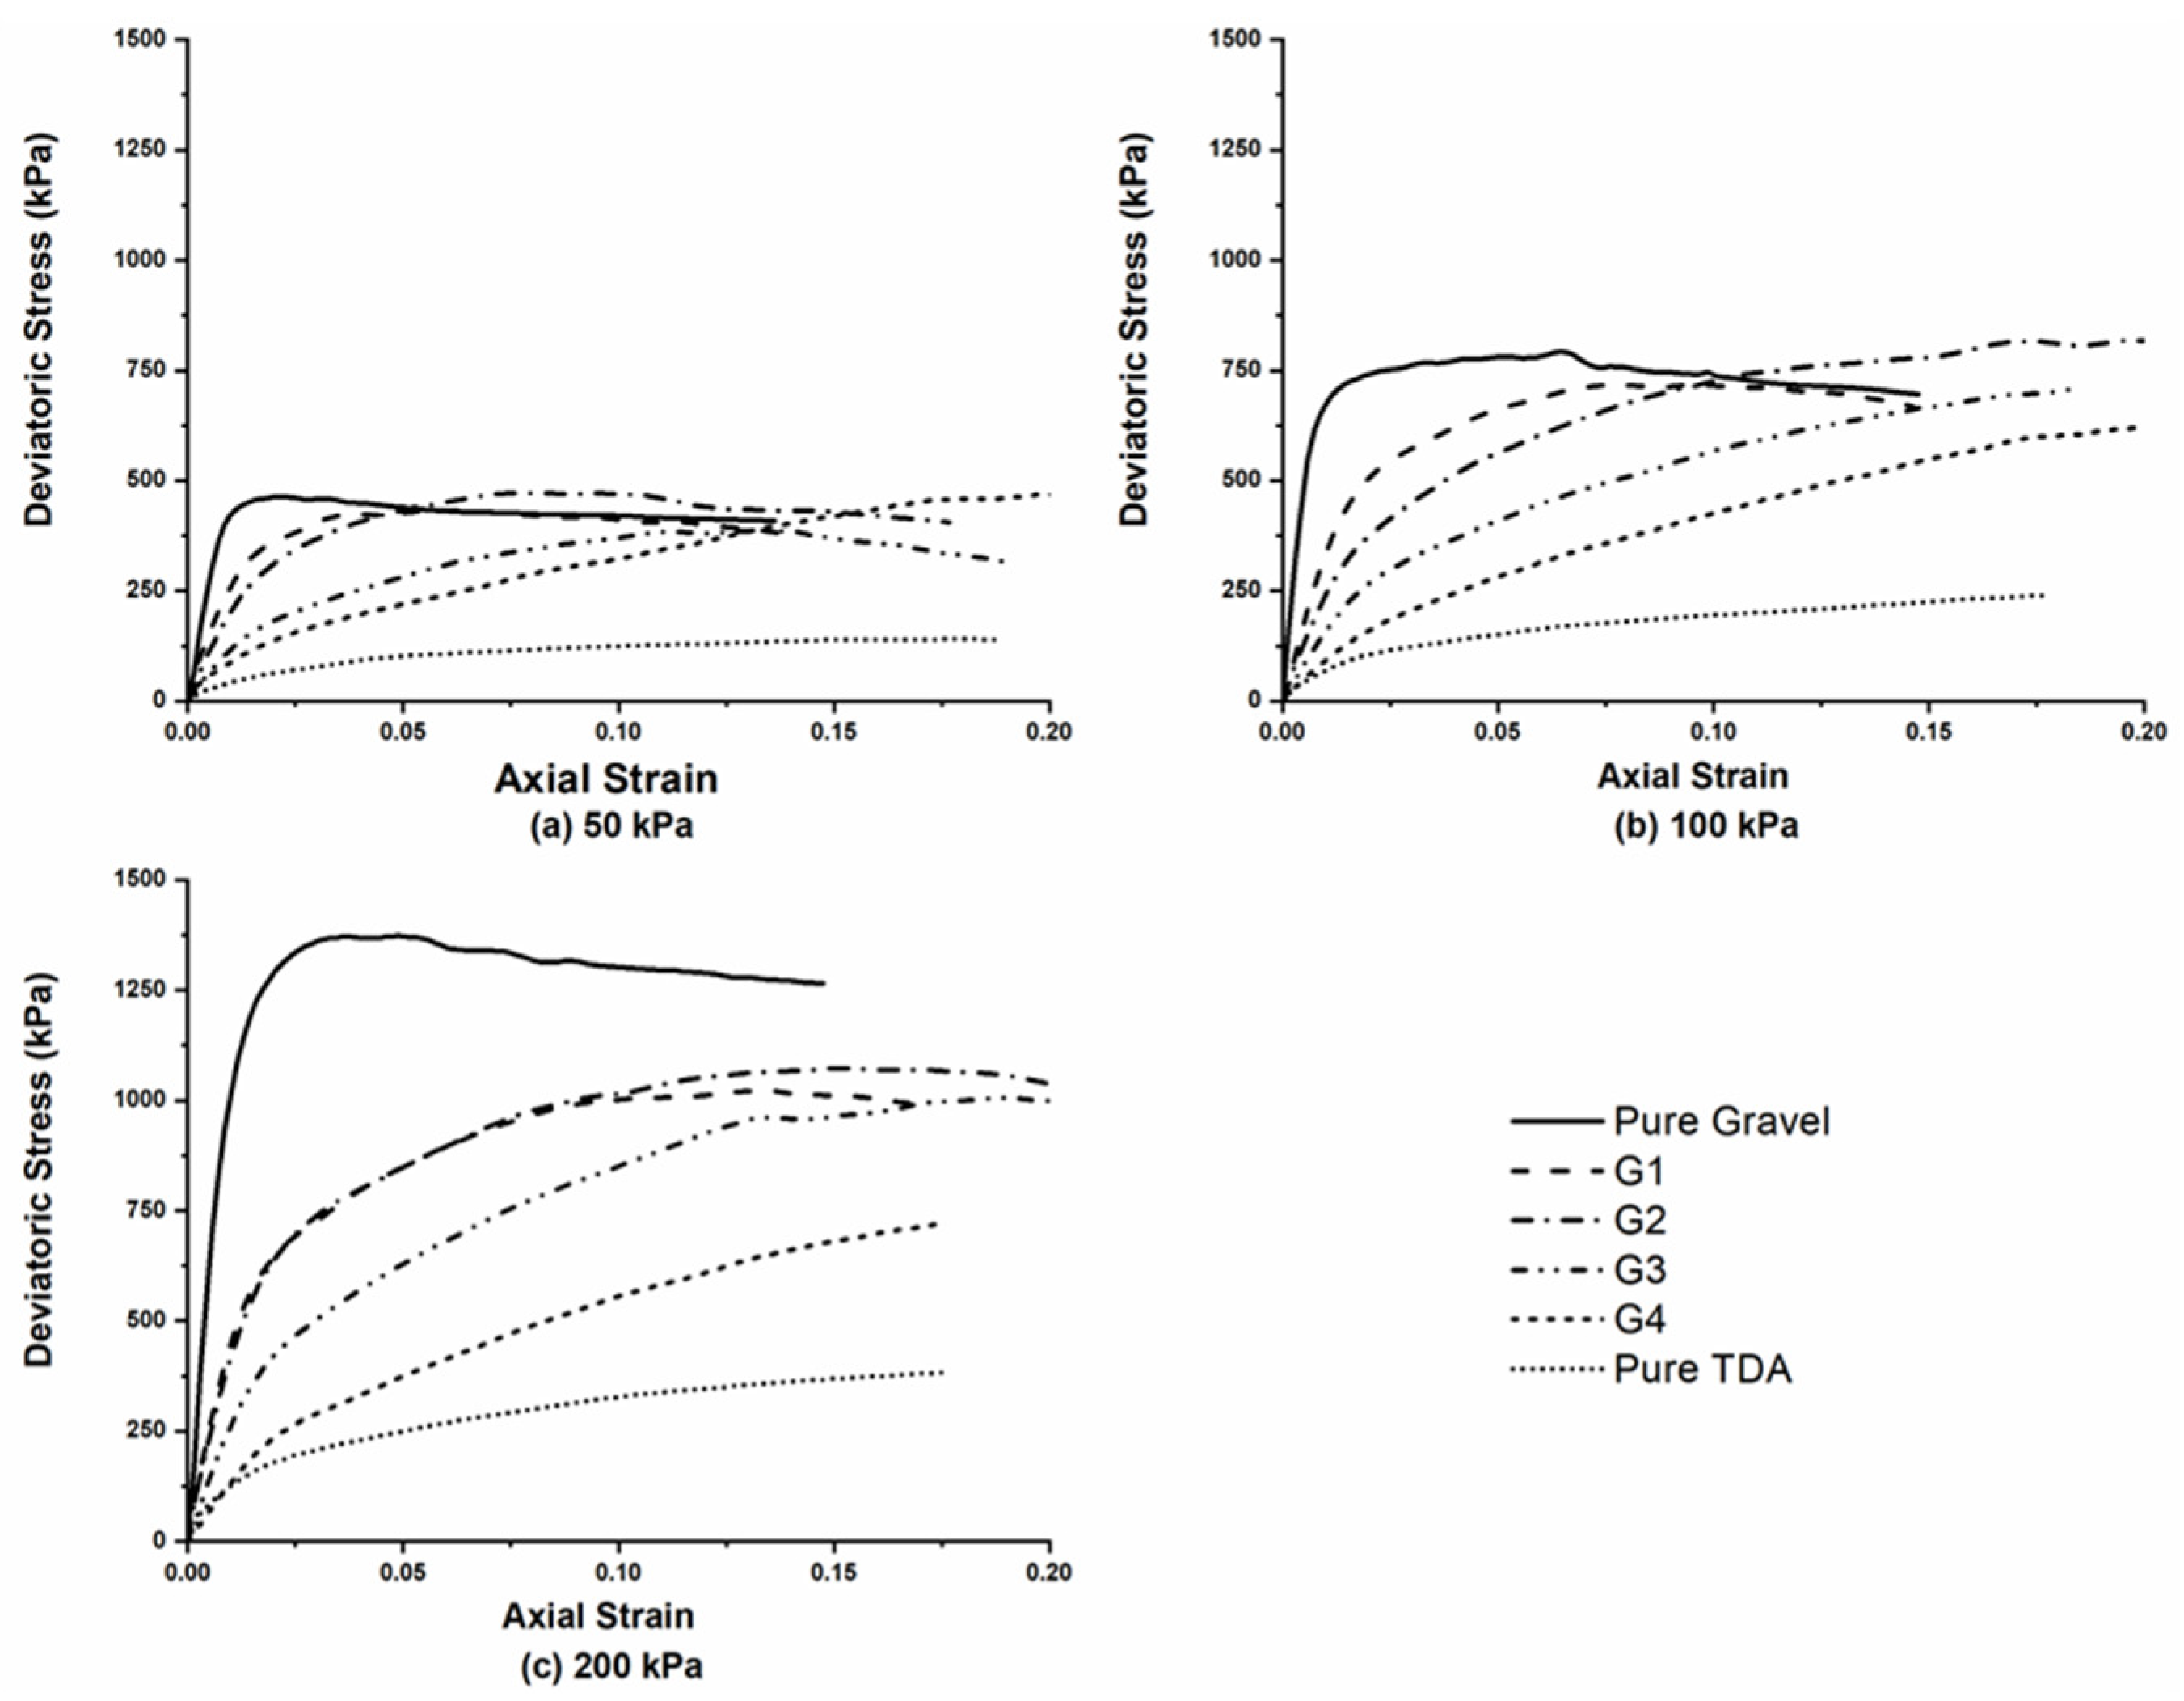
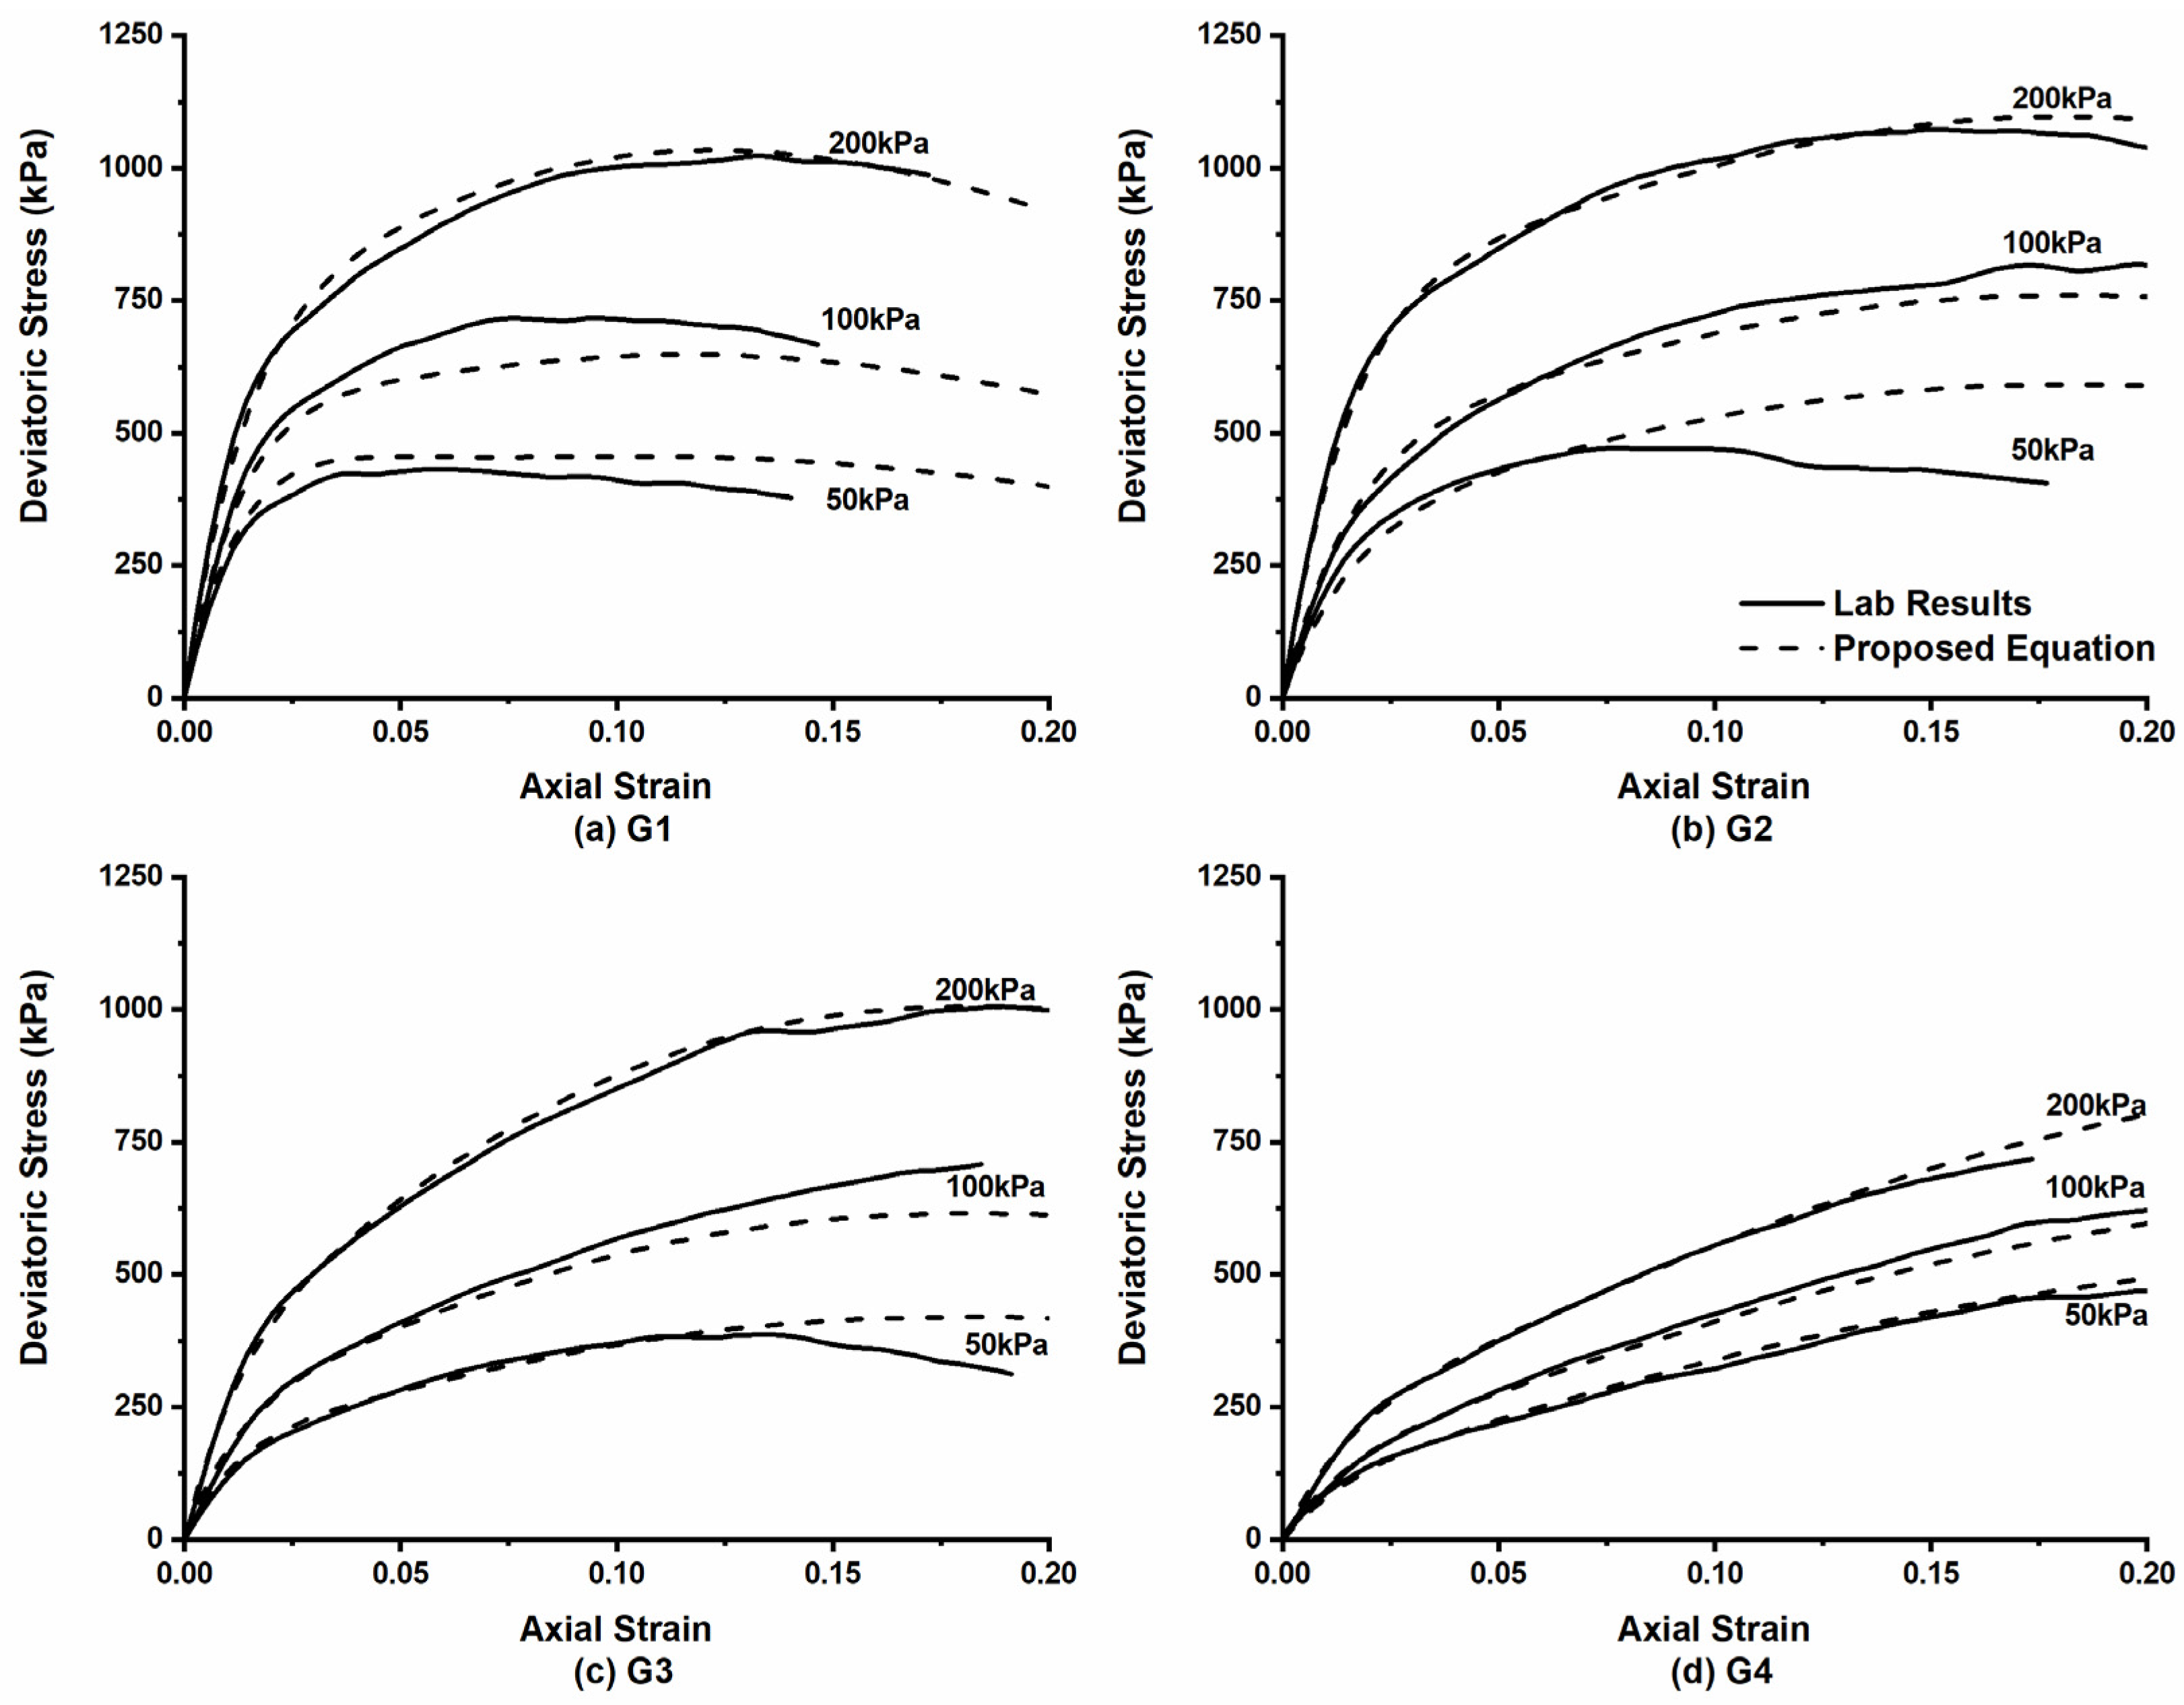
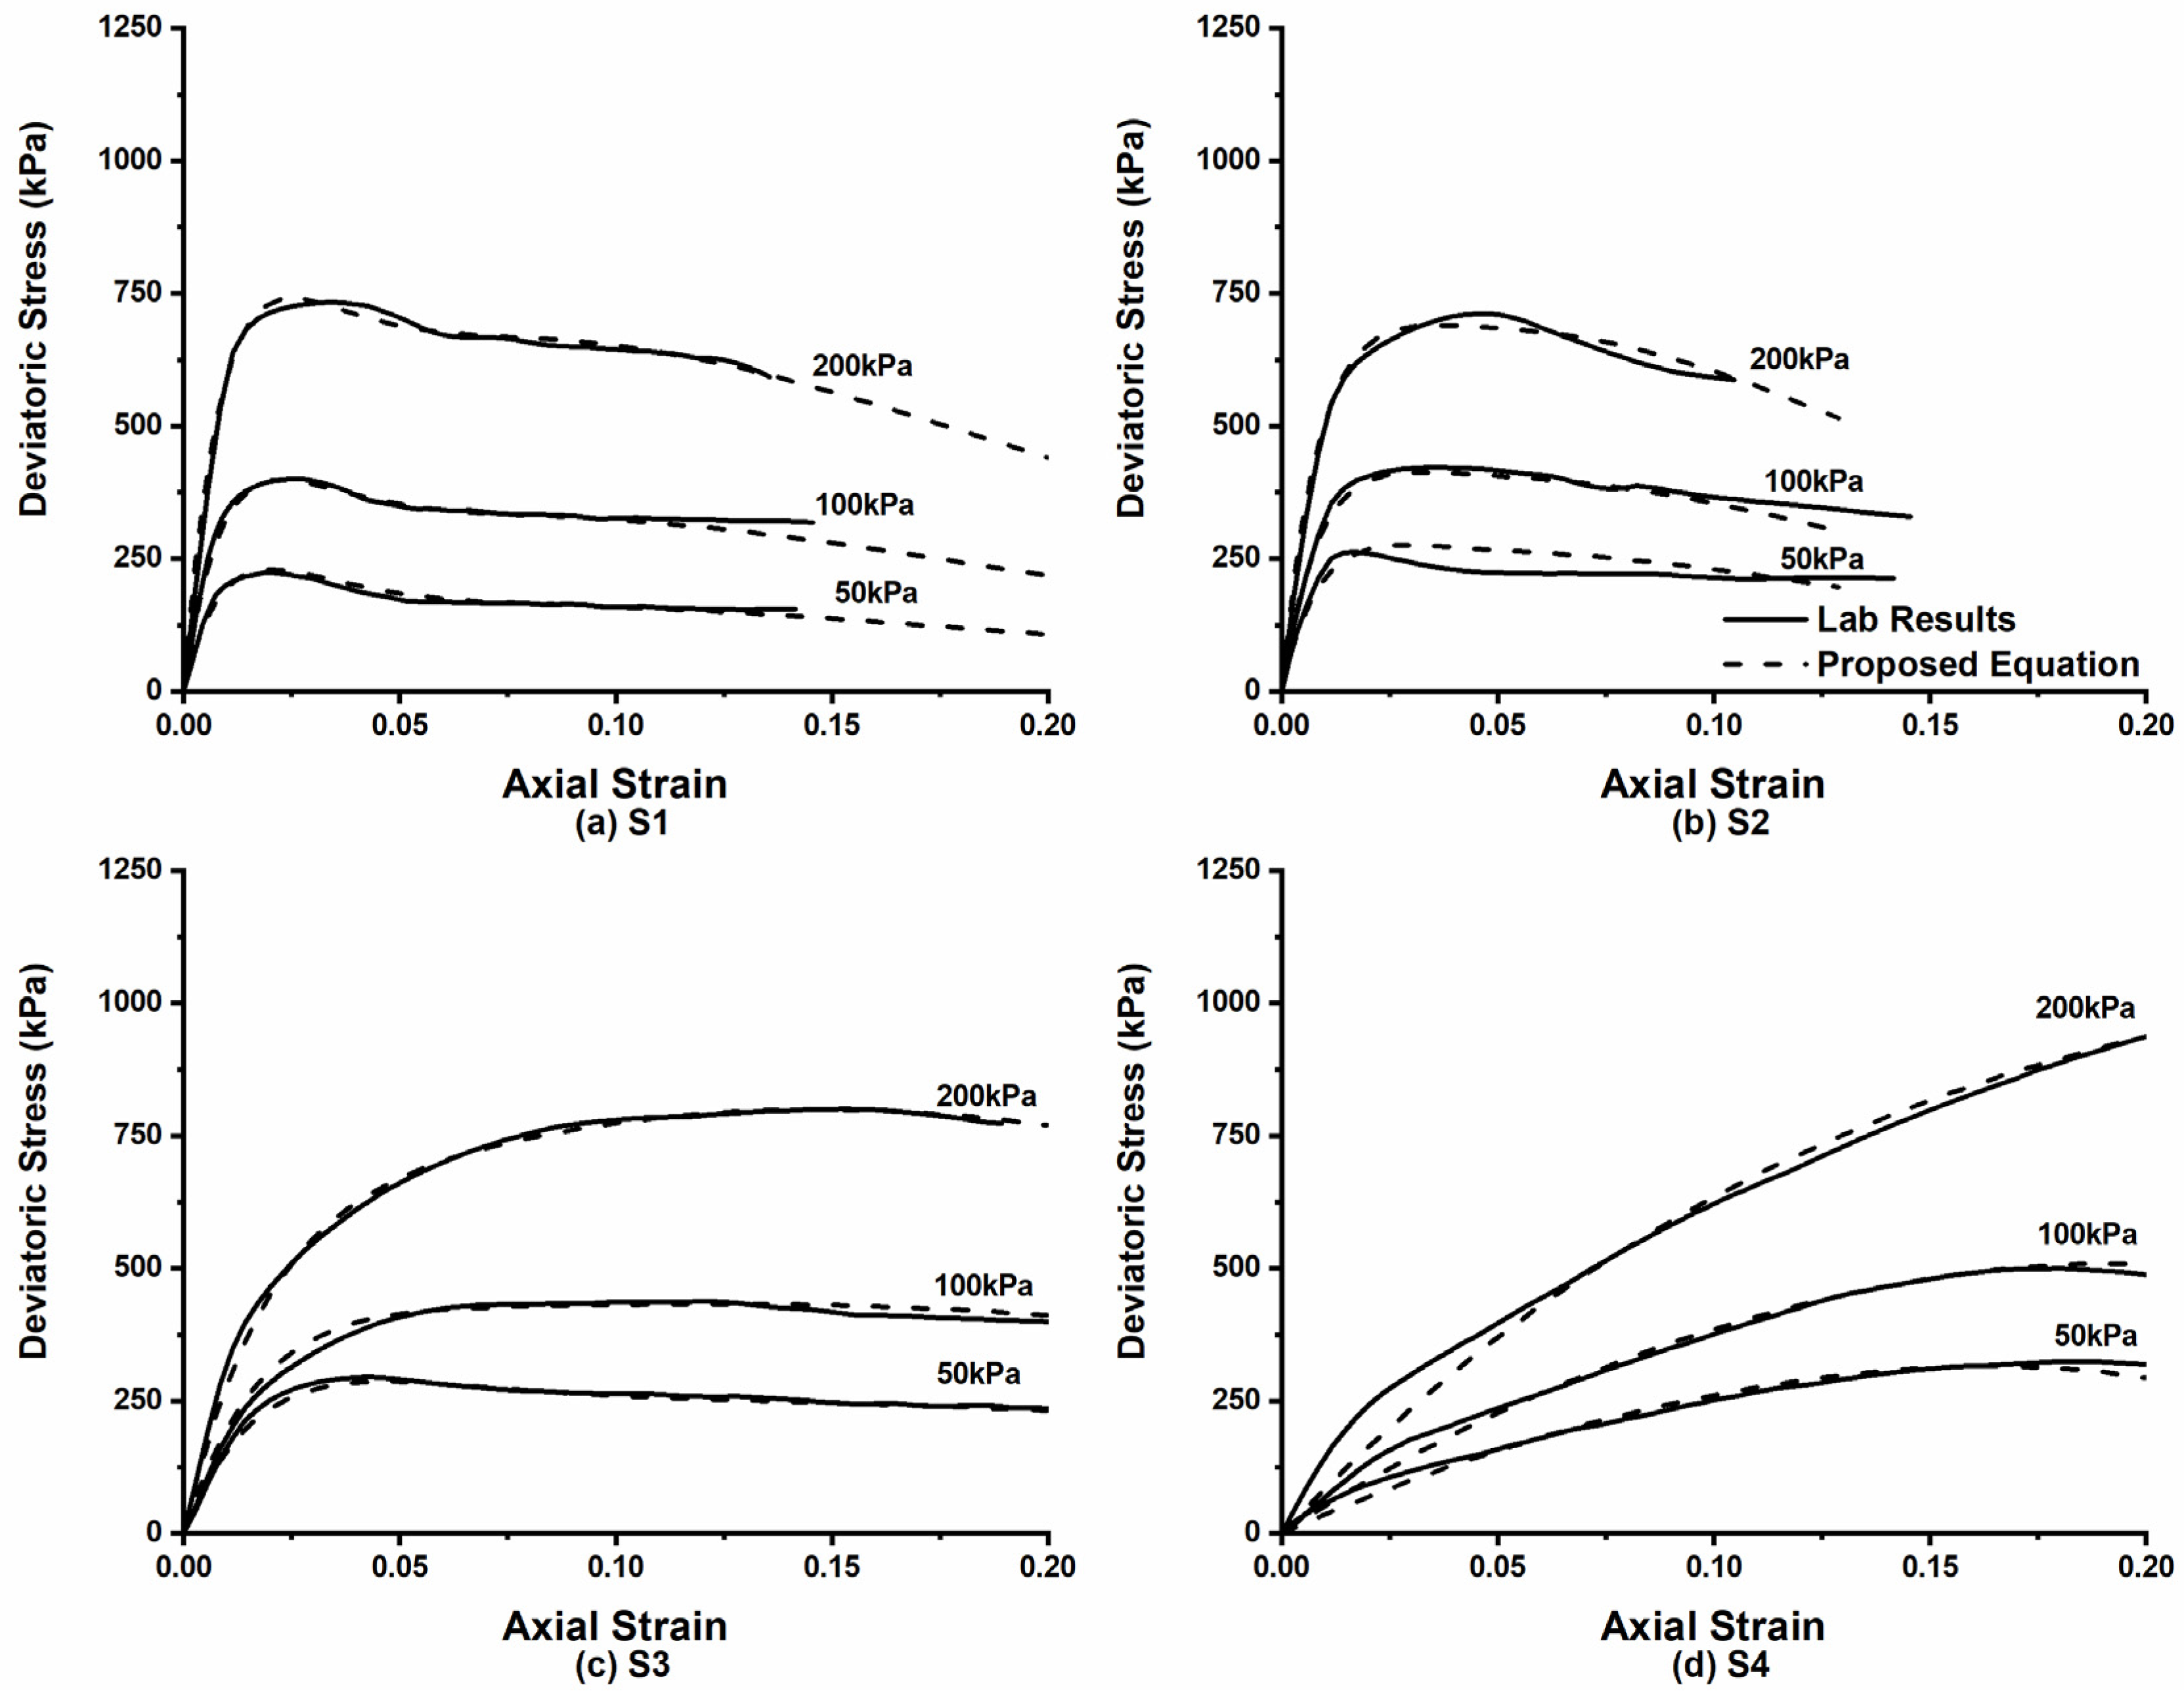
3.2. Deviatoric Stress Versus Axial Strain

Deviatoric stress versus axial strain results are plotted in Figure 7 and Figure 8 for the TDA-gravel and TDA-sand mixtures, respectively. Figure 7 shows that adding TDA to gravel does not increase the peak deviatoric stress of the mixture. For mixture G2, with 10% TDA by weight, especially at the lower confining pressures of 50 kPa and 100 kPa, the maximum deviatoric stress is comparable to the deviatoric stress of pure gravel. This could prove to be significant for many applications, since the dry density of G2 is 17% lower than the dry density of pure gravel. In contrast, adding TDA to sand results in a promising increase in the maximum deviatoric stress. This increase is more substantial at the lower confining pressures of 50 kPa and 100 kPa, where mixture S3, with 30% TDA by weight, exhibits the greatest increase. Since the dry density of S3 is 9% lower, as in the case of gravel, this could prove advantageous for many civil engineering applications. It is also noteworthy that adding as little as 10% TDA by weight to gravel can shift the peak deviatoric stress to strains greater than 0.1; however, this effect is less noticeable for sand. The S2 TDA-sand mixture, with 10% TDA by weight, shows a peak deviatoric stress at strains less than or equal to 0.05. These differences in the behavior of gravel and sand mixtures can be attributed to the different particle sizes of gravel and sand. Sand, with a smaller particle size, can efficiently fill the voids in TDA-sand mixtures, which causes the behavior of sand mixtures to be closer to that of pure sand, especially in mixtures with lower percentages of TDA by weight. In contrast, the larger particle sizes of gravel result in more voids in TDA-gravel mixtures, which explains why the behavior of TDA-gravel mixtures resembles that of loose soil. Voids in TDA-gravel mixtures can be expected even with very low percentages of TDA. The TDA-gravel mixture G1, with 5% TDA by weight, had a dry density almost 14% lower than that of pure gravel. In contrast, the results for TDA-sand mixture S1, with 5% TDA by weight, showed that adding 5% TDA to sand reduced the dry density by less than 1%. In TDA-gravel mixtures as well as TDA-sand mixtures, it was found that increasing the percentage of TDA results in a decrease in the initial slope of the deviatoric stress curves. This affects stiffness characteristics, as discussed later in this paper.
In order to obtain an empirical equation that can predict the results of laboratory studies conducted on samples of TDA mixed with gravel or sand, regression analysis was used to fit various curves to the deviatoric stress versus axial strain results found in this research. The goal was to find one simple equation to fit all the results presented in this study, with a high coefficient of determination (R2). The following equation, with two exponential terms, was found to be the best match for the results while maintaining simplicity:
σ d e v . ε , σ 3 = ε a σ 3 + b e f ε c σ 3 + d e g ε
where ε is the axial strain and σ 3   is the confining pressure (measured in kPa). The values of a , b , c , d , f , and g for each mixture can be determined by using the set of equations below (Equations (3)–(14)).
For TDA-gravel mixtures:
a = 4370.64 w 3 3731.1 w 2 + 843.7 w 2.698
b = 14 , 250 , 688 w 3 + 8 , 189 , 137 1 , 434 , 942 w + 81 , 997
c = 74 , 877 w 3 + 42 , 152 w 2 6455 w + 146
d = 1 , 869 , 599 w 3 + 970 , 442 w 2 131 , 612 w 866.2
f = 46 , 132 w 3 24 , 865 w 2 + 3772 w 180
g = 32 , 010 w 3 + 17 , 647 w 2 2716 w + 88
For TDA-sand mixtures:
a = 6635 w 3 5514 w 2 + 947.7 w + 54.73
b = 403 , 287 w 3 + 76 , 910 w 2 + 85 , 326 w 5820
c = 10 , 848 w 3 12 , 148 w 2 + 4431 w 587.8
d = 2 , 063 , 723 w 3 + 1 , 683 , 432 w 2 315 , 557 w + 1118
f = 2295 w 3 1348 w 2 + 115.8 w 13.19
g = 7053 w 3 + 5605 w 2 929.4 w 29.34
where w is the ratio of the weight of the TDA to the weight of the sample (i.e., the TDA content of the sample). Figure 9 and Figure 10 compare the results obtained in the laboratory with the results of Equation (2). As can be seen in the figures, there is strong agreement between the results generated by the equation and the results obtained in the laboratory.

3.3. Strength Parameters
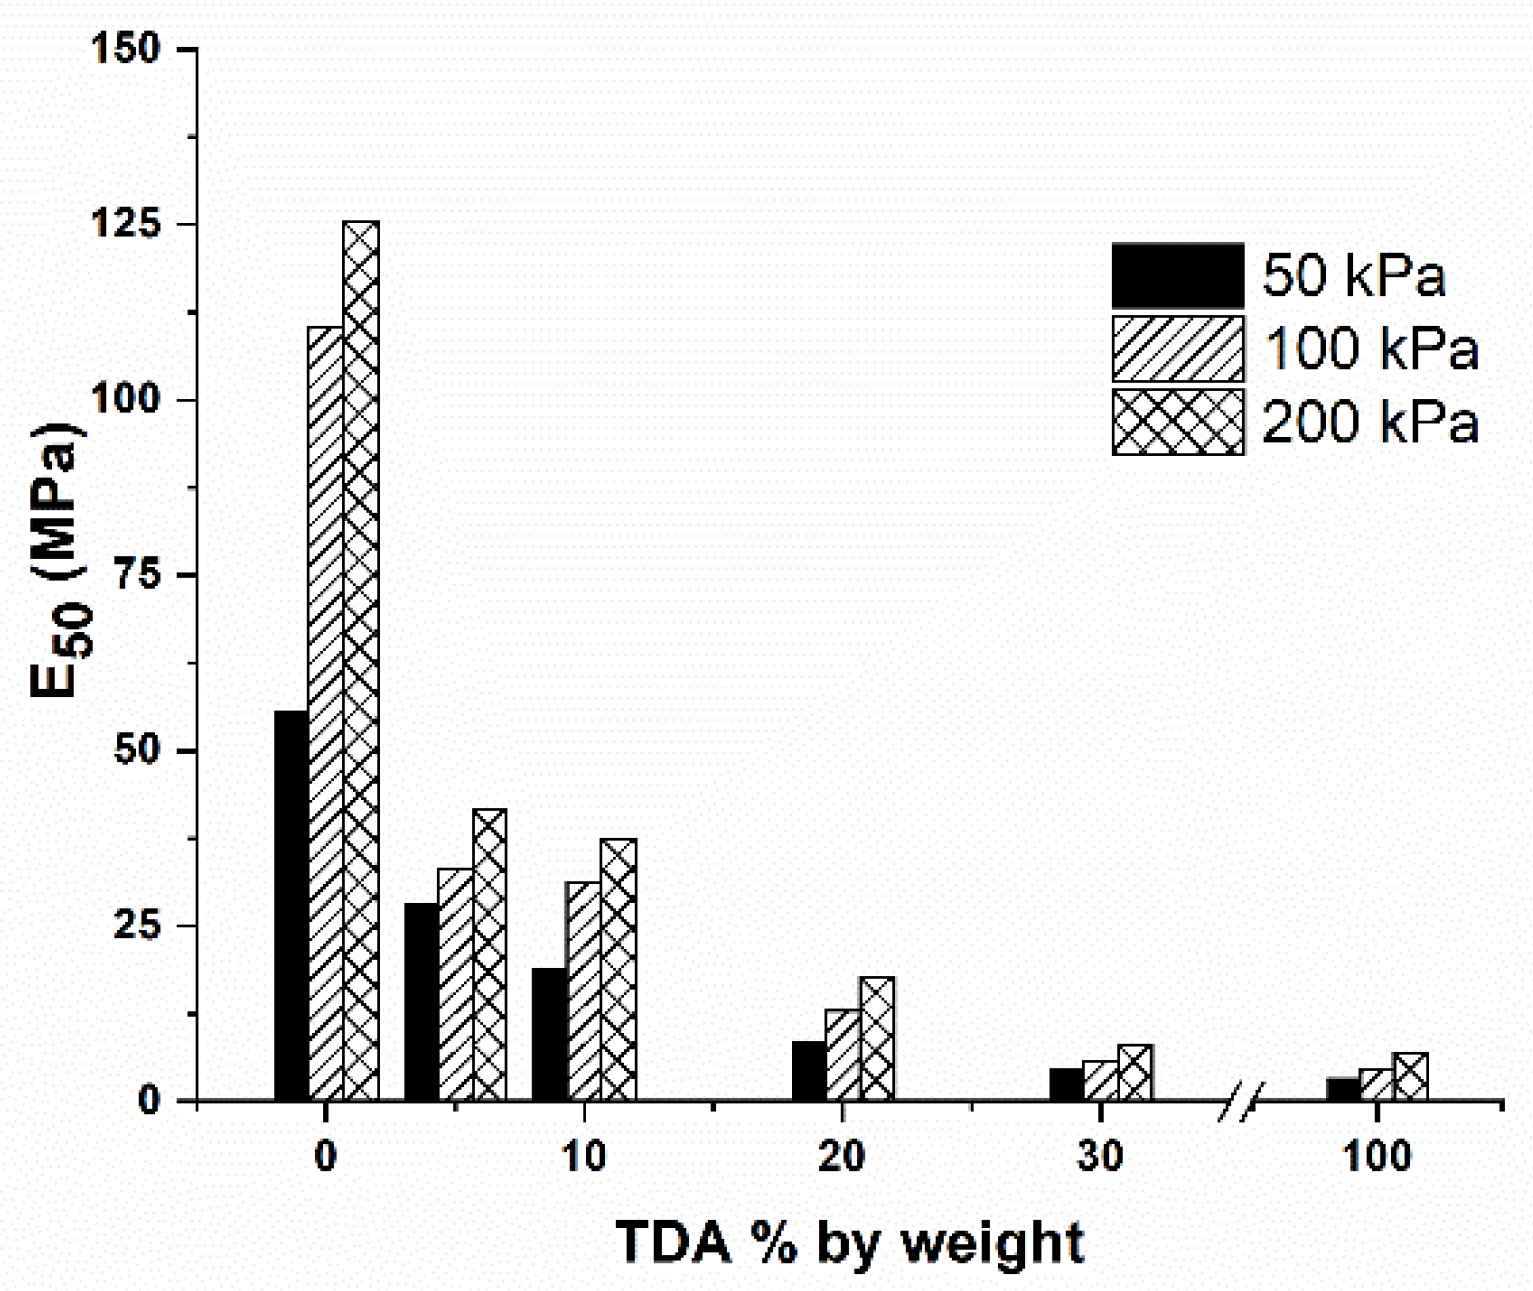
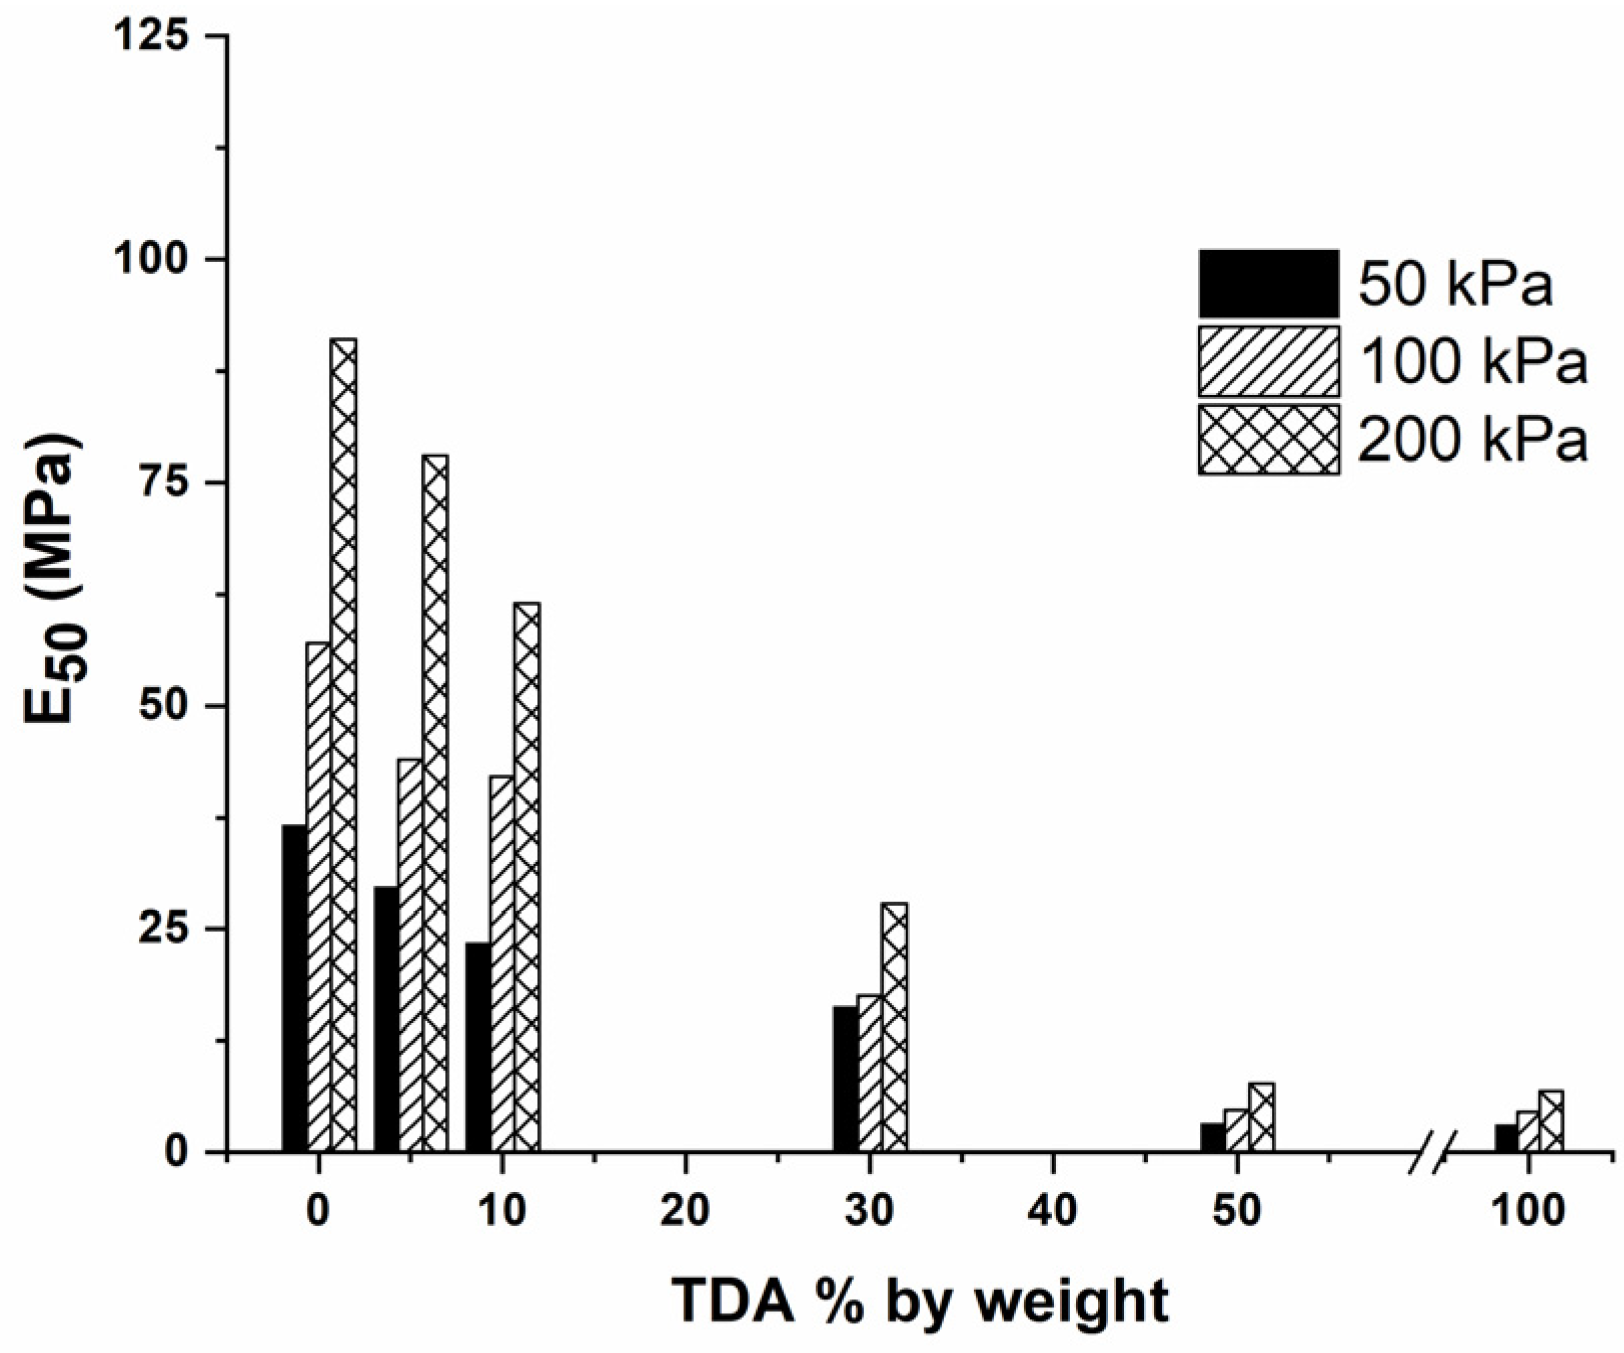
Table 1 presents the cohesion and internal friction angle values for all the samples tested in this research. In cases where the test did not yield a conclusive peak for the deviatoric stress, in accordance with ASTM D7181-11, the stress at 15% strain was used to calculate the cohesion and internal friction angle values. To select the most suitable material for their designs, designers usually consider a combination of factors such as availability, strength parameters, dry density, stiffness, and cost. Although pure TDA has a lower strength and stiffness than pure sand or pure gravel, the lower density of TDA can make pure TDA a better choice for some applications, e.g., use as a backfilling material for embankments on soft soils. TDA-sand and TDA-gravel mixtures also share these advantages. As the percentage of TDA increases in TDA-sand mixtures, the internal friction angle remains constant, but the cohesion increases and the dry density decreases. These properties make TDA-sand mixtures a better backfilling material in many applications. The same cannot be said for mixtures of gravel and TDA. The internal friction angle of pure gravel is greater than that of TDA-gravel mixtures. However, as shown in Figure 7, in comparison to the G1 and G2 mixtures, pure gravel has a similar maximum deviatoric stress at confining pressures of 50 kPa and 100 kPa, and a lower maximum deviatoric stress at a confining pressure of 200 kPa. The lower dry density of the G1 and G2 mixtures, combined with the comparable performance at lower confining pressures, makes them a good alternative to pure gravel for shallow backfilling layers, which are often required.

3.4. Stiffness

To compare the stiffness of the different mixtures studied, values of E50 (the secant modulus) were calculated for each mixture, as shown in Figure 11 and Figure 12. From these figures it can be seen that adding TDA to gravel or sand decreases the secant modulus. This decrease is more significant in TDA-gravel mixtures. For example, adding small percentages of TDA to gravel has a great effect on the secant modulus, resulting in an average 65% decrease in the E50 with the addition of 5% TDA by weight. The effect is less noticeable when the same percentage of TDA is added to sand, resulting in an average 18% decrease in the E50 with the addition of 5% TDA by weight. This difference in the behavior of the TDA-gravel and TDA-sand mixtures may be related to the different particle sizes of gravel and sand. With a smaller particle size, sand can efficiently fill the voids in the mixture, which makes the behavior of sand mixtures closer to that of pure sand. In contrast, the larger particle size of gravel makes it difficult for gravel particles to fill the voids. This is evident in the sharp decrease in dry density when TDA is added to gravel. The addition of 5% TDA by weight to pure gravel decreases the dry density by almost 14%. In contrast, if 5% TDA by weight is added to pure sand, the dry density is reduced by less than 1%. The fact that additional empty voids can be filled during axial loading decreases the stiffness of the samples.

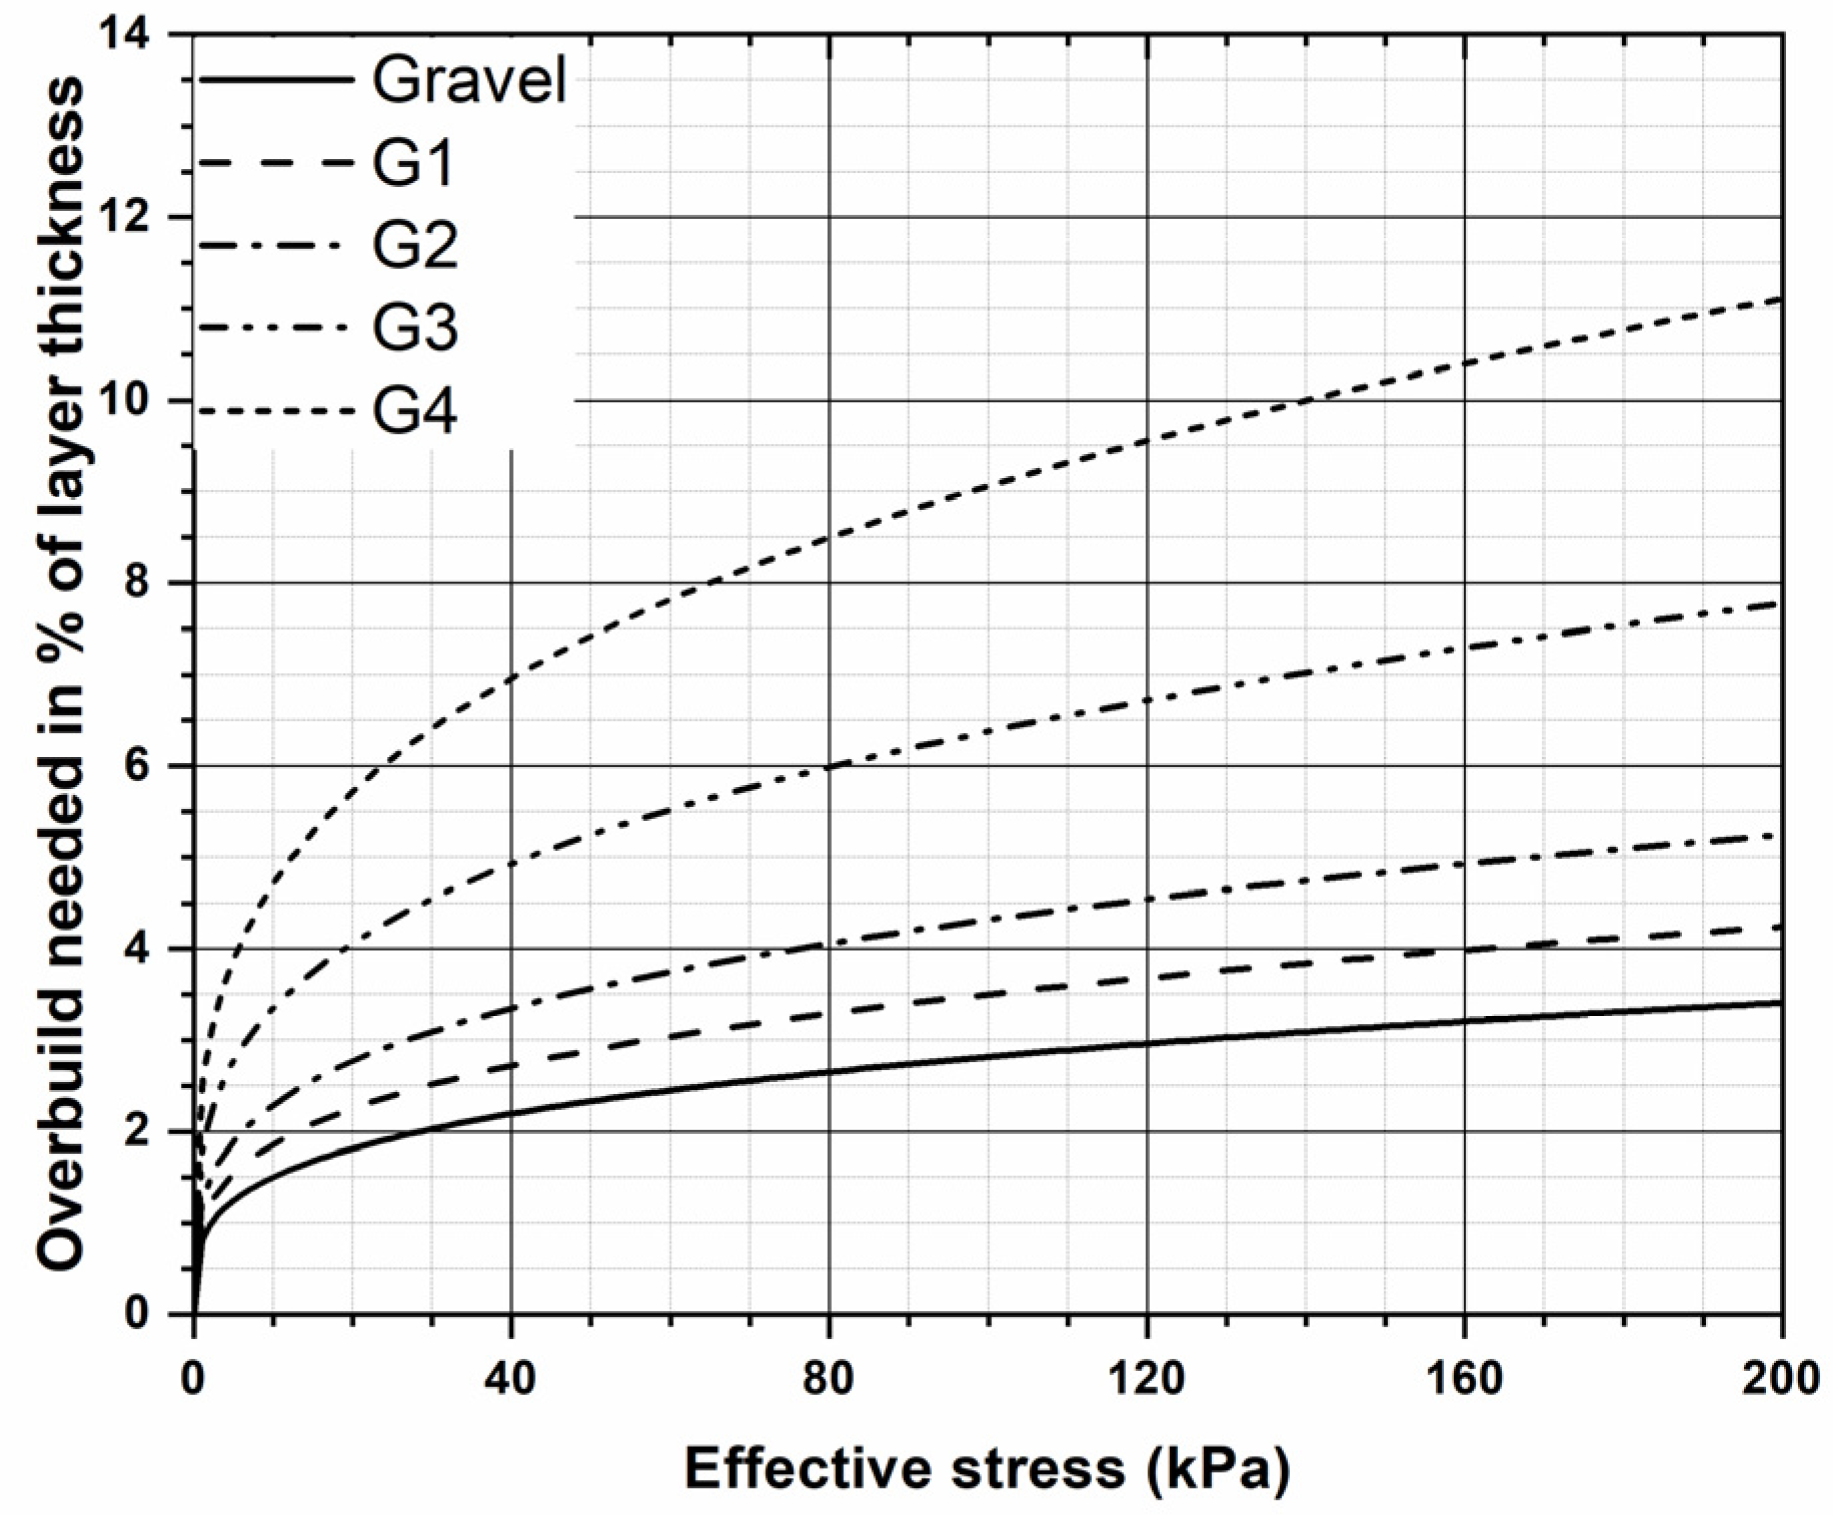
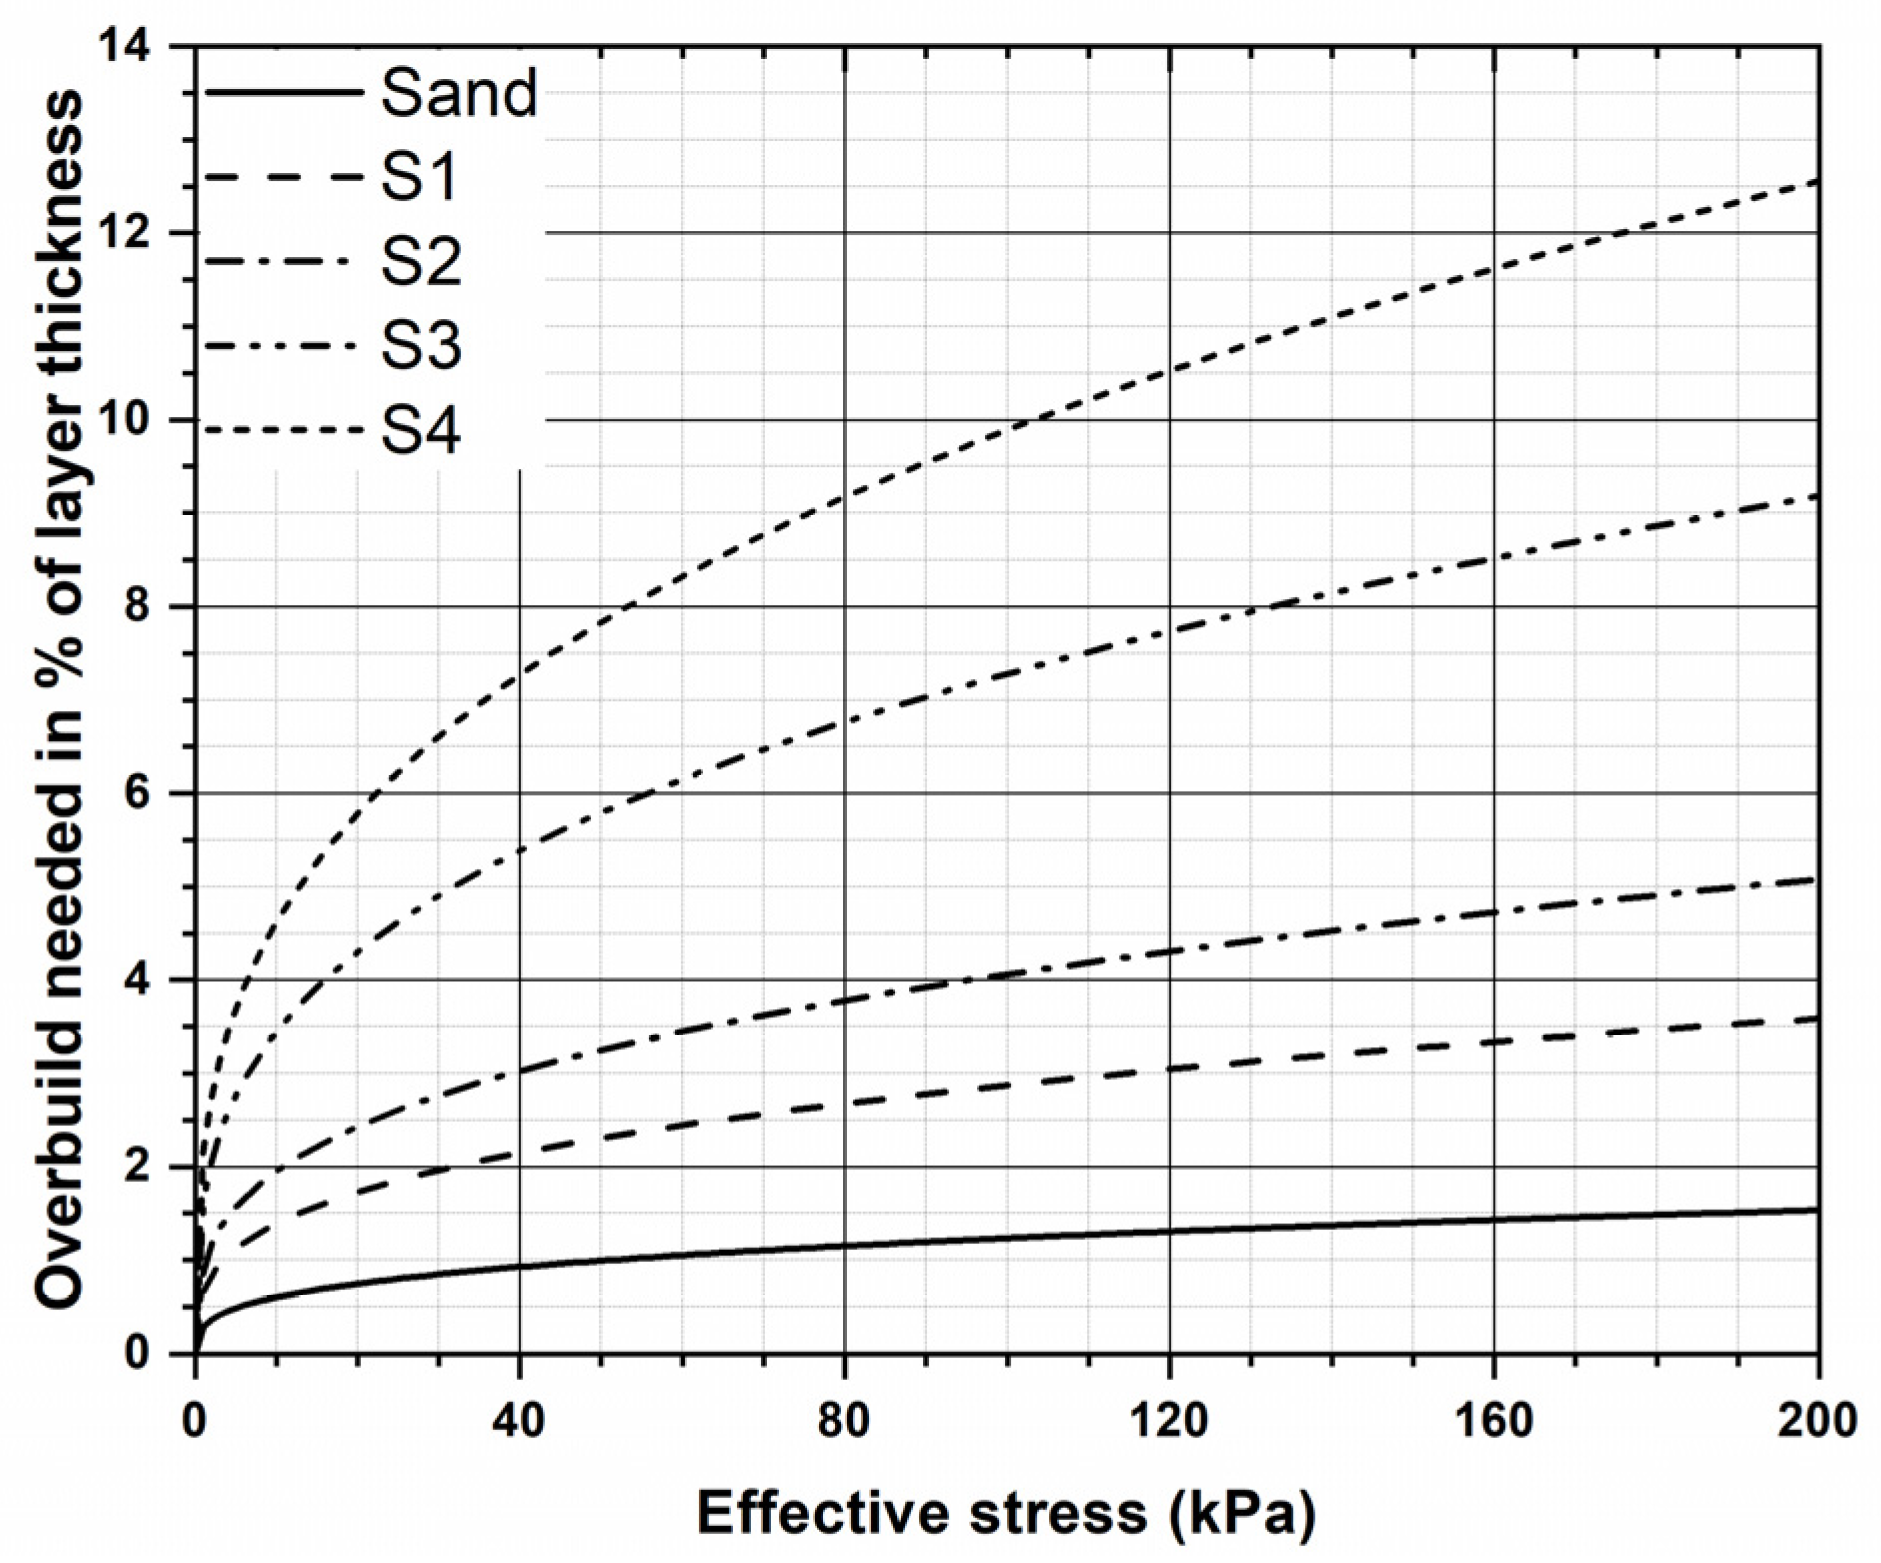
3.5. Overbuild Guidelines

The amount of overbuild required to achieve a desired layer thickness in the field was calculated by using the laboratory results and is presented in the equation below. In this calculation, the volume change occurring in a layer of TDA-soil mixture buried beneath the surface was assumed to be equal to the volume change occurring during the consolidation stage of the triaxial test. Hence:
O v e r b u i l d = T D A m i x t u r e l a y e r t h i c k n e s s × V P 100 V P
where VP is the percentage volume change presented in Equation (1). Thus, for TDA-gravel mixtures, the VP value in Equation (15) can be calculated by using:
V P = 4.928 25.04 w + 0.07253 σ e w + 96.8 w 2
Similarly, the VP value for TDA-sand mixtures can be calculated by using:
V P = 0.5737 + 25.72 w + 0.05448 σ e w 30.27 w 2
Figure 13 and Figure 14 show the percentage overbuild required to achieve a desired layer thickness for each mixture. If the effective stress applied to the centre of the fill layer and the percentage TDA by weight are known, the amount of overbuild required can be determined from Figure 13 and Figure 14 for TDA-gravel mixtures and TDA-sand mixtures, respectively.

4. Conclusions

In this study, triaxial tests were performed on TDA-sand and TDA-gravel mixtures containing different amounts of TDA. The sand and gravel in the TDA-soil mixtures represented fine and coarse aggregates, respectively. The gravel used in this study complied with the Nova Scotia Transportation and Public Works standard specification for type 1 gravel. The sand used in the experiment was a poorly graded sand, in accordance with ASTM D2487-11. The TDA used was type A TDA, in accordance with ASTM D6270-08. Type A TDA is the size typically used in most civil engineering projects. Sample sets were prepared with different percentages of TDA. Each sample set was tested at three different confining pressures, and results for the volumetric strain and deviatoric stress versus axial strain were obtained and depicted. In addition, the cohesion, internal friction angle, and stiffness values for each sample set are presented. Finally, empirical equations are proposed to match the laboratory results. The results presented in this paper confirm the versatility of the TDA-sand and TDA-gravel mixtures to be used in various civil engineering applications, especially when a lighter-weight backfilling material is required for embankments over weak soils. Based on the results of the testing program, the following conclusions can be drawn:
(1)
As the percentage of TDA increases, the volumetric strain behavior of the mixtures shifts from resembling soil to resembling TDA.
(2)
As the percentage of TDA increases, the deviatoric stress versus axial strain curves of the mixtures also shift from resembling soil to resembling TDA.
(3)
The addition of a small percentage of TDA to sand results in a minimal change in the dry density. In contrast, the addition of a small percentage of TDA to gravel results in a sharp decrease in the dry density.
(4)
Similarly, the addition of a small percentage of TDA to gravel has a more significant effect on the strength parameters and stiffness than is the case when a small percentage of TDA is added to the sand.

Author Contributions

Conceptualization, H.E.N.; Data curation, M.A.; Investigation, H.E.N. and M.A.; Supervision, H.E.N.; Writing—original draft, M.A. and H.E.N.; Writing—review & editing, M.A. and H.E.N. All authors have read and agreed to the published version of the manuscript.

Funding

This research was funded by The Natural Sciences and Engineering Research Council of Canada (NSERC) and Divert NS grant to the first author.

Data Availability Statement

All data, models, and code generated or used during the study appear in the submitted article.

Acknowledgments

The authors acknowledge funding provided by the Natural Sciences and Engineering Research Council of Canada (NSERC) and Divert NS for this research project. They are also grateful for the support and generosity of Halifax C & D Recycling Ltd. (HCD).

Conflicts of Interest

The authors declare that they have no known competing financial interests or personal relationships that could have appeared to influence the work reported in this paper.

References

  1. Rubber Manufacturers Association. 2015 U.S. Scrap Tire Management Summary U.S. Scrap Tire Disposition 2015; U.S. Tire Manufacturers Association: Washington, DC, USA, 2016; pp. 1–19.
  2. Zalando Corp. Annual Report 2016; Zalando Corp.: Berlin, Germany, 2016; p. 175. [Google Scholar]
  3. Ashari, M.; El Naggar, H.; Martins, Y. Evaluation of the physical properties of TDA-sand mixtures. In Proceedings of the GeoOttawa, the 70th Canadian Geotechnical Conference Ottawa, Ottawa, CA, Canada, 1–4 October 2017; Canadian Geotechnical Society: Surrey, BC, Canada, 2017. [Google Scholar]
  4. Edinçliler, A.; Baykal, G.; Saygili, A. Influence of different processing techniques on the mechanical properties of used tires in embankment construction. Waste Manag. 2010, 30, 1073–1080. [Google Scholar] [CrossRef]
  5. El Naggar, H.; Ashari, M.; Mahgoub, A. Development of an Empirical Hyperbolic Material Model for TDA Using Large Scale Triaxial Testing. Int. J. Geotech. Eng. 2022, 16, 133–142. [Google Scholar] [CrossRef]
  6. Zahran, K.; El Naggar, H. Effect of Sample Size on TDA Shear Strength Parameters in Direct Shear Tests. Transp. Res. Rec. 2020, 2674, 1110–1119. [Google Scholar] [CrossRef]
  7. Manion, W.P.; Humphrey, D.N. Use of Tire Chips as Lightweight and Conventional Embankment Fill, Phase I—Laboratory; Technical Paper 91-1; Technical Services Division, Maine Department of Transportation: Augusta, ME, USA, 1992; p. 151.
  8. Fathali, M.; Nejad, F.M.; Esmaeili, M. Influence of tire-derived aggregates on the properties of railway ballast material. J. Mater. Civ. Eng. 2017, 29, 04016177. [Google Scholar] [CrossRef]
  9. Tehrani, F.M.; Nazari, M.; Truong, D.; Farshidpour, R. Sustainability of tire-derived aggregate concrete: A case study on energy, emissions, economy, and ENVISION. In International Conference on Sustainable Infrastructure 2019: Leading Resilient Communities through the 21st Century; American Society of Civil Engineers: Reston, VA, USA, 2019; pp. 399–408. [Google Scholar]
  10. Ahn, I.S.; Cheng, L.; Fox, P.J.; Wright, J.; Patenaude, S.; Fujii, B. Material properties of large-size tire derived aggregate for civil engineering applications. J. Mater. Civ. Eng. 2015, 27, 04014258. [Google Scholar] [CrossRef]
  11. Wartman, J.; Natale, M.F.; Strenk, P.M. Immediate and time dependent compression of tire derived aggregate. J. Geotech. Geoenvironmental Eng. 2007, 133, 245–256. [Google Scholar] [CrossRef] [Green Version]
  12. Humphrey, D.N.; Sandford, T.C.; Cribbs, M.M.; Manion, W.P. Shear strength and compressibility of tire chips for use as retaining wall backfill. Transp. Res. Rec. 1993, 29–35. [Google Scholar]
  13. Humphrey, D.N.; Sandford, T.C.; Cribbs, M.M.; Gharegrat, H.G.; Manion, W.P. Tire Chips as Light-Weight Backfill for Retaining Walls—Phase I. A Study for the New England Transportation Consortium; Department of Civil and Environmental Engineering, University of Maine: Orono, ME, USA, 1992. [Google Scholar]
  14. El Naggar, H.; Ali, I. Evaluation of the Shear Strength Behavior of TDA Mixed with Fine and Coarse Aggregates for Backfilling around Buried Structures. Sustainability 2021, 13, 5087. [Google Scholar] [CrossRef]
  15. El Naggar, H.; Khaled, Z.; Ahmed, M. Effect of the Particle Size on the TDA Shear Strength and Stiffness Parameters in Large-Scale Direct Shear Tests. Geotechnics 2021, 1, 1. [Google Scholar] [CrossRef]
  16. Sparkes, J.; El Naggar, H.; Valsangkar, A. Compressibility and Shear Strength Properties of Tire-Derived Aggregate Mixed with Lightweight Aggregate. ASCE J. Pipeline Syst. Eng. Pract. 2019, 10, 04018034. [Google Scholar] [CrossRef]
  17. Tatlisoz, N.; Edil, T.B.; Benson, C.H. Interaction between Reinforcing Geosynthetics and Soil-Tire Chip Mixtures. J. Geotech. Geoenvironmental Eng. 1998, 124, 1109–1119. [Google Scholar] [CrossRef]
  18. Mahgoub, A.; El Naggar, H. Using TDA as an Engineered Stress-Reduction Fill over Pre-existing Buried Pipes. ASCE J. Pipeline Syst. Eng. Pract. 2019, 10, 04018034. [Google Scholar] [CrossRef]
  19. Mahgoub, A.; El Naggar, H. Using TDA underneath shallow foundations: Simplified design procedure. Int. J. Geotech. Eng. 2022, 16, 787–801. [Google Scholar] [CrossRef]
  20. Mahgoub, A.; El Naggar, H. Innovative application of tire-derived aggregate around corrugated steel plate culverts. J. Pipeline Syst. Eng. Pract. 2020, 11, 04020025. [Google Scholar] [CrossRef]
  21. Mahgoub, A.; El Naggar, H. Coupled TDA–Geocell Stress-Bridging System for Buried Corrugated Metal Pipes. J. Geotech. Geoenvironmental Eng. 2020, 146, 04020052. [Google Scholar] [CrossRef]
  22. Mahgoub, A.; El Naggar, H. Using TDA Underneath Shallow Foundations: Field Tests and Numerical Modelling. J. Comput. Geotech. 2020, 126, 103761. [Google Scholar] [CrossRef]
  23. Abdo, A.M.A.; El Naggar, H. Evaluation of the Incorporation of Tire-Derived Aggregates (TDA) in Rigid Pavement Mix Designs. Sustainability 2022, 14, 11775. [Google Scholar] [CrossRef]
  24. Mills, B.; El Naggar, H.; Valsangkar, A.J. North American overview and Canadian perspective on the use of tire derived aggregate in highway embankment construction. Ground Improv. Case Hist. 2015, 2, 635–655. [Google Scholar]
  25. Feng, Z.Y.; Sutter, K.G. Dynamic Properties of Granulated Rubber/Sand Mixtures. Geotech. Test. J. 2000, 23, 338–344. [Google Scholar]
  26. Mccartney, J.; Ghaaowd, I.; Fox, P.; Sanders, M.; Thielmann, S.; Sander, A. Shearing Behavior of Tire-Derived Aggregate with Large Particle Size. II: Cyclic Simple Shear. J. Geotech. Geoenvironmental Eng. 2017, 143, 04017079. [Google Scholar] [CrossRef] [Green Version]
  27. Madhusudhan, B.R.; Boominathan, A.; Banerjee, S. Static and large-strain dynamic properties of sand-rubber tire shred mixtures. J. Mater. Civ. Eng. 2017, 29, 04017165. [Google Scholar] [CrossRef]
  28. Moussa, A.; El Naggar, H. Numerical Evaluation of Buried Wave Barriers Performance. Int. J. Geosynth. Ground Eng. 2020, 6, 56. [Google Scholar] [CrossRef]
  29. Moussa, A.; El Naggar, H. Dynamic Characterization of Tire Derived Aggregates. J. Mater. Civ. Eng. 2021, 33, 04020471. [Google Scholar] [CrossRef]
  30. Moussa, A.; El Naggar, H.; Sadrekarimi, A. Dynamic Properties of Granulated Rubber Using Different Laboratory Tests. Buildings 2021, 11, 186. [Google Scholar] [CrossRef]
  31. Moussa, A.; El Naggar, H.; Sadrekarimi, A. Dynamic Characterization of Tire Derived Aggregates Using Cyclic Simple Shear and Bender Element. Soil Dyn. Earthq. Eng. 2023, 165, 107700. [Google Scholar] [CrossRef]
  32. Foose, G.J.; Benson, C.H.; Bosscher, P.J. Sand Reinforced with Shredded Waste Tires. J. Geotech. Eng. 1996, 122, 760–767. [Google Scholar] [CrossRef]
  33. Cetin, H.; Fener, M.; Gunaydin, O. Geotechnical properties of tire-cohesive clayey soil mixtures as a fill material. Eng. Geol. 2006, 88, 110–120. [Google Scholar] [CrossRef]
  34. Bali Reddy, S.; Pradeep Kumar, D.; Murali Krishna, A. Evaluation of the Optimum Mixing Ratio of a Sand-Tire Chips Mixture for Geoengineering Applications. J. Mater. Civ. Eng. 2015, 28, 6015007. [Google Scholar] [CrossRef]
  35. El Naggar, H.; Soleimani, P.; Fakhroo, A. Strength and Stiffness Properties of Green Lightweight Fill Mixtures. Geotech. Geol. Eng. 2016, 34, 867–876. [Google Scholar] [CrossRef]
  36. Masad, E.; Taha, R.; Ho, C.; Papagiannakis, T. Engineering Properties of Tire/Soil Mixtures as a Lightweight Fill Material. Geotech. Test. J. 1996, 19, 297–304. [Google Scholar]
  37. Lee, J.H.; Salgado, R.; Bernal, A.; Lovell, C.W. Shredded Tires and Rubber-Sand as Lightweight Backfill. J. Geotech. Geoenvironmental Eng. 1999, 125, 132–141. [Google Scholar] [CrossRef]
  38. Youwai, S.; Bergado, D.T. Strength and deformation characteristics of shredded rubber tire-sand mixtures. Can. Geotech. J. 2003, 40, 254–264. [Google Scholar] [CrossRef]
  39. Zornberg, J.G.; Cabral, A.R.; Viratjandr, C. Behaviour of tire shred-sand mixtures. Can. Geotech. J. 2004, 41, 227–241. [Google Scholar] [CrossRef]
  40. ASTM C136/C136M-14; Standard Test Method for Sieve Analysis of Fine and Coarse Aggregates. ASTM International: West Conshohocken, PA, USA, 2014. [CrossRef]
  41. ASTM D2487-11; Standard Practice for Classification of Soils for Engineering Purposes (Unified Soil Classification System). ASTM International: West Conshohocken, PA, USA, 2011. [CrossRef]
  42. ASTM D6270-08; Standard Practice for Use of Scrap Tires in Civil Engineering Applications. ASTM International: West Conshohocken, PA, USA, 2012; pp. 1–22.
  43. ASTM D7181-11; Standard Test Method for Consolidated Drained Triaxial Compression Test for Soils 1. ASTM International: West Conshohocken, PA, USA, 2011; pp. 1–11.
  44. ASTM D698-12; Standard Test Methods for Laboratory Compaction Characteristics of Soil Using Standard Effort (12,400 ft-lbf/ft3 (600 kN-m/m3). ASTM International: West Conshohocken, PA, USA, 2012. [CrossRef]
  45. Kowalska, M. Compactness of scrap tyre rubber aggregates in standard proctor test. Procedia Eng. 2016, 161, 975–979. [Google Scholar] [CrossRef] [Green Version]
  46. ASTM D3999-11; Standard Test Methods for the Determination of the Modulus and Damping Properties of Soils Using the Cyclic Triaxial Apparatus. ASTM International: West Conshohocken, PA, USA, 2011. [CrossRef]
Figure 1. Particle size distributions of the samples studied.
Buildings 13 00202 g001
Figure 2. The large-scale triaxial apparatus that was used in the experiments.
Buildings 13 00202 g002
Figure 3. Optimum water content of the gravel and sand used (note discontinuity and varying scale of the y-axis).
Buildings 13 00202 g003
Figure 4. Volumetric strain versus axial strain for pure samples of the gravel, sand, and TDA used in the study at confining pressures of 50 kPa, 100 kPa, and 200 kPa.
Buildings 13 00202 g004
Figure 5. Volumetric strain versus axial strain for TDA-gravel mixtures with 5%, 10%, 20%, and 30% TDA by weight at confining pressures of 50 kPa, 100 kPa, and 200 kPa.
Buildings 13 00202 g005
Figure 6. Volumetric strain versus axial strain for TDA-sand mixtures with 5%, 10%, 30%, and 50% TDA by weight at confining pressures of 50 kPa, 100 kPa, and 200 kPa.
Buildings 13 00202 g006
Figure 7. Deviatoric stress versus axial strain for TDA-gravel samples with 0%, 5%, 10%, 20%, 30%, and 100% TDA by weight at confining pressures of 50 kPa, 100 kPa, and 200 kPa.
Buildings 13 00202 g007
Figure 8. Deviatoric stress versus axial strain for TDA-sand samples with 0%, 5%, 10%, 30%, 50%, and 100% TDA by weight at confining pressures of 50 kPa, 100 kPa, and 200 kPa.
Buildings 13 00202 g008
Figure 9. Comparison between laboratory and empirical equation results for gravel mixtures.
Buildings 13 00202 g009
Figure 10. Comparison between laboratory and empirical equation results for sand mixtures.
Buildings 13 00202 g010
Figure 11. E50 for TDA-gravel samples with 0%, 10%, 20%, 30%, and 100% TDA by weight at confining pressures of 50 kPa, 100 kPa, and 200 kPa.
Buildings 13 00202 g011
Figure 12. E50 for TDA-sand samples with 0%, 10%, 30%, 50%, and 100% TDA by weight at confining pressures of 50 kPa, 100 kPa, and 200 kPa.
Buildings 13 00202 g012
Figure 13. The percentage overbuild required for TDA-gravel mixtures with 0%, 5%, 10%, 20%, and 30% TDA by weight.
Buildings 13 00202 g013
Figure 14. The percentage overbuild required for TDA-sand mixtures with 0%, 5%, 10%, 30%, and 50% TDA by weight.
Buildings 13 00202 g014
Table 1. Composition of specimens tested.
CompositionGravel (%) by WeightSand (%) by WeightTDA (%) by WeightDry Density (kg/m3)Cohesion (kPa)Friction Angle (°)E50 * (MPa)
TDA0010071023.525.54.9
Gravel100002108-49110
G195051815624133.9
G2900101749684231.4
G3800201593514212.9
G4700301483109367.1
Sand010001717-3954.2
S10955170515.43942.4
S209010168329.73840.3
S307030156932.33916.7
S405050126136404.9
* Secant modulus at 100 kPa confinement.
Table 2. Volume change of samples during the consolidation stage.
CompositionVolume Change at Each Confining Pressure (%)
50 kPa100 kPa200 kPa
TDA13.919.425
Gravel1.62.32.7
G13.644.9
G23.94.25.6
G34.64.96.3
G47.18.710.4
Sand11.52
S11.62.22.7
S23.54.35.1
S35.76.98.3
S479.111.2
Table 3. Values of a, b, c, and d in the volume change equation.
CompositionGravelSandTDA
a6.678−5.1310
b3.4256.2380
c0.80110.29273.12
d0.2670.30970.39
Disclaimer/Publisher’s Note: The statements, opinions and data contained in all publications are solely those of the individual author(s) and contributor(s) and not of MDPI and/or the editor(s). MDPI and/or the editor(s) disclaim responsibility for any injury to people or property resulting from any ideas, methods, instructions or products referred to in the content.

