
Vector-Valued Intensity Measures Based on Spectral Shape to Predict Seismic Fragility Surfaces in Reinforced Concrete Buildings
 , , ,
, , ,  , , and
Abstract
:1. Introduction
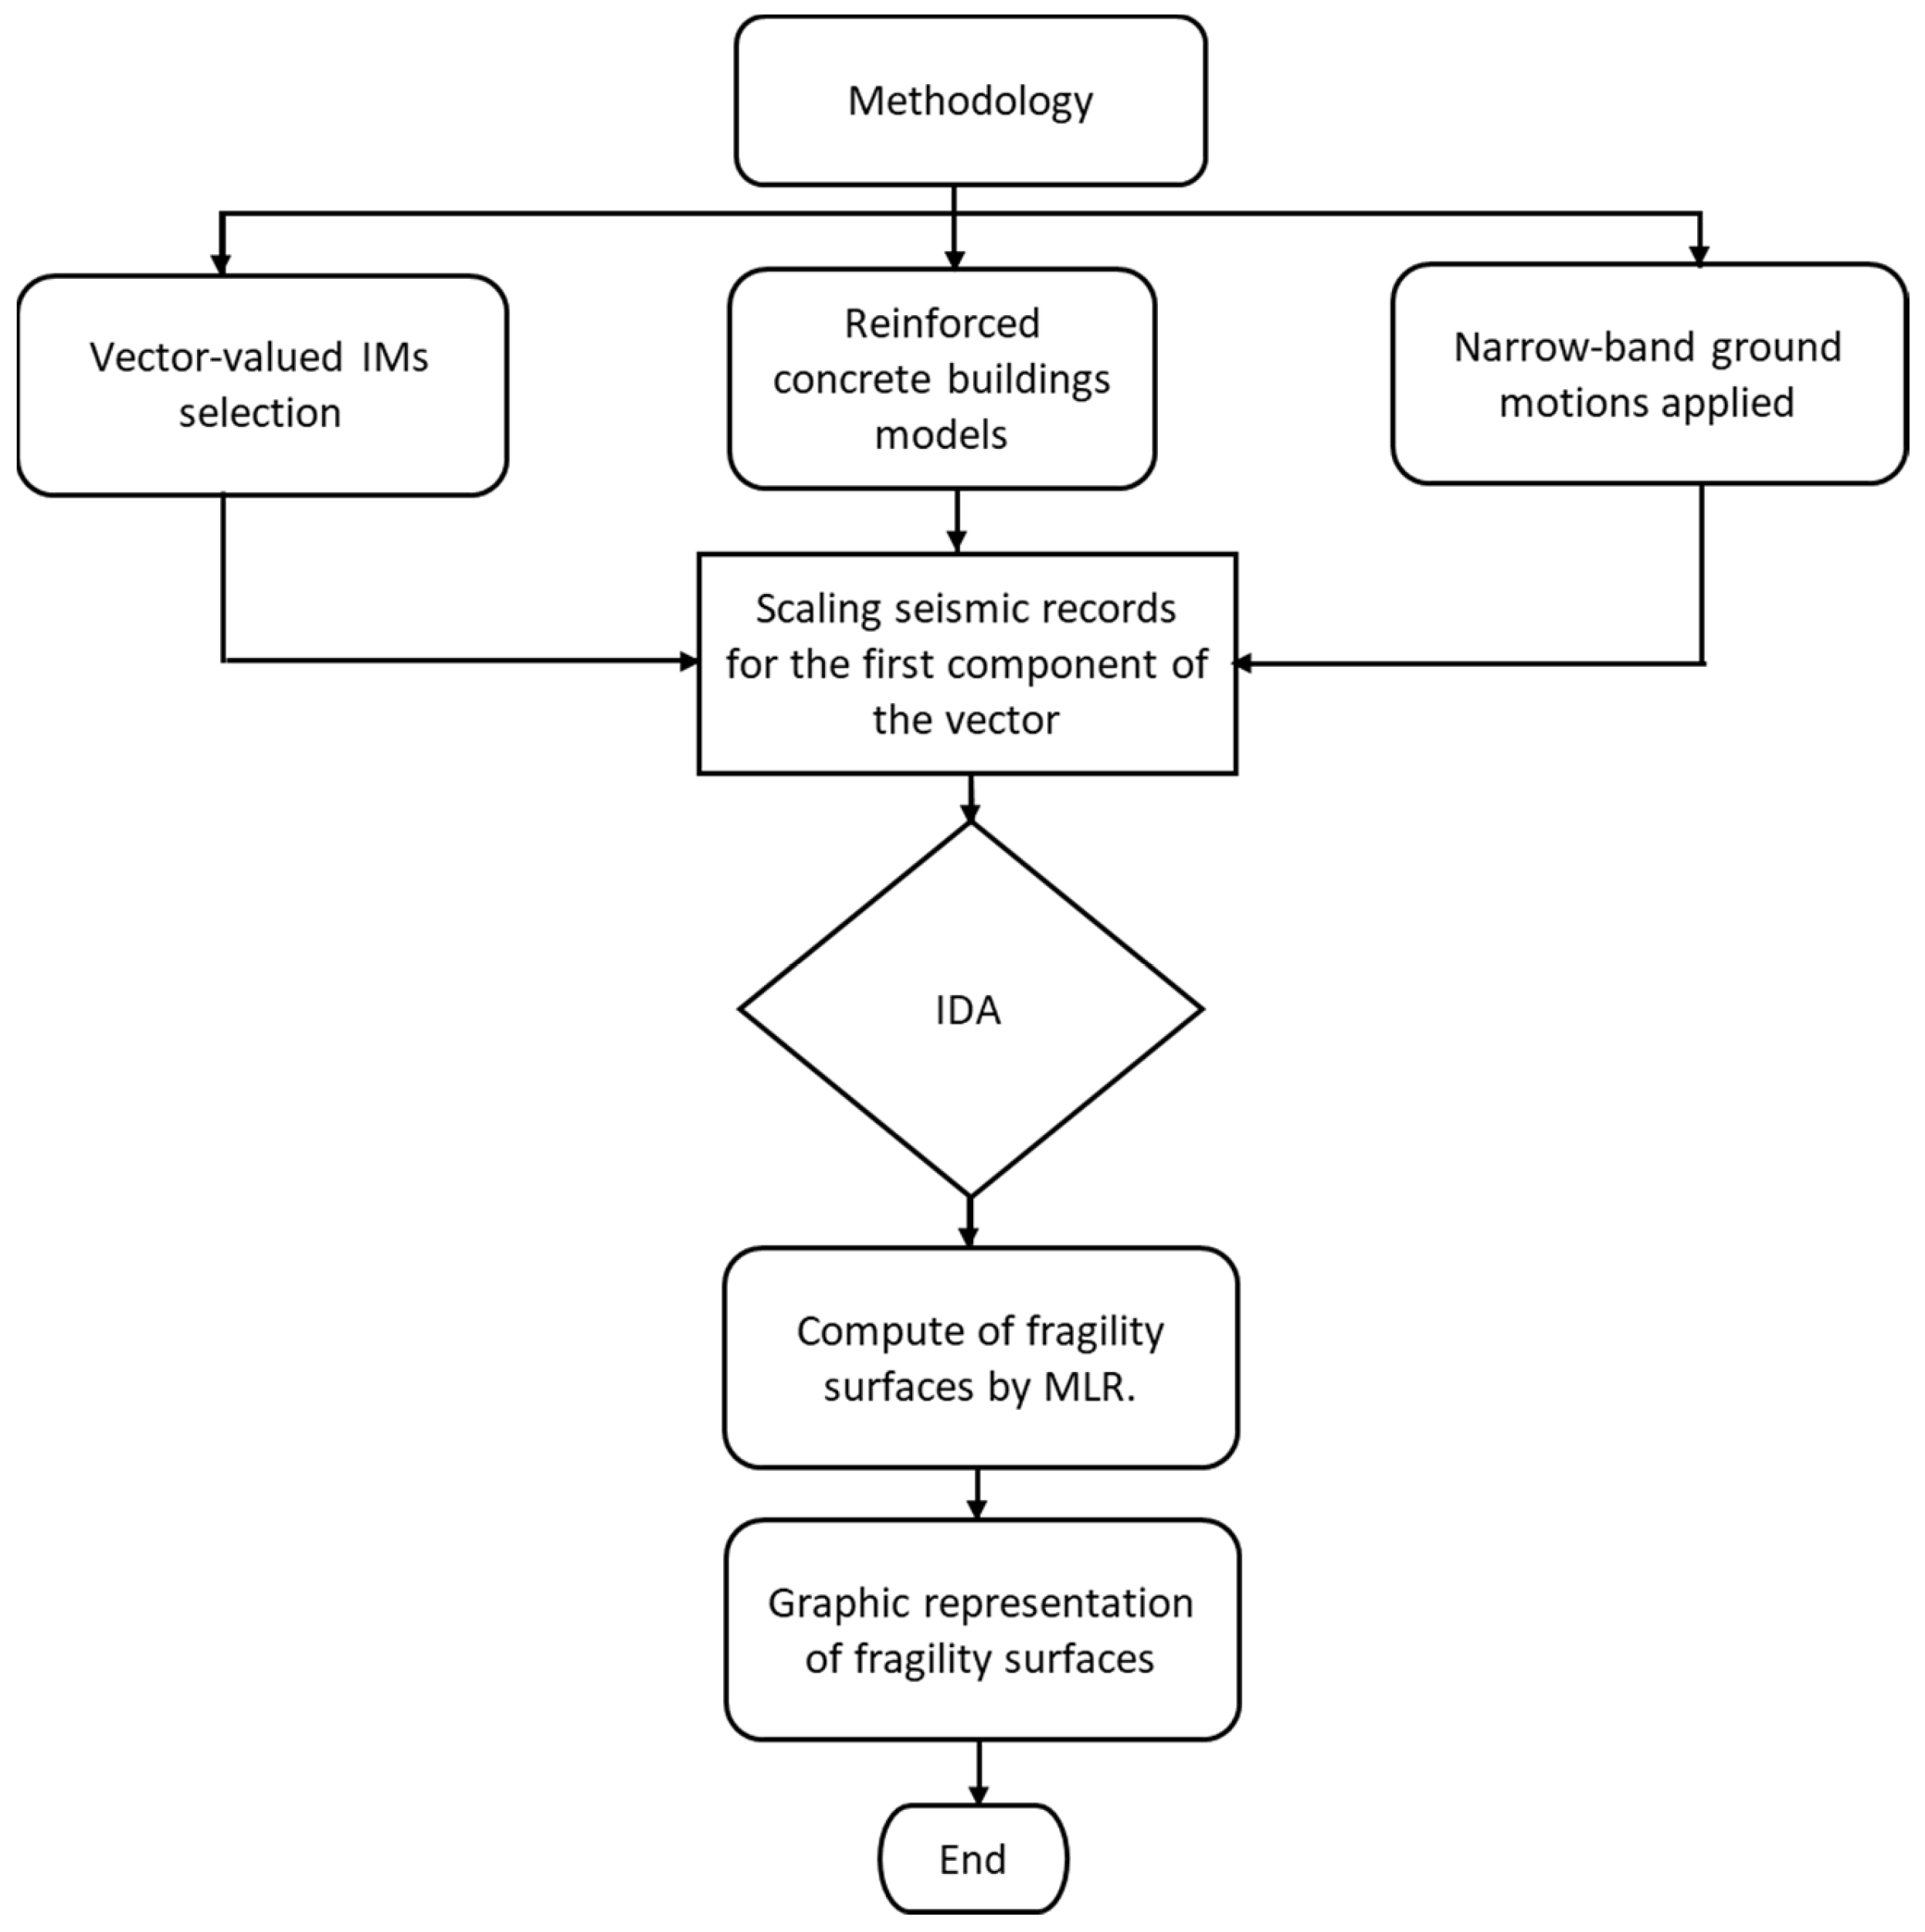
2. Methodology
2.1. Selected Seismic Intensity Measures

2.2. Reinforced Concrete Buildings Models
2.3. Narrow-Band Ground Motions
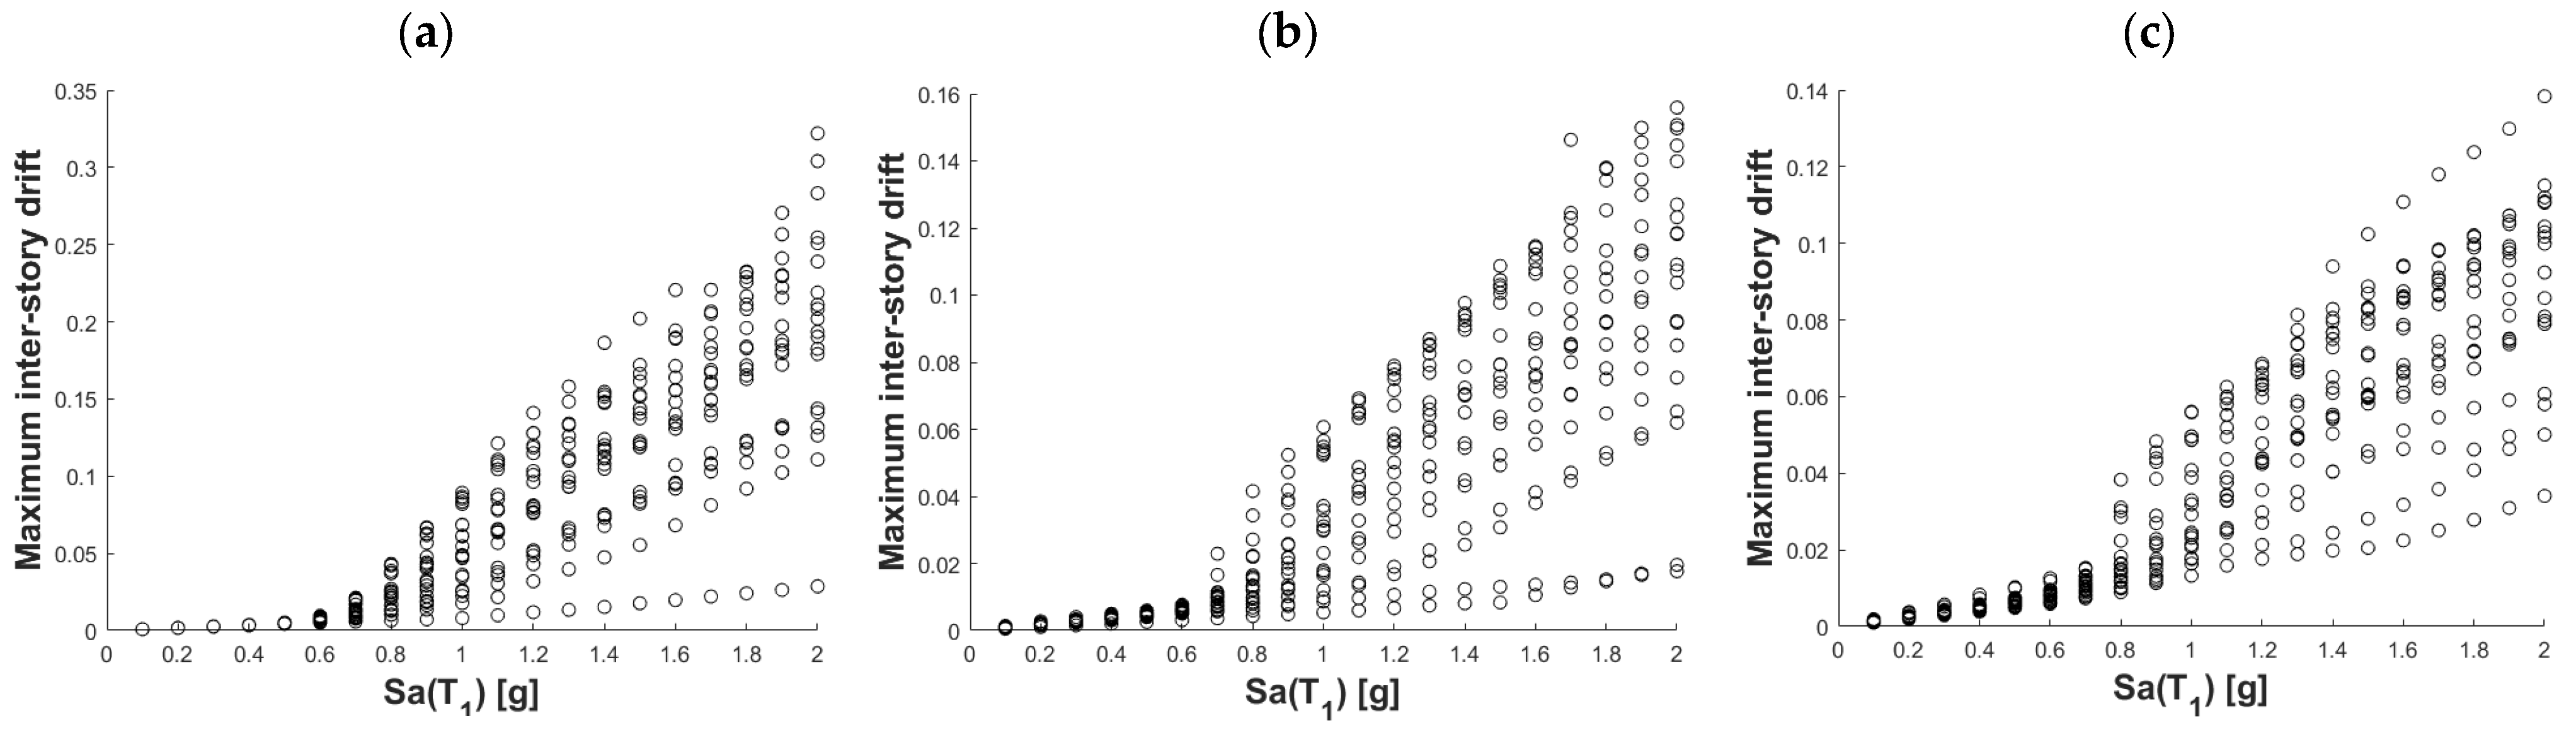
2.4. Incremental Dynamic Analysis
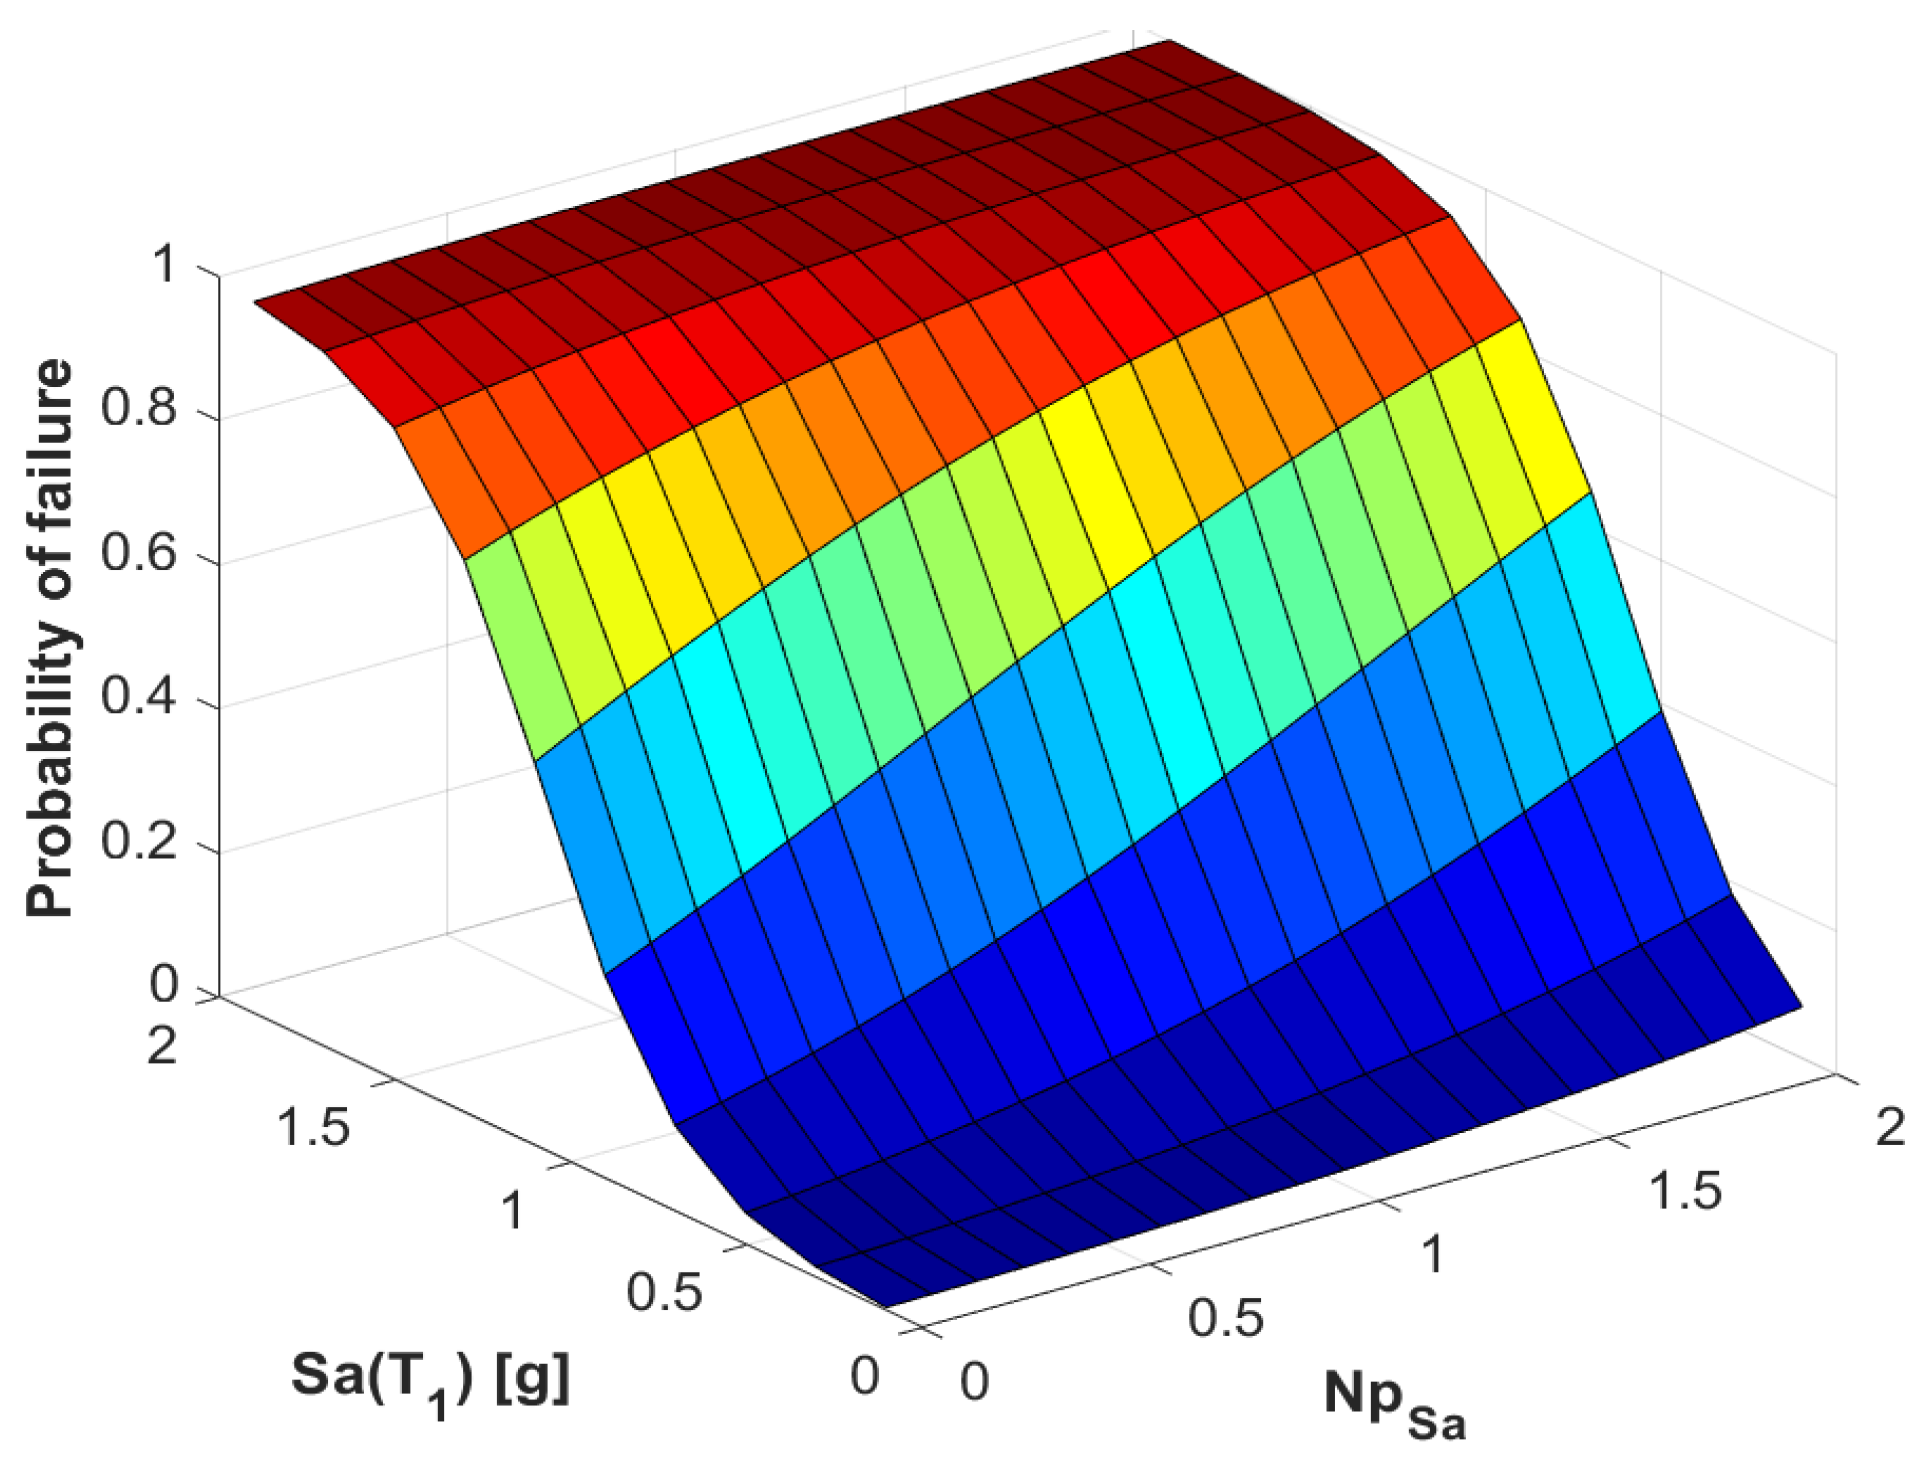
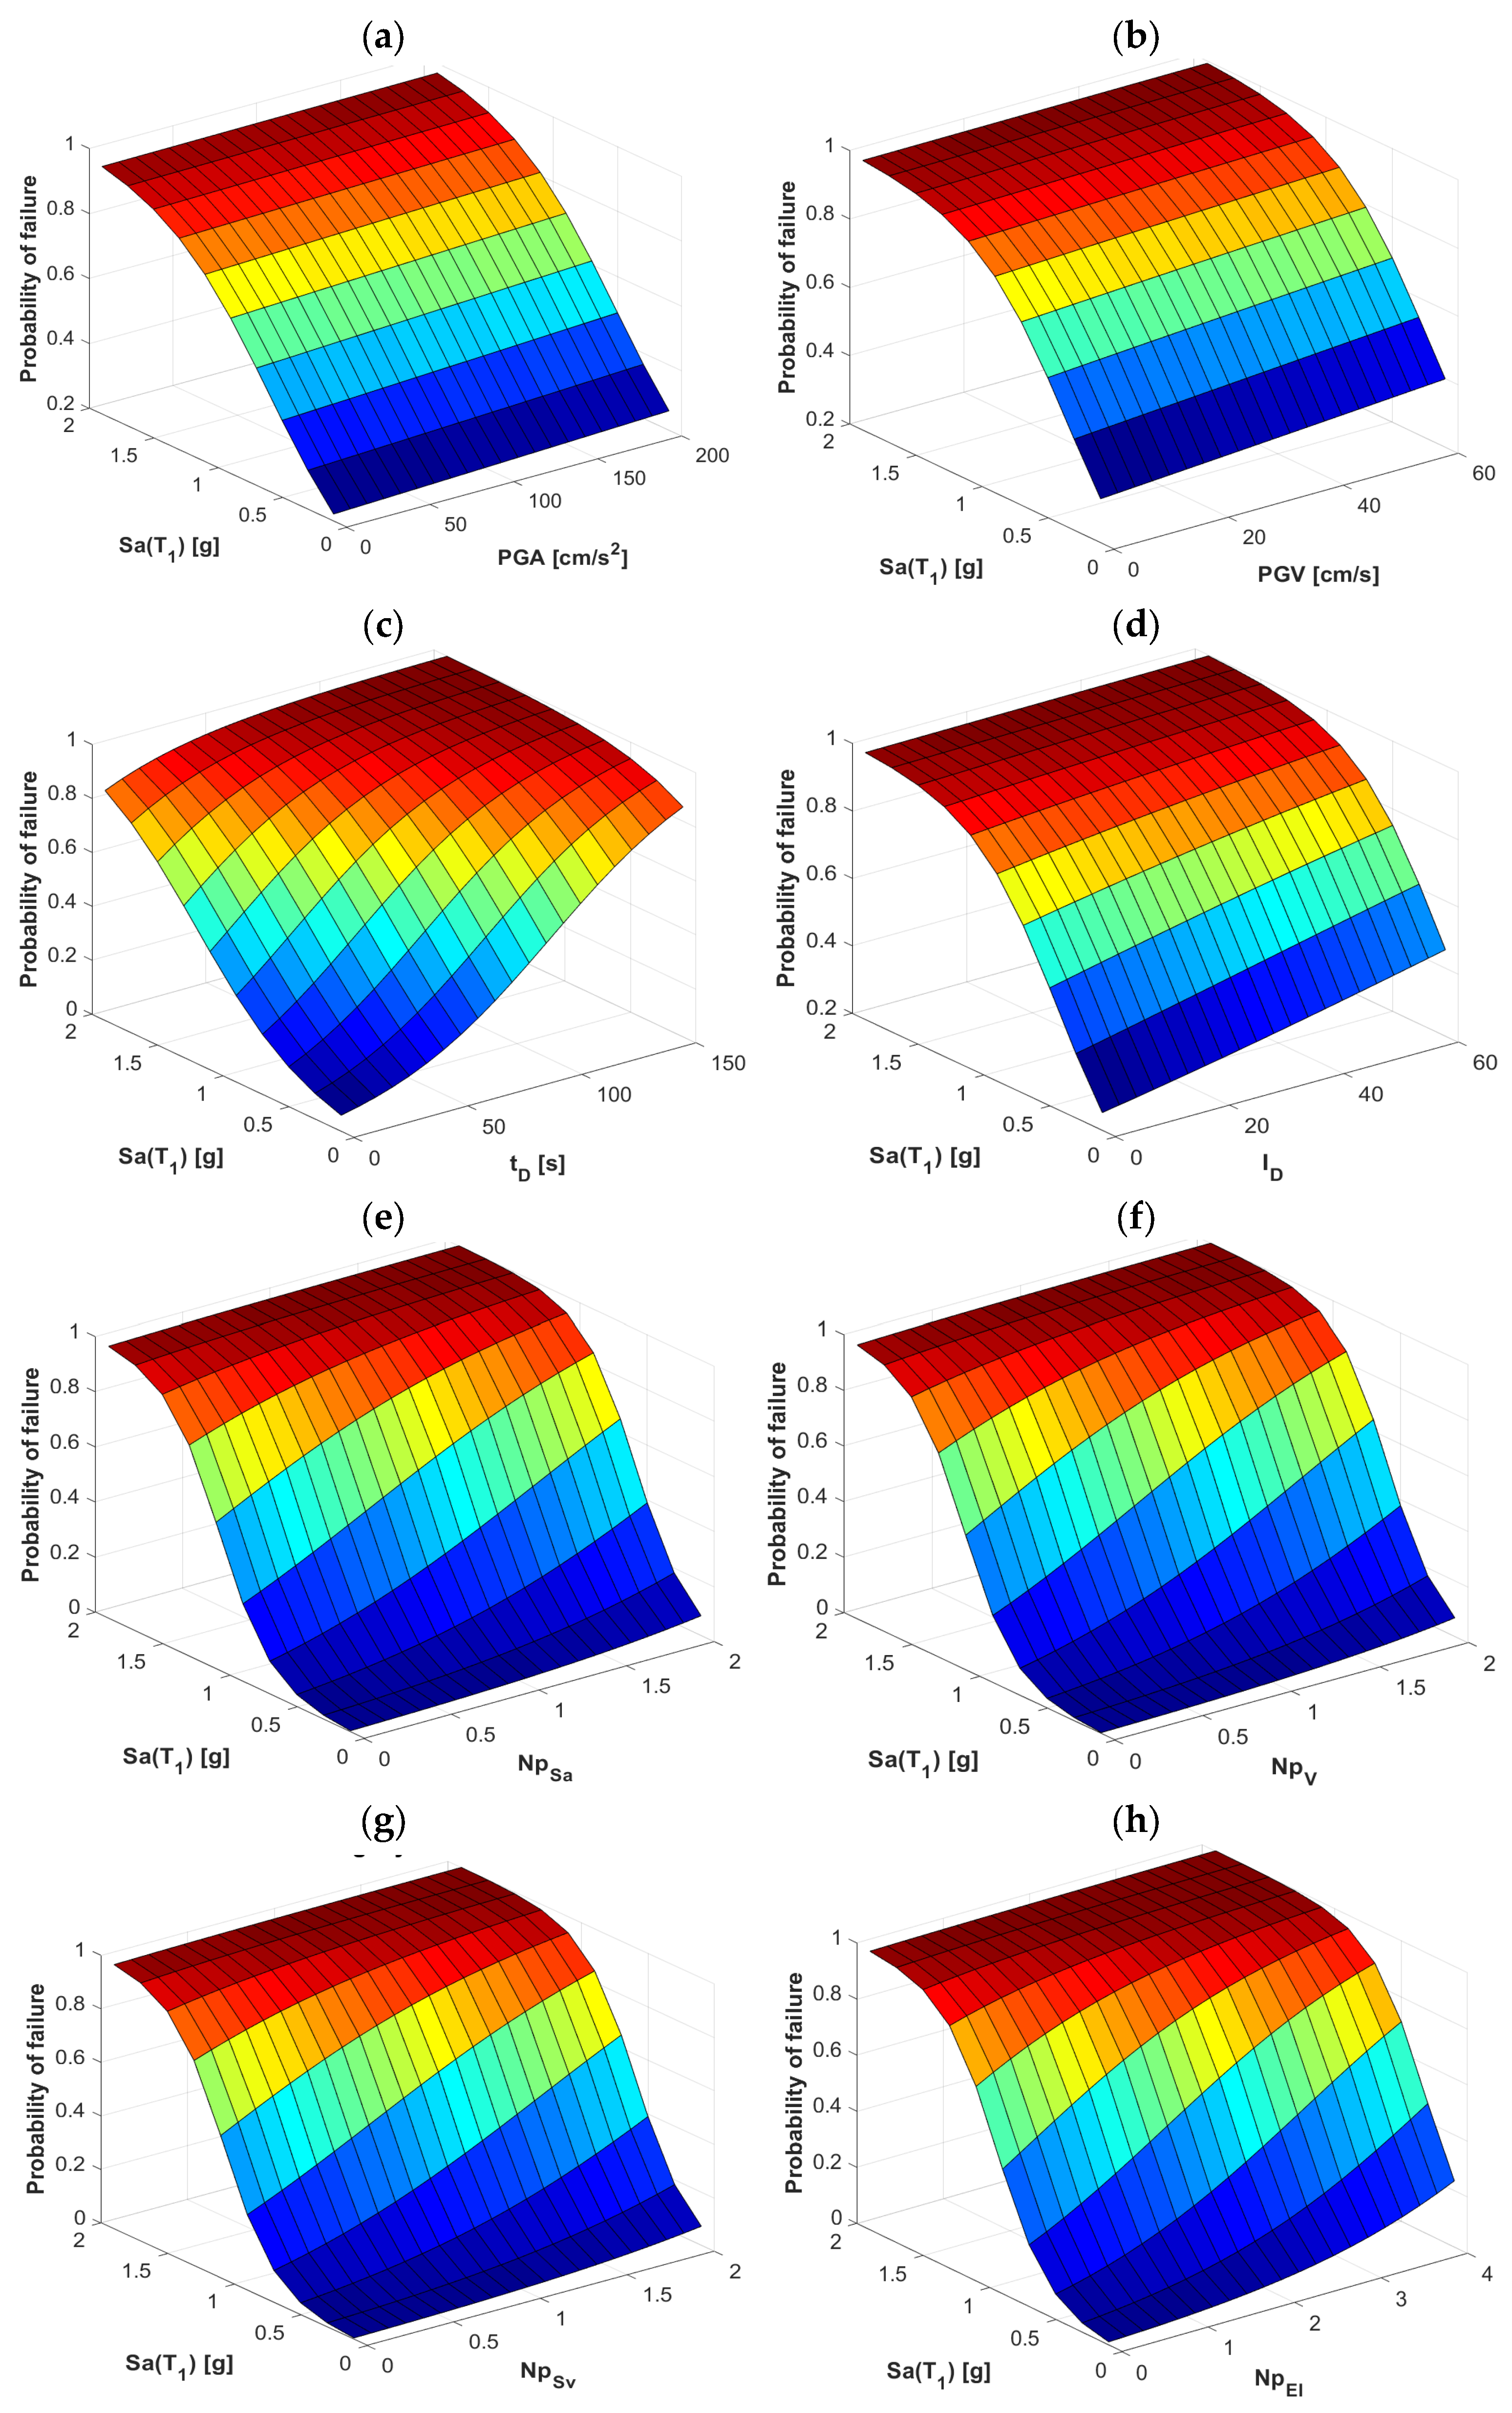
2.5. Seismic Fragility Surfaces
- PF = Probability of failure.
- x1 = First parameter of the vector or IM1 value.
- x2 = Secondary parameter of the vector or IM2 value.
- β0, β1 y β2 = Coefficients obtained from regression of the results for the scaled records variating both IM1 = x1 and IM2 = x2.
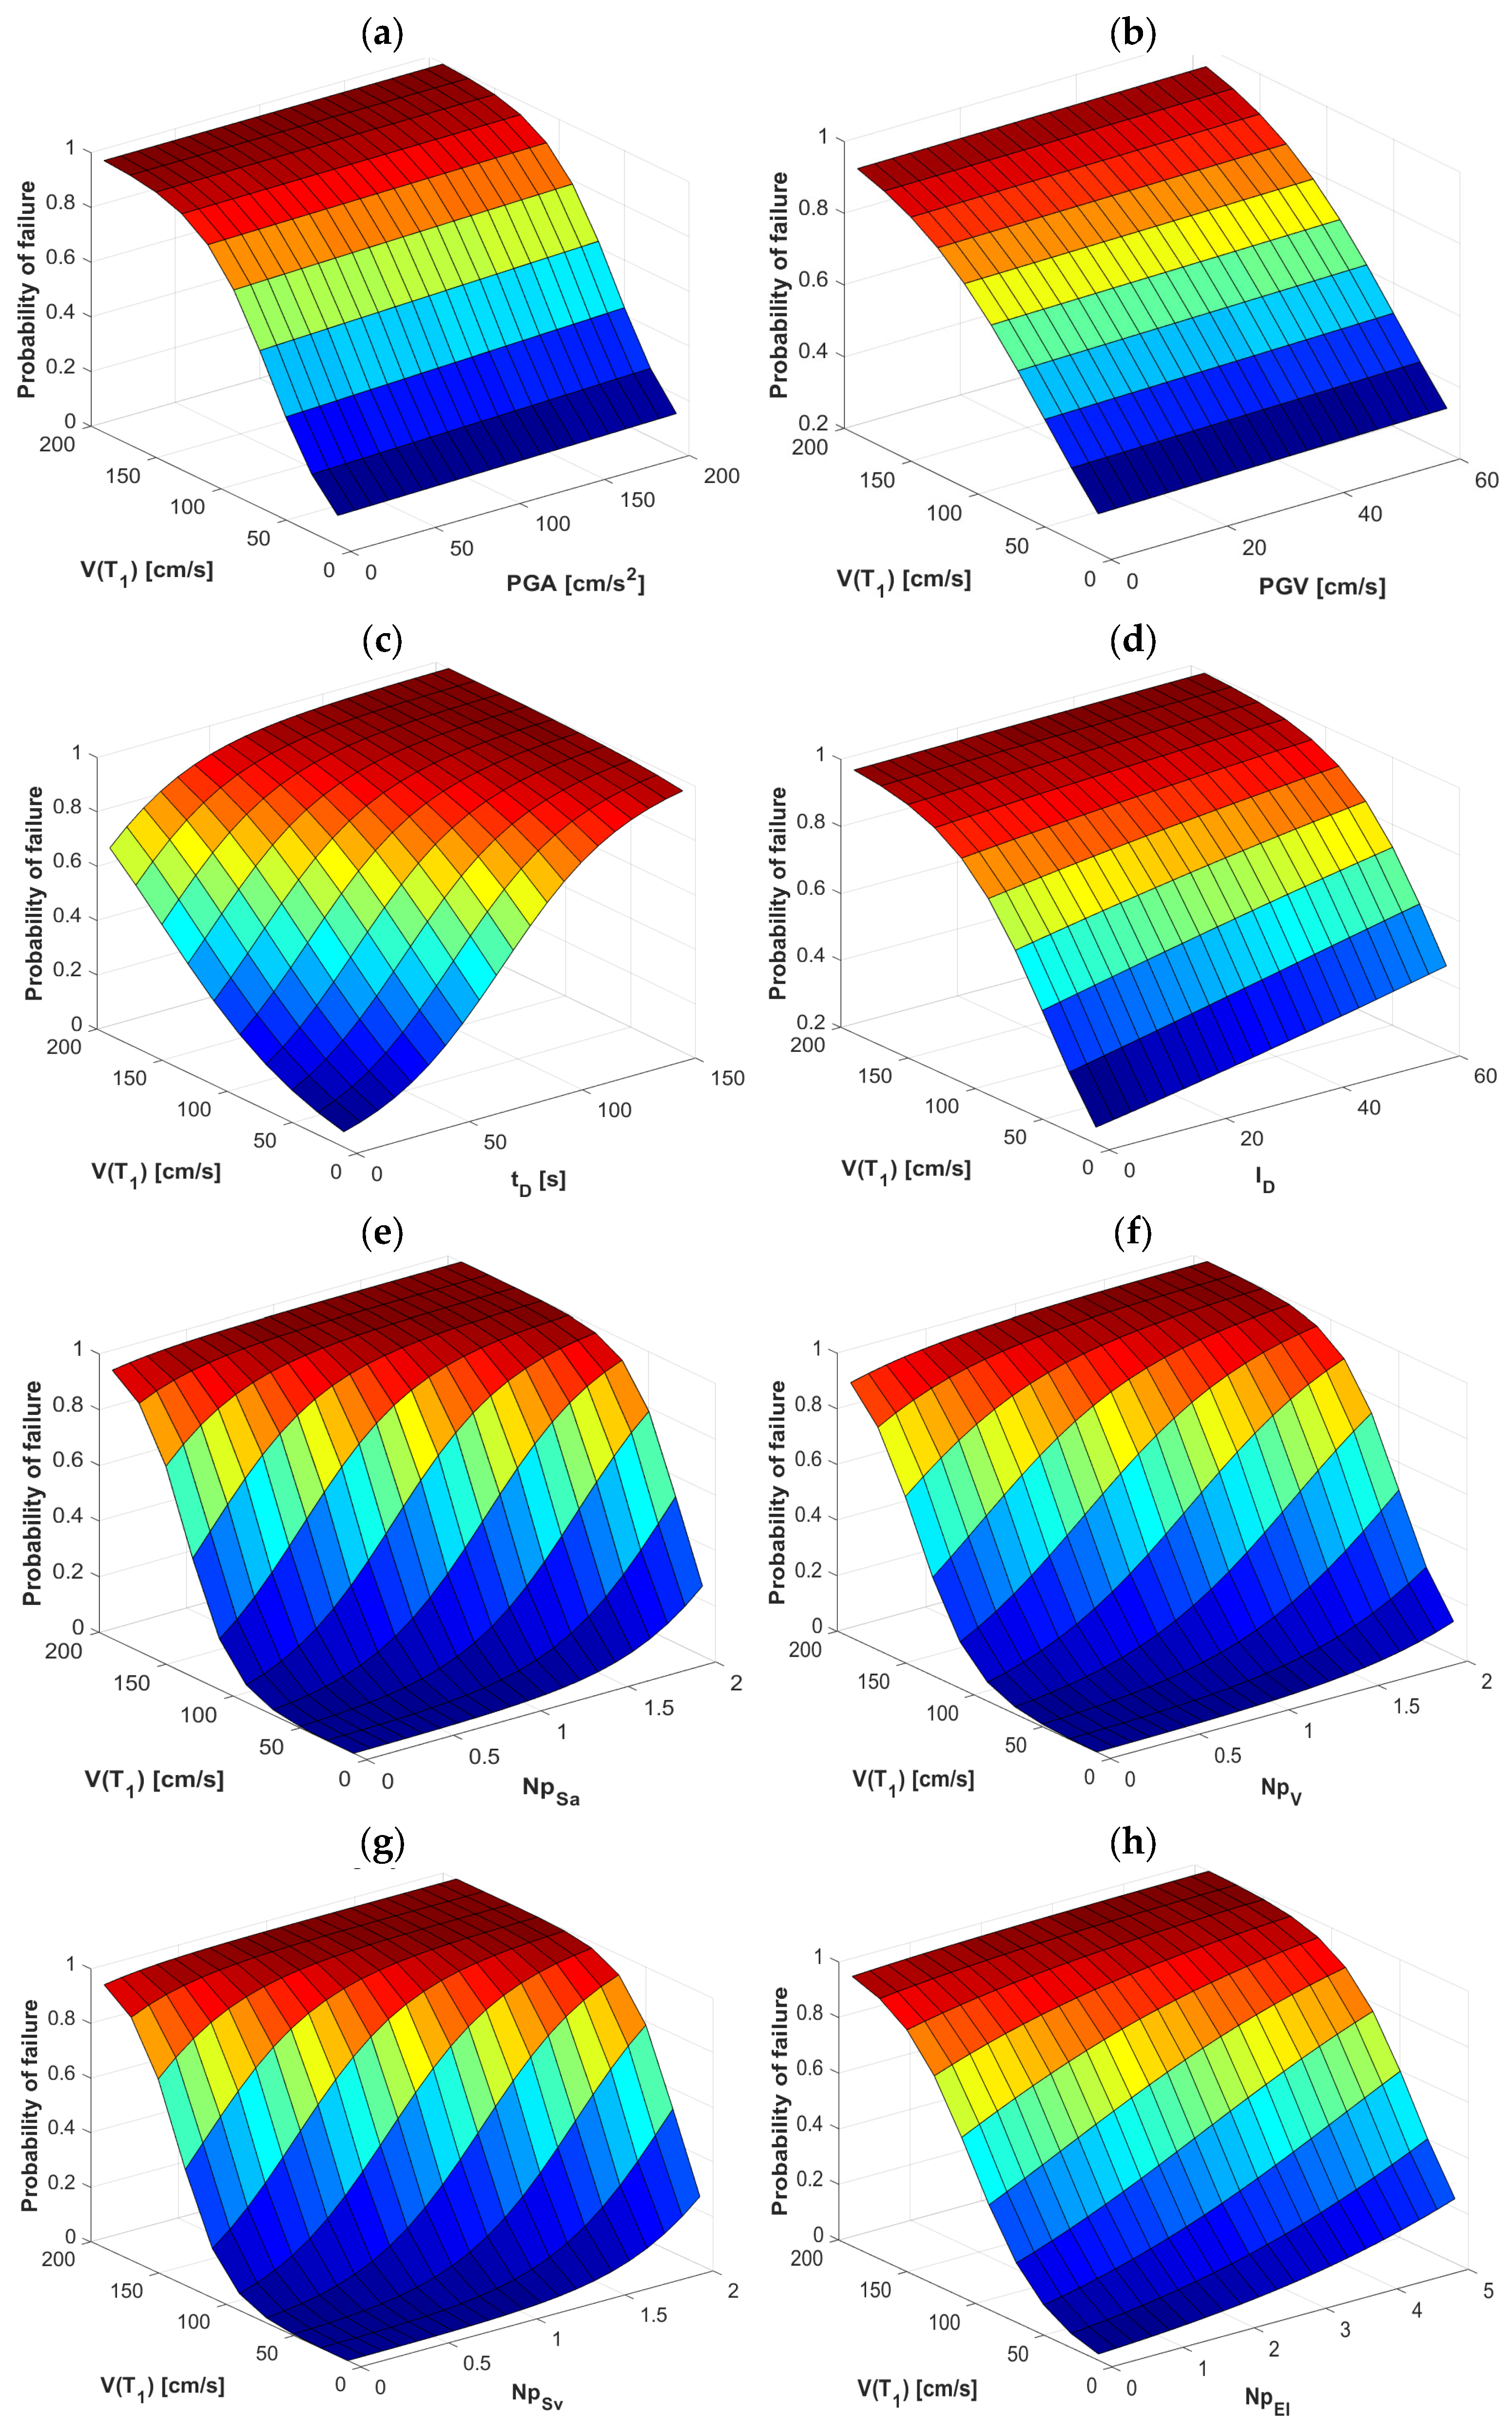
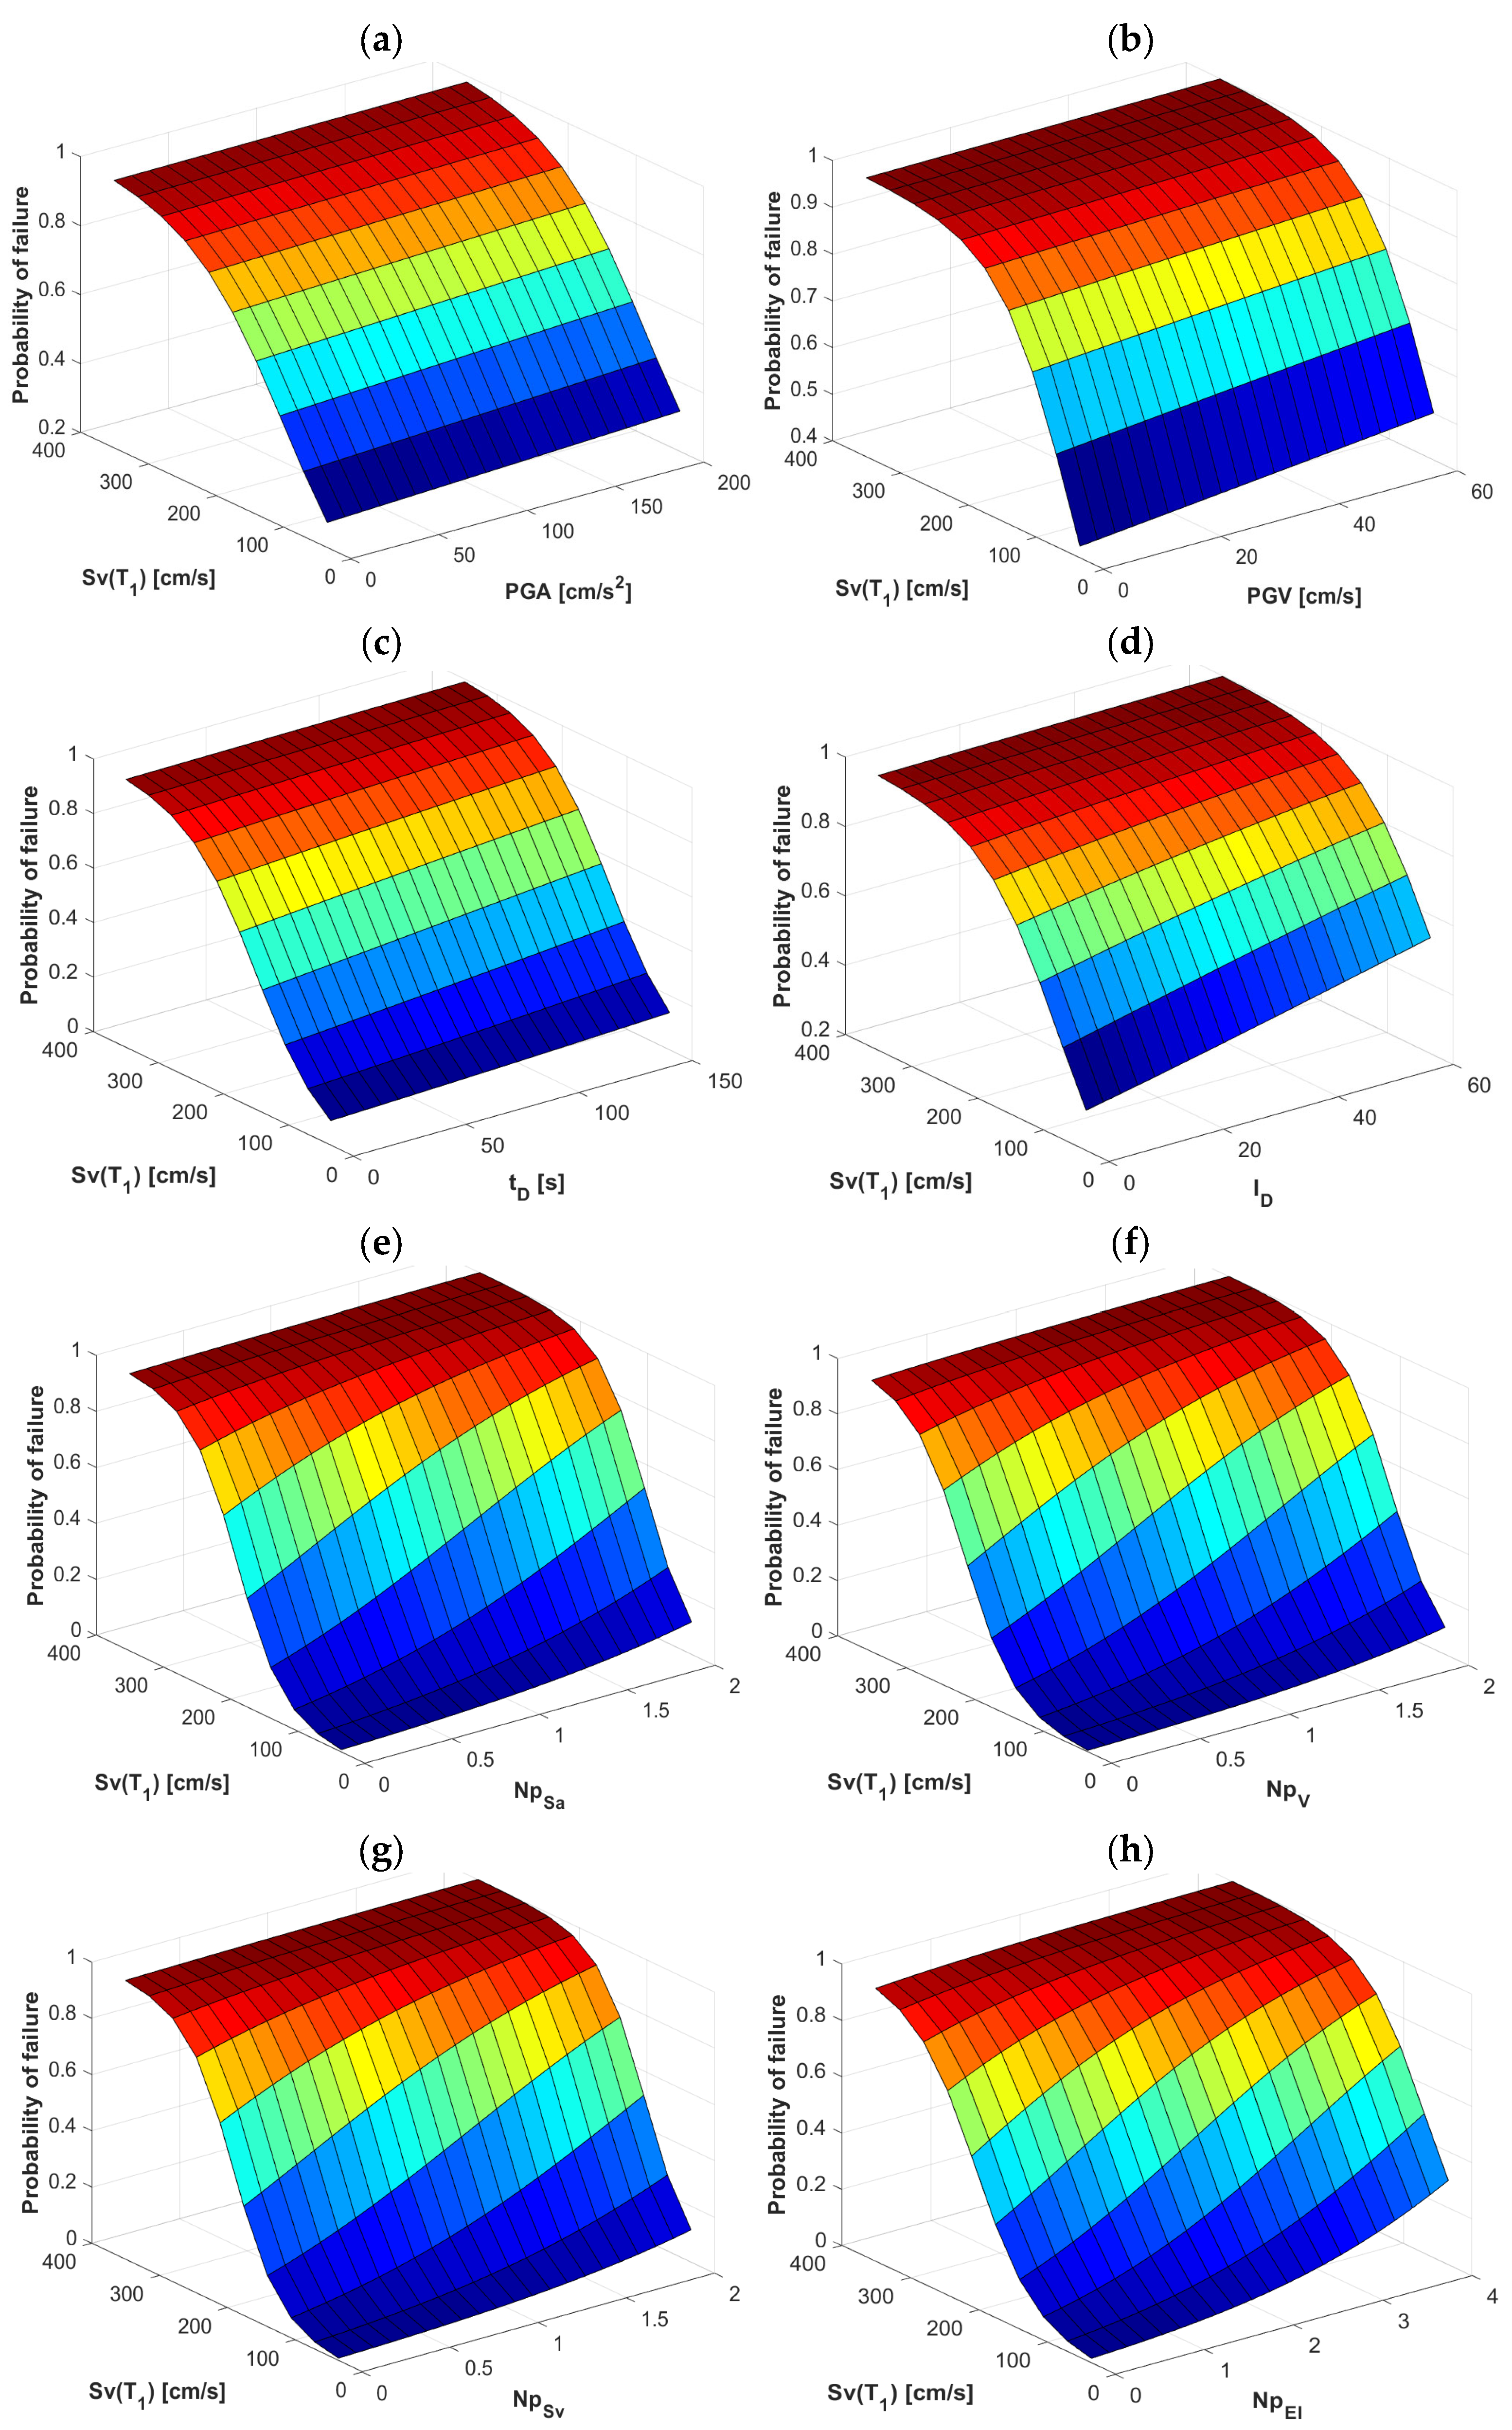
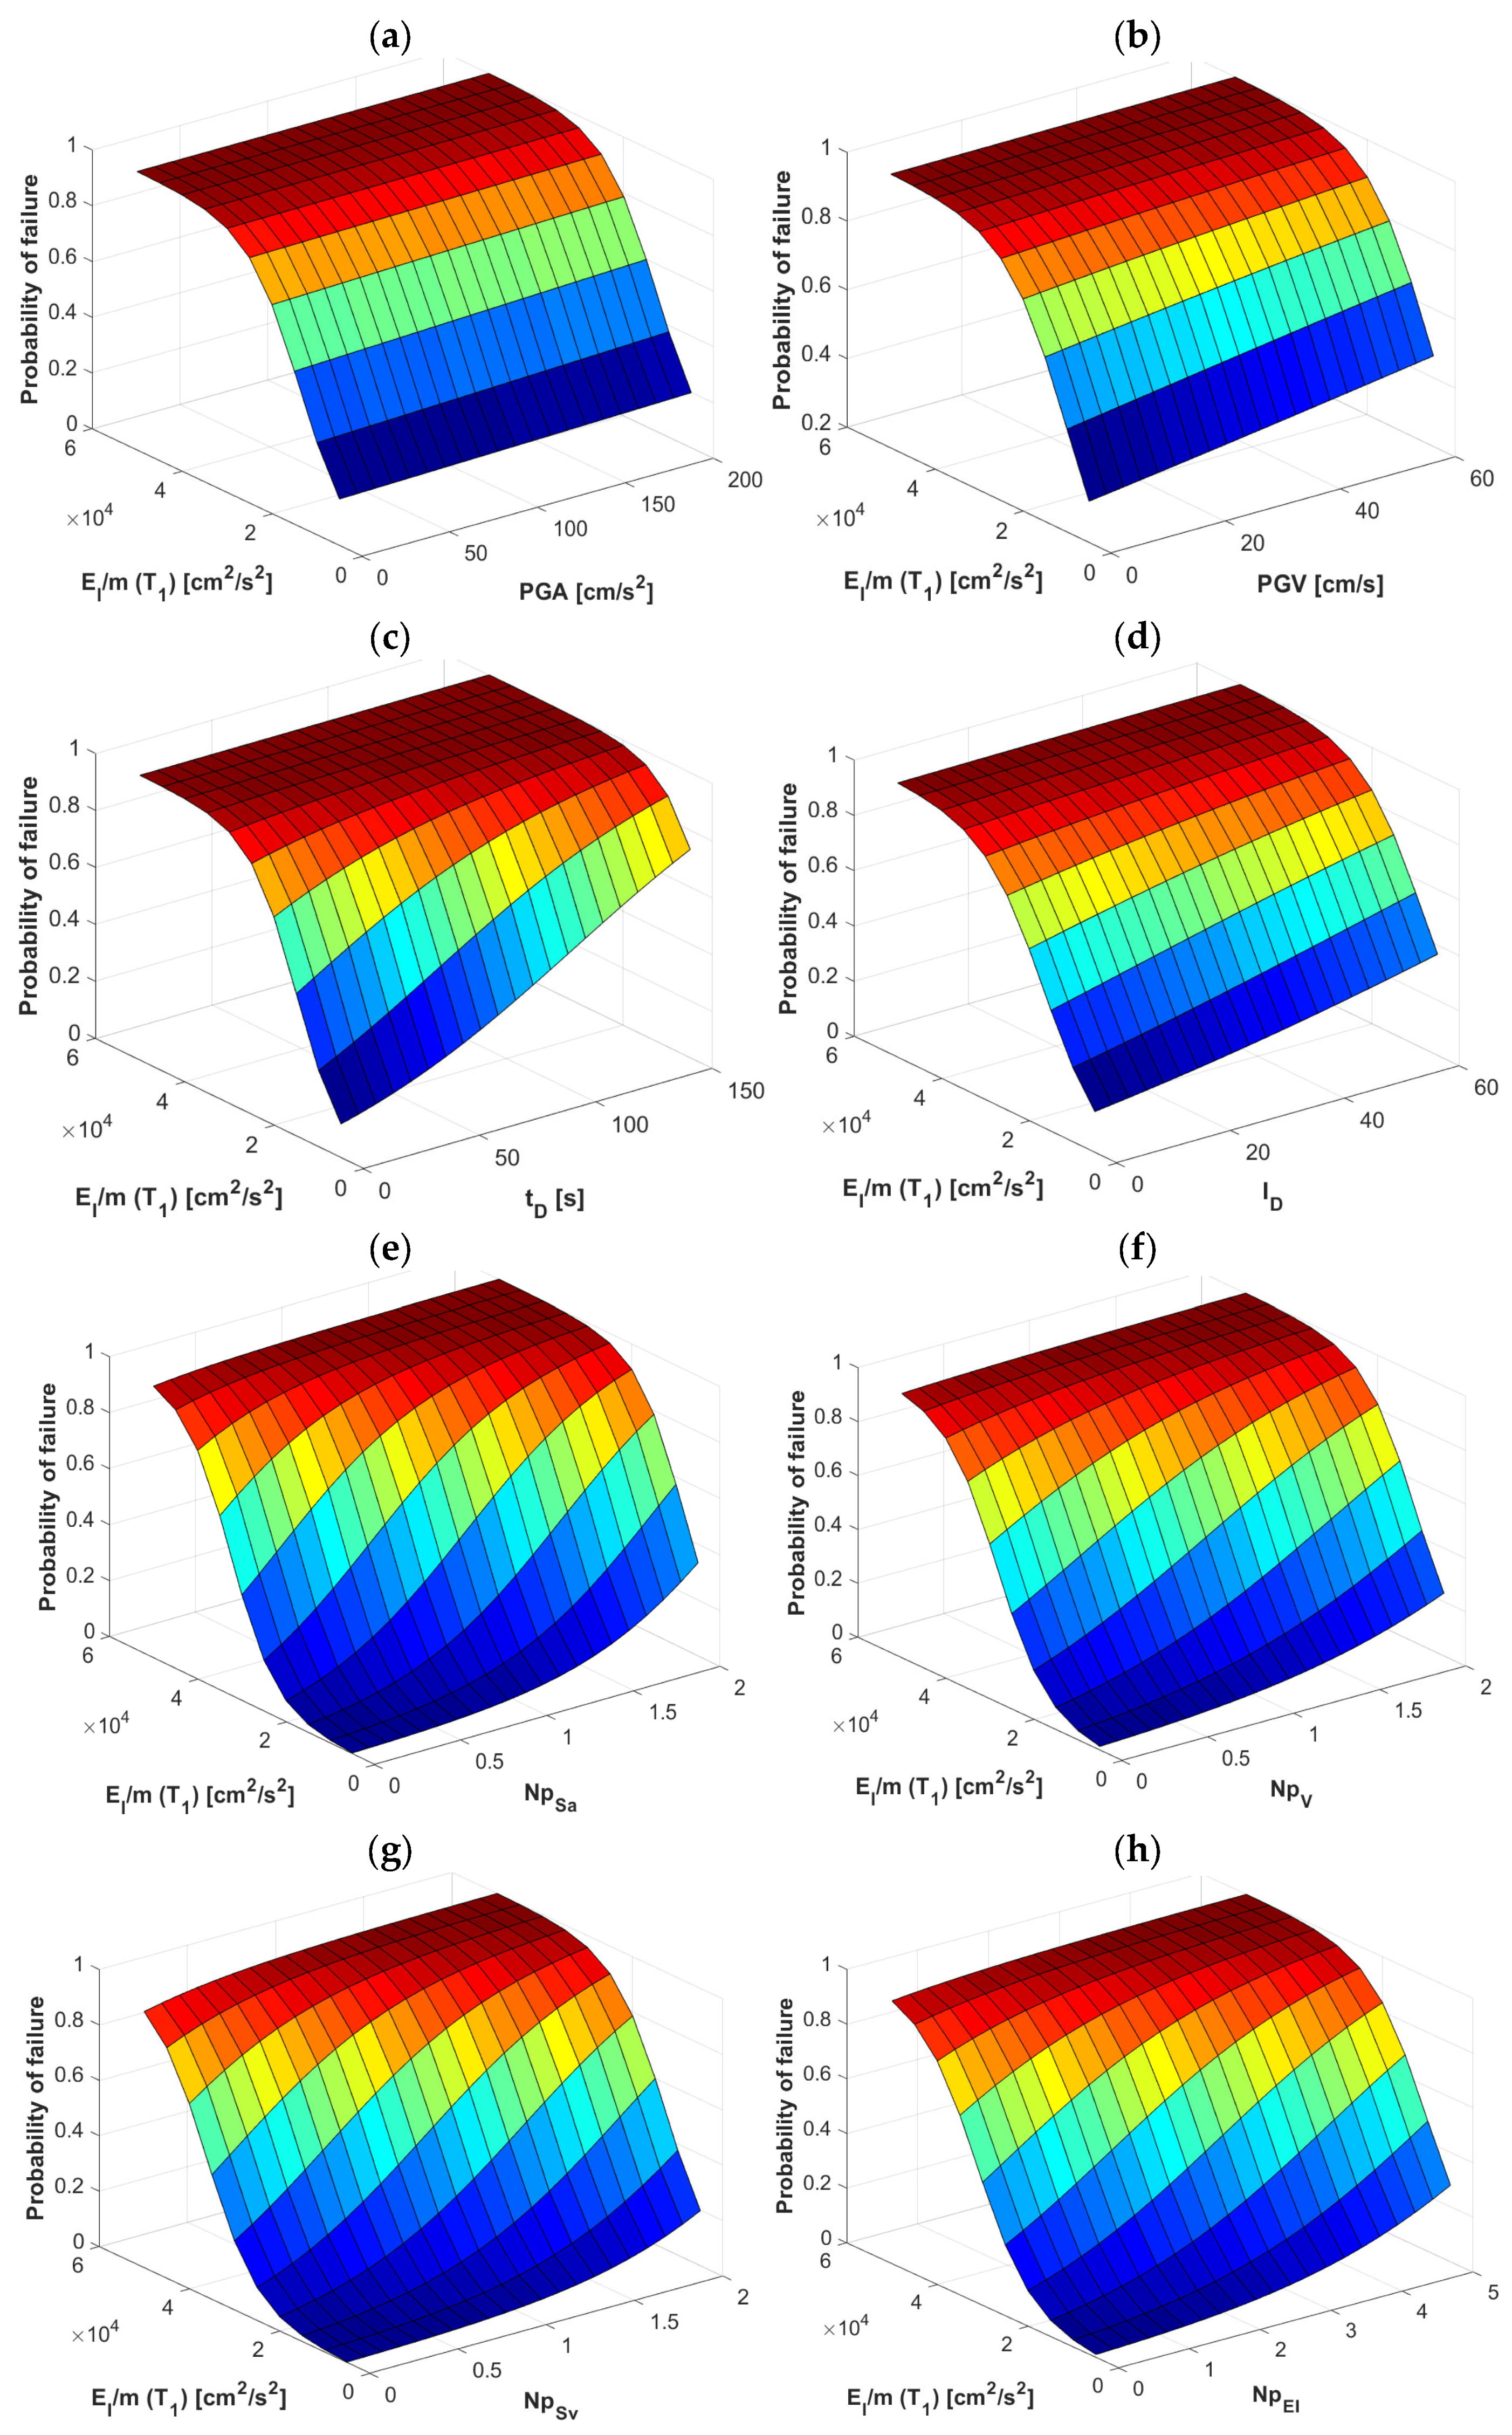
3. Numerical Results
4. Discussion
- In each of the cases of vector-valued IMs, PGA and PGV had low influence when they were used as the second component of the vector.
- tD tended to behave well in some cases, but it was inconsistent in others, so its reliability still requires further study; ID presented better results than PGA and PGV, but its use did not imply a clear advantage over other IMs with better results.
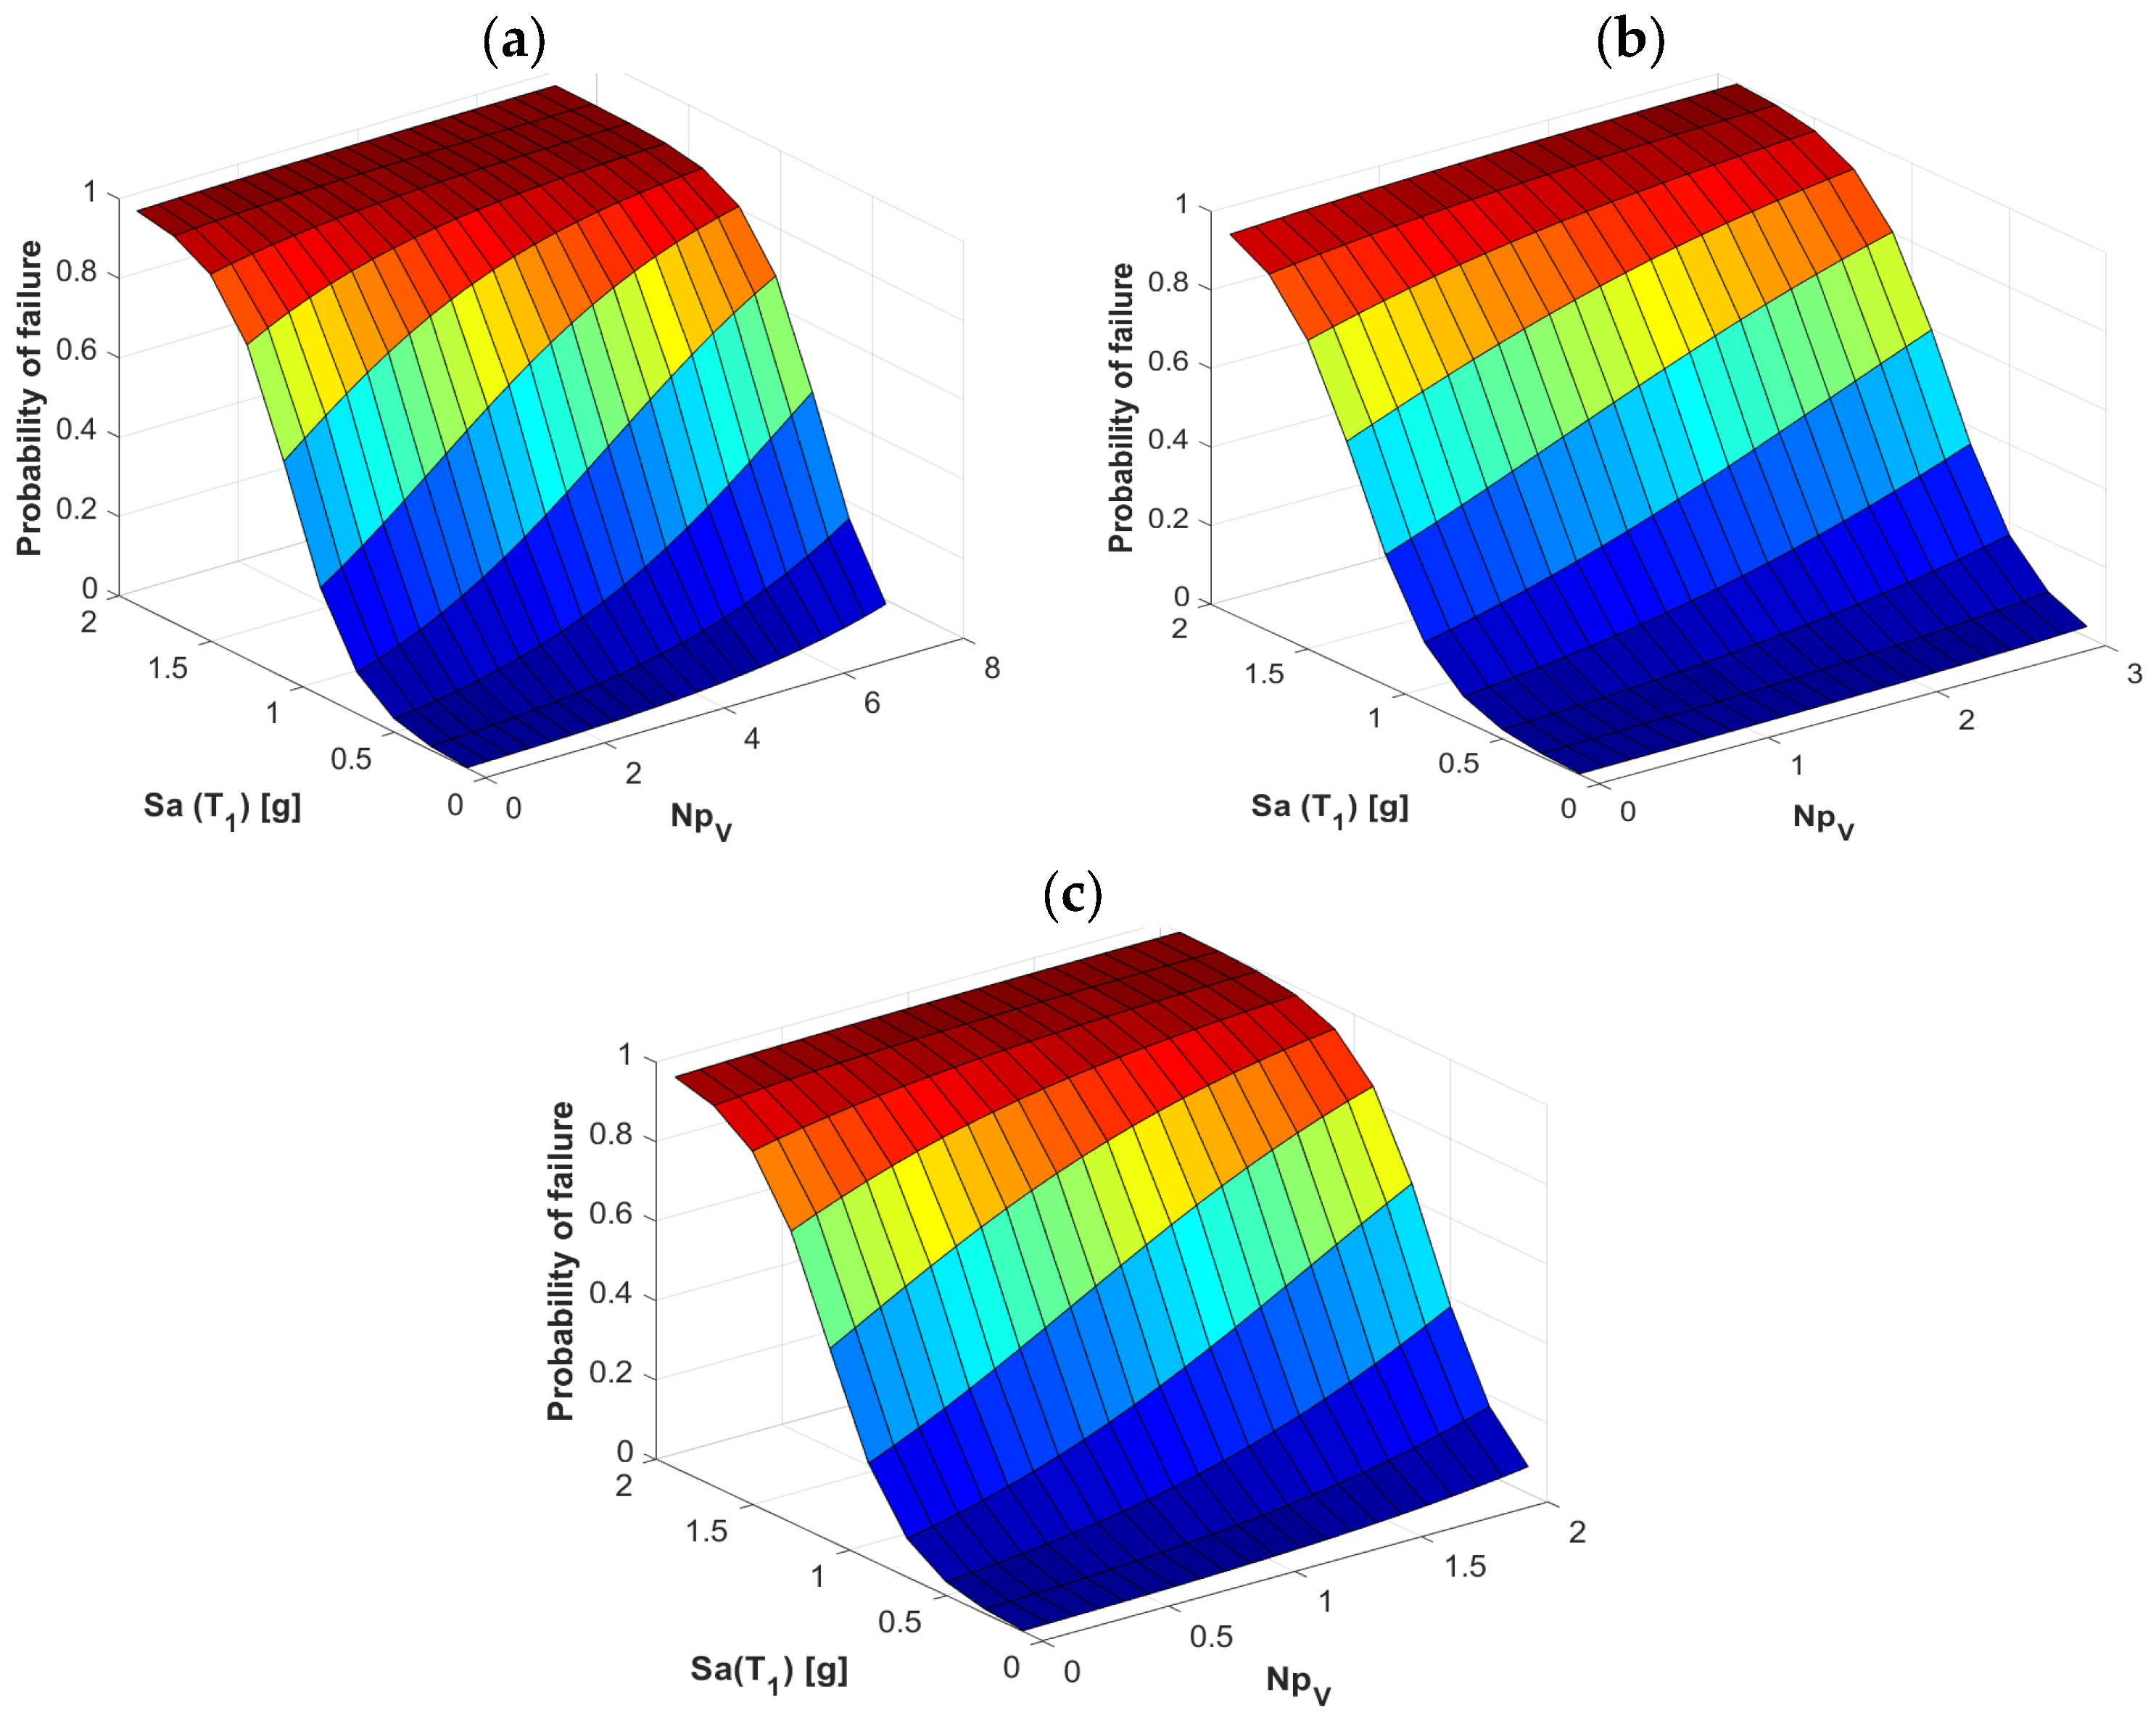
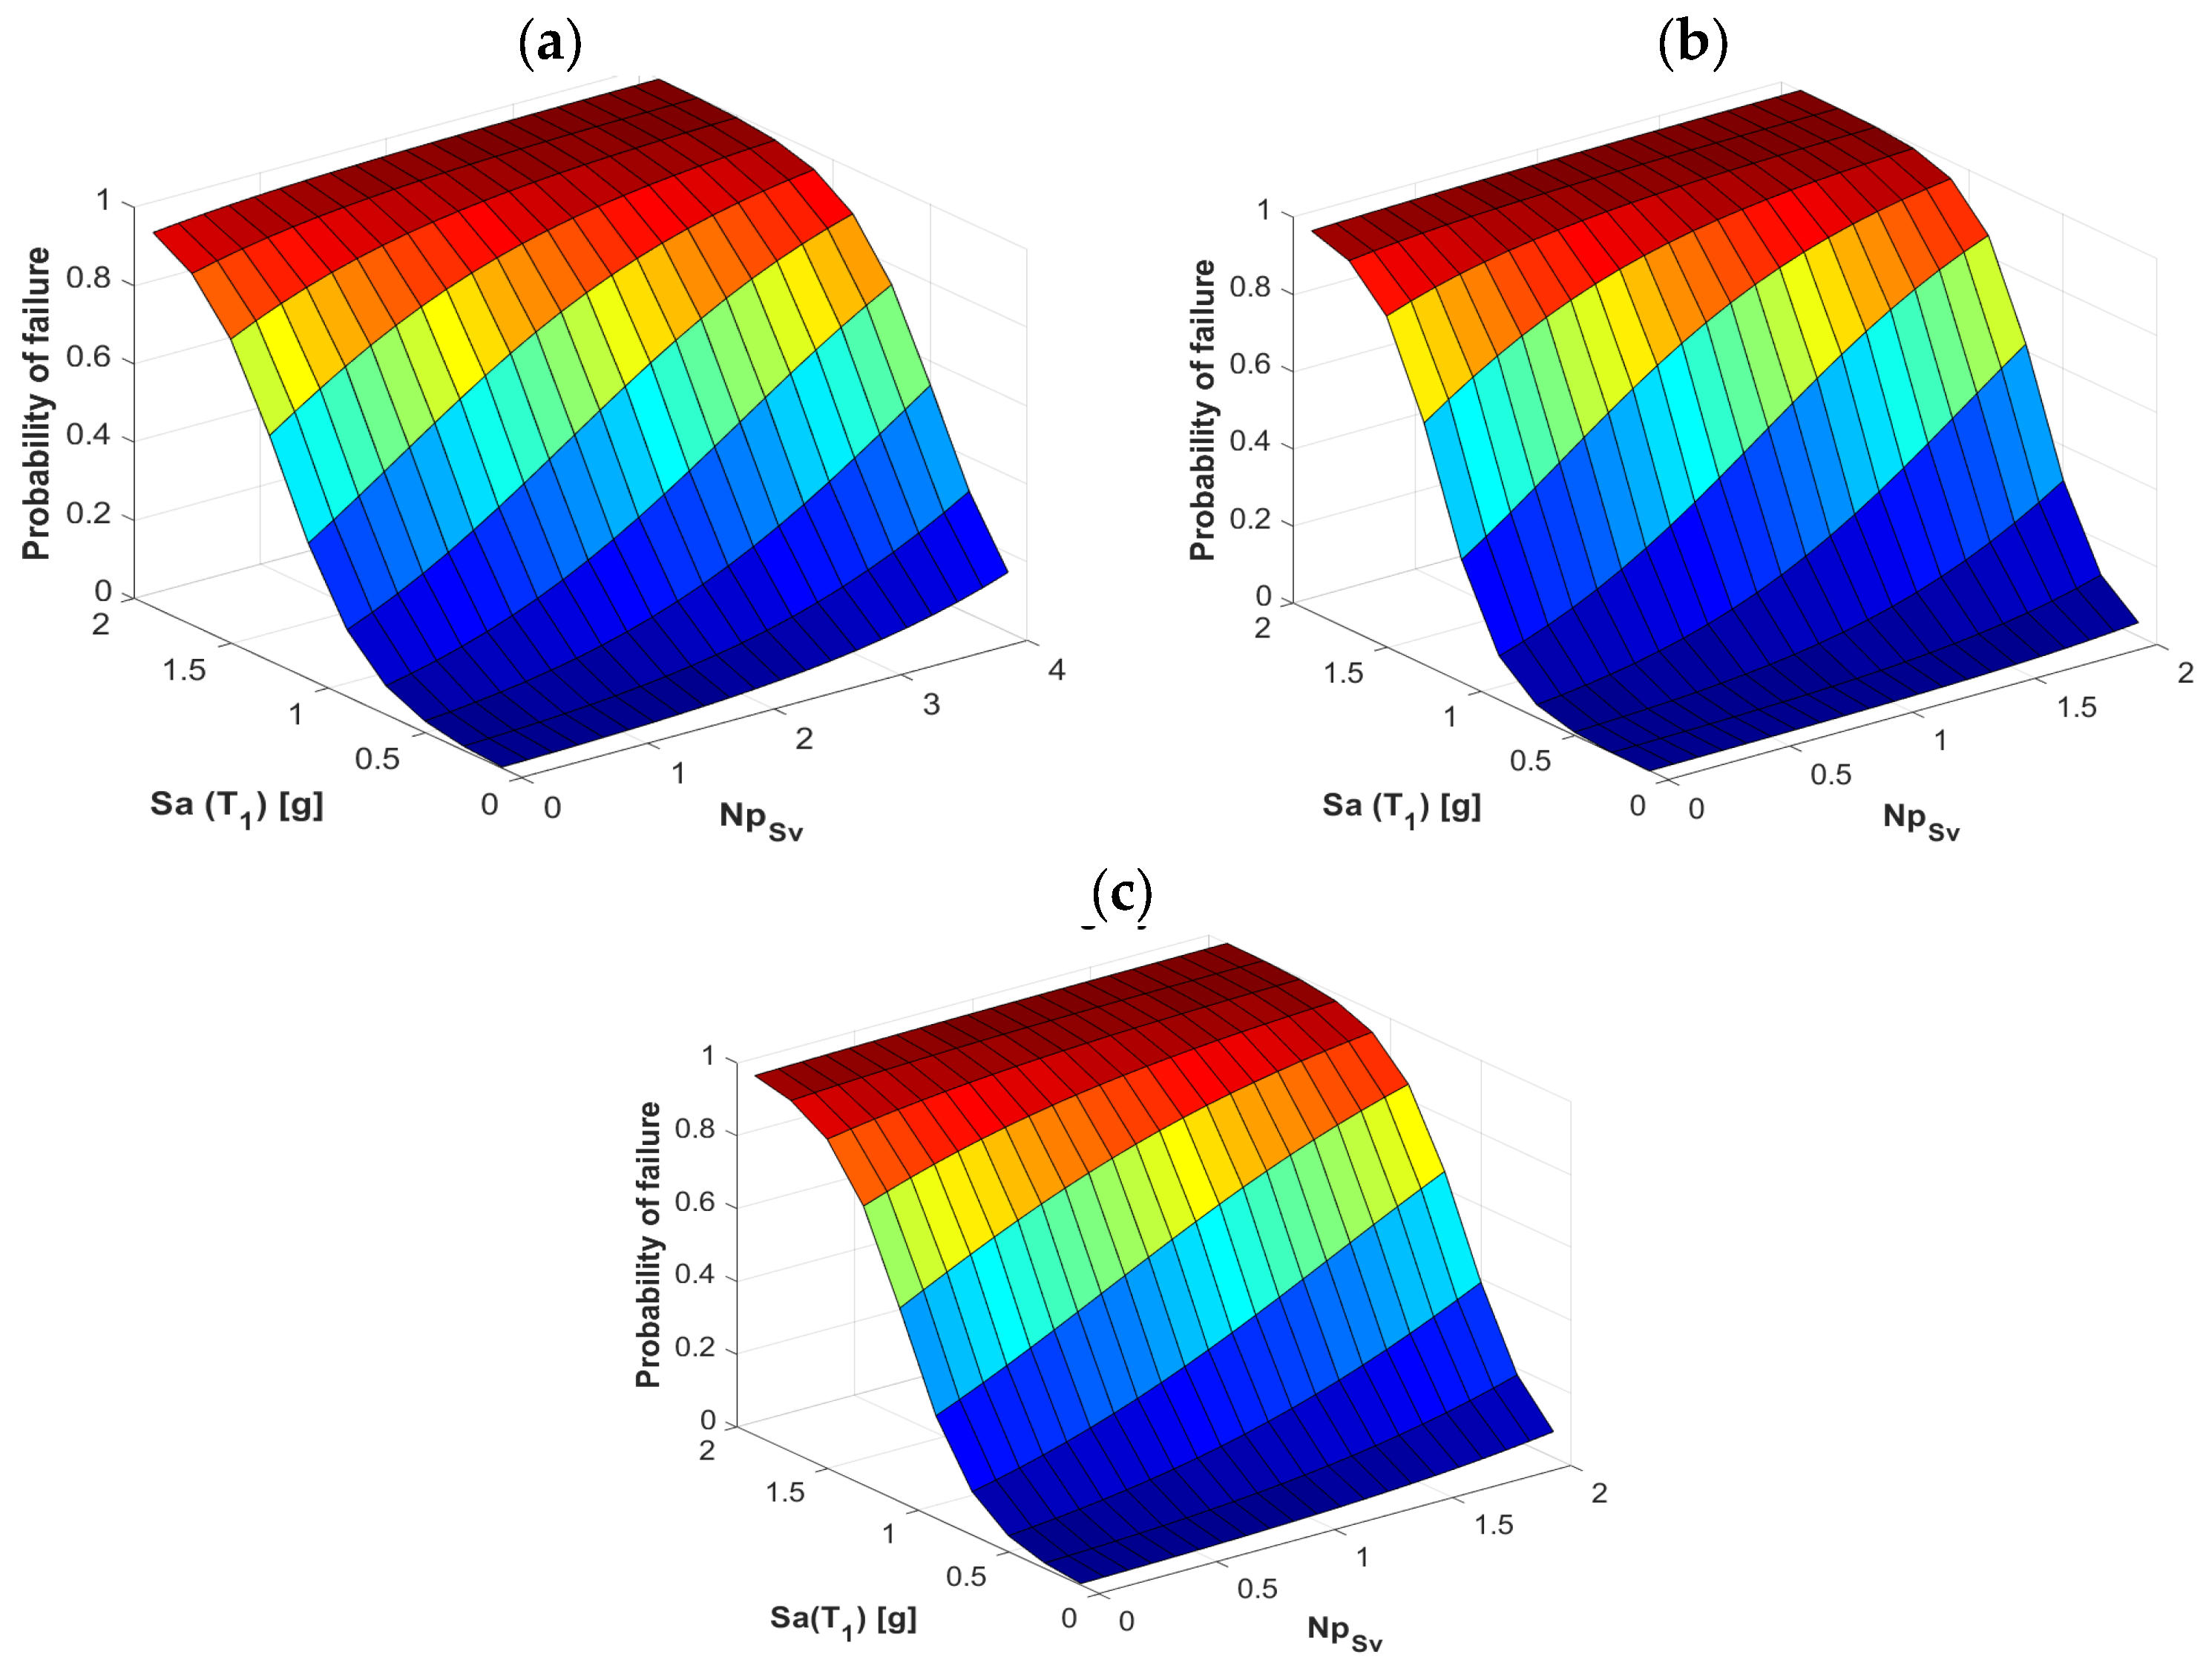
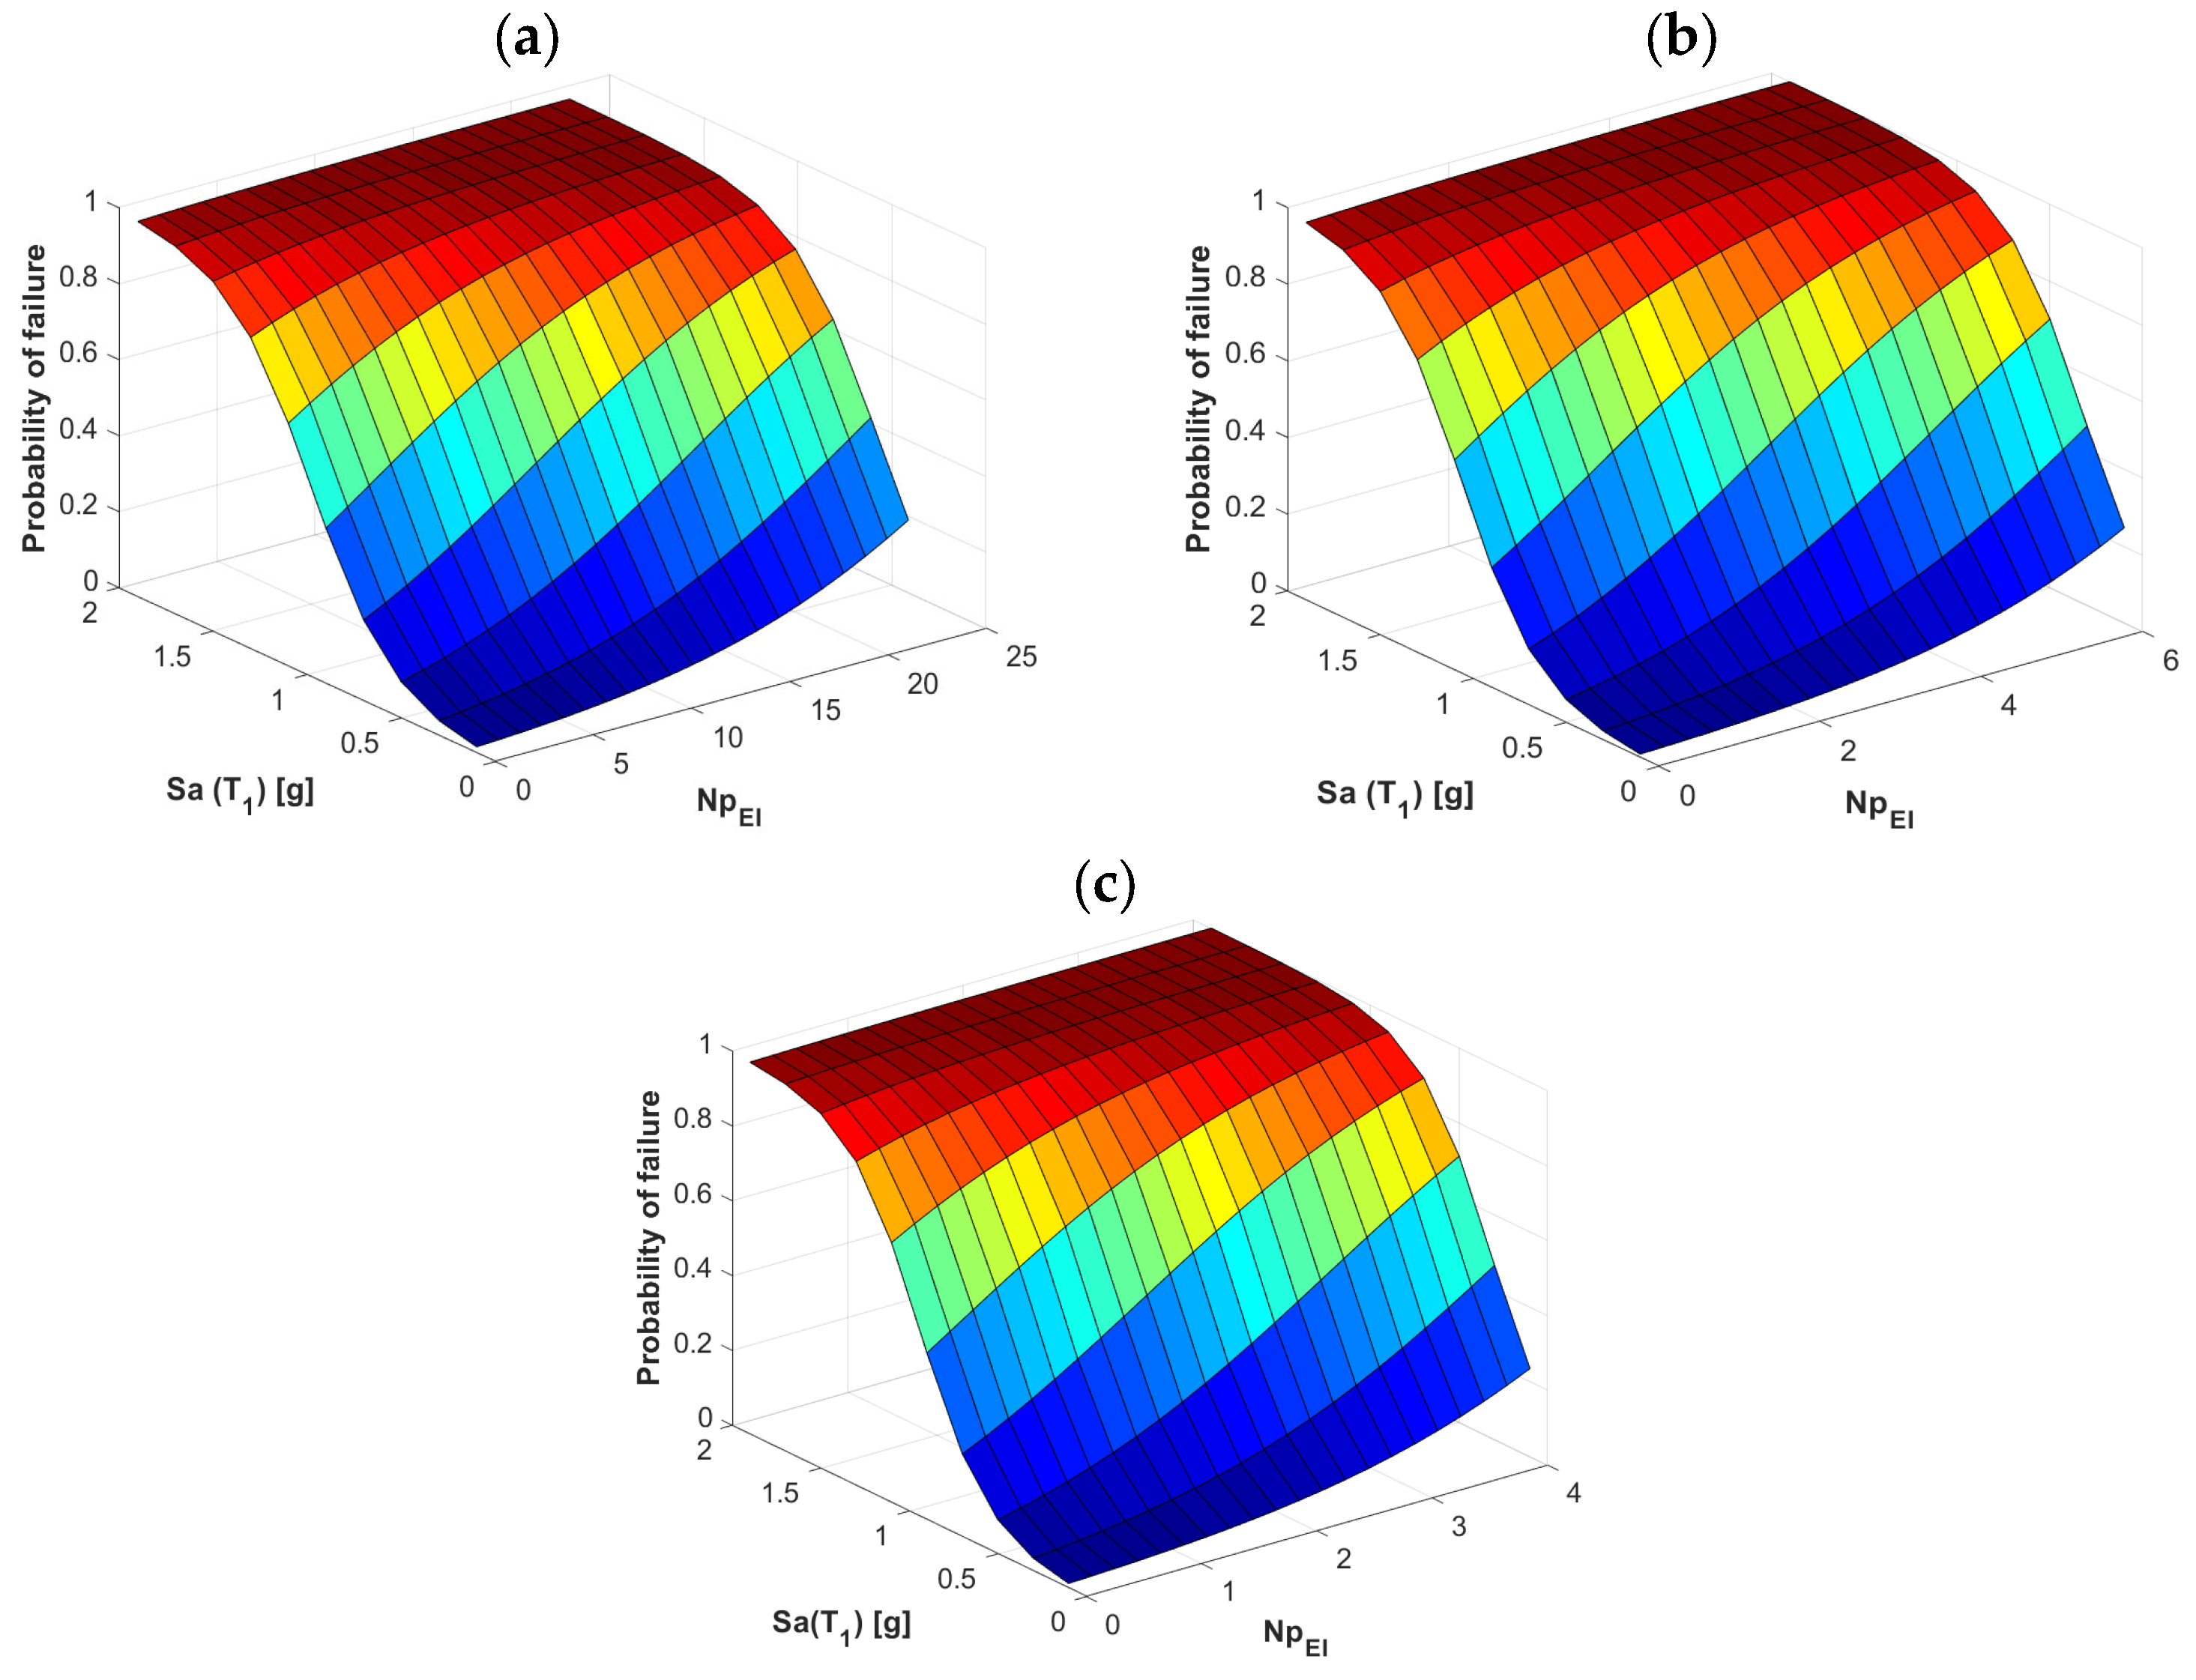
- The vector-valued IMs based on the spectral shape Np had higher influence on the structural response and were more appropriate parameters in the estimation of the probability of failure for trace seismic fragility surfaces.
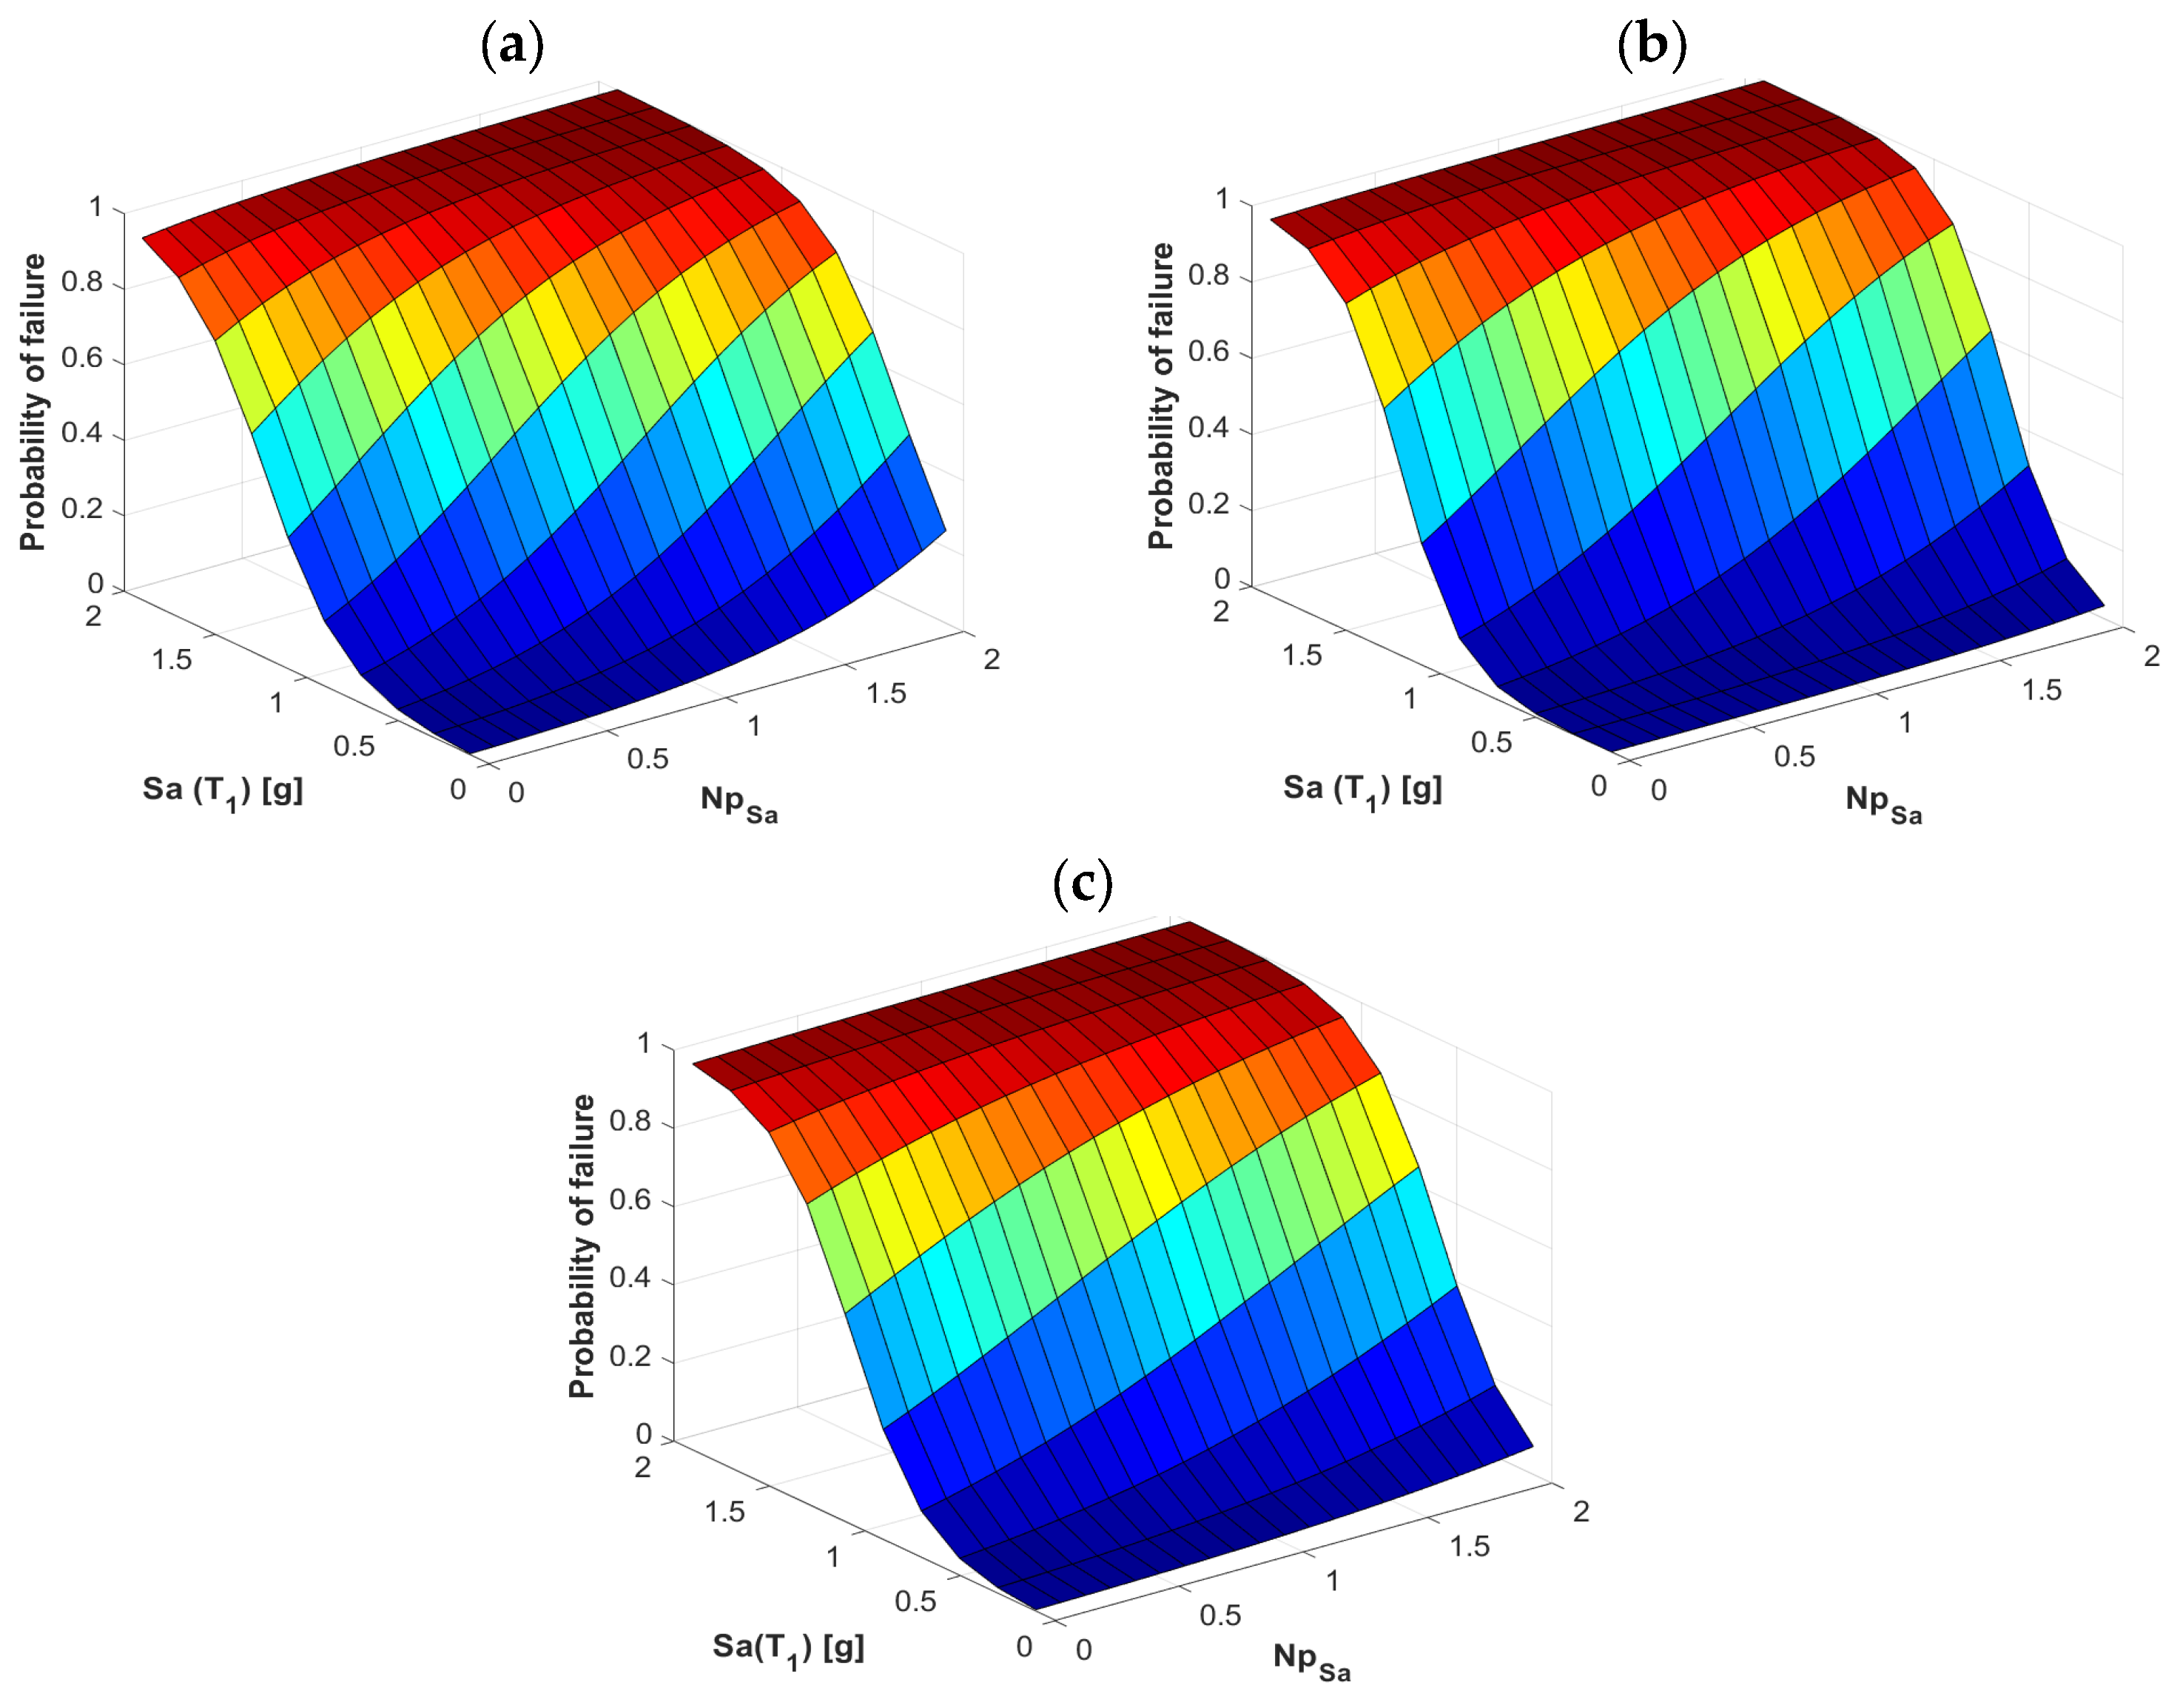
- The IM with the best results as the first component of the vector were Sa(T1) and V(T1) since they generated the fragility surfaces that were most influenced by varying the vector-valued IMs. In addition, the vector <V, NpSa> had the best results and was established as the best estimator for seismic fragility surfaces based on the probability of failure of buildings.
- The vectors <Sa, NpSa>, <Sa, NpV>, <Sa, NpSv>, and <Sa, NpEI> were used to analyze the reinforced concrete buildings of 4, 7, and 10 stories. The results showed that in all cases, there was an important influence on the estimation of the probability of failure regardless of the building being analyzed. The above is valid only for the frames analyzed in this study; further investigation is required for buildings with different heights and topologies.
5. Conclusions
Author Contributions
Funding
Data Availability Statement
Acknowledgments
Conflicts of Interest
References
- Cordova, P.; Deierlein, G.G.; Mehanny, S.S.F.; Cornell, C.A. Development of a Two-Parameter Seismic Intensity Measure and Probabilistic Assessment Procedure. J. Eng. Appl. Sci. 2001, 1, 51. [Google Scholar]
- Baker, J.W.; Cornell, A. Vector-valued intensity measures for pulse-like near-fault ground motions. Eng. Struct. 2008, 30, 1048–1057. [Google Scholar] [CrossRef]
- Riddel, R. On ground motion intensity indices. Earthq. Spectra 2007, 23, 147–173. [Google Scholar] [CrossRef]
- Bojórquez, E.; Iervolino, I. Spectral shape proxies and nonlinear structural response. Soil Dyn. Earthq. Eng. 2011, 31, 996–1008. [Google Scholar] [CrossRef]
- Tothong, P.; Luco, N. Probabilistic seismic demand analysis using advanced ground motion intensity measures. Earthq. Eng. Struct. Dyn. 2007, 36, 1837–1860. [Google Scholar] [CrossRef]
- Lucchini, A.; Mollaioli, F.; Monti, G. Intensity measures for response prediction of a torsional building subjected to bi-directional earthquake ground motion. Bull. Earthq. Eng. 2011, 9, 1499–1518. [Google Scholar] [CrossRef]
- Donaire-Ávila, J.; Mollaioli, F.; Lucchini, A.; Benavent-Climent, A. Intensity measures for the seismic response prediction of mid-rise buildings with hysteretic dampers. Eng. Struct. 2015, 102, 278–295. [Google Scholar] [CrossRef]
- Ge, P.; Zhou, Y. Investigation of efficiency of vector-valued intensity measures for displacement-sensitive tall buildings. Soil Dyn. Earthq. Eng. 2018, 107, 417–424. [Google Scholar] [CrossRef]
- Kiani, J.; Camp, C.; Pezeshk, S. Role of conditioning intensity measure in the influence of ground motion duration on the structural response. Soil Dyn. Earthq. Eng. 2018, 104, 408–417. [Google Scholar] [CrossRef]
- Bojórquez, E.; Iervolino, I.; Reyes-Salazar, A.; Ruiz, S.E. Comparing vector-valued intensity measures for fragility analysis of steel frames in the case of narrow-band ground motions. Eng. Struct. 2012, 45, 472–480. [Google Scholar] [CrossRef]
- Bojórquez, E.; Chávez, R.; Reyes-Salazar, A.; Ruiz, S.E.; Bojórquez, J. A new ground motion intensity measure IB. Soil Dyn. Earthq. Eng. 2017, 99, 97–107. [Google Scholar] [CrossRef]
- Yakhchalian, M.; Nicknam, A.; Amiri, G. Optimal vector-valued intensity measure for seismic collapse assessment of structures. Earthq. Eng. Eng. Vib. 2015, 14, 37–54. [Google Scholar] [CrossRef]
- Yang, C.; Xie, L.; Li, A.; Jia, J.; Zeng, D. Ground motion intensity measures for seismically isolated RC tall buildings. Soil Dyn. Earthq. Eng. 2019, 125, 105727. [Google Scholar] [CrossRef]
- Rajabnejad, H.; Hamidi, H.; Naseri, S.; Abbaszadeh, M. Effect of intensity measure on the response of a 3D-structure under different ground motion duration. Int. J. Eng. 2021, 34, 2219–2237. [Google Scholar]
- Zhou, Y.; Ge, P.; Han, J.; Lu, Z. Vector-valued intensity measures for incremental dynamic analysis. Soil Dyn. Earthq. Eng. 2017, 100, 380–388. [Google Scholar] [CrossRef]
- Tomeo, R.; Bilotta, A.; Pitilakis, D.; Nigro, E. Soil-structure interaction effects on the seismic performances of reinforced concrete moment resisting frames. Procedia Eng. 2017, 199, 230–235. [Google Scholar] [CrossRef]
- Kiani, J.; Camp, C.; Pezeshk, S. The importance of non-spectral intensity measures on the risk-based structural responses. Soil Dyn. Earthq. Eng. 2019, 120, 97–112. [Google Scholar] [CrossRef]
- Liu, T.-T.; Lu, D.-G.; Yu, X.-H. Development of a compound intensity measure using partial least-squares regression and its statistical evaluation based on probabilistic seismic demand analysis. Soil Dyn. Earthq. Eng. 2019, 125, 105725. [Google Scholar] [CrossRef]
- Javadi, E.; Yakhchalian, M. Selection of optimal intensity measure for seismic assessment of steel buckling. Restrained braced frames under Near-Fault ground motions. J. Rehabil. Civ. Eng. 2019, 7, 114–133. [Google Scholar]
- Buratti, N. A comparison of the performances of varios ground-motion intensity measures. In Proceedings of the 15th World Conference on Earthquake Engineering 2012, Lisbon, Portugal, 24–28 September 2012. [Google Scholar]
- Grigoriu, M. Do seismic intensity measures (IMs) measure up? Probabilistic Eng. Mech. 2016, 46, 80–93. [Google Scholar] [CrossRef] [Green Version]
- Kiani, J.; Pezeshk, S. Sensitivity analysis of the seismic demands of RC moment resisting frames to different aspects of ground motions. Earthq. Eng. Struct. Dyn. 2017, 46, 2739–2755. [Google Scholar] [CrossRef]
- Mollaioli, F.; Lucchini, A.; Cheng, Y.; Monti, G. Intensity measures for the seismic response prediction of base-isolated buildings. Bull. Earthq. Eng. 2013, 11, 1841–1866. [Google Scholar] [CrossRef]
- Palanci, M.; Senel, S. Correlation of earthquake intensity measures and spectral displacement demands in building type structures. Soil Dyn. Earthq. Eng. 2019, 121, 306–326. [Google Scholar] [CrossRef]
- Torres, J.I. Eficiencia de Medidas de Intensidad Sísmica Vectorial en la Predicción de la Respuesta de Edificios de C/R; Universidad Autónoma de Sinaloa: Culiacán, México, 2018; p. 102. [Google Scholar]
- Tsantaki, S.; Adam, C.; Ibarra, L. Intensity measures that reduce collapse capacity dispersion of P-delta vulnerable simple systems. Bull. Earthq. Eng. 2016, 15, 1085–1109. [Google Scholar] [CrossRef] [Green Version]
- Bojórquez, E.; Reyes-Salazar, A.; Ruiz, S. On the Use of Vector-Valued Intensity Measure to Predict Peak and Cumulative Demands of Steel Frames under Narrow-Band Motions. Appl. Mech. Mater. 2014, 595, 137–142. [Google Scholar] [CrossRef]
- Bojorquez, E.; Astorga, L.; Reyes-Salazar, A.; Teran-Gilmore, A.; Velazquez, J.; Bojorquez, J.; Rivera, L. Prediction of hysteretic energy demands in steel frames using vector-valued IMs. Steel Compos. Struct. 2015, 19, 697–711. [Google Scholar] [CrossRef] [Green Version]
- Torres, J.I.; Bojórquez, E.; Reyes, A.; Bojórquez, J. Vector-valued intensity measures to predict peak and hysteretic energy demands of 3D R/C buildings. Energy-Based Seism. Eng. 2021, 155, 274–289. [Google Scholar]
- Hosseinpour, F.; Abdelnaby, A. Fragility curves for RC frames under multiple earthquakes. Soil Dyn. Earthq. Eng. 2017, 98, 222–234. [Google Scholar] [CrossRef]
- Mai, C.; Konakli, K.; Sudret, B. Seismic fragility curves for structures using non-parametric representations. Front. Struct. Civ. Eng. 2017, 11, 169–186. [Google Scholar] [CrossRef] [Green Version]
- Uang, C.-M.; Bertero, V. Evaluation of seismic energy in structures. Earthq. Eng. Struct. Dyn. 1990, 19, 77–90. [Google Scholar] [CrossRef]
- RCDMX. Normas Técnicas Complementarias para el Diseño por Sismo; Gaceta Oficial de la Ciudad de México: Ciudad de México, México, 2017. [Google Scholar]
- Carr, A. Ruamoko 3D Manual; University of Canterbury: Christchurch, New Zealand, 2015. [Google Scholar]
- Teran-Gilmore, A.; Jirsa, J. The use of cumulative ductility strength spectra for seismic design against low cycle fatigue. In Proceedings of the 13th World Conference on Earthquake Engineering, Vancouver, BC, Canada, 1–6 August 2004; Volume 889. [Google Scholar]
- Vamvatsikos, D.; Cornell, C. Incremental dynamic analysis. Earthq. Eng. Struct. Dyn. 2002, 31, 491–514. [Google Scholar] [CrossRef]
- Amiri, M.; Yakhchalian, M. Performance of intensity measures for seismic collapse assessment of structures with vertical mass irregularity. Structures 2020, 24, 728–741. [Google Scholar] [CrossRef]
- Minas, S.; Galasso, C. Accounting for spectral shape in simplified fragility analysis of case-study reinforced concrete frames. Soil Dyn. Earthq. Eng. 2019, 119, 91–103. [Google Scholar] [CrossRef]
- Chávez, R.; Bojórquez, E. Seismic hazard maps based on the intensity measure INp. KSCE J. Civ. Eng. 2017, 22, 247–256. [Google Scholar] [CrossRef]
- Ruggieri, S.; Calò, M.; Cardellicchio, A.; Uva, G. Analytical-mechanical based framework for seismic overall fragility analysis of existing RC buildings in town compartments. Bull. Earthq. Eng. 2022, 20, 8179–8216. [Google Scholar] [CrossRef]
- Ruggieri, S.; Vukobratovic, V. Acceleration demands in single-storey RC buildings with flexible diaphragms. Eng. Struct. 2023, 275 Part A, 115276. [Google Scholar] [CrossRef]
- Gehl, P.; Seyedi, D.; Douglas, J. Vector-valued fragility functions for seismic risk evaluation. Bull. Earthq. Eng. 2013, 11, 365–384. [Google Scholar] [CrossRef]


| Intensity Measures | Mathematical Formulation |
|---|---|
| Peak Ground Acceleration (PGA) |  |
| Peak Ground Velocity (PGV) | |
| Effective duration (tD) 1 | |
| Earthquake damage potential (ID) | |
| Spectral parameter NpSa | |
| Spectral parameter NpV | |
| Spectral parameter NpSv | |
| Spectral parameter NpEI |
| Vector-Valued IMs | Peak Ground Response | Duration | Spectral Shape |
|---|---|---|---|
| <Sa, PGA> | * | ||
| <Sa, PGV> | * | ||
| <Sa, tD> | * | * | |
| <Sa, ID> | * | * | |
| <Sa, NpSa> | * | * | |
| <Sa, NpV> | * | * | |
| <Sa, NpSv> | * | * | |
| <Sa, NpEI> | * | * | |
| <V, PGA> | * | ||
| <V, PGV> | * | ||
| <V, tD> | * | * | |
| <V, ID> | * | * | |
| <V, NpSa> | * | * | |
| <V, NpV> | * | * | |
| <V, NpSv> | * | * | |
| <V, NpEI> | * | * | |
| <Sv, PGA> | * | ||
| <Sv, PGV> | * | ||
| <Sv, tD> | * | * | |
| <Sv, ID> | * | * | |
| <Sv, NpSa> | * | * | |
| <Sv, NpV> | * | * | |
| <Sv, NpSv> | * | * | |
| <Sv, NpEI> | * | * | |
| <EI, PGA> | * | ||
| <EI, PGV> | * | ||
| <EI, tD> | * | * | |
| <EI, ID> | * | * | |
| <EI, NpSa> | * | * | |
| <EI, NpV> | * | * | |
| <EI, NpSv> | * | * | |
| < EI, NpEI> | * | * |
| Frame | Number of Stories | T1 (s) | Cy | Dy (m) |
|---|---|---|---|---|
| F4 | 4 | 0.50 | 0.45 | 0.136 |
| F7 | 7 | 0.90 | 0.42 | 0.189 |
| F10 | 10 | 1.07 | 0.36 | 0.226 |
| Event | Date | Seismic Station | Longitude (°) 1 | Latitude (°) 1 | Magnitude (Mw) | PGA (cm/s2) | PGV (cm/s) | tD (s) | ID |
|---|---|---|---|---|---|---|---|---|---|
| 1 | 19/09/1985 | SCT | −102.468 | 18.419 | 8.1 | 178.0 | 59.5 | 63.3 | 13.1 |
| 2 | 21/09/1985 | Tláhuac Deportivo | −101.681 | 17.828 | 7.6 | 48.7 | 14.6 | 133.8 | 0.8 |
| 3 | 25/04/1989 | Alameda | −99.275 | 16.795 | 6.8 | 45.0 | 15.6 | 115.8 | 17.1 |
| 4 | 25/04/1989 | Garibaldi | −99.275 | 16.795 | 6.8 | 68.0 | 21.5 | 117.8 | 8.8 |
| 5 | 25/04/1989 | SCT | −99.275 | 16.795 | 6.8 | 44.9 | 12.8 | 128.4 | 14.2 |
| 6 | 25/04/1989 | Sector Popular | −99.275 | 16.795 | 6.8 | 45.1 | 15.3 | 117.4 | 28.3 |
| 7 | 25/04/1989 | Tlatelolco TL08 | −99.275 | 16.795 | 6.8 | 52.9 | 17.3 | 118.9 | 9.4 |
| 8 | 25/04/1989 | Tlatelolco TL55 | −99.275 | 16.795 | 6.8 | 49.5 | 17.3 | 132.3 | 7.3 |
| 9 | 14/09/1995 | Alameda | −98.667 | 16.752 | 7.3 | 39.3 | 12.2 | 105.3 | 13.8 |
| 10 | 14/09/1995 | Garibaldi | −98.667 | 16.752 | 7.3 | 39.1 | 10.6 | 89.6 | 24.1 |
| 11 | 14/09/1995 | Liconsa | −98.667 | 16.752 | 7.3 | 30.1 | 9.62 | 92.3 | 14.1 |
| 12 | 14/09/1995 | Plutarco E.C | −98.667 | 16.752 | 7.3 | 33.5 | 9.37 | 95.9 | 16.7 |
| 13 | 14/09/1995 | Sector Popular | −98.667 | 16.752 | 7.3 | 34.3 | 12.5 | 122.1 | 36.4 |
| 14 | 14/09/1995 | Tlatelolco TL08 | −98.667 | 16.752 | 7.3 | 27.5 | 7.8 | 142.4 | 28.2 |
| 15 | 14/09/1995 | Tlatelolco TL55 | −98.667 | 16.752 | 7.3 | 27.2 | 7.4 | 124.7 | 56.9 |
| 16 | 09/10/1995 | Cibeles | −104.245 | 18.993 | 8.0 | 14.4 | 4.6 | 125.3 | 35.9 |
| 17 | 09/10/1995 | CU Juárez | −104.245 | 18.993 | 8.0 | 15.8 | 5.1 | 122.5 | 34.6 |
| 18 | 09/10/1995 | C.U.P.J | −104.245 | 18.993 | 8.0 | 15.7 | 4.8 | 130.1 | 33.2 |
| 19 | 09/10/1995 | Córdoba | −104.245 | 18.993 | 8.0 | 24.9 | 8.6 | 113.5 | 23.4 |
| 20 | 09/10/1995 | Liverpool | −104.245 | 18.993 | 8.0 | 17.6 | 6.3 | 147.1 | 17.2 |
| 21 | 09/10/1995 | Plutarco E.C | −104.245 | 18.993 | 8.0 | 19.2 | 7.9 | 99.0 | 33.7 |
| 22 | 09/10/1995 | Sector Popular | −104.245 | 18.993 | 8.0 | 13.7 | 5.3 | 123.9 | 37.9 |
| 23 | 09/10/1995 | Valle Gómez | −104.245 | 18.993 | 8.0 | 17.9 | 7.18 | 131.3 | 24.5 |
| 24 | 11/01/1997 | CU Juárez | −102.580 | 18.340 | 7.1 | 16.2 | 5.9 | 117.7 | 21.4 |
| 25 | 11/01/1997 | C.U.P.J | −102.580 | 18.340 | 7.1 | 16.3 | 5.5 | 109.5 | 23.3 |
| 26 | 11/01/1997 | García Campillo | −102.580 | 18.340 | 7.1 | 18.7 | 6.9 | 104.6 | 9.3 |
| 27 | 11/01/1997 | Plutarco E.C. | −102.580 | 18.340 | 7.1 | 22.2 | 8.6 | 112.3 | 14.3 |
| 28 | 11/01/1997 | Estación 10 Roma A | −102.580 | 18.340 | 7.1 | 21.0 | 7.76 | 88.7 | 25.6 |
| 29 | 11/01/1997 | Estación 11 Roma B | −102.580 | 18.340 | 7.1 | 20.4 | 7.1 | 96.5 | 27.1 |
| 30 | 11/01/1997 | Tlatelolco TL08 | −102.580 | 18.340 | 7.1 | 16.0 | 7.2 | 120.9 | 14.9 |
Disclaimer/Publisher’s Note: The statements, opinions and data contained in all publications are solely those of the individual author(s) and contributor(s) and not of MDPI and/or the editor(s). MDPI and/or the editor(s) disclaim responsibility for any injury to people or property resulting from any ideas, methods, instructions or products referred to in the content. |
© 2023 by the authors. Licensee MDPI, Basel, Switzerland. This article is an open access article distributed under the terms and conditions of the Creative Commons Attribution (CC BY) license (https://creativecommons.org/licenses/by/4.0/).
Share and Cite
Zavala, N.; Bojórquez, E.; Barraza, M.; Bojórquez, J.; Villela, A.; Campos, J.; Torres, J.; Sánchez, R.; Carvajal, J. Vector-Valued Intensity Measures Based on Spectral Shape to Predict Seismic Fragility Surfaces in Reinforced Concrete Buildings. Buildings 2023, 13, 137. https://doi.org/10.3390/buildings13010137
Zavala N, Bojórquez E, Barraza M, Bojórquez J, Villela A, Campos J, Torres J, Sánchez R, Carvajal J. Vector-Valued Intensity Measures Based on Spectral Shape to Predict Seismic Fragility Surfaces in Reinforced Concrete Buildings. Buildings. 2023; 13(1):137. https://doi.org/10.3390/buildings13010137
Chicago/Turabian StyleZavala, Noel, Edén Bojórquez, Manuel Barraza, Juan Bojórquez, Almendra Villela, José Campos, José Torres, Ricardo Sánchez, and Joel Carvajal. 2023. "Vector-Valued Intensity Measures Based on Spectral Shape to Predict Seismic Fragility Surfaces in Reinforced Concrete Buildings" Buildings 13, no. 1: 137. https://doi.org/10.3390/buildings13010137