Article

Optimizing Building Orientation and Roof Angle of a Typhoon-Resilient Single-Family House Using Genetic Algorithm and Computational Fluid Dynamics

1
Graduate School of Engineering, Mindanao State University—Iligan Institute of Technology, Iligan City 9200, Philippines
2
Department of Civil Engineering and Technology, Mindanao State University—Iligan Institute of Technology, Iligan City 9200, Philippines
3
Department of Mechanical Engineering and Technology, Mindanao State University—Iligan Institute of Technology, Iligan City 9200, Philippines
*
Author to whom correspondence should be addressed.
Buildings 2023, 13(1), 107; https://doi.org/10.3390/buildings13010107
Submission received: 8 November 2022 / Revised: 22 December 2022 / Accepted: 24 December 2022 / Published: 31 December 2022
(This article belongs to the Topic Advances in Building Simulation)

Abstract

:
In the event of a typhoon, the majority of houses suffer from large amounts of damage because they were not built with typhoon resilience in mind. For instance, the Philippines is one of the world’s most vulnerable countries to typhoons. Often, roof structures are ripped off during typhoons with average or more vigorous wind gustiness, and houses are easily ruined. This situation led us to search for the appropriate building orientation and roof angle of single-family residential houses through simulations using MATLAB’s genetic algorithm (GA) and SolidWorks’ computational fluid dynamics (CFD). The GA provides the set of design points, while CFD generates a fitness score for each design point. The goal of the optimization is to determine the orientation and roof angle while minimizing the drag force along the direction of a constant wind speed (315 km/h). The lower and upper bounds for house orientation are 0 and 90 , respectively; the roof angle is between 3 and 60 . After 100 generations, the GA converged to values equal to an 80 orientation and 11 roof angle. The final results provide a good standpoint for future experiments on physical structures.

Graphical Abstract

1. Introduction

The Philippines is one of the world’s most vulnerable to atmospheric disturbances. The country’s geography and weak infrastructure are two unique factors that have combined to exacerbate both threats, and devastating consequences [1]. One of these distressing consequences is the destruction of houses, warehouses, and buildings, with many roof structures ripped off during the strong winds brought by storms. For example, Super Typhoon Rolly, with the international name of Goni, struck the Philippines in 2020, and was the most robust tropical cyclone at landfall (313.82 km/h) in history [2]. The typhoon’s violent winds and torrential rains blew away roofs and toppled structures. It also caused severe flooding and landslides throughout the Bicol region.
Other countries around the world have experienced the same fate. For instance, in Bangladesh, many buildings had roofs blown away by the 165 km/h winds of the Amphan cyclone [3]. In Vietnam, more than 6200 houses in districts were either entirely or partially unroofed and destroyed by Typhoon Molave with three-minute sustained wind speeds of 170 mph in the same year Typhoon Amphan hit Bangladesh [4]. Many volunteers have been deployed to devastated communities to rebuild houses severely damaged by the storms.
If a single-family house is built so that it can endure strong wind gusts, it can be said to be typhoon-resistant. For instance, the damage intensity experienced by low-level buildings is highly associated with the roof angle. The numerical simulations of building design show good agreement in predicting the effect of wind on low-rise buildings [5]. Another illustration would be determining the ideal housing orientation when a high wind load is applied. Compared with the other wind direction, the impact of solid external pressure is more significant over broader sections of the house [6].
In addition to constructing low-rise residential houses for typhoon resilience, engineers consider other distinct features for design optimization. Numerous dynamic studies have examined the influence of traffic volumes [7,8], harsh climate [9,10], and seismic activities [11,12].
In a case study, ref. [7] assessed the traffic-induced vibrations in low-rise residential buildings. The vibration analysis showed that the vehicles’ passage was at acceptable levels. Fence presence and building distance from it both play a crucial part in attenuating vibrations produced by traffic. In addition to the movement of automobiles, frequent train operations in metropolitan areas can harm the residents of the buildings in terms of audible and palpable vibration. The cost-efficient method in [8] anticipated vibration transmissions from columns onto girders and flooring.
Harsh hot arid climates are also a significant concern in designing residential houses. A naturally ventilated building can provide thermal comfort as it is less likely to consume more energy. For instance, the retrofit strategy in [9] efficiently reduced a villas’ cooling load by 10% through parametric shading structure. Similarly, a wind tower with a single-sided house in [10] achieved ventilation effectiveness of 15% to 40% lower than the underground application of wind towers. The optimized roof structure and multiple window configurations improved the cross-ventilation, making wind towers practically coherent in contemporary house design.
Seismic vulnerability analysis is used to evaluate a building’s susceptibility to earthquakes. For example, the construction of low-rise reinforced concrete buildings [11] adopted a structural form with brick infills. The researchers performed a fragility analysis of the buildings to reveal the physical weaknesses of the structural elements and the soil–foundation–structure interaction. They outlined how this kind of low-rise building’s soil–structure interaction is damage-state-sensitive. In a similar context, authors [12] presented a two-dimensional model for the interaction of two identical vibrating structures supported by stiff foundations contained in a layered half-space for in-plane motions and incident-plane SV waves. Their findings indicated a more significant degree of coupling than antiplane motions. In contrast with a standalone structure, a building’s relative response to a vertically incident SV waves may be up to 50% stronger at a distance where it may be reduced by as much as 30%. Nonetheless, results [11,12] have implied that engineers must consider a building’s seismic response in the design stage.
Because no studies have yet highlighted the scenarios within the Philippines setting, it is in that context that we decided to conduct this quantitative study using advanced tools such as SolidWorks’s computational fluid dynamics (CFD) and MATLAB’s genetic algorithm (GA) derived from various literature and studies. With these recurring predicaments, it was essential to conduct this study to design a method of optimizing the building orientation and roof angle in terms of applied wind loads using MATLAB and SolidWorks. Using these tools gave the perfect fitness score result, so the two combined design parameters are highly resilient to strong winds. Presented in the following section is a literature review on the tools we used.

1.1. Computational Fluid Dynamics Simulations for Typhoons

The numerical simulations in this study were based on the concept of computational fluid ddynamics (CFD). In [13], CFD demonstrated the possibility of providing the structural designer with the necessary wind pressure data for a broad spectrum of structures. The authors generated building models according to the most frequently used structures with inclined roofs, such as double-slope gable roofs and mono-slope sawtooth structures. These two structures are widely used in industrial buildings considering the effect of roof slope angles on wind pressure distribution. Furthermore, based on their analysis, CFD provides results very close to the experimentally obtained values for walls and the leeward side of a roof, but there is a gap between results for the windward side. As such, the application of CFD techniques shows excellent potential to offer wind design data for structures with shapes. It advantageously provides flexibility to change parametric design parameters without changing the existing system of the model. Moreover, the authors in [14] argued that the CFD’s computational domain should have an optimized size to avoid uneconomic grids with large meshes. Their framework involves parametrizing the domain dimensions based on sensitivity analyses, where optimal values are obtained from acceptable levels of the following four domain errors: the wind-blocking effect, flow circulation, global venturi effect, and local venturi effect.
We also used CFD simulation to determine the impacts of roof slope and wind direction on wind pressure distribution over the pyramidal roof of low-rise buildings with a square plan. In [15], CFD was carried out for different models of pyramidal roof buildings with similar plan shapes but different roof angles and varying wind directions. The results showed that the velocity profile of the vertical locations near the building model on the windward side gradually decreased compared with that of the lines near the inlet location. In a separate study [16], through CFD simulations, a hexagonal pyramidal roof surface building was found to have low-pressure coefficients and better chances of survival than a pentagonal pyramidal roof surface building. This is due to the hexagonal plan shape roof, which has more faces than the pentagonal roof surface. It causes a better distribution of wind over the roof surface.
Based on numerical evaluations through CFD, the stability of various physical structures can be simulated under typhoon conditions. Different typhoon roofing designs produced diverse velocity fields and streamlines for several detached structures in the Philippines. After considering the materials and installation methods, the recommendation was to consider the importance of roofing configuration (gabled or pyramidal) and eaves overhang to minimize roof ripping due to the high-pressure coefficient on the windward side [17]. In addition to a detached structure, CFD simulations are accurate in determining the reaction of a high-rise building in a wind environment. The two k- ϵ turbulent models, realizable two-layer K-epsilon (RTKLE) and standard two-layer K-epsilon (STLKE), were appropriate for simulating the area around high-rise buildings with low- and and high-wind-speed areas, respectively [18]. In a similar context, a CFD study on wind turbines demonstrated that typhoons decrease the buckling stability and ultimate bearing capacity of a single wind turbine, despite the increased aerodynamic force and structural responses [19]. With 360-degree full-wind directions under typhoon conditions, a CFD simulation resulted in a detailed reference for the fatigue life and ultimate strength of a wind turbine design [20]. Based on the literature on CFD simulations for typhoons, using numerical simulations such as CFD affirmed the possibility of providing structural design engineers with recommendations for a broad spectrum of structures.

1.2. Genetic-Algorithm-Based Optimizations for Typhoon

We also adopted a genetic algorithm (GA) application. GA is a search technique that draws inspiration from the biological evolution of living things and the idea of natural selection. GA considers the problem space as a population of individuals, which then repeatedly produces generations to discover the fittest candidate. GA develops from an initial population of low-quality individuals to an eventual population of high-quality individuals, each offering a potential solution set [21]. The fitness function measures the quality of each rule as a quantitative representation of each adaptation to the environment.
In studies related to typhoon resilience, genetic algorithm was employed to perform design parameter searches. For instance, the roof trusses of building structures were investigated, where GA produced the optimal size, shape, and topology [22]. As demonstrated in [23], GA also offered ideal roofing structures for thermal comfort. In addition to roof structure design, GA-based optimization was valuable for creating nowcasting and forecasting weather systems. The reverse-optimization analysis through a real-coded genetic algorithm helped calibrate the regional hydrogeological parameters of a real-time nowcasting system for assessing landslide hazards under extreme rainfall conditions [24]. Additionally, the multiobjective genetic algorithm obtained typhoon inundation forecast models with high accuracy, low time shift error, and low error distribution when combined with the autoregressive model with eXogenous inputs (ARX) [25]. Lastly, typhoon rainfall forecasting is more accurate in producing forecasts of a 1 day cumulative rainfall if the system integrates a genetic algorithm into the ensemble numerical weather prediction [26]. Nevertheless, in addition to constructing typhoon-resistant structures, the genetic algorithm benefits disaster warning and water resources management during typhoons.

1.3. Relevant Studies Using CFD and GA

CFD-based numerical modeling and GA-based optimization are integrable strategies used to generate highly recommendable designs for various technological products such as photovoltaic panel arrays [27], automobiles [28,29], wind turbines [30,31,32,33], unmanned aerial vehicles [34], and other industrial machinery [35]. The combination of CFD and GA achieved a minimum aerodynamic lift force on the photovoltaic structure by searching for the best tilt angle and pitch values between two rows of solar panels [27]. In the automobile industry, it is essential to continue improving the aerodynamic performance of vehicles through parametrizing geometries using GA [28,29]. In these investigations, the design goal was to lower the drag coefficient while considering rthe pressure constraints in the CFD simulations. Similarly, the blade’s aerodynamics, high startup torque, and wind conditions directly affect the wind turbine’s annual energy production [30,31,32,33]. The blade shape (chord length, twist angle, and relative thickness) [30,31,32,33] and rated rotational speed [30,31] are several design variables used to attain optimal wind turbine design. The CFD simulations on wind turbines in [30,31,32,33] were partnered with the GA to find the design variables’ optimal values. In addition to wind turbines, the integrated approach of CFD and GA ascertained an agricultural UAV design with optimal root chord, wing tip chord, wingspan, and sweep angle through time coefficient and air resistance minimization [34]. Lastly, a power plant boiler’s efficiency was increased by simulating slag formation in CFD with GA-based control of the velocity and temperature of the air inlets in the machinery [35].
These studies and the conclusion in [36] strengthened the application of GA and CFD in this study. In this context, GA shows potential for finding the best solution to optimization problems when combined with other methods.
Furthermore, based on the existing outcomes, we introduced simulation–optimization tools that integrate GA and CFD to identify the optimal values of the roof angle and housing orientation to minimize the wind damage caused by typhoons. This study is novel because of two main contributions to the scientific body of knowledge: First, the search for optimal values of building orientation and roof angle has not yet been explored in the literature. Second, to the best of our knowledge, no existing study used the GA and CFD to optimize low-rise, single-family residential houses for typhoon resilience.

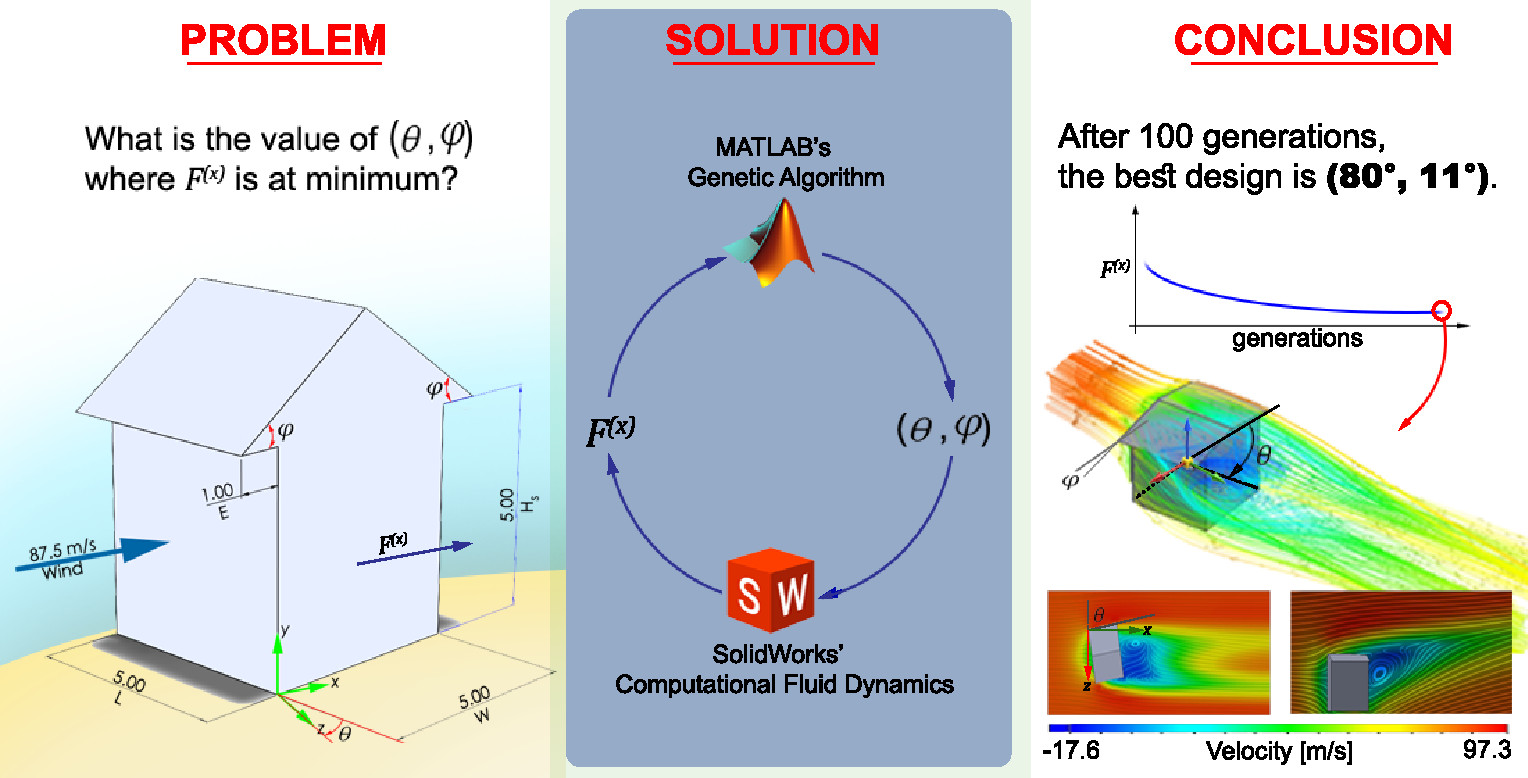
2. Materials and Methods

The objective of this study was to design an optimization of building orientation and roof angle of a single-family house using a combination of MathWorks MATLAB’s Genetic Algorithm and Dassault Systèmes SolidWorks’ Computational Fluid Dynamics on applied wind load force. The development of the optimization strategy followed two stages: first, designing the building model in SolidWorks; second, integrating the model into MATLAB’s GA optimization solver.

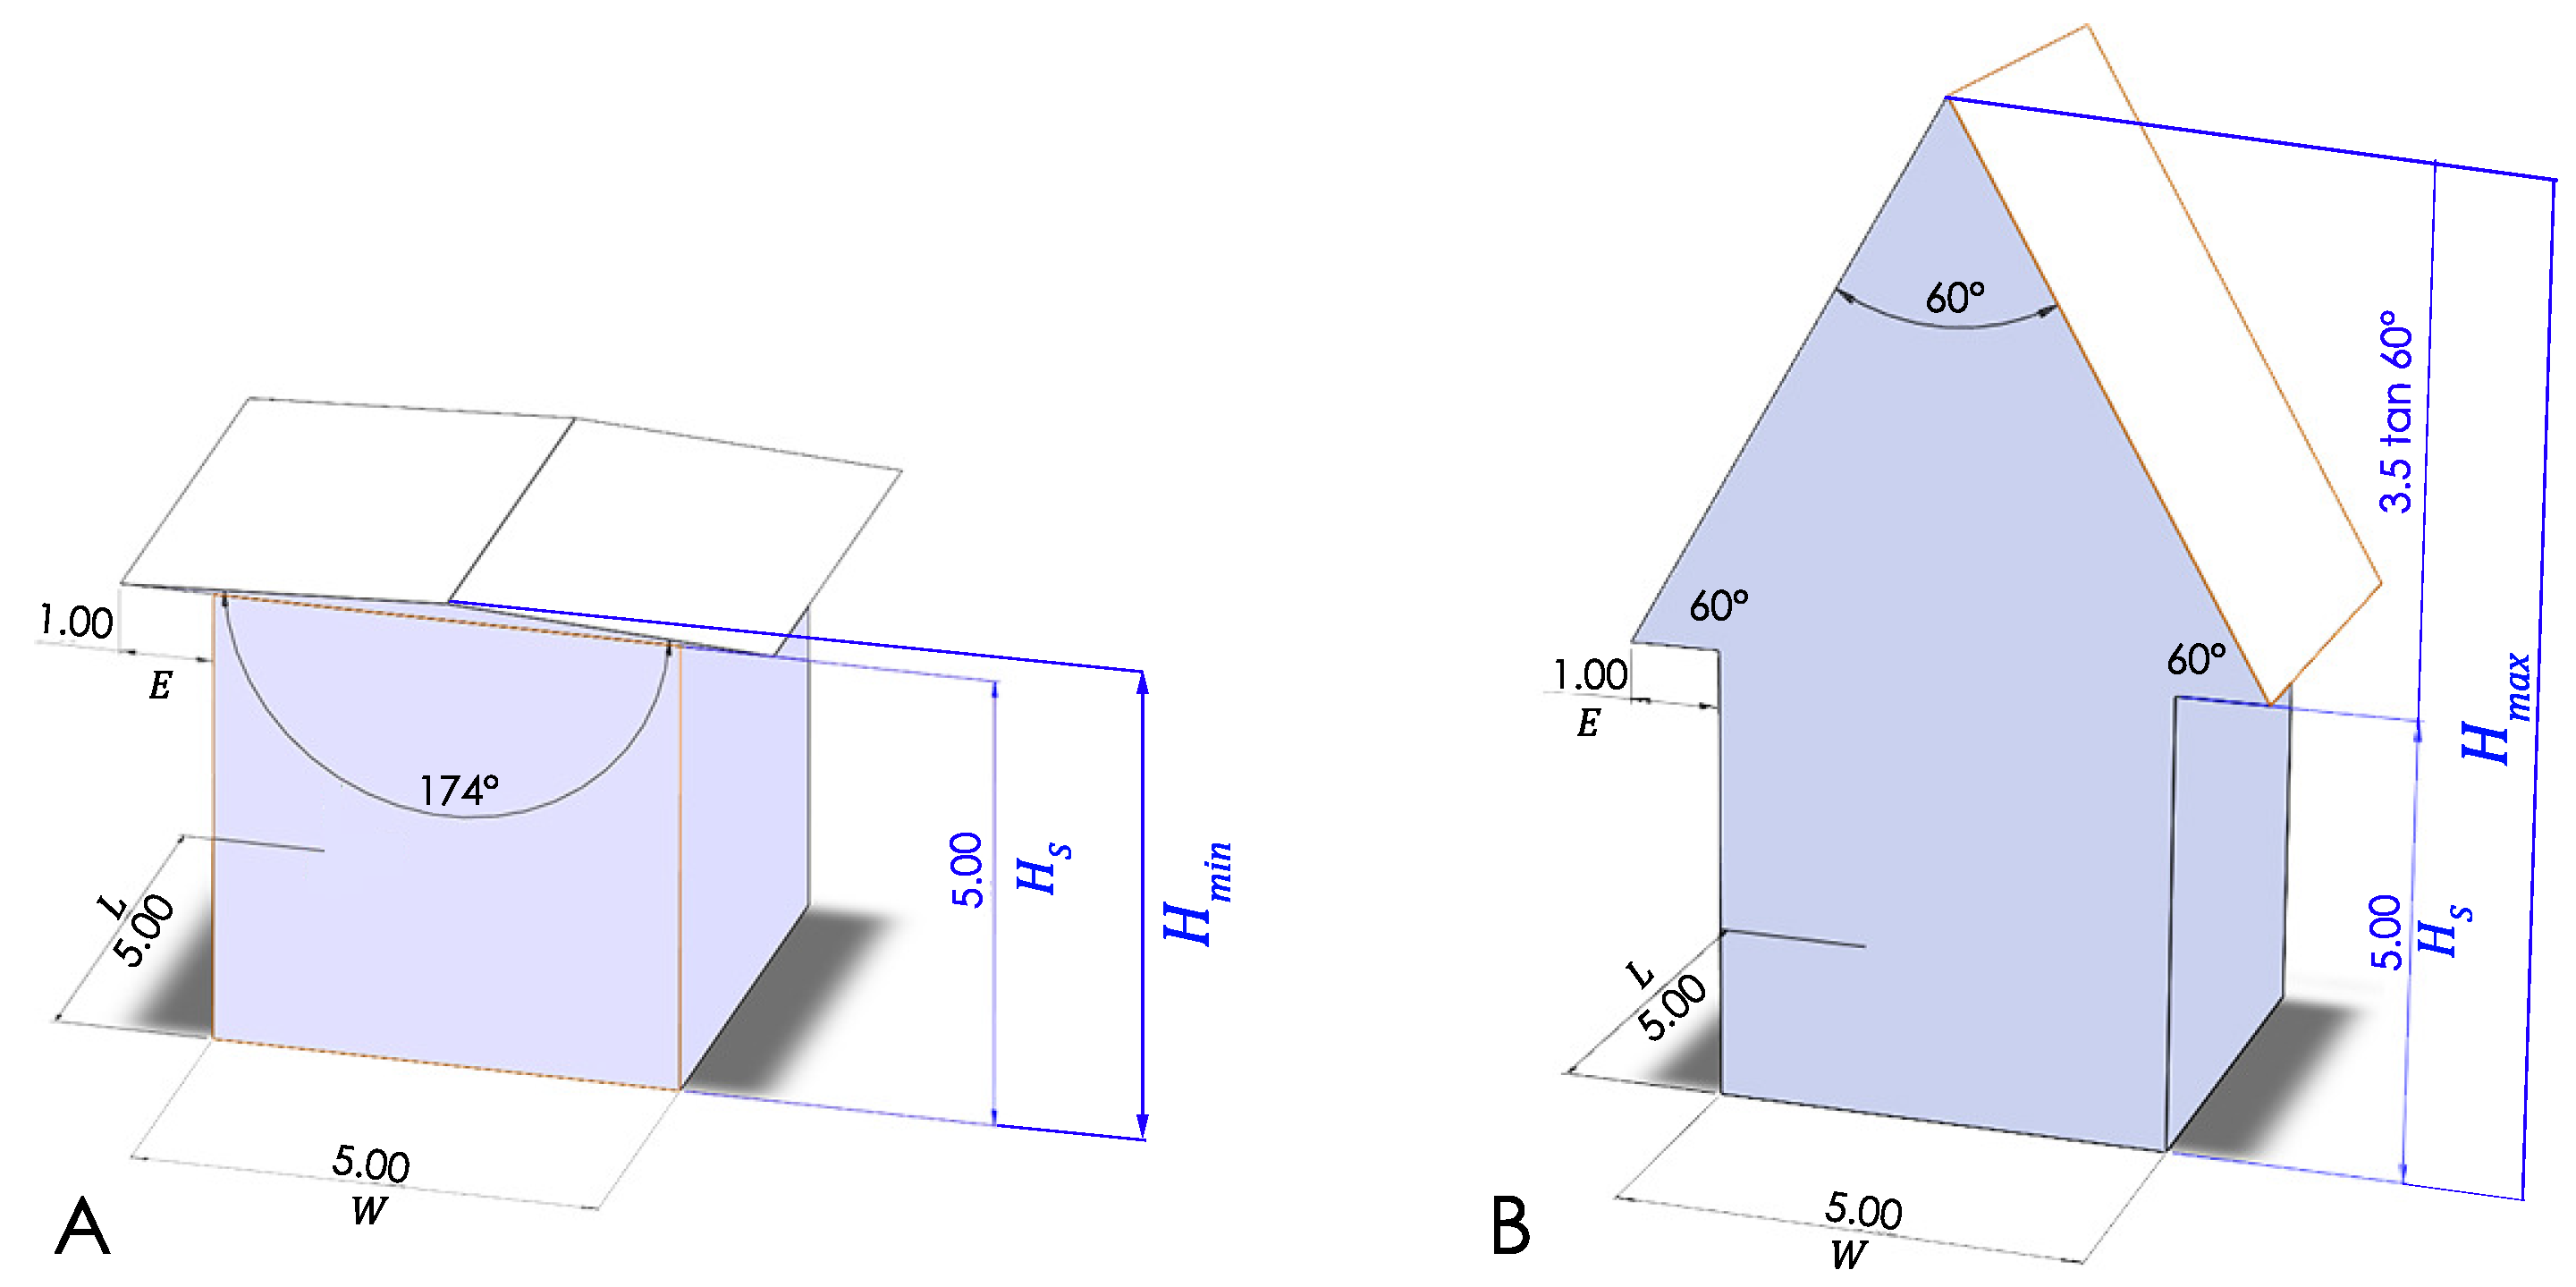
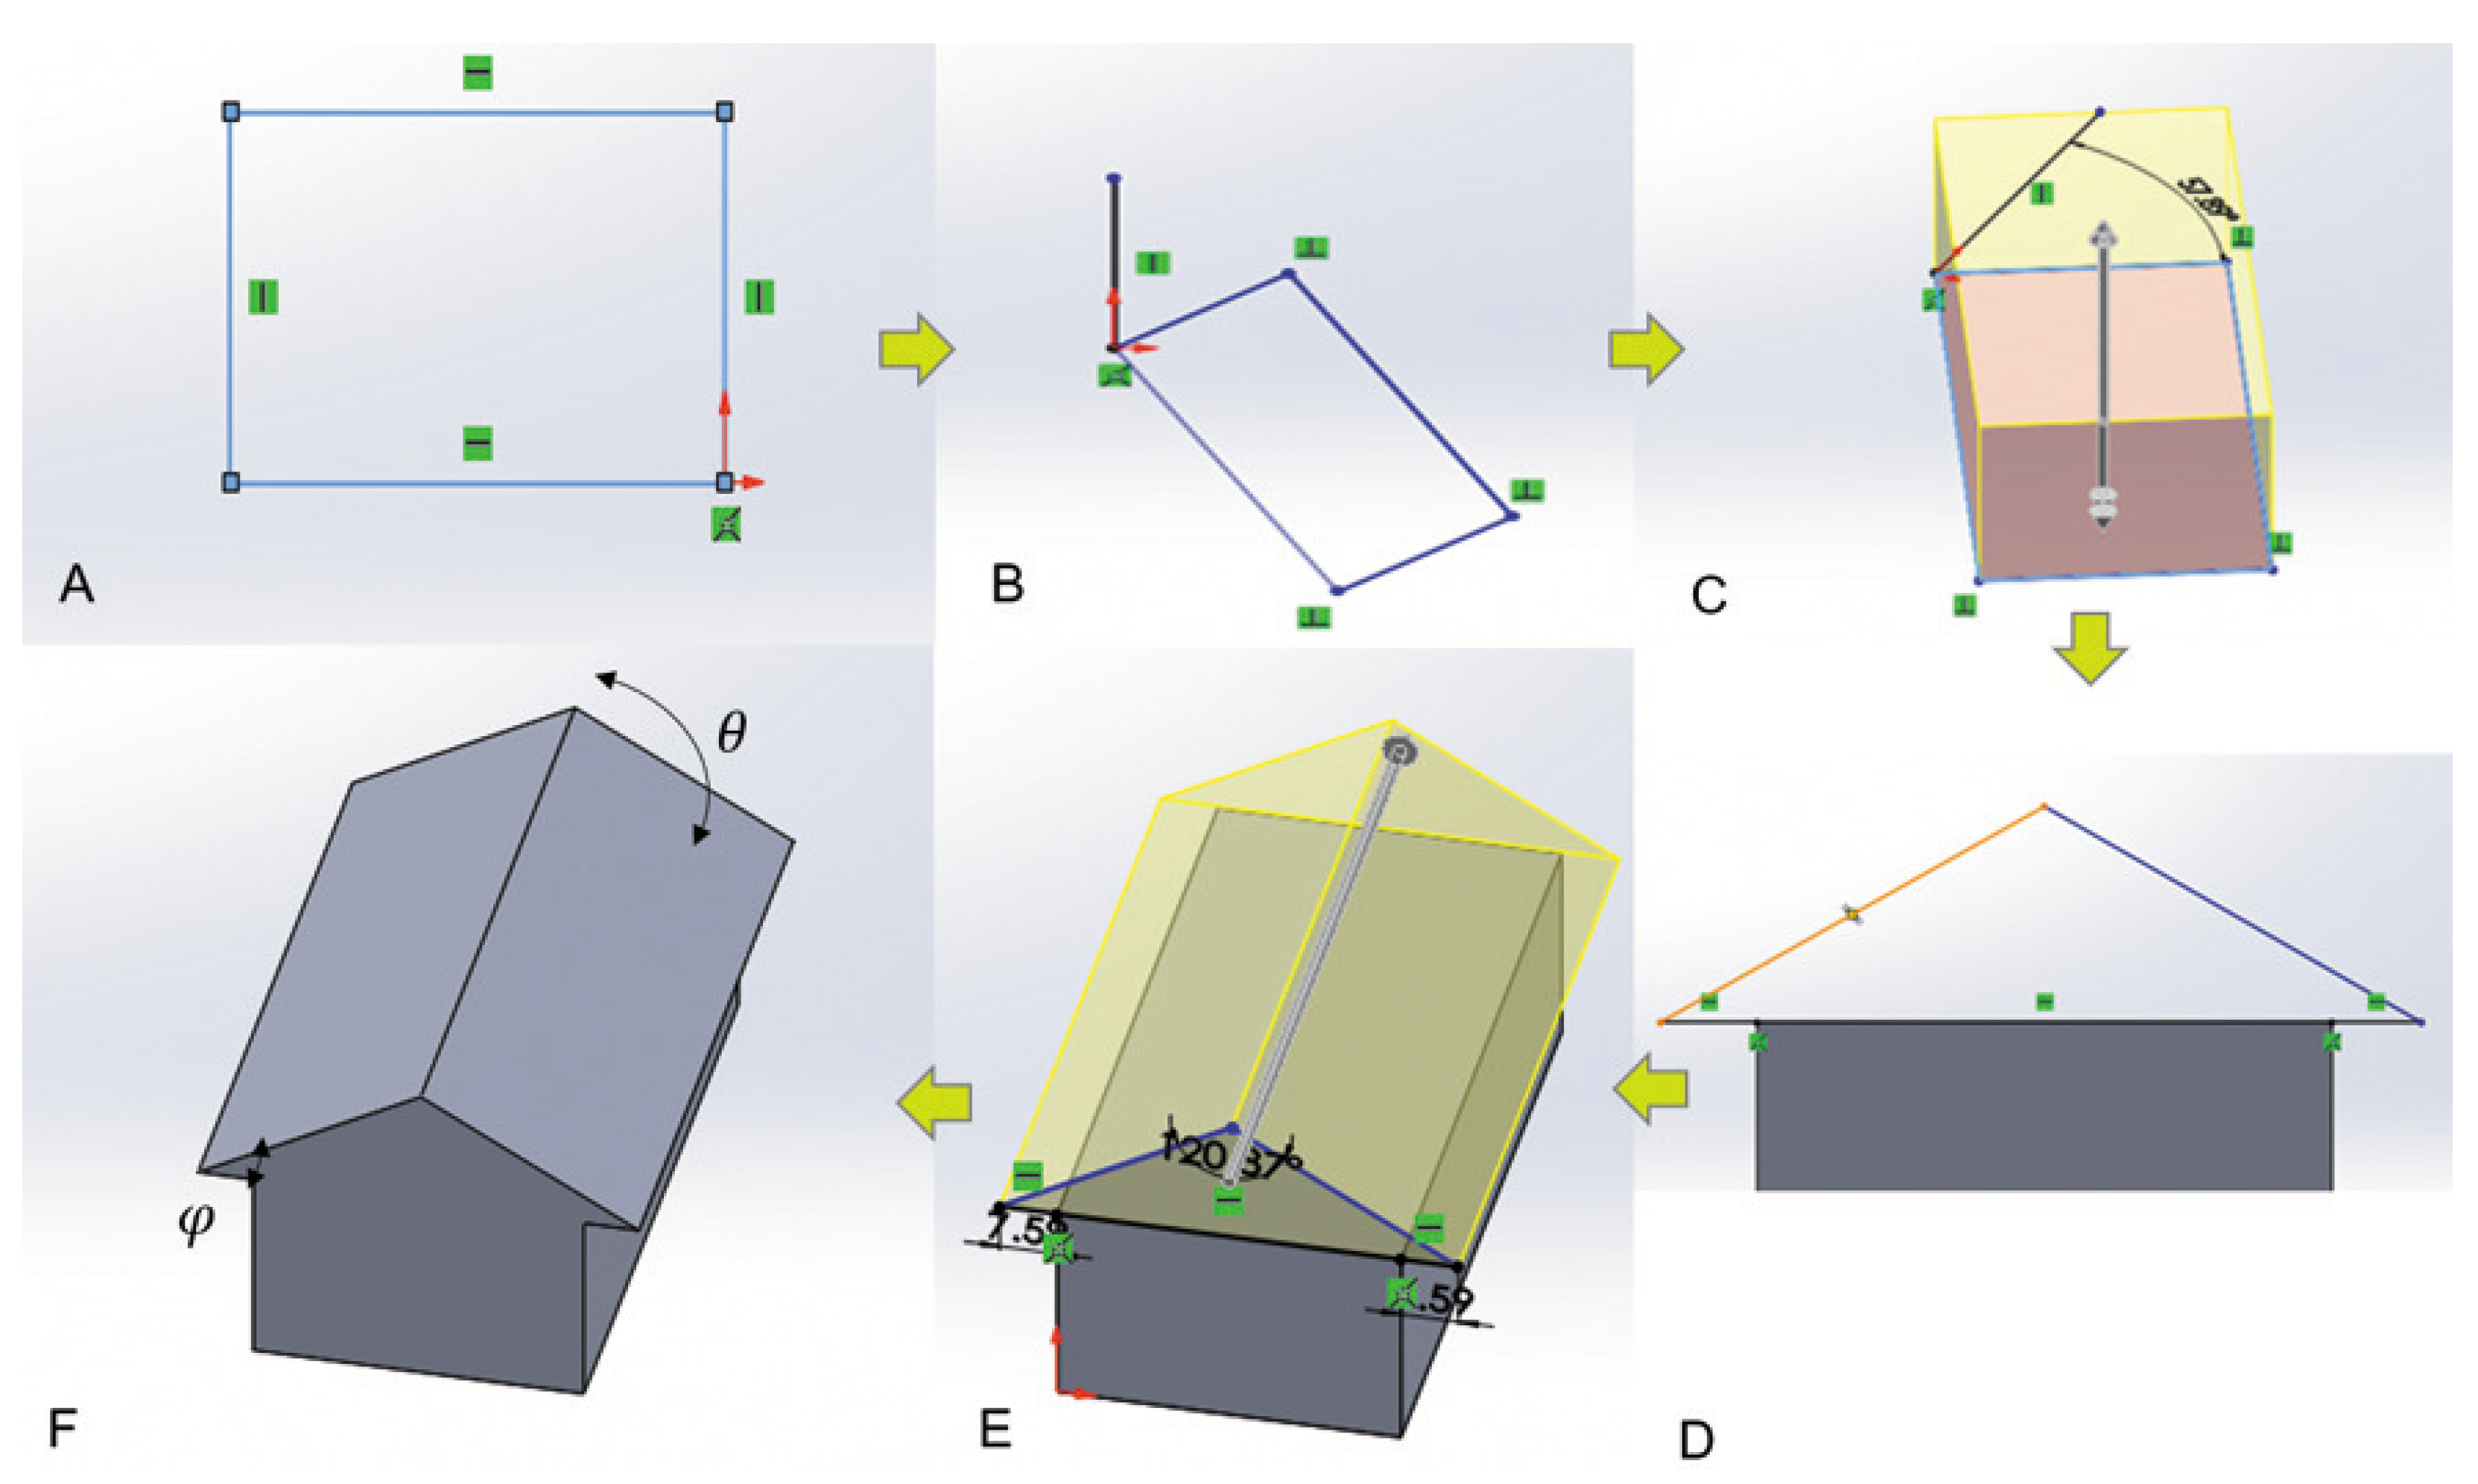
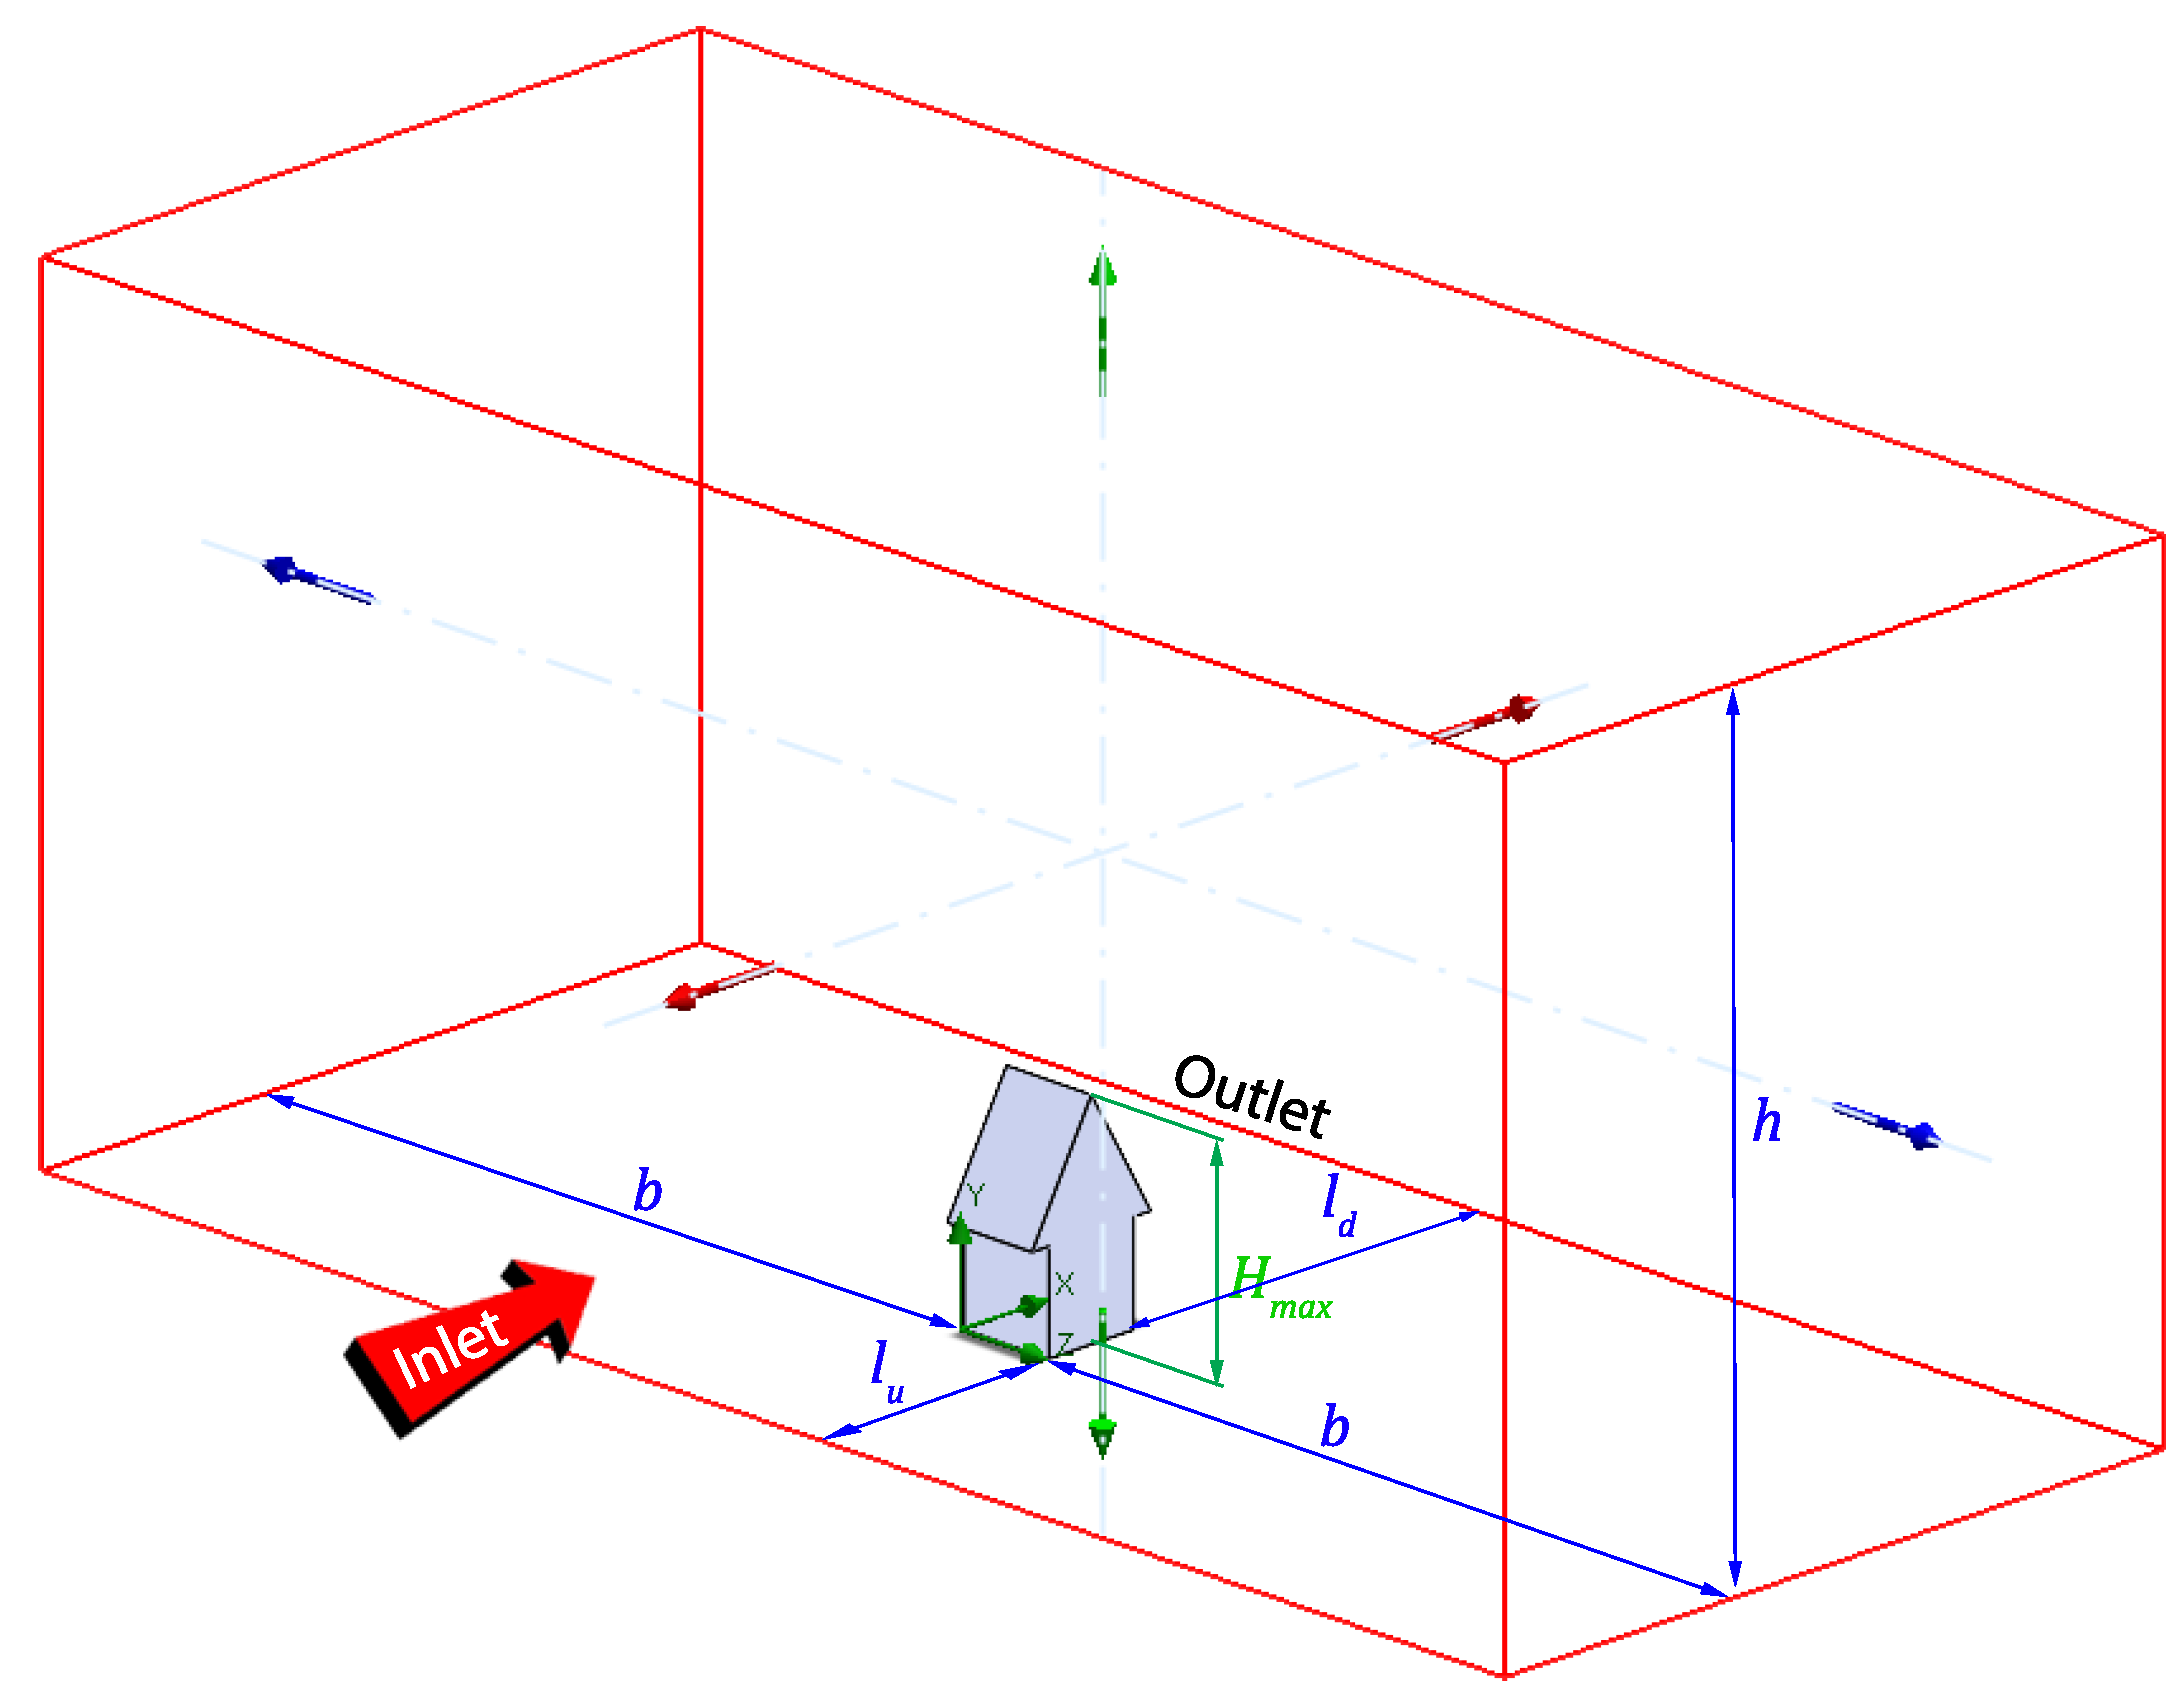
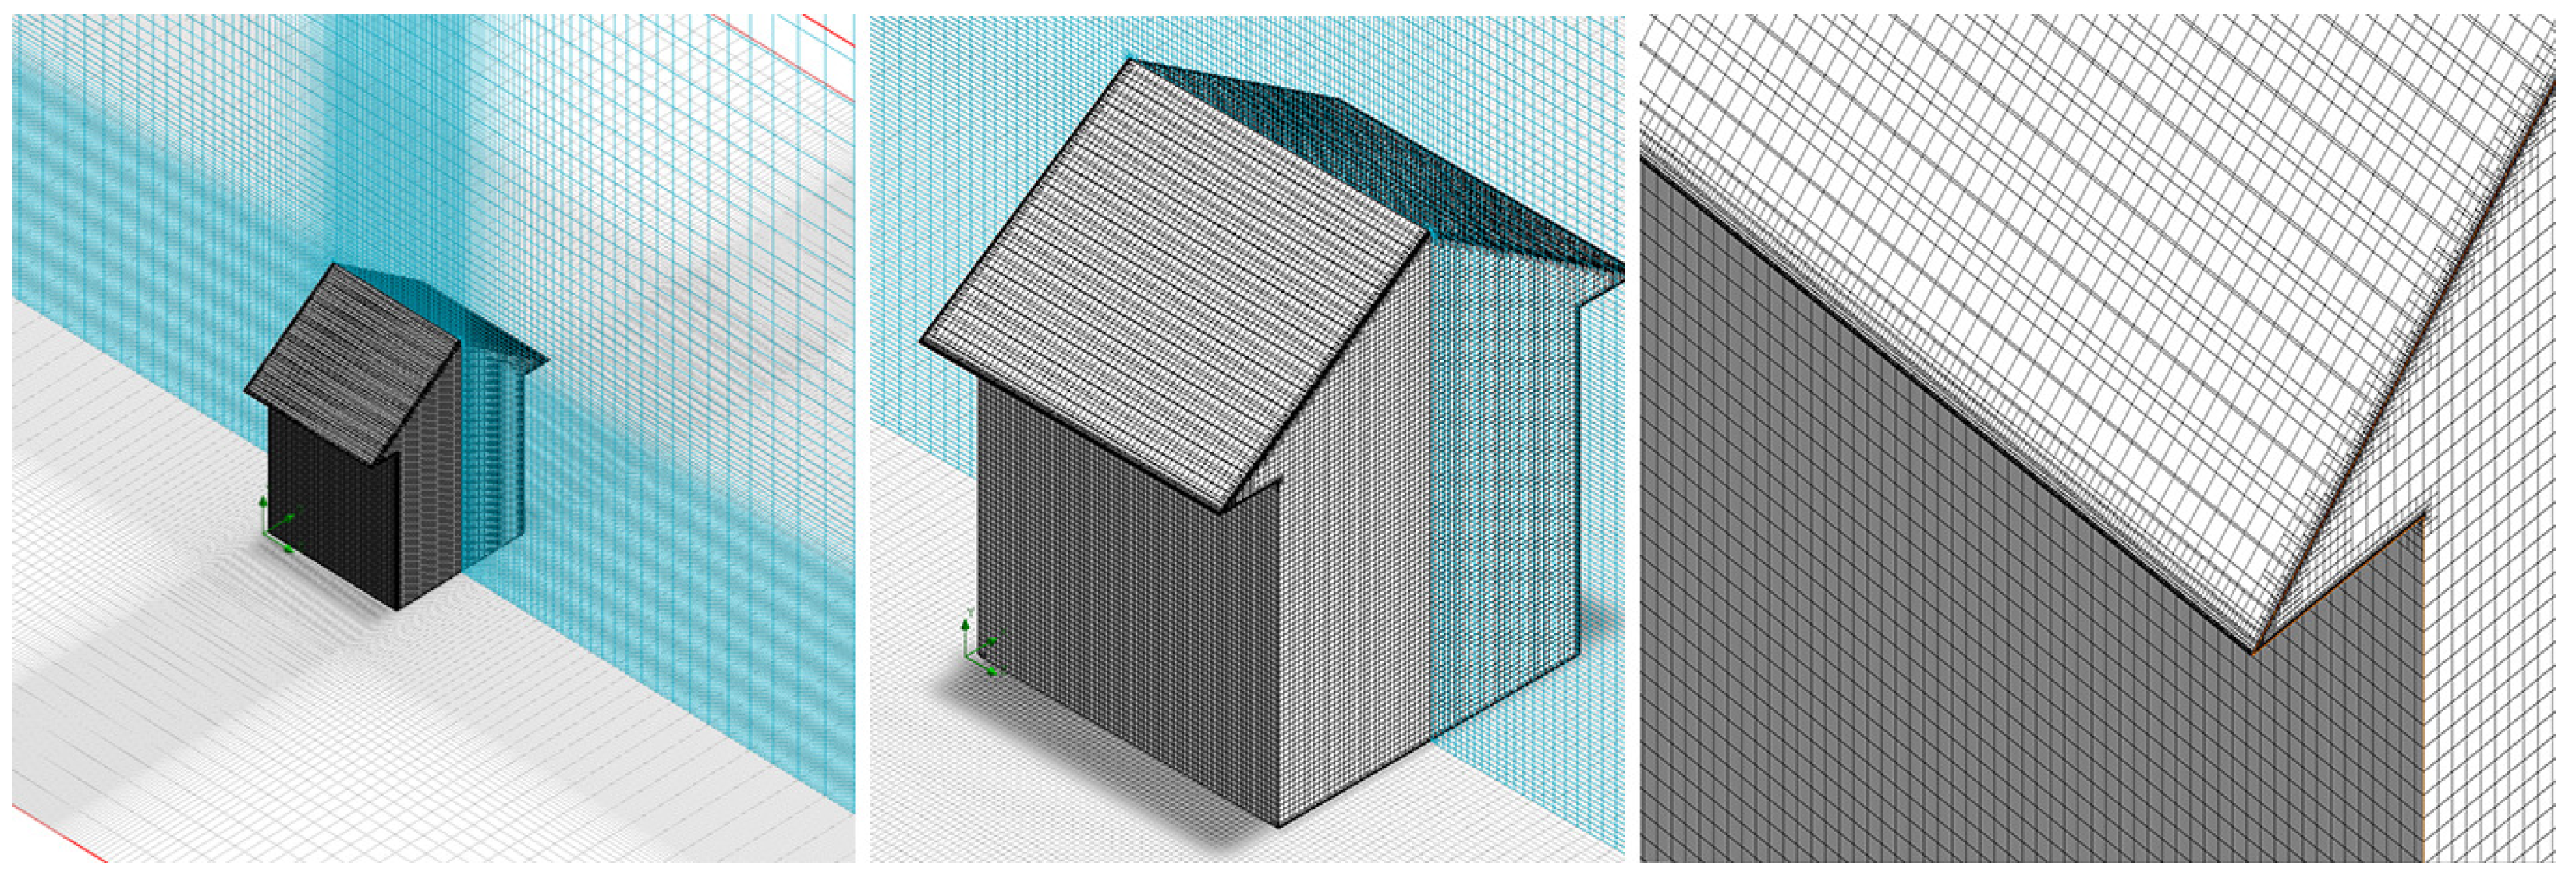
2.1. Model Construction in SolidWorks

We picked a building structure that is easy to establish at an economical cost. The model is a mimic of a one-story single-family residential house. Its width (W) and length (L) are both 5 meters, making its floor size equal to 25 square meters. The height of the side wall ( H s ) is also 5 meters. The model has a cuboid shape to assume a uniform effect on all sides of the model, thus avoiding bias in the analysis. Both the left and right eaves (E) have a one-meter overhang. Because the roof angles are to be determined, the model’s height, H, is the measurement from the ground to the ridge. The minimum possible height, H m i n , is the sum of the 5 meter height of the side wall and the height of the gable wall, where the roof angle is equal to the lower bound of 3 . Figure 1A shows the model’s dimensions with assumed 3 roof angles on both eaves. The model’s maximum possible height, H m a x , is when the roof angles are 60 on both eaves. Figure 1B portrays the building model with the maximum height.
We performed a step-by-step process in constructing the model in the SolidWorks application, as shown in Figure 2. It started with creating a new sketch in SolidWorks and drawing a rectangle for the base of the building (Figure 2A). We set the dimensions of the building orientation by creating a pole-like axis by trimming another rectangular object (Figure 2B). We extruded the base to produce a three-dimensional body of a house at the desired height (Figure 2C). Two adjacent lines were selected at the summit of the triangle, while making the roof eaves have equal dimensions to set up the roof angle dimension (Figure 2D). Then, we extruded the triangle to extend to the other side of the building (Figure 2E). Finally, we completed the sketch by declaring the building orientation ( θ ) and roof angle ( φ ) with arbitrary dimension values in preparation for the CFD parametric study (Figure 2F).
The next step was to prepare CFD in SolidWorks for the constructed model. The goal was to perform a parametric study to accept varying design points (a combination of building orientation and roof angle) and generate results for every design point. The result was the drag forces caused by a constant wind load.
We applied the Flow Simulation tool of SolidWorks’ CFD to the building model. Internal and external flows were two options for the study’s flow simulation. Because this investigation dealt with the effect of typhoons on one-story houses, the external flow was more suitable than the internal flow. Applying gravity to the simulation helped the model stay on the ground, not floating. Then, we added airflow in the direction parallel to the x-axis. It was necessary to pin up a static wind direction to replicate the typhoon’s wind load (Figure 3). To materialize the wind velocity in CFD, we selected the parameters inside the new wizard under Initial and ambient conditions.
The wind speed was a constant 87.5 meters per second. The motivation for the wind speed selection was according to the highest recorded typhoon speed at landfall of 315 km/h of both Super Typhoons Haiyan (2013) and Rolly (2020), locally named Yolanda and Goni, respectively, in the Philippines. The wind load was unidirectional and flowed parallel to the x-axis. The simulations for this study did not use scattered flow fields because the exposure that results in the highest wind loads was sufficient to reflect the winds coming from that direction [16,37]. In addition, the constant wind speed represented the worst-case scenario that can occur during typhoons. According to wind codes of various countries, it was adequate to render both wind speed and direction at the exposure that creates the maximum wind load in analytical studies [16,37,38].
Regarding boundary condition imposition and geometric representation, the computational domain is a condensed version of the physical domain. Thus, we precisely defined it in the simulation. We depicted the inlet and outlet airflows according to their respective surfaces. The control volume of the analysis is the model placement relative to the wind velocity despite the sensitivity of the mesh sizes and geometrical domain that arise in flow development. The bounds within which the simulation takes place are the computational domain. This field improves simulation capabilities while also fixing the simulation space. Optimizing the simulation space controls airflow so that it does not chaotically move. We adjusted the computational domain considering time complexity (Figure 4). The larger the computational domain, the longer the analysis for one scenario.
The building model’s dimensions were the basis for constructing the computational domain with the x, y, and z axes in the stream-wise, normal, and span-wise directions, respectively (Figure 4). We considered the importance of selecting an adequately sized computational domain for accurate solutions. The domain size consisted of four dimensions: upstream length l u , downstream length l d , domain width b, and domain height h. We adapted the recommendations of these dimensions according to the sensitivity studies in [14], tallied in Table 1:
  • The upstream length l u was twice the H m a x to limit the magnitude of wind-blocking effects;
  • The downstream length l d was equal to three times the H m a x , which helped to reduce the flow re-circulation errors by ensuring that the outflow boundary was far from the wake region (as suggested in [14]);
  • Both the domain width b and height h were six times the H m a x . We selected these values to meet the requirement of the blockage ratio to be lower than 1%, as recommended in [14]. The ratio ensured that global venturi effects (GVEs) and local venturi effects (LVEs) were within acceptable boundaries. The blockage ratio ( B R ) is the ratio of the model’s frontal area (A) to the domain’s frontal area.
    B R = model s frontal area domain s frontal area = A h ( 2 b + L ) = A 6 H m a x ( 12 H m a x + L )
The model’s surface area varied throughout the simulations because of the orientation and roof angle. Different sides received the wind load every time the orientation changed. Additionally, the roof’s surface area varied when the roof angle decreased or increased. Thus, the model’s surface area A was a function of the building orientation and the roof angle. The total surface area was the sum of the wall and roof surface areas. Area A s i d e was the surface area when the building was at 0 orientation, while area A f r o n t was at 90 orientation.
A = A s i d e c o s θ + A f r o n t s i n θ ,
which can be further expanded as,
A = ( L H s + L ( 0.5 W + E ) s e c φ ) c o s θ + ( W H s + ( 0.5 W + E ) 2 t a n φ ) s i n θ .
Figure 5 illustrates the heatmap of the blockage ratios for various roof angles and building orientations. The smallest blockage ratio was 0.28% when the model was at 90 orientation and the roof angle was 3 . Meanwhile, the largest blockage ratio was 0.82% when model had a 38 orientation and 60 roof angle.
The grid resolution had a finer mesh obtained through Level 5 refinement with a 2 mm gap size. With the mesh and domain parameters, the solution-adaptive meshing produced 9.24 million cells (Table 1). Figure 6 shows the resulting mesh and its magnified views.
The SolidWorks CFD used the finite volume method (FVM) to resolve the time-dependent Navier–Stokes equations in this study. The simulation terminated once the goal convergence occurred, regardless of the number of iterations. Our goal was the force on the x-axis (SG Force X).
Finally, we established the desired response of the simulation. In this study, the drag force along the x-axis, Force(X), was the expected output from a single tuple of building orientation and roof angle. The process involved setting the goals inside SolidWorks’ flow simulation. We aimed to shorten the solver’s elapsed time and minimize errors in the calculated parameters. Notably, Force(X) was the fitness function of the GA in this study. The following discusses how we incorporated the flow simulation into the GA.

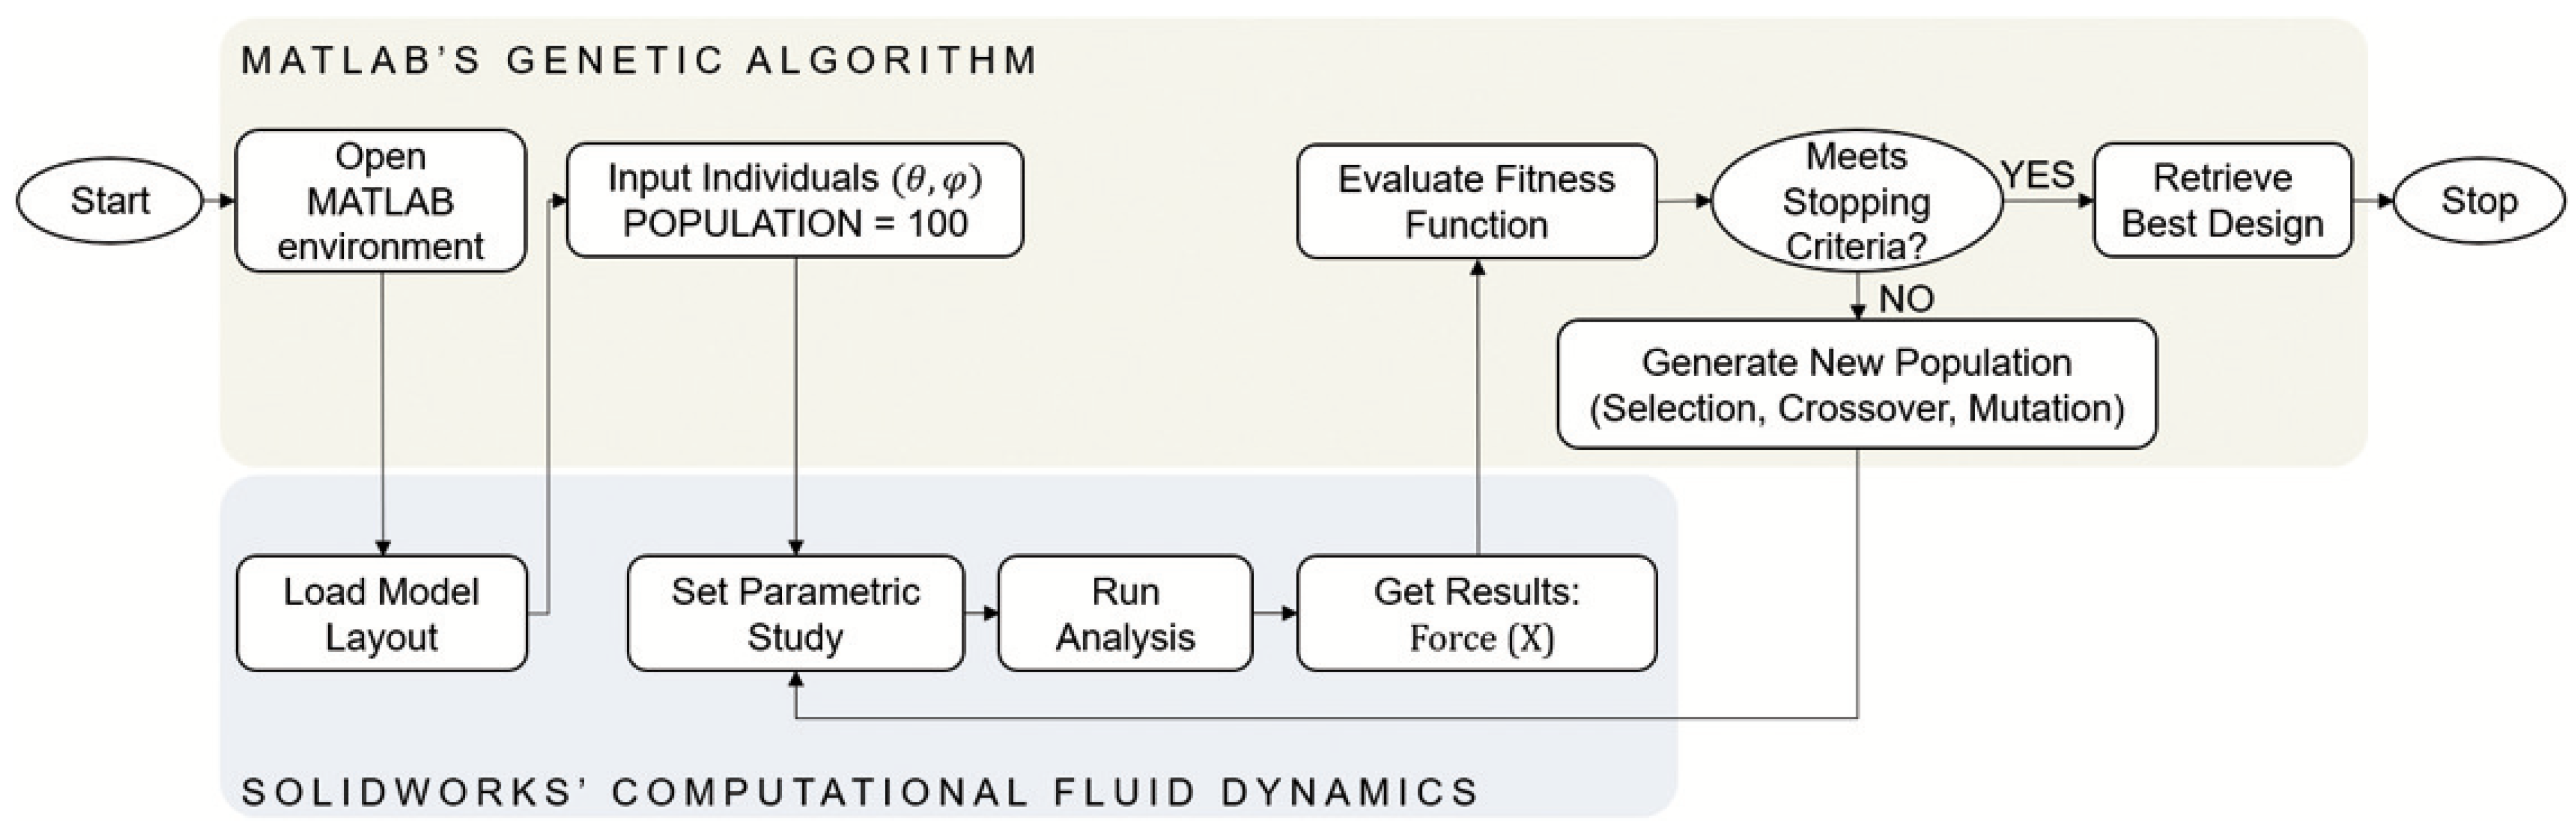
2.2. Integration of Model into MATLAB’s GA

The GA evolves from a population of initial individuals to a population of high-quality individuals, each representing a solution to the problem. In this study, an individual was an ordered pair of the building orientation and roof angle. The fitness function measured the quality of the individual, which is the resulting drag force from SolidWorks’ flow simulation. Because the model resided in the SolidWorks application, while GA was available in the MATLAB programming application, there was a need to integrate the two software applications to automate the optimization process. Figure 7 shows that we connected the two environments as a program provisioned to solve a single-objective optimization problem. The ultimate goal was to search for the values of both building orientation and roof angle, where the drag force felt by the model was at a minimum. We conceptualized minimization because the lower the drag force, the lesser the damage in the model. The succeeding contents elaborate each process:

2.2.1. Open MATLAB Environment

The integrated process began by opening the MATLAB program. This process prepared the MATLAB application as it loads all necessary libraries for the environment. The end user needs to run the program by clicking the button in MATLAB’s integrated development environment (IDE).

2.2.2. Load Model Layout

Once the MATLAB program was ready, the first step of the implementation was to load the building model. The application accomplishes this by executing a shell command to load the external SolidWorks application. We noticed on the screen that the program perfectly loaded the building model.

2.2.3. Generate Initial Population

Then, GA provided the initial population. GA performed this by spawning 100 random individuals. MATLAB’s GA Solver anointed an individual as one chromosome. A single chromosome was an ordered pair of building orientation ( θ ) and roof angle ( φ ) of the single-family residential house model. A chromosome was valid if it satisfies the rule of set S,
S = { ( θ , φ ) : 0 θ 90 , 3 φ 60 , w h e r e θ , φ Z } ,
which drives the initial population P 0 to be
P 0 S b u t | P 0 | = 100 .
The lower and upper bounds of the building orientation θ were are 0 and 90 , respectively. We selected this range to simulate only the angular positions in the first quadrant of the rectangular coordinate system. On the other hand, the lower bound for the roof angle φ was 3 , while its upper bound was 60 . This range constitutes the feasible roof construction considering physical limitations. A 0 to 2 angle inclination would destroy the model assembly in SolidWorks. Moreover, roof angles above 60 seem undesirable due to their pointy look at the end, and the roof slope was not feasible in the flow simulation.

2.2.4. Set Parametric Study

Given the initial population P 0 , the next step of the GA was to calculate the fitness scores for each individual. This step, however, could not be completed in the MATLAB environment alone because the fitness function corresponds to the simulation result in SolidWorks, which was the drag force acting in parallel with the wind direction. As such, the actual next step was to set the parametric study in SolidWorks given the generated initial population. Because the initial population size was 100, the number of simulation scenarios in the parametric study was also 100. Each scenario referred to the design of the building model with orientation and roof angle equal to the ordered pair. For instance, if the first individual had ( θ 1 , φ 1 ) values, then the first scenario in the parametric study had a model design with orientation and roof angle equal to θ 1 and φ 1 respectively.
The data were transfer redbetween MATLAB and SolidWorks environments with the presence of external files—“parametric_study.fwps” and “SG Force (X).txt”. The fwps-formatted file stored the 100 chromosomes from the initial population. The MATLAB application inserted 100 chromosomes into this file and fed it to the SolidWorks application as input. SolidWorks required this file to re-configure the building model for the parametric study. Thus, each chromosome in MATLAB’s GA corresponded to one ordered pair in SolidWorks’ CFD. In other words, the 100 individuals in a population became 100 design points in the parametric study.

2.2.5. Run Analysis

Run analysis means activating the CFD’s solver for the flow simulation. Because the population size was 100, there were also be 100 scenarios where the simulation changed the dimensions of the building orientation and roof angle according to the provided design points from the previous step. Additionally, there were 100 simulations where the building model faced a constant wind load. Each one came up with a different simulation output: a drag force for the particular variant of the building model. The SolidWorks application saved all results to the txt-formatted file.

2.2.6. Get Results

The “SG Force (X).txt” file stored all the drag forces obtained from SolidWorks’ flow simulations. The MATLAB program red these values from the file and assigned them to an array variable.

2.2.7. Evaluate Fitness Function

The fitness function measures how closely a particular solution adheres to the optimal resolution of the targeted problem. It establishes how suitable a solution is. We represent the fitness function f as
f ( θ , φ ) = F ( x )
The scalar F ( x ) was the drag force along the x-axis and parallel to the wind direction for the given building orientation θ and roof angle φ . Becaues there were 100 simulations, there were also 100 resulting drag forces. The drag force of the first individual is F t , 1 ( x ) ; the second individual is F t , 2 ( x ) ; the third individual is F t , 3 ( x ) , and so on. Thus, a set of forces, F t , is a collection of fitness scores in generation t.
F t = { F t , 1 ( x ) , F t , 2 ( x ) , F t , 3 ( x ) , , F t , 100 ( x ) }
Because we considered a minimization search problem, MATLAB’s GA preferred smaller drag forces, and the minimum was the best fitness score of the generation.

2.2.8. Check Stopping Criteria

The integrated application will stop iterating once the current generation reaches the 100th generation. At the beginning of the program execution, the authors set the maximum number of generations to 100. They did not implement any early termination for the stopping criterion.

2.2.9. Generate New Population

GA applies the idea of the survival of the fittest. Thus, investing in effectively reproducing a new population for the next generation is essential. GA follows three sequential stages to breed individuals of the new population: selection, crossover, and mutation. We describe each stage in the following paragraphs.
We set MATLAB’s GA Solver to retain its default arguments. In effect, the program implemented the stochastic universal sampling in choosing the parents within the population. This strategy offers a more favorable selection pressure because it shows no bias toward the selection approach and enhances the likelihood of selecting weaker individuals, which boosts diversity [39]. The process divides a line into contiguous segments, with the length of each parent’s segment corresponding to its scaled value. The algorithm advances the sequence in increments of equal size.
GA combines two parents using a scattered crossover operator to produce a crossover child for the subsequent generation. A crossover mask is a random binary vector with distinguishing features. A binary value of 1 indicates copying the first parent’s genetic information, whereas a binary value of 0 indicates that the genetic information is from the second parent [40]. In this study, the mixing ratio, the distribution of the binary values, was not set to have a uniform 1:1 ratio but was random.
The crossover children’s genes underwent adaptive mutation in this study, resulting in mutant offspring. This mutation algorithm modified the mutation probability per the fitness evaluations. A low mutation probability is applied to high-fitness chromosomes to keep their quality and increase accuracy. In contrast, low-fitness chromosomes have a higher likelihood of mutation, increasing their importance in the search [41]. We chose adaptive mutation because it is less likely to disrupt the high-fitness chromosomes. In addition, it effectively uses the exploratory position of low-fitness chromosomes. The mutated children then become the individuals of the new population for the next generation of the optimization search.

2.2.10. Retrieve Best Design

A best-fitted chromosome emerged in the last generation. The ordered pair of building orientation θ and roof angle φ , which had the minimum drag force, is the best design for single-family typhoon-resilient houses. In this study, the optimal dimensions were in the set of ordered pairs that achieved the global minimum in domain P 100 for a real-valued function f, which is defined as,
arg min ( θ , φ ) P 100 f ( θ , φ ) = { ( θ , φ ) P 100 : f ( θ , φ ) = min ( α , β ) P 100 f ( α , β ) } ,
where P 100 is the population in the 100th generation that satisfies,
P 100 S b u t | P 100 | = 100 .

3. Results and Discussion

We discuss the building simulation results in this section. The first subsection focuses on the performance of the GA as measured per generation. The visualization results, such as contour streamlines, flow trajectories, and surface plots, are covered in the last subsection.

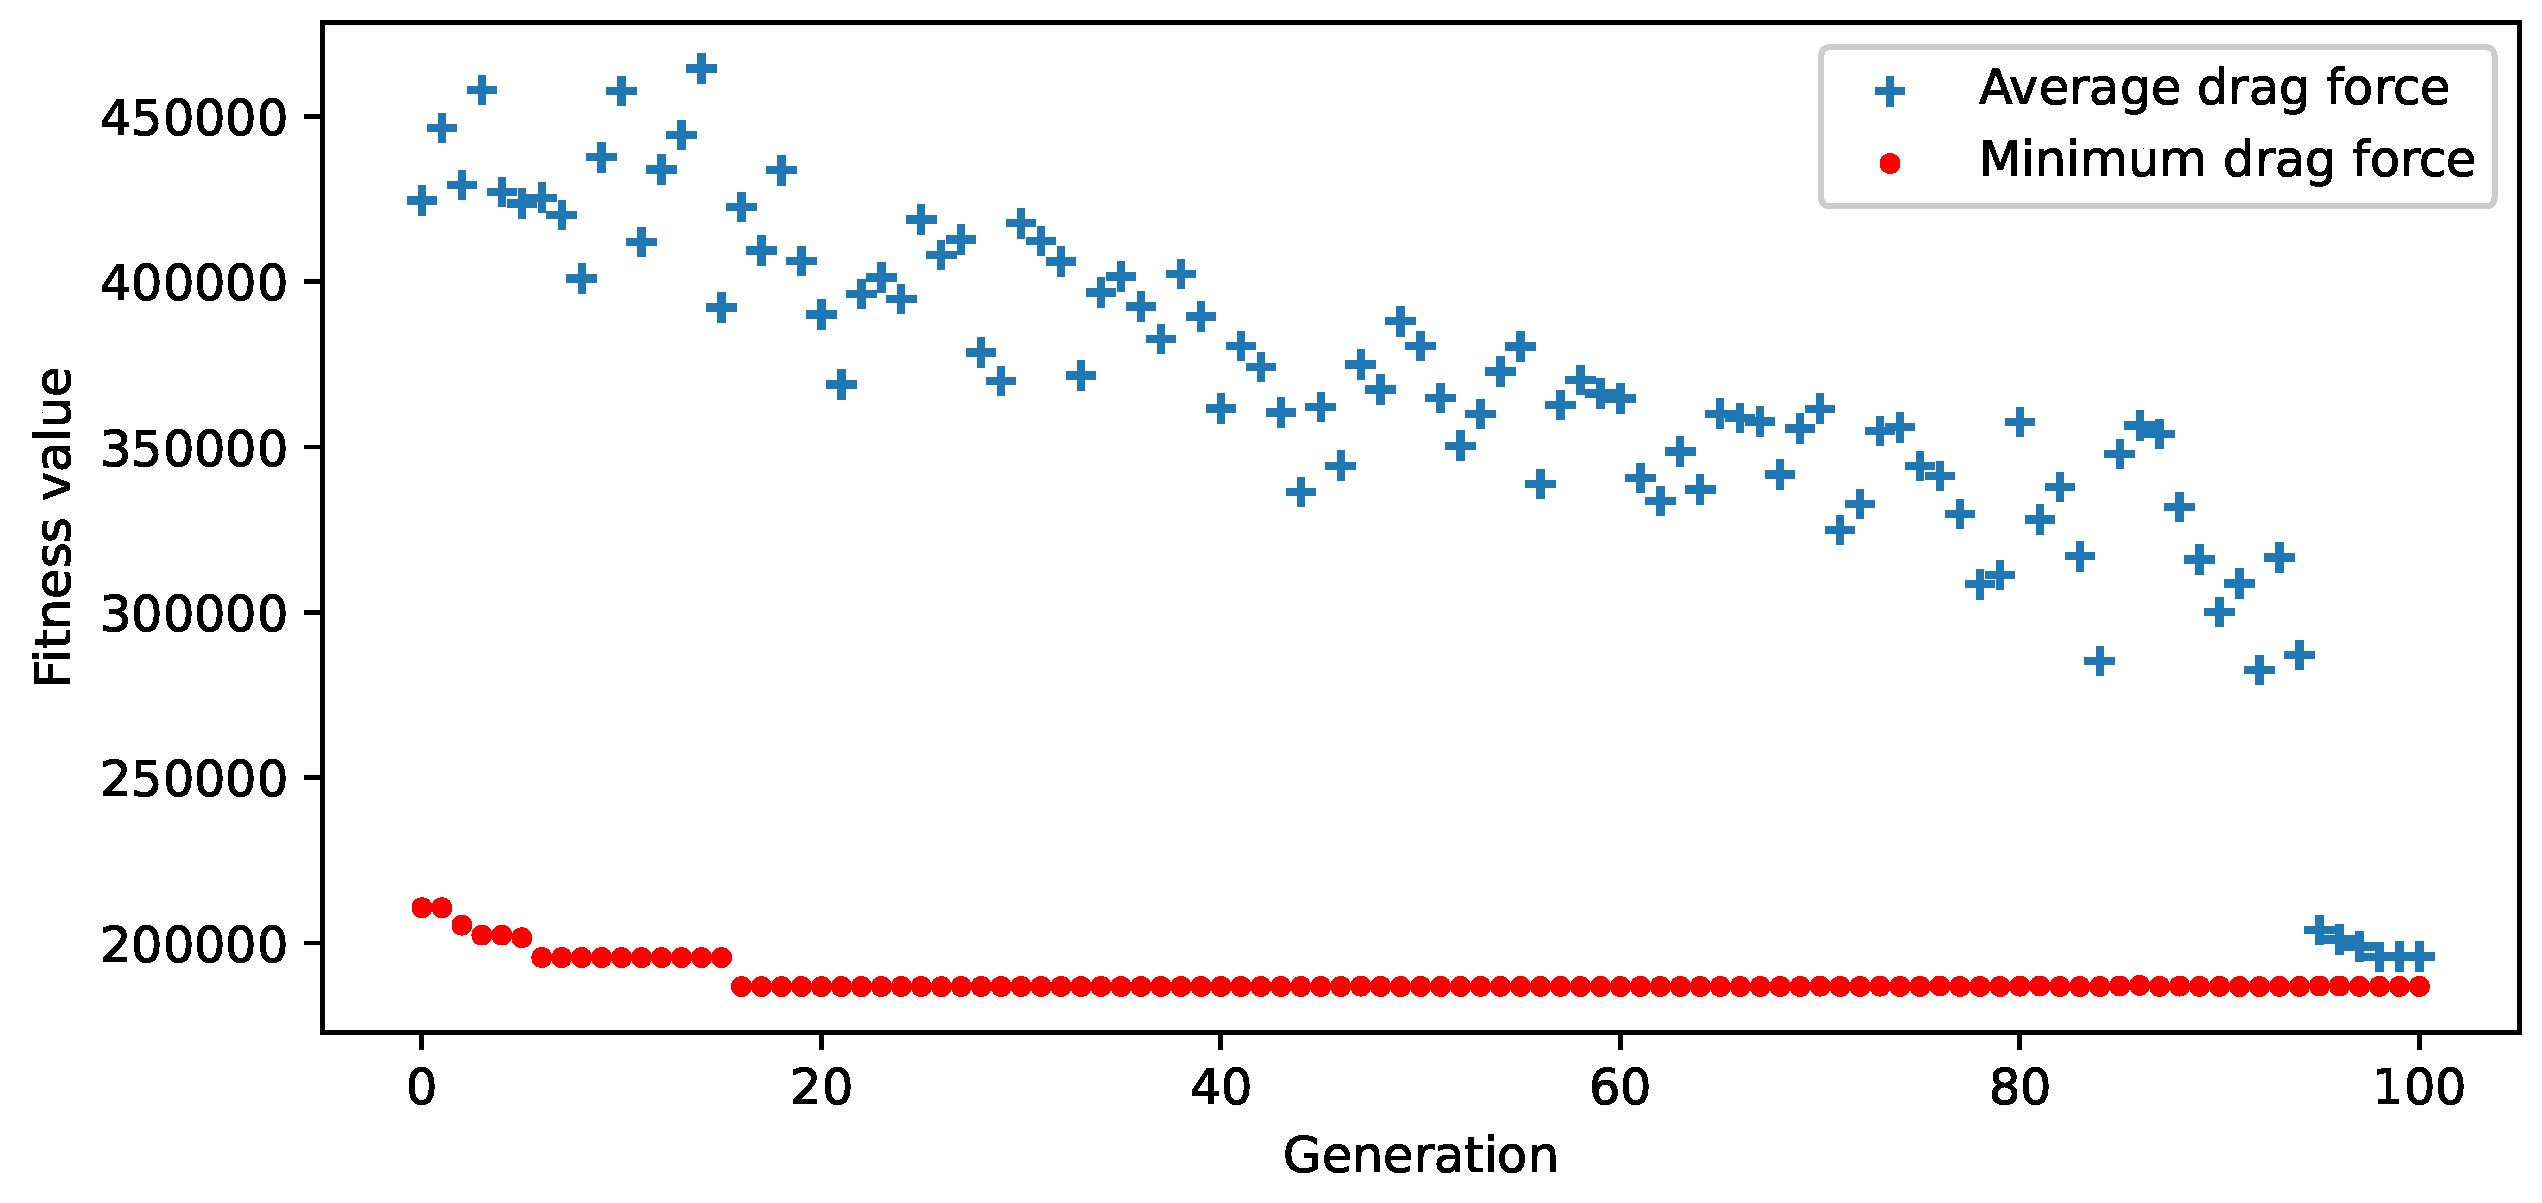
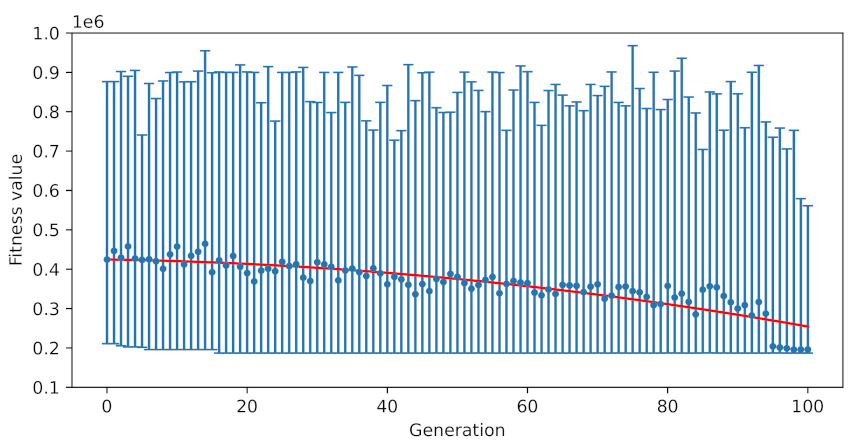
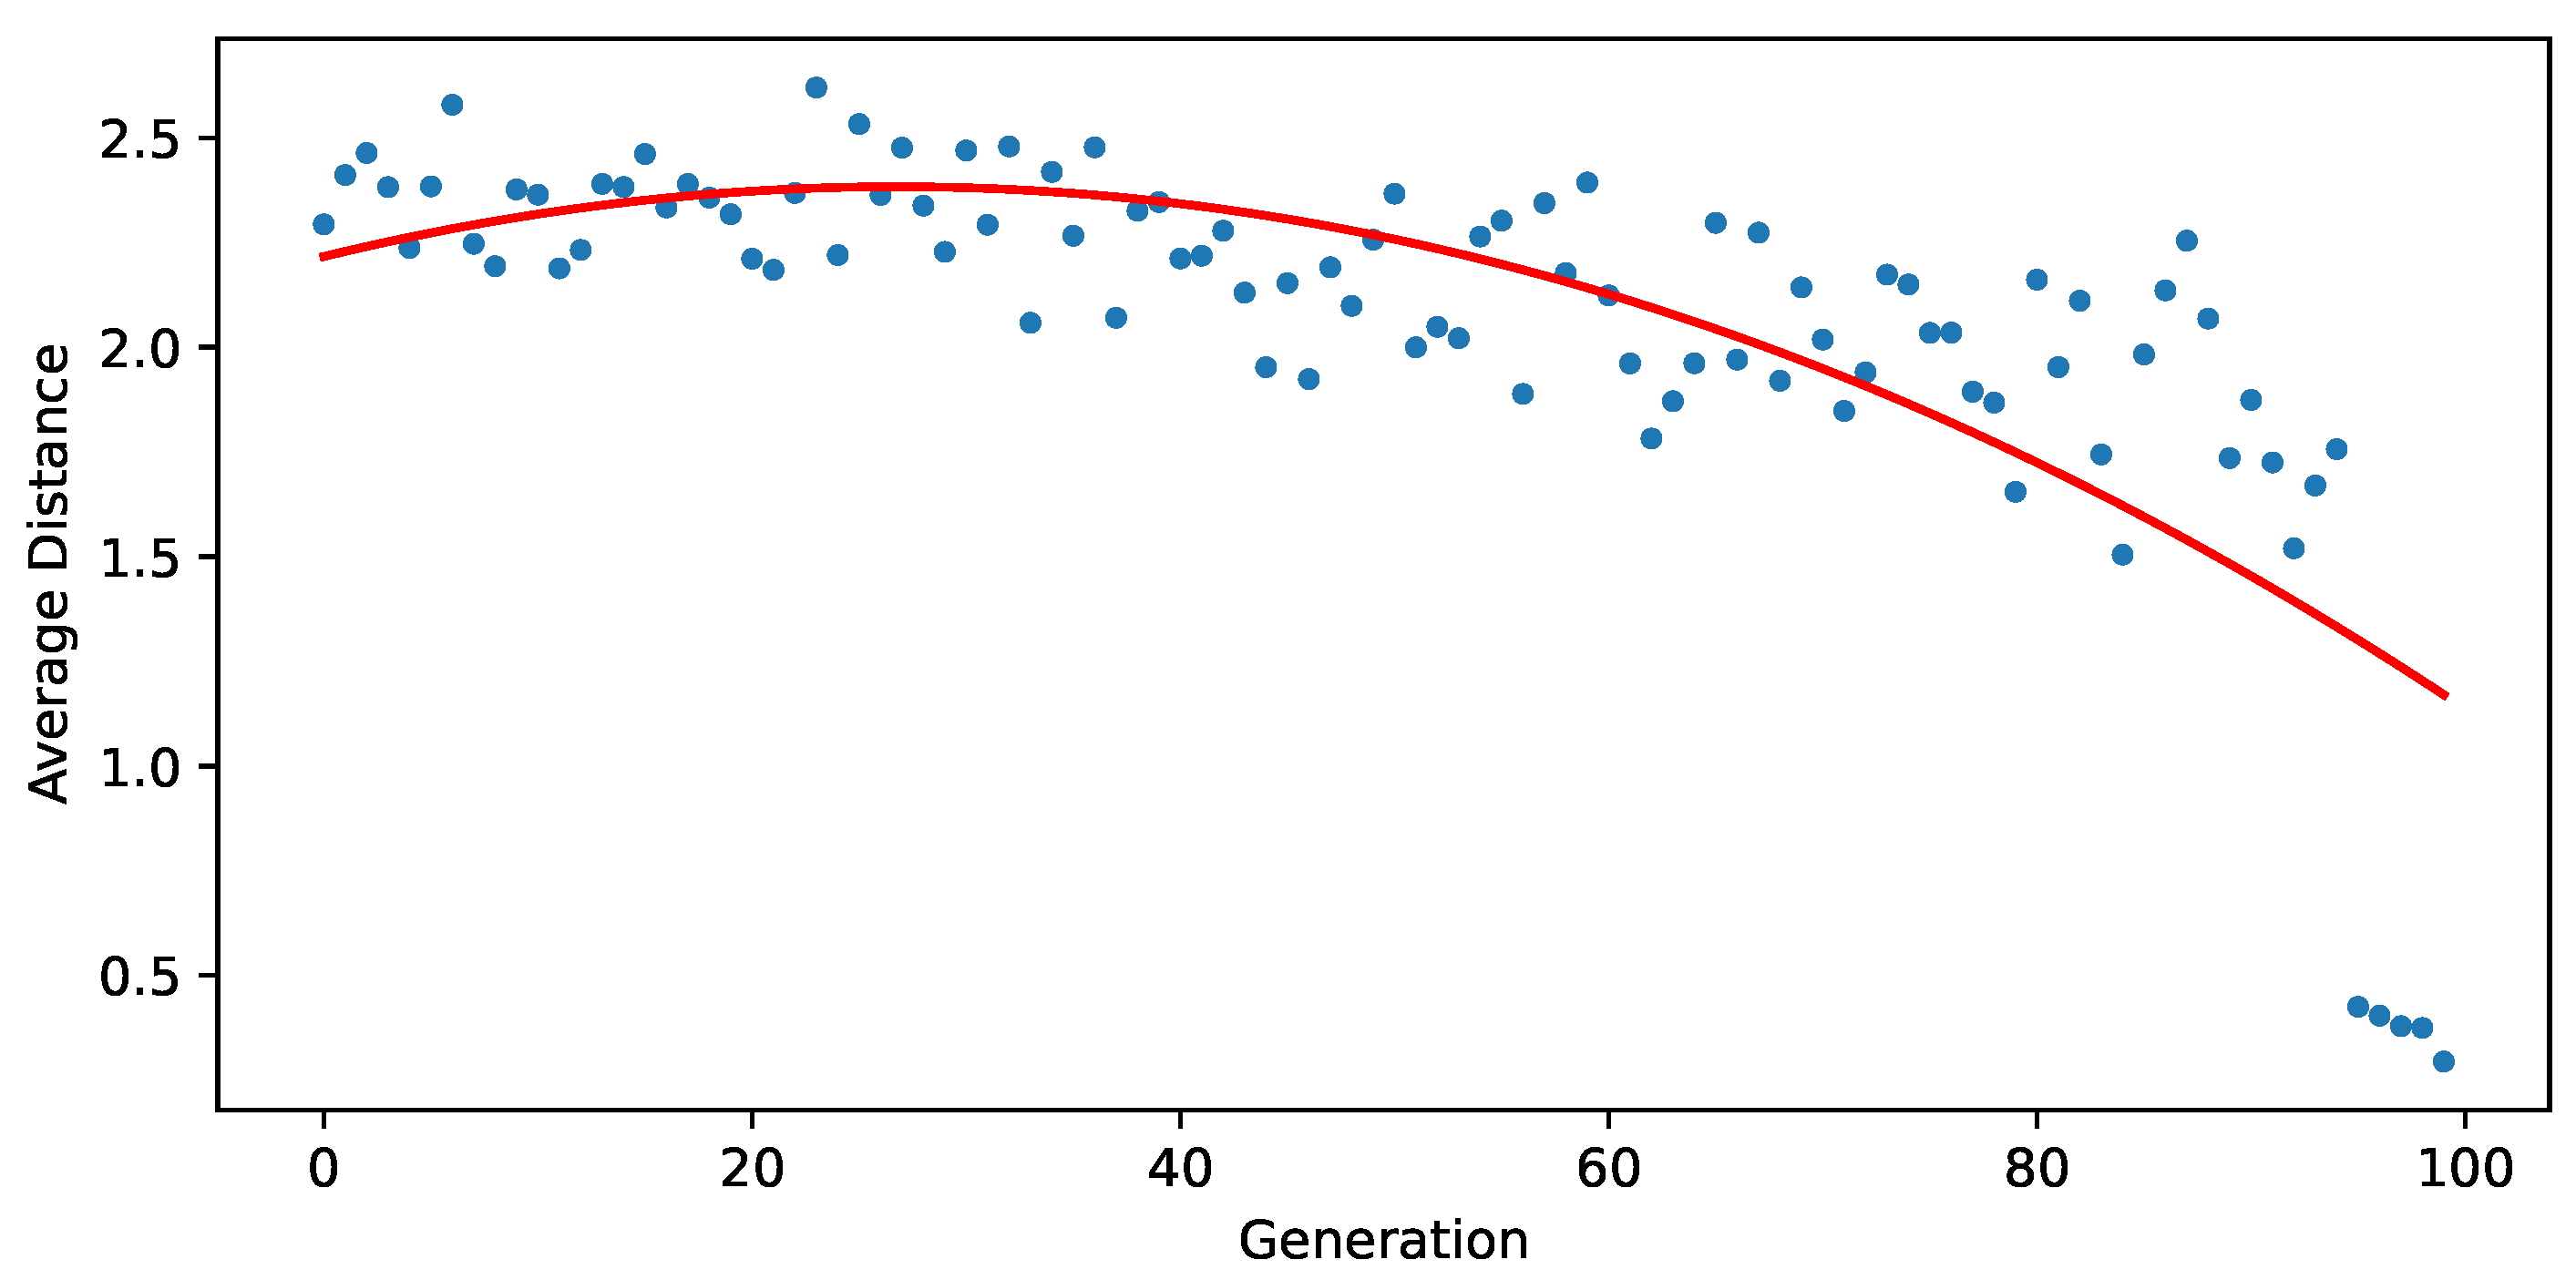
3.1. GA Minimization Search Performance

The integrated application ran for 100 generations, but GA achieved the minimum drag force of 18.69 kN as early as the 16th generation. Figure 8 shows that the best fitness scores did not significantly change in the latter generations as the generations increased. However, GA tried to explore other chromosomes. It is evident in Figure 9 that GA explored weaker chromosomes and retained high-quality chromosomes in every population, as illustrated by the minimum, maximum, and mean fitness scores.
Six design points were distinctive and majorly contributed to the optimization search, as portrayed in Figure 8. In the first generation, GA returned the best chromosome as an ordered pair (86.354 , 7.829 ). Both design parameters changed in the second generation to a new best chromosome with values of 86.176 and 22.957 . There was a slight shift in the building orientation for this generation, while the roof angle considerably shifted. In the third generatio, the best chromosome was 86.354 , 4.074 , which was also the same result in the fourth generation. A minimal update of values (82.416 , 7.842 ) occurred in the fifth generation. A chromosome (80.181 , 22.957 ) arrived with the minimum drag force starting from the 6th generation until the 15th generation. However, GA arrived at the global minimum drag force of 18.69 kN in Generation 16 and was not superseded even at the last generation. The chromosome that resulted from this minimum drag force was 80.181 , 11.26 .
The decreasing trend in the average distances between individuals in every population indicated that GA converged. Figure 10 illustrates that the average distances between individuals at generations below 50 were more spread out than those above 50. When the average distance arrived at asymptotically zero, GA had reached the minimum of drag forces.

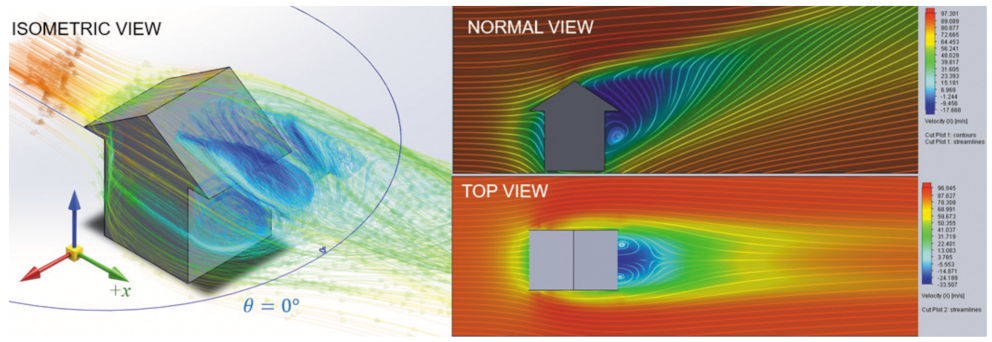
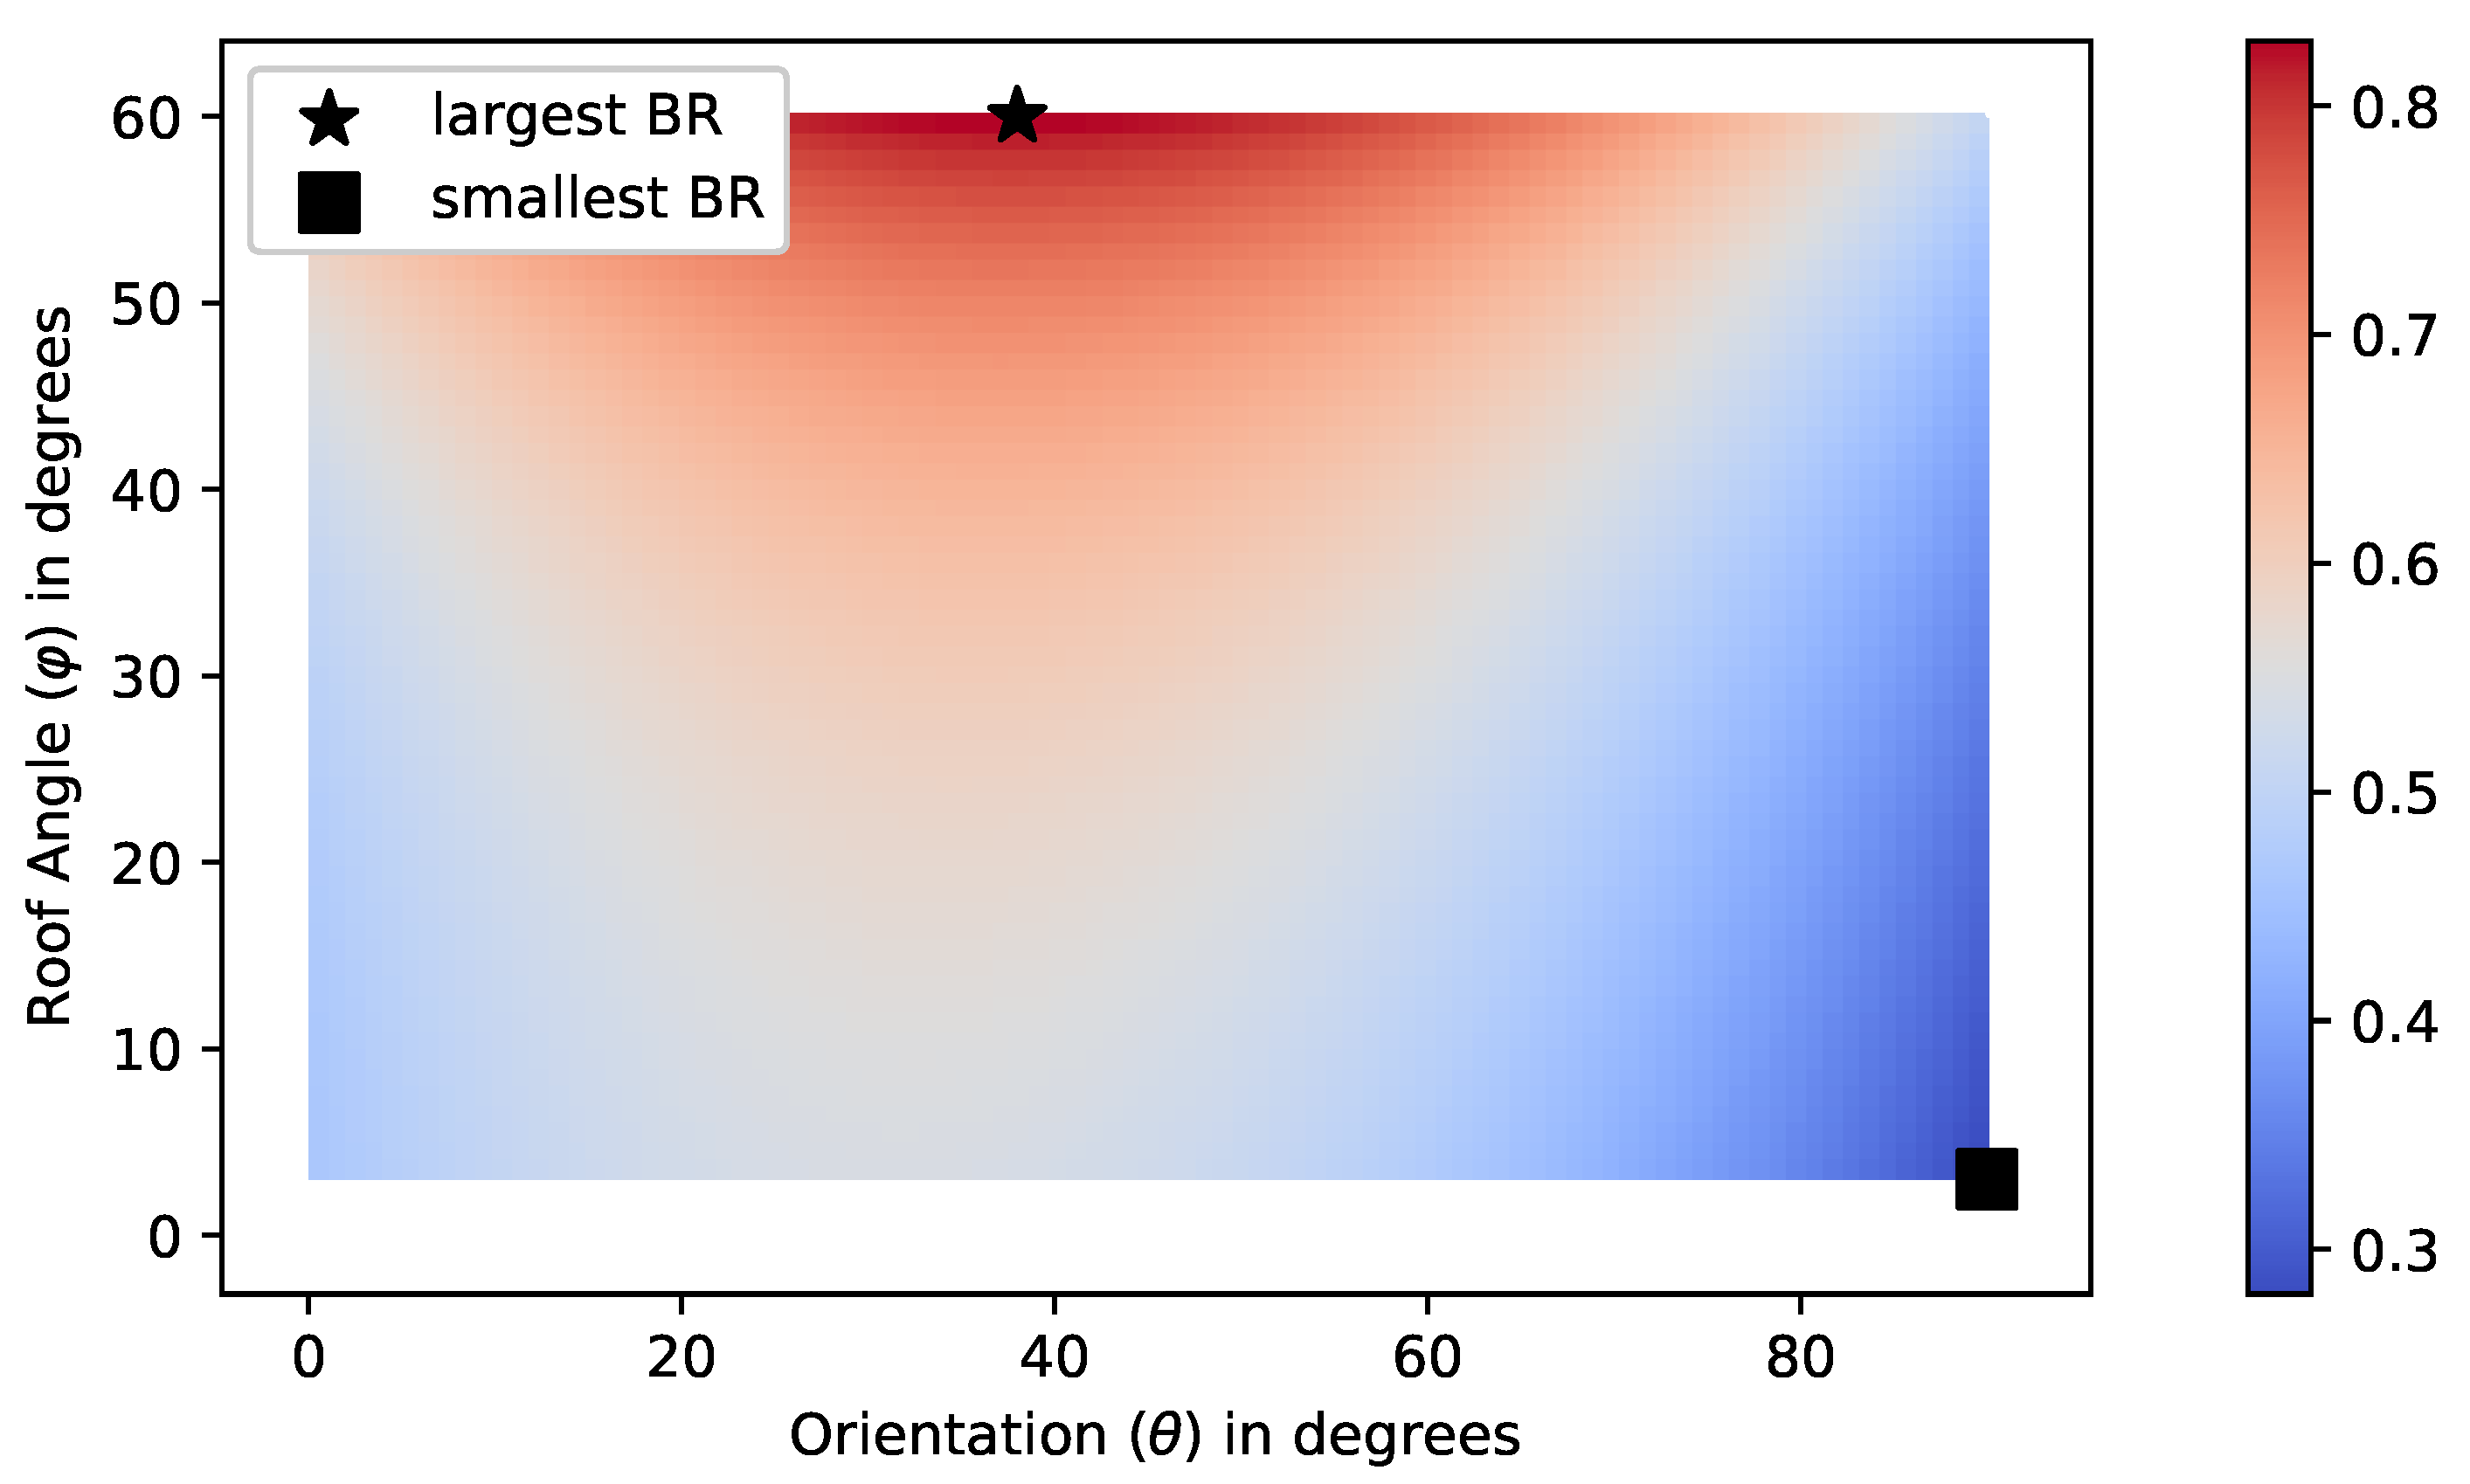
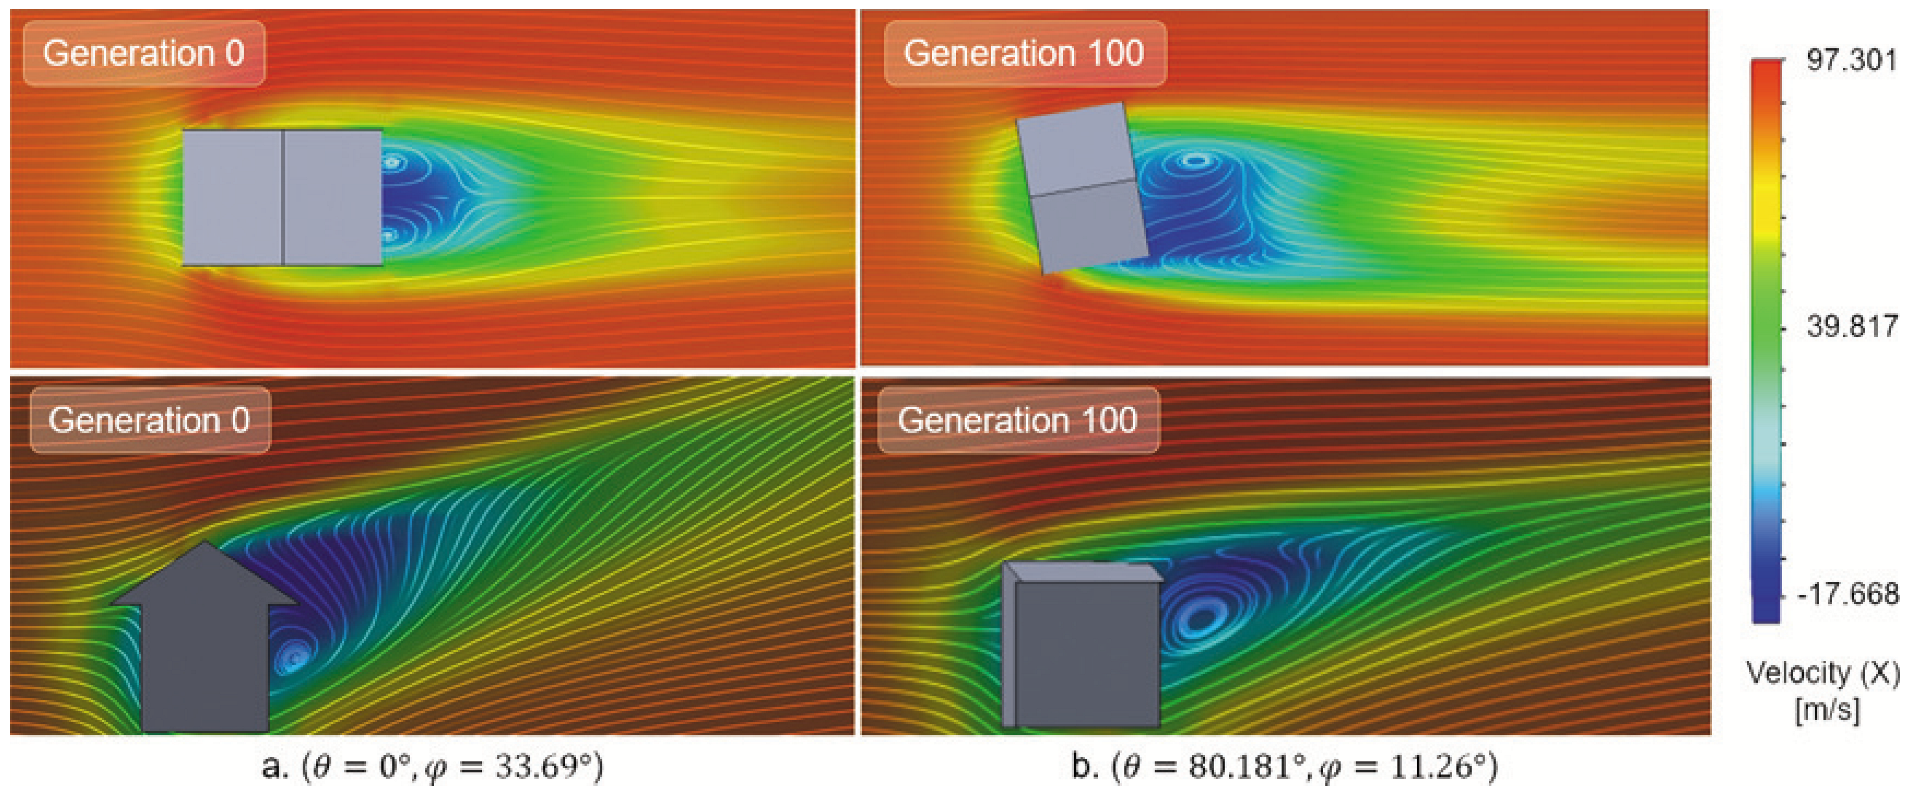
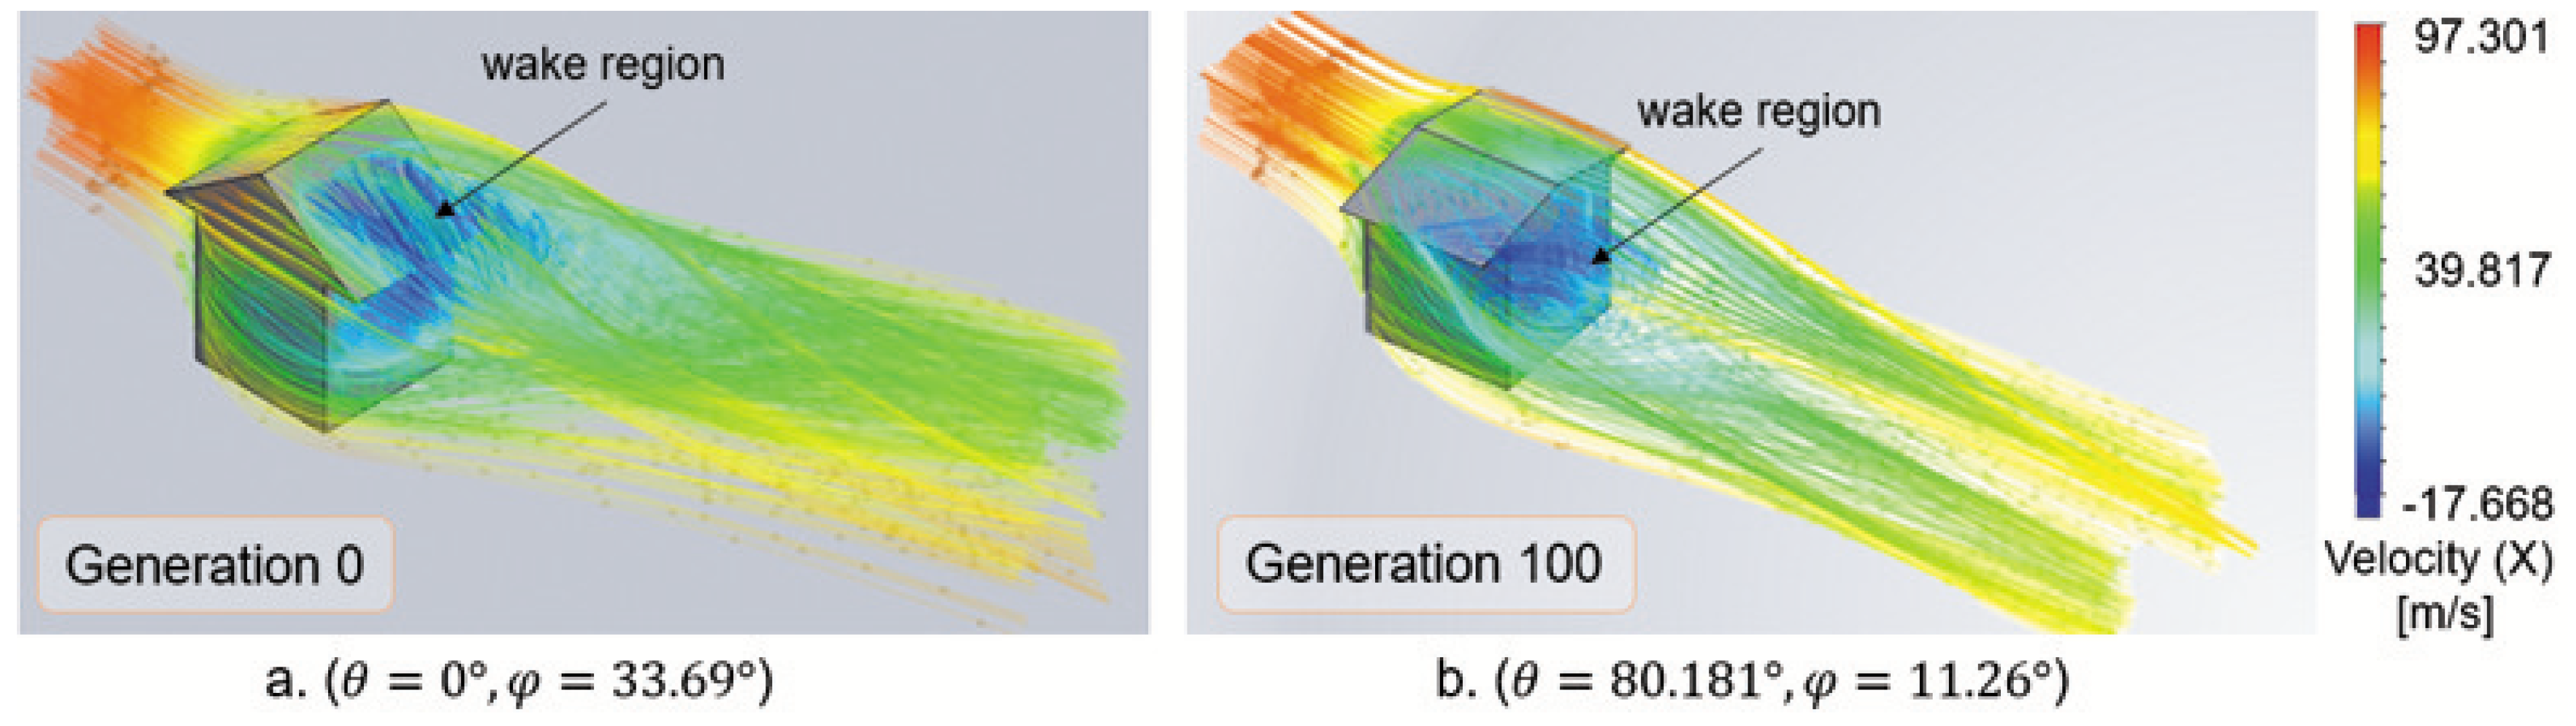
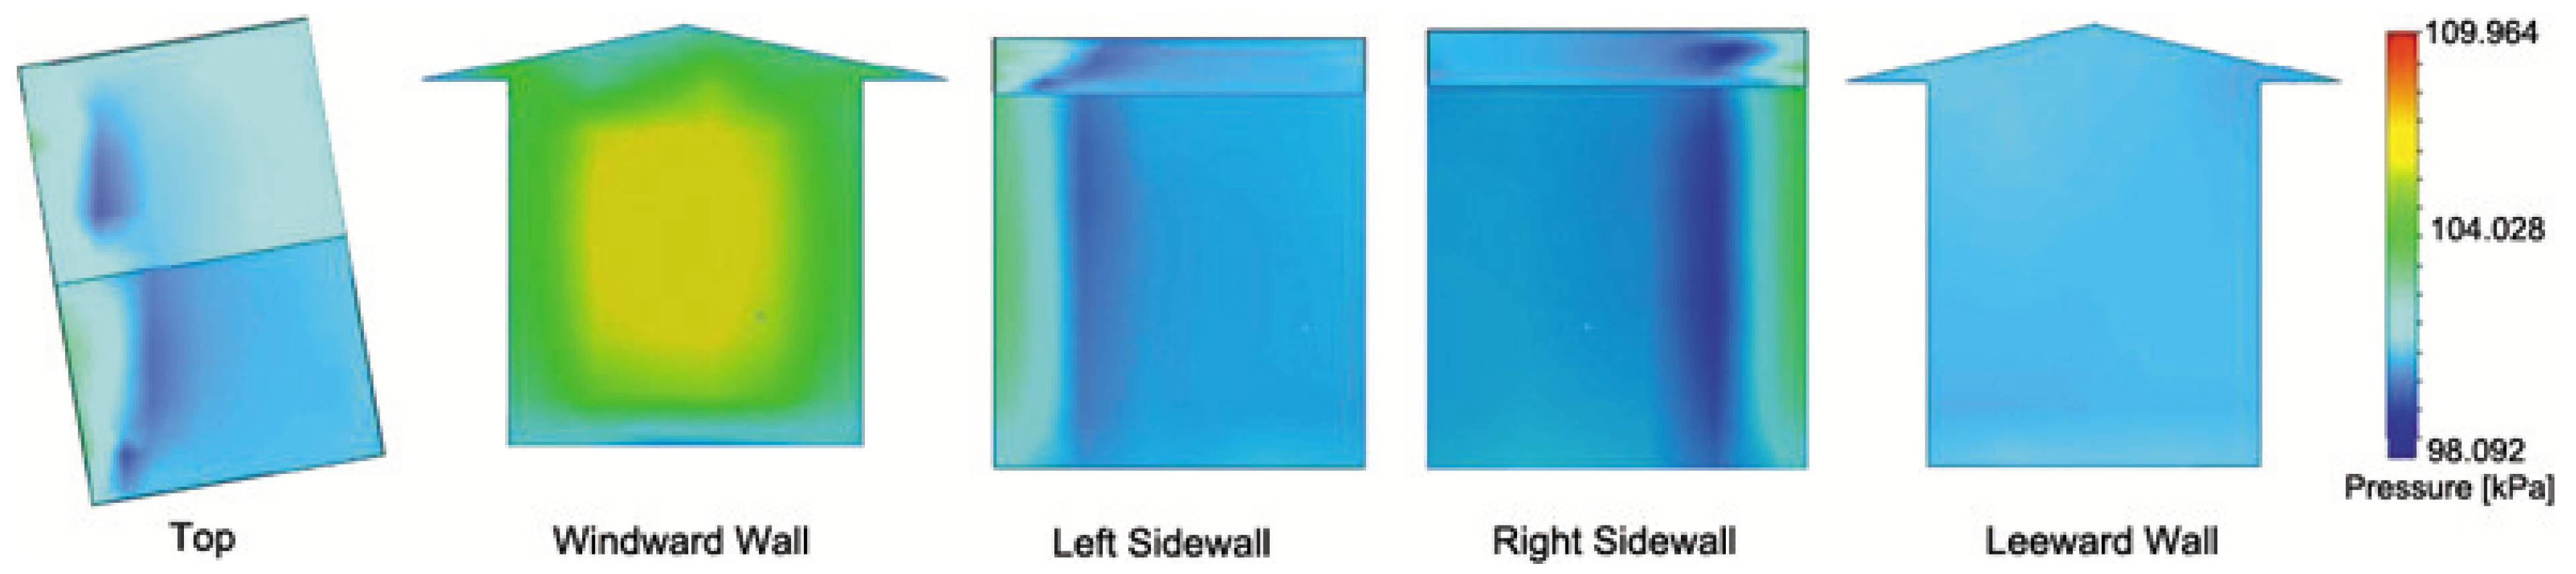
3.2. Visualization of Results from Computational Fluid Dynamics

The outcomes of the SolidWorks’ flow simulations were wind velocity and surface pressure profiles. Contour streamlines and flow trajectories depicted the effect of constant wind load on the building model. Understanding the regions enabled a comprehensive investigation of the flow simulation. As displayed in Figure 11, Point 1, which went along the x-axis, was where the wind load pressure stagnated. The windward roofing edges produced vortex flow with significant pressure amounts and set boundaries on trajectory flows. The streamlines were split along the structure at Point 2 and converged at the front side’s horseshoe vortex at Point 3. The pace increased along the building’s corners at Point 4. The rear-most part of the building at Point 5 had a horizontal standing vortex in the wake region. Lastly, a reverse air flow was visible at Point 6. Determining dominance at the wake region implied the intensity of the drag force felt by the model. The larger the drag, the more massive the vortex.
The contour streamlines visualize the flow that is tangential to the velocity direction. Figure 12 compares the streamlines between individuals from the initial and last populations. A randomly picked individual from the zeroth generation drew a more significant portion in the wake region than the last generation’s best chromosome streamlines. This comparison suggested that the wind load had less impact on the building model as the generation increased.
Flow trajectories simulated the wind speed in the form of long arrow lines evenly distributed across the building’s surface as viewed isometrically. The trajectory mimicked the flow of air impacting the structure. Figure 13 shows that the best design point produced less vortex in the wake region. Thus, this scenario suggestsedless drag force, unlike a more powerful vortex, such as in the initial population’s random individual.
We investigated the surface plots of every face of the model with the best dimensions for building orientation and roof angle. The goal of these plots was to show the reactions felt by each face of the model structure. Figure 14 illustrates that the pressure varied on different walls. High pressure was present in the area directly facing the wind load. The wind load had a more significant effect on this surface than on the rest of the walls.

4. Conclusions

Roof structure failure is a common reason for the destruction of most residential houses when subjected to extreme wind load. Several related analyses have noted that building orientation or roof angle is essential for designing typhoon-resistant buildings. Searching for the appropriate dimensions for the orientation and roof angle of single-family residential houses had yet to be explored. Thus, in this study, we performed the design optimization of these dimensions to prevent the severe damages brought by the strong winds of typhoons. In our integrated approach, we used MATLAB’s GA to populate design points and SolidWorks’ CFD to calculate the fitness values. The program produced at the best design with an 80° orientation and 11° roof angle. The future direction of these studies is to examine the performance of a physical structure with the determined dimensions.
Thus, according to this study, strong typhoon winds pose a more significant threat to a low-rise residential building’s structural integrity, which is a problem that has been raised by multiple engineers, primarily because the current trend emphasizes establishing sustainable infrastructure. The construction of typhoon-resistant houses is a complex problem, and engineers should always consider optimal designs. Future researchers with the same interest can further utilize the presented results. Structural engineers can begin with the initial simulation findings of this study to develop low-rise, single-family residential houses in typhoon-prone areas, such as in the Philippines. Finally, the presented optimal orientation and roof angle can be integrated into designs of future low-rise structures in addition to other distinct features.

Author Contributions

Conceptualization, J.L.M., J.N.O., J.G.O. and S.A.G.; methodology, J.L.M., J.G.O. and S.A.G.; software, J.L.M. and S.A.G.; validation, J.L.M.; formal analysis, J.L.M.; investigation, J.L.M. and J.N.O.; resources, J.L.M.; data curation, J.L.M.; writing—original draft preparation, J.L.M.; writing—review and editing, J.N.O., J.G.O. and S.A.G. All authors have read and agreed to the published version of the manuscript.

Funding

This research received no external funding.

Informed Consent Statement

Not applicable.

Data Availability Statement

Not applicable.

Conflicts of Interest

The authors declare no conflict of interest.

Abbreviations

The following abbreviations are used in this manuscript:
GAGenetic Algorithm
CFDComputational Fluid Dynamics

References

  1. Guinto, R.R.; Parungao-Balolong, M.; Flores, R.J.D.; Bongcac, M.K. Establishing a community for planetary health in the Philippines. Lancet Planet. Health 2021, 5, e396–e397. [Google Scholar] [CrossRef] [PubMed]
  2. Santos, G.D.C. 2020 tropical cyclones in the Philippines: A review. Trop. Cyclone Res. Rev. 2021, 10, 191–199. [Google Scholar] [CrossRef]
  3. Kumar, S.; Lal, P.; Kumar, A. Influence of super cyclone “Amphan” in the Indian subcontinent amid COVID-19 pandemic. Remote Sens. Earth Syst. Sci. 2021, 4, 96–103. [Google Scholar] [CrossRef]
  4. Luu, L.N.; Scussolini, P.; Kew, S.; Philip, S.; Hariadi, M.H.; Vautard, R.; Van Mai, K.; Van Vu, T.; Truong, K.B.; Otto, F.; et al. Attribution of typhoon-induced torrential precipitation in Central Vietnam, October 2020. Clim. Chang. 2021, 169, 1–22. [Google Scholar] [CrossRef]
  5. Wang, X.; Li, Q.; Li, J. Field measurements and numerical simulations of wind-driven rain on a low-rise building during typhoons. J. Wind. Eng. Ind. Aerodyn. 2020, 204, 104274. [Google Scholar] [CrossRef]
  6. Stewart, M.G.; Ginger, J.D.; Henderson, D.J.; Ryan, P.C. Fragility and climate impact assessment of contemporary housing roof sheeting failure due to extreme wind. Eng. Struct. 2018, 171, 464–475. [Google Scholar] [CrossRef]
  7. Beben, D.; Maleska, T.; Bobra, P.; Duda, J.; Anigacz, W. Influence of Traffic-Induced Vibrations on Humans and Residential Building—A Case Study. Int. J. Environ. Res. Public Health 2022, 19, 5441. [Google Scholar] [CrossRef]
  8. Tao, Z.; Moore, J.A.; Sanayei, M.; Wang, Y.; Zou, C. Train-induced floor vibration and structure-borne noise predictions in a low-rise over-track building. Eng. Struct. 2022, 255, 113914. [Google Scholar] [CrossRef]
  9. Bande, L.; Alshamsi, A.; Alhefeiti, A.; Alderei, S.; Shaban, S.; Albattah, M.; Scoppa, M.D. Parametric design structures in low rise buildings in relation to the urban context in UAE. Sustainability 2021, 13, 8595. [Google Scholar] [CrossRef]
  10. Wu, Y.; Gao, N.; Niu, J.; Zang, J.; Cao, Q. Numerical study on natural ventilation of the wind tower: Effects of combining with different window configurations in a low-rise house. Build. Environ. 2021, 188, 107450. [Google Scholar] [CrossRef]
  11. Adhikari, R.; Rupakhety, R.; Giri, P.; Baruwal, R.; Subedi, R.; Gautam, R.; Gautam, D. Seismic Fragility Analysis of Low-Rise RC Buildings with Brick Infills in High Seismic Region with Alluvial Deposits. Buildings 2022, 12, 72. [Google Scholar] [CrossRef]
  12. Liang, J.; Han, B.; Todorovska, M.I.; Trifunac, M.D. 2D dynamic structure-soil-structure interaction for twin buildings in layered half-space II: Incident SV-waves. Soil Dyn. Earthq. Eng. 2018, 113, 356–390. [Google Scholar] [CrossRef]
  13. Fouad, N.S.; Mahmoud, G.H.; Nasr, N.E. Comparative study of international codes wind loads and CFD results for low rise buildings. Alex. Eng. J. 2018, 57, 3623–3639. [Google Scholar] [CrossRef]
  14. Abu-Zidan, Y.; Mendis, P.; Gunawardena, T. Optimising the computational domain size in CFD simulations of tall buildings. Heliyon 2021, 7, e06723. [Google Scholar] [CrossRef]
  15. Singh, J.; Roy, A.K. Effects of roof slope and wind direction on wind pressure distribution on the roof of a square plan pyramidal low-rise building using CFD simulation. Int. J. Adv. Struct. Eng. 2019, 11, 231–254. [Google Scholar] [CrossRef] [Green Version]
  16. Singh, J.; Roy, A.K. CFD simulation of the wind field around pyramidal roofed single-story buildings. SN Appl. Sci. 2019, 1, 1–10. [Google Scholar] [CrossRef] [Green Version]
  17. Enteria, N.A. CFD evaluation of Philippine detached structure with different roofing designs. Infrastructures 2016, 1, 3. [Google Scholar] [CrossRef] [Green Version]
  18. Xiong, M.; Chen, B.; Zhang, H.; Qian, Y. Study on Accuracy of CFD Simulations of Wind Environment around High-Rise Buildings: A Comparative Study of k-ε Turbulence Models Based on Polyhedral Meshes and Wind Tunnel Experiments. Appl. Sci. 2022, 12, 7105. [Google Scholar] [CrossRef]
  19. Ke, S.; Yu, W.; Cao, J.; Wang, T. Aerodynamic force and comprehensive mechanical performance of a large wind turbine during a typhoon based on WRF/CFD nesting. Appl. Sci. 2018, 8, 1982. [Google Scholar] [CrossRef] [Green Version]
  20. Lian, J.; Jia, Y.; Wang, H.; Liu, F. Numerical study of the aerodynamic loads on offshore wind turbines under typhoon with full wind direction. Energies 2016, 9, 613. [Google Scholar] [CrossRef]
  21. Mirjalili, S. Genetic algorithm. In Evolutionary Algorithms and Neural Networks; Springer: Berlin/Heidelberg, Germany, 2019; pp. 43–55. [Google Scholar]
  22. Frans, R.; Arfiadi, Y. Sizing, shape, and topology optimizations of roof trusses using hybrid genetic algorithms. Procedia Eng. 2014, 95, 185–195. [Google Scholar] [CrossRef] [Green Version]
  23. Stamoulis, M.N.; Santos, G.H.d.; Lenz, W.B.; Tusset, A.M. Genetic Algorithm Applied to Multi-Criteria Selection of Thermal Insulation on Industrial Shed Roof. Buildings 2019, 9, 238. [Google Scholar] [CrossRef] [Green Version]
  24. Deng, Y.C.; Hwang, J.H.; Lyu, Y.D. Developing Real-Time Nowcasting System for Regional Landslide Hazard Assessment under Extreme Rainfall Events. Water 2021, 13, 732. [Google Scholar] [CrossRef]
  25. Ouyang, H.T.; Shih, S.S.; Wu, C.S. Optimal Combinations of Non-Sequential Regressors for ARX-Based Typhoon Inundation Forecast Models Considering Multiple Objectives. Water 2017, 9, 519. [Google Scholar] [CrossRef] [Green Version]
  26. Wu, M.C.; Yang, S.C.; Yang, T.H.; Kao, H.M. Typhoon rainfall forecasting by means of ensemble numerical weather predictions with a GA-based integration strategy. Atmosphere 2018, 9, 425. [Google Scholar] [CrossRef] [Green Version]
  27. Khan, A.Y.; Ahmad, Z.; Sultan, T.; Alshahrani, S.; Hayat, K.; Imran, M. Optimization of Photovoltaic Panel Array Configurations to Reduce Lift Force Using Genetic Algorithm and CFD. Energies 2022, 15, 9580. [Google Scholar] [CrossRef]
  28. Erdem, C.; Eulalie, Y.; Gilotte, P.; Harries, S.; Nayeri, C.N. Aerodynamic Optimization of a Reduced Scale Model of a Ground Vehicle with a Shape Morphing Technique. Fluids 2022, 7, 166. [Google Scholar] [CrossRef]
  29. Yang, Z.; Jin, Y.; Gu, Z. Aerodynamic shape optimization method of non-smooth surfaces for aerodynamic drag reduction on A minivan. Fluids 2021, 6, 365. [Google Scholar] [CrossRef]
  30. Khlaifat, N.; Altaee, A.; Zhou, J.; Huang, Y.; Braytee, A. Optimization of a small wind turbine for a rural area: A case study of Deniliquin, New South Wales, Australia. Energies 2020, 13, 2292. [Google Scholar]
  31. Cao, J.; Zhu, W.; Shen, W.; Sørensen, J.N.; Wang, T. Development of a CFD-based wind turbine rotor optimization tool in considering wake effects. Appl. Sci. 2018, 8, 1056. [Google Scholar] [CrossRef] [Green Version]
  32. Akbari, V.; Naghashzadegan, M.; Kouhikamali, R.; Afsharpanah, F.; Yaïci, W. Multi-Objective Optimization of a Small Horizontal-Axis Wind Turbine Blade for Generating the Maximum Startup Torque at Low Wind Speeds. Machines 2022, 10, 785. [Google Scholar] [CrossRef]
  33. Yoshida, S.; Motoyama, M.; Jamieson, P.; Matsuoka, K. Diffuser total efficiency using generalized actuator disc model and its maximization method. Energies 2021, 14, 813. [Google Scholar] [CrossRef]
  34. Yao, X.; Liu, W.; Han, W.; Li, G.; Ma, Q. Development of Response Surface Model of Endurance Time and Structural Parameter Optimization for a Tailsitter UAV. Sensors 2020, 20, 1766. [Google Scholar] [CrossRef] [PubMed] [Green Version]
  35. Kumar, G.N.; Gundabattini, E. Investigation of Supercritical Power Plant Boiler Combustion Process Optimization through CFD and Genetic Algorithm Methods. Energies 2022, 15, 9076. [Google Scholar] [CrossRef]
  36. Kaseb, Z.; Rahbar, M. Towards CFD-based optimization of urban wind conditions: Comparison of Genetic algorithm, Particle Swarm Optimization, and a hybrid algorithm. Sustain. Cities Soc. 2022, 77, 103565. [Google Scholar] [CrossRef]
  37. Simiu, E.; Miyata, T. Design of Buildings and Bridges for Wind: A Practical Guide for ASCE-7 Standard Users and Designers of Special Structures; The National Academies of Sciences, Engineering, and Medicine: Washington, DC, USA, 2006. [Google Scholar]
  38. McAllister, T.P.; Wang, N.; Ellingwood, B.R. Risk-informed mean recurrence intervals for updated wind maps in ASCE 7-16. J. Struct. Eng. 2018, 144. [Google Scholar] [CrossRef] [PubMed]
  39. Katoch, S.; Chauhan, S.S.; Kumar, V. A review on genetic algorithm: Past, present, and future. Multimed. Tools Appl. 2021, 80, 8091–8126. [Google Scholar] [CrossRef]
  40. Hakimi, D.; Oyewola, D.O.; Yahaya, Y.; Bolarin, G. Comparative analysis of genetic crossover operators in knapsack problem. J. Appl. Sci. Environ. Manag. 2016, 20, 593–596. [Google Scholar] [CrossRef] [Green Version]
  41. Tang, P.H.; Tseng, M.H. Adaptive directed mutation for real-coded genetic algorithms. Appl. Soft Comput. 2013, 13, 600–614. [Google Scholar] [CrossRef]
Figure 1. Dimensions of the building model with (A) the minimum height H m i n and (B) maximum height H m a x .
Buildings 13 00107 g001
Figure 2. Summary of process flow for model construction and setting up dimensions for building orientation θ and roof angle φ in the SolidWorks application.
Buildings 13 00107 g002
Figure 3. The wind direction along the x-axis, directly hitting the side of the model at 0 orientation.
Buildings 13 00107 g003
Figure 4. Computation domain with its dimensions and boundary conditions. The inlet airflow of the computational domain has a constant wind speed of 315 km/h.
Buildings 13 00107 g004
Figure 5. The blockage ratios are less than 1% on combinations of roof angles ( φ ) and building orientations ( θ ).
Buildings 13 00107 g005
Figure 6. Perspective views of the structured mesh with high refinement near the model.
Buildings 13 00107 g006
Figure 7. The integrated software application automates the minimization search.
Buildings 13 00107 g007
Figure 8. Mean and best fitness scores per generation.
Buildings 13 00107 g008
Figure 9. Minimum, maximum, and mean fitness scores in each generation.
Buildings 13 00107 g009
Figure 10. Average distance between individuals at each generation.
Buildings 13 00107 g010
Figure 11. The model experienced different wind velocity profiles at various regions.
Buildings 13 00107 g011
Figure 12. Comparison of contour streamlines between (a) a random individual in the initial population and (b) best chromosome in last generation, visualized in top view (top) and normal view (bottom).
Buildings 13 00107 g012
Figure 13. Comparison of flow trajectories between (a) a random individual in initial population and (b) best chromosome in last generation.
Buildings 13 00107 g013
Figure 14. Surface plots based on pressure of the building model with 80 . 18 orientation and 11 . 26 roof angle.
Buildings 13 00107 g014
Table 1. Details of simulation parameters.
Domain DimensionsBlockage RatioCell Count
l u l d bhBR( × 10 6 )
2 H m a x 3 H m a x 6 H m a x 6 H m a x 0.28 % B R 0.83 % 9.24
Disclaimer/Publisher’s Note: The statements, opinions and data contained in all publications are solely those of the individual author(s) and contributor(s) and not of MDPI and/or the editor(s). MDPI and/or the editor(s) disclaim responsibility for any injury to people or property resulting from any ideas, methods, instructions or products referred to in the content.

