Article

Identifying Barriers to the Digitalization of China’s Real Estate Enterprises in Operations Management with an Integrated FTA–DEMATEL–ISM Approach

1
School of Data Science, Zhejiang University of Finance & Economics, Hangzhou 310018, China
2
Guangzhou R&F Properties Co., Ltd., Hangzhou 310000, China
3
School of Information Management & Artificial Intelligence, Zhejiang University of Finance & Economics, Hangzhou 310018, China
*
Author to whom correspondence should be addressed.
Buildings 2023, 13(1), 100; https://doi.org/10.3390/buildings13010100
Submission received: 23 November 2022 / Revised: 22 December 2022 / Accepted: 28 December 2022 / Published: 30 December 2022
(This article belongs to the Collection Strategies for Sustainable Urban Development)

Abstract

:
This paper aims to identify indicators of the obstacles that affect the digitalization of real estate enterprises in their operations management, and analyze the influence, hierarchy and relationships of these indicators. The indicators of obstacles that affect the digitalization of real estate enterprise operations management were explored by searching the literature and using the Delphi method and a word cloud diagram. The obstacle indicator system was built according to the upstream, middle and downstream levels of the value chain. The FTA obstacle model was used to analyze the influence of obstacle index, and the DEMATEL–ISM model was used to analyze the hierarchical structure and correlations between indicators. The results are as follows. The biggest barriers in real estate digitalization are in the upstream level, such as the difficulty in adopting new technologies, lack of information technology talent and the high cost of digital software. According to analysis from the DEMATEL–ISM, the difficulty of enterprises to use new technologies has a deep-rooted influence on the digitalization of real estate enterprises. Lack of information technology talent and the high cost of digital software in the upstream level as well as barriers related to a company’s development strategy and investment willingness constitute barriers in the midstream level. These barriers not only affect the external and internal links, but also influence each other. The lack of overall regulation and supervision can explain the reason for these barriers.

1. Introduction

In 2021, China’s primary, secondary and tertiary industries have achieved growth of varying degrees. The added value of the primary industry was 8308.6 billion yuan, representing an increase of 7.1% over 2020; the added value of the secondary industry reached 4.50904 trillion yuan, an increase of 8.2%. Among the secondary industries, the total industrial added value reached 37,257.5 billion yuan, representing an increase of 9.6% over 2020. In China, the impact of real estate development investment on economic growth has been significant and positive over the years [1], indicating that real estate investment is an important engine driving economic growth [2]. According to data from the National Bureau of Statistics, national investment in real estate development in 2021 totaled 14,760.2 billion yuan, an increase of 4.4% over the previous year; the national sales of commercial properties reached 18,193 billion yuan, an increase of 4.8%. The real estate sector’s added value rose by 5.2% in 2021 over the previous year, adding 0.4% to overall economic growth.
Years of rapid growth have, however, resulted in several drawbacks [3], such as the short history of marketization of China’s real estate industry, the lack of a functioning market mechanism and the prevalence of speculative activity [4]. To this end, the government has implemented a series of regulation measures in the real estate industry with the prohibition of housing speculation as a guideline, such as restricting the purchase of second and third homes as well as the resale of housing within five years, thus prompting the real estate industry to make supply-side reforms and enter an adjustment period; however, this will also destroy the growth of the construction industry to a certain extent, leading to bottlenecks in the development of some real estate enterprises [3,5]. The COVID-19 pandemic is impacting the economy across the world, and the real estate industry is certainly not immune to this global trend [6]. Some scholars have found that COVID-19 has reduced the market value of real estate in the United States by about 47% to 62% [7]. Its real estate development decreased by 16.3% from March to April 2021 alone, and operating capacity fell to 70% to 75% of prepandemic capacity [8]. Although COVID-19 has hit real estate investment to some extent and reduced the enthusiasm of some home buyers, it is still a common consensus for most Chinese people to buy their own property due to China’s large population base. In light of this fact, the demand for housing will remain strong. In addition, crises are also opportunities. Changes in the real estate market have also prompted the transformation and upgrading of real estate enterprises. The application of visualization, big data, cloud computing and other digital technologies will help real estate enterprises obtain large quantities of data in various business links for analysis and decision-making, which will promote process standardization, reduce business costs and improve management efficiency.
Real estate development businesses are facing a new market environment [9], that is, the shift of industry development from a period of incremental fast growth to a stage of stock development. This trend calls for the rebuilding of industrial value chain; therefore, it is necessary to establish a sound development system with a highly mature market [4], a distinct supply chain [10], high operational efficiency [11] and quick response times. Real estate corporations will use new technical advancements, particularly all-round digital advancements, as a key tool to hasten the formation of this robust growth system [12].
China’s digital economy has grown significantly in recent years [13,14,15,16], but real estate businesses still lag behind in digital technology adoption. According to the White Paper on the Development of China’s Digital Economy (2021), the digital economy in 2020 is worth $39.2 trillion, accounting for 38.6% of GDP. The use of digital technologies in the real estate sector is notably underdeveloped when compared to other industries in China, including the in-depth application of digital technologies such as artificial intelligence in the fields of healthcare [17], autonomous driving [18,19] and security [20,21]. Currently, digital technologies are mostly applied in the fields of intelligent architecture and house design [22,23,24], real estate energy management [25], property management [26] and real estate promotion and marketing [27,28] in Chinese real estate development firms.
According to the above-mentioned practical applications, digital technology has only been used to manage a few aspects of the real estate development enterprise rather than the entire chain of operations. This limits the effectiveness of digital technology and also encourages the formation of information islands and chimneys. It has become vital to conduct research on the application potential of digital technology in the operations management of real estate development companies given the need for transformation and upgrading of China’s real estate sector and the prospect of digital economy development.
Fault tree analysis (FTA) is usually used to study the root cause problem of a system. Combined with a risk matrix, risk analysis can be carried out to evaluate the probability of the occurrence of specific obstacles [29]. Therefore, fault tree analysis is widely used to make a forward-looking plan for an industry. Examples include the testing and evaluation of safety system engineering [30], the design and operation of a subway system [31] and the risk assessment of applying sensor networks to smart cities [32]. However, it is seldom used in the study of barriers to the digital operation of real estate. The Decision Making Trial and Evaluation Laboratory (DEMATEL) approach can further evaluate the dynamic relationship between barriers, mine the causal relationship between factors and find out the key factors [33]. Some scholars have applied it to the study of waste management barriers in smart cities [34]. The interpretive structural modeling method (ISM) can make the simplest hierarchical diagram and explore the relationship between obstacles without affecting the function of the system under study [35].
Therefore, this paper will explore the barriers of digital technology adoption in the operations management of real estate businesses in China. The research objectives include three aspects: (1) to construct the indicator system to detect obstacle factors affecting the digitalization of real estate enterprise operations management; (2) to use the FTA model to assess the influence of obstacle degree indicators; (3) to use the DEMATEL–ISM model to analyze the multilevel recursive hierarchy and correlation of obstacle indicators.

2. Literature Review

2.1. Enterprise Operations Management

The concept of operations management has been incorporated into the industrial sector in the current era due to rapidly growing social productivity, which has caused a significant transfer of production factors from the traditional industrial sector into the fields of commerce, transportation, real estate, public health services, finance and other service industries and fields. Operations management is an umbrella term encompassing management initiatives that are closely tied to product manufacturing and service provision. It refers to the planning, organization, implementation and control of the complete processes of operations [36]. Operations management can also refer to the design, implementation, monitoring and assessment of changes to the systems that generate and provide a company’s products or services.
The supply chain disruption risk, business model disruptions and the expanded goals resulting from public pressure over environmental sustainability and social responsibility in the past have prompted companies in different industries to develop new approaches to operations management, implementing measures such as supply chain risk management programs, new business models and new initiatives to address environmental and social issues. Now, under the circumstances of the China–US trade war and the COVID-19 pandemic, scholars have tried to investigate the research direction of operations management from the perspective of material, information and financial flows, and they have pointed out that socially and environmentally responsible supply chains, global supply chain redesign and innovative supply chain financing are the future research topics of operations management [37].
In the last two or three decades, social and economic development have seen modern businesses expand their production capacities and modernize their operations. Real estate businesses, which are closely related to people’s daily lives, are also undergoing a systematic and technological mode shift in their business operations and management [38]. The majority of real estate enterprises are still struggling with ineffective operations management structures in the transition process [39]. When building an operations management system, real estate enterprises should not only maximize customer value in line with the trend of contemporary business models [40], but they must also reasonably lay out all aspects of the operation management process based on their own development, implement refined operations management programs based on their internal business chain and external value chain and should pay attention to the incentive and guiding role of performance evaluation guidance [41,42].

2.2. Enterprise Digital Transformation

Digital transformation is a process of improving entities through combinations of information, computing, communication and connectivity technologies (digital technologies) that trigger significant changes in their broader individual, organizational and societal contexts [43]. Enterprises can leverage digital transformation to improve efficiency and productivity, and the benefits are significant and long-term [44,45]. The current digital transformation of enterprises includes the overall and innovative transformation of corporate strategy, commodity technology, business models and organizational management [46,47].
Small and medium enterprises (SMEs) are currently facing the challenge of how to reasonably use digital platforms to improve their original business models to conduct new business activities [48]. From the perspective of the digital economy, as Truant, Broccardo and Dana (2021) have pointed out, in the face of business challenges, technological innovation of digital platforms can help SMEs create greater value, and thus it is necessary to strengthen the foundation of China’s industrial digitalization, facility construction and digital platform technology innovation [49]. Another study found that there is a general lack of awareness of digital transformation in SMEs; for example, the top management of SMEs may not recognize the additional market opportunities brought by digital technology [50]. In addition, managers and employees are less willing to use online methods, and lack of online business knowledge hinders the digital transformation process of enterprises [51]. Although advanced foreign management theories have been applied, in practice, the lack of advanced management techniques for SMEs and lack of preparation for expectations are huge barriers that restrict the success of digital transformation of enterprises. These abilities in operations management can allow SMEs to compete with large multinational companies [52,53].
With a focus on real estate firms, digital transformation is both a challenging reform and a crucial way for the sector to break through traditions and achieve innovation. Operations management digitalization faces three main levels of barriers in terms of technology, organization and the external environment [47]. When digital technologies are not successfully applied, internal collaboration of project teams as well as information communication are not efficiently utilized [54]; in digital application scenarios, although the algorithms involved are cutting-edge and applicable, they are too theoretical and do not align well with reality [55], and there are also difficulties in translating data analysis capabilities into smooth business processes [56]. The biggest organizational impediments to the implementation of digital operations management methodologies in real estate organizations are routine organizational system rigidity and a lack of digital communication agent capabilities [57]. The absence of government incentives and support, as well as inadequate regulatory and standard systems, are external environmental hurdles to the adoption of digital technology in the real estate industry. These factors are outside the control of these companies [58,59]. Compared with other industries, such as manufacturing, the digitalization of China’s real estate industry started late. Digitalization focuses on technology, light assets and on solving the problem of information asymmetry and efficiency. As an asset-heavy industry with a long industrial chain and asymmetric information, the real estate purchase process emphasizes personalization and experience, which makes the real estate industry have a certain ability to resist the passive digitalization from Internet-based enterprises [47]. As a result, the real estate industry has a later inflow of digital personnel on a smaller scale than other industries. At the same time, the traditional operational thinking mode of managers in the real estate industry [60] and the insufficient adaptability of employees to new technologies [47] are also impediments to the intelligent development of industry.
In short, the discussion of operations management can broadly cover the positive experiences or challenges of different industrial sectors, with the operations management of the real estate industry being primarily based on case studies or the development of theoretical frameworks with little empirical analysis. Though there are wide and sufficient studies on digital transformation, covering industries with high technology development potential such as digital agriculture, high-tech manufacturing and service industries, little exploration is made regarding the transformation of traditional sectors such as the real estate industry. There are studies on the barriers or dilemmas of digital transformation, but very few empirical studies of the obstacle indicators. To fill this gap, this paper tries to use Chinese real estate enterprises as the research object and empirically analyze the challenges posed by the digitization of real estate enterprise operations management, as well as the hierarchy and relationships among the indicators of obstacle degrees, in order to offer clear empirical support for the digital reform of Chinese traditional real estate enterprises.

3. Research Methods

This study primarily adopted questionnaires and interviews of personnel in different posts within the operations management of real estate enterprises. The study was conducted in three stages. The goal of the first stage was to build a digital obstacle index system for real estate enterprise operation and management. Firstly, the index system of influencing factors of digitalization of operation management of real estate enterprises was constructed through a search of the literature and the Delphi method, and then the primary indicators were clustered by using the analysis results of a word cloud map. Finally, the digital obstacle index system of real estate enterprise operation and management was formed, which takes the three links in the upper, middle and lower reaches of the value chain as the second-level index, 9 clustering modules as the third-level index and 17 primary indicators as the fourth-level index. Based on the index system, we designed the Questionnaire on the Digitalization of Operation and Management of Real Estate Enterprises to further carry out the data collection in the second stage. Data were collected by snowballing, and then data curation and descriptive statistical analysis were performed. The third stage involved model construction and result analysis. The DEMATEL–ISM model was further developed to assess the multilevel hierarchical structure and interrelation of the obstacle degree indicators using the obtained data. The FTA obstacle degree model was established to analyze the impact size of the obstacle degree index.

3.1. The Establishment of Indicator System in the Digitalization of Real Estate Management

A search for relevant literature was conducted using two major literature databases, namely CNKI in China, Web of Science and Scopus. To ensure the quality of the literature, keywords such as “digitization of real estate enterprises”, “operations management innovation”, “digital barriers”, “digital innovation/transformation” and “value chain innovation” were used to search articles from SCI journals, EI journals, the core journals of Peking University, CSSCI, CSCD and other important literature databases. After screening and eliminating, a total of 530 references were collected. Through further searching and research of the literature, the areas where current academic research was still insufficient were initially identified, and the research direction was broadly determined. The questionnaire scale was developed with the digitalization of operations management as the core dimension, and some of the scale candidates that could be considered were selected, as shown in Figure 1.
Based on the above literature review and word cloud map analysis, we invited a group of experts, including 5 professors of management and statistics in universities and the real estate industry, including 3 executives of operations management of Guangzhou R&F Properties Co., Ltd., to score the initial set of indicators using the Delphi method (see Appendix A for details). We then divided the entire chain of operations management of real estate enterprises into three categories: upstream design, midstream production and downstream management. Finally, the factors affecting the digital operations management of real estate enterprises, including 3 secondary indicators and 17 tertiary indicators, were shown in Table 1, and a survey questionnaire was designed based on them.

3.2. Questionnaire Design and Reliability Test

A questionnaire was conducted on the Wenjuanxing platform to examine whether real estate managers knew about digitalization, the adoption of digitalization and the barriers they were facing (see in Appendix B). The questionnaire, consisting of three parts, had to be finished in 10–15 min. The first part was the demographic description of those managers, including gender, age, education, career and work experience in real estate. The second part gave questions on their views on digitalization and their willingness to adopt, such as how much they know about real estate digitalization, whether the companies they work for have adopted digitalization and what technologies they have applied. Part three gave questions either on the barriers they encountered in the adoption of technology in the digitalization process or, if they have not adopted digitalization, the reasons they have not. The interviewees were asked to grade the impact of technology, with 0 indicating no obstacle and 1–5 indicating the probability of occurrence or impact of the obstacle from very low to very high.
The internal consistency of questionnaire was tested using the Cronbach’s coefficient method to determine the reliability. The results showed that Cronbach’s coefficient was 0.962, greater than 0.7, indicating that the scale of the questionnaire used in the study had good reliability and internal consistency.

3.3. FTA Barriers Degree Model Construction in the Digitalization of Real Estate Enterprises

Using Boolean logic to aggregate low-order events and analyze undesirable states in a system, fault tree analysis (FTA) [61,62] is a top-down deductive risk analysis technique. To identify risks, comprehend system fault reasons and determine the most effective strategy to reduce risk, FTA analysis is most frequently used in the domains of safety engineering and reliability engineering [63]. It is a vital technique for risk management and risk modeling and may be used to determine and quantify the risks connected to any project.

3.3.1. Principle and Mathematical Basis of the Method

FTA is related to set theory in mathematics. It expresses events as combinations of some basic events, or, to put it another way, expresses system faults as combinations of basic component faults. It then acts out these equations to find the combinations of component faults that lead to system faults, i.e., seeking the minimal cut set (MCS) that leads to top events that can never occur and identifying events with serious repercussions [64]. This process is achieved by means of Boolean algebraic rules, some of which are as follows [65,66]. Equations (1)–(4) are the basic rules of Boolean algebra; most of the other rules are derived from these four basic rules.
Commutative   law X + Y = Y + X
Law   of   absorption X + X Y = X
Associative   law X Y Z = X Y Z
Law   of   tautology X X = X
Using the formulae above, the “top event”, i.e., the one that has to be analyzed, is followed by a mapping of all the connected events in accordance with their logical connections, branching down to locate their root causes in the shape of a tree, and so on until all potential basic events have been reached. The procedure continues until all root causes have been found by first identifying the top events and then moving on to find the intermediate events. These exhibit the fault tree structure’s lowest level and are referred to as “basic events” and “gate events”, respectively.
Logic gates like AND and OR describe the relationship between all events from the top to the basic events. In order to assess the likelihood that a specific fault or hazard will materialize, FTA offers a qualitative model that gives a clear understanding of the causes of event failure and quantifies additional information about the probability of any event occurring from top to bottom.
In this paper, a comprehensive questionnaire was used to investigate the basic events, and a risk score was assigned to each obstacle according to the interaction matrix of probable probability and impact of occurrence [67]. The following equation is how the risk score R S was determined:
R S = P × I
where P denotes probability and I stands for the impact of the obstacle.

3.3.2. Establishment of Index System of Obstacle Degree

Based on the literature concerning the digitalization of operations management in the past seven years, web crawler technology was used to obtain blog posts and comments on relevant topics, such as the digital transformation of enterprises, on microblogs and public websites. Figure 2 shows high-frequency words displayed in the form of a word cloud diagram generated with Python software to understand current mainstream concerns about digital innovation and operations management of enterprises, which provides reference for the design of the index system. “Small and medium-sized enterprises” (SME) is a high-frequency term that has been extensively studied, and “business model”, “production method”, “information technology”, “technical innovation” and “infrastructure” are other frequently discussed subjects. It is clear that SMEs are a key area of concentration for digital transformation, and because the ultimate goal of transformation is to create a new company operating model, “business model” is also a major research hotspot. The trends of the era of the digital economy are also reflected in production method, innovation capacity and technological innovation, artificial intelligence and information technology, etc. These factors are also the socioeconomic background that motivates businesses to plan transformation and upgrading. Extended topics such as “infrastructure”, “ecosystem”, “e-commerce” and “business processes” provide the digital transformation process of enterprises both room for play and opportunities for innovation, yet may also imply potential barriers. Based on the above high-frequency words, this paper classifies the 17 factors in Table 1 that affect the digitalization of real estate enterprise operations management into 9 categories (V3). Finally, a digital obstacle indicator system for real estate enterprise operations management has been formed, including three levels, as shown in Table 2.

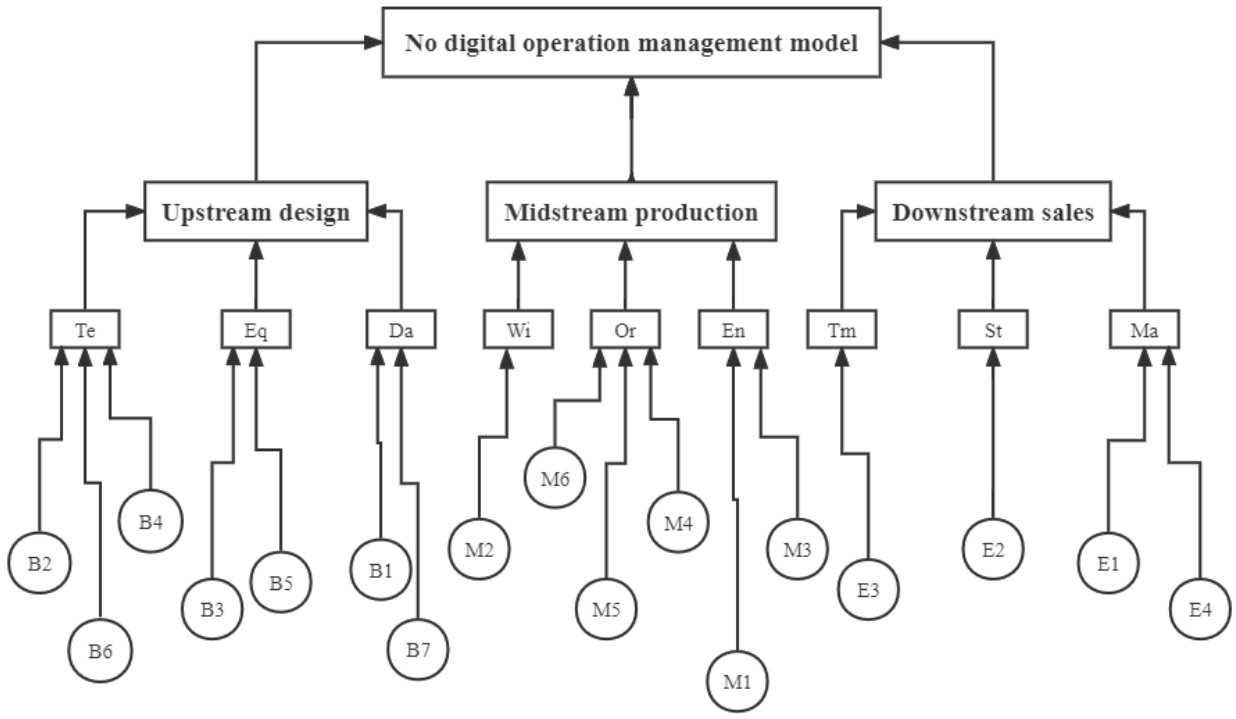
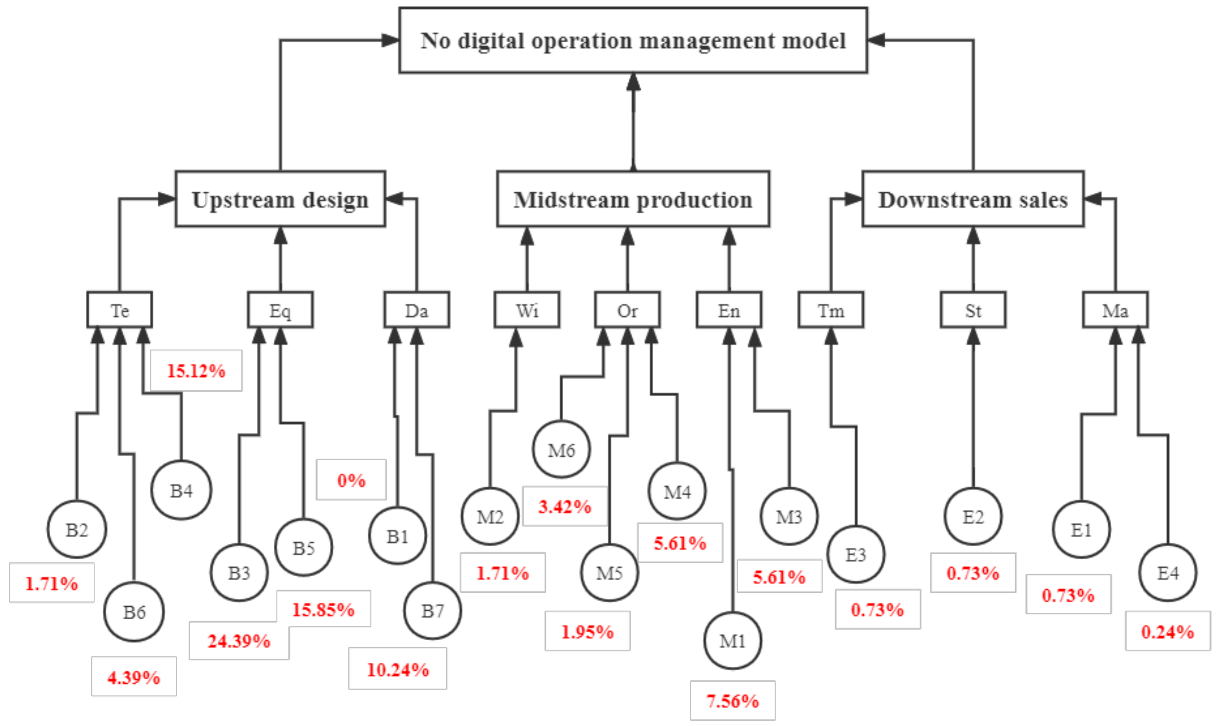
3.3.3. Fault Tree Construction

The scoring fault tree constructed in this study is shown in Figure 3, and it demonstrates how its hierarchical probabilities were multiplied to determine the final probability of each individual obstacle leading to the occurrence of the top event. The last node was determined using the aggregate risk score values as stated above, and at each level of analysis, the total probability was equal to 1. Level 1 contained only one connecting node from level 1 to level 3, hence the assigned probability value was 1. Since it was unclear how much of an influence each obstacle will have, we first assumed that all three branches on Levels 2 and 3 will occur equally frequently, thus giving each branch a chance of 0.33. The final probability was calculated as follows:
F i = R S i × V 1 × V 2 × V 3

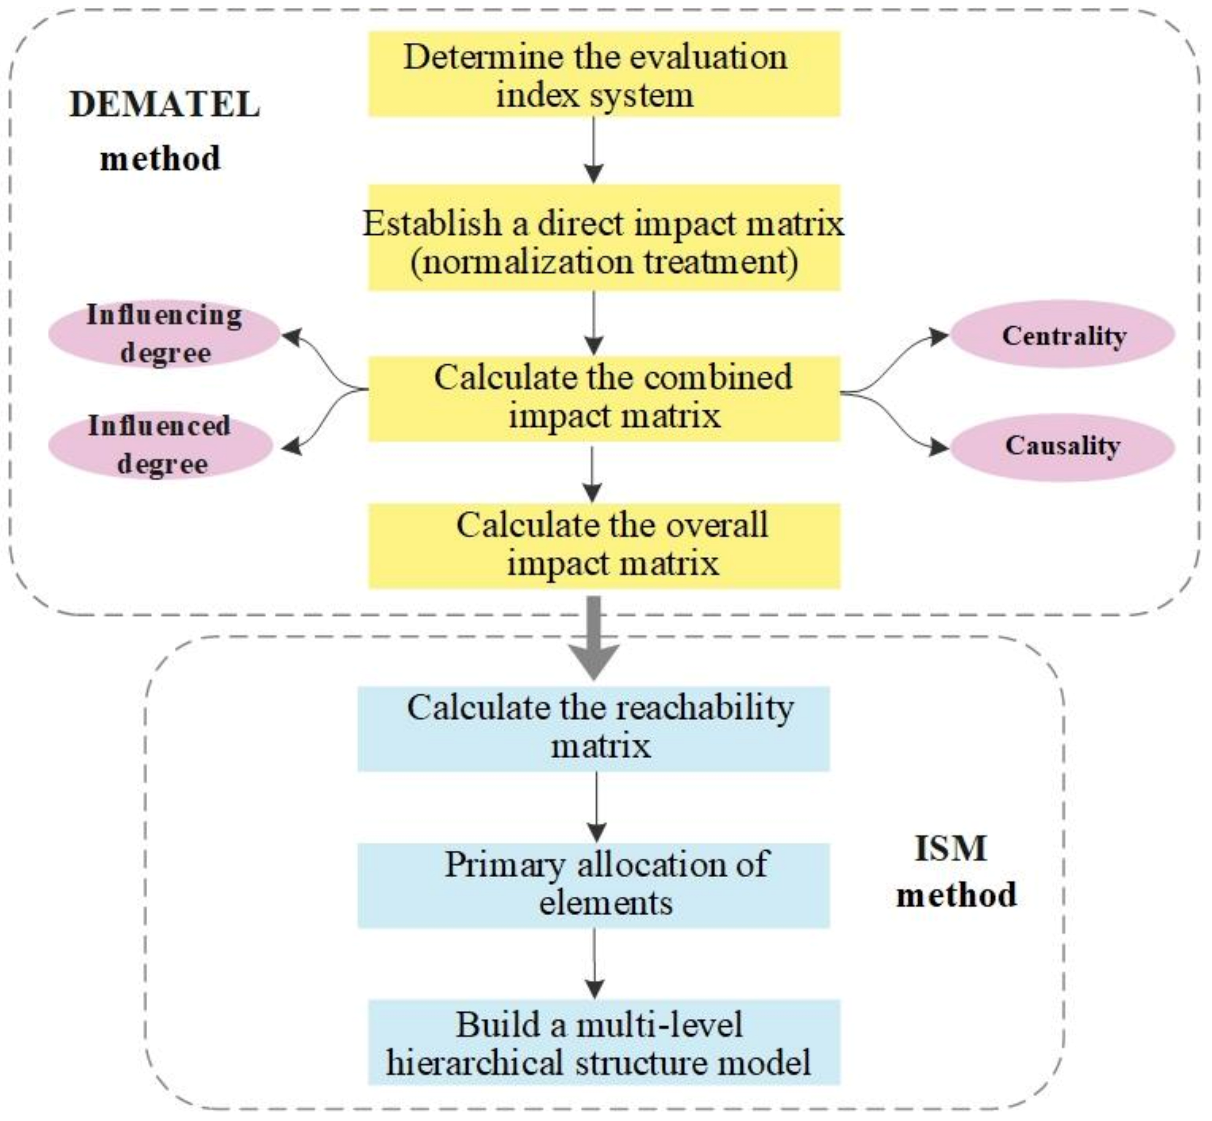
3.4. Construction of DEMATEL–ISM in the Digitalization of Operations Management of Real Estate Enterprises

The DEMATEL (Decision Making Trial and Evaluation Laboratory) approach was proposed by A. Gabus and E. Fontela in 1971 as a methodology to comprehend complicated and challenging problems in the actual world [33]. Specifically, it uses graphical and matrix tools to analyze the degree of importance of factors within a complex system and thereby simplify the analysis of the system structure [68]. This method determines the role of each factor in the overall system by analyzing the logical and direct influence relationships among the factors in the system and constructing a direct influence matrix [69].
The ISM (interpretive structural modeling method) is a system engineering research technique that can convert ambiguous concepts and viewpoints into understandable models with strong structural connections [70]. It is particularly effective for the analysis of systems with numerous variables, intricate relationships and hazy structural details [71].
When the influencing factors for the digitization of real estate enterprises were investigated, it was discovered that various factors have intricate relationships with one another, and as they touch on a wide range of enterprise operations management issues, there exist factors from different levels. Owing to the complexity of influencing factors, this paper uses the DEMATEL method to determine the relative importance of various factors and their relationships of mutual influence. Then, it uses the ISM method to determine the logical structure of each influencing factor and create a multilevel hierarchical structure model that reflects the importance of the various factors [72]. Figure 4 illustrates the precise operating steps. In the DEMATEL stage, based on the questionnaire data of the index system collected above, the direct influence matrix was established and normalized in Section 4.3.1. In Section 4.3.2, the comprehensive influence matrix and the overall influence matrix as well as the four indexes of influence degree, influence degree, centrality degree and cause degree were calculated. Based on the calculation of the overall influence matrix and reachability matrix of ISM stage in Section 4.3.3, a multilevel hierarchical structural model was constructed and analyzed in Section 4.3.5 after the primary obstacle degree elements were allocated in Section 4.3.4.

4. Analysis of the Barriers to the Digitalization of Operations Management of Real Estate Enterprises

4.1. Analysis of Descriptive Statistical Results

The questionnaire was collected from May to June in 2021. A total of 145 valid questionnaires were collected, and descriptive analysis was done on the respondents’ demographics, covering a number of factors including the distribution of respondents’ jobs, years of experience, knowledge of digital technology, the status of their applications and their awareness of future adoption.

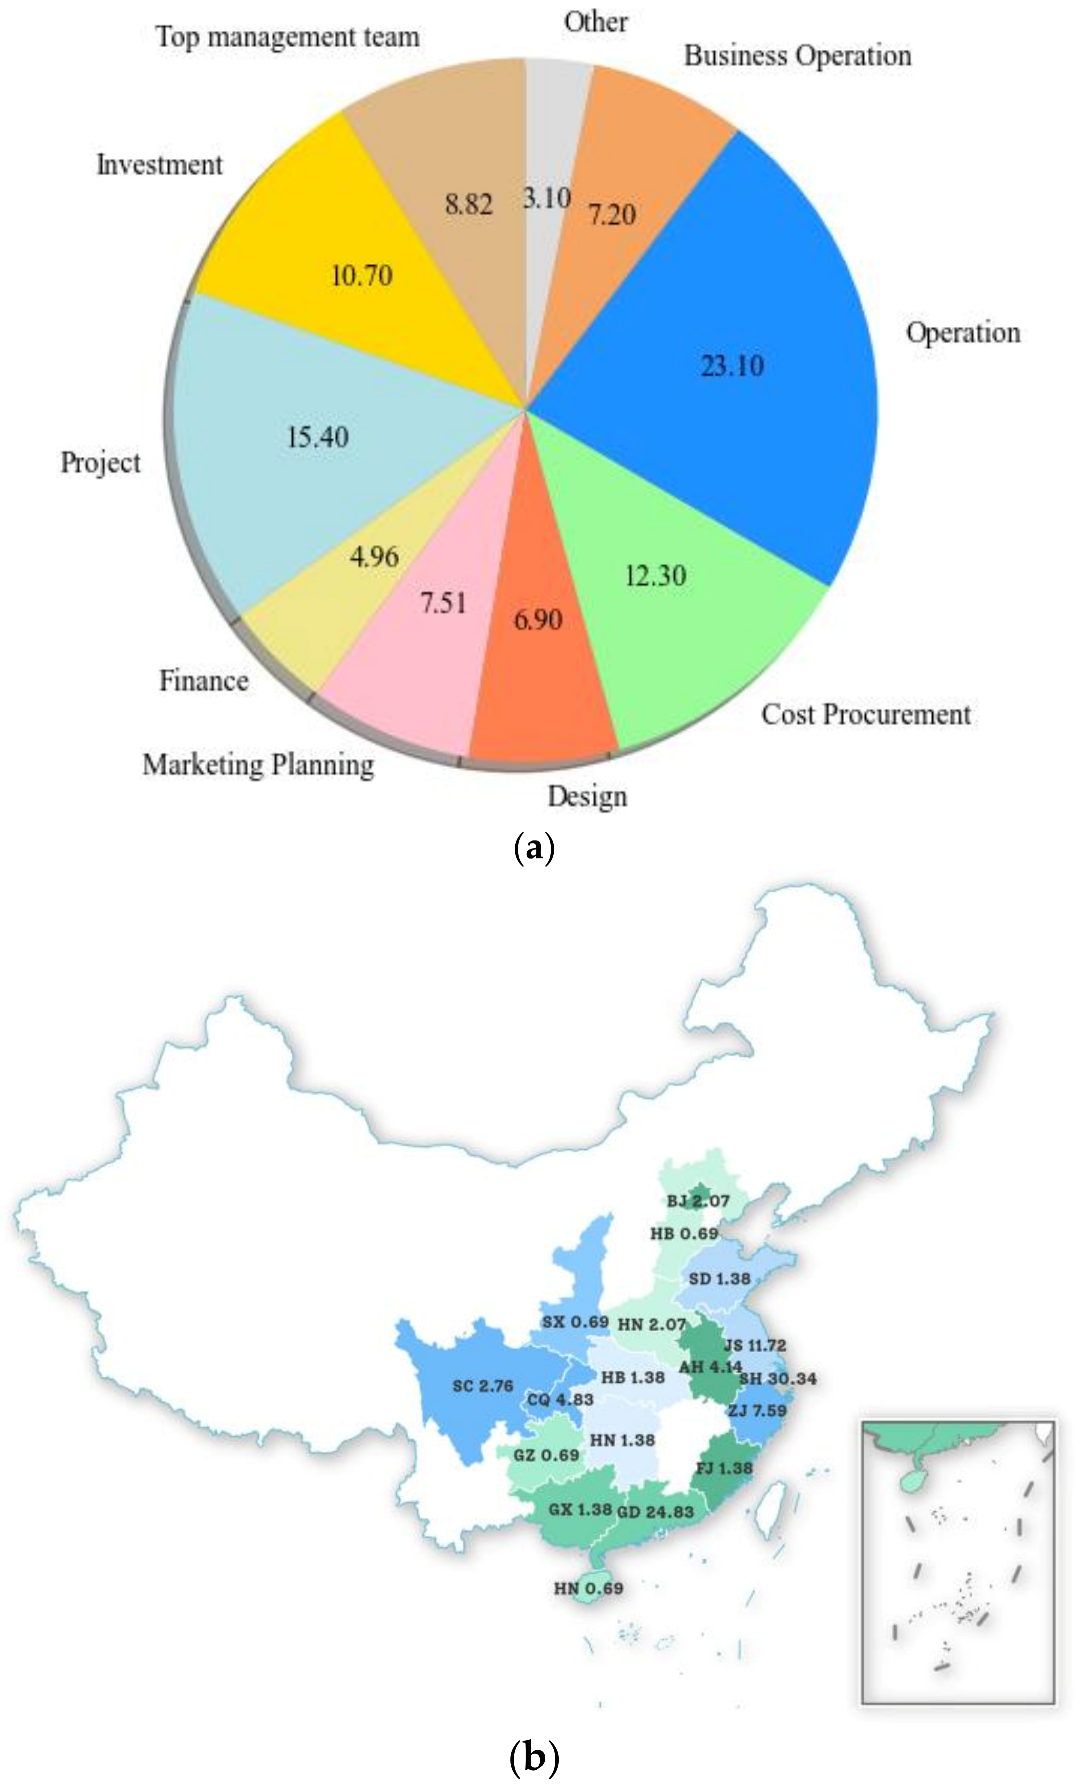
4.1.1. Demographics of Respondents

The positions of the respondents were distributed in the field of operations management, as shown in Figure 5a. The positions range from operations (23.1%), real estate engineering (15.4%), real estate cost recruitment (12.3%) and real estate investment (10.7%), and others include top management team, real estate design, finance, marketing planning, business operation, etc. Figure 5b shows the regional distribution in which it is clear that the respondents mainly came from the more developed regions of real estate development, such as the north, south, east and central regions of the top three cities—Shanghai (30.77%), Guangdong (23.76%) and Jiangsu (11.89%). According to Table 3, nearly half of the respondents had less than 5 years’ experience in the real estate industry, more than 1/3 had 5–10 years’ experience, less than 1/4 had more than 10 years’ experience and nearly 5% of the workforce had up to 20 years’ experience or more.

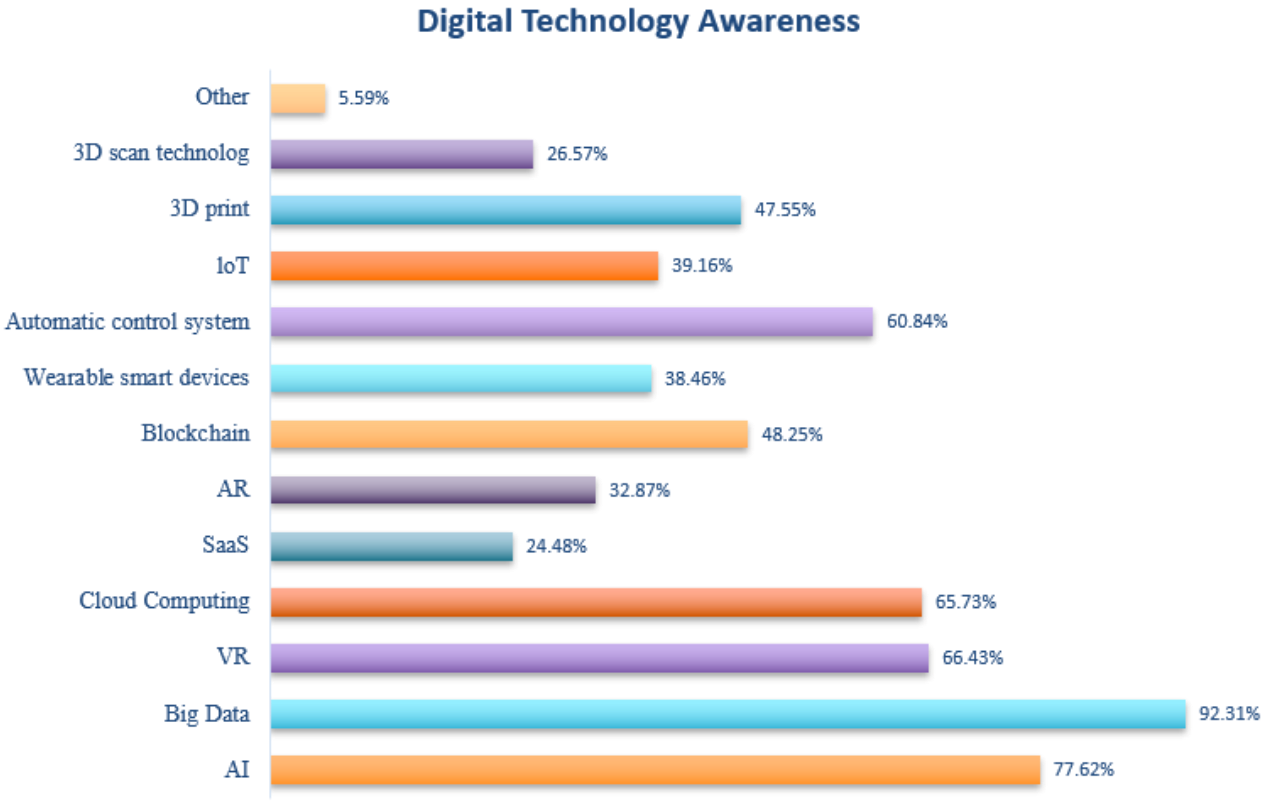
4.1.2. Adoption of Digital Technologies for Operations Management

According to the survey, digital technologies were adopted by 46.15 percent of the respondents’ real estate businesses. Up to 92.31 percent of respondents (78.62%) said they have some knowledge of how the real estate industry is becoming more digitalized. Big data was followed by artificial intelligence (77.62%), virtual reality (VR) technology (66.43%), cloud computing technology (65.73%) and automatic control systems (60.84%) in terms of understanding (as shown in Figure 6). It is important to note that even highly specialized technologies, such as 3D printing and blockchain, were familiar to almost half of the population. This is encouraging because awareness is the first step towards embracing and accepting digital innovations. However, excluding the “other” option, SaaS technology is the least understood, and SaaS technology may be able to help businesses with their cost and learning curve issues; therefore, awareness must be raised in this area. Overall, there is mass awareness for the real estate companies adopting and utilizing digital technologies.

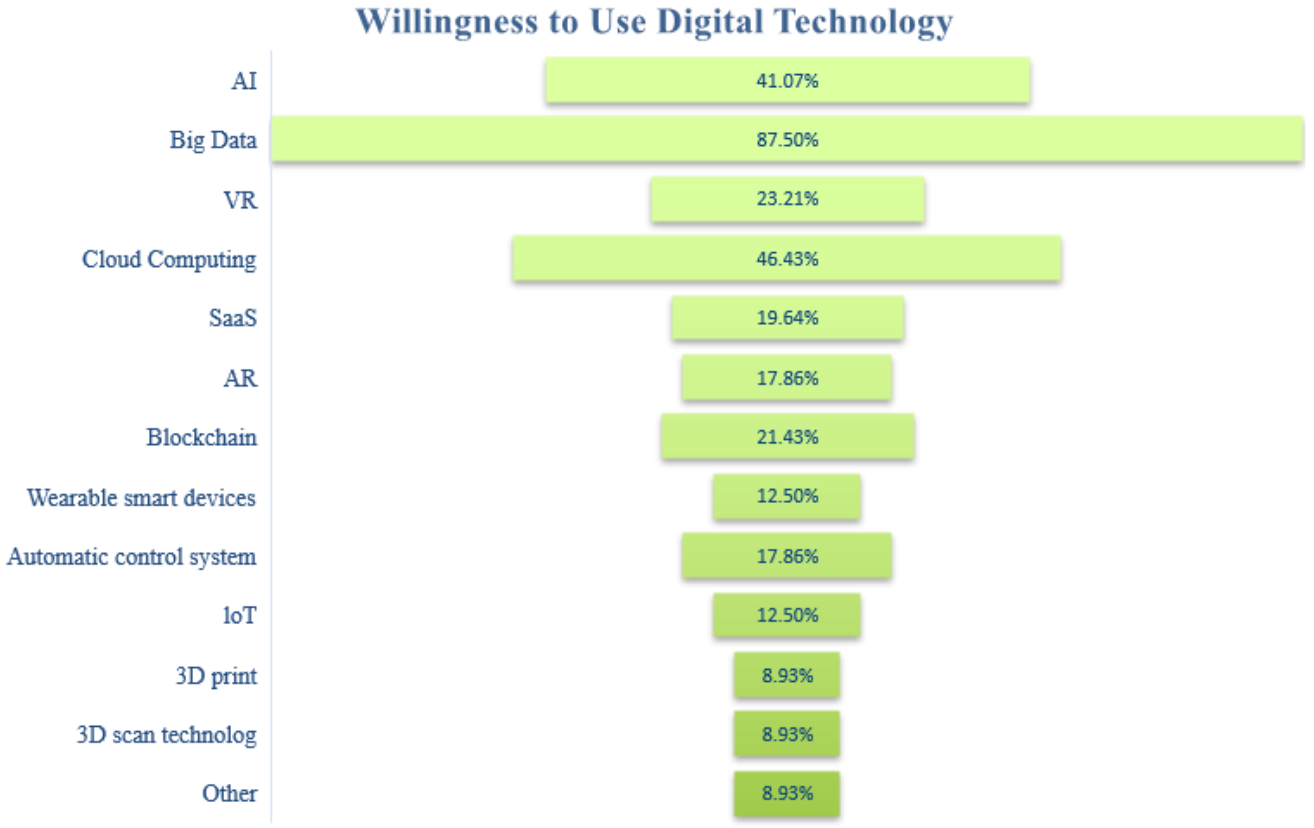
4.1.3. Adoption Intention of Digital Technology

72.73 percent of respondents had the willingness to adopt digital technology, indicating that employees within these organizations are aware of the need for corporate upgrading and that people are influenced by the social trend of digitalization.
Figure 7 shows the responses concerning which digital technology they would like to adopt. Big data was the highest (87.5%), followed by cloud computing (46.43%) and artificial intelligence (41.07%), which is in line with the findings of the respondents’ understanding of digital technology and suggests that enterprises are more likely to develop digital technology about which consumers have a certain knowledge. Second, respondents have similar willingness to apply blockchain, SaaS, VR and AR, each of which reported about 20% willingness among respondents. It can be seen that enterprises intend to adopt a variety of digital technologies to provide consumers with a more relevant and attractive brand experience. Meanwhile, accurate and real-time reports from multiple digital channels provide consumers with data intelligence.

4.2. Obstacle Degree Analysis

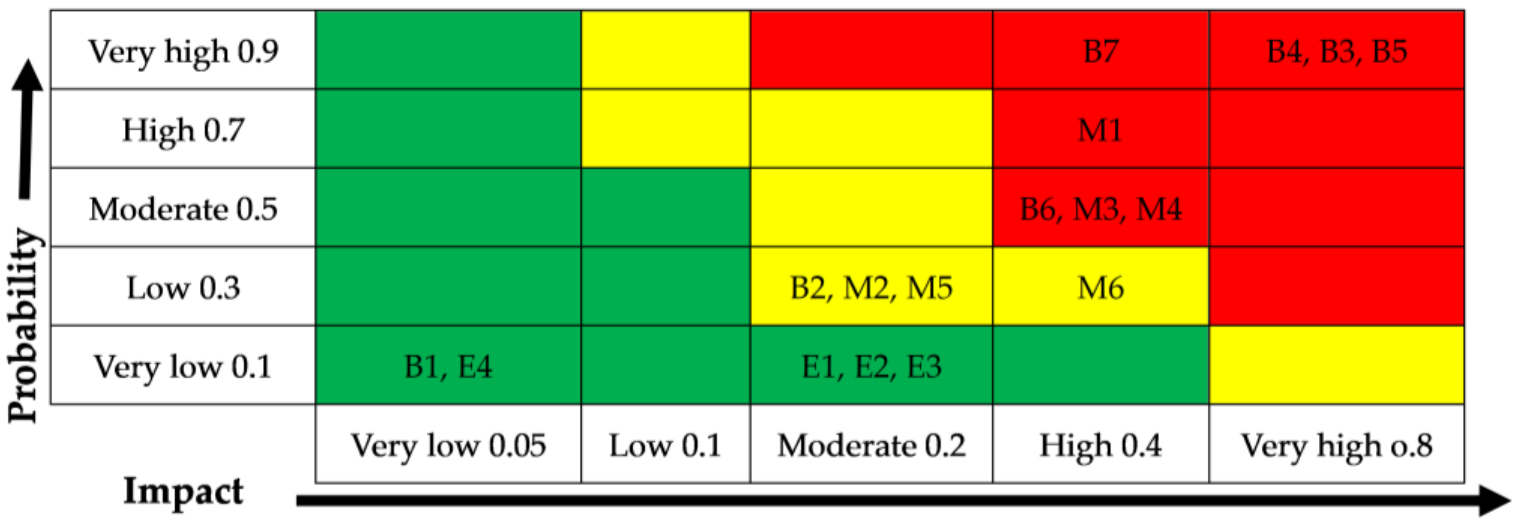
4.2.1. Risk Matrix Development

In the questionnaire, we designed an obstacle scale, with 0 representing no obstacle and 1–5 indicating the probability of occurrence or impact of the obstacle from very low to very high, in order to assess possible barriers and the impact of these barriers to the application of digital technology in real estate operations management. Table 4 shows the obstacle scores, and it can be seen that the highest frequency of the “very high” response was the lack of information technology talent and the high cost of digital software (B3), which occured 25 times, followed by the difficulty of using new technology (B4) and the high cost of infrastructure (B5), each with a frequency of 21 times. Institutional restrictions and the degree of barriers to the company’s growth strategy (M1) were both relatively high, with 20 occurrences in the evaluation. In terms of the three lower levels of evaluation, the lack of a good stakeholder cooperation model (M5) saw the most frequent “no such obstacle” response, followed by management’s lack of investment readiness (M2), the difficulty in obtaining information on product design and customer needs (B1) and low consumer acceptance of digital marketing (E4). Considering the two “very low” and “low” items and simply putting them together, we can determine that the difficulty in acquiring data on product design and consumer wants (B1) had the highest frequency among the three low degree items, with a total of 66 responses. The low degree of consumer acceptability of digital marketing (E4), which appeared 64 times, leads us to believe that the combined impact of these two barriers may be negligible. This is consistent with the big data economy and the social environment in which people are used to digital technology.
For further analysis and the construction of a risk matrix, Table 5 shows the transformation of the respondents’ scores into a mean probability score and mean impact score, each given min–max normalization. The mean score for impact is generally greater than that for probability. B3 got the highest standardized mean probability score and mean impact score, followed by B4, B5 and B7. It can be concluded that the upstream design segment had a larger obstacle likelihood and impact. Additionally, it was discovered that E4 is the only obstacle with a score of impact less than 0.1.
Table 6 shows the results of the risk scoring formula used to determine each obstacle’s risk score after determining its probability and impact score. The normalized values will change the original structure of the data and obscure the differences between barriers; as a result, this project uses the RS values directly in the subsequent FTA for calculation without normalization because the results show that there is a more pronounced difference between different obstacle risks. According to the table, which is consistent with the previous analysis, B3 (1) had the highest risk score, followed by B5 (0.65) and B4 (0.62); B1 (0) had the lowest risk score, with E4 (0.01), E1 (0.03), E2 (0.03) and E3 (0.03) following.
After calculating the risk score and normalized score values, the probability and influence matrix given below categorizes the barriers, showing the risk level of each obstacle. Those located in the red area were high-risk barriers, those located in the yellow area were moderate-risk barriers, and those located in the green area were low-risk barriers. As shown in Figure 8, the barriers ranked very high were B4, B3, B5, B7 and M1, and the barriers ranked relatively low were B1 and E4. Twelve barriers fell into the medium- and high-risk area of the matrix, only 5 barriers fell in the low-risk area, and the four barriers in the downstream sales link were classified as low risk barriers; after observation, the probability of occurrence of the 4 barriers located in the medium-risk area was lower than their influence. Among the eight barriers located in the high-risk area, B4, B3 and B5 were three barriers of very high risk, indicating a high risk of hindering the digital operations management of real estate, and the probability of occurrence of the other five barriers was higher than the impact strength.

4.2.2. FTA

This section explains how the risk score was used to calculate the probability value of each obstacle leading to the occurrence of the top event, which was combined with the previous analysis and calculated in this project using the following formula:
F V i = R S i × 1 × 0.33 × 0.33
In the fault tree, the likelihood of each obstacle causing the top event is represented by its percent contribution, which is shown in the following formula:
F i ( % ) = F V i F V i × 100
The modified fault tree diagram is displayed in Figure 9. Overall, B3 (lack of information technology talent and high cost of digital software) was the obstacle with the highest contribution (24.39%). It was the only obstacle with a contribution of more than 20 percent among all obstacles, and it had the highest likelihood of occurrence of top events brought on by the upstream design link, indicating that the cost issue is still a significant obstacle to the adoption of digital operations management by real estate enterprises. Enterprises are still hampered in their efforts to embrace digitalization by the dearth of senior information technology personnel. Additionally, B5 (15.85%) indicates they often had inadequate infrastructure, and B4 (15.12%) indicates they often found it challenging to use new technology. These results show that real estate businesses struggle to adopt digital operations management due to a lack of hardware, and they also show how challenging it is for businesses to use new technology in operations management, which has an impact on their digital transformation. As a result, the challenges are primarily found in the upstream design, particularly in hardware and software.
It can be seen that the contributions of the barriers in midstream production were not more than 10%, and the influence was moderate. Barriers in the M1 category (7.56%), i.e., those related to company development strategy and institutional constraints, were the most contributing barriers, which indicates that the failure of enterprises to adopt digital operations management mode is to some extent limited by their own development strategies. In order to carry out value chain innovation, it is necessary to reform and adjust the corporate planning and management system.
Overall, it appears that each obstacle in the downstream sales section only contributed a modest amount of no more than three percent. These four barriers, when taken together with the risk matrix, all fell in the low-risk category, which may mean that they have not yet developed into barriers that real estate organizations must raise concerns about throughout the process of managing digital operations.

4.3. Multilevel Hierarchical Structure and Correlation Analysis of Obstacle Degree Index

4.3.1. Establishing a Direct-Influence Matrix

To further analyze the hierarchy and degree of correlation within the obstacle degree index, we first used the Delphi method to score the degree of mutual influence within the 17 barriers index and used the averaging method to obtain the final scores of each factor. As shown in Table 7, this resulted in a direct matrix between the influencing factors of digital technology use.

4.3.2. Calculation of the Total-Influence Matrix

The new matrix X was obtained by normalizing the direct-impact matrix on the basis of the preceding, and the comprehensive influence matrix T was further obtained by calculating the following equation:
X = 1 m a x 1 i 17 j = 1 17 a ij
T = X I X 1
where I is the unit matrix. As shown in Table 8, the total-influence matrix was calculated with the help of MATLAB.
The four indicators for each obstacle degree were calculated separately through the comprehensive influence matrix T , as shown in the following formulae:
Influencing   degree D i = j = 1 17 t i j i = 1 , 2 , 3 , , 17
Influenced   degree C i = j = 1 17 t j i i = 1 , 2 , 3 , , 17
Centrality F i = D i + C i
Causality R i = D i C i
where D i refers to the sum of the values of each row in the matrix T , indicating the comprehensive influence of each element on all other elements; C i refers to the sum of the values of each column in the matrix T , indicating the comprehensive influence of all other elements on each element; the sum of the influence degree and the influenced degree of the element is regarded as the central degree of the element F i , which indicates the position of the element in the evaluation index system and the size of its role. The greater the centrality, the greater the importance of the element. The difference between the influence degree and the influence degree of an element is denoted as the cause degree of the element. If the cause degree is greater than 0, it indicates that the element had a great influence on other factors, which is called the cause factor. Otherwise, it is called the result factor.
Table 9 shows the F-centrality and R-degree of both “managers’ lack of willingness to invest” ( S 9 ) and “lack of information talent and high cost of digital software” ( S 3 )were found to be relatively high, which indicates that they play a significant role in the use of digital technology in enterprises and, to a large extent, also influence other factors in the system. As such, they can be regarded as key factors that should be taken into consideration when formulating the value chain. The remaining factors are examined in more detail.
In terms of centrality, the most crucial factors include “lack of data management and data repository” ( S 7 ), “lack of digital systems and management organizations” ( S 10 ) and “outdated current technology and low efficiency” ( S 2 ). These barriers, on one hand, show that managers only have a vague understanding of digitalization and have not put digitalization into practice or made decisions on the corresponding rules and regulations of digitalization. On the other hand, the barriers also demonstrate the importance of technical support, which helps with the adoption and development of digitalization.
From the perspective of causality, the factors with R-causalities greater than zero were “insufficiency of industry regulations, standards and supervision” ( S 15 ), “enterprises’ development strategy and institutional constraints” ( S 8 ) and “enterprises’ lack of knowledge of new technologies” ( S 4 ), which are called causality barriers acting as prerequisites for most other factors. The factors with R-causalities less than zero were “lack of advanced technology in market information mining” ( S 16 ), “lack of data management and data repository” ( S 7 ), “enterprises’ lack of sufficient dynamic sales information” ( S 14 ), “poor cooperation between stakeholder enterprises” ( S 12 ) and “poor organization and coordination of various departments within the enterprise” ( S 13 ). These obstacle factors are outcome factors, which are easily influenced by other factors. For example, organization and coordination of various departments within the enterprise as well as cooperation between stakeholder enterprises will be affected by the company’s development strategy.

4.3.3. Calculation of the Total-Impact Matrix and Reachability Matrix of Indicators

It is important to first check for a logical connection between the components that influence or imply one another before using the ISM model to undertake an explanatory structural analysis of the factors influencing the use of digital technology.
Based on the total-influence matrix calculated earlier, the overall influence matrix was obtained with the following equation:
H = I + T
The attenuation degree is also set to round off the influence relationship between elements with less influence in order to achieve the purpose of simplifying the system structure. The calculation is shown in Formula (16):
K i j = 1 , h i j λ i , j = 1 , 2 , 3 , , 17 0 , h i j < λ i , j = 1 , 2 , 3 , , 17
Since the threshold value must be taken for numerous trials in order to acquire the optimum system structure model, the setting of the attenuation degree directly influences the makeup of the reachability matrix and the division of the system structure. The reachability matrix between factors was determined in this study by choosing λ = 0.25 , λ = 0.27 , λ = 0.30 , λ = 0.32 and λ = 0.35 . The node degree of the factor is the sum of the elements in the rows and columns of the reachability matrix, and it was determined that the node degree is moderate when the threshold value is 0.32; therefore, it was set to 0.32. Then, the power operation of the matrix was carried out by Boolean algebraic operation law to obtain the reachability matrix. Formula (17) shows the calculation.
M i j = K + I r = K + I r 1 K + I 2 K + I
The final reachable matrix of factors is shown in Table 10:

4.3.4. Primary Allocation of Barriers

According to the reachability matrix, the reachable set of each obstacle factor P S i (the set of barriers with a value of one in the corresponding row of a factor in the reachability matrix) and the prior set Q S i (the set of barriers with a value of one in the corresponding column of a factor in the reachability matrix) were found, and a circular stratification of all factors was done based on L i S i | P S i Q S i = P S i i = 1 , 2 , 3 , , 17 , excluding S 1 and S 4 , as those two factors are just in their own reachability matrix path. The five layers obtained were: L 1 = S 12 , S 16 ; L 2 = S 7 , S 13 , S 14 ; L 3 = S 2 , S 5 , S 11 ; L 4 = S 3 , S 8 , S 9 , S 10 ; L 5 = S 6 , S 15 , S 17 . Table 11 is a summary table of each stratum:

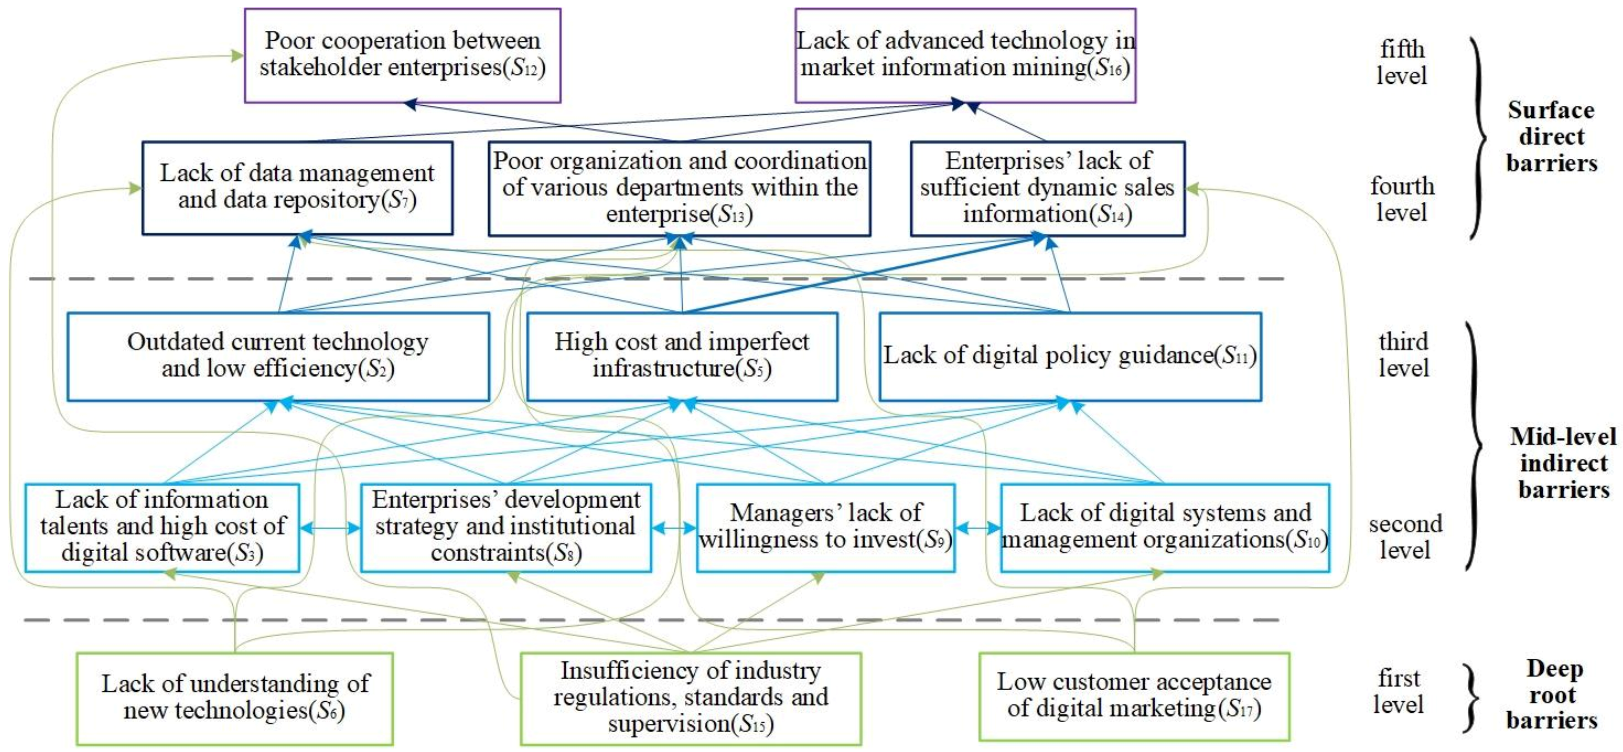
4.3.5. Constructing a Multilevel Hierarchical Structure Model

Figure 10 shows a five-level hierarchical structure model of the influencing factors for the digitalization of operations management in real estate enterprises. The impact of various barriers in the digitalization of real estate enterprise operations management as shown in Figure 10 is divided into deep-rooted impact, intermediate indirect impact and surface direct impact. The causal relationship between barriers is also shown in the hierarchical structure.
The direct influence of the surface layer is mainly composed of the elements of the fifth and fourth layers. Among them, the fifth layer comprises the two elements of “poor cooperation between stakeholder enterprises” ( S 12 ) and “lack of advanced technology in market information mining” ( S 16 ), which are called the external links of the real estate enterprise. The former ( S 12 ) indicates the ability of cooperation between the real estate enterprise itself and other related enterprises. The latter ( S 16 ) indicates whether real estate enterprises can use digital technology to timely tap and master external opportunities and customer needs in the real estate market.
The fourth layer consists of three elements: “lack of data management and data repository” ( S 7 ), “poor organization and coordination of various departments within the enterprise” ( S 13 ) and “enterprises’ lack of sufficient dynamic sales information” ( S 14 ), which are called the internal links of real estate enterprises and mainly show the construction of real estate enterprises’ own databases as well as the application of digital technology to achieve more effective coordination between departments and a more accurate grasp of sales information. From the perspective of the relationship between the two layers of direct influence on the surface, the three elements of the fourth layer have a significant impact on the market information-mining ability of the fifth layer. On the one hand, it reflects whether the real estate enterprises can use advanced digital technology to mine, store and develop market information. On the other hand, it shows whether the real estate enterprises can first grasp the sales information from the perspective of the supply side, carry out the smooth transmission and sharing of information among departments, and then expand to the information mining of the demand side on this basis. The coordination level of internal departments at the fourth layer has a great impact on the cooperation ability of external stakeholders of the real estate enterprises at the fifth layer, which is more realistic. From the perspective of the underlying impact path, the cooperation ability between different enterprise entities is also affected by the “insufficiency of industry regulations, standards and supervision ( S 15 )” in the first layer. Therefore, it can be seen that the standard and healthy development of the industry as a whole is the cornerstone to ensure good cooperation among all subjects in the industry.
The indirect influence of the middle layer is mainly composed of the elements of the third and second layers. Among them, the third layer consists of three elements: “outdated current technology and low efficiency” ( S 2 ), “high cost and imperfect infrastructure ( S 5 )” and “lack of digital policy guidance ( S 11 )”. Among them, “outdated current technology and low efficiency ( S 2 )” and “high cost and imperfect infrastructure ( S 5 )” are referred to as hardware and software facilities, whereas “Lack of digital policy guidance ( S 11 )” is referred to as a policy factor. From the perspective of the paths, the advantages and disadvantages of hardware and software facilities and policy factors all have an impact on the three factors at the fourth level. Better hardware and software facilities as well as digital policy guidance can make it easier for effective enterprises to establish databases and improve the technical level and means of departments to coordinate and mine market information, and vice versa.
The second layer consists of four elements: lack of information talent and high cost of digital software ( S 3 ), enterprises’ development strategy and institutional constraints ( S 8 ), managers’ lack of willingness to invest ( S 9 ) and lack of digital systems and management organizations ( S 10 ). In addition to influencing the third layer, the second layer generates a loop relationship among its four elements. It is easy to understand that the key to improving the third layer of hardware and software facilities and policy factors lies in information talent, strategic layout and investment willingness as well as digital system and management organization. Talent is the soft power of the digital transformation of real estate enterprises. Strategic layout and investment willingness affect the construction of hardware facilities and the introduction, development and training of talent. The digital system and management organization not only guarantees the construction of hardware and software facilities for real estate enterprises, but also lays the foundation for digital policy to effectively play a guiding role in all levels and departments of these enterprises.
The deep-root influence is the first layer, including three elements: “lack of understanding of new technologies” ( S 6 ), “insufficiency of industry regulations, standards and supervision” ( S 15 ) and “low customer acceptance of digital marketing” ( S 17 ). Among them, the “insufficiency of industry regulations, standards and supervision” ( S 15 ) has an impact on all elements of the second layer. It shows that if the regulations and standards of the government and industry organizations are not perfect and supervision is not in place, then real estate enterprises will show no willingness to carry out a digital strategic layout. In other words, without corresponding investment considerations, there is no motivation for the construction of digital software and hardware facilities. It can be seen that the top-level design of government industry organizations has a fundamental impact on the digital application of real estate enterprise operation management. “Lack of understanding of new technologies” ( S 6 ) and “low customer acceptance of digital marketing” ( S 17 ) mainly affect the fourth layer of direct impact on the surface. “Lack of understanding of new technologies” ( S 6 ) is reflected in the inability of enterprises to establish databases and the inability to use digital technology for department coordination and sales information mining. Customers’ low acceptance of digital marketing will dent the enthusiasm of enterprise to go digital from the perspective of demand side and reduce the effectiveness of digital technology application.

5. Conclusions

The results show that there are 17 barriers in the digitalization of operations management of real estate enterprises in China. Among the 17 barriers, the biggest ones are in the upstream level, such as difficulty in adopting new technologies, lack of information technology talent and the high cost of digital software as well as imperfect infrastructure and the high cost to upgrade it. According to analysis using the DEMATEL–ISM method, the difficulty enterprises face in using new technologies has a deep-rooted impact on real estate digitalization. The lack of information technology talent and the high cost of digital software in the upstream level, as well as barriers to a company’s development strategy and investment willingness to institute digitalization in the midstream level, not only affects the external and internal links, but also have influence among themselves. The lack of overall regulation and supervision can explain the reason for these barriers.
Based on the above results, corresponding suggestions are shown below:
First, real estate enterprises must promote the improvement of digital systems and management organizations of the real estate industry based on policy guidance regarding digitalization. The standardization and improvement of industry regulations provides guidance for the development of the real estate industry that directly affects the digital strategic layout of real estate enterprises, the willingness to invest in software and hardware facilities and the inflow of digital talent. In addition to strengthening communication and cooperation between supervision authorities, government departments and industry associations, real estate enterprises can also support and assist the government to formulate reasonable digital policies and industry standards for the real estate industry by participating in government digital infrastructure construction, government urban data fusion and sharing construction, etc.
Second, real estate enterprises must implement their laws, regulations and standards in management based on the guidance of those in the whole industry. Advanced data management systems should be built. Meanwhile, regulations that give clear divisions of responsibilities should be established so that technology talent and resources can find their best matches, and coordination between departments within the enterprise should be improved to secure the efficiency of digital operations management. In terms of management standards, real estate enterprises also must develop an evaluation method for the phased achievements of digital innovation because digital management is a relatively unfamiliar field for real estate enterprises. It is necessary to ensure that the development of real estate is within a reasonable and controllable range, and continuous development of science and technology should be evaluated and adjusted in the long-run strategy to improve digital services.
Third, real estate enterprises must transform their previous awareness and knowledge of digitalization into practical application and greatly increase digital technology application scenarios in upstream, midstream and downstream links to break isolation among these factors. Owing to the high cost, real estate enterprises can take a step-by-step process in digitalization, centralizing resources to support the implementation of digitalization strategic objectives. The operation coordination mode can be exploratory, coordinated, centralized and embedded. Enterprises can take an exploratory position when the overall strategy is not established at the beginning of the digital transformation. After that, with the deepening of the application of digitalization in enterprises, the demand for cross-departmental coordination will intensify, the transition to coordinated and centralized management will be beneficial and, finally, embedded operations management could be established.
Finally, digital human resource management of real estate enterprises should be strengthened. Breaking the bottleneck of talent shortage is the key for real estate enterprises to quickly master cutting-edge digital technology and apply it to operations management. First, more talent in digital management and development should be recruited and cultivated, and digital technology should be adopted by enterprises in a planned way. Second, digital training for existing management teams and the integration of digital technology into the real estate business can improve management efficiency within these enterprises. Third, the digital transformation of real estate enterprises can be accelerated by cooperation and sharing, such as establishing a digital resource-sharing mechanism, promoting resource sharing, forming an effective cooperation model and building agile development based on business needs.
As for the analysis of the dynamic relationship between obstacle degrees, this study only used classical DEMATEL, and different DEMATEL models, such as fuzzy DEMATEL and gray DEMATEL, can be explored in the future. This method was used to study the barriers to digital operation in China’s real estate industry, but it can be applied to the real estate industry of other countries or the field of business process management of real estate in the future.

Author Contributions

Conceptualization, Y.X. and Y.Z.; methodology, Y.X.; software, Q.J.; validation, W.Z., Q.J. and Y.X.; formal analysis, W.Z.; investigation, Y.Z.; resources, Y.Z.; data curation, Q.J.; writing—original draft preparation, Y.X., W.Z. and Q.J.; writing—review and editing, W.Z., Y.X. and Q.J.; visualization, Q.J.; supervision, W.Z. and Y.X.; project administration, Y.X.; funding acquisition, Y.X. and W.Z. All authors have read and agreed to the published version of the manuscript.

Funding

This research was funded by Soft Science Research Project of Science Technology Department of Zhejiang Province (2023C25010) and the First-class Discipline Planning Project of Zhejiang Province.

Institutional Review Board Statement

All respondents of the survey questionnaire as well as the key informant interviewees are not mentioned by name. Results are aggregated and cannot be tracked back to any individual person.

Informed Consent Statement

All people involved in the study participated voluntarily and agreed with the study results derived from their responses.

Data Availability Statement

Not applicable.

Acknowledgments

We owe our full-hearted thanks to Xinjian Hong, Yongquan Zhang and Jinchang Li from Zhejiang University of Finance and Economics, Aiting Xu and Yizhi Chen from Zhejaing Gongshang University and Shangming Li, Keming Sun and Sheng Zhong, executives of operations management of Guangzhou R&F Properties Co., Ltd., who have been supportive to identify the indicators of obstacles that affect the digitalization of real estate enterprise operations management. We would also like to extend our thanks to Hezhi Xu and Jiayu Hu from Zhejiang University of Finance & Economics who have been supportive to all data analysis. Our thanks also go out to all of the questionnaire respondents who set aside time to answer the research questions.

Conflicts of Interest

The authors declare no conflict of interest.

Appendix A

In the process of constructing the impact factors affecting the digital operation and management of real estate enterprises, we used the Delphi method to consult the prediction opinions of expert group members through back-to-back communication. After two rounds of consultation, the opinions of the expert group tended to be concentrated to finally determine the index system. To follow the principle of combining representativeness and authority, multidiscipline and industry understanding, eight experts, including professors of statistical management in universities and senior executives in the real estate industry, were selected for consultation. (See the notes at the end of the text for the specific composition of personnel).

Appendix A.1. Questionnaire Design for Expert Consultation

The first round of the expert consultation questionnaire contained three parts. The first part comprised three first-level indicators and 19 second-level indicators of factors affecting the digitalization of real estate enterprise operation and management. The second part prompted evaluation of these indicators by experts, including importance score, index familiarity and the index importance evaluation basis. The third part requested the opinions and suggestions of the experts on the design of indicators in the form of open questions. The importance of indicators is measured by the five-point Likert scoring method, with 1–5 indicating Not Important, Not Very Important, Moderately Important, Important and Very Important, respectively. The experts’ familiarity with the indicators was set as Familiar, More Familiar, General, Less Familiar and Unfamiliar with assigned values 1, 0.8, 0.6, 0.4 and 0.2, respectively. The experts’ index for judgment basis was set as Practical Experience, Theoretical Analysis, Reference and Intuitive Feeling with assigned values of 1, 0.8, 0.6 and 0.4 respectively.

Appendix A.2. Results of Expert Consultation

(1)
Reliability of the questionnaire. Cronbach’s coefficient was used to test the reliability of the expert consultation questionnaire by SPSS25. The reliability coefficient of the first round was 0.828, and the reliability coefficient of the second round was 0.943, indicating that the reliability of the two rounds of expert consultation questionnaire is good.
(2)
Expert positivity. The questionnaire recovery rate is usually used as a reference standard to indicate the degree of importance and cooperation given by experts in this survey. The effective response rate of the questionnaires in both rounds was 100%.
(3)
The degree of expert authority. Based on the two indicators of experts’ familiarity with the indicator (Q2) and experts’ judgment basis for the indicator (Q3), the average Q = (Q2 + Q3)/2 was adopted. This study scored 0.85, greater than 0.7, indicating that the experts were familiar with the indicators and the judgment was based on practical experience and theoretical analysis, which is credible.
(4)
The degree of index and optimization. In the first round of consultation, the average value of experts’ judgement was 4.250 with a coefficient of 20.9%. Referring to experts’ suggestions for open questions, modifications were conducted. First, optimizations were made. “Digital-related system construction” and “digital management organization” were merged into “digital system and management organization”; “managers’ willingness to invest” was moved from the upstream module to the midstream module; the downstream module “information mining ability of competitors” was deleted, and “the technical level of market information mining” was added. Then, in the second round of consultation, the modified content was fed back to each expert, and then the evaluation was conducted again. Thus, the index system of influencing factors for the digitalization of operation and management of real estate enterprises in this study was initially formed, including 3 first-level indicators and 18 s-level indicators.
In the FTA model analysis, the index composition of influencing factors was used in the obstacle index system.

Appendix B. Questionnaire on Digitalization of Operation and Management of Real Estate Enterprises

Dear friends: with the continuous development of technology, the real estate industry has brought a fortune to the global economy. However, at present, real estate enterprises are still using traditional management methods. We guess that through innovation of the digital value chain that meets the requirements of the industry, the operation and management of real estate enterprises will be promoted, the core value chain of my country’s real estate enterprises will be optimized, and the core competitiveness will be continuously improved to achieve efficient operation. Therefore, we are conducting a survey on the current situation of digital value chain innovation for real estate companies and the obstacles they face, and we would like to invite you to take a few minutes to help answer this questionnaire.
This questionnaire is anonymous, and all data will only be used for statistical analysis. Your opinions are very important to our research. We sincerely hope that you will take time out of your busy schedule to assist us in completing this questionnaire. There is no right or wrong question option, please fill in the answer according to the actual situation. Sincere thanks for your support and help!
I. 
Basic information
1.
Your gender:
  • Male
  • Female
2.
Your age:
  • 20–30 years old
  • 31–40 years old
  • 41–50 years old
  • over 51 years old
3.
Your education level:
  • High school and below
  • Specialty
  • Undergraduate
  • Postgraduate and above
4.
Your occupation:
  • Top management team
  • Investor
  • Designer
  • Financier
  • Marketing planner
  • Project staff
  • Developer
  • Cost buyer
  • Operator
  • Commercial operator
  • Property staff
  • Other personnel
5.
Your years of experience in real estate:
  • Under 5 years
  • B 5–10 years (excluding 10 years)
  • 10–20 years (excluding 20 years)
  • 20 years and above
6.
Your monthly income:
  • Below 8000 yuan
  • 8000–20,000 yuan
  • 20,001–50,000 yuan
  • 50,000 yuan and above
  • Keep secret
7.
The province you work in is _____
8.
Annual sales of your company:
  • 200 billion and above
  • 100–200 billion (excluding 200 billion)
  • 50–100 billion (excluding 100 billion)
  • 10 billion–50 billion (excluding 50 billion)
  • Less than 10 billion
9.
Your institution is affiliated with:
  • Group
  • Area
  • City
  • Project
10.
Is your company a listed company?
  • Yes
  • No
II. 
Current situation awareness
11.
How much do you know about digital real estate?
  • Do not know
  • Not sure
  • General understanding
  • Comprehension
  • Know very well
12.
Which of the following digital technologies do you know? (multiple choice)
  • Artificial Intelligence (AI)
  • Big Data
  • Virtual Reality Systems (VR)
  • Cloud Computing Technology
  • Software as a Service (SaaS)
  • Augmented Reality (AR)
  • Blockchain
  • Wearable Gadgets/Devices
  • UAV, Automatic Control System
  • Internet of Things
  • 3D Printing
  • 3D Scanning
  • Others
13.
Is your company currently using digital technology? (Answer: “No” skip to question 15)
  • Yes
  • No
  • Do not know
14.
Which digital technologies do your company use?
  • Artificial Intelligence (AI)
  • Big Data
  • Virtual Reality Systems (VR)
  • Cloud Computing Technology
  • Software as a Service (SaaS)
  • Augmented Reality (AR)
  • Blockchain
  • Wearable Gadgets/Devices
  • UAV, Automatic Control System
  • Internet of Things
  • 3D Printing
  • 3D Scanning
  • Others
15.
Is your company willing to use digital technology? (Answer: “No” skip to question 17)
  • Yes
  • No
16.
Which digital technologies would your company be willing to use? (Multiple choice)
  • Artificial Intelligence (AI)
  • Big Data
  • Virtual Reality Systems (VR)
  • Cloud Computing Technology
  • Software as a Service (SaaS)
  • Augmented Reality (AR)
  • Blockchain
  • Wearable Gadgets/Devices
  • UAV, Automatic Control System
  • Internet of Things
  • 3D Printing
  • 3D Scanning
  • Others
17.
What impact do you hope to bring to your company by adopting digital technology?
  • Improve productivity
  • More standardized operation
  • Broaden information dissemination channels
  • Diversification of sales channels
  • Reduce manufacturing cost
  • Strengthen risk control
  • Others
III. 
Barriers to digital technology
18.
[Matrix Scale Questions] Please rate the barriers your company encounters when using digital technology or the reasons for not using digital technology. Please choose according to the actual situation. (1–5 indicates the degree from low to high)
BarriersDegree
Difficulty in obtaining data on product design and customer needs12345
Outdated current technology and low efficiency12345
Lack of information talent and high cost of digital software12345
Enterprises’ lack of knowledge of new technologies12345
High cost and imperfect infrastructure12345
Lack of understanding of new technologies12345
Lack of data management and data repository12345
Enterprises’ development strategy and institutional constraints12345
Managers’ lack of willingness to invest12345
Lack of digital systems and management organizations12345
Lack of digital policy guidance12345
Poor cooperation between stakeholder enterprises12345
Poor organization and coordination of various departments within the enterprise12345
Enterprises’ lack of sufficient dynamic sales information12345
Insufficiency of industry regulations, standards and supervision12345
Lack of advanced technology in market information mining12345
Low customer acceptance of digital marketing12345

References

  1. Chen, H.; Zhao, S.D.; Zhang, P.; Zhou, Y.; Li, K.R. Dynamics and Driving Mechanism of Real Estate in China’s Small Cities: A Case Study of Gansu Province. Buildings 2022, 12, 1512. [Google Scholar] [CrossRef]
  2. Kong, Y.; Glascock, J.L.; Lu-Andrews, R. An Investigation into Real Estate Investment and Economic Growth in China: A Dynamic Panel Data Approach. Sustainability 2016, 8, 66. [Google Scholar] [CrossRef] [Green Version]
  3. Wang, L.Y.; Hu, H.Q.; Wang, X.Z.; Zhang, X.C.; Wu, Y.B. Synergistic evolution of resilience and efficiency in the real estate industry: Evidence from 35 large and medium-sized cities in China. Appl. Econ. Lett. 2022. [Google Scholar] [CrossRef]
  4. Yu, S.J.; Zhang, L.; Zeng, Y.N.; Zhang, H. Dual influences of regulatory polices on real estate enterprises’ investment -based on the perspective of supply-side reform in China. Financ. Res. Lett. 2017, 23, 50–57. [Google Scholar] [CrossRef]
  5. Glaeser, E.; Huang, W.; Ma, Y.R.; Shleifer, A. A Real Estate Boom with Chinese Characteristics. J. Econ. Perspect. 2017, 31, 93–116. [Google Scholar] [CrossRef] [Green Version]
  6. Chong, J.; Phillips, G.M. COVID-19 losses to the real estate market: An equity analysis. Financ. Res. Lett. 2022, 45, 102131. [Google Scholar] [CrossRef]
  7. The German Construction Industry Must Act Now to Gear Up for an Uncertain Future and Be in a Position to Shape it Actively. Available online: https://www.rolandberger.com/en/Insights/Publications/What-the-new-normal-could-look-like-in-construction.html (accessed on 19 December 2022).
  8. China Property Investment Falls 16.3%, Sales Plunge by 40%. Available online: https://www.businesstimes.com.sg/property/china-property-investment-falls-163-sales-plunge-40 (accessed on 19 December 2022).
  9. Zhang, H.; Li, L.J.; Chen, T.T.; Li, V. Where will China’s real estate market go under the economy’s new normal? Cities 2016, 55, 42–48. [Google Scholar] [CrossRef]
  10. Yevu, S.K.; Yu, A.T.W.; Darko, A. Digitalization of construction supply chain and procurement in the built environment: Emerging technologies and opportunities for sustainable processes. J. Clean. Prod. 2021, 322. [Google Scholar] [CrossRef]
  11. Yang, G.L.; Fukuyama, H.; Chen, K. Investigating the regional sustainable performance of the Chinese real estate industry: A slack-based DEA approach. Omega-Int. J. Manag. Sci. 2019, 84, 141–159. [Google Scholar] [CrossRef]
  12. Nanda, A.; Xu, Y.S.; Zhang, F.C. How would the COVID-19 pandemic reshape retail real estate and high streets through acceleration of E-commerce and digitalization? J. Urban Manag. 2021, 10, 110–124. [Google Scholar] [CrossRef]
  13. Jiang, H.; Murmann, J.P. The Rise of China’s Digital Economy: An Overview. Manag. Organ. Rev. 2022, 18, 790–802. [Google Scholar] [CrossRef]
  14. Wu, H.X.; Yu, C.H. The impact of the digital economy on China’s economic growth and productivity performance. China Econ. J. 2022, 15, 153–170. [Google Scholar] [CrossRef]
  15. Song, M.L.; Zheng, C.B.; Wang, J.Q. The role of digital economy in China’s sustainable development in a post-pandemic environment. J. Enterp. Inf. Manag. 2022, 35, 58–77. [Google Scholar] [CrossRef]
  16. Liu, Y.; Zhao, X.; Mao, F. The synergy degree measurement and transformation path of China’s traditional manufacturing industry enabled by digital economy. Math. Biosci. Eng. 2022, 19, 5738–5753. [Google Scholar] [CrossRef] [PubMed]
  17. Sun, T.Q.; Medaglia, R. Mapping the challenges of Artificial Intelligence in the public sector: Evidence from public healthcare. Gov. Inform. Q. 2019, 36, 368–383. [Google Scholar] [CrossRef]
  18. Ning, H.S.; Yin, R.; Ullah, A.; Shi, F.F. A Survey on Hybrid Human-Artificial Intelligence for Autonomous Driving. IEEE Trans. Intell. Transp. 2022, 23, 6011–6026. [Google Scholar] [CrossRef]
  19. Gao, X.P.; Bian, X.L. Autonomous driving of vehicles based on artificial intelligence. J. Intell. Fuzzy Syst. 2021, 41, 4955–4964. [Google Scholar] [CrossRef]
  20. Institute, T.R. Top 10 Digital Technology Application Trends 2022. Available online: https://tisi.org/23332 (accessed on 21 January 2022).
  21. Schwarck, E. Intelligence and Informatization: The Rise of the Ministry of Public Security in Intelligence Work in China. China J. 2018, 80, 1–23. [Google Scholar] [CrossRef]
  22. Cao, Y.Y.; Gao, L.; Fan, L.H.; Jiao, M.L.; Li, Y.; Ma, Y.S. The Influence of Emotional Intelligence on Job Burnout of Healthcare Workers and Mediating Role of Workplace Violence: A Cross Sectional Study. Front. Public Health 2022, 10, 892421. [Google Scholar] [CrossRef]
  23. Kong, X.Y.; Ai, B.L.; Kong, Y.M.; Su, L.J.; Ning, Y.Z.; Howard, N.; Gong, S.; Li, C.; Wang, J.; Lee, W.T.; et al. Artificial intelligence: A key to relieve China’s insufficient and unequally-distributed medical resources. Am. J. Transl. Res. 2019, 11, 2632–2640. [Google Scholar]
  24. Ma, L.J.; Lovreglio, R.; Yi, W.; Yiu, T.W.; Shan, M. Barriers and strategies for building information modelling implementation: A comparative study between New Zealand and China. Int. J. Constr. Manag. 2022. [Google Scholar] [CrossRef]
  25. Ji, W.Y.; Chan, E.H.W. Between users, functions, and evaluations: Exploring the social acceptance of smart energy homes in China. Energy Res. Soc. Sci. 2020, 69, 101637. [Google Scholar] [CrossRef]
  26. Shen, Q.; Hua, Y.K.; Huang, Y.X.; Ebstein, R.; Yu, X.F.; Wu, Z.H. Knowledge management and modern digital transformation of the property management industry in China. J. Knowl. Manag. 2022, 26, 2133–2144. [Google Scholar] [CrossRef]
  27. Qian, D. Visualization Analysis and Application Research of the Architectural Animation Based on Digital Media Technology. Agro Food Ind. Hi-Tech 2017, 28, 1597–1602. [Google Scholar]
  28. Xu, M.D.; Zheng, H.F.; Wu, J. Are Online-Only Real Estate Marketplaces Viable? Evidence from China. J. Real Estate Financ. Econ. 2022, 66. [Google Scholar] [CrossRef]
  29. Hsu, P.-Y.; Aurisicchio, M.; Angeloudis, P.; Whyte, J. Understanding and visualizing schedule deviations in construction projects using fault tree analysis. Eng. Constr. Archit. Manag. 2020, 27, 2501–2522. [Google Scholar] [CrossRef]
  30. Xin, S.; Zhang, L.; Jin, X.; Zhang, Q. Reconstruction of the fault tree based on accident evolution. Process Saf. Environ. Prot. 2019, 121, 307–311. [Google Scholar] [CrossRef]
  31. Sadeghi, J.; Esmaeili, M.H.; Akbari, M. Reliability of FTA general vibration assessment model in prediction of subway induced ground borne vibrations. Soil Dyn. Earthq. Eng. 2019, 117, 300–311. [Google Scholar] [CrossRef]
  32. Hinrichs, T.; Buth, B. Potential use of safety analysis for risk assessments in smart city sensor network applications. In Proceedings of the International Conference on Computer Safety, Reliability, and Security, Turku, Finland, 2019, September 10; pp. 117–126.
  33. Gabus, A.; Fontela, E. World problems, an invitation to further thought within the framework of DEMATEL. Battelle Geneva Res. Cent. Geneva Switz. 1972, 1, 7–14. [Google Scholar]
  34. Sharma, M.; Joshi, S.; Kannan, D.; Govindan, K.; Singh, R.; Purohit, H. Internet of Things (IoT) adoption barriers of smart cities’ waste management: An Indian context. J. Clean. Prod. 2020, 270, 122047. [Google Scholar] [CrossRef]
  35. Kumar, A.; Dixit, G. An analysis of barriers affecting the implementation of e-waste management practices in India: A novel ISM-DEMATEL approach. Sustain. Prod. Consum. 2018, 14, 36–52. [Google Scholar] [CrossRef]
  36. Stevenson, W.J. Operations Management, 14th ed.; International Student Edition; McGraw Hill: New York, NY, USA, 2021. [Google Scholar]
  37. Zhang, F.Q.; Wu, X.L.; Tang, C.S.; Feng, T.J.; Dai, Y. Evolution of Operations Management Research: From Managing Flows to Building Capabilities. Prod. Oper. Manag. 2020, 29, 2219–2229. [Google Scholar] [CrossRef]
  38. Li, B.; Li, R.Y.M.; Wareewanich, T. Factors Influencing Large Real Estate Companies’ Competitiveness: A Sustainable Development Perspective. Land 2021, 10, 1239. [Google Scholar] [CrossRef]
  39. Schrippe, P.; Medeiros, F.S.B.; Weise, A.D. Diagnosis based on strategic management practices: Real estate agencies of Santa Maria-Brazil. Indep. J. Manag. Prod. 2015, 6, 548–562. [Google Scholar] [CrossRef] [Green Version]
  40. Li, W.W.; Weng, L.S.; Zhao, K.X.; Zhao, S.D.; Zhang, P. Research on the Evaluation of Real Estate Inventory Management in China. Land 2021, 10, 1283. [Google Scholar] [CrossRef]
  41. Wu, M.; Yan, B.X.; Huang, Y.; Sarker, M.N.I. Big Data-Driven Urban Management: Potential for Urban Sustainability. Land 2022, 11, 680. [Google Scholar] [CrossRef]
  42. Del Giudice, V.; De Paola, P. Real Estate Economics, Management and Investments: New Perspectives and Frontiers. Buildings 2018, 8, 40. [Google Scholar] [CrossRef]
  43. Vial, G. Understanding digital transformation: A review and a research agenda. J. Strateg. Inf. Syst. 2019, 28, 118–144. [Google Scholar] [CrossRef]
  44. Schwab, K.; First, U.S. The Fourth Industrial Revolution; First U.S. Edition; Crown Business: New York, NY, USA, 2016; Volume VIII, 184p. [Google Scholar]
  45. Benn, M.; Stoy, C. BIM for CREM: Exploring the Benefit of Building Information Modelling for Facility Management in Corporate Real Estate Management. Buildings 2022, 12, 400. [Google Scholar] [CrossRef]
  46. Ma, H.; Meng, Z.; Yan, D.; Wang, H. Digital Economy: A new driving force for China’s innovation and growth. North China Power 2017, 6, 93. [Google Scholar]
  47. Ullah, F.; Sepasgozar, S.M.E.; Thaheem, M.J.; Al-Turjman, F. Barriers to the digitalisation and innovation of Australian Smart Real Estate: A managerial perspective on the technology non-adoption. Environ. Technol. Innov. 2021, 22, 101527. [Google Scholar] [CrossRef]
  48. Bouncken, R.B.; Kraus, S.; Roig-Tierno, N. Knowledge- and innovation-based business models for future growth: Digitalized business models and portfolio considerations. Rev. Manag. Sci. 2021, 15, 1–14. [Google Scholar] [CrossRef]
  49. Truant, E.; Broccardo, L.; Dana, L.P. Digitalisation boosts company performance: An overview of Italian listed companies. Technol. Forecast. Soc. Change 2021, 173, 121173. [Google Scholar] [CrossRef]
  50. Horvath, D.; Szabo, R.Z. Driving forces and barriers of Industry 4.0: Do multinational and small and medium-sized companies have equal opportunities? Technol. Forecast. Soc. Change 2019, 146, 119–132. [Google Scholar] [CrossRef]
  51. Yunus, N.M.; Wahob, N.A. The Technology and Knowledge Spillover Effects of FDI on Labour Productivity. GATR J. Bus. Econ. Rev. 2021, 5, 51–58. [Google Scholar] [CrossRef]
  52. Kennedy, J.; Hyland, P. A comparison of manufacturing technology adoption in SMEs and large companies. In Proceedings of the 16th Annual Conference of Small Enterprise Association of Australia and New Zealand, Ballarat, Austrilia, 28 September–1 October 2003; pp. 1–10. [Google Scholar]
  53. Wei, C.K.; Fu, M.C.; Wang, L.; Yang, H.B.; Tang, F.; Xiong, Y.Q. The Research Development of Hedonic Price Model-Based Real Estate Appraisal in the Era of Big Data. Land 2022, 11, 334. [Google Scholar] [CrossRef]
  54. Ghouri, A.M.; Mani, V. Role of real-time information-sharing through SaaS: An industry 4.0 perspective. Int. J. Inf. Manag. 2019, 49, 301–315. [Google Scholar] [CrossRef]
  55. Lazer, D.; Kennedy, R.; King, G.; Vespignani, A. The parable of Google Flu: Traps in big data analysis. Science 2014, 343, 1203–1205. [Google Scholar] [CrossRef]
  56. Henke, N.; Bughin, J.; Chui, M.; Manyika, J.; Saleh, T.; Wiseman, B.; Sethupathy, G. The age of analytics: Competing in a data-driven world. McKinsey Glob. Inst. 2016, 4, 136. [Google Scholar]
  57. Dooley, K. Routines, Rigidity and Real Estate: Organisational Innovations in the Workplace. Sustainability 2017, 9, 998. [Google Scholar] [CrossRef] [Green Version]
  58. Aina, Y.A. Achieving smart sustainable cities with GeoICT support: The Saudi evolving smart cities. Cities 2017, 71, 49–58. [Google Scholar] [CrossRef]
  59. Anthony, B.; Majid, M.A.; Romli, A. Green information technology adoption towards a sustainability policy agenda for government-based institutions An administrative perspective. J. Sci. Technol. Policy Manag. 2019, 10, 274–300. [Google Scholar] [CrossRef]
  60. Saull, A.; Baum, A.; Braesemann, F. Can digital technologies speed up real estate transactions? J. Prop. Invest. Financ. 2020. ahead-of-print. [Google Scholar] [CrossRef]
  61. Vesely, W.E.; Goldberg, F.F.; Roberts, N.H.; Haasl, D.F. Fault Tree Handbook; Nuclear Regulatory Commission: Washington, DC, USA, 1981. [Google Scholar]
  62. Stamatelatos, M.; Vesely, W.; Dugan, J.; Fragola, J.; Minarick, J.; Railsback, J. Fault Tree Handbook with Aerospace Applications; 2002; Available online: https://pdf4pro.com/amp/view/fault-tree-handbook-with-aerospace-applications-452300.html.
  63. Kabir, S.; Azad, T.; Walker, M.; Gheraibia, Y. Reliability analysis of automated pond oxygen management system. In Proceedings of the 2015 18th International Conference on Computer and Information Technology (ICCIT), Dhaka, Bangladesh, 21–23 December 2015; pp. 144–149. [Google Scholar]
  64. Ruijters, E.; Stoelinga, M. Fault tree analysis: A survey of the state-of-the-art in modeling, analysis and tools. Comput. Sci. Rev. 2015, 15, 29–62. [Google Scholar] [CrossRef] [Green Version]
  65. Yang, Y.; Jung, I. Boolean algebra application in simplifying fault tree analysis. Int. J. Saf. 2017, 1, 12–19. [Google Scholar] [CrossRef]
  66. Whitesitt, J.E. Boolean Algebra and Its Applications; Courier Corporation: North Chelmsford, MA, USA, 2012. [Google Scholar]
  67. Project Management Institute. A Guide to the Project Management Body of Knowledge (Pmbok Guide), 5th ed.; A guide to the project management body of knowledge; PMBOK® Guide: Pennsylvania, USA, 2013. [Google Scholar]
  68. Ware, N.R.; Singh, S.P.; Banwet, D. Modeling flexible supplier selection framework. Glob. J. Flex. Syst. Manag. 2014, 15, 261–274. [Google Scholar] [CrossRef]
  69. Lamba, K.; Singh, S.P. Modeling big data enablers for operations and supply chain management. Int. J. Logist. Manag. 2018. Available online: https://www.researchgate.net/publication/319554477_Modeling_Big_Data_Enablers_for_Operations_and_Supply_Chain_Management (accessed on 19 December 2022).
  70. Mathiyazhagan, K.; Govindan, K.; NoorulHaq, A.; Geng, Y. An ISM approach for the barrier analysis in implementing green supply chain management. J. Clean. Prod. 2013, 47, 283–297. [Google Scholar] [CrossRef]
  71. Khatwani, G.; Singh, S.P.; Trivedi, A.; Chauhan, A. Fuzzy-TISM: A fuzzy extension of TISM for group decision making. Glob. J. Flex. Syst. Manag. 2015, 16, 97–112. [Google Scholar] [CrossRef]
  72. Rajput, S.; Singh, S.P. Identifying Industry 4.0 IoT enablers by integrated PCA-ISM-DEMATEL approach. Manag. Decis. 2018. Available online: https://www.researchgate.net/publication/326725448_Identifying_Industry_40_IoT_enablers_by_integrated_PCA-ISM-DEMATEL_approach (accessed on 19 December 2022).
Figure 1. Search results.
Buildings 13 00100 g001
Figure 2. The digital word cloud of operations management. Note: The figure is drawn based on the results of web crawlers with Python 3.10.0.
Buildings 13 00100 g002
Figure 3. The Fault Tree Construction. Note: The figure is drawn based on Table 2.
Buildings 13 00100 g003
Figure 4. The DEMATEL–ISM method operation flow chart. Note: The figure is drawn with Microsoft Visio 2013.
Buildings 13 00100 g004
Figure 5. The demographics of the respondents. (a) The posts of respondents (by percent). (b) The regional distribution of respondents (by percent). Note: The figure is mapped based on the questionnaire data.
Buildings 13 00100 g005
Figure 6. Comparison of digital technology awareness. Note: The figure is mapped based on the questionnaire data.
Buildings 13 00100 g006
Figure 7. Adoption intention of digital technologies. Note: The figure is mapped based on the questionnaire data.
Buildings 13 00100 g007
Figure 8. The risk matrix diagram. Note: The figure is mapped based on Table 6.
Buildings 13 00100 g008
Figure 9. The fault tree diagram. Note: The figure was drawn with failure probability.
Buildings 13 00100 g009
Figure 10. The five-level hierarchical structure model of the influencing factors for the digitalization of operations management in real estate enterprises. Note: The figure was drawn with Microsoft Visio 2013.
Buildings 13 00100 g010
Table 1. Influencing factor scale.
ThemeFirst-Level IndicatorSecondary Indicators
Influencing factors of digital operations management Upstream designThe current technical level of the enterprise
Digital hardware and software costs
Ease of learning new technologies
The quality of information talent
Infrastructure cost and perfection
Ease of obtaining design and requirements data
Construction of data management library
Midstream productionDigital policy guidance
Cooperation with stakeholders
Organization and coordination level of various departments within the enterprise
Management’s willingness to invest
Company development strategy and system
Digital related systems and management organizations
Downstream salesThe perfection of industry regulations, standards and supervision
The mastery of dynamic sales information
Customer acceptance of digital marketing
Market information mining technology level
Note: The table is compiled according to the results of expert evaluation.
Table 2. Barriers index system table.
V1V2V3Basic Events
No digital operations managementUpstream designTechnology
(Te)
B2 The company’s outdated current technology and low efficiency
B6 Lack of understanding of new technologies
B4 Difficulty for companies to use new technologies
Software and hardware equipment
(Eq)
B3 Lack of information talent and high cost of digital software
B5 High cost and imperfect infrastructure
Data
(Da)
B1 Difficulty in obtaining data on product design and customer needs
B7 Lack of data management, building of repositories
Midstream productionCoordinating organization
(Or)
M4 Lack of digital policy guidance
M5 Poor cooperation between stakeholder enterprises
M6 Low level of organization and coordination of various departments within the enterprise
Will
(Wi)
M2 Lack of management’s willingness to invest
Environment
(En)
M1 Company development strategy and institutional constraints
M3 Lack of digital systems and management organizations
Downstream salesIndustry standards and regulations
(St)
E2 Insufficiency of industry regulations, standards and supervision
Market
(Ma)
E1 Lack of dynamic sales information
E4 Low customer acceptance of digital marketing
Technical method
(Tm)
E3 Lack of technology to mine market information
Note: The table is compiled according to the research results.
Table 3. Contingency table of respondents’ positions and years of real estate experience.
Working YearsLess than 5 Years5–10 Years10–20 YearsMore than 20 YearsTotal
Post
Top management team 28313
Invest1042 16
Design451 10
Marketing planning74 11
Finance232 7
Project1281122
Cost procurement674118
Operation91411 34
Commercial operation82 10
Other211 4
Total6050305145
Table 4. Disability score counting table.
BarriersNoneVery LowLowModerateHighVery HighTotal
B1 Difficulty in obtaining data on product design and customer needs14173638319145
B2 The company’s outdated current technology and low efficiency141826403314145
B3 Lack of information talent and high cost of digital software11719404325145
B4 Difficulty for companies to use new technologies14619483721145
B5 High cost and imperfect infrastructure111121384321145
B6 Lack of understanding of new technologies111526423615145
B7 Lack of data management, building of repositories121223394019145
M1 Company development strategy and institutional constraints141324403420145
M2 Lack of management’s willingness to invest161323473214145
M3 Lack of digital systems and management organizations141127433119145
M4 Lack of digital policy guidance131126413915145
M5 Poor cooperation between stakeholder enterprises181125443314145
M6 Low level of organization and coordination of various departments within the enterprise111232433116145
E1 Lack of dynamic sales information131632413013145
E2 Insufficiency of industry regulations, standards and supervision131729413312145
E3 Lack of technology to mine market information101633413510145
E4 Low customer acceptance of digital marketing151832373013145
Note: The table was compiled according to the questionnaire data.
Table 5. Probability and impact score.
BarriersProbability Mean (PM)Normalized PMImpact Mean (IM)Normalized IM
B1 Difficulty in obtaining data on product design and customer needs20.32024.360
B2 The company’s outdated current technology and low efficiency23.100.2826.000.24
B3 Lack of information talent and high cost of digital software30.23131.121
B4 Difficulty for companies to use new technologies27.870.7729.840.81
B5 High cost and imperfect infrastructure28.260.8029.840.81
B6 Lack of understanding of new technologies24.420.4127.280.43
B7 Lack of data management, building of repositories26.740.6528.760.65
M1 Company development strategy and institutional constraints26.100.5827.920.53
M2 Lack of management’s willingness to invest22.940.2626.120.26
M3 Lack of digital systems and management organizations25.160.4927.480.46
M4 Lack of digital policy guidance24.840.4627.760.50
M5 Poor cooperation between stakeholder enterprises23.100.2826.200.27
M6 Low level of organization and coordination of various departments within the enterprise23.940.3726.960.38
E1 Lack of dynamic sales information22.000.1725.360.15
E2 Insufficiency of industry regulations, standards and supervision22.130.1825.600.18
E3 Lack of technology to mine market information21.770.1525.760.21
E4 Low customer acceptance of digital marketing21.580.1324.720.05
Note: The probability and impact scores were calculated according to the questionnaire data.
Table 6. Risk score sheet.
BarriersProbabilityImpactRS
B1 Difficulty in obtaining data on product design and customer needs000
B2 The company’s outdated current technology and low efficiency0.280.240.07
B3 Lack of information talent and high cost of digital software111
B4 Difficulty for companies to use new technologies0.770.810.62
B5 High cost and imperfect infrastructure0.800.810.65
B6 Lack of understanding of new technologies0.410.430.18
B7 Lack of data management, building of repositories0.650.650.42
M1 Company development strategy and institutional constraints0.580.530.31
M2 Lack of management’s willingness to invest0.260.260.07
M3 Lack of digital systems and management organizations0.490.460.23
M4 Lack of digital policy guidance0.460.500.23
M5 Poor cooperation between stakeholder enterprises0.280.270.08
M6 Low level of organization and coordination of various departments within the enterprise0.370.380.14
E1 Lack of dynamic sales information0.170.150.03
E2 Insufficiency of industry regulations, standards and supervision0.180.180.03
E3 Lack of technology to mine market information0.150.210.03
E4 Low customer acceptance of digital marketing0.130.050.01
Note: The risk score is calculated according to Table 5.
Table 7. Direct-influence matrix A .
S 1   S 2   S 3   S 4   S 5   S 6   S 7   S 8   S 9   S 10   S 11   S 12   S 13   S 14   S 15   S 16   S 17  
S 1   * 04234121221244141
S 2 40342342332344232
S 3 44043243444344141
S 4 32301131233133231
S 5 33330342322144243
S 6 23214043422121321
S 7 23332203233244343
S 8 33313230444334343
S 9 24314344044333343
S 10 33432242304432333
S 11 32332142240242223
S 12 12322132232022331
S 13 23432143333302231
S 14 22322342222320244
S 15 33314334344432043
S 16 12222342212313203
S 17 11213134333324340
* S i 1 , 2 , 17 represent B1–B7, M1–M6 and E1–E4 in Table 2, in that order. The direct influence matrix’s values of 0, 1, 2, 3 and 4 were used to quantify the strength of direct relationships between the factors, with 0 denoting no relationship, 1 denoting a weak relationship, 2 denoting a general relationship, 3 denoting a strong relationship and 4 denoting a very strong relationship. Note: The direct influence matrix A was drawn based on the expert scoring results.
Table 8. Comprehensive influence matrix T .
S 1   S 2   S 3   S 4   S 5   S 6   S 7   S 8   S 9   S 10   S 11   S 12   S 13   S 14   S 15   S 16   S 17  
S 1 0.17 0.27 0.24 0.23 0.25 0.17 0.29 0.19 0.23 0.24 0.22 0.22 0.28 0.29 0.18 0.31 0.18
S 2 0.29 0.25 0.31 0.28 0.26 0.24 0.39 0.26 0.29 0.31 0.29 0.28 0.34 0.34 0.24 0.36 0.24
S 3 0.31 0.34 0.29 0.31 0.30 0.24 0.42 0.30 0.34 0.36 0.35 0.31 0.37 0.37 0.25 0.40 0.25
S 4 0.22 0.22 0.25 0.16 0.19 0.16 0.29 0.18 0.22 0.25 0.24 0.19 0.25 0.25 0.19 0.28 0.17
S 5 0.26 0.29 0.30 0.26 0.22 0.23 0.38 0.25 0.29 0.29 0.28 0.24 0.33 0.33 0.24 0.36 0.25
S 6 0.21 0.26 0.25 0.19 0.26 0.15 0.33 0.24 0.27 0.25 0.24 0.21 0.26 0.24 0.22 0.28 0.19
S 7 0.25 0.29 0.30 0.26 0.26 0.21 0.31 0.27 0.27 0.30 0.30 0.26 0.33 0.33 0.25 0.36 0.25
S 8 0.28 0.31 0.33 0.24 0.30 0.23 0.39 0.24 0.33 0.34 0.34 0.30 0.33 0.35 0.27 0.39 0.27
S 9 0.28 0.34 0.34 0.25 0.32 0.26 0.42 0.32 0.27 0.36 0.35 0.31 0.35 0.35 0.28 0.40 0.28
S 10 0.27 0.30 0.33 0.27 0.27 0.22 0.39 0.26 0.30 0.26 0.32 0.30 0.32 0.31 0.26 0.36 0.26
S 11 0.24 0.25 0.28 0.24 0.24 0.18 0.35 0.23 0.25 0.30 0.22 0.24 0.30 0.27 0.22 0.30 0.23
S 12 0.18 0.22 0.24 0.19 0.20 0.15 0.29 0.20 0.21 0.25 0.22 0.17 0.23 0.23 0.21 0.28 0.17
S 13 0.23 0.27 0.30 0.25 0.24 0.18 0.35 0.25 0.27 0.29 0.28 0.26 0.24 0.28 0.22 0.33 0.20
S 14 0.22 0.25 0.27 0.22 0.23 0.21 0.34 0.23 0.24 0.26 0.25 0.25 0.26 0.23 0.22 0.33 0.25
S 15 0.29 0.32 0.33 0.25 0.32 0.25 0.39 0.31 0.31 0.35 0.34 0.32 0.34 0.32 0.22 0.40 0.28
S 16 0.18 0.22 0.23 0.19 0.21 0.19 0.30 0.20 0.22 0.21 0.22 0.22 0.22 0.25 0.19 0.23 0.21
S 17 0.21 0.23 0.26 0.20 0.25 0.18 0.33 0.27 0.27 0.28 0.27 0.26 0.27 0.31 0.24 0.34 0.19
Note: The comprehensive influence matrix T was calculated based on Table 7 with the help of MATLAB 2021a.
Table 9. DEMATEL model comprehensive analysis table.
BarriersD
Influence
C
Influenced
F
Centrality
R
Causality
S 1 : Difficulty in obtaining data on product design
and customer needs
3.96 4.09 8.06 −0.13
S 2 : Outdated current technology and low efficiency4.96 4.62 9.58 0.34
S 3 : Lack of information talent and high cost of digital
software
5.48 4.85 10.33 0.63
S 4 : Enterprises’ lack of knowledge of new technologies3.71 4.00 7.71 −0.29
S 5 : High cost and imperfect infrastructure4.80 4.33 9.13 0.47
S 6 : Lack of understanding of new technologies4.03 3.44 7.48 0.59
S 7 : Lack of data management and data repository4.81 5.94 10.75 −1.14
S 8 : Enterprises’ development strategy and institutional
constraints
5.25 4.20 9.45 1.05
S 9 : Managers’ lack of willingness to invest5.47 4.56 10.03 0.91
S 10 : Lack of digital systems and management
organizations
5.01 4.89 9.90 0.13
S 11 : Lack of digital policy guidance4.33 4.72 9.05 −0.39
S 12 : Poor cooperation between stakeholder enterprises3.66 4.36 8.02 −0.70
S 13 : Poor organization and coordination of various
departments within the enterprise
4.46 5.02 9.48 −0.56
S 14 : Enterprises’ lack of sufficient dynamic sales
information
4.27 5.05 9.33 −0.78
S 15 : Insufficiency of industry regulations, standards
and supervision
5.34 3.90 9.24 1.44
S 16 : Lack of advanced technology in market
information mining
3.69 5.72 9.41 −2.04
S 17 : Low customer acceptance of digital marketing4.35 3.89 8.24 0.46
Note: This table was made based on Table 8 with the help of MATLAB 2021a.
Table 10. Reachability matrix M .
S 1   S 2   S 3   S 4   S 5   S 6   S 7   S 8   S 9   S 10   S 11   S 12   S 13   S 14   S 15   S 16   S 17  
S 1 10000000000000000
S 2 01000010000011010
S 3 01101011111011010
S 4 00010000000000000
S 5 00001010000011010
S 6 00000110000011010
S 7 00000010000011010
S 8 01101011111011010
S 9 01101011111011010
S 10 01101011111011010
S 11 00000010001011010
S 12 00000000000100000
S 13 00000010000011010
S 14 00000010000011010
S 15 01101011111111110
S 16 00000000000000010
S 17 00000010000011011
Note: The reachability matrix M was calculated based on the comprehensive influence matrix T with the help of MATLAB 2021a.
Table 11. Reachable set and antecedent set of barriers.
S i Reachable   Set   of   S i Antecedent   Set   of   S i Common   Set   of   S i Starting
Set
Termination Set
22,7,13,14,162,3,8,9,10,152
32,3,5,7,8,9,10,11,13,14,163,8,9,10,153,8,9,10
55,7,13,14,163,5,8,9,10,155
66,7,13,14,16666
77,13,14,162,3,5,6,7,8,9,10,11,13,14,15,177,13,14
82,3,5,7,8,9,10,11,13,14,163,8,9,10,153,8,9,10
92,3,5,7,8,9,10,11,13,14,163,8,9,10,153,8,9,10
102,3,5,7,8,9,10,11,13,14,163,8,9,10,153,8,9,10
117,11,13,14,163,8,9,10,11,1511
121212,1512 12
137,13,14,162,3,5,6,7,8,9,10,11,13,14,15,177,13,14
147,13,14,162,3,5,6,7,8,9,10,11,13,14,15,177,13,14
152,3,5,7,8,9,10,11,12,13,14,15,16151515
16162,3,5,6,7,8,9,10,11,13,14,15,16,1716 16
177,13,14,16,17171717
Note: The reachable set and antecedent set of barriers was drawn based on Table 10.
Disclaimer/Publisher’s Note: The statements, opinions and data contained in all publications are solely those of the individual author(s) and contributor(s) and not of MDPI and/or the editor(s). MDPI and/or the editor(s) disclaim responsibility for any injury to people or property resulting from any ideas, methods, instructions or products referred to in the content.

