
Thermal Comfort in the Overhead Public Space in Hot and Humid Climates: A Study in Shenzhen

1
Shenzhen Key Laboratory of Built Environment Optimization, Shenzhen University, Shenzhen 518060, China
2
School of Architecture and Urban Planning, Shenzhen University, Nanhai Ave 3688, Shenzhen 518060, China
3
School of Urban Design, Wuhan University, Wuhan 430072, China
*
Author to whom correspondence should be addressed.
Buildings 2022, 12(9), 1454; https://doi.org/10.3390/buildings12091454
Submission received: 17 August 2022
/
Revised: 5 September 2022
/
Accepted: 9 September 2022
/
Published: 15 September 2022
(This article belongs to the Topic Built Environment and Human Comfort)
Abstract
:In recent years, semi-outdoor space has become an important research subject in the field of thermal comfort. Overhead space located on the ground floor is a common type of semi-outdoor space in China’s Lingnan region with a hot and humid climate. Its thermal comfort has been scarcely studied. This study aims to reveal the importance and influencing factors of overhead public spaces in hot and humid areas, and to explore the corresponding adaptive behaviors of people. In this research, several overhead public spaces in Shenzhen University were selected to conduct field measurements and questionnaire surveys (n = 509) in hot and cold seasons. The results indicated that the acceptable physiologically equivalent temperature (PET) range for 90% of the population was 26.2–30.4 °C in hot season, 9.9–19.2 °C in cold season, and 17.6–25.3 °C for the whole year. The respondents preferred “neutral” in cold season and “slightly cool” in hot season. Respondents in hot season were more eager to adjust their thermal comfort, while those in cold season were more comfortable exposing themselves to the sun. Concurrently, the neutral temperature and neutral temperature range for different seasons was obtained and compared with the results of other studies. The results provide references for thermal comfort adjustment in hot and humid areas as well as optimization suggestions for the planning and design of overhead spaces.
1. Introduction
Moderate outdoor activities are beneficial both physiologically and psychologically. They have been shown to enhance subjective well-being and pathogen resistance [1], reduce myopia in adolescents [2], delay cognitive decline in the elderly [3], decrease individual susceptibility to symptoms of mental illness, and improve emotional or cognitive states [4], etc. Urban open spaces have substantially improved the quality of life for citizens from the aspects of physical, environmental, social, and economic benefits [5]. In outdoor and semi-outdoor spaces, human thermal satisfaction is significantly affected by the local microclimate [6], and the level of thermal comfort can greatly influence how often people choose to use these spaces [7]. Many cities are endeavoring to control the local climate and microclimate in urban environments to reduce thermal stress and improve living conditions [8]. Therefore, the research on outdoor and semi-outdoor thermal comfort is of important significance to promote the overall health status of the users and create a better human habitat.
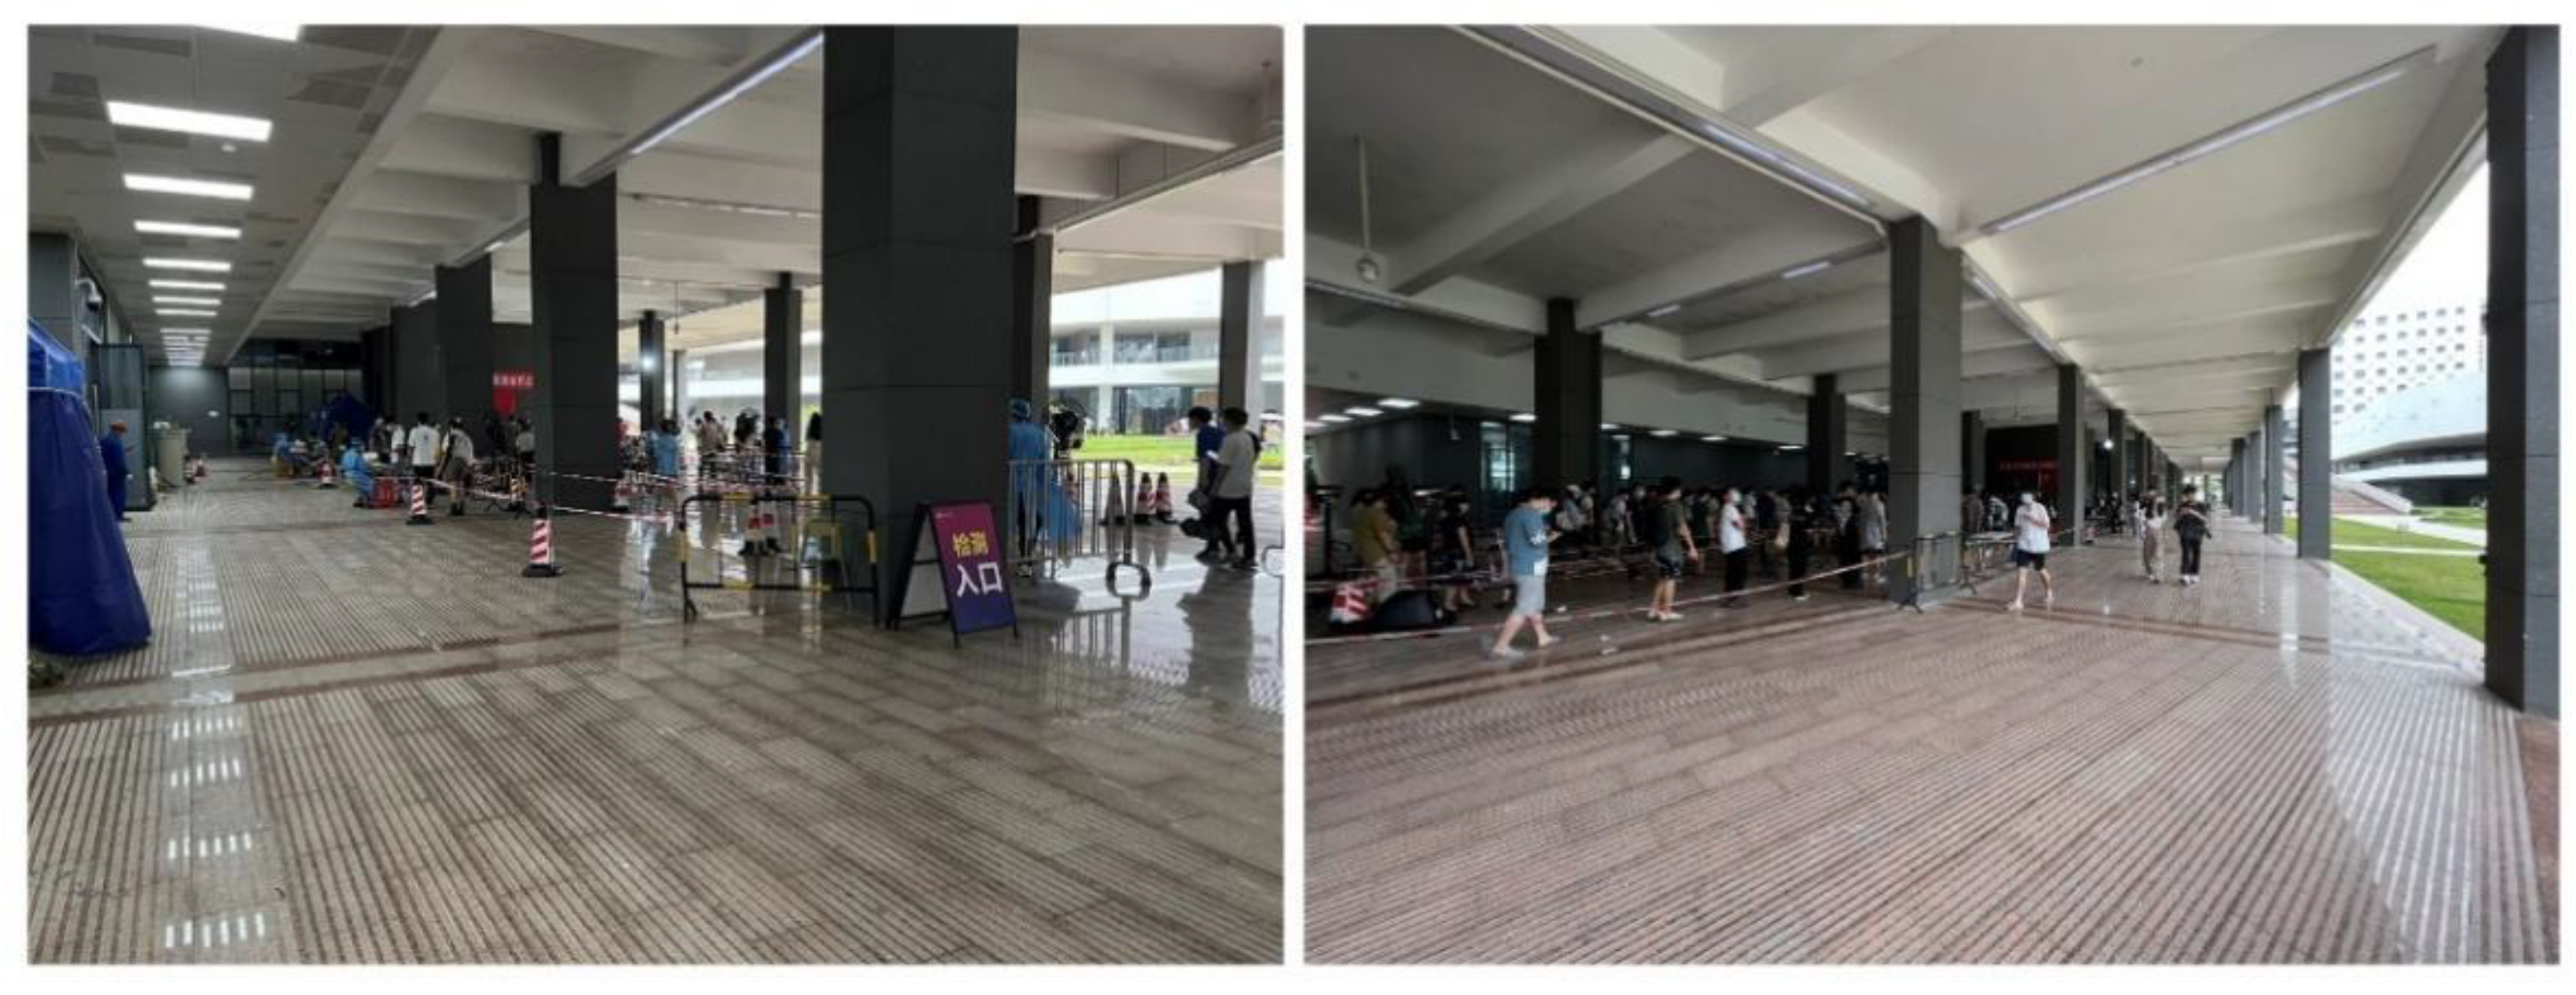
Semi-outdoor spaces can be defined as spaces partially open to the outdoor environment [9]. They are often attractive and frequently used spaces that have a great influence on the quality of life and well-being of users [6,10]. Generally, users expect a thermal environment different from indoor and outdoor ones [11]. Semi-outdoor spaces have significantly lower air temperature and mean radiant temperature than outdoor spaces, providing a more comfortable outdoor thermal environment [12]. Overhead spaces are a type of semi-outdoor spaces. According to the Design Code for Residential Buildings GB50096-2011 [13], the overhead floors refer to the open space layers with only structural support and no external envelope structure. Canopies and balconies in buildings do not fall under the concept of overhead spaces. Overhead space in buildings have many advantages, including greater moisture-proofing and ventilation, sun and rain protection, noise reduction and energy saving. Especially in the special context of the normalized pandemic prevention and control in China, overhead spaces on the ground floor (Figure 1) can also serve as suitable places for nucleic acid testing in summer when the excessive heat makes the outdoor areas uncomfortable and stressful for staying and waiting.
Currently, some scholars have conducted studies in the field of semi-outdoor thermal comfort. These studies have been carried out in different climatic conditions, such as tropical [14,15,16], subtropical [17,18], highland [19], Mediterranean [20], desert [21], and continental [22] climates. At the same time, they covered diverse space types, such as semi-outdoor learning spaces in colleges and universities [23], office buildings [24], cafeterias [25], stadiums [26], and bus shelters [27]. In recent studies in hot and humid regions, some scholars compared thermal comfort differences among indoor, semi-outdoor, and outdoor spaces. Mihara et al. [28] conducted an experiment in an air-conditioned room and semi-outdoor space in Singapore to evaluate environment satisfaction, mood and cognitive performance in cool and warm seasons and used the structural equation model (SEM) to analyze the relationship among environment satisfaction, mood, and work performance. Acero et al. [12] measured and compared thermal comfort in outdoor and semi-outdoor spaces in Singapore, indicating that semi-outdoor spaces were effective in reducing air temperature and mean radiation temperature. Othman et al. [29] studied pedestrian thermal comfort in outdoor and semi-outdoor conditions in two Malaysian universities and obtained neutral temperatures of 28.1 °C and 30.8 °C, with the acceptable physiologically equivalent temperature (PET) ranges of 24–34 °C and 26–33 °C, respectively.
Simultaneously, there are also studies on the relationship between spatial forms and thermal comfort in semi-outdoor spaces. Gamero-Salinas et al. [30] found that semi-outdoor spaces could serve as thermal buffers and that the building forms in semi-outdoor spaces were related to microclimate and thermal comfort in hot and humid climates. Tao et al. [23] explored the relationships among thermal environment, thermal perception, and spatial settings with five semi-outdoor spaces on the campus in Singapore, suggesting that increasing the height of the space and surrounding buildings could improve user’s satisfaction with semi-outdoor spaces, and that building orientation and headspace void-to-solid ratio could effectively regulate temperature and air velocity, respectively. In addition, some studies further investigated the possible factors affecting thermal comfort in semi-outdoor spaces. Pinto et al. [31] conducted a study in a public transport building in Porto and proposed a ventilation model (aDR) to assess the local thermal discomfort caused by ventilation in semi-outdoor spaces. Yin et al. [32] selected an outdoor space in a university in Xi’an to explore the effects of the acoustic environment on thermal comfort, thermal environment on acoustic comfort, and thermoacoustic factors on overall comfort. Concurrently, some scholars studied the adaptive behaviors of people in thermal discomfort. Huang et al. [33] studied outdoor thermal comfort and adaptive behaviors at a university in Mianyang, a hot summer and cold winter region, and found that when PET increased by 1 °C, the probability of “using an umbrella”, “taking off clothes”, and “seeking shade” increased by 22.6%, 4.9%, and 16.6%, respectively. Nakano et al. [34] investigated thermal adaptation characteristics and thermal comfort zones in semi-outdoor environments in Tokyo and found that clothing adjustment was the primary form of behavioral adaptation and that occupants in semi-outdoor environments could tolerate thermal environments 2–3 times wider than the range obtained by the predicted percentage dissatisfied (PPD).
Although the thermal comfort in outdoor spaces has been evaluated under various climatic conditions, the possible factors affecting thermal comfort are yet to be fully understood in the hot and humid climate. Furthermore, more semi-outdoor space types should be included to propose environmental design strategies that help to reduce the negative impact of excessive heat stress in summer. Among them, overhead space is a typical semi outdoor space that can improve the thermal environment. In China, the research on overhead public spaces is mainly divided into two directions. One is focused on the design of the overhead spaces [35,36], and the other is focused on the wind environment of the overhead spaces [37,38], which lacks the integration of design and environmental performance studies. In addition, different cities have different policies on the reward of plot ratio of overhead public spaces. It is found that the planning and design of overhead public spaces is a relatively new field in the practice and related research, and the relevant design theories and methods need to be further improved through research and practice. The Lingnan region (south of the Nanling Mountains) in China has a humid subtropical monsoon climate with a high mean annual temperature, massive precipitation, and intense solar radiation. Due to its hot and humid climate, many traditional dwellings have been ventilated and insulated by various means since ancient times [39]. A study in Guangzhou showed that the standard effective temperature index could be reduced by 6~10 °C using semi outdoor components, such as pilotis (a support that lifts a building to the ground or above a water body) [40]. In modern times, the architectural form of “Qilou” (riding tower) has emerged in Lingnan. As a type of overhead space, it reflects the artistic features combining Chinese and Western elements under the climatic and historical background of the region. Although the overhead floors are often observed in Lingnan architecture and extensively used by architects as an architectural design strategy to cope with a hot and humid climate, their effectiveness and practical use effects have not yet been verified from the user’s perspective.
In sum, there is a lack of research on the thermal comfort of overhead space, especially in hot and humid areas, and overhead space itself exists widely in hot and humid areas. The research of overhead space is still a relatively new field and needs further exploration in terms of design and planning. Therefore, the main objectives of this study are proposed as follows: (1) To investigate the thermal sensations of users in the overhead public space in hot summer and warm winter regions and compare with previous semi-outdoor thermal comfort studies. (2) To explore various factors that may affect thermal comfort in the overhead public space, (3) To study the adaptive behaviors of users seeking thermal comfort in the overhead public space. This study is expected to supplement the research on thermal comfort and adaptive behaviors of semi-outdoor spaces in hot and humid areas, especially to enhance the application of overhead spaces in college campuses. From the architectural design perspective, it provides suggestions for thermal comfort adjustment in hot and humid areas such as Shenzhen and optimizes and promotes the planning and design of overhead spaces.
2. Materials and Methods
2.1. Region Selection
The application of overhead spaces has become increasingly common and mature in southern Chinese cities. Shenzhen is a mega-city in southern China and the smallest first-tier city in China, with a fast construction speed and high plot ratio. It lays a sound foundation for the practice of overhead spaces. According to China national climate classification criteria, five major climate zones are identified for building design. Shenzhen is located in a hot summer and warm winter region, where the mean temperature of the coldest month is above 10 °C, the mean temperature of the hottest month is 25–29 °C, and the number of days with mean daily temperature above 25 °C is 100–200.
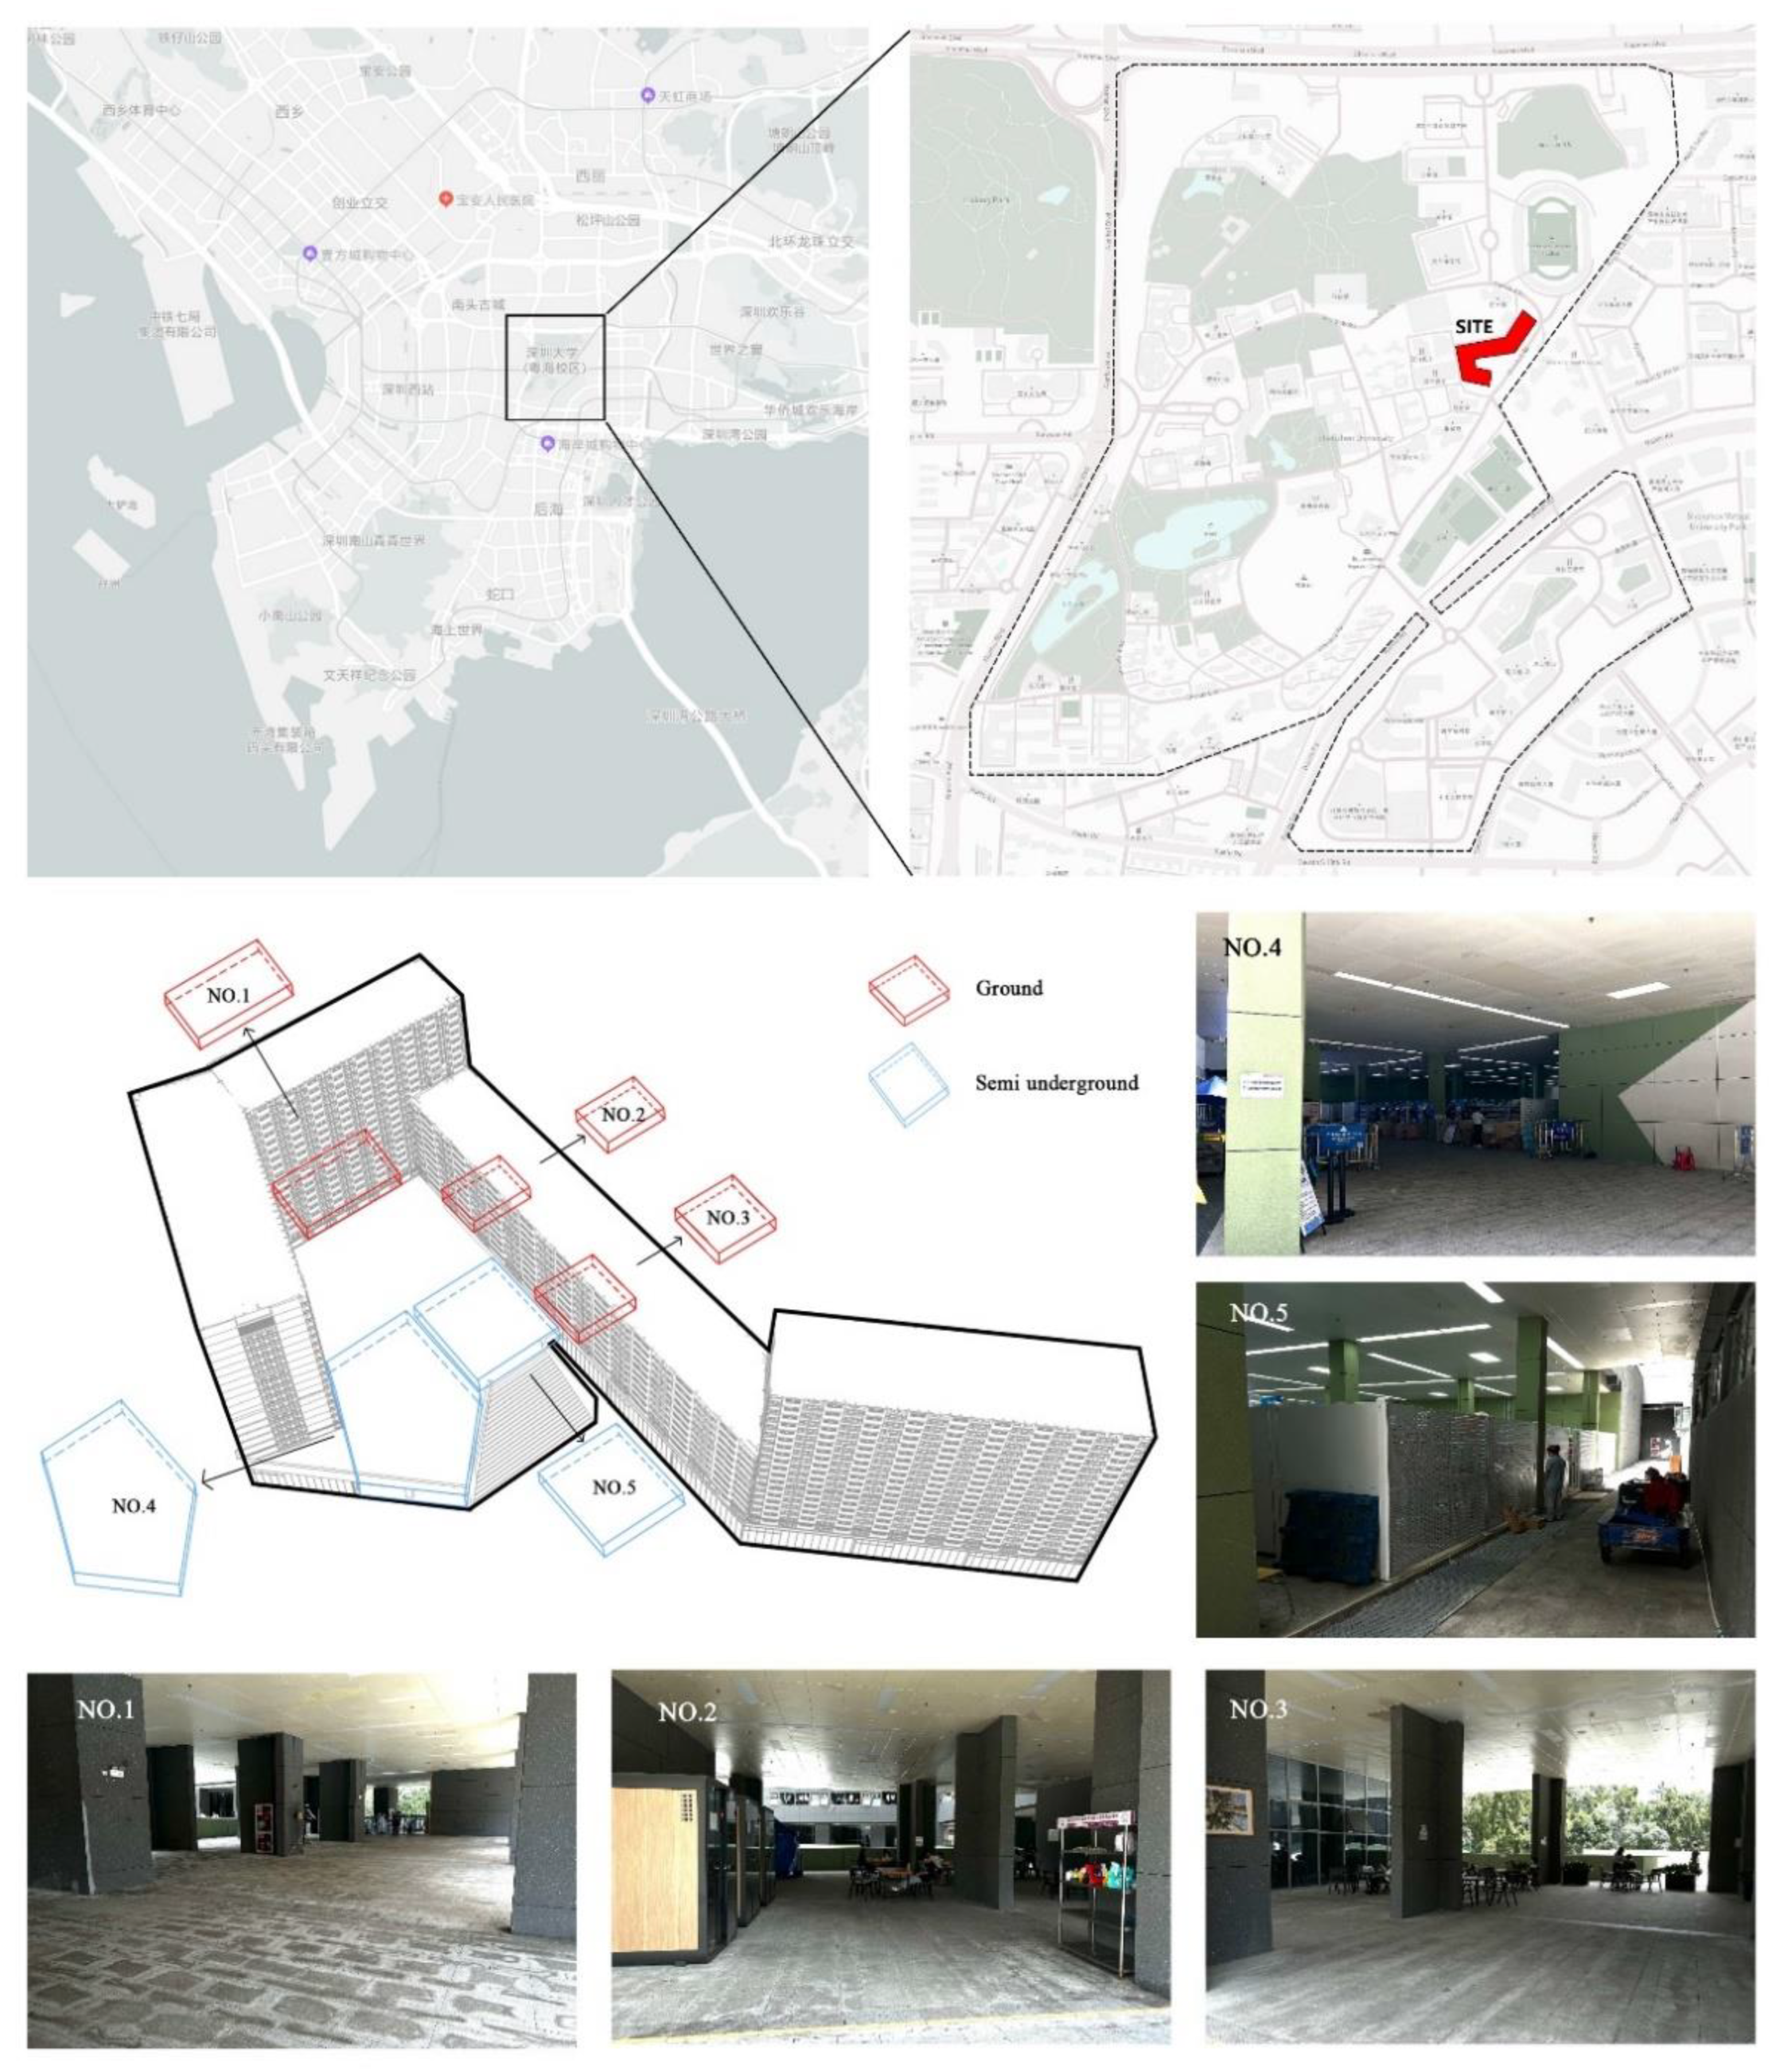
Shenzhen University (SZU) is a representative comprehensive university in the Lingnan region with a large number of students. The campus was built relatively recently, with diversified architectural forms and distinctive semi-outdoor spaces. The ambiguity and multiplicity of overhead spaces make it a special type of open spaces used the most frequently on the campus. Hence, SZU was selected as the study area in this research. SZU campus (113.6° E, 22.3° N) is located in the southern part of Guangdong Province, China. According to the local meteorological records, the outdoor air temperature varies between 5 °C and 37 °C, with the highest annual mean outdoor air temperature in July (28 °C) and the lowest in February (15 °C) [41]. In this study, the student dormitory area (completed in 2019) in the Zhai zone (Figure 2) with relatively high traffic in SZU was selected as the study object. Table 1 shows the basic information on the measurement sites. Figure 3 shows the site selected for the study. Points 1 and 2 are a study and rest space respectively with some tables and chairs. The area of point 2 is slightly smaller than that of point 1, and there is a piano room. Point 3 is a passage space, without tables and chairs, with the largest area. Point 4 and point 5 serve as the Express Center together. Point 4 is the entrance space of the Express Center, which is used for queues, waiting, etc. Point 5 is the container area of the Express Center.
2.2. Meteorological Data
Given the dates when the majority of students start school, the actual measurement dates in this paper were from 23 September to 6 October 2021 in hot season and from 3 January to 7 January 2022 in cold season. Data were kept only on sunny days to eliminate the interference of other factors. Each measuring point has a weather station set up near the middle of the measuring point. The thermal environment parameters, such as air temperature, relative humidity, air velocity, and black globe temperature (BGT), were recorded at 1.1 m height. All instruments required for actual measurement were calibrated and automatically recorded once every 10 min for 24 h. The measurement range and accuracy of the instruments are shown in Table 2.
2.3. Questionnaire Data
In addition to traditional and accepted thermal comfort indices, questionnaire-based outdoor thermal comfort surveys were crucial [42]. In this study, a questionnaire survey for users was conducted at the measurement sites while meteorological parameters were collected. Since the main respondents of the questionnaire are anonymous, and the questionnaire does not involve privacy and personal information, about 50% of the invitees accepted the questionnaire. The date and time of the questionnaire survey are shown in Table 3. The questionnaire was completed with the assistance of the students in the research group and divided into four parts, as shown in Table 4. Part 1 is a personal information survey, including gender, age, etc. Part 2 investigates the current dress and metabolic level of the subjects. Part 3 inquires about subjective thermal sensation. Part 4 inquires about different methods of adaptation to the thermal environment. Only those who stayed at the selected site for more than 15 min would be considered for the questionnaire survey. A total of 509 valid questionnaires were collected, including 243 in hot season and 266 in cold season. The age was mainly concentrated between 18 and 30 years, accounting for 95.5%. In the aspect of gender, males accounted for about 58.5% and females about 41.5%. The mean BMI was 21.00, with a standard deviation of 3.22.
2.4. Calculation of Thermal Comfort
The human comfort sensation involves physiological and psychological factors. According to previous studies, PET is a widely accepted outdoor meteorological index. PET, a comprehensive evaluation index of meteorological parameters based on the Munich Energy-Balance Model for Individuals (MEMI), refers to the physiologically equivalent temperature in any given environment (outdoor or indoor). Its value is equal to the air temperature in a given situation, at which the thermal equilibrium of the human body is maintained and the core and skin temperatures are equal to the temperature under the conditions evaluated [43]. Notably, it assumes the clothing insulation value and activity level, so that the effect of microclimate alone on the thermal state of the body can be evaluated independently of individual behavior [44]. All PET values expressed in degrees Celsius in this paper were calculated using Rayman 1.2. During calculation, air temperature (°C), air velocity (m/s), relative humidity (RH), and mean radiation temperature (Tmrt) were used as the main input data.
Upon the calculation of PET, Tmrt (mean radiant temperature) is first calculated, a common parameter used to assess thermal comfort or calculate the radiant heat loss from the human body. Tmrt is calculated according to Equation (1):
where Tmrt is the mean radiation temperature (°C), Tg is the black globe temperature (°C), Ta is the air temperature (°C), v is the air velocity (m/s), D is the diameter of the black globe (m) (standard black globe with D = 75 mm is used in this paper), and ε is the absorption rate of the black globe (0.95 in this paper).
2.5. Linear Regression
Linear regression is a regression analysis that uses the least square function or linear regression equation to model the relationship between one or more independent variables and dependent variables. It is the first type of regression analysis that has been strictly studied and widely used in practical applications. This is because a model that depends linearly on its unknown parameters is easier to fit than a model that depends nonlinearly on its unknown parameters, and the statistical characteristics of the resulting estimates are also easier to determine. When linear regression is applied to thermal comfort analysis, the model is easy to understand. At the same time, a broader microclimate state can be fitted.
3. Results
3.1. Outdoor Thermal Environment and Respondent Characteristics
The maximum, minimum, mean, and standard deviation of each parameter of the outdoor thermal environment at each measurement site are shown in Table 5 In terms of air temperature, it was mainly concentrated at 26–33 °C in hot season and 18–24 °C in cold season, and the mean air temperature difference between hot season and cold season was around 10 °C. In terms of relative humidity and air velocity, there was little difference between hot season and cold season. The BGT presented similar characteristics to the air temperature.
To understand the influence of microclimatic parameters on outdoor thermal comfort in hot summer and warm winter regions, five meteorological parameters (Ta, Tg, Va, Tmrt, and RH) were analyzed using the correlation analysis method, as shown in Table 6. The results indicated that Tg and Tmrt showed a significant positive correlation with PET, and a very close relationship. Ta also showed a significant positive correlation with PET, and a close relationship. Second, Va showed a significant negative correlation with PET. RH did not show a significant correlation with PET. This may be due to the hot and humid climate of Shenzhen, with high solar radiation intensity and accompanied by low air velocity, which was generally consistent with previous studies [45]. Moreover, among microclimate parameters, Ta and Tg showed a positive correlation with a very close relationship. Moreover, Tg and Tmrt showed a positive correlation, with a very close relationship. This is because Tmrt was obtained based on the calculation of Tg.
3.2. Thermal Sensation and Thermal Comfort
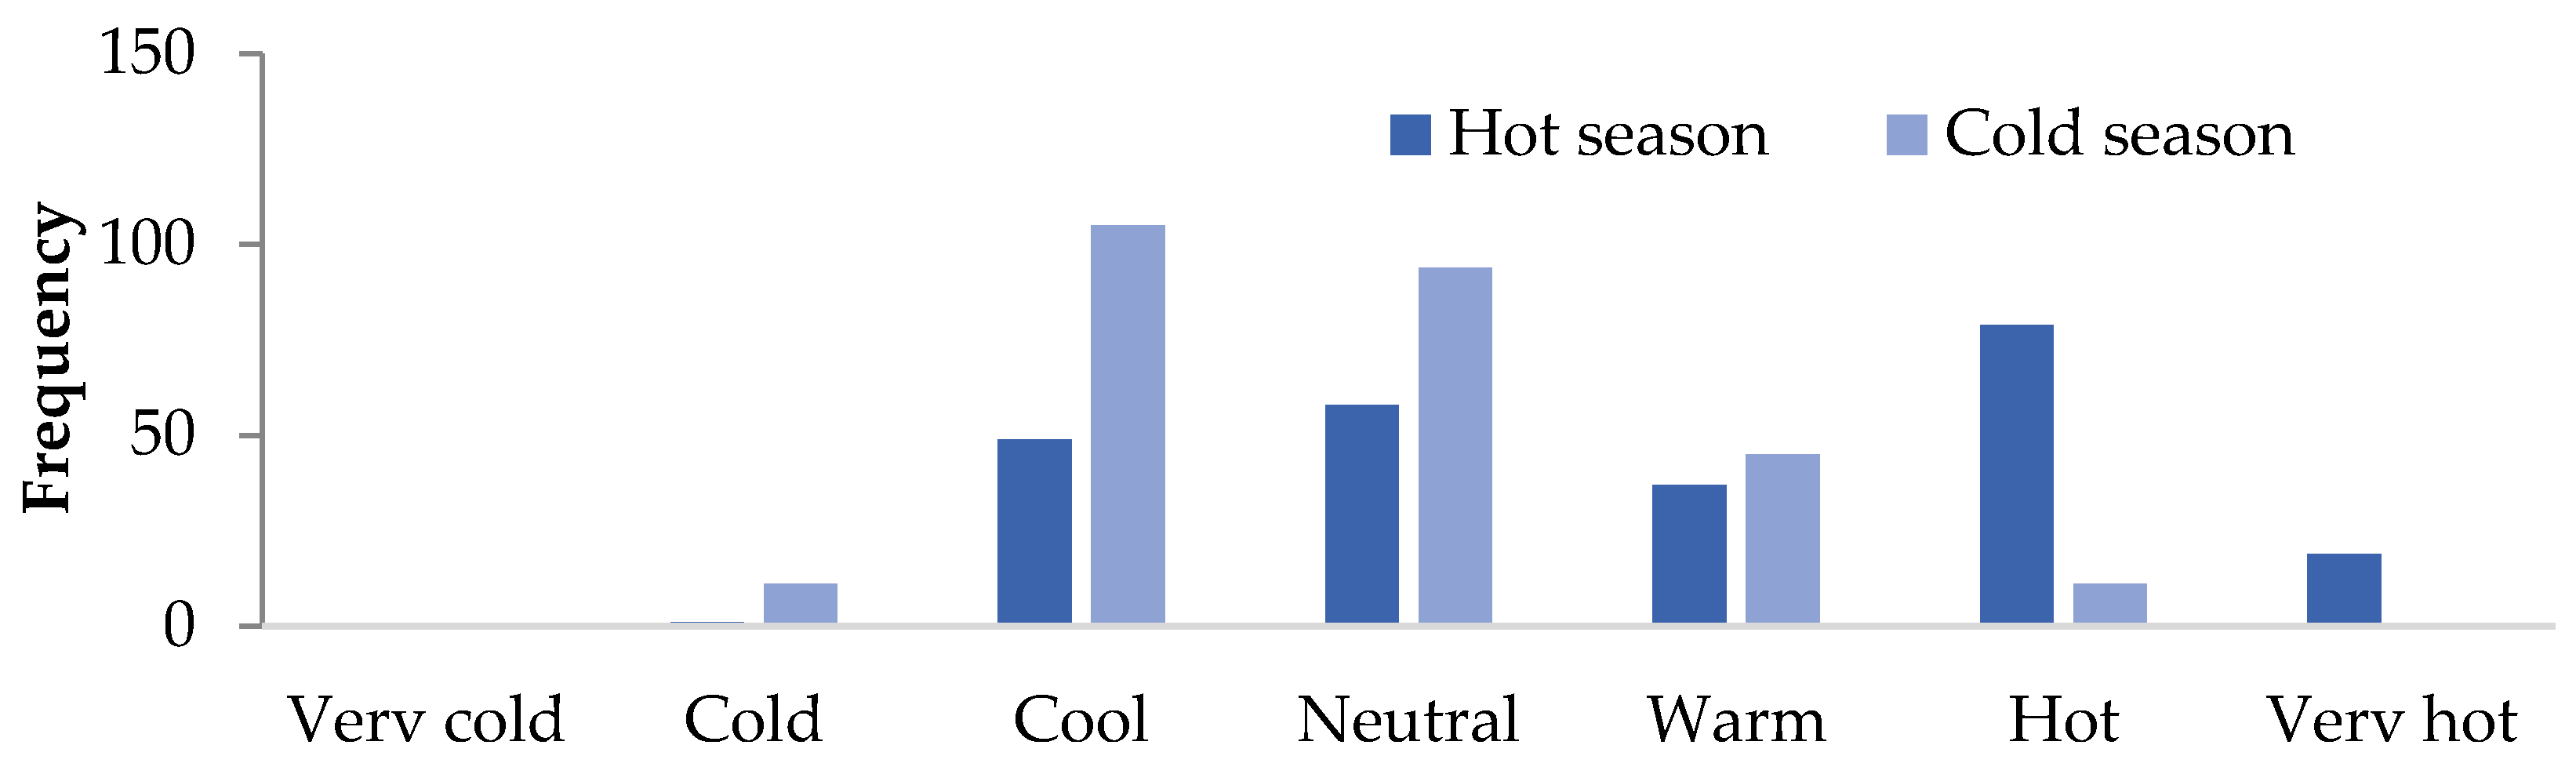
Figure 4 shows the TSV distribution of respondents. It is generally considered that respondents with TSV between −1 and 1 are satisfied with their thermal environment. The percentage of respondents satisfied with their thermal environment in summer was 59.3%. This value increased to 91.7% in cold season, suggesting that these semi-outdoor spaces were more likely to make the respondents feel thermally comfortable in cold season. This may be due to the difference in clothing insulation between cold season and hot season. In hot season, the minimum acceptable amount of clothing given moral constraints still did not allow for thermal sensation in the comfort zone. Yet, the relatively cooler thermal environment in cold season allowed more space for people to adjust their clothing.
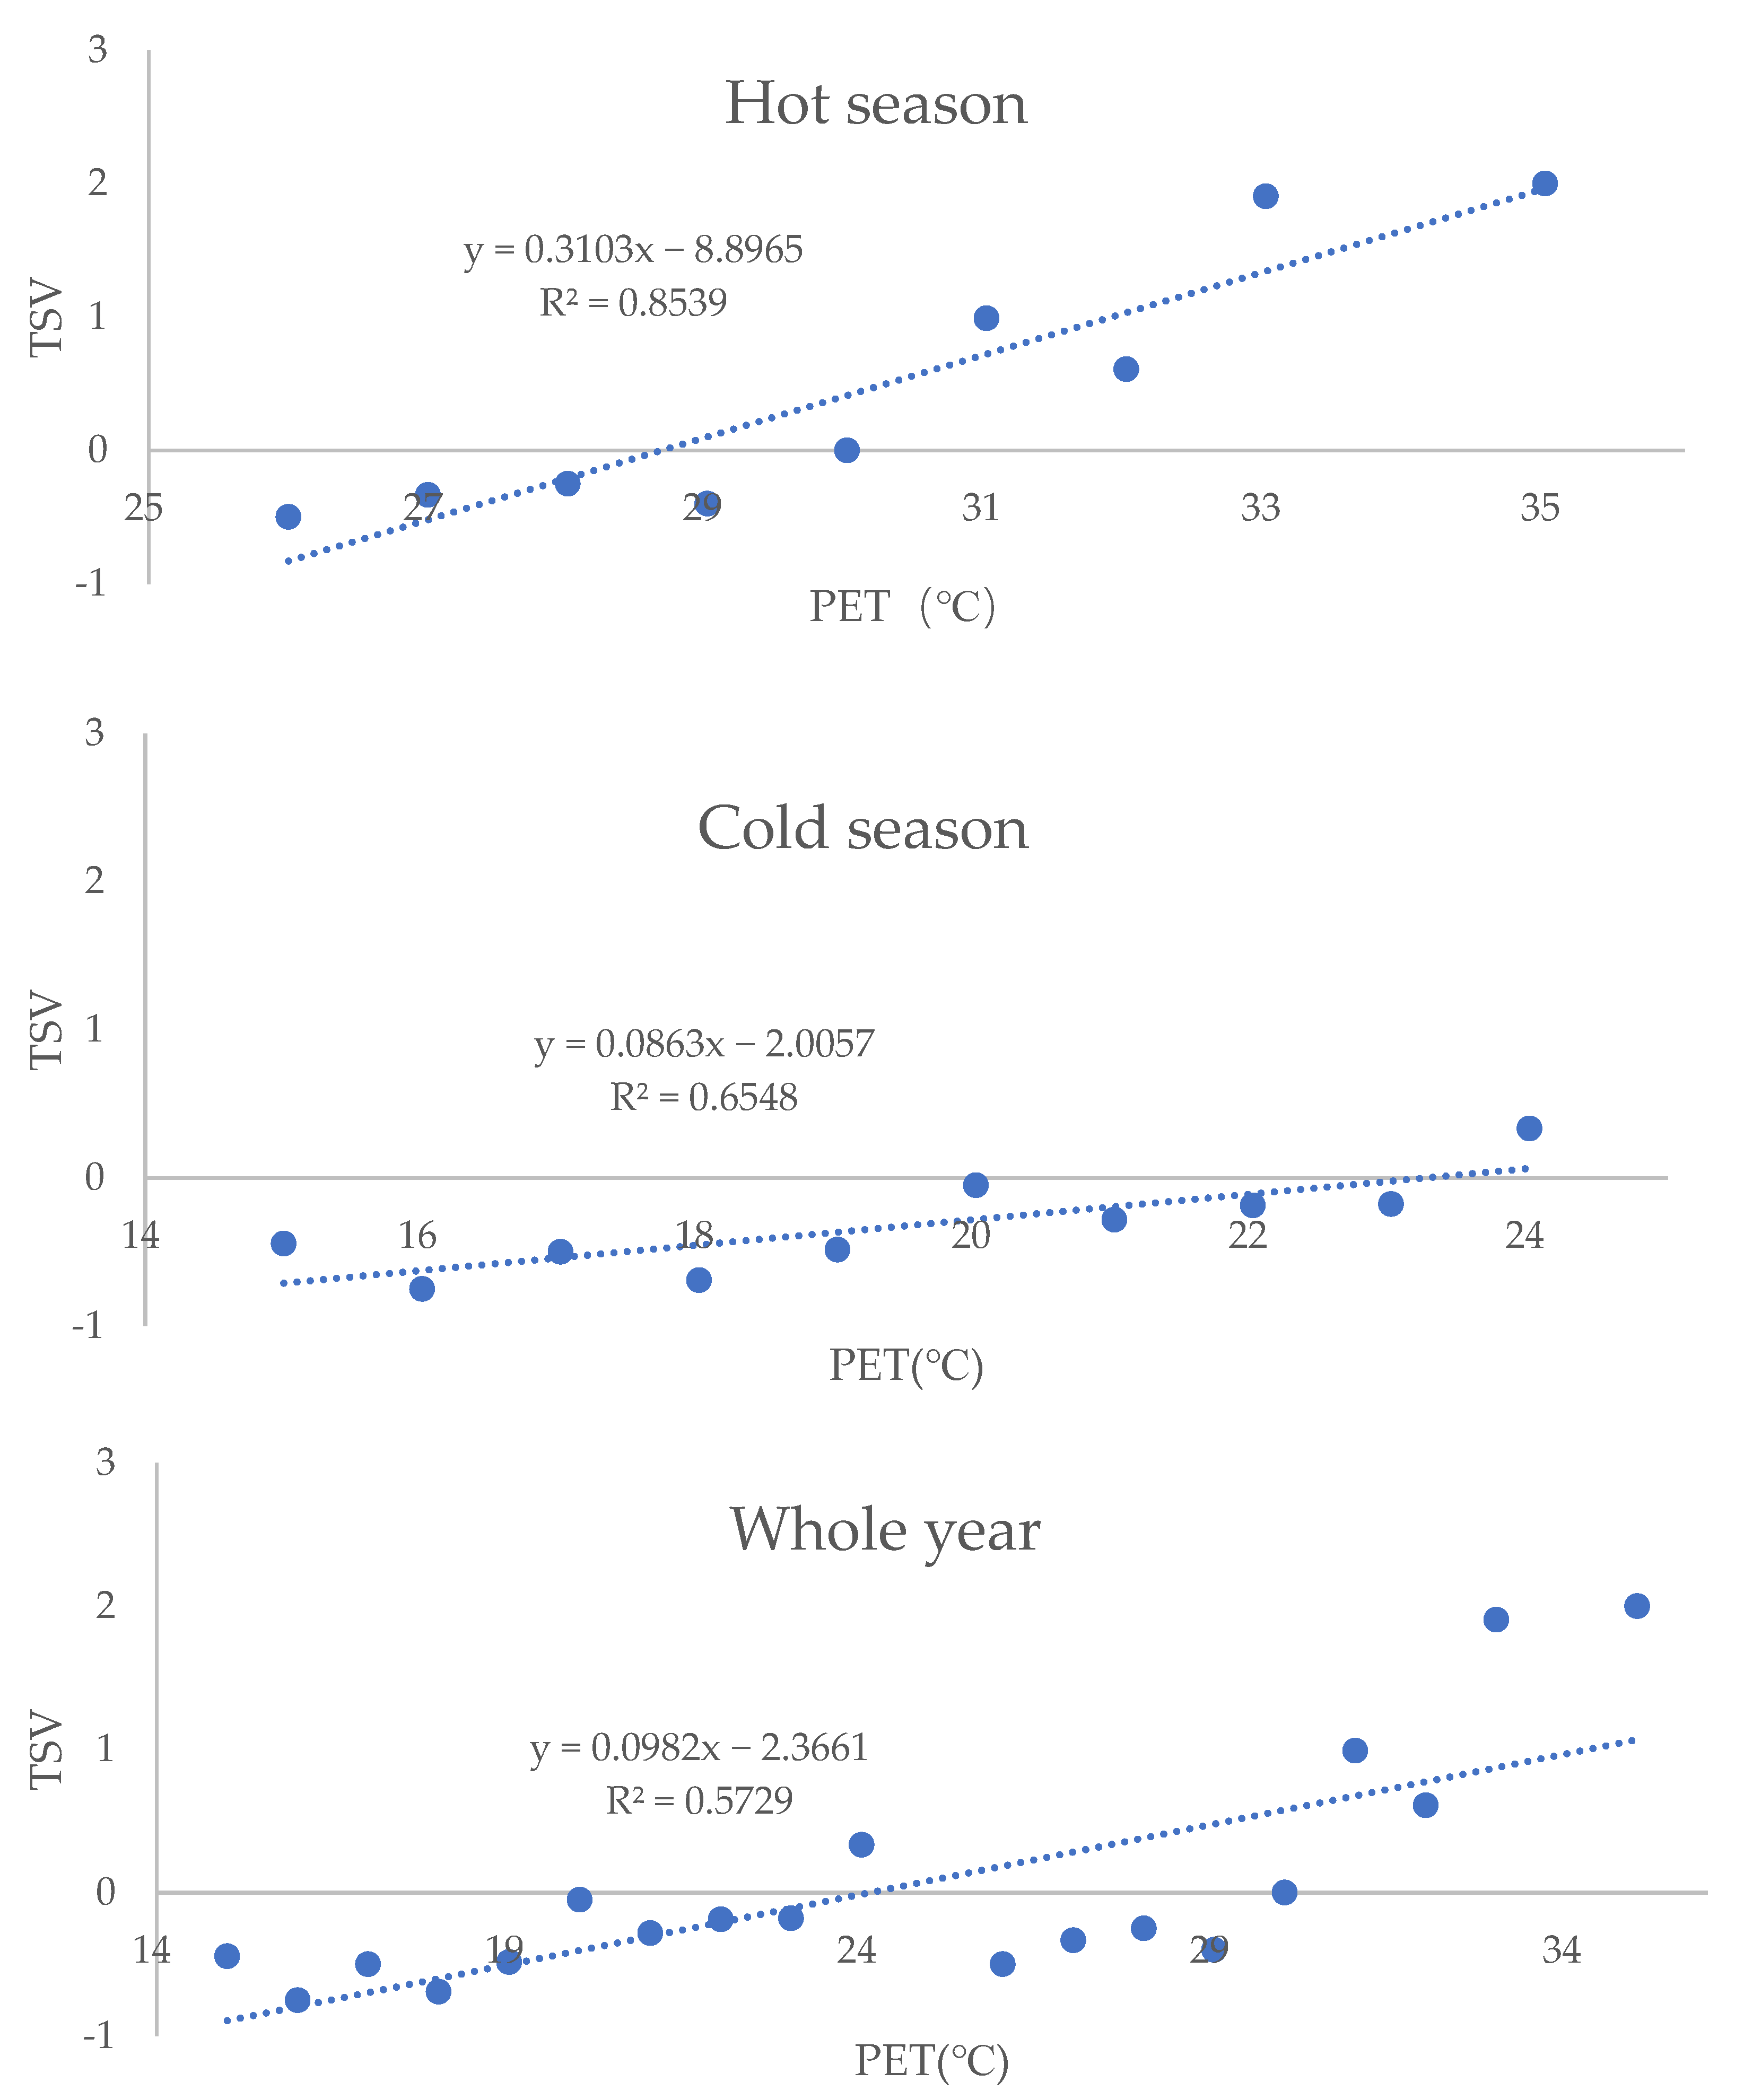
The linear regression model of TSV and PET was established, as shown in Figure 5. According to the regression equation, TSV was set to 0, and it could be obtained that the neutral temperature was 28.3 °C in hot season, 23.3 °C in cold season, and 23.8 °C for the whole year. TSV between −0.5 and 0.5 was within the neutral PET range, which was 26.5–30.1 °C in hot season, 17.4–29.1 °C in cold season, and 18.8–28.9 °C for the whole year, as shown in Equations (2)–(4) below:
Hot season: TSV = 0.3103 PET − 8.8965 (R² = 0.7693, p = 0.0004)
Cold season: TSV = 0.0863 PET − 2.0057 (R² = 0.6548, p = 0.0005)
Whole year: TSV = 0.0982 PET − 2.3661 (R² = 0.5729, p = 0.0001)
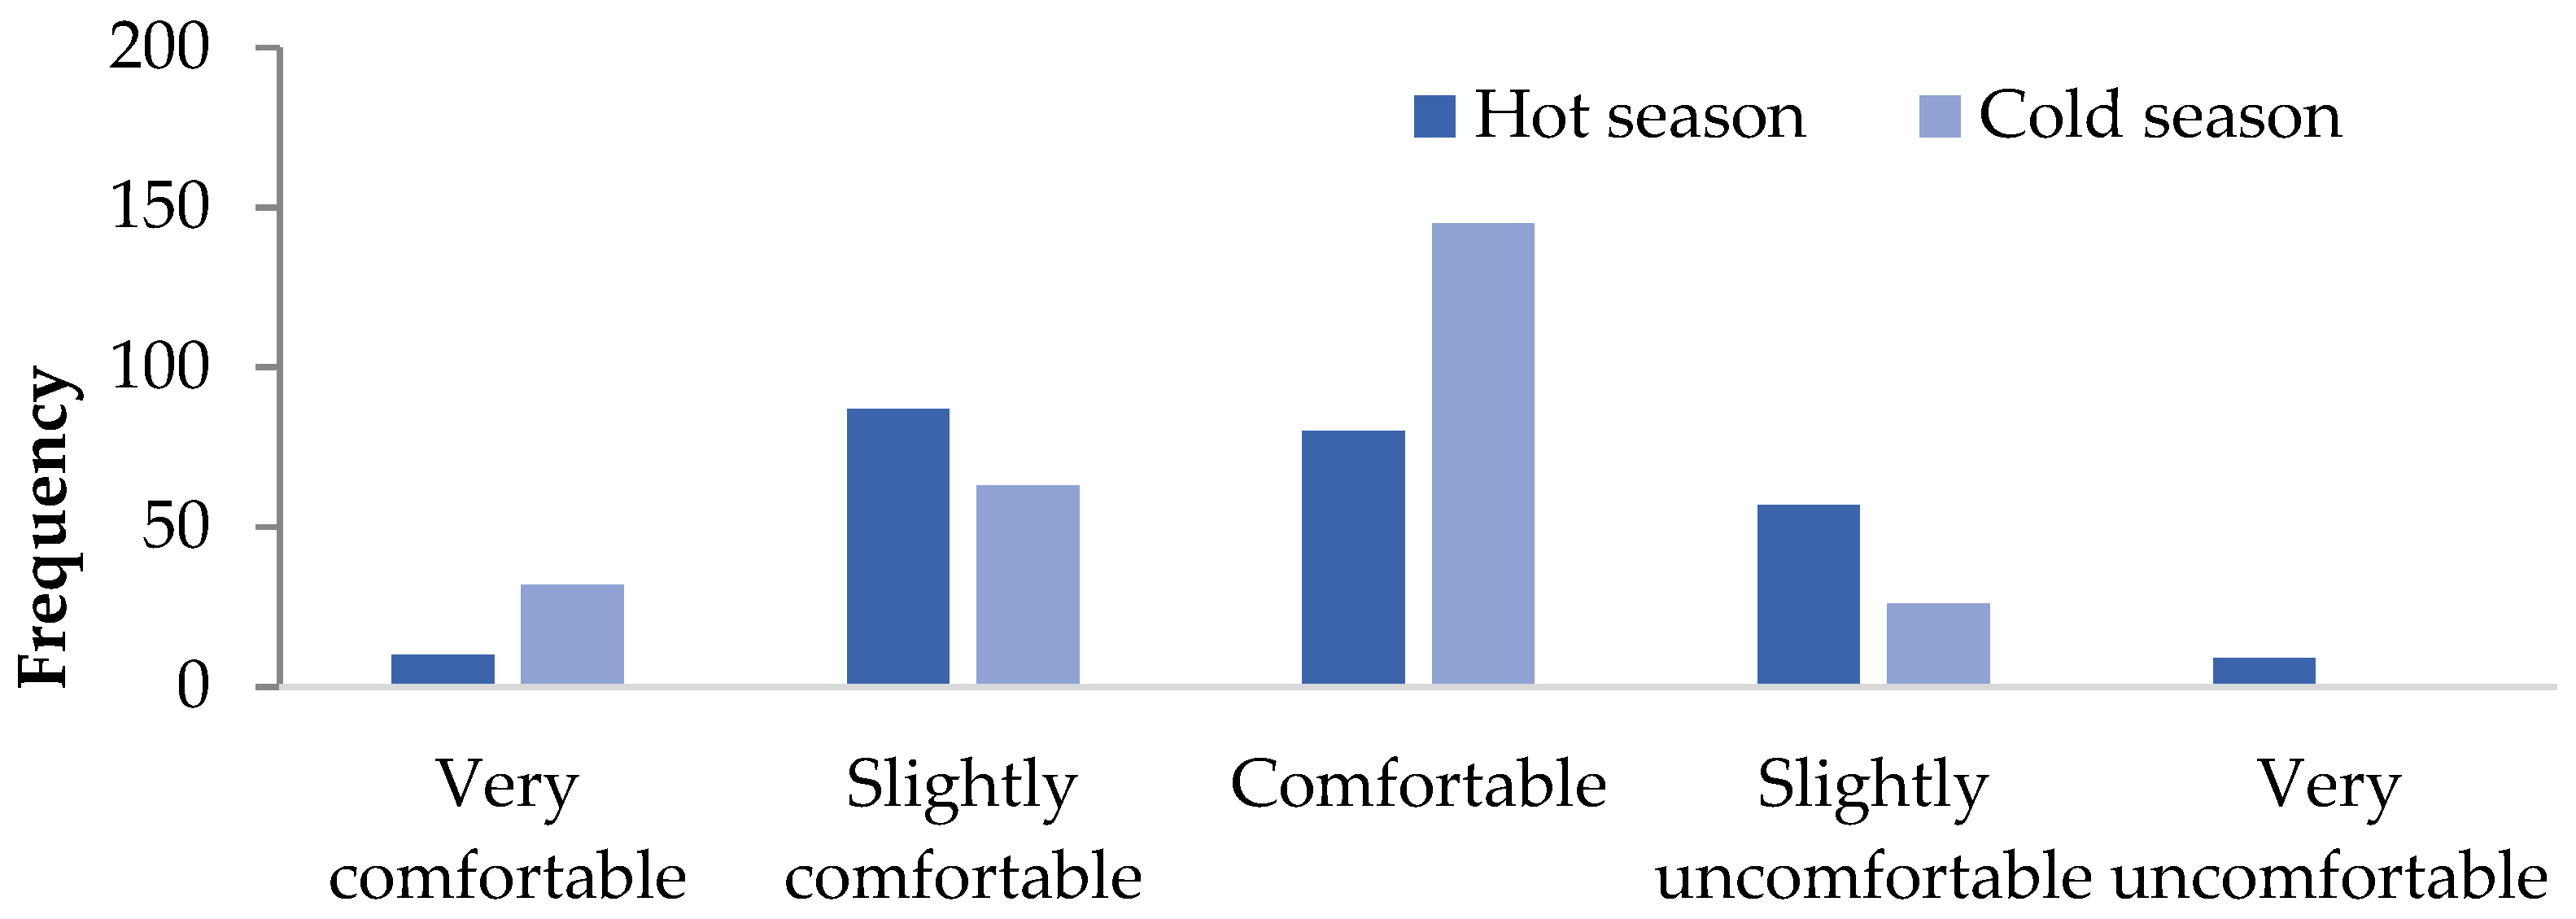
Figure 6 shows the distribution of TCV frequency. The mean TCV was 1.87 in hot season and 1.62 in cold season, indicating that the overall thermal comfort was higher in cold season than in hot season.
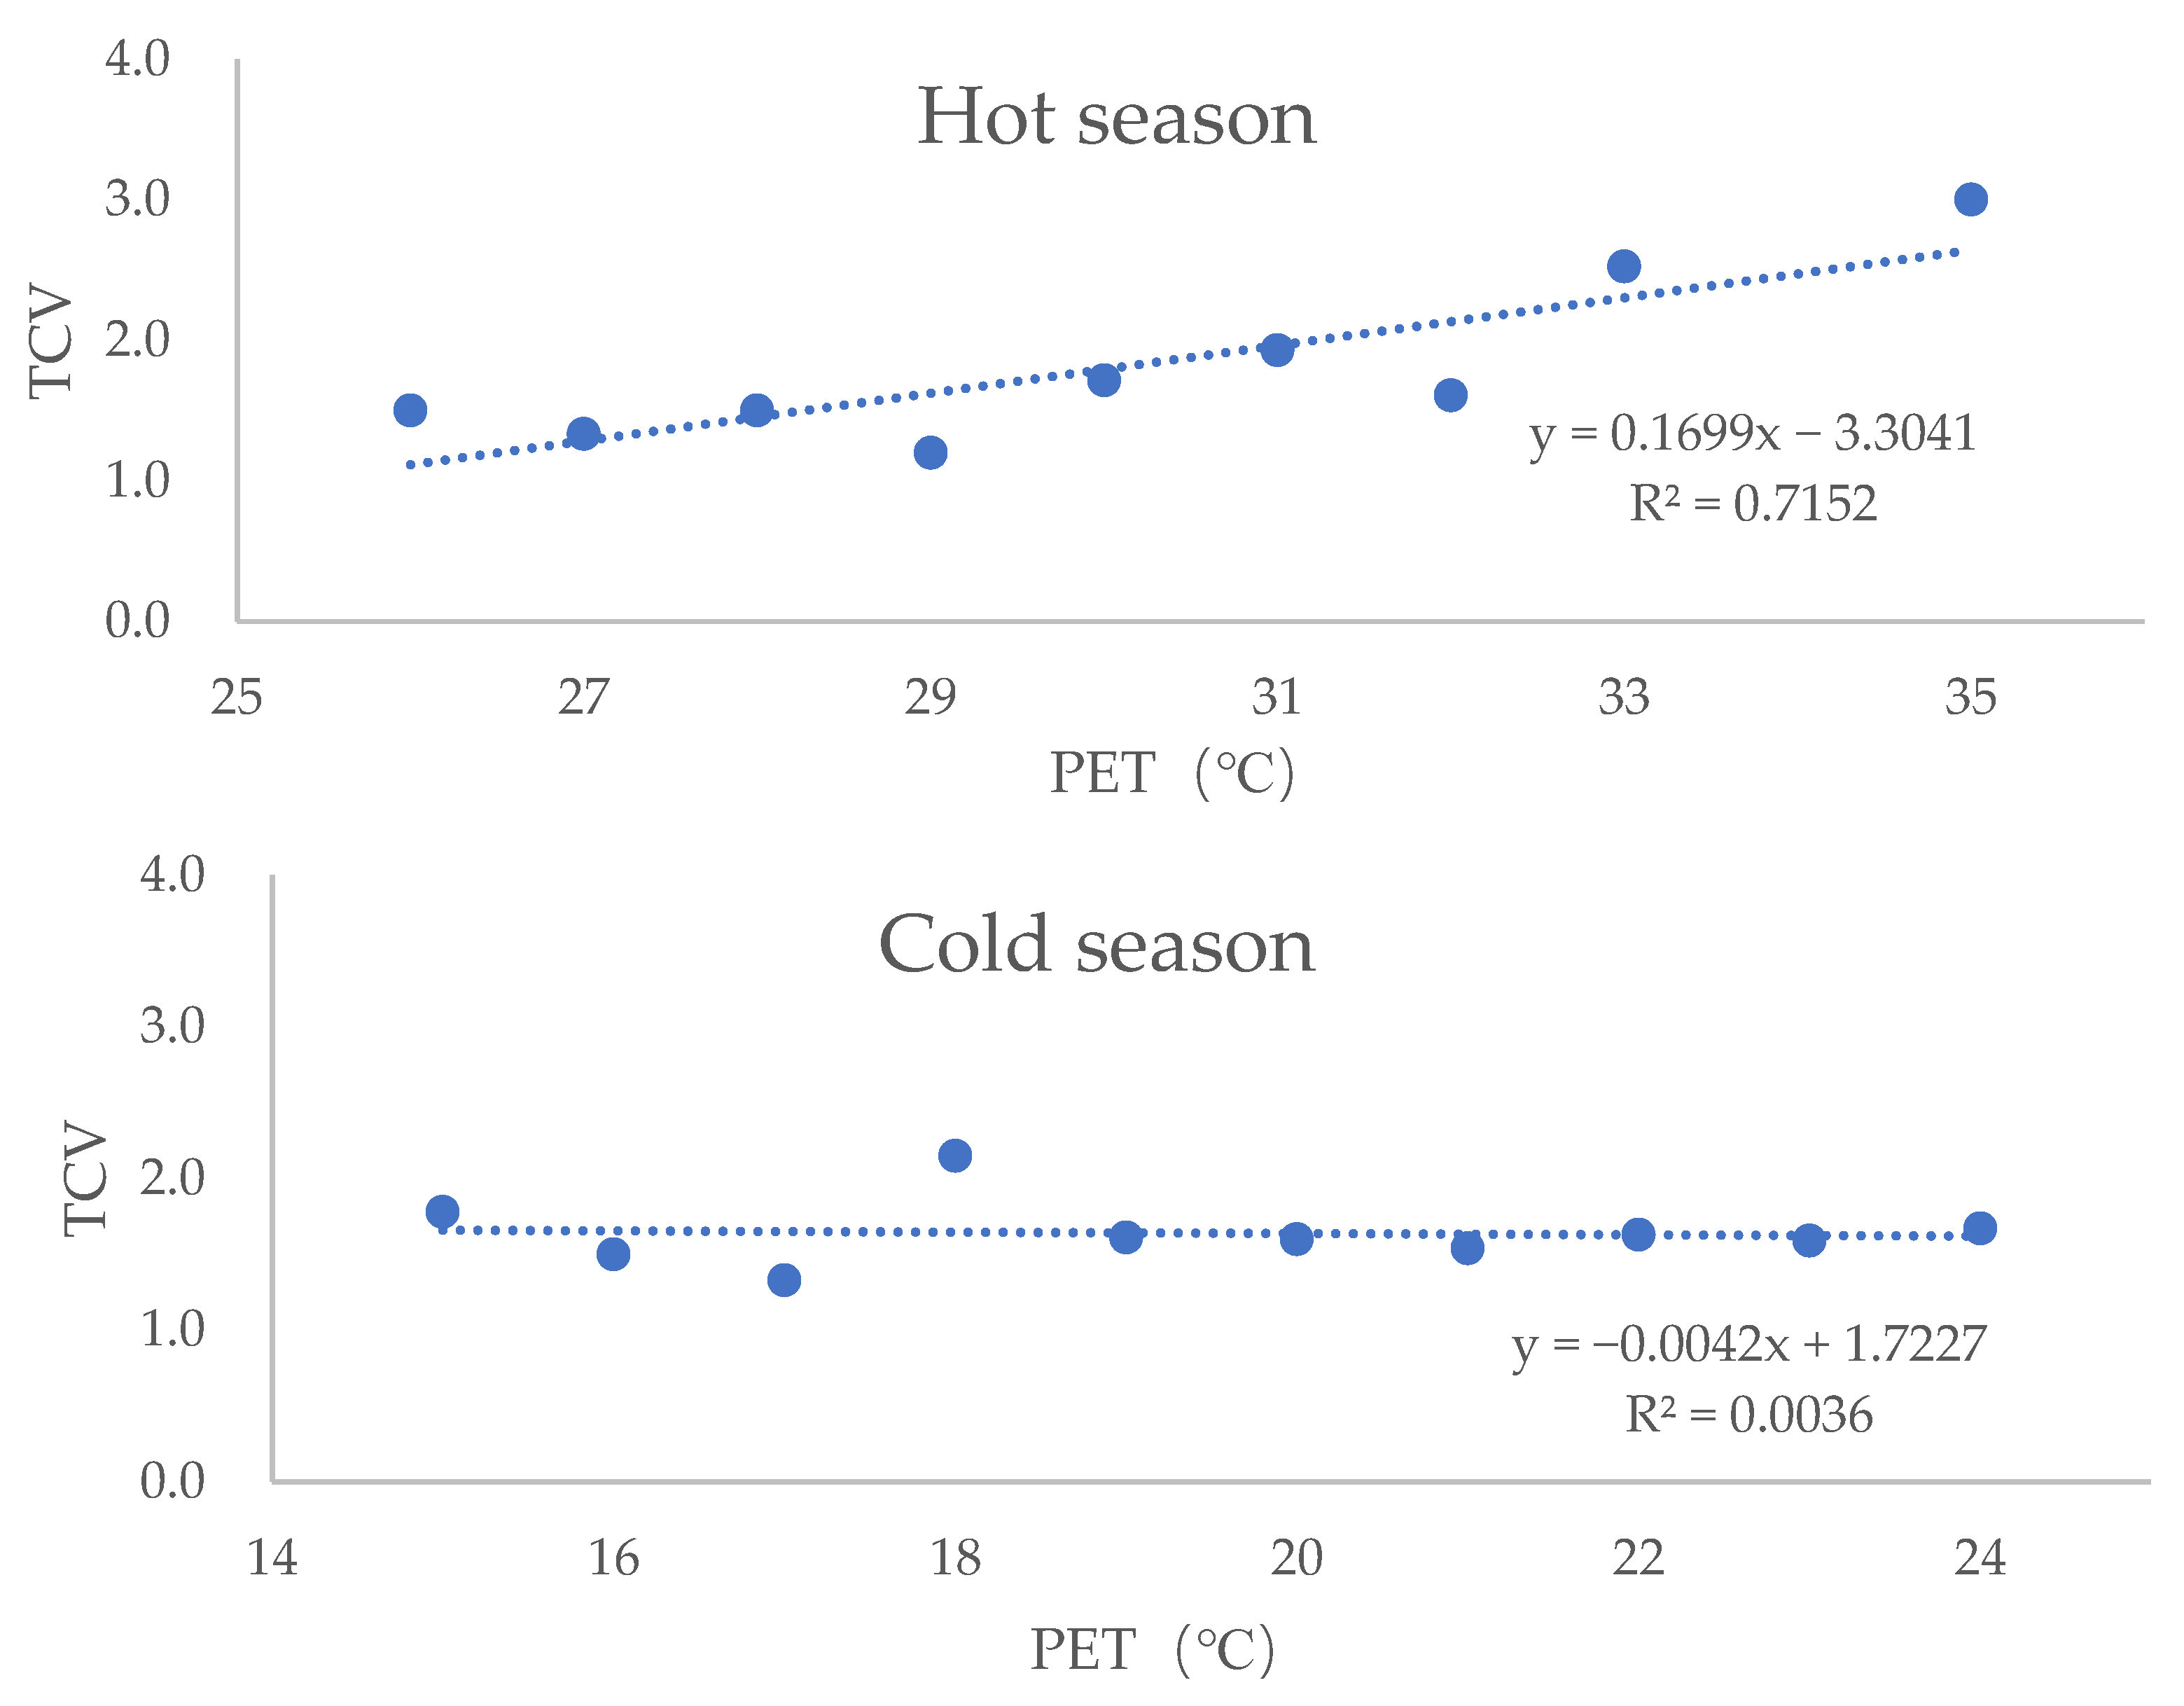
The linear relationship between TCV and PET was established, as shown in Figure 7. It can be observed that the relationship between TCV and PET is close in hot season but not obvious in cold season.
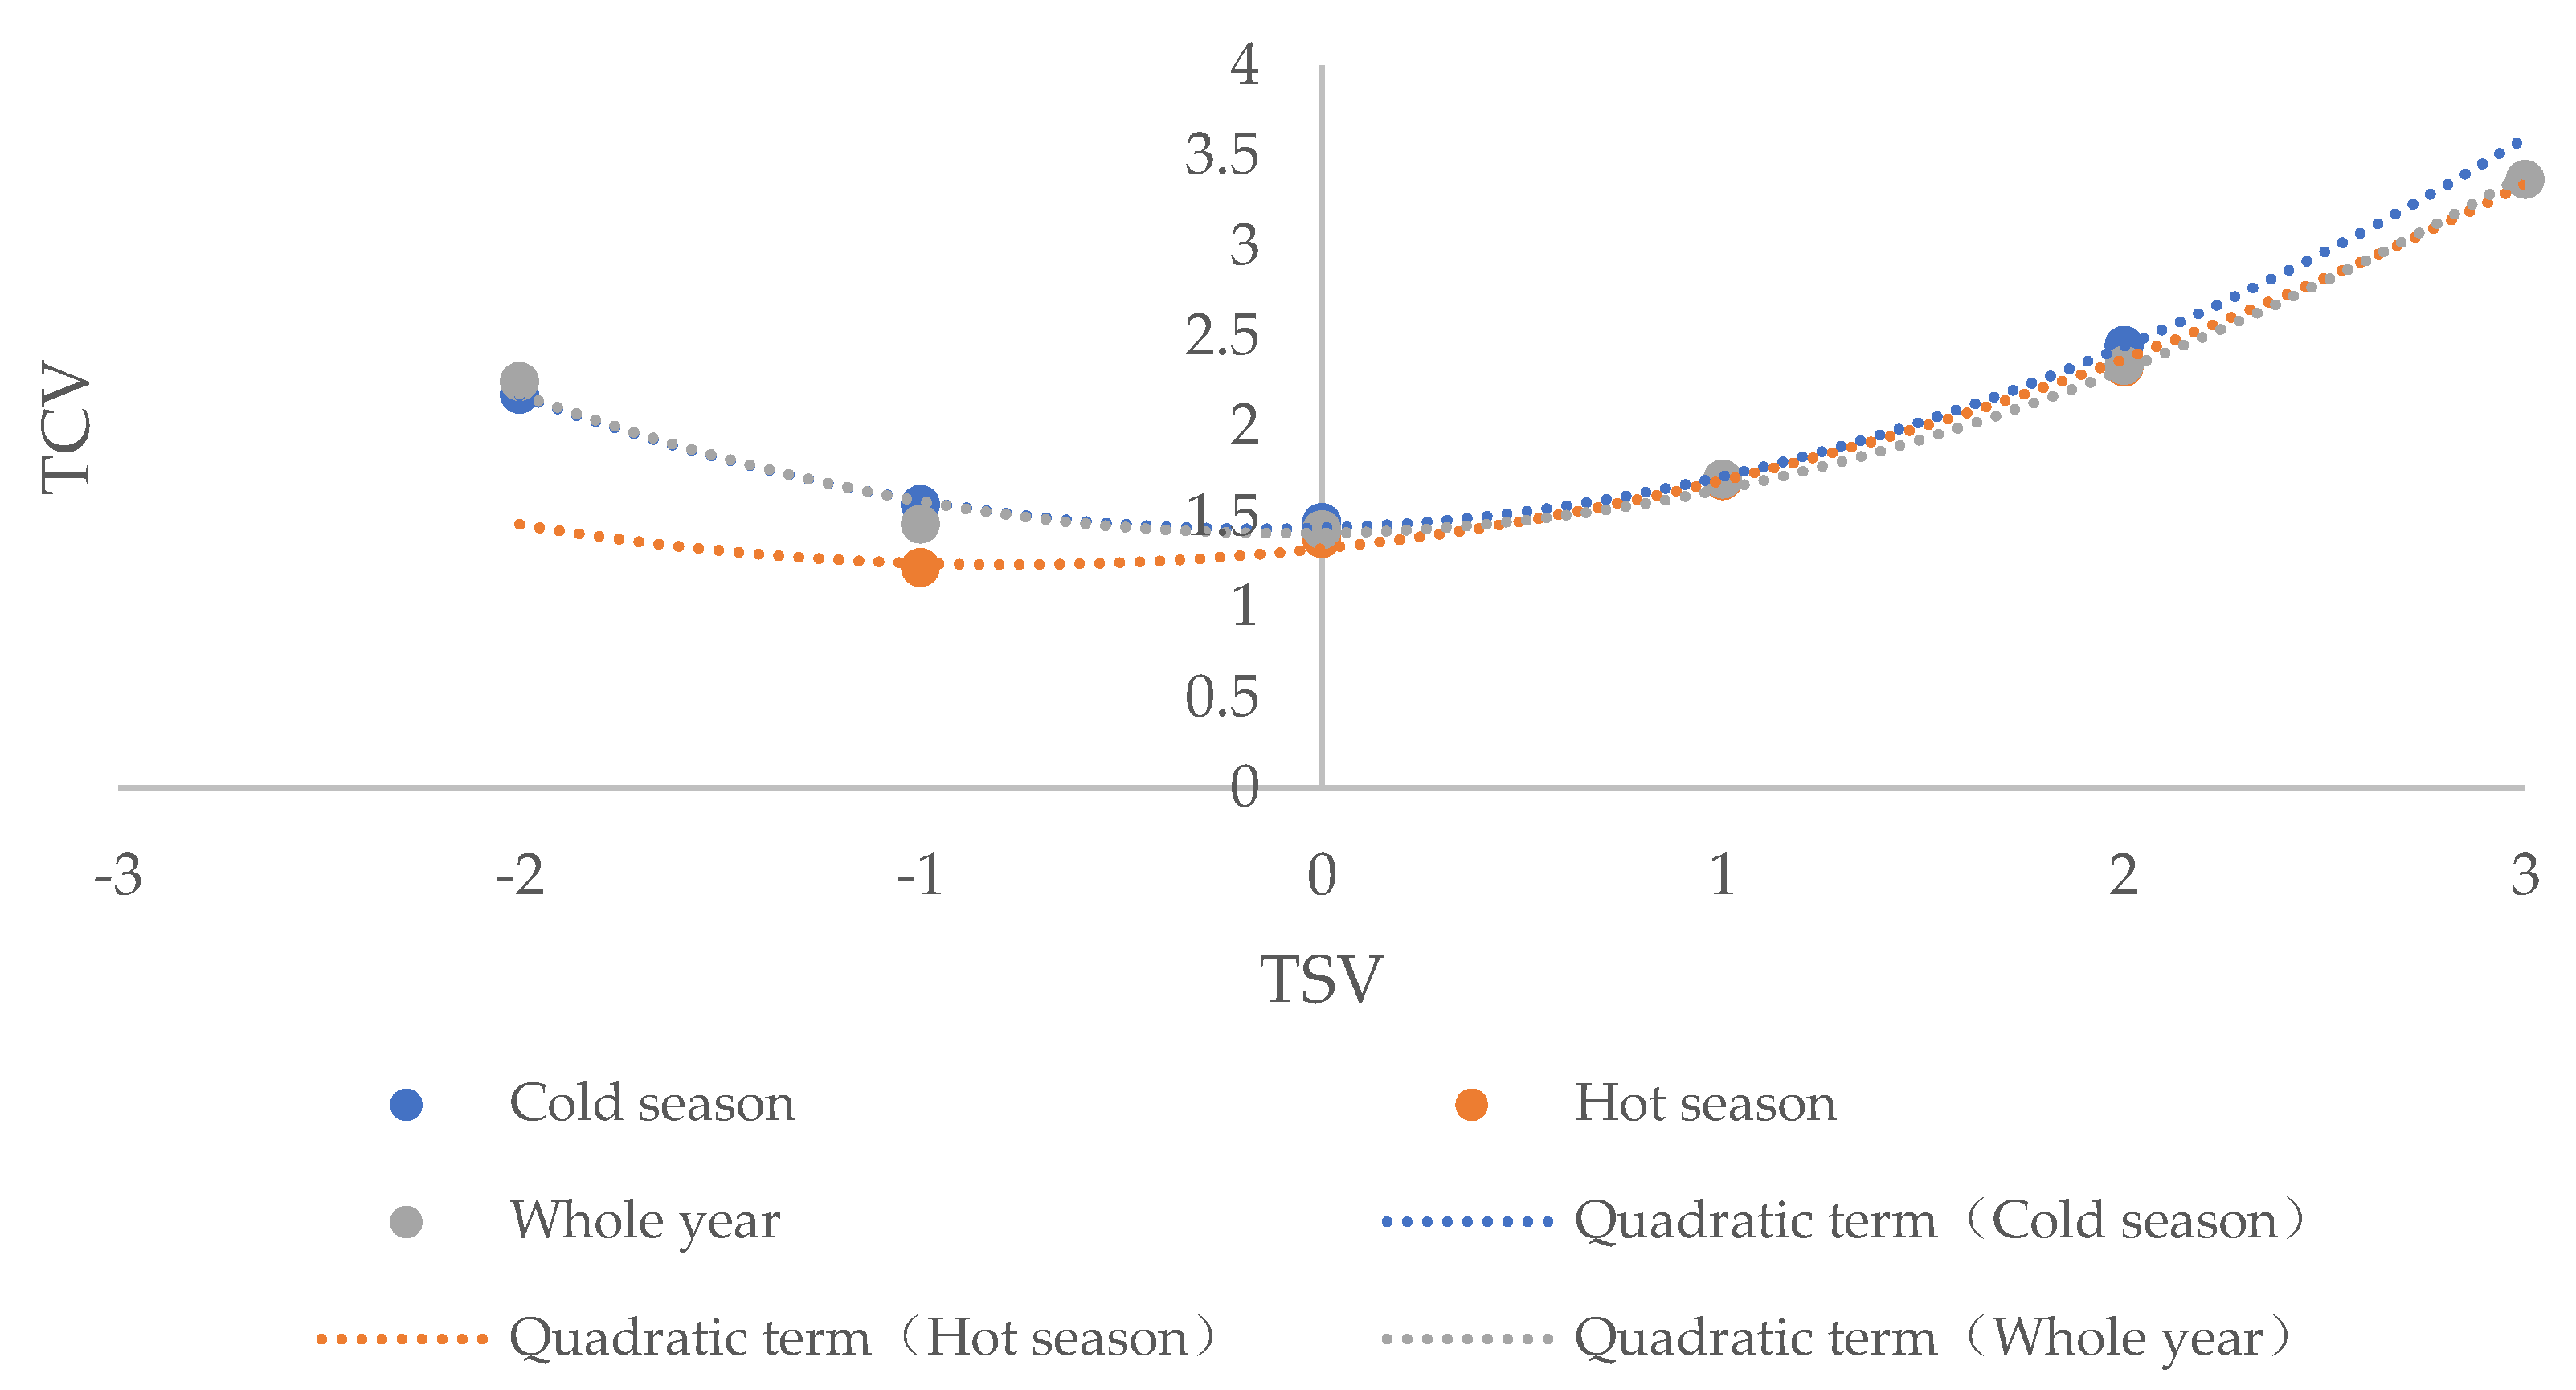
There was a strong correlation between TSV and TCV. Figure 8 shows the correlations between each TSV scale and the mean TCV corresponding to the different seasons. Through binomial curve fitting, the correlations can be expressed by Equations (5)–(7) as follows:
Hot season: TCV = 0.1479 TSV 2 + 0.2293x + 1.3271 (R² = 0.998)
Cold season: TCV = 0.2171 TSV 2 + 0.068x + 1.4417 (R² = 0.9978)
Year-round: TCV = 0.2096TSV2 + 0.0338x + 1.4126 (R² = 0.9906)
The most comfortable condition (TSV) was −0.78 in hot season, −0.16 in cold season, and −0.08 for the whole year, indicating that the correlation varied with the season. In the hot season, “slightly cool” was considered as a comfortable thermal sensation, and in cold season, it was “neutral”.
3.3. Thermal Acceptability and Thermal Preference
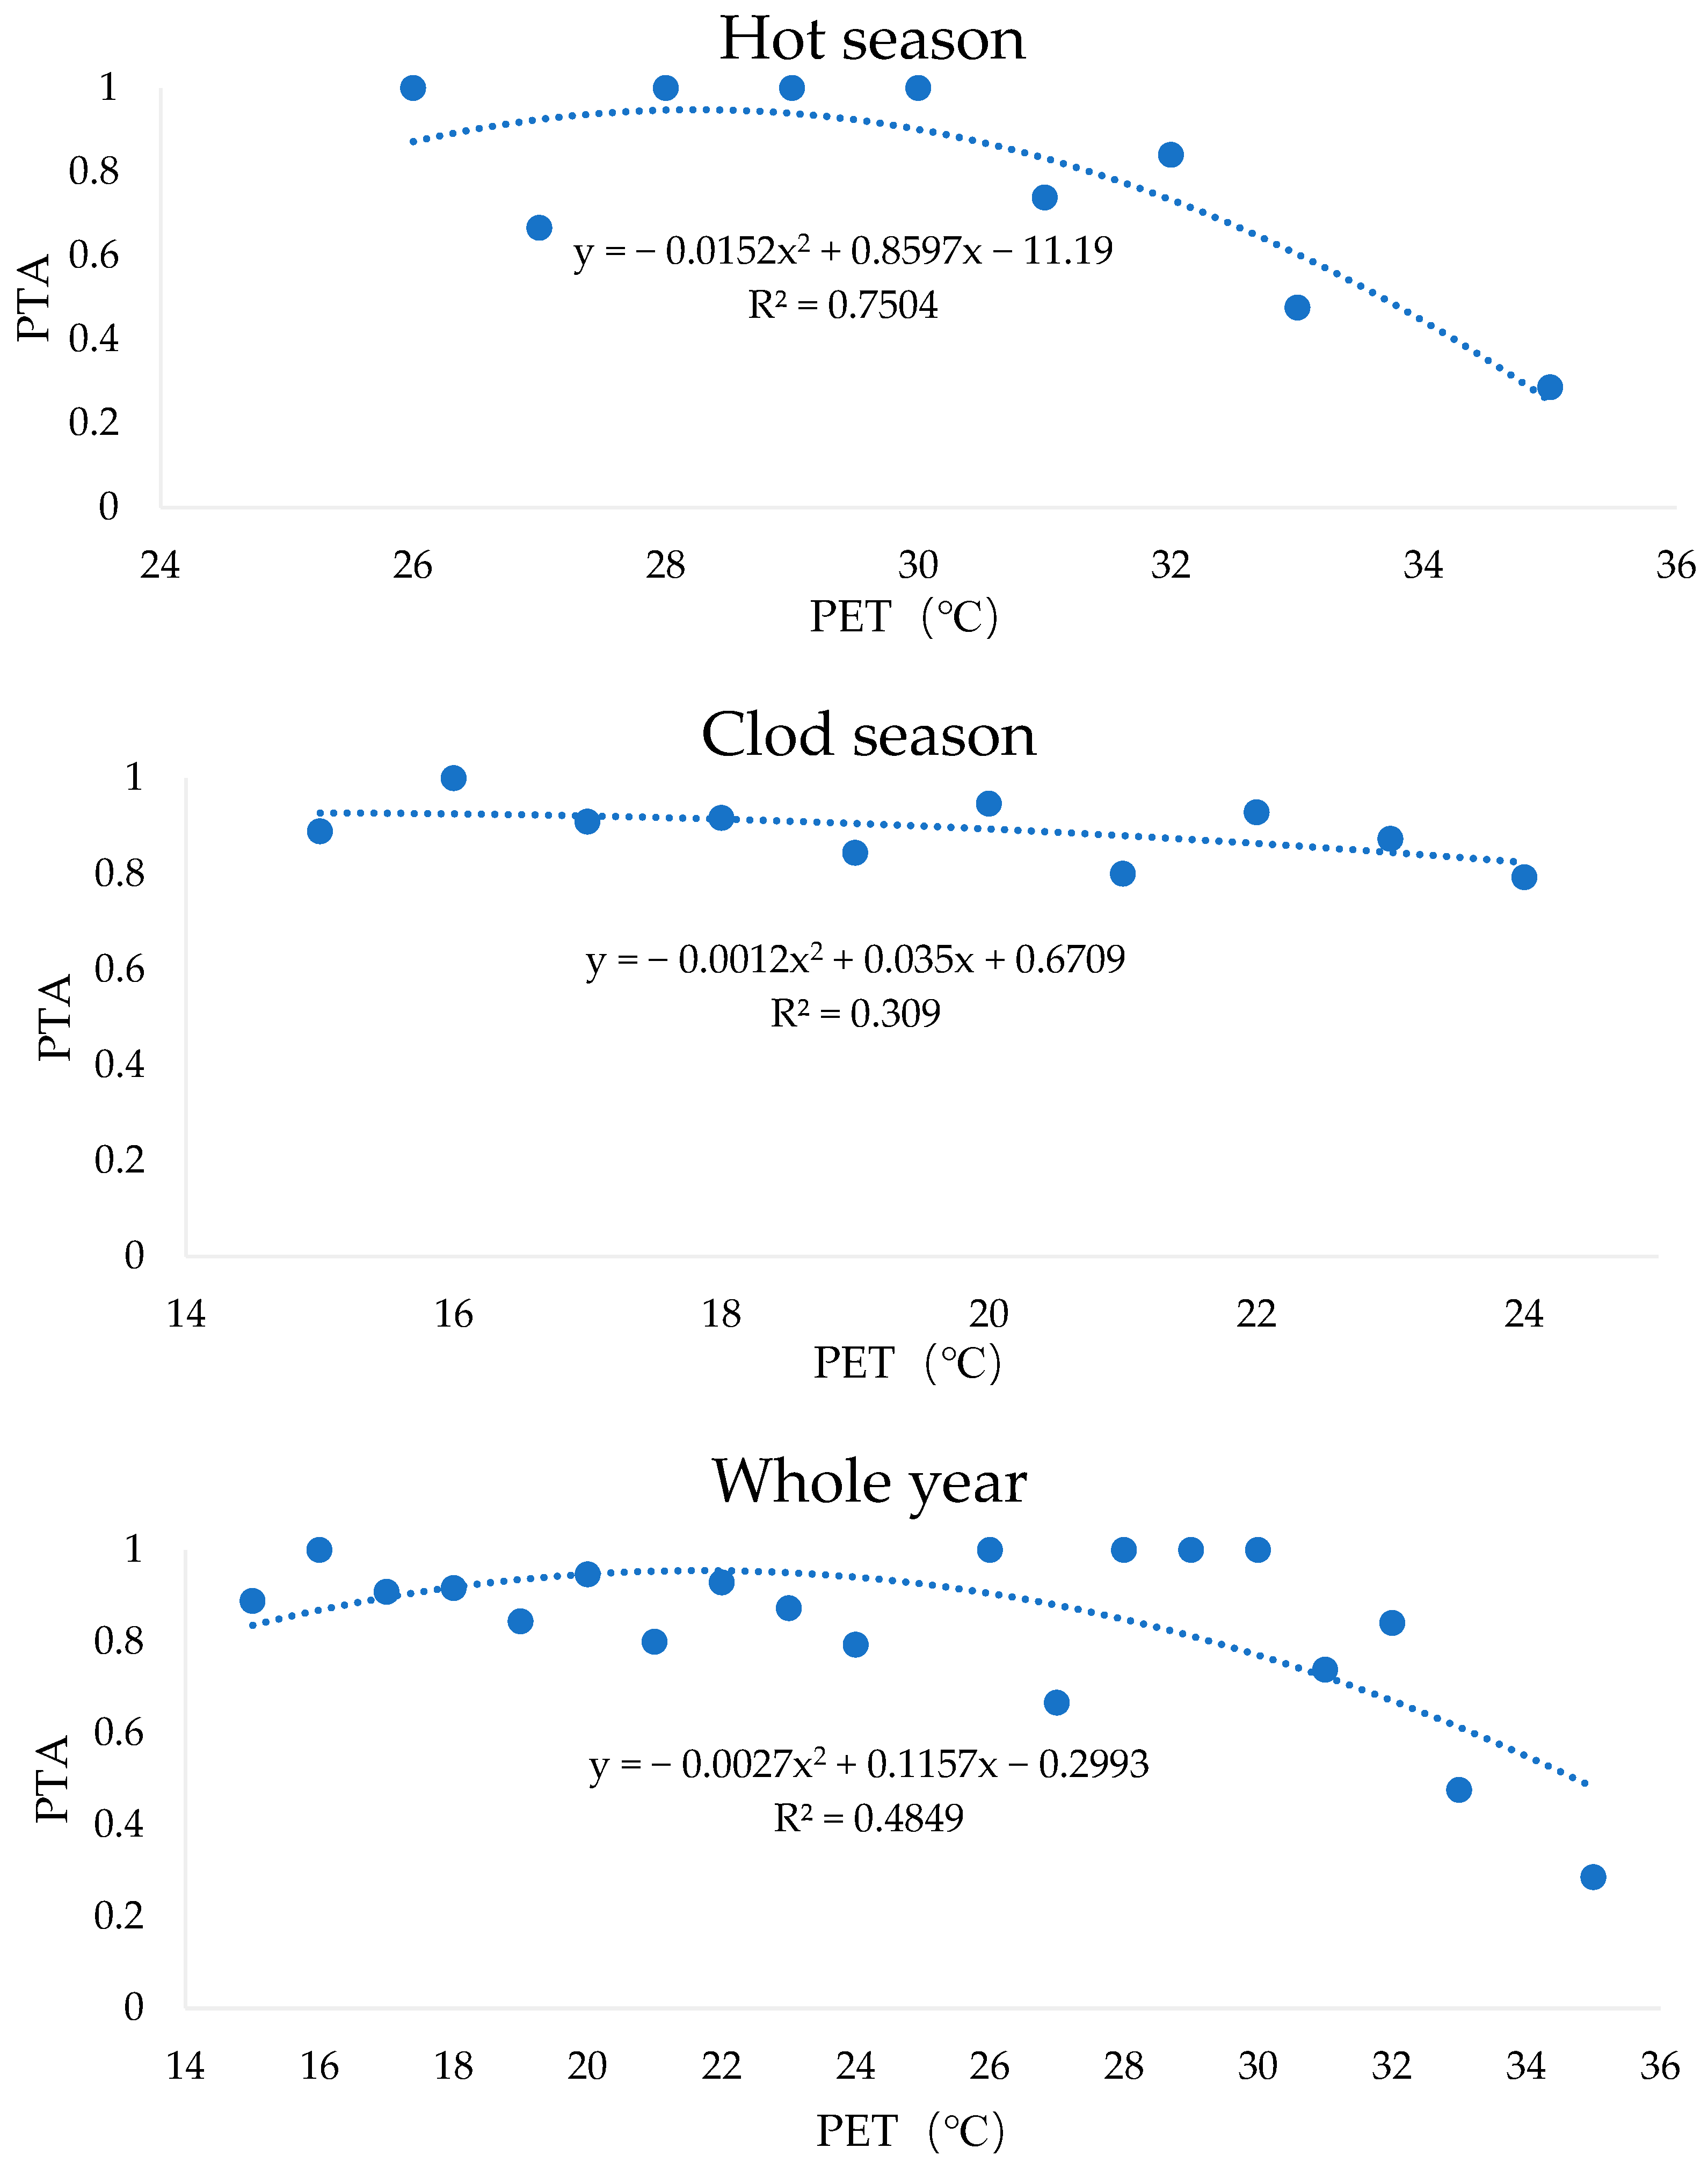
The relationship between the percentage of thermal acceptability (PTA) and PET is shown in Figure 9. ASHRAE 55 recommends that a thermal environment acceptable to 90% of the population is a comfortable thermal environment [46]. According to this criterion and the PTA-PET equation, the PET range acceptable to 90% of the population was 26.2–30.4 °C in hot season, 9.9–19.2 °C in cold season (probably due to clothing), and 17.6–25.3 °C for the whole year.
Terms such as “cold” and “warm” have slightly different meanings depending on the season. In the evaluation scale analyzed, TPV was more suitable than TSV to address seasonal semantic differences [34]. The correlation between TPV and TSV was analyzed, as shown in Table 7. The results indicated that TPV had a highly significant negative correlation with TSV for the whole year. The hotter the thermal sensation, the cooler the thermal preference, and vice versa. Moreover, the correlation between TPV and TSV was higher in cold season than in hot season.
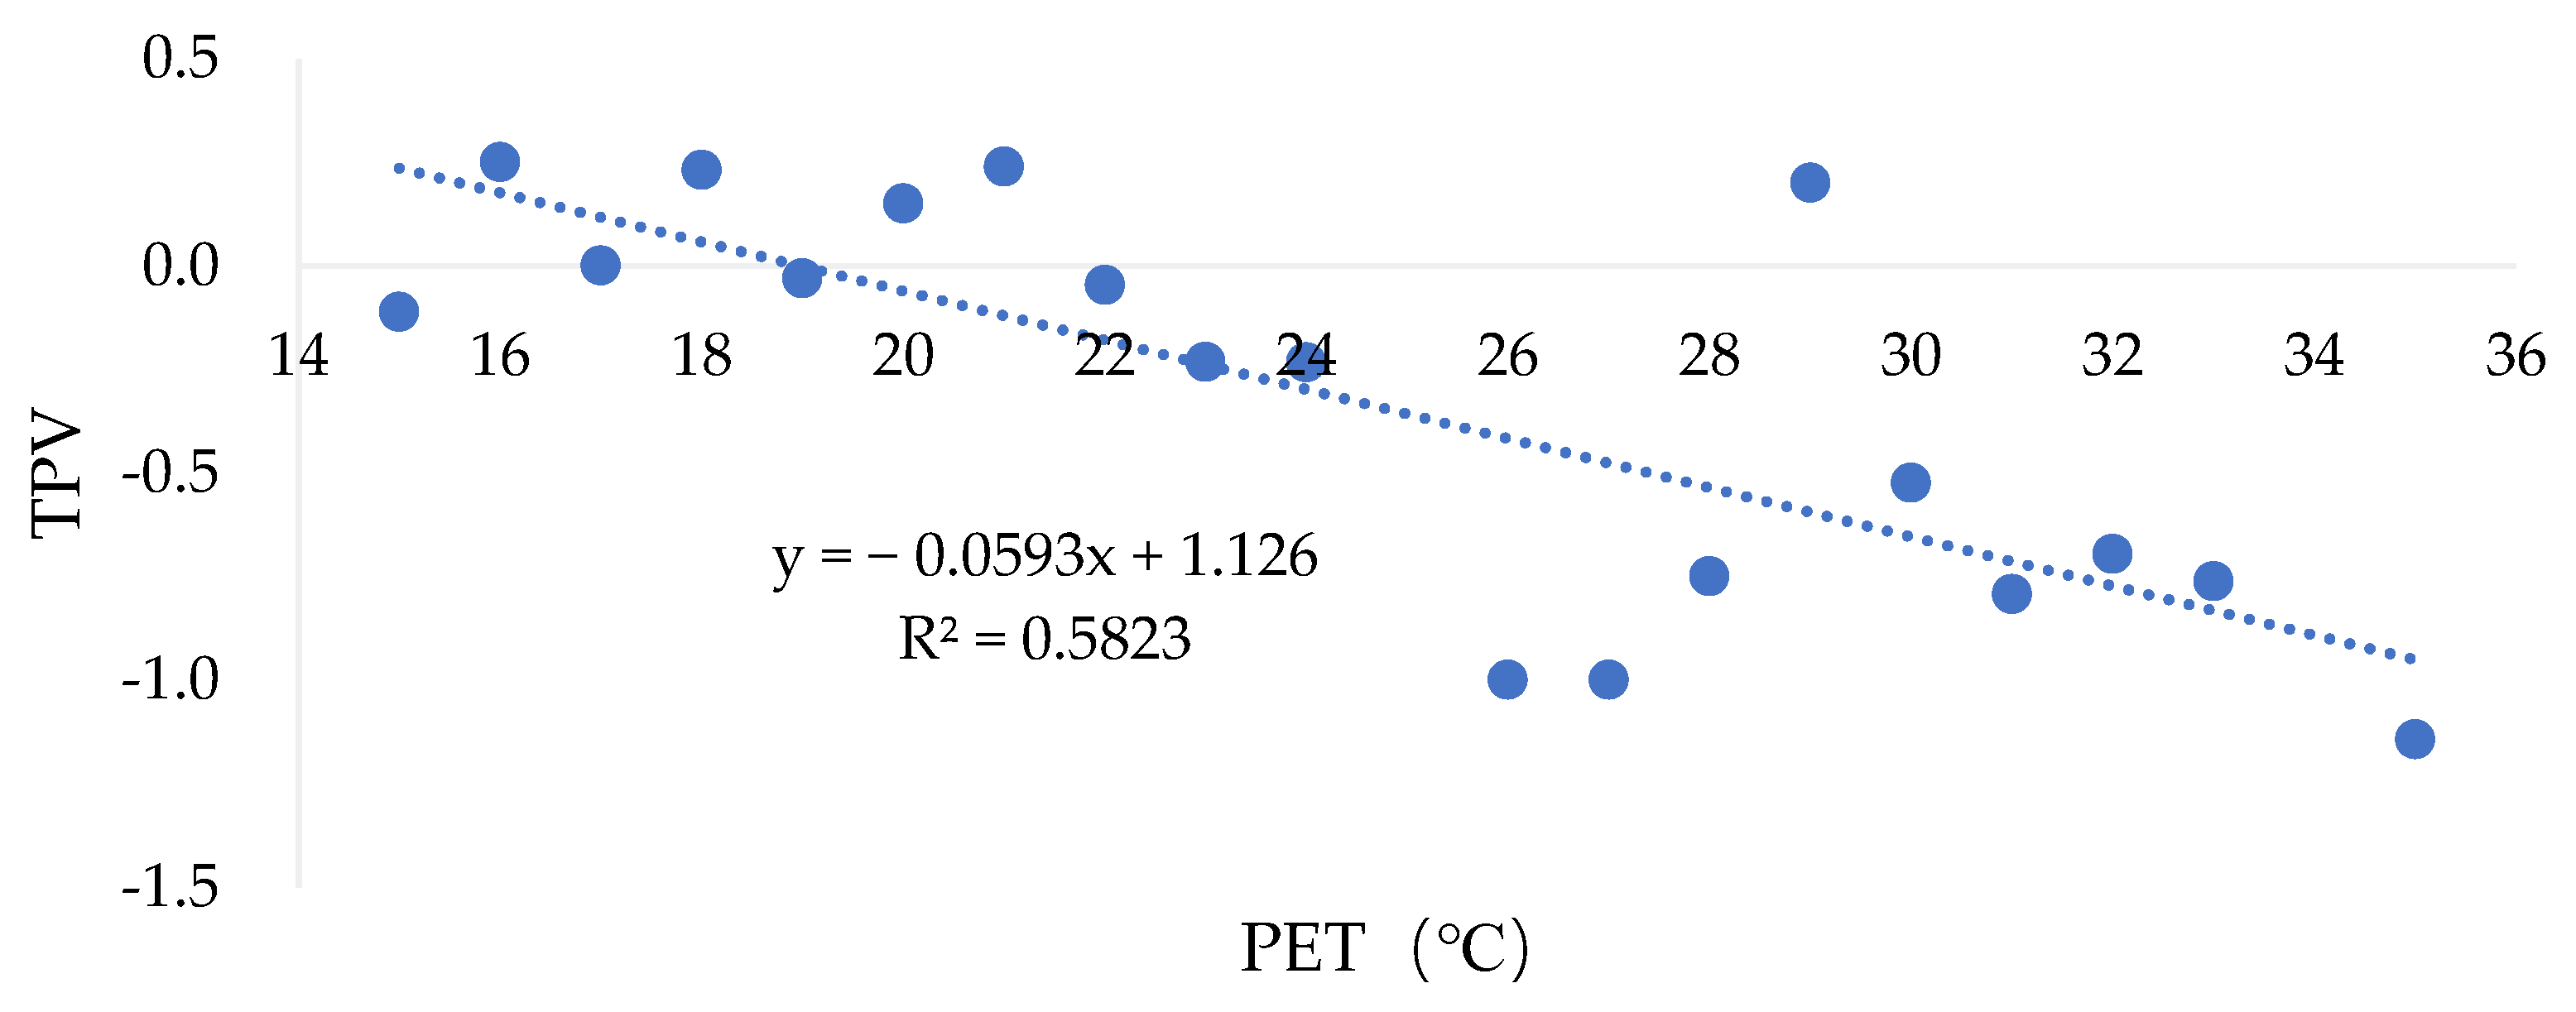
In hot season, the mean TPV was −0.73, and the median was −1.00, with the respondents’ thermal preferences close to “slightly colder”. In cold season, the mean TPV was −0.02, and the median was 0.00, with respondents’ thermal preference close to “no change”. In hot season, only 7% of the respondents chose “slightly hotter” or “significantly hotter” for thermal preference, and 73% chose “slightly colder” or “significantly colder” for thermal preference. Therefore, it was difficult to identify the preferred temperature in hot season. For the whole year, linear fitting was performed on the relationship between PET and TPV (Figure 10), as shown in Equation (8) below. It can be seen that the preferred temperature for the whole year is 19.0 °C.
TPV = −0.0593PET + 1.126 (R² = 0.5823)
3.4. Gender Differences
Due to differences in physiological structure, basal metabolic rate (BMR), and multiple environmental and psychological responses, the evaluation and requirements of the thermal environment vary between gender groups. Independent sample t-tests were conducted for TSV, TAV, TCV, and TPV to determine whether gender had a significant effect on weather perception. The results are shown in Table 8. Gender showed no significant effect on thermal perception, thermal comfort, thermal acceptability, and thermal preference in the independent seasons of hot season and cold season. However, it had a significant effect on TPV in the year-round analysis, with males expecting colder thermal environments than females.
3.5. Activity and Clothing
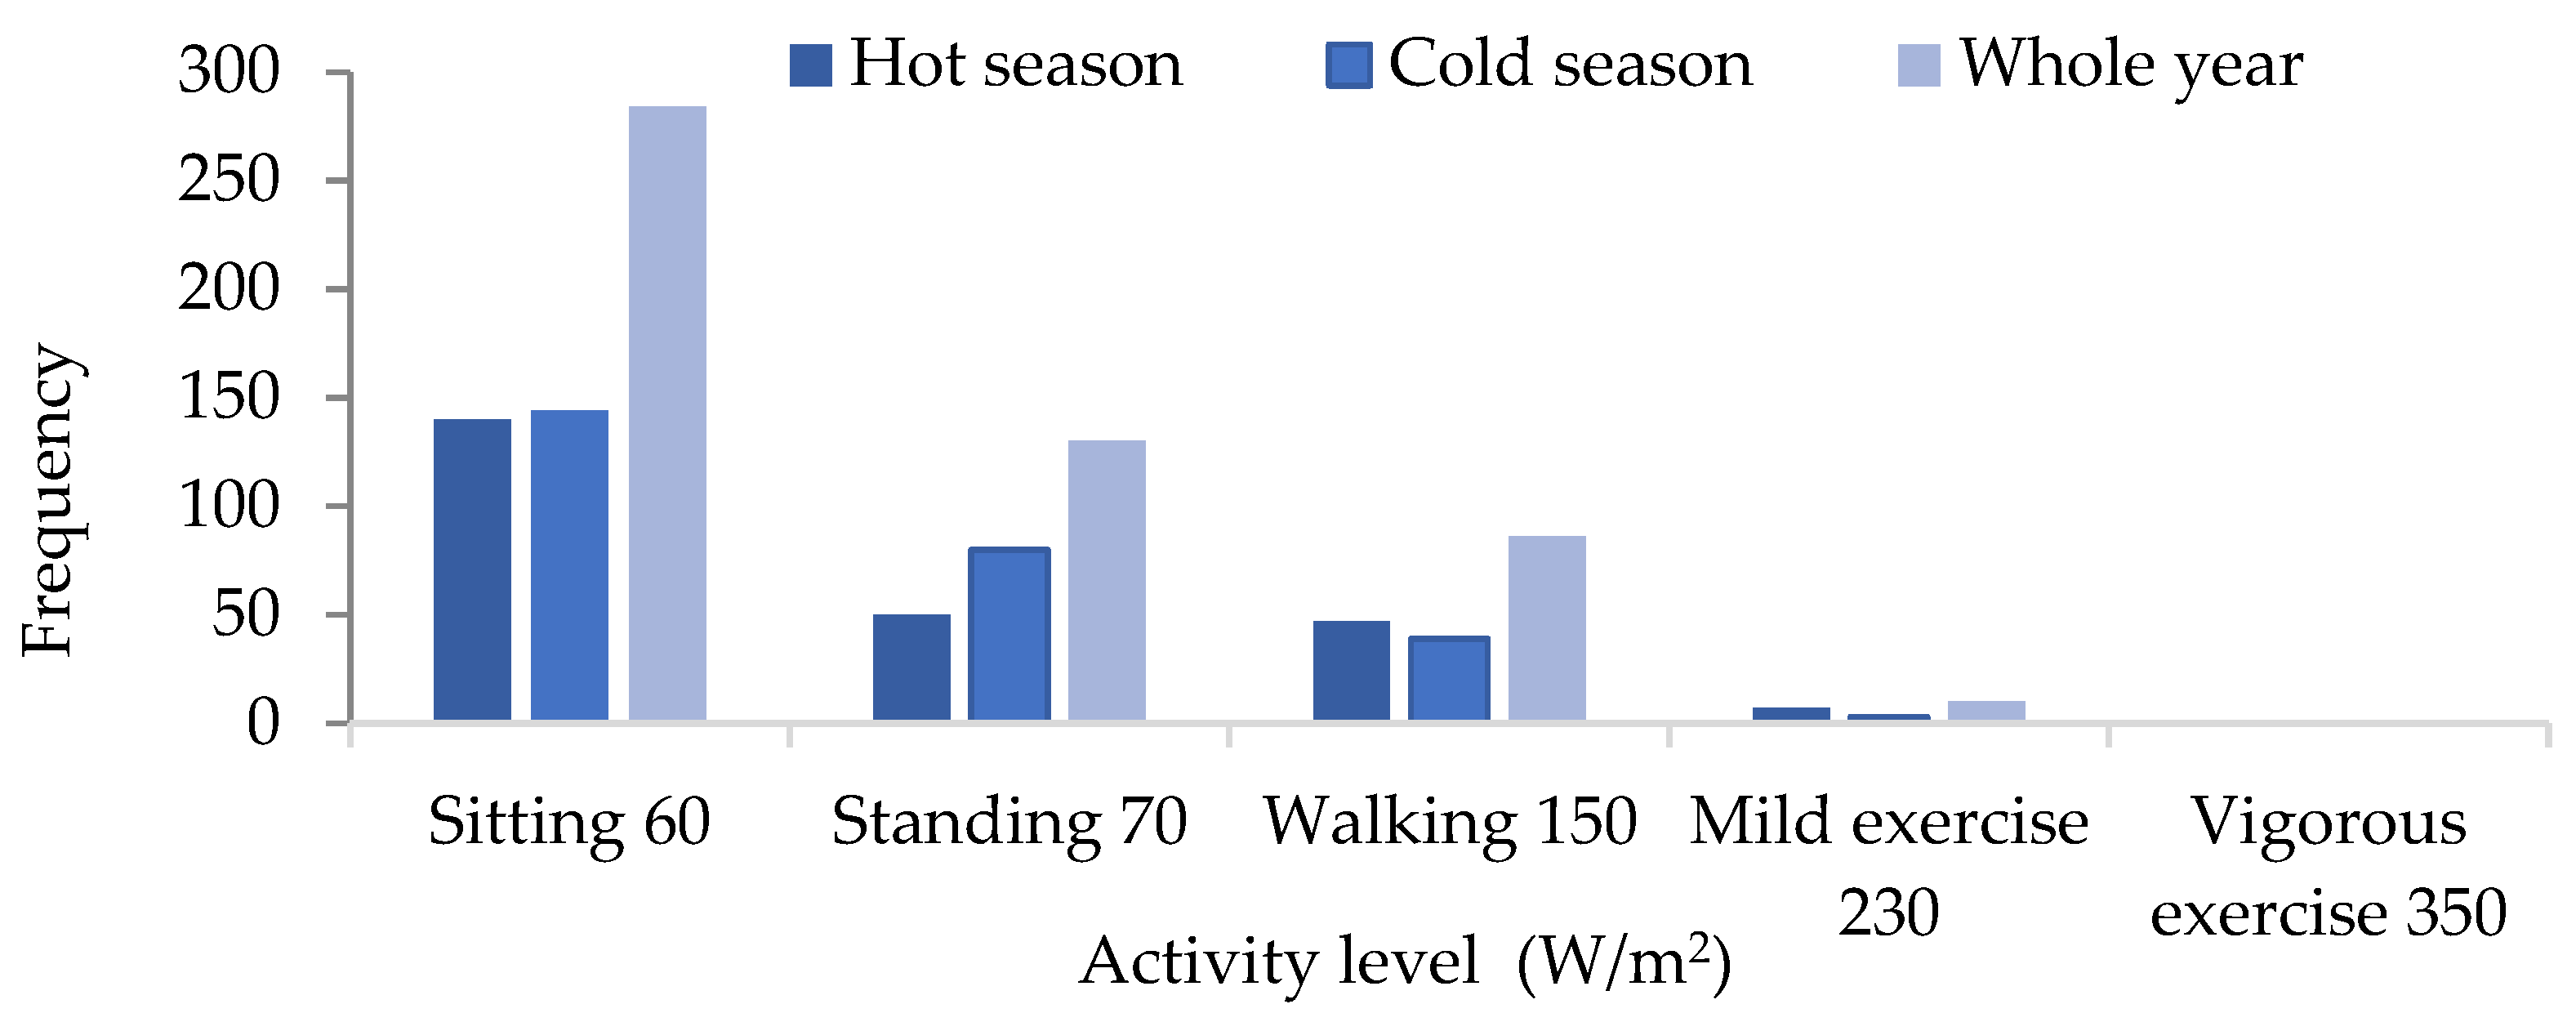
The distribution of activity frequency in the overhead spaces is shown in Figure 11. The mean activity level was 85.47 W/m2 in hot season and 77.14 W/m2 in cold season, so slightly higher in hot season than in cold season. The mean activity level for the whole year was 81.12 W/m2. The differences were analyzed with the respondent activity level as the grouping variable (excluding the 350 W/m2 data for vigorous exercise reported by only one respondent) and TSV, TCV, TAV, and TPV as analysis variables, as shown in Table 9. The results indicated that the level of activity had a significant effect on TSV, but no significant effect on TCV, TAV, and TPV. The greater the activity level, the higher the metabolic rate, and the greater the thermal sensation toward the hot side. The comparison between activity level groups is shown in Table 10, with a significant difference between mild exercise and other groups and no significant difference between other groups.
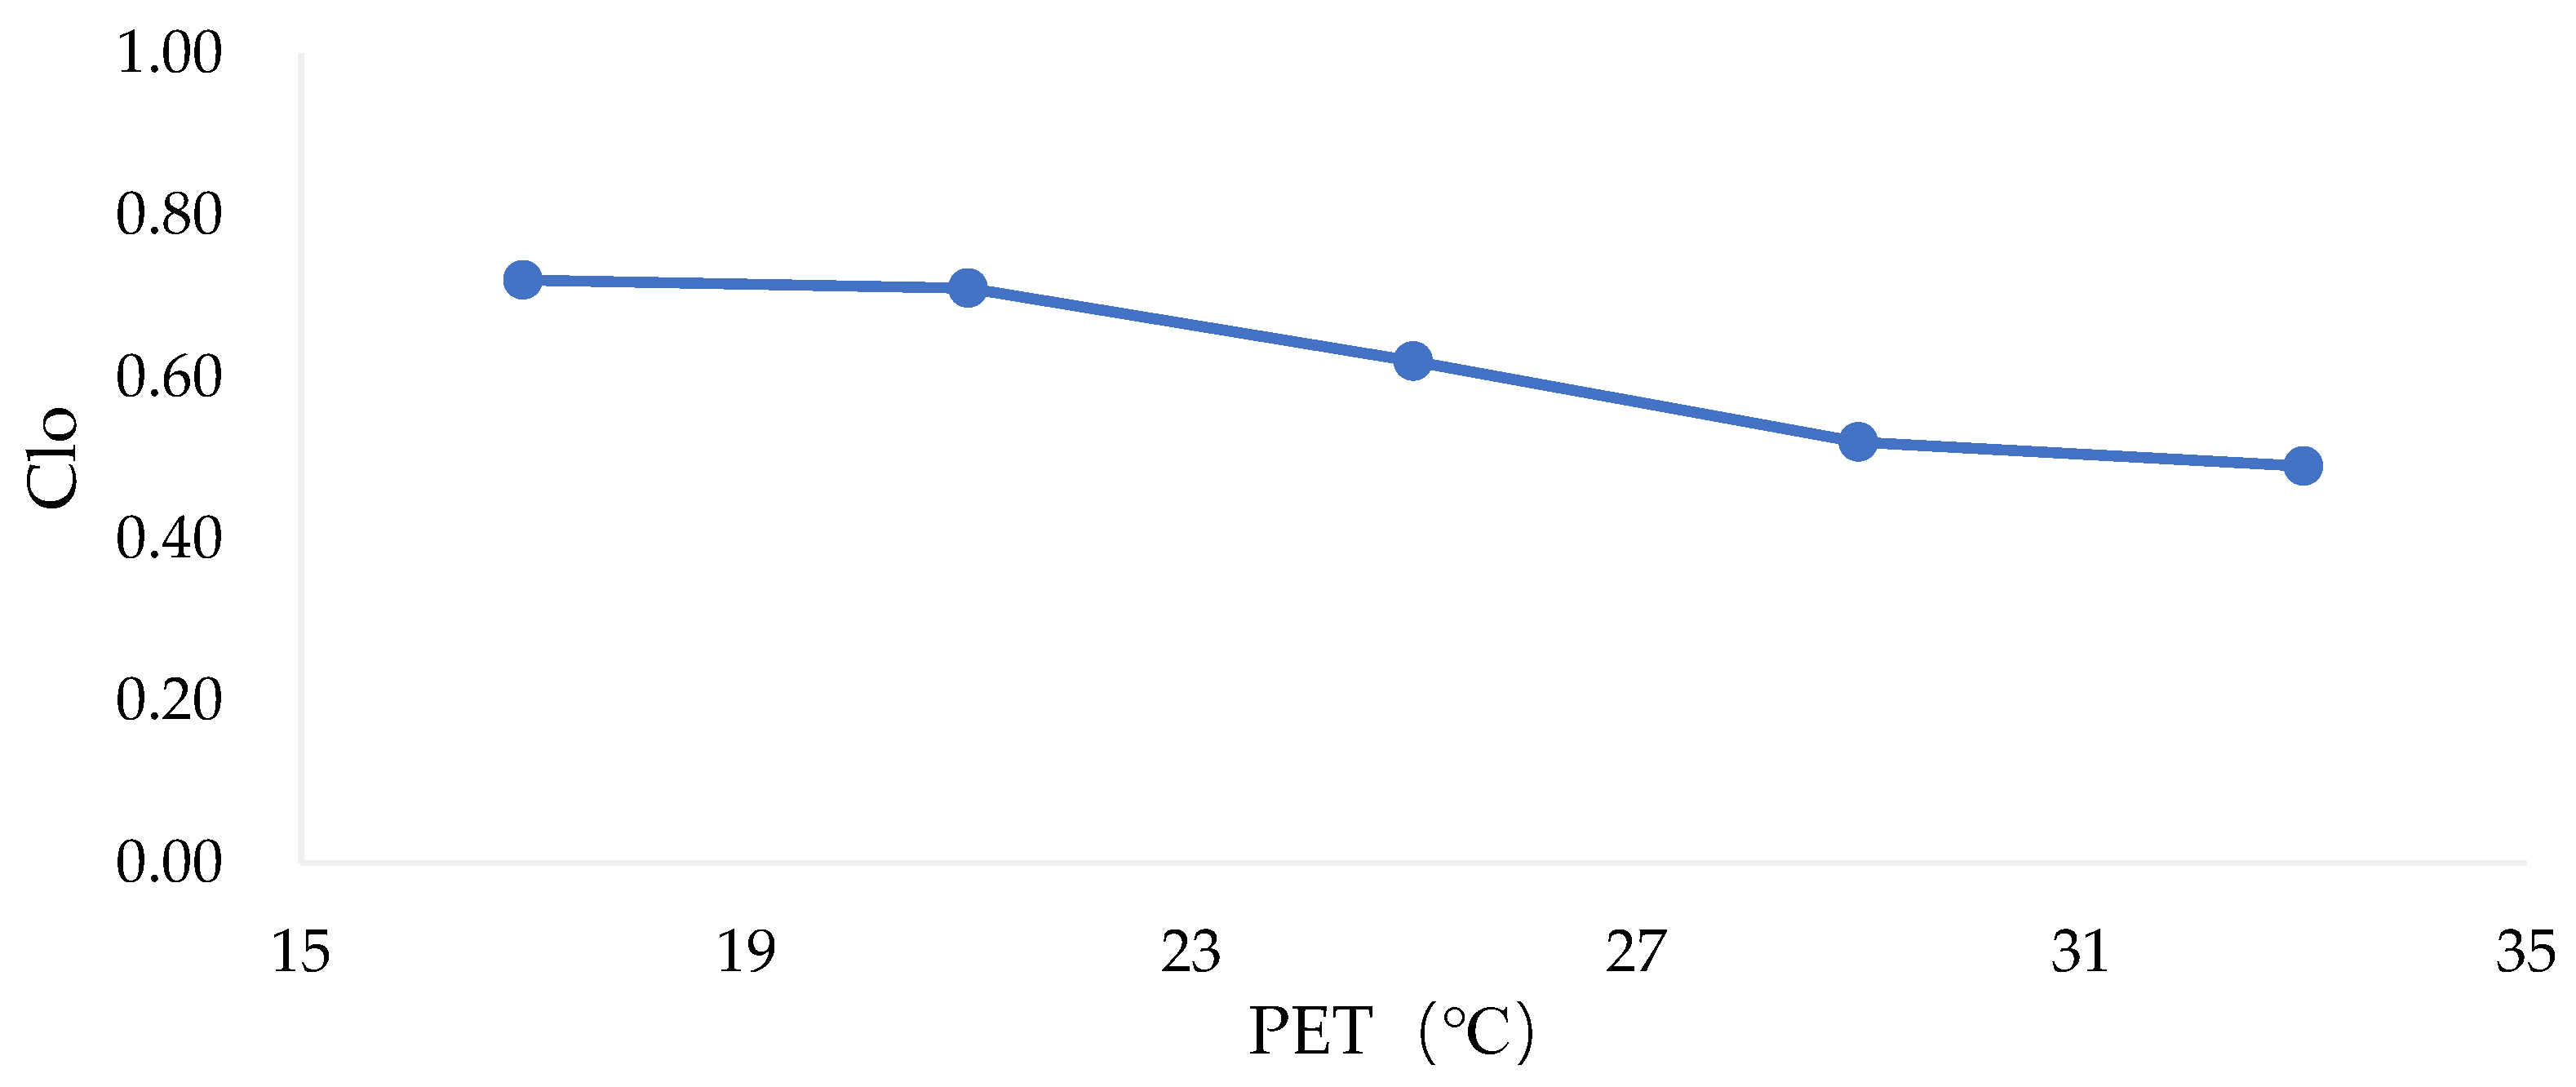
The mean clothing insulation in hot season, cold season, and the whole year were 0.48 Clo, 0.71 Clo, and 0.60 Clo, respectively, with standard deviations of 0.11 Clo, 0.18 Clo, and 0.19 Clo. The relationship between clothing insulation and PET was determined using PET as the horizontal coordinate and clothing insulation (Clo) as the vertical coordinate, as shown in Figure 12. The results indicated that clothing insulation did not vary significantly with PET in a single season of hot season and cold season; clothing insulation decreased with the increasing PET throughout the year, consistent with the study by Huang et al. [33].
3.6. Long-Term Thermal History and Short-Term Activity
Thermal history can be divided into long-term and short-term thermal history. The household registration locations of respondents were investigated in the questionnaire and classified into severe cold regions, cold regions, hot summer and cold winter regions, hot summer and warm winter regions, and mild regions according to the Thermal Design Code for Civil Buildings GB 50176-2016 [47]. Shenzhen falls into the hot summer and warm winter region. Among the valid questionnaires collected, the percentage of respondents living in this climate zone for a long time was 69%, and the total percentage of respondents in the remaining four types of climate zones was 31%. Difference analysis was performed on the respondents using the household registration regions as the grouping variable to see whether long-term residence had a significant effect on TSV, TCV, TAV, and TPV, as shown in Table 11. Results indicated that long-term residence had no significant effect on people’s TSV and TPV, but had a significant effect on TCV and TAV. Post hoc tests indicated that for TCV, there was a significant difference between cold regions and hot summer and warm winter regions, and a significant difference between mild regions and hot summer and cold winter regions. Respondents from cold regions and mild regions had higher thermal acceptability. For TAV, there was a significant difference between hot summer and cold winter regions and hot summer and warm winter regions. Respondents from hot summer and cold winter regions had higher thermal acceptability than those from hot summer and warm winter regions during the survey.
Meanwhile, the activity status of respondents in the first 15 min or so was investigated in the questionnaire and classified into four groups based on the respondent reports (walking, sitting, eating, and others) to see whether short-term thermal history had a significant effect on TSV, TCV, TAV, and TPV. One-way ANOVA difference analysis was performed, as shown in Table 12. The results indicated that short-term thermal history had a significant effect on TSV, but not on TCV, TAV, and TPV. That is, short-term thermal history in hot season had a relatively significant effect on people’s thermal sensation, and respondents who had performed certain activities in the short term felt that the current environment was a little bit hotter.
3.7. Adaptive Behavior
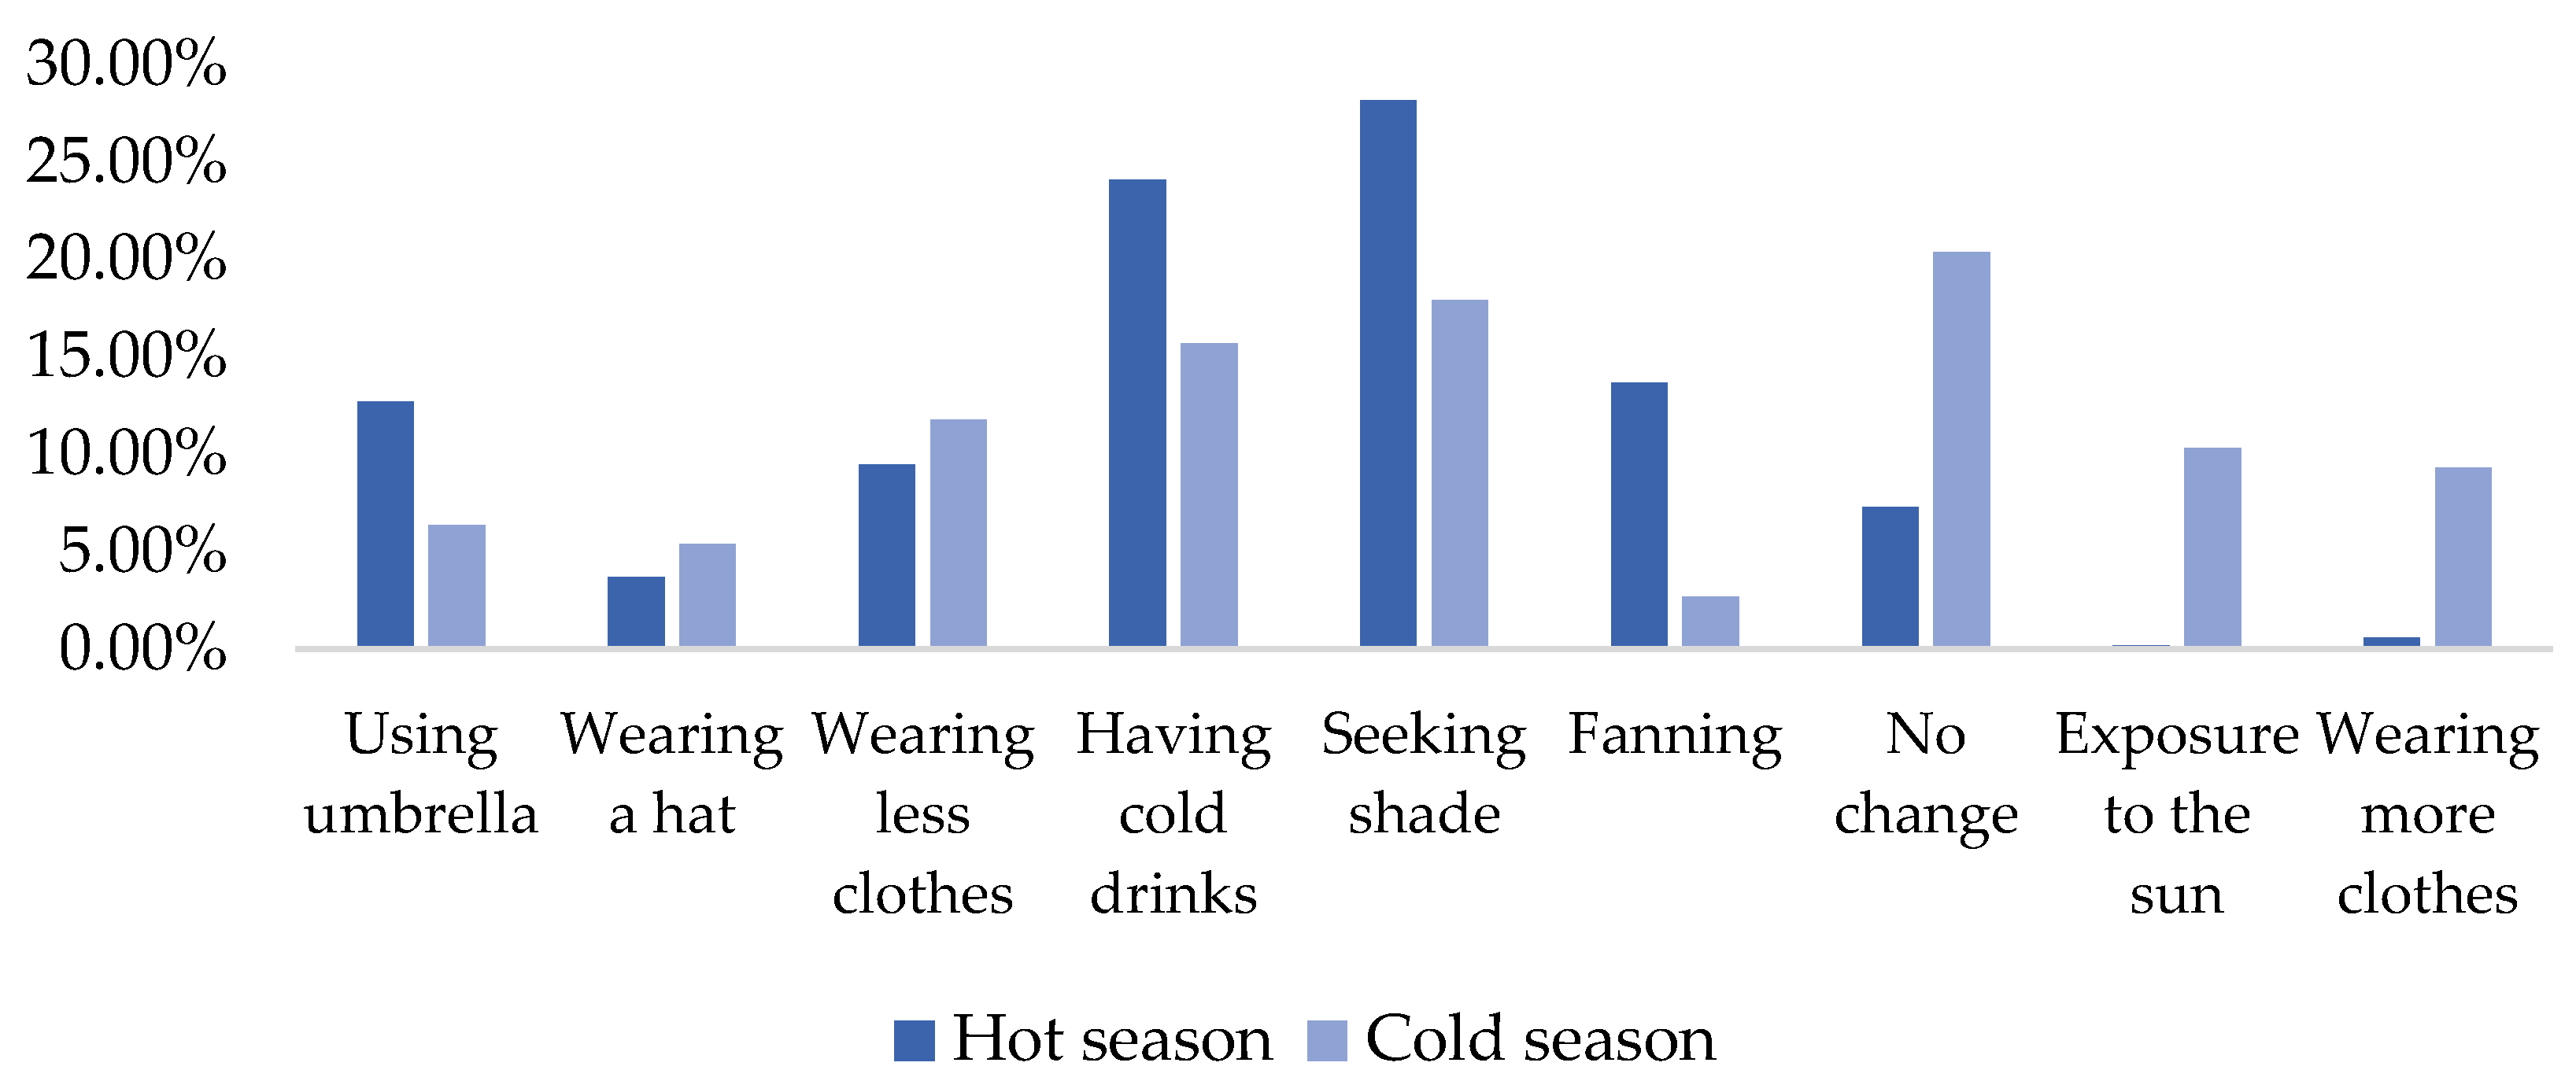
Nikolopoulou and Steemers pointed out that the concept of adaptation could be used to understand thermal comfort in outdoor and semi-outdoor environments effectively [9]. Brager and de Dear considered that thermal adaptation included behavioral, physiological, and psychological aspects [28]. Regarding short-term behavioral adaptation, respondents were asked about the measures they tended to take to regulate thermal comfort for the current thermal environment. The descriptive statistics are shown in Table 13, and the frequency distribution is shown in Figure 13. In hot season, the response rate of “no change” was 7.30%. In cold season, this value increased to 20.39%, indicating that the thermal environment in the overhead spaces was more comfortable in cold season than in hot season. In hot season, the highest response rates were “seeking shade” (28.20%) and “having cold drinks” (24.10%), and the response rates of these two options in cold season were still not low (17.94% and 15.72% respectively), indicating that there were still users who felt relatively hot in Shenzhen in cold season. The response rate of adaptive behaviors to adjust thermal comfort was the highest in both hot season and cold season. The comparison of cold season and hot season options of “using a sun umbrella” and “exposure to the sun” suggested that respondents in cold season were more comfortable being exposed to the sun than in hot season. In both hot season and cold season, there were users who chose “wearing a hat”, probably due to the function of hats, which could serve as sunshade in hot season and keep warm in cold season. In terms of clothing, respondents in both cold season and hot season chose “wearing less clothes”, but almost all respondents in cold season chose “wearing more clothes”. Moreover, the frequency of adaptive behaviors being selected (excluding the “no change” option) was 199.10% in hot season and 121.81% in the cold season. This might be due to the fact that respondents were more eager to adapt to their thermal environment in hot season, which was also confirmed by the selection rate of “no change” in different seasons as mentioned above.
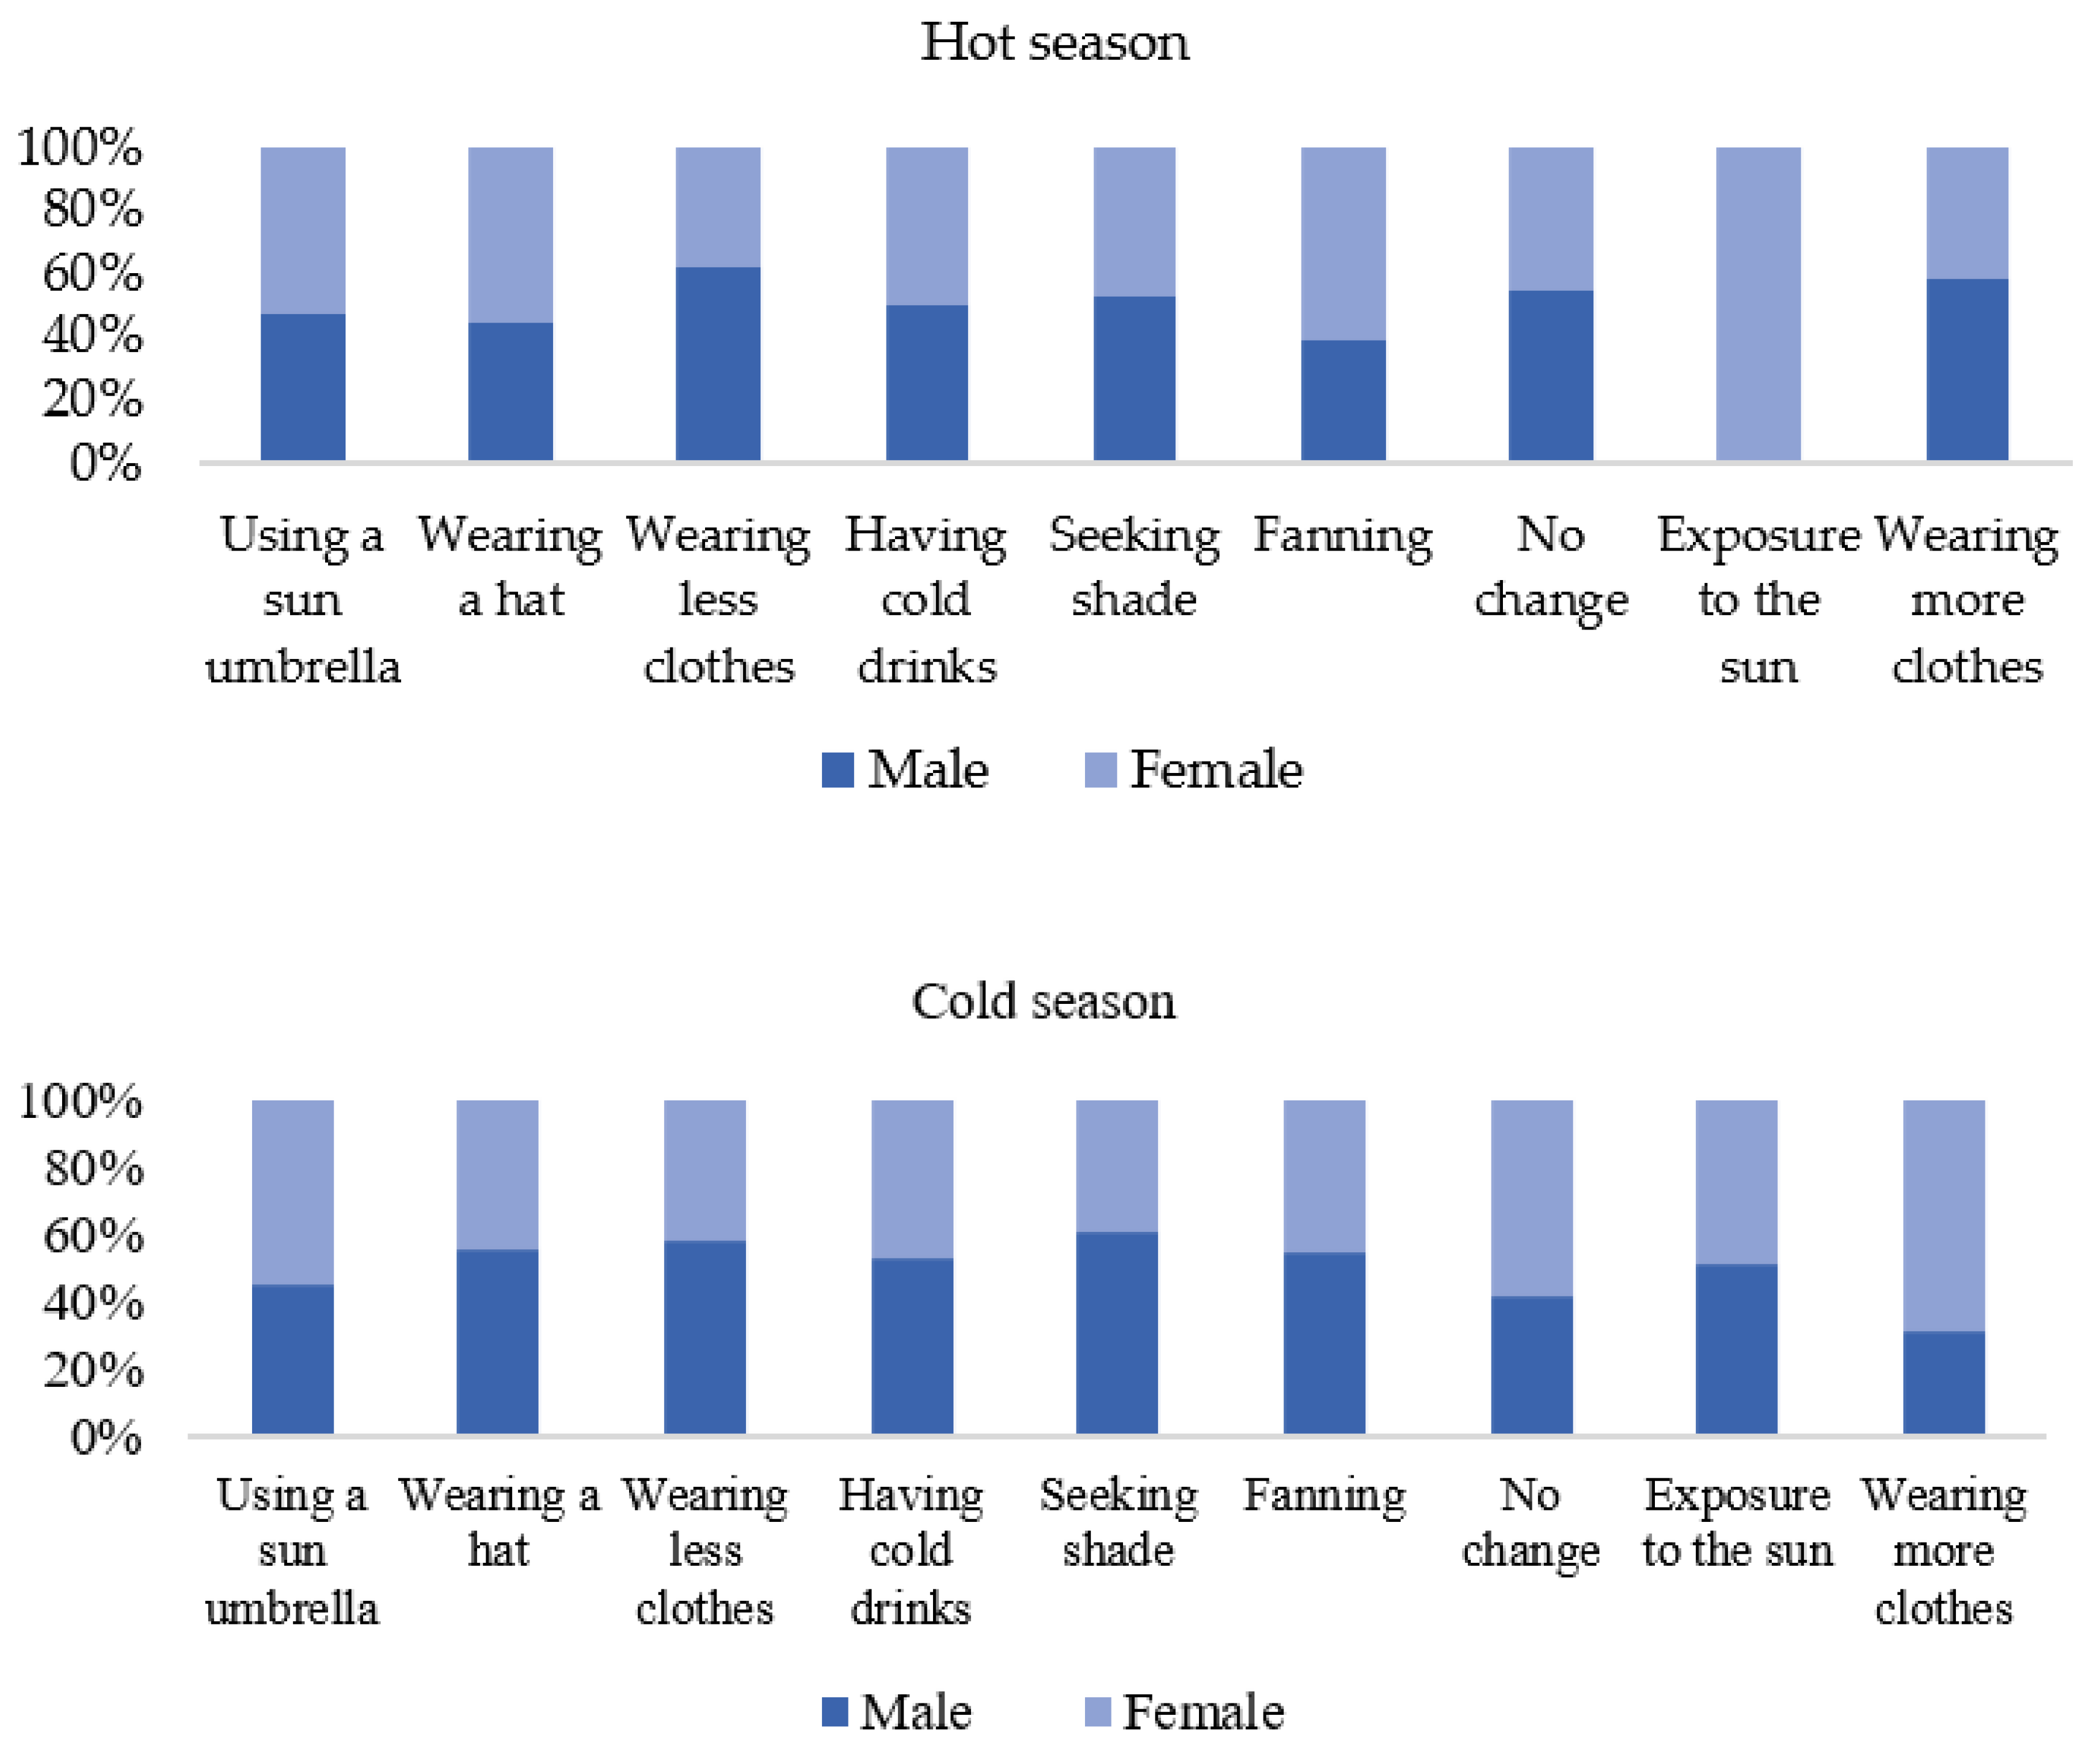
To understand the gender differences in the selection of adaptive behaviors, Figure 14 was created. Different genders showed a generally consistent trend in the options for each adaptive behavior. For individual options, if the ratio of two genders being greater than two was considered a significant difference, then female respondents were significantly more likely to respond with “wearing more clothes” than male respondents in cold season. Only one female respondent reported “exposure to the sun” in hot season, which may be a coincidence and will not be further discussed.
4. Discussion
4.1. Spatial Comparison
To understand the thermal characteristics of thermal environments in different spaces, studies with PET as a thermal comfort index in hot summer and warm winter regions of China were selected for comparison, as shown in Table 14. Green space and waterfront could effectively reduce PET in hot season. According to the study by Lin and Matzarakis for PET classification [48], Shenzhen fell into the subtropical region with a neutral range of 26–30 °C, and cool and warm ranges of 22–26 °C and 30–34 °C, respectively. The thermally acceptable range of PET was a set of cool, neutral, and warm intervals, i.e., 22–34 °C. In the present study, PET was mainly concentrated in 29–34 °C in hot season and 18–24 °C in cold season. Given the short cold season and long hot season in Shenzhen, the thermal comfort of overhead spaces in Shenzhen was essentially in an acceptable range throughout the year, indicating that the overhead spaces in Shenzhen could provide a comfortable thermal environment for users almost all year round. In the future design of overhead spaces, more green space and waterfront landscape elements should be incorporated to further optimize the thermal environment of overhead spaces.
4.2. Seasonal Differences in Thermal Sensation
According to the hypothetical classification by Lai et al. [52], statistics on the relationship between TSV and PET in different regions are shown in Table 15. The statistics on neutral PET and PET/TSV in different regions are shown in Table 16.
In this study, neutral PET was 28.3 °C in hot season and 23.3 °C in cold season. Neutral PET increased as the season shifted from cold to hot, consistent with the results for Tianjin [52], Taichung [53], Hong Kong [44], Rome [54], and Cairo [55]. The studies in these regions concluded that people’s thermal sensation changed with the season and that inhabitants’ tolerance to the thermal environment in hot season increased, so neutral PET increased. However, studies in Damascus [56] and Sydney [17] had different results: neutral PET decreased as the season shifted from cold to hot. Latter studies suggested that differences in thermal sensation preferences across seasons could be attributed to the concept of “synesthesia” which indicates that warm sensations were perceived as more comfortable than cool ones during the cold season, and vice versa during the hot season. Different climatic conditions, ethnicity, and cultural practices were all possible factors contributing to the differences in neutral temperature in various regions.
In addition, the slopes of PET corresponding to TSV in each season in this study were 0.28 in hot season, 0.09 in cold season, and 0.10 for the whole year, respectively. The TSV/PET was 3.6 °C in hot season, 11.1 °C in cold season, and 10.0 °C for the whole year. This suggested that the TSV of respondents was more sensitive in hot season, insensitive in cold season, and in-between throughout the year, indicating that this experience changed their perception of the thermal environment. The same phenomenon was observed in Hong Kong [44] and Rome [54]. The cold season PET/TSV was 8.4 and 8.5, and hot season PET/TSV was 7.3 and 5.9, respectively. Other studies such as Tianjin [52], Taichung [53], and Damascus [56] reported different phenomena (Table 16). PET/TSV in cold season was 5.3, 5, and 8.8, and PET/TSV in hot season was 10, 8.4, and 16.7, respectively. Thermal sensitivity was a complex issue, involving multiple factors, such as local climate, physical (activities and clothing), and psychological (experience and expectations) aspects.
4.3. Thermal Comfort and Comfort PET Range
In hot season, a slightly cool thermal sensation (TSV = −0.78) was considered more comfortable than a neutral thermal sensation (TSV = 0). Similarly, in cold season, the most comfortable thermal sensation is not neutral (TSV = 0) strictly, but TSV = −0.16. This suggested that the optimal thermal sensation would change with the season, and neutral thermal sensation was not the situation where the respondents felt most comfortable. The neutral temperatures were 28.3 °C and 23.3 °C in hot season and cold season, respectively, while the optimal temperatures were 25.5 °C and 21.4 °C in hot season and cold season, respectively, which were 2.8 °C and 1.9 °C lower than the neutral PET. The seasonal thermal preferences found in this study differed from those by Lai [52] and Li [57]. Lai found the most comfortable TSV to be 0.86 in the cold season, 0.08 in the transition season, and −1.07 in the hot season. Li found the most comfortable TSV to be 1 in the cold season, 0.2 in the transition season, and −0.3 in the hot season. This may be due to the geographical locations and climatic conditions of Shenzhen and Tianjin, where the temperature conditions in hot season had no significant difference, but the climate of Shenzhen in cold season may be more similar to that of Tianjin in the transition season (close to TSV = 0).
The acceptable PET range for 90% of the population in this study was 26.2–30.4 °C in hot season, 9.9–19.2 °C in cold season, and 17.6–25.3 °C for the whole year. The mean monthly temperature in Shenzhen was 15.1–29.0 °C PET. Lin found in a study of the humid subtropical region in Taiwan [53] (mean monthly temperature is 13–29 °C) that the acceptable PET range for 90% of the population was 21.3–28.5 °C PET. The acceptable PET range for 90% of the population in Europe [58] (mean monthly temperature is 2–20 °C) was 18–23 °C. The acceptable PET range for 90% of the population in Guangzhou [57] (mean monthly temperature is 2–20 °C) was 18.1–31.1 °C. The results of Shenzhen were closer to those of Guangzhou and Taiwan, which were significantly wider than those of Europe. This may be due to the fact that Shenzhen, Guangzhou, and Taiwan are classified as hot summer and warm winter regions, which differ significantly from the European climate.
4.4. Gender Differences
The results of the t-test for TSV and TCV by gender showed that gender may not be related to TSV and TCV. This result supported Huang’s survey in Mianyang [33], different from the results obtained by Donnini [59] and Tung et al. [60]. Donnini investigated the neutral temperature of different genders in southern Quebec and found that the neutral temperature of females was 0.3 °C higher than that of males. Tung et al. found in their study in Taiwan that the neutral temperature of females was 0.9 °C lower than that of males. Hence, the effect of gender on thermal sensation may be influenced by regional differences and ethnicity. The t-test results of TPV by gender indicated that gender differences had a significant effect on TPV, with males preferring colder thermal environments than females.
4.5. Adaptive Behaviors
The regulation of thermal comfort through clothing is the most frequently considered and fundamental. Wearing more or less clothing is the most direct way for people to regulate thermal comfort, which has been verified by many studies [61]. For the whole year, clothing insulation (Clo) decreased gradually with the increasing PET, and vice versa. However, this was not obvious within a single season. Similarly, in terms of activity, adaptive behaviors with seasonal changes were also demonstrated. People were more active in hot season than in cold season. This suggested that people tended to conduct non-indoor activities in hot season, while preferring indoor activities or reducing activity levels when the temperature dropped in cold season, consistent with the study conducted by Huang et al. [33] in Mianyang.
5. Conclusions
In this paper, a field study was conducted on the thermal comfort and adaptive behaviors in the overhead spaces of SZU in different seasons, using a combination of actual measurement and questionnaires. It has enriched the literature on thermal comfort of semi-open spaces in hot summer and warm winter regions and expanded the research theory concerning the planning and design of campus activity spaces based on climate adaptation. The results of the study may be useful for building planning practices in hot summer and warm winter regions and provide partial references for campus planning and design. The main conclusions of this study are as follows.
In the aspect of thermal sensation, overhead spaces in Shenzhen can provide users with a comfortable thermal environment nearly all year round. The mean PET was 31.2 °C in hot season, 20.9 °C in cold season, and 25.8 °C for the whole year. The neutral temperature was 27.7 °C in hot season, 23.3 °C in cold season, and 23.2 °C for the whole year. The preferred temperature for the whole year was 19.0 °C. In hot season, people felt more comfortable with a lower PET and 90% of the people had an acceptable PET range of 26.2–30.4 °C. In cold season, people’s thermal sensation did not change significantly with PET and the acceptable PET range for 90% of the population was 9.9–19.2 °C. Throughout the year, the acceptable PET range for 90% of the population was 17.6–25.3 °C. As the season shifted from cold to hot, neutral PET increased. In both hot season and cold season, slightly cool (TSV = −0.78) and neutral (TSV = −0.16) thermal sensations were considered more comfortable than neutral ones (TSV = 0).
In the aspect of possible influences on thermal comfort, gender was not related to TSV, TCV, TAV, but related to TPV, with males expecting a colder thermal environment than women. In hot season, the mean activity level of respondents was 85.47 W/m2, and the mean clothing insulation was 0.48 Clo. In cold season, the mean activity level of respondents was 76.87 W/m2, and the mean clothing insulation was 0.71 Clo. The relationship between activity and PET was not significant within independent seasons of hot season or cold season. Similarly, clothing insulation values did not vary significantly with PET within independent seasons. Throughout the year, clothing insulation decreased slightly with the increasing PET. Long-term residences had no significant effect on people’s TSV and TPV, but a significant effect on TCV and TAV. Respondents from cold and mild regions had higher TCV, while those from hot summer and cold winter regions had higher TAV to the environment than those from hot summer and warm winter regions.
Regarding the aspect of adaptive behaviors, the response rates of “seeking shade” and “having cold drinks” were significantly higher than the other options, indicating that people’s adaptive behaviors could be performed from changing both the physical environment and their own metabolism. The desire to adjust thermal comfort was stronger in hot season than in the cold season.
Based on the above, some observations are as follows: (1) The optimum TSVs in the hot season and the cold season are −0.78 and −0.16 respectively. Considering the long hot season and the short cold season in Shenzhen, greater consideration should be given to measures to reduce PET in the hot season when designing overhead spaces. The hot season is more sensitive to sunlight, and the addition of shading facilities can increase the usable area of the overhead spaces in the hot season. (2) People in different regions have significant differences in TCV and TAV. In a university campus with diverse populations, it is necessary to fully understand the thermal comfort threshold of people from various regions and to capture the diversity in the design of overhead spaces, so as to provide a comfortable experience for a wider range of people. (3) The cold season in Shenzhen is different from most areas in China, and most users still do not feel cold. Therefore, when designing the overhead spaces in Shenzhen, it is unnecessary to consider too many thermal protection measures, such as cold season wind protection. (4) PET is significantly higher than other measuring points near the measuring points of HVAC and other equipment. The location of HVAC and other heat rejection equipment should be reasonably planned in the overhead spaces of the buildings to reduce their negative impact on the thermal comfort of users.
There are also limitations in this study: (1) This study only collected data in late September/early October and early January due to the academic calendar, missing out on the most extreme periods for the climate in Shenzhen, such as August. (2) The samples of the questionnaire survey focused on the student group aged 18–30 years, and populations such as faculty members were missing. To gain a comprehensive understanding of the thermal comfort conditions in semi-open spaces in hot summer and cold winter regions, it is necessary to extend the study to more seasons and cover more campus users in the study population. Although statistical analysis can be conducted based on the sample size of this study, a larger sample size would allow for higher-order statistical analysis and provide more convincing results.
Author Contributions
Conceptualization, X.X. and H.L.; methodology, X.X., H.L. and Z.G.; software, X.X. and H.L.; validation, H.L.; formal analysis, H.L.; investigation, H.L. and R.W.; data curation, H.L.; writing—original draft preparation, X.X., H.L. and Z.G.; writing—review and editing, X.X. and Z.G.; visualization, H.L.; supervision, X.X.; project administration, X.X. and H.L.; funding acquisition, X.X. All authors have read and agreed to the published version of the manuscript.
Funding
This research received no external funding.
Institutional Review Board Statement
Not applicable.
Informed Consent Statement
Not applicable.
Data Availability Statement
All data, models, and code generated or used in this study are available upon request from the corresponding author.
Conflicts of Interest
The authors declare no conflict of interest.
Abbreviations
| Abbreviation | Full Name |
| Ta | Air temperature (°C) |
| Tg | Black globe temperature (°C) |
| Tmrt | Mean radiant temperature(°C) |
| Va | Air velocity (m/s) |
| RH | Relative humidity (%) |
| BMI | Body mass index |
| PET | Physiologically equivalent temperature (°C) |
| PTA | Percentage of thermal acceptability (%) |
| TAV | Thermal acceptability vote |
| TCV | Thermal comfort vote |
| TPV | Thermal preference vote |
| TSV | Thermal sensation vote |
References
- Jackson, S.B.; Stevenson, K.T.; Larson, L.R.; Peterson, M.N.; Seekamp, E. Outdoor Activity Participation Improves Adolescents’ Mental Health and Well-Being during the COVID-19 Pandemic. Int. J. Environ. Res. Public Health 2021, 18, 2506. [Google Scholar] [CrossRef] [PubMed]
- Wang, W.; Zhu, L.; Zheng, S.; Ji, Y.; Xiang, Y.; Lv, B.; Xiong, L.; Li, Z.; Yi, S.; Huang, H.; et al. Survey on the Progression of Myopia in Children and Adolescents in Chongqing during COVID-19 Pandemic. Front. Public Health 2021, 9, 646770. [Google Scholar] [CrossRef] [PubMed]
- Bayat, S.; Naglie, G.; Rapoport, M.J.; Stasiulis, E.; Widener, M.J.; Mihailidis, A. A GPS-Based Framework for Understanding Outdoor Mobility Patterns of Older Adults with Dementia: An Exploratory Study. Gerontology 2021, 68, 106–120. [Google Scholar] [CrossRef] [PubMed]
- Pereira, T.J.; King, T.; Burr, J.F. Mental health & physical activity: Could off-road motorized recreation help combat depression and anxiety? Leisure/Loisir 2021, 45, 331–345. [Google Scholar] [CrossRef]
- Lai, D.; Liu, W.; Gan, T.; Liu, K.; Chen, Q. A review of mitigating strategies to improve the thermal environment and thermal comfort in urban outdoor spaces. Sci. Total Environ. 2019, 661, 337–353. [Google Scholar] [CrossRef]
- Goshayeshi, D.; Shahidan, M.F.; Khafi, F.; Ehtesham, E. A review of researches about human thermal comfort in semi-outdoor spaces. Eur. Online J. Nat. Soc. Sci. 2013, 2, 561. [Google Scholar]
- Chen, L.; Ng, E. Outdoor thermal comfort and outdoor activities: A review of research in the past decade. Cities 2012, 29, 118–125. [Google Scholar] [CrossRef]
- Lehnert, M.; Kubeček, J.; Geletič, J.; Jurek, M.; Frajer, J. Identifying hot and cool spots in the city centre based on bicycle measurements: The case of Olomouc, Czech Republic. Geogr. Pannonica 2018, 22, 230–240. [Google Scholar] [CrossRef]
- Nikolopoulou, M.; Steemers, K. Thermal comfort and psychological adaptation as a guide for designing urban spaces. Energy Build. 2003, 35, 95–101. [Google Scholar] [CrossRef]
- Xue, F.; Gou, Z.; Lau, S.S.Y. Green open space in high-dense Asian cities: Site configurations, microclimates and users’ perceptions. Sustain. Cities Soc. 2017, 34, 114–125. [Google Scholar] [CrossRef]
- Junta, N.; Shin-Ichi, T. Thermal Comfort and Adaptation in Semi-Outdoor Environments. ASHRAE Trans. 2004, 110, 543. [Google Scholar]
- Acero, J.A.; Ruefenacht, L.A.; Koh, E.J.; Tan, Y.S.; Norford, L.K. Measuring and comparing thermal comfort in outdoor and semi-outdoor spaces in tropical Singapore. Urban Clim. 2022, 42, 101122. [Google Scholar] [CrossRef]
- GB50096-2011; China Academy of Architectural Design and Research, Code for Residential Design. National Standard of the People’s Republic of China: Beijing, China, 2011.
- Oual, M.S.; Tabassi, A.; Hassan, A.; Hassan, A.S. Thermal Comfort in Semi-Outdoor Studying Spaces: A case study of Universiti Sains Malaysia. IOP Conference Series. Mater. Sci. Eng. 2018, 401, 12022. [Google Scholar] [CrossRef]
- Hwang, R.; Lin, T. Thermal Comfort Requirements for Occupants of Semi-Outdoor and Outdoor Environments in Hot-Humid Regions. Archit. Sci. Rev. 2007, 50, 357–364. [Google Scholar] [CrossRef]
- Sultana, L.; Bari, N. A Study on the Impact of Tensile Fabric Structure in Semi-Outdoor Spaces of Tropical Cities; Department of Architecture, Southeast University: Dhaka, Bangladesh. Int. J. New Innov. Eng. Technol. 2019, 10, 4. [Google Scholar] [CrossRef]
- Spagnolo, J.; de Dear, R. A field study of thermal comfort in outdoor and semi-outdoor environments in subtropical Sydney Australia. Build. Environ. 2003, 38, 721–738. [Google Scholar] [CrossRef]
- Zhou, Z.; Chen, H.; Deng, Q.; Mochida, A. A Field Study of Thermal Comfort in Outdoor and Semi-outdoor Environments in a Humid Subtropical Climate City. J. Asian Archit. Build. Eng. 2013, 12, 73–79. [Google Scholar] [CrossRef]
- Monteiro, L.M.; Alucci, M.P. Transitional spaces in São Paulo, Brazil: Mathematical modeling and empirical calibration for thermal comfort assessment. In Building Simulation; Department of Technology, Faculty of Architecture and Urbanism of University of Sao Paulo: Sao Paulo, Brazil, 2007; pp. 737–744. [Google Scholar]
- Pagliarini, G.; Rainieri, S. Thermal environment characterisation of a glass-covered semi-outdoor space subjected to natural climate mitigation. Energy Build. 2011, 43, 1609–1617. [Google Scholar] [CrossRef]
- Bayoumi, M. Improving Natural Ventilation Conditions on Semi-Outdoor and Indoor Levels in Warm–Humid Climates. Buildings 2018, 8, 75. [Google Scholar] [CrossRef]
- Vard, M.; Faizi, M.; Khakzand, M.; Ojaghlou, M. Thermal Characteristics of Outdoor and Semi-outdoor Spaces in Climate of Tehran-Iran. Archit. Environ. Res. 2019, 1, 31–48. [Google Scholar]
- Tao, Y.; Lau, S.S.Y.; Gou, Z.; Zhang, J.; Tablada, A. An investigation of semi-outdoor learning spaces in the tropics: Spatial settings, thermal environments and user perceptions. Indoor Built Environ. 2019, 28, 1368–1382. [Google Scholar] [CrossRef]
- Cao, B.; Luo, M.; Li, M.; Zhu, Y. Thermal comfort in semi-outdoor spaces within an office building in Shenzhen: A case study in a hot climate region of China. Indoor Built Environ. 2018, 27, 1431–1444. [Google Scholar] [CrossRef]
- Munawaroh, A.S.; Damayanti, E.; Prasetyo, Y.A. A Field Measurement of Thermal Comfort in Semi Outdoor Space in Hot-Humid Climate. IOP conference series. Earth Environ. Sci. 2021, 738. [Google Scholar] [CrossRef]
- Bouyer, J.; Vinet, J.; Delpech, P.; Carré, S. Thermal comfort assessment in semi-outdoor environments: Application to comfort study in stadia. J. Wind Eng. Ind. Aerodyn. 2007, 95, 963–976. [Google Scholar] [CrossRef]
- Lin, T.P.; Matzarakis, A.; Huang, J.J. Thermal Comfort and Passive Design Strategy of Bus Shelters. In Proceedings of the 23rd Conference on Passive and Low Energy Architecture, Geneva, Switzerland, 6–8 September 2006. [Google Scholar]
- Mihara, K.; Chen, S.; Hasama, T.; Tan, C.L.; Lee, J.K.; Wong, N.H. Environmental satisfaction, mood and cognitive performance in semi-outdoor space in the tropics. Build. Environ. 2022, 216, 109051. [Google Scholar] [CrossRef]
- Othman, N.E.; Zaki, S.A.; Rijal, H.B.; Ahmad, N.H.; Razak, A.A. Field study of pedestrians’ comfort temperatures under outdoor and semi-outdoor conditions in Malaysian university campuses. Int. J. Biometeorol. 2021; prepublish. [Google Scholar] [CrossRef]
- Gamero-Salinas, J.; Kishnani, N.; Monge-Barrio, A.; López-Fidalgo, J.; Sánchez-Ostiz, A. The influence of building form variables on the environmental performance of semi-outdoor spaces. A study in mid-rise and high-rise buildings of Singapore. Energy Build. 2021, 230, 110544. [Google Scholar] [CrossRef]
- Pinto, D.; Rocha, A.; Simões, M.L.; Almeida, R.M.; Barreira, E.; Pereira, P.F.; Ramos, N.M.; Martins, J.P. An innovative approach to evaluate local thermal discomfort due to draught in semi-outdoor spaces. Energy Build. 2019, 203, 109416. [Google Scholar] [CrossRef]
- Yin, Y.; Zhang, D.; Zhen, M.; Jing, W.; Luo, W.; Feng, W. Combined effects of the thermal-acoustic environment on subjective evaluations in outdoor public spaces. Sustain. Cities Soc. 2022, 77, 103522. [Google Scholar] [CrossRef]
- Huang, Z.; Cheng, B.; Gou, Z.; Zhang, F. Outdoor thermal comfort and adaptive behaviors in a university campus in China’s hot summer-cold winter climate region. Build. Environ. 2019, 165, 106414. [Google Scholar] [CrossRef]
- Nakano, J.; Tanabe, S.I. Thermal Adaptation and Comfort Zones in Urban Semi-Outdoor Environments. Front. Built Environ. 2020, 6. [Google Scholar] [CrossRef]
- Xiao, A.; Li, Z.; Li, Z. Research on the Rationale Design on Overhead Layer of Different Types of Buildings. J. Beijing Archit. Archit. Univ. 2018, 34, 13–17. [Google Scholar] [CrossRef]
- Li, W.; Ling, F. Study on the Design Strategy of the Ground Leisure Space in the Residential Building Based on Neighborhood: A Case of Hefei. Urban Archit. 2020, 17, 79–81. [Google Scholar] [CrossRef]
- Bu, H.; Wang, Z.; Liu, Y.; Ping, S. Overhead Design Optimization and Airflow Simulation in Buildings. J. Hunan City Univ. (Nat. Sci. Ed.) 2018, 27, 38–42. [Google Scholar] [CrossRef]
- Shui, T.; Liu, J.; Xiao, R.; Li, Z.; Luo, F.; Zhou, J. Wind Tunnel Experiments of Residential Wind Environment with Piloti-type Structures. Build. Sci. 2017, 33, 20–26. [Google Scholar] [CrossRef]
- Xiao, X.T. Three Adaptabilities of the Traditional Vernacular Architecture of the Han Nationality in Lingnan. Appl. Mech. Mater. 2014, 644–650, 5109–5112. [Google Scholar] [CrossRef]
- Xi, T.; Li, Q.; Mochida, A.; Meng, Q. Study on the outdoor thermal environment and thermal comfort around campus clusters in subtropical urban areas. Build. Environ. 2012, 52, 162–170. [Google Scholar] [CrossRef]
- Li, L.; Chan, P.W.; Wang, D.; Tan, M. Rapid urbanization effect on local climate: Intercomparison of climate trends in Shenzhen and Hong Kong, 1968–2013. Clim. Res. 2015, 63, 145–155. [Google Scholar] [CrossRef]
- Kántor, N. Differences between the evaluation of thermal environment in shaded and sunny position. Hung. Geogr. Bull. 2016, 65, 139–153. [Google Scholar] [CrossRef]
- Hoppe, P. The physiological equivalent temperature—A universal index for the biometeorological assessment of the thermal environment. Int. J. Biometeorol. 1999, 43, 71–75. [Google Scholar] [CrossRef]
- Cheng, V.; Ng, E.; Chan, C.; Givoni, B. Outdoor thermal comfort study in a sub-tropical climate: A longitudinal study based in Hong Kong. Int. J. Biometeorol. J. Int. Soc. Biometeorol. 2012, 56, 43–56. [Google Scholar] [CrossRef] [PubMed]
- Hwang, R.-L.; Lin, T.-P.; Matzarakis, A. Seasonal effects of urban street shading on long-term outdoor thermal comfort. Build. Environ. 2011, 46, 863–870. [Google Scholar] [CrossRef]
- ASHRAE Standard 55-2017; A Thermal Environmental Conditions for Human Occupancy. American Society of Heating, Refrigerating and Air-Conditioning Engineers: Atlanta, GA, USA, 2017.
- GB 50176-2016; Institute of Standards and Quotas of the Ministry of Housing and Urban Rural Development of the People’s Republic of China, Code for Thermal Design of Civil Buildings. National Standard of The People’s Republic of China: Beijing, China, 2016.
- Liu, L.; Lin, Y.; Xiao, Y.; Xue, P.; Shi, L.; Chen, X.; Liu, J. Quantitative effects of urban spatial characteristics on outdoor thermal comfort based on the LCZ scheme. Build. Environ. 2018, 143, 443–460. [Google Scholar] [CrossRef]
- Wang, Y.; Ni, Z.; Peng, Y.; Xia, B. Local variation of outdoor thermal comfort in different urban green spaces in Guangzhou, a subtropical city in South China. Urban For. Urban Green. 2018, 32, 99–112. [Google Scholar] [CrossRef]
- Lin, T.; Matzarakis, A. Tourism climate and thermal comfort in Sun Moon Lake, Taiwan. Int. J. Biometeorol. 2008, 52, 281–290. [Google Scholar] [CrossRef]
- Xue, S.; Xiao, Y. Study on the outdoor thermal comfort threshold of Lingnan Garden in summer. Build. Sci. 2016, 32, 10. [Google Scholar] [CrossRef]
- Lai, D.; Lai, D.; Guo, D.; Hou, Y.; Lin, C.; Chen, Q. Studies of outdoor thermal comfort in northern China. Build. Environ. 2014, 77, 110–118. [Google Scholar] [CrossRef]
- Lin, T. Thermal perception, adaptation and attendance in a public square in hot and humid regions. Build. Environ. 2009, 44, 2017–2026. [Google Scholar] [CrossRef]
- Salata, F.; Golasi, I.; de Lieto Vollaro, R.; de Lieto Vollaro, A. Outdoor thermal comfort in the Mediterranean area. A transversal study in Rome, Italy. Build. Environ. 2016, 96, 46–61. [Google Scholar] [CrossRef]
- Ayman, H.A.M. Analysis of the microclimatic and human comfort conditions in an urban park in hot and arid regions. Build. Environ. 2011, 46, 2641–2656. [Google Scholar] [CrossRef]
- Yahia, M.W.; Johansson, E. Evaluating the behaviour of different thermal indices by investigating various outdoor urban environments in the hot dry city of Damascus, Syria. Int. J. Biometeorol. 2013, 57, 615–630. [Google Scholar] [CrossRef] [PubMed]
- Li, K.; Zhang, Y.; Zhao, L. Outdoor thermal comfort and activities in the urban residential community in a humid subtropical area of China. Energy Build. 2016, 133, 498–511. [Google Scholar] [CrossRef]
- Németh, A. Estimation of Tourism Climate in the Lake Balaton Region, Hungary. J. Environ. Geogr. 2013, 6, 49–55. [Google Scholar] [CrossRef]
- de Paula Xavier, A.A.; Lamberts, R. Indices of thermal comfort developed from field survey in Brazil. Trans. Am. Soc. Heat. Refrig. Air Cond. Eng. 2000, 106, 45–58. [Google Scholar]
- Tung, C.H.; Chen, C.P.; Tsai, K.T.; Kántor, N.; Hwang, R.L.; Matzarakis, A.; Lin, T.P. Outdoor thermal comfort characteristics in the hot and humid region from a gender perspective. Int. J. Biometeorol. 2014, 58, 1927–1939. [Google Scholar] [CrossRef] [PubMed]
- Metje, N.; Sterling, M.; Baker, C.J. Pedestrian comfort using clothing values and body temperatures. J. Wind Eng. Ind. Aerodyn. 2008, 96, 412–435. [Google Scholar] [CrossRef]
Figure 1.
Nucleic acid test being conducted in an overhead space on the ground floor (Photos taken by the authors).
Figure 1.
Nucleic acid test being conducted in an overhead space on the ground floor (Photos taken by the authors).

Figure 2.
The campus and site information. (Photos taken by the authors).

Figure 3.
Study site selection.

Figure 4.
TSV frequency statistics.

Figure 5.
Relationship between TSV and PET.

Figure 6.
TCV frequency statistics.

Figure 7.
Relationship between TCV and PET.

Figure 8.
Relationship between TSV and TCV.

Figure 9.
Relationship between PTA and PET.

Figure 10.
Relationship between TPV and PET.

Figure 11.
Activity level statistics.

Figure 12.
Relationship between clothing insulation and PET.

Figure 13.
Adaptive behavior statistics.

Figure 14.
Selection rate of male and female adaptive behaviors in different seasons.


Table 1.
Information on the measurement sites.
| Site | Floor | Floor Height (m) | Depth (m) | Width (m) | Orientation |
|---|---|---|---|---|---|
| 1 | Ground | 4.4 | 19.3 | 27.0 | East-West |
| 2 | Ground | 4.4 | 19.3 | 13.6 | South-North |
| 3 | Ground | 4.4 | 19.3 | 19.2 | South-North |
| 4 | Semi underground | 4.4 | 17.2 | 20.0 | East-West |
| 5 | Semi underground | 4.4 | 16.0 | 10.0 | South-North |
Table 2.
Instrument measurement range and accuracy.
| Air Temperature | Air Velocity | Humidity | Black Globe Temperature | Surface Temperature | Distance Class | |
|---|---|---|---|---|---|---|
| Equipment | NHQXZ602 portable automatic weather station | NHQXZ602 portable automatic weather station | NHQXZ602 portable automatic weather station | Comprehensive temperature and heat index meter 87,786 | Electronic pyrometer VC307C | Handheld laser measuring instrument Y40M |
| Manufacturer | Chen Sen Zhi Yu | Chen Sen Zhi Yu | Chen Sen Zhi Yu | AZ Instrument | VICTOR | YHT |
| Range | −50–80 °C | 0–60 m/s | 0–100%RH | 0–80 °C | −20–800 °C | 0.05–40 m |
| Accuracy | ±0.2 °C | ±0.3 m/s | ±3%RH | ±0.6 °C | ±1.5 °C | ±1.5 mm |
| Resolution | 0.1 °C | 0.1 m/s | 1%RH | 0.1 °C | 0.1 °C | 0.001 m |
Table 3.
Date and time of data collection.
| Year | Season | Month | Date | Time | Sample Size |
|---|---|---|---|---|---|
| 2021 | hot | September | 23, 24, 25 | 9:00–21:00 | 243 |
| October | 1, 5, 6 | ||||
| 2022 | cold | January | 4, 5, 6 | 9:00–23:00 | 266 |
Table 4.
The questionnaire used in this study.
| PART1 | Time/Location | |
| Gender | □Male □Female | |
| Age | □<18 □18–31 □31–45 □46–60 □>60 | |
| Birthplace | ||
| Length of stay in Shenzhen | □Less than 1 month □About half a year □1–2 years □More than 2 years | |
| PART2 | Clothing insulation (clo) | Lower Body: □T-shirt (0.15) □Short-sleeved shirts (0.19) □Long-sleeved shirts (0.25) □Knitwear (0.28) □Hoodie (0.3) □Jacket (0.35) □Woolen coat (0.45) □Down jacket (0.55) Lower Body: □Briefs (0.03) □Shorts (0.08) □Thermal underwear (0.1) □Thin outer pants (0.24) □Thick trousers (0.28) □Thin skirt (0.15) □Thick skirt (0.25) □Dress (0.2) Feet: □Thin socks (0.02) □Thick socks (0.05) □Slippers or sandals (0.02) □Sneakers (0.1) □Leather shoes (0.06) |
| Metabolic rate (W/m2) | □Sitting (60) □Standing (90) □Walking (120) □Exercising (360) | |
| PART3 | Thermal sensation vote (TSV) | □Cold (−3) □Cool (−2) □Slightly cool (−1) □Neutral (0) □Slightly warm (1) □Warm (2) □Hot (3) |
| Thermal comfort vote (TCV) | □Very comfortable (0) □Slightly comfortable (1) □Comfortable (2) □Slightly uncomfortable (3) □Very uncomfortable (4) | |
| Thermal acceptability vote (TAV) | □Very unacceptable (−2) □Just unacceptable (−1) □Just Acceptable (1) □Very acceptable (2) | |
| Thermal preference vote (TPV) | □Colder (−2) □Cooler (−1) □Unchanged (0) □Warmer (+1) □Hotter (+2) | |
| PART4 | Adaptive behavior | □Using umbrellas □Wearing a hat □Wearing more clothes □Wearing less clothes □Seeking shade □Staying in the sun □Having cold drinks □Fanning □No change □Exposure to the sun |
Table 5.
Thermal environment at each measurement site.
| SITE | Air Temperature (°C) | Relative Humidity (%) | Air Velocity (m/s) | Black Globe Temperature (°C) | |||||||||||||
|---|---|---|---|---|---|---|---|---|---|---|---|---|---|---|---|---|---|
| Max | Min | Mean | SD | Max | Min | Mean | SD | Max | Min | Mean | SD | Max | Min | Mean | SD | ||
| Hot season | 1 | 33.0 | 27.8 | 30.9 | 1.2 | 86.7 | 44.8 | 68.9 | 10.0 | 3.5 | 0.0 | 0.4 | 0.6 | 32.9 | 27.8 | 30.7 | 1.2 |
| 2 | 32.9 | 26.3 | 30.5 | 1.4 | 92.2 | 46.0 | 72.2 | 10.2 | 4.6 | 0.0 | 0.7 | 0.8 | 33.2 | 27.6 | 30.7 | 1.3 | |
| 3 | 33.0 | 26.7 | 30.5 | 1.3 | 93.9 | 49.6 | 73.6 | 9.4 | 5.7 | 0.0 | 0.7 | 0.9 | 32.8 | 26.5 | 30.1 | 1.3 | |
| 4 | 32.8 | 25.8 | 30.4 | 1.4 | 95.8 | 47.8 | 74.2 | 10.5 | 4.6 | 0.0 | 0.5 | 0.6 | 32.7 | 25.4 | 30.1 | 1.3 | |
| 5 | 36.2 | 27.8 | 31.5 | 1.8 | 87.5 | 41.4 | 70.2 | 11.0 | 4.9 | 0.0 | 0.5 | 0.7 | 36.2 | 29.0 | 32.1 | 1.4 | |
| Cold season | 1 | 23.8 | 18.5 | 21.0 | 1.5 | 81.4 | 48.9 | 68.3 | 8.2 | 2.4 | 0.0 | 0.2 | 0.4 | 23.5 | 18.6 | 20.6 | 1.4 |
| 2 | 23.3 | 18.1 | 20.6 | 1.6 | 92.9 | 51.3 | 74.9 | 10.0 | 5.2 | 0.0 | 0.6 | 0.9 | 22.9 | 17.9 | 20.2 | 1.5 | |
| 3 | 23.3 | 18.1 | 20.6 | 1.6 | 96.0 | 54.5 | 79.3 | 9.6 | 5.3 | 0.0 | 0.6 | 1.0 | 22.9 | 18.1 | 20.2 | 1.5 | |
| 4 | 23.7 | 18.8 | 20.7 | 1.5 | 87.2 | 53.1 | 73.4 | 8.5 | 5.4 | 0.0 | 0.6 | 0.8 | 23.3 | 18.4 | 20.4 | 1.4 | |
| 5 | 23.3 | 18.6 | 20.6 | 1.2 | 87.8 | 50.3 | 75.4 | 8.1 | 2.0 | 0.0 | 0.1 | 0.3 | 22.7 | 18.6 | 20.1 | 1.1 | |
Table 6.
Correlation analysis among microclimate parameters.
| PET | Ta | Tg | Va | Tmrt | RH | |
|---|---|---|---|---|---|---|
| PET | 1.000 | |||||
| Ta | 0.641 ** | 1.000 | ||||
| Tg | 0.839 ** | 0.859 ** | 1.000 | |||
| Va | −0.292 ** | 0.174 ** | 0.183 ** | 1.000 | ||
| Tmrt | 0.713 ** | 0.467 ** | 0.796 ** | 0.138 * | 1.000 | −0.086 |
| RH | −0.118 | −0.481 ** | −0.345 ** | −0.224 ** | −0.086 | 1.000 |
*. Correlation is significant at the 0.05 level (2-tailed). **. Correlation is significant at the 0.01 level (2-tailed).
Table 7.
Correlation analysis of TPV and TSV.
| Sig. (2-Tailed) | Pearson Correlation | Number of Cases | |
|---|---|---|---|
| Hot season | 0.001 | −0.216 ** | 243 |
| Cold season | 0.000 | −0.356 ** | 266 |
| Year-round | 0.000 | −0.405 ** | 509 |
**. Correlation is significant at the 0.01 level (2-tailed).
Table 8.
Independent sample t-test for gender on weather perception.
| Season | Variables | Group | Mean ± sd | t | Sig |
|---|---|---|---|---|---|
| Hot season | TSV | Female | 1.00 ± 1.42 | 1.64 | 0.103 |
| Male | 0.71 ± 1.21 | ||||
| TCV | Female | 2.00 ± 1.06 | 1.7 | 0.09 | |
| Male | 1.78 ± 0.85 | ||||
| TAV | Female | 0.46 ± 1.11 | −1.71 | 0.088 | |
| Male | 0.70 ± 0.94 | ||||
| TPV | Female | −0.69 ± 0.89 | 0.67 | 0.503 | |
| Male | −0.76 ± 0.60 | ||||
| Cold season | TSV | Female | −0.27 ± 0.91 | −0.711 | 0.478 |
| Male | −0.19 ± 0.93 | ||||
| TCV | Female | 1.60 ± 0.87 | −0.409 | 0.683 | |
| Male | 1.64 ± 0.79 | ||||
| TAV | Female | 0.98 ± 0.88 | 1.015 | 0.311 | |
| Male | 0.88 ± 0.83 | ||||
| TPV | Female | −0.07 ± 0.77 | 1.692 | 0.092 | |
| Male | −0.09 ± 0.78 | ||||
| Whole year | TSV | Female | 0.18 ± 1.21 | −1.5 | 0.137 |
| Male | 0.35 ± 1.25 | ||||
| TCV | Female | 1.67 ± 0.91 | −1.4 | 0.161 | |
| Male | 1.79 ± 0.87 | ||||
| TAV | Female | 0.86 ± 0.92 | 1.78 | 0.076 | |
| Male | 0.71 ± 0.97 | ||||
| TPV | Female | −0.26 ± 0.86 | 2.3 | 0.022 * | |
| Male | −0.43 ± 0.81 |
*. Correlation is significant at the 0.05 level (2-tailed).
Table 9.
Analysis of differences in the effect of activity levels on weather perception.
| 60 W/m2 | 70 W/m2 | 150 W/m2 | 230 W/m2 | F | p | |
|---|---|---|---|---|---|---|
| TSV | 0.20 ± 1.26 | 0.24 ± 1.20 | 0.43 ± 1.08 | 1.40 ± 1.51 | 3.69 | 0.012 * |
| TCV | 1.70 ± 0.91 | 1.74 ± 0.82 | 1.81 ± 0.90 | 2.10 ± 0.88 | 0.90 | 0.440 |
| TAV | 0.80 ± 0.98 | 0.82 ± 0.85 | 0.65 ± 0.96 | 0.40 ± 0.97 | 1.18 | 0.317 |
| TPV | −0.31 ± 0.89 | −0.32 ± 0.78 | −0.54 ± 0.67 | −0.70 ± 0.82 | 2.28 | 0.079 |
*. Correlation is significant at the 0.05 level (2-tailed).
Table 10.
Comparison of activity levels between groups.
| Dependent Variable | (I) Activity Level | (J) Activity Level | Difference in Mean (I–J) | Standard Error | Significance |
|---|---|---|---|---|---|
| TSV | 60 | 70 | −0.04 | 0.13 | 0.75 |
| 150 | −0.23 | 0.15 | 0.12 | ||
| 230 | −1.20 * | 0.39 | 0.00 * | ||
| 70 | 60 | 0.04 | 0.13 | 0.75 | |
| 150 | −0.19 | 0.17 | 0.26 | ||
| 230 | −1.16 * | 0.40 | 0.00 * | ||
| 150 | 60 | 0.23 | 0.15 | 0.12 | |
| 70 | 0.19 | 0.17 | 0.26 | ||
| 230 | −0.97 * | 0.41 | 0.02 * | ||
| 230 | 60 | 1.20 * | 0.39 | 0.00 * | |
| 70 | 1.16 * | 0.40 | 0.00 * | ||
| 150 | 0.97 * | 0.41 | 0.02 * |
*. Difference in mean is significant at the 0.05 level.
Table 11.
Difference analysis of long-term residence and weather perception.
| Severely Cold Regions | Cold Regions | Hot Summer and Cold Winter Regions | Hot Summer and Warm Winter Regions | Mild Regions | F | p | |
|---|---|---|---|---|---|---|---|
| TSV | 0.31 ± 1.18 | 0.34 ± 1.09 | −0.03 ± 1.07 | 0.36 ± 1.29 | −0.11 ± 0.93 | 2.165 | 0.072 |
| TCV | 1.62 ± 0.96 | 1.37 ± 0.86 | 1.68 ± 0.85 | 1.82 ± 0.89 | 1.11 ± 0.78 | 3.845 | 0.004 ** |
| TAV | 1.00 ± 0.71 | 0.98 ± 0.85 | 0.97 ± 0.78 | 0.67 ± 1.00 | 1.22 ± 0.44 | 3.215 | 0.013 * |
| TPV | −0.54 ± 0.66 | −0.12 ± 0.87 | −0.21 ± 0.82 | −0.42 ± 0.83 | −0.44 ± 1.01 | 2.271 | 0.061 |
*. Correlation is significant at the 0.05 level (2-tailed). **. Correlation is significant at the 0.01 level (2-tailed).
Table 12.
Difference analysis of short-term activity and weather perception.
| Walking | Sitting | Eating | Others | F | p | |
|---|---|---|---|---|---|---|
| TSV | 0.88 ± 1.25 | 0.63 ± 1.34 | 0.91 ± 1.14 | 1.63 ± 1.31 | 2.94 | 0.03 * |
| TCV | 1.91 ± 0.96 | 1.80 ± 0.94 | 1.91 ± 0.83 | 2.00 ± 0.97 | 0.39 | 0.76 |
| TAV | 0.62 ± 1.06 | 0.57 ± 1.02 | 0.91 ± 0.70 | 0.50 ± 0.89 | 0.42 | 0.74 |
| TPV | −0.68 ± 0.76 | −0.80 ± 0.73 | −0.55 ± 0.82 | −0.81 ± 0.40 | 0.74 | 0.53 |
*. Correlation is significant at the 0.05 level (2-tailed).
Table 13.
Descriptive statistics of adaptive behavior.
| Measures | Response | |||
|---|---|---|---|---|
| Number of Cases | Percentage | Percentage of Cases | ||
| Hot season | Use umbrella | 66 | 12.70% | 27.40% |
| Wearing a hat | 19 | 3.70% | 7.90% | |
| Wearing less clothes | 49 | 9.50% | 20.30% | |
| Having cold drinks | 125 | 24.10% | 51.90% | |
| Seeking shade | 146 | 28.20% | 60.60% | |
| Fanning | 71 | 13.70% | 29.50% | |
| No change | 38 | 7.30% | 15.80% | |
| Exposure to the sun | 1 | 0.20% | 0.40% | |
| Wearing more clothes | 3 | 0.60% | 1.20% | |
| Total | 518 | 100.00% | 214.90% | |
| Cold season | Use umbrella | 26 | 6.39% | 9.77% |
| Wearing a hat | 22 | 5.41% | 8.27% | |
| Wearing less clothes | 48 | 11.79% | 18.05% | |
| Having cold drinks | 64 | 15.72% | 24.06% | |
| Seeking shade | 73 | 17.94% | 27.44% | |
| Fanning | 11 | 2.70% | 4.14% | |
| No change | 83 | 20.39% | 31.20% | |
| Exposure to the sun | 42 | 10.32% | 15.79% | |
| Wearing more clothes | 38 | 9.34% | 14.29% | |
| Total | 407 | 100.00% | 153.01% | |
Table 14.
Mean hot season and cold season PET for different spaces in hot summer and warm winter regions.
Table 14.
Mean hot season and cold season PET for different spaces in hot summer and warm winter regions.
| Cities | Space Type | Mean PET in Hot Season (°C) | Mean PET in Cold Season (°C) | Ref. |
|---|---|---|---|---|
| Guangzhou | Urban green space | 30.7–34.2 | 11.3–12.9 | [49] |
| Shenzhen | Multiple types | 29–39 | / | [48] |
| Hong Kong | Open square | 26–29 | 19–21 | [44] |
| Taiwan | Waterfront space | 21.6–23.9 | 12.1–14.7 | [50] |
| Guangzhou/Foshan | Garden courtyard | 30–35 | / | [51] |
| Dongguan | Garden courtyard | 33–40 | / | [51] |
| Shenzhen | Overhead space | 29–34 | 18–24 | - |
Table 15.
Relationship between TSV and PET for Shenzhen, Tianjin residents, Europeans, and Taiwanese.
Table 15.
Relationship between TSV and PET for Shenzhen, Tianjin residents, Europeans, and Taiwanese.
| Thermal Sensation | PET in Shenzhen (°C) | PET in Tianjin (°C) | PET in Europe (°C) | PET in Taiwan (°C) |
|---|---|---|---|---|
| Very Cold | <−17 a | <-16 | <4 | <14 |
| Cold | −17 to −6 a | −16 to −11 | 4–8 | 14–18 |
| Cool | −6 to 6 a | −11 to −6 | 8–13 | 18–22 |
| Slightly cool | 6–17 | −6 to 11 | 13–18 | 22–26 |
| Neutral | 17–30 | 11–24 | 18–23 | 26–30 |
| Slightly warm | 30–34 | 24–31 | 23–29 | 30–34 |
| Warm | 34–37 | 31–36 | 29–35 | 34–38 |
| Hot | 37–40 a | 36–46 | 35–41 | 38–42 |
| Very Hot | >40 a | >46 | >41 | >42 |
a Sensation obtained by linear regression.
Table 16.
Neutral PET and PET/TSV for Tianjin, Taichung, Hong Kong, Rome, Cairo, Damascus, Sydney and Shenzhen.
Table 16.
Neutral PET and PET/TSV for Tianjin, Taichung, Hong Kong, Rome, Cairo, Damascus, Sydney and Shenzhen.
| City | Location | Neutral PET (°C) | PET/TSV (°C) | Ref. | ||
|---|---|---|---|---|---|---|
| Cold Season | Hot Season | Cold Season | Hot Season | |||
| Tianjin, China | 38.3° N, 116.4° E | 9.2 | 15.6 | 5.3 | 10 | [52] |
| Taichung, Taiwan | 24.1° N, 120.7° E | 23.7 | 25.6 | 5 | 8.4 | [53] |
| Hong Kong, China | 22.3° N, 114.2° E | 21 | 25 | 8.4 | 7.3 | [44] |
| Rome, Italy | 41.5° N, 12.3° E | 24.9 | 26.9 | 8.5 | 5.9 | [54] |
| Cairo, Egypt | 31.0° N, 31.3° E | 26.5 | 27.4 | - | - | [55] |
| Damascus, Syria | 33.6° N, 36.3° E | 24.2 | 15.7 | 8.8 | 16.7 | [56] |
| Sydney, Australia | 33.9° S, 151.2° E | 28.8 | 22.9 | - | - | [17] |
| Shenzhen, China | 22.5° N, 113.9° E | 23.3 | 28.3 | 11.1 | 3.6 | - |
Publisher’s Note: MDPI stays neutral with regard to jurisdictional claims in published maps and institutional affiliations. |
© 2022 by the authors. Licensee MDPI, Basel, Switzerland. This article is an open access article distributed under the terms and conditions of the Creative Commons Attribution (CC BY) license (https://creativecommons.org/licenses/by/4.0/).
Share and Cite
MDPI and ACS Style
Xie, X.; Liao, H.; Wang, R.; Gou, Z. Thermal Comfort in the Overhead Public Space in Hot and Humid Climates: A Study in Shenzhen. Buildings 2022, 12, 1454. https://doi.org/10.3390/buildings12091454
AMA Style
Xie X, Liao H, Wang R, Gou Z. Thermal Comfort in the Overhead Public Space in Hot and Humid Climates: A Study in Shenzhen. Buildings. 2022; 12(9):1454. https://doi.org/10.3390/buildings12091454
Chicago/Turabian StyleXie, Xiaohuan, Haitao Liao, Ruobing Wang, and Zhonghua Gou. 2022. "Thermal Comfort in the Overhead Public Space in Hot and Humid Climates: A Study in Shenzhen" Buildings 12, no. 9: 1454. https://doi.org/10.3390/buildings12091454
Note that from the first issue of 2016, this journal uses article numbers instead of page numbers. See further details here.