Article

Research on the Material and Spatial Psychological Perception of the Side Interface of an Underground Street Based on Virtual Reality

1
School of Architecture and Design, China University of Mining and Technology, Xuzhou 221116, China
2
JiangSu Collaborative Innovation Center for Building Energy Saving and Construction Technology, Xuzhou 221116, China
3
Tus-Design Group Co., Ltd., Suzhou 215000, China
*
Author to whom correspondence should be addressed.
Buildings 2022, 12(9), 1432; https://doi.org/10.3390/buildings12091432
Submission received: 26 July 2022 / Revised: 5 September 2022 / Accepted: 9 September 2022 / Published: 12 September 2022
(This article belongs to the Topic Built Environment and Human Comfort)

Abstract

:
In the context of the rapid development of the construction of urban underground spaces in China, people’s demands for the quality of these spaces have become increasingly prominent. As an important part of underground spaces, the different materials used in underground street interfaces give rise to different spatial experiences, which are important for creating a comfortable underground space atmosphere. However, current research on the perception of underground street spaces lacks an exploration of the influence of materials, and most research on materials focuses on the interface design of above-ground commercial streets. In this study, material characteristics were extracted as independent variables, 17 scenes were orthogonalized, and the efficient simulation characteristics of VR were used to build a scene model for the experiment. Participants’ evaluations of the scenes were measured during the experiment, and conclusions were drawn through scene ranking and one-way ANOVA. The results showed that the use of white, high-finish materials with non-directional textures and low bumpiness for the side interface was more in line with the participants’ preferences. This study provides new ideas for the design of high-quality underground commercial streets.

1. Introduction

At present, the construction of underground spaces in Chinese cities has entered a stage of rapid development, and the number of underground public service facilities, including underground commercial streets and underground complexes, is increasing; however, the problem of the environmental quality of underground spaces still exists, and the public’s demand for physical and psychological underground space environments of good quality is becoming more and more prominent. The interface is an important part of underground commercial streets, and its material directly affects people’s feelings of street space and street vitality. However, the current research on spatial perception of underground streets has not involved the influence of materials, and the research on side interfaces is mostly concentrated on above-ground commercial streets. Therefore, it is necessary to use scientific methods to evaluate, study, and design interface materials for underground streets to obtain better spatial quality and increase psychological visual comfort. Furthermore, because of the complex environment of underground spaces, this study used the efficient simulation characteristics of virtual reality (VR) technology to establish more virtual scenes for simulation and obtain more possibilities.

2. Literature Review

2.1. Perception of Underground Space

Underground space is the focus of research in urban stock development and has received some attention from scholars who have conducted a number of studies on the perception of common underground spaces such as subways [1], commercial spaces [2], and tunnels [3]. Starting from the basic physical environment (for example, sound [4,5], light [6,7], and heat [8,9]) and human perception (for example, vision [10] and hearing), these studies have used techniques such as electroencephalogram, virtual reality, the laboratory environmental control method [11], and generative adversarial networks [12] to track changes in people’s psychological and physical perception of space. The current development and utilization of urban underground spaces is focused on underground buildings, with underground commerce as the main target [13]. Underground commercial streets are the most frequent commercial spaces where people stay for longer periods of time. Therefore, the design and decoration of underground streets have a more substantial impact on the emotional experience of customers. [14] Visuals dominate in non-sensory conditions. The visual system relies on diagnostic image features to estimate physical properties in a distal world [15]. Zhou et al. [10] proposed a multi-category measurable method for evaluating the overall visual comfort of underground spaces, with which the overall perception of comfort related to color, brightness, scale, and spatial form could be finely classified and quantitatively evaluated. As the material of the interface is one of the most important visual elements in the internal environment of the underground street, this study aimed to finely classify and quantitatively evaluate the overall spatial perception of underground streets.

2.2. Material Perception

Materials have been shown to significantly influence people’s perception of a space [16] and have been studied in depth by many scholars. Fan et al. [17] conducted a preliminary study on methods for applying decorative materials to more reasonably satisfy people’s physical and mental demands. Hwang, YR. [18] confirmed that the visual perceptions of participants were changed more by characteristic textures and textures with regular shapes than by the other typologies of textures. Wang et al. [19] found that the effect of wall texture on perceptual spaciousness varied depending on the wall material, and the textural effect was affected by room size. These studies confirmed that the way materials are applied and textural changes have an impact on people’s spatial perceptions. However, research on material and spatial perception has mainly been focused on by researchers in interior environmental art design, and there is a lack of exploration in the underground field.

2.3. Applications of Virtual Reality
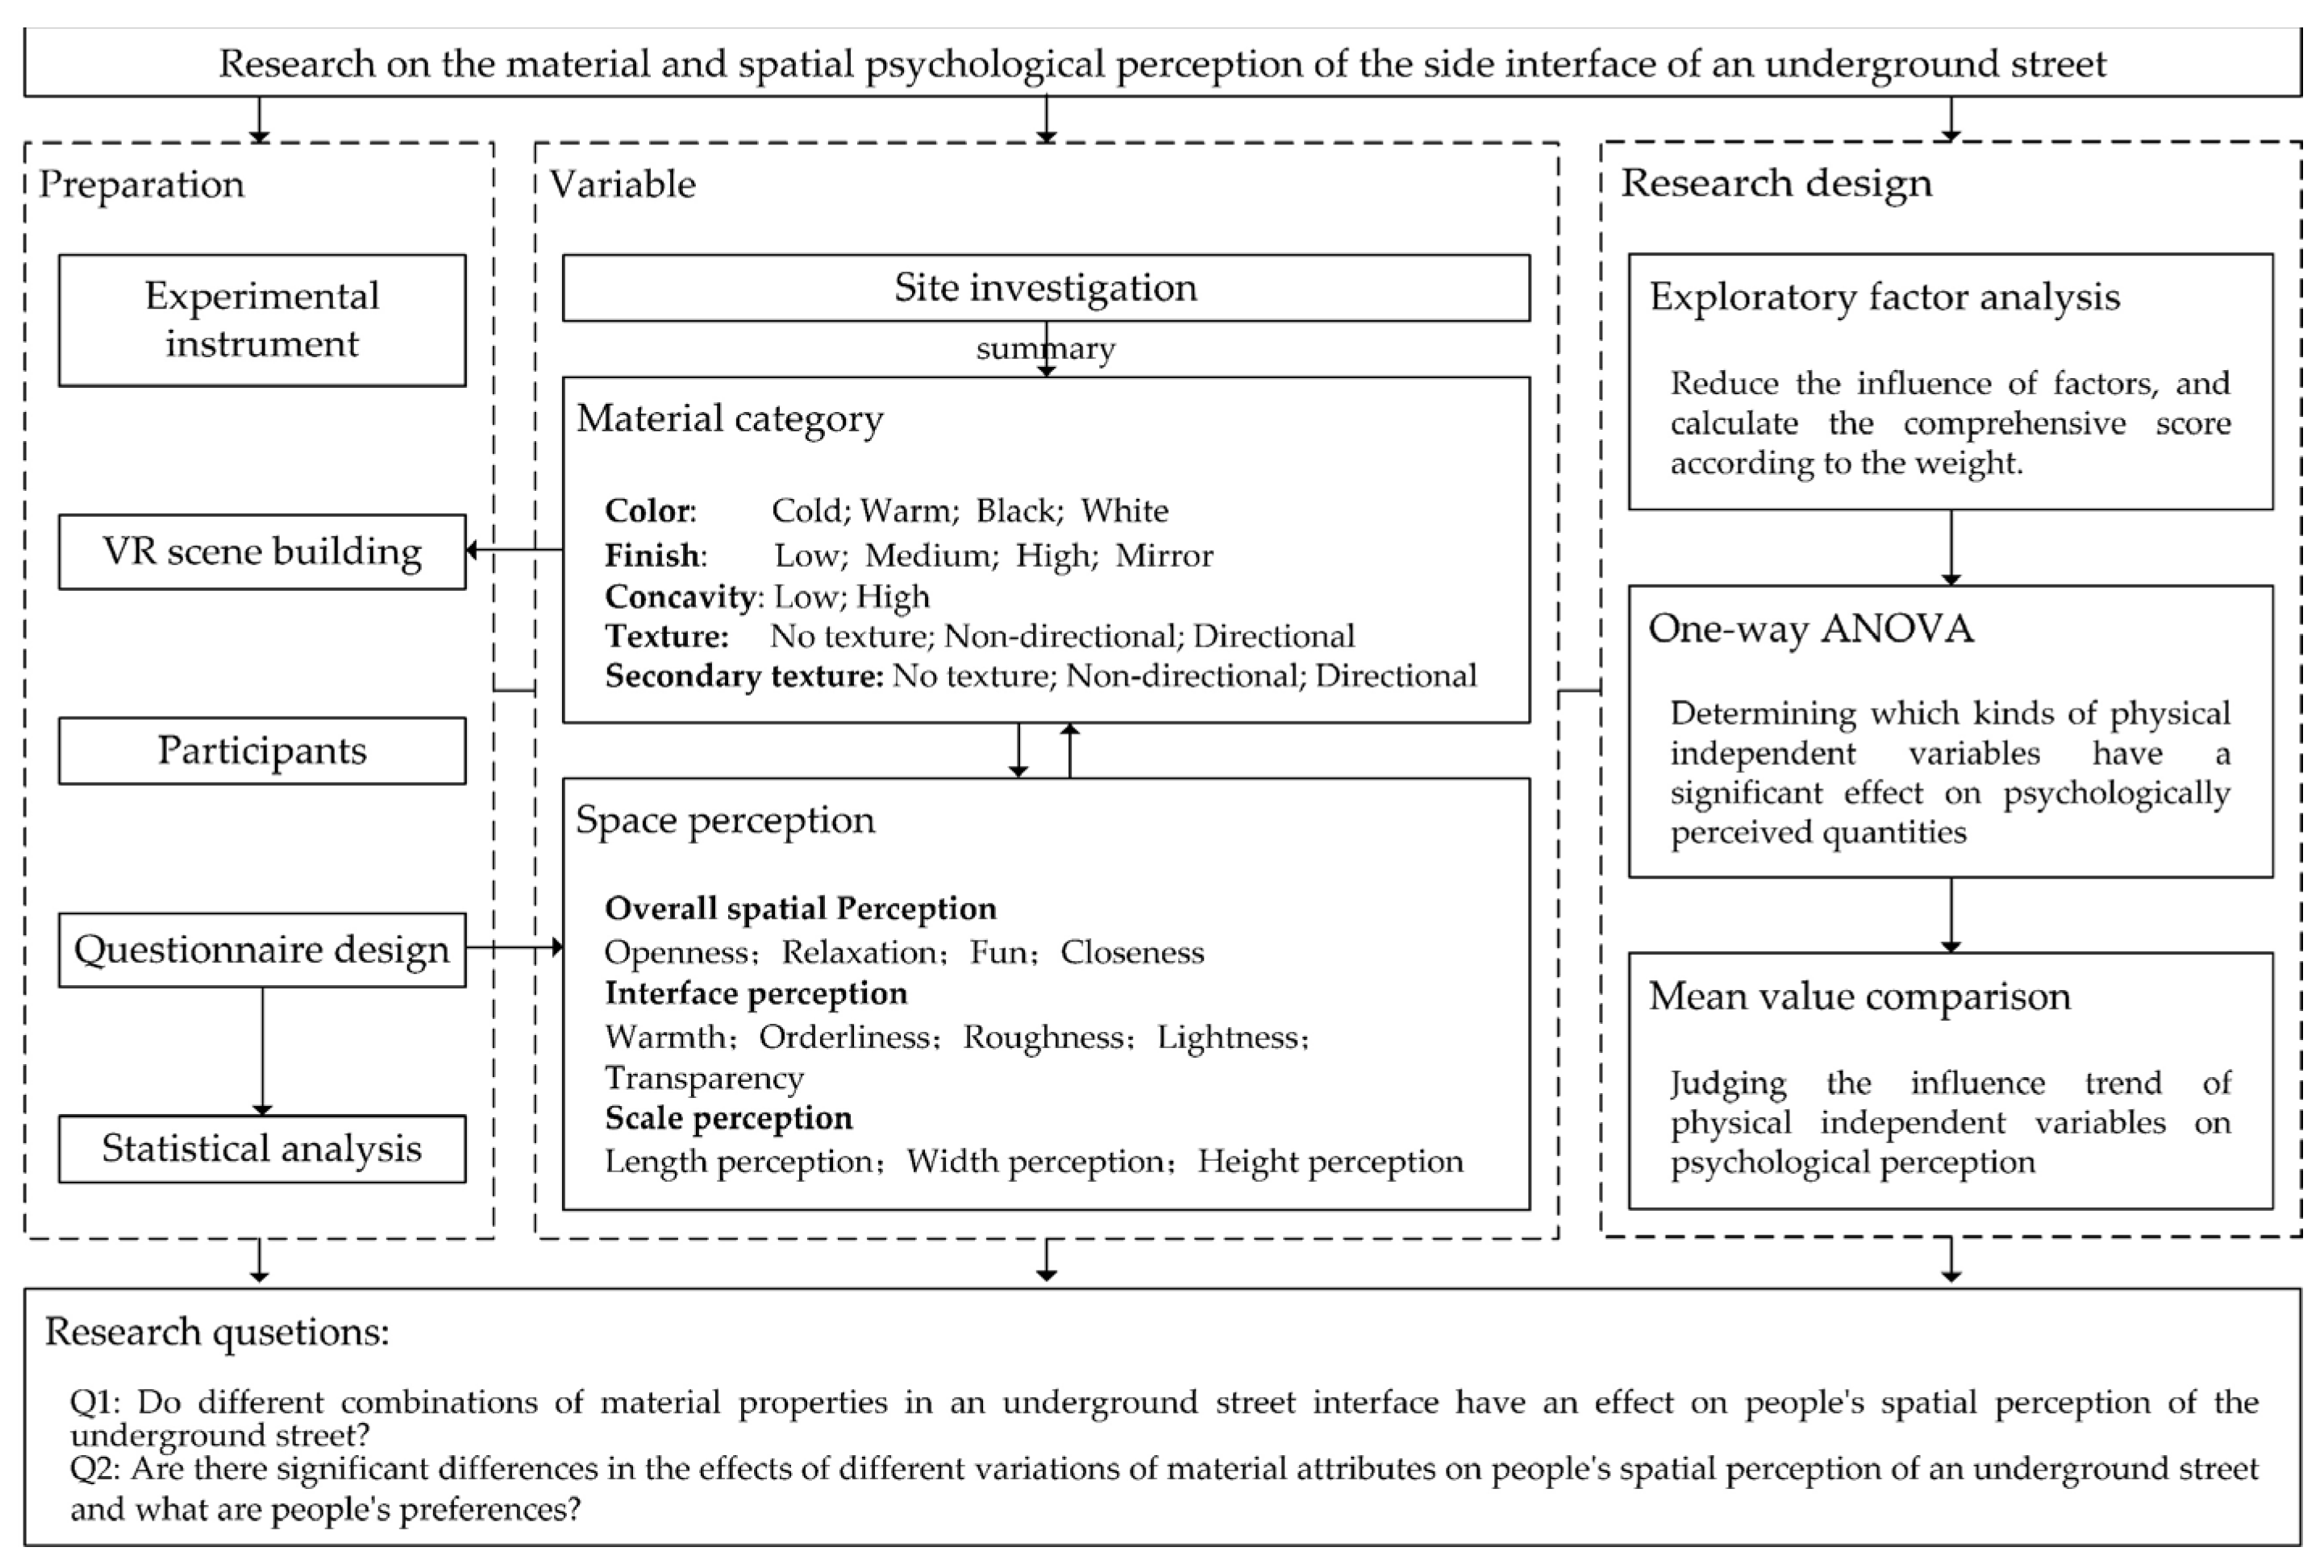
Field tests have authenticity, timeliness, and validity, which can eliminate the bias of subjective estimation. However, experimental research is time consuming, expensive, and requires complicated experimental conditions. In contrast, virtual reality is more cost effective. Virtual reality is a term used to describe a computer-generated virtual environment that can be moved through and manipulated by a user in real time [20]. Virtual technology has taken advantage of its efficient, realistic, and non-destructive properties, and it is becoming more common in the study of underground space perception. Felnhofer et al. [21] showed that VR was able to elicit intended emotions. Sun et al. [22] discussed the influence and effects of the interface morphology of underground squares on spatial experiences. Xu et al. [23] showed that both green visual acuity and the street interface had a significant influence on street healing. Wang et al. [7] used VR to demonstrate that fire visibility exerts a significant influence on occupants’ premovement time, while other factors are not significantly influential in the case of predictable fires. Fang et al. [24] presented an interactive virtual environment and showed that when view was limited, more exits and arranging the exits evenly helped to shorten the time taken to seek the available exits. With the development of the social economy, VR technology can be used to simulate the underground space scenario well and provide practical solutions while promoting the development of research on underground spaces.
In summary, current research on the perception of underground street spaces lacks an exploration of the influence of materials, and most of the research on materials focuses on the interface design of the above-ground commercial street [25]. The side interface of an underground commercial street refers to the side or vertical interface of the underground commercial street space. This study aimed to explore the influence of the side interface material of an underground street on people’s spatial perception. In this investigation, we firstly collected information on underground street interface materials through field research and classified the materials into color, finish, concavity, texture, and secondary texture according to their properties. Then, we analyzed the following two specific issues to provide a new perspective on the mechanism of the influence of the interface on people’s spatial perception in an underground street environment.
Q1: Do different combinations of material properties in an underground street interface have an effect on people’s spatial perception of the underground street?
Q2: Are there significant differences in the effects of different variations of material attributes on people’s spatial perception of an underground street and what are people’s preferences?
Sun et al. [26] explored the correlation between the morphological elements of underground commercial street paving and spatial perception and visual comfort with the help of a VR platform, which laid the theoretical foundation for this paper. In this study, VR technology was used and questionnaires conducted to obtain more realistic emotional responses from the participants. It was a useful attempt to explore the influence of materials on people’s spatial perception of underground streets from the perspective of interface materials. The results of our study can not only complement the existing research on potential factors affecting people’s emotions in underground streets, but also provide new design ideas for high-quality underground street design.

3. Methodology

This study aimed to investigate the influence mechanism of the spatial psychological perception of the interface material design of underground streets. We first conducted field research and online research on underground streets in Xuzhou, China; Shanghai, China; Hohhot, China; and Fukuoka, Japan to summarize the interface materials commonly used in underground streets, and then deconstructed them into physical independent variables to construct experimental scenarios according to the material characteristics. We found that the characteristics of underground streets in Xuzhou were similar to those in Shanghai and other cities; furthermore, the underground streets in Xuzhou were convenient for research. Therefore, Xuzhou underground street was used as the prototype of the experimental scene, which kept its physical size and store layout while switching the interface material. Then, VR was used to simulate the scene and a questionnaire was used to obtain people’s evaluation of their spatial perception. Finally, the data obtained from the questionnaire were processed. Exploratory factor, one-way analysis of variance and mean comparison analysis were used to explore the effect of side interface material on spatial perception (Figure 1).

3.1. Preparation

3.1.1. Experimental Instrument

The experiments were carried out in the immersive virtual reality platform of the VR Lab of the China University of Mining and Technology, which includes a virtual simulation engine (Vizard 5.4), graphics workstation, head-mounted virtual reality glasses (Oculus Rift DK2), and four optical position tracking systems (PPT Studio N).

3.1.2. VR Scene Building

The study aimed to investigate the influence mechanism of the psychological perception of an underground street interface material design space. The lighting conditions in the experimental scenes and the physical scale of the underground street as a non-research object were kept as controlled variables in each experimental scene. Therefore, in this study, all experimental scenes were set to artificial lighting with LED lamps: the illumination level of a 0.75 m horizontal surface in the traffic area of all scenes was maintained at 250 lx, the illumination level of a 0.75 m horizontal surface in the store was 750 lx, and the color temperature of the lamps was unified at a neutral color temperature of 4000 K.
A typical underground street case was used as a prototype for the experimental scene, which kept its physical size and store layout while switching the interface material; this arrangement was more convenient for keeping the control variables consistent and gave the final research results more practical reference significance. The experimental scene captured the underground crossing of Fashion Avenue in Xuzhou, Jiangsu Province, combined with an underground shopping mall as part of the prototype, with a column distance of 8400 mm, column section of 800 mm × 800 mm, net street width of 7600 mm, and net street height of 4200 mm (Figure 2).

3.1.3. Participants

A total of 111 people of all ages and industries were invited to participate in this study. The participants included 78 females and 33 males, all of whom had good visual and mental status without abnormalities. The recruited participants were then tested for color blindness and color weakness, and those who were color blind or could not accurately distinguish colors were identified and excluded from the data of subsequent experiments. Finally, 111 questionnaires were distributed and collected, of which 74 were valid and 37 were invalid, with a valid response rate of 66.7%. The gender ratio of participants was basically balanced, with slightly more women than men, and 84% did not have any in-depth exposure to architecture.

3.1.4. Questionnaire Design

We divided the psychological perception of space into three dimensions: overall spatial perception, side interface perception, and scale perception. Among them, the overall spatial perception dimension included four psychological perceptions (openness, ease, fun, and closeness); the side interface perception dimension included five psychological perceptions (color warmth, orderliness, roughness, lightness, and transparency); and the scale perception dimension included three psychological perceptions (length, width, and height) (Table 1).
The experimental questionnaire was used to describe the participants’ degree of psychological spatial perception according to a Likert scale. A nine-point scale, the variation of 5-point scale, was used so that adjacent options were less radically different (or more gradually different) from each other as compared to a 5-point scale. This larger (step by step) spectrum of choices offers more independence to a participant to pick the ‘exact’ one (which he prefers most) rather than to pick some ‘nearby’ or ‘close’ option [27].
In the questionnaire, a set of descriptors was divided between the left and right ends, and each psychological perception quantity was scored from −4 to 4 according to the degree from one extreme description to the most satisfactory and appropriate to the other extreme description. The most satisfactory value was 0. During statistical analysis, the data were entered as 1–9, with 5 being the most satisfactory value, to avoid statistical errors caused by positive and negative signs. The more the value converged to 5, the higher the psychological perception of satisfaction.

3.1.5. Reliability and Validity Analysis

To test the effect of the changes in interface materials on the participants’ moods, multiple statistical analyses were conducted using SPSS. The side interface material color, side interface material finish, side interface bumpiness, side interface material texture, side interface material secondary texture, and top interface reflectance were considered as categorical independent variables, while the indicators of mood changes were considered continuous dependent variables.
An analysis of reliability was first conducted to verify whether the questionnaire scale data were true and reliable. Cronbach’s alpha coefficient was used to test the quality of the reliability of the scale data. The results of the test (Table 2) showed that the lowest alpha value for the data from the three dimensions was 0.921. An alpha coefficient higher than 0.8 indicated that the reliability quality of the data of this experiment was high and the sample data from the questionnaire on the three dimensions were true and reliable.
After passing the reliability test, factor analysis was conducted for the data from the psychological scale to verify the validity and to analyze whether the questionnaire’s item design was scientific and reasonable. The results of the factor analysis showed that the KMO value of 0.876 was much greater than 0.6, and the p-value of 0 was much less than 0.05, as calculated by Bartlett’s sphericity test, which indicates that it was appropriate to use factor analysis for the data concentration study and for the validation of the experimental satisfaction scale data.

3.2. Variable

3.2.1. Independent Variables

The research data were analyzed to summarize the physical properties of the building materials and deconstruct them into the physical independent variables needed to build the experimental scenes. According to the surface dominance theory of visual perception, the visual system can more effectively represent the visual space below the high horizontal line of the eye [28]. People also locate objects more accurately in space below eye level than in space above. Therefore, the side interface and bottom interface are more important than the top interface in this study. Since the previous study explored the spatial perception of paving on an underground street, this study focused on the influence of the side interface materials on spatial perception. The original bottom interface of Fashion Avenue in central Xuzhou was maintained in all scenes, and the uniform roof design was conserved as well. The properties of a material are generally reflected in color and texture, while its finishing often constitutes a secondary texture (Table 3).
When multi-factor and multi-level experimental studies were required, the experimental design used an orthogonal table to filter out representative multi-factor and multi-level combinations from the full-scale experiment to achieve the same effect as conducting the full-scale experiment with the minimum number of trials. Therefore, the orthogonal analysis of the independent variables representing the material physical properties resulted in a series of combinations that were used to construct an ideal experimental scenario with the same physical dimensions and store layout as the original scenario, but with different material independent variables. The orthogonal design results for the material independent variables of the final experimental scenes are shown in Table 4.
We constructed simulated experimental scenarios in an immersive VR scene according to the results of the orthogonal experimental design. Using the 3ds Max software, the experimental scene model was constructed, and the physical autocorrelation properties of the scene obtained from the orthogonal design were simulated via baked rendering and real-time rendering. Scene roaming screenshots are shown in Table 5.

3.2.2. Dependent Variable

The dependent variable is people’s spatial perception in the underground street. When designing the questionnaire, the spatial psychological perception is divided into three dimensions: overall spatial perception, side interface perception and scale perception, with a total of 12 variables (Table 1). The nine levels of Likert scale were quantified for these variables, and the experimental data were obtained by the participants’ scores.

3.3. Research Design

3.3.1. Procedure

Before the experiment started, the experimenter explained the manual interactive handle control method and introduced the experimental process to the participants. After confirming the participants’ readiness, we had them wear VR glasses for 3–5 min to experience the virtual street scene and adjusted the appropriate viewpoint height and movement speed according to the participant’s eye height and verbal report so that it was as close as possible to their realistic roaming experience.
After confirming that the participants were fully adapted to the virtual scene roaming experience and had no adverse reactions, the experimenter switched to the experimental scene and started the formal experiment. The participants were required to roam freely and experience the experimental scenes for 1 min to form a complete perceptual picture of the scenes; then, the experimenter asked the participants questions about their psychological perceptions. The participants provided scores verbally without leaving the experimental scenes, and the experimenter recorded the answers. The duration was about 2 min. After completing the scale for an experimental scene, participants independently chose to leave or not to leave the virtual scene and rest for half a minute to avoid the fatigue caused by the long duration of a single experiment, which could affect the accuracy of the experimental data. After the rest interval, the participants randomly roamed to the next experimental scene and completed the scale until all 17 experimental scenes were completed. The total experiment time for a single person ranged from 55 to 90 min.

3.3.2. Data Analysis

The questionnaire design has been analyzed for reliability and validity, which proves that the questionnaire data are reliable, and the questionnaire design is scientific. This paper studies the influence of the interface material of the side of the underground street on people’s spatial perception. Exploratory factor analysis (EFA) is a technique used to identify the essential structure of multivariate observed variables and process them for dimensionality reduction. Thus, EFA is able to synthesize variables with intricate relationships into a few core factors and effectively reduce the influence of factors. Their variance interpretation rates are used as weights to calculate the composite score of scenes and rank the scenes. The ranking results are used to make preliminary inferences about people’s preferences for material classification.
When the types of physical independent variables differed, in order to determine whether the corresponding psychological perceptual quantities were significantly different—and thus to determine which psychological perceptual quantities were significantly affected by the types of physical independent variables—the original data scores from the psychological perception questionnaires for similar scenarios were classified according to color, finish, convexity, texture and secondary texture to take the mean value, and one-way ANOVA was performed on this mean value. The items with significant effects were identified and the means were counted to determine the trend of the effect of the physical independent variables on the psychological perception quantities.

4. Results

4.1. Scene Sequencing Study

4.1.1. Exploratory Factor Analysis

In order to investigate the influence of interface materials on overall spatial perception, the differences in 12 psychological perception quantities between different experimental scenarios were investigated and an attempt was made to rank a total of 17 experimental scenarios from S0–S16 in a comprehensive manner.
From Table 6, it can be seen that warmth, orderliness, roughness, lightness, closeness, and fun were the highest load factors under factor 1 and all were greater than 0.4, which meant that factor 1 corresponded to the interface perception dimension. Length perception, width perception, and height perception were the highest factor load factors under factor 2 and all were greater than 0.4, which indicated that factor 2 corresponded to the expected scale perception dimension. The sense of openness and ease had the highest loading coefficients under factor 3 and all were greater than 0.4; that is, factor 3 corresponded to the expected overall spatial atmosphere perception dimension. Accordingly, the logical internal structure identified by the validity analysis was basically consistent with the expected internal logical structure in the sense of architectural profession, which indicated that the validity of the data structure of the experiment was good.
Therefore, factor 1 was named as the interface perception factor, factor 2 as the scale perception factor, and factor 3 as the overall space perception factor. After adjusting the sense of fun and roughness from the overall spatial perception dimension to the interface perception dimension, the questionnaire data from experiment A were re-tested for reliability. The test results (Table 7) showed that the lowest alpha value for the data from the three dimensions was 0.91; since the alpha coefficient was higher than 0.8, which is regarded as indicating high reliability, the scale data remained true and credible under the three dimensions after adjustment.

4.1.2. Scene Sequencing

Taking the variance explained ratio of each of the three common factors in the exploratory factor analysis (EFA), i.e., overall spatial perception factor, interface perception factor, and scale perception factor, as the cumulative variance explained ratio, the weights of the three factors were 47.158%/88.967%, 24.894%/88.967%, and 16.914%/88.967%, respectively. Thus, the composite score formula was:
SCORE = Fac1 × 47.158/88.967 + Fac2 × 24.894/88.967 + Fac3 × 16.914/88.967
The ranking of the 17 scenarios as calculated by the composite score formula from S0 to S16 is shown in Table 8.
Since the weights in this method were formed only by the ratio of variance interpretation rates (Table 9) and have no practical significance in terms of construction expertise, this ranking only indicates that the top-ranked scenes scored higher on the items for which the factor analysis could accurately summarize the information from the recorded data.
As can be seen from Table 10, the color of the top four scenes was white, while the scores of black scenes were generally lower, and the participants had a higher recognition of white scenes and a poorer spatial experience in black scenes. From the scenes with higher scores, it was concluded that materials with medium and high gloss and low bumpiness were more popular. As for the material texture, it had to be matched with secondary texture; a combination where one had an obvious direction and the other had no texture was more preferred by the participants.

4.2. Relationship between the Physical Independent Variables of the Scene and Psychological Perception as the Dependent Variable

On the basis of scene ranking, one-way ANOVA and mean value comparison were used to determine whether there were significant differences in the spatial psychological perception data of different physical independent variables and what were the trends of the differences.

4.2.1. One-Way ANOVA

According to the one-way ANOVA for color classification (Table 11): there were 10 significant differences among the samples in the color classification of the side interface material for height, transparency, lightness, roughness, orderliness, warmth, closeness, fun, ease, and openness. The p values of significance were less than 0.01 for all variables except for orderliness, which was less than 0.05.
One-way ANOVA on the material finish of the side interface (Table 12) shows that there were four significant differences among the samples in the finish of the side interface material for transparency, roughness, warmth, and openness. The p values of significance were less than 0.05 for warmth, while the other three items had p values less than 0.01. The p values were 0.041, 0.05, and 0.01 for warmth and less than 0.01 for the other three items.
There were two significant differences in the roughness and orderliness of the side interface material concavity samples; the p values were 0 and 0.036, respectively (Table 13).
There were significant differences for warmth in the texture samples (Table 14).
The samples with different secondary textures on the side interface (Table 15) showed no significant differences in the sense of height, width, length, transparency, lightness, roughness, orderliness, warmth, closeness, fun, ease, or openness, with p values greater than 0.05.

4.2.2. Mean Value Comparison

The mean value of the original scale data was obtained for the psychological perception data that had a significant effect on the classification of each physical independent variable, and a line graph was drawn. The closer the mean value was to 5, the higher the psychological satisfaction level, and the further the mean value deviated from 5, the lower the psychological satisfaction level.
The analysis of the mean value of the color classification of the side interface material (Figure 3) produced the following results:
  • In terms of height perception satisfaction, white scene > warm scene = cold scene > black scene. The mean values of the warm, cold, and black scenes were all less than 5, indicating that the scenes tended to make the participants feel uncomfortable with the short height of the underground street.
  • For satisfaction with interface transparency, white scene > warm scene = cold scene > black scene. The mean values of the warm, cold, and black scenes were all less than 5, indicating that the scenes tended to make participants feel uncomfortable because the underground street interface was too closed.
  • In terms of satisfaction with lightness, the white scenes were more satisfactory than the warm scenes, the cold scenes, and the black scenes. White scenes tended to make participants feel too bright and uncomfortable, and warm, cold, and black underground street scenes tended to feel too dark and uncomfortable to the participants.
  • In terms of roughness satisfaction, warm color scene > white scene > cold color scene > black scene. Black and cold underground street scenes tended to feel too rough and uncomfortable to participants.
  • In terms of satisfaction with the sense of orderliness, white scene > warm scene = black scene > cold scene. Warm scenes, black scenes, and cold scenes tended to feel too messy and uncomfortable to participants.
  • In terms of satisfaction with color warmth, white scene > warm color scene > cold color scene > black scene. White, cold, and black underground street scenes tended to make the participants feel discomfort because the color was too cold, and warm underground street scenes tended to make the participants feel discomfort because the color was too warm.
  • Regarding the satisfaction with closeness, white scene > warm scene = cold scene > black scene. The white underground street scene tended to make the participants feel too close and uncomfortable, and the warm, cold, and black scenes tend to make the participants feel too detached and uncomfortable.
  • In terms of satisfaction with the sense of fun, warm color scene > white scene > cold color scene > black scene. The cold color and black underground street scenes tended to make the participants feel too bored and uncomfortable.
  • In terms of satisfaction with ease, warm scenes ≥ white scenes > cold scenes > black scenes. The white underground street scene tended to make the participants feel relaxed and comfortable, and the warm, cold, and black underground street scenes tended to make the participants feel too depressed and uncomfortable.
  • As for the satisfaction with openness, cold scenes ≥ warm scenes > black scenes > white scenes. The white scene tended to make the participants feel too open and uncomfortable.
The mean value of the white scene was closer to 5 than the other three scenes, which showed that people were more satisfied with the overall spatial perception of the white scene.
The analysis of the mean value of the material finish classification of the side interface (Figure 4) gave the following results:
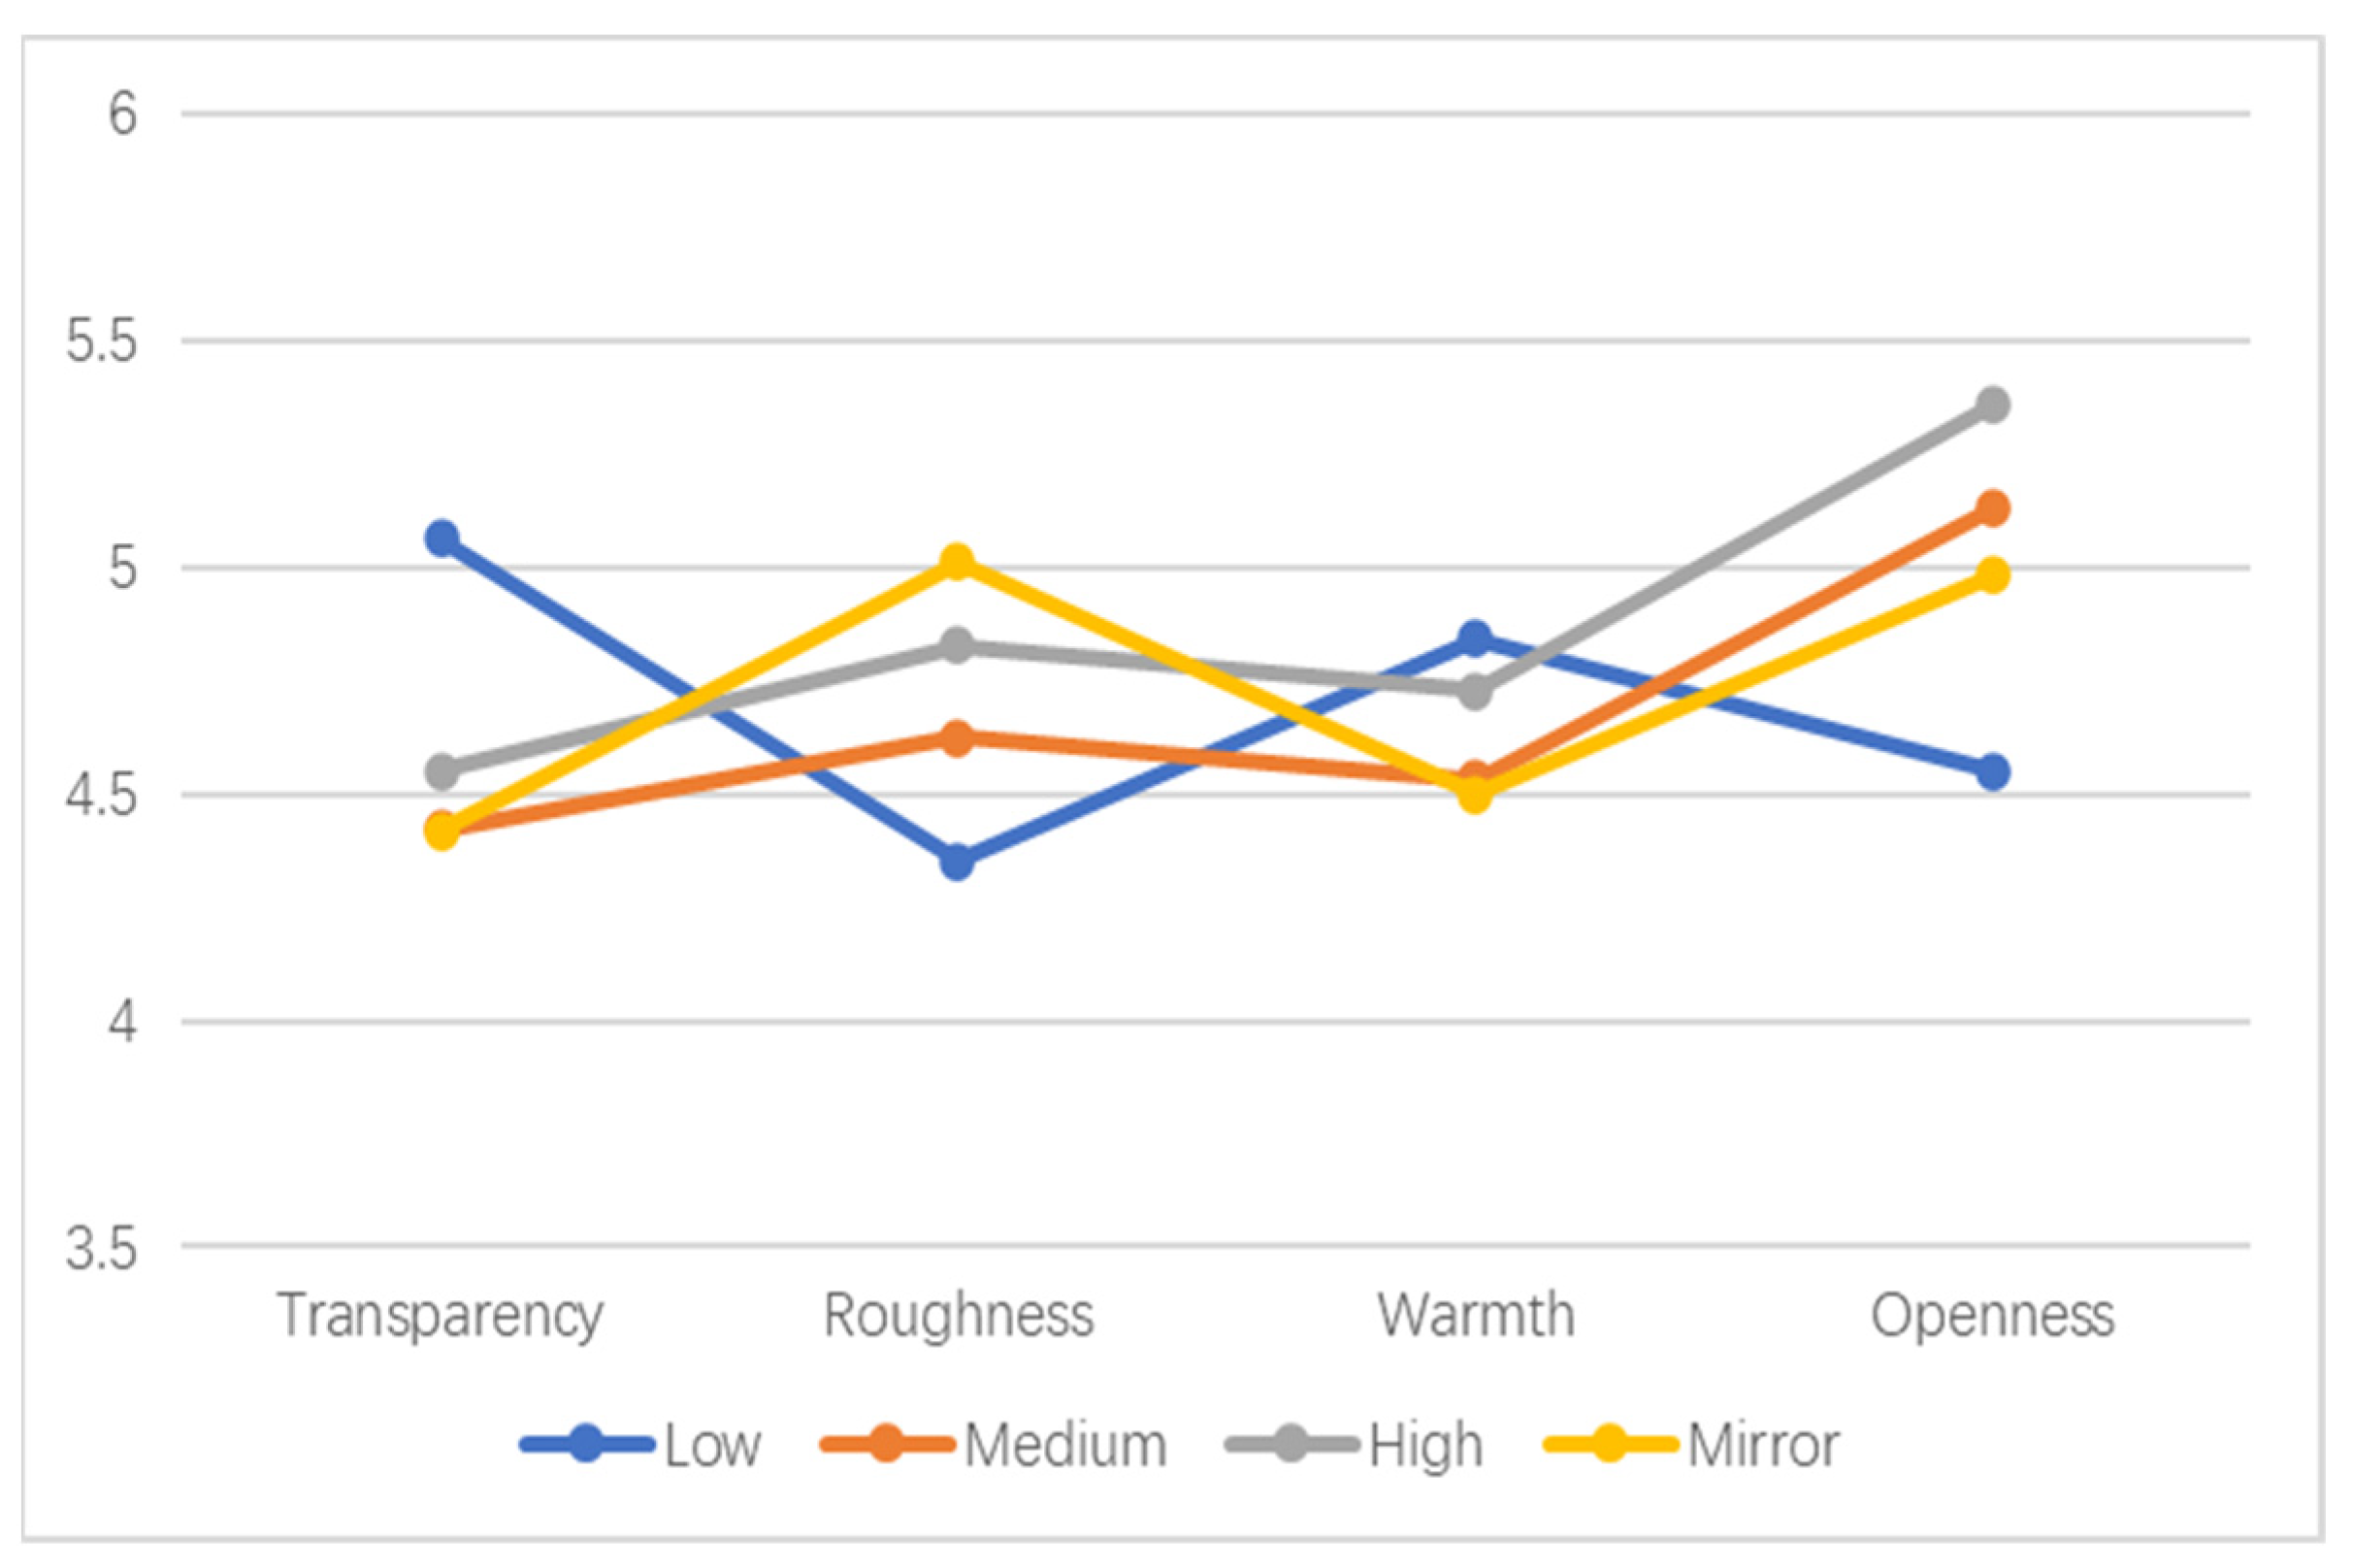
  • In terms of satisfaction with the transparency of the interface, low finish material > high finish material > mirror material = medium finish material. The side interfaces of the underground street made up of medium- and high-gloss materials and mirrored materials tended to make the participants feel too closed-in and uncomfortable.
  • In terms of satisfaction with the roughness of the interface, mirror material > high-gloss material > medium-gloss material > low-gloss material. The side interfaces of the underground street composed of high-, medium-, and low-gloss materials tended to feel too rough and uncomfortable to participants.
  • In terms of satisfaction with the color warmth of the interface, low-gloss material > high-gloss material > medium-gloss material = mirror material. The side interfaces made up of medium- and high-gloss materials and mirror materials tended to make the participants feel uncomfortable because the color was too cold.
  • Regarding the satisfaction with openness, mirror material > medium-gloss material > high-gloss material > low-gloss material. The underground street scene with high-gloss material on the side interface tended to make the participants feel too open and uncomfortable, while the underground street scene with low-gloss material on the side interface tended to make the participants feel too crowded and uncomfortable.
The average values for all four types of glossy side interface materials tended to be close to 5; however, the average value of high-gloss materials tended to be closer to 5 and less volatile, which showed that the participants preferred scenes with high gloss.
The analysis of the mean value of the classification of the degree of material concavity of the side interface (Figure 5) showed that:
  • In terms of roughness satisfaction, side interfaces with low material bumpiness > side interfaces with high material bumpiness. The underground street scenes with a high degree of concavity or convexity of the side interface tended to make the participants feel too rough and uncomfortable.
  • As for the satisfaction with the sense of order, the side interface with a low degree of material concavity > the side interface with a high degree of material concavity. The side streets with a high degree of bumpiness made the participants feel too messy and uncomfortable.
In conclusion, the satisfaction level for the side interface with low material bumpiness was higher, and the mean value was closer to 5, which indicates that it was preferred by the participants.
The analysis of the mean value of satisfaction with the warmth and coldness of the color of the side interface material and texture classification (Figure 6) showed that the satisfaction with the color warmth and coldness of the side interface composed of materials with no directional texture > materials without texture = materials with directional texture. Underground street scenes with no texture or directional texture to the side interface material tended to make the participants feel uncomfortable with the colors being too cold. The mean value of non-directional texture was closer to 5, indicating people preferred non-directional texture to satisfy their needs for color warmth.

5. Discussion

5.1. Research Innovation

The present study was related to but different from the currently established studies. As proposed by Zhou et al. [10] in their study, this study used VR technology to finely classify and quantitatively evaluate the overall perception of comfort. Learning from the analysis method of Zhang et al. [29], the experimental data were initially analyzed before digging deeper into the connections behind them. Thus, we first analyzed the evaluation data obtained through questionnaires in VR experiments to rank and analyze the overall scene evaluation. Based on this analysis, the material categories were subdivided, and a one-way ANOVA was conducted. Unlike Akiyama. et al. [30], who reported that the physical parameters affecting the visual perception of wooden architectural flooring were “contrast”, “fiber gloss”, and “surface gloss”, in this paper, the relationship between interface materials and spatial perception was explored in more detail by classifying the material properties of side interfaces to provide more precise suggestions for the design of underground streets.
Although previous studies [31] have addressed the influence of interface design on the visual perception of streets, this study changed the study area to an underground space, and the study object was specific to the material properties, which breaks the boundary of this research line. In addition, this study included color blindness and color weakness tests in the experimental design to avoid the errors caused by color-blind subjects. In order to allow subjects to provide more realistic data, this study combined scene modeling with a real built commercial street prototype to conduct experiments using VR equipment.
Overall, this study built on our previous study [26] and explored the effect of the side interface material on spatial perception. Although the top and bottom interface styles still have a slight effect on spatial perception, this study effectively controlled the variables and showed participants an underground street space created with side interface materials that had different characteristics, and found that the use of white, high-gloss, and non-directional texture with low concavity for the side interface was more in line with people’s preferences.

5.2. Limitations and Future Directions

In order to avoid subjects feeling bored by the long experiment and questionnaire, which could lead to experimental errors, only a single color was chosen for the construction of the experimental scene of the underground street. During the construction of the experimental scene of the underground street, only black, white, cold, and warm colors were chosen for the interface materials. If a multi-gradient color composition classification was chosen for each color category, more convincing and richer research conclusions could be drawn, and an investigation of the interrelationship between the physical characteristics of interface color and spatial psychological perception and the influence trend might become possible.
Due to the current epidemic, offline experiments caused difficulties due to an unstable network status and low values of the questionnaire response rate for remote experiments. Remote experiments should be considered in future questionnaire design.
In order to better control the variables, we minimized the influence from the top and bottom interfaces. However, lighting is a passive strategy that is important for improving the vitality, performance, and visual comfort of residents [9]. Different lighting environments may also have an impact on spatial perception. In future studies, lighting should be added to the independent variables for exploration.
The focus of this paper was on the subjective evaluation of the participants; however, different life experiences also have an impact on people’s spatial perception. Some existing studies have recorded oculomotor and dermatomotor EEG activity to obtain more objective data. We suggest that objective physiological data should be combined with subjective evaluations in future studies.

6. Conclusions and Implications

6.1. Conclusions

This study discussed in detail the interrelationship between interface materials, spatial psychological perceptions, and influence trends in underground commercial streets through virtual experiments and questionnaire surveys. The answers to the two research questions can be summarized as follows:
  • Different material attributes of the side interface of underground streets have an impact on people’s spatial perception. Most of the top-ranked scenes were white and had a medium–high gloss and low bumpiness.
  • From the material properties, color classification showed a significant variability in the amount of space perception for 10 qualities; thus, it was concluded that color changes had a greater impact on space perception. The side interface material finish showed significant differences for four perceptual qualities, the concavity sample showed significant differences for two items, and the texture sample showed significant differences for one item, which shows that these material attributes also contributed different degrees of influence on spatial perception.
From the mean value analysis, the mean value of the white scene was closer to 5 than the other three scenes, which showed that the participants were more satisfied with the overall spatial perception of the white scene. Textures with high glossiness, low bumpiness, and no directionality were also preferred.

6.2. Implications

Overall, the findings of this study have a number of implications:
  • When deciding the interior color of underground streets, priority should be given to white walls.
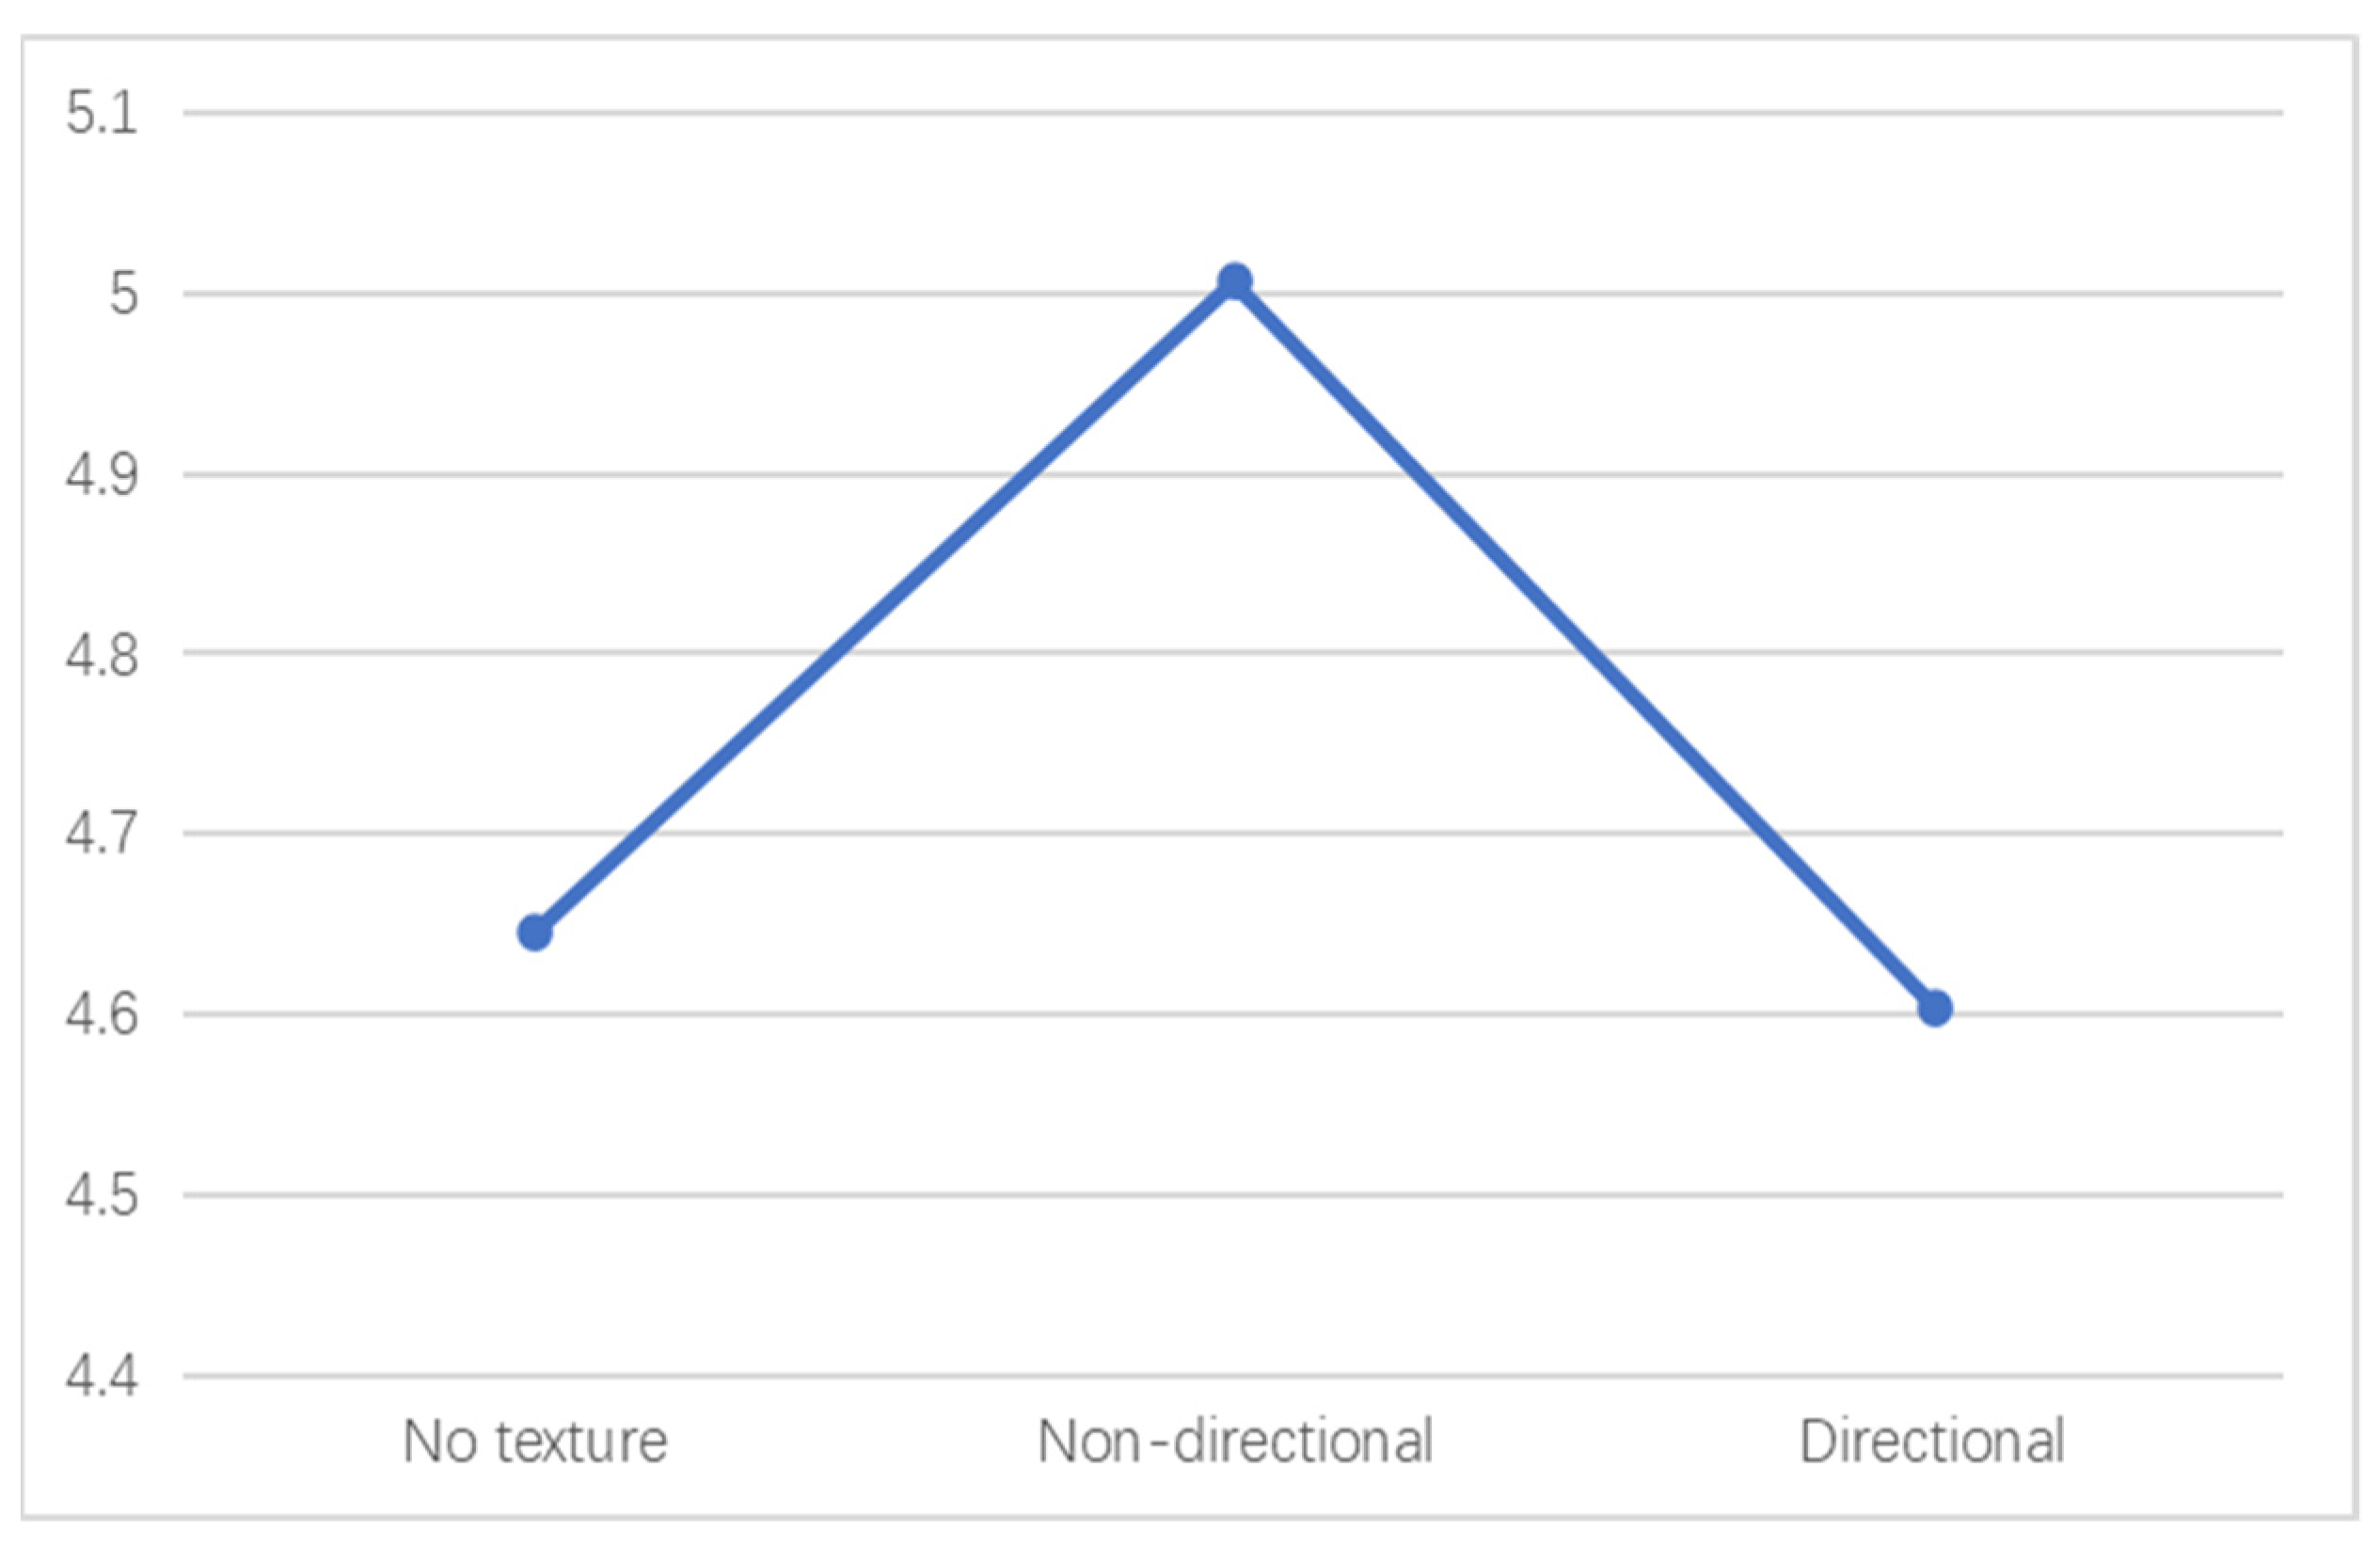
  • In order to create a more comfortable underground street space atmosphere, the side interface of the underground street should preferably use materials with high gloss, low bumpiness, and non-directional texture.
Although it was verified that the physical characteristics of underground street interface materials have a significant effect on the psychological perception of space, it is still necessary to consider the balance between various satisfaction levels to create a comfortable underground commercial street space. We hope that these findings will provide strategies for planning and design interventions for underground commercial streets to create healthier high-density cities.

Author Contributions

Conceptualization, L.S., S.D., Y.R., M.L. and B.W.; Data curation, S.D. and Y.R.; Formal analysis, Y.R.; Funding acquisition, L.S.; Investigation, Y.R.; Methodology, Y.R.; Project administration, L.S. and M.L.; Resources, L.S.; Supervision, L.S. and M.L.; Validation, L.S., S.D. and M.L.; Visualization, S.D. and B.W.; Writing—original draft, S.D., Y.R. and B.W.; Writing—review and editing, L.S., S.D., M.L. and B.W. All authors have read and agreed to the published version of the manuscript.

Funding

This study was part of the project called “Research on the key problems of quantitative evaluation of environmental quality of urban underground streets” funded by International Science and Technology Cooperation Fund of Jiangsu Collaborative Innovation Center for Building Energy Saving and Construction Technology, the funding number is SJXTGJ2102.

Institutional Review Board Statement

Not applicable.

Informed Consent Statement

Not applicable. The research method of this paper is to use VR to establish a virtual scene. During the experiment, participants only need to wear VR devices and answer the questionnaire. Informed consent was obtained from all participants involved in the study. There were no studies involving humans or animal subjects.

Data Availability Statement

Data are available on request from the authors.

Conflicts of Interest

The authors declare no conflict of interest.

References

  1. Tang, Z.; Kang, J.; Jin, H. Experimental study of the sound field in an underground shopping street. Tunn. Undergr. Space Technol. 2013, 36, 1–4. [Google Scholar] [CrossRef]
  2. Maden, D.A.; Avlar, E. Evaluation of the passenger areas of underground subway stations in terms of visual comfort: The sample of kadıköy and kartal stations//yer altı metro istasyonlarındaki yolculu alanların görsel konfor açısından değerlendirilmesi: Kadıköy ve kartal istasyonları örneği. Megaron 2017, 12, 13–26. [Google Scholar] [CrossRef]
  3. Audi, Y.; Jullien, A.; Dauvergne, M.; Feraille, A.; Schwartzentruber, L.D.A. Methodology and application for the environmental assessment of underground multimodal tunnels. Transp. Geotech. 2020, 24, 100389. [Google Scholar] [CrossRef]
  4. Meng, Q.; Kang, J.; Jin, H. Field study on the influence of spatial and environmental characteristics on the evaluation of subjective loudness and acoustic comfort in underground shopping streets. Appl. Acoust. 2013, 74, 1001–1009. [Google Scholar] [CrossRef]
  5. Dong, X.; Wu, Y.; Chen, X.; Li, H.; Cao, B.; Zhang, X.; Yan, X.; Li, Z.; Long, Y.; Li, X. Effect of thermal, acoustic, and lighting environment in underground space on human comfort and work efficiency: A review. Sci. Total Environ. 2021, 786, 147537. [Google Scholar] [CrossRef]
  6. Kim, J.; Cha, S.H.; Koo, C.; Tang, S.K. The effects of indoor plants and artificial windows in an underground environment. Build. Environ. 2018, 138, 53–62. [Google Scholar] [CrossRef]
  7. Wang, D.; Zhou, T.; Li, X. Impacts of environment and individual factors on human premovement time in underground commercial buildings in China: A virtual reality–based study. ASCE-ASME J. Risk Uncertain. Eng. Syst. Part A Civ. Eng. 2021, 7, 04020056. [Google Scholar] [CrossRef]
  8. Yang, B.; Yao, H.; Yang, P.; Guo, Y.; Wang, F.; Yang, C.; Li, A.; Che, L. Effects of thermal and acoustic environments on workers’ psychological and physiological stress in deep underground spaces. Build. Environ. 2022, 212, 108830. [Google Scholar] [CrossRef]
  9. Tan, Z.; Roberts, A.C.; Christopoulos, G.I.; Kwok, K.W.; Car, J.; Li, X.; Soh, C.K. Working in underground spaces: Architectural parameters, perceptions and thermal comfort measurements. Tunn. Undergr. Space Technol. 2018, 71, 428–439. [Google Scholar] [CrossRef]
  10. Zhou, B.; Gui, Y.; Xie, X.; Li, W.; Li, Q. A multi-category intelligent method for the evaluation of visual comfort in underground space. Tunn. Undergr. Space Technol. 2022, 124, 104488. [Google Scholar] [CrossRef]
  11. Li, J.; Wu, W.; Jin, Y.; Zhao, R.; Bian, W. Research on environmental comfort and cognitive performance based on EEG+ VR+ LEC evaluation method in underground space. Build. Environ. 2021, 198, 107886. [Google Scholar] [CrossRef]
  12. Gui, Y.; Zhou, B.; Xie, X.; Li, W.; Zhou, X. GAN-based method for generative design of visual comfort in underground space. IOP Conf. Ser. Earth Environ. Sci. 2021, 861, 072015. [Google Scholar] [CrossRef]
  13. Zhang, M.; Zheng, X.; Wang, K. Analysis on the knowledge mapping of foreign research on urban underground space. Sci. Surv. Mapp. 2018, 7, 180–186. [Google Scholar] [CrossRef]
  14. Anderson, R.; Arro, J.; Hansen, C.S.; Serafin, S. Audio-visual perception—The perception of object material in a virtual environment. In AVR 2016: Augmented Reality, Virtual Reality, and Computer Graphics; LNCS 9768; De Paolis, L., Mongelli, A., Eds.; Springer: Cham, Switzerland, 2016; pp. 162–171. [Google Scholar] [CrossRef]
  15. Sawayama, M.; Nishida, S.Y. Material and shape perception based on two types of intensity gradient information. PLoS Comput. Biol. 2018, 14, e1006061. [Google Scholar] [CrossRef]
  16. Fleming, R.W. Visual perception of materials and their properties. Vis. Res. 2014, 94, 62–75. [Google Scholar] [CrossRef] [PubMed]
  17. Fan, W.; Liu, W.J. Applied research on the decorative materials in indoor underground public space. In Applied Mechanics and Materials; Sun, D., Sung, W.P., Chen, R., Eds.; Trans Tech Publications Ltd.: Zurich, Switzerland, 2011; Volume 71–78, pp. 5099–5102. [Google Scholar] [CrossRef]
  18. Hwang, Y.R. Change of visual perceptions in Taiwan’s aged people with mild dementia caused by the textures of building materials. Ageing Int. 2014, 39, 221–232. [Google Scholar] [CrossRef]
  19. Wang, C.; Lu, W.; Ohno, R.; Gu, Z. Effect of wall texture on perceptual spaciousness of indoor space. Int. J. Environ. Res. Public Health 2020, 17, 4177. [Google Scholar] [CrossRef] [PubMed]
  20. Mandal, S. Brief introduction of virtual reality & its challenges. Int. J. Sci. Eng. Res. 2013, 4, 304–309. Available online: https://citeseerx.ist.psu.edu/viewdoc/download?doi=10.1.1.302.4239&rep=rep1&type=pdf (accessed on 20 July 2022).
  21. Felnhofer, A.; Kothgassner, O.D.; Schmidt, M.; Heinzle, A.K.; Beutl, L.; Hlavacs, H.; Kryspin-Exner, I. Is virtual reality emotionally arousing? Investigating five emotion inducing virtual park scenarios. Int. J. Hum-Comput. Stud. 2015, 82, 48–56. [Google Scholar] [CrossRef]
  22. Sun, L.; Feng, L.; Zhang, Y.; Ji, X.; Wong, H.; Wei, Z. Research on correlation between underground squares’ interface morphology and spatial experience based on virtual reality. Int. J. Pattern Recognit. Artif. Intell. 2019, 34, 2050004. [Google Scholar] [CrossRef]
  23. Xu, L.Q.; Meng, R.X.; Huang, S.Q.; Chen, Z. Healing oriented street design: Experimental explorations via virtual reality. Chin. J. Urban Plan. Int. 2019, 34, 38–45. [Google Scholar] [CrossRef]
  24. Fang, Z.; Xu, X.; Jiang, L.; Li, X.; Huang, N. Study on the exit-selecting behavior in underground indoor space with fire using a virtual experiment. Tunn. Undergr. Space Technol. 2021, 112, 103936. [Google Scholar] [CrossRef]
  25. Al Mushayt, N.S.; Dal Cin, F.; Barreiros Proença, S. New lens to reveal the street interface. A morphological-visual perception methodological contribution for decoding the public/private edge of arterial streets. Sustainability 2021, 13, 11442. [Google Scholar] [CrossRef]
  26. Sun, L.; Tan, W.; Ren, Y.; Ji, X.; Wang, Z.; Li, P. Research on visual comfort of underground commercial streets’ pavement in China on the basis of virtual simulation. Int. J. Pattern Recognit. Artif. Intell. 2019, 34, 2050005. [Google Scholar] [CrossRef]
  27. Dawes, J. Do data characteristics change according to the number of scale points used? An experiment using 5-point, 7-point and 10-point scales. Int. J. Mark. Res. 2008, 50, 61–104. [Google Scholar] [CrossRef]
  28. Zhou, L.; Shi, P.; Ooi, T.L.; He, Z. Perceptual space asymmetry above and below the eye level reveals ground superiority in the reduced cue environment. J. Vis. 2012, 12, 914. [Google Scholar] [CrossRef]
  29. Zhang, R.X.; Zhang, L.M. Panoramic visual perception and identification of architectural cityscape elements in a virtual-reality environment. Futur. Gener. Comput. Syst. 2021, 118, 107–117. [Google Scholar] [CrossRef]
  30. Akiyama, A.; Araki, Y.; Hosoya, S. Influence of the impression of visual perception by physical parameters of flooring-especially,“contrast”, “fiber luster” and “surface gloss”. Trans. Jpn. Soc. Kansei Eng. 2016, 15, 327–336. [Google Scholar] [CrossRef]
  31. Wu, Y.; Chen, X.; Li, H.; Zhang, X.; Yan, X.; Dong, X.; Li, X.; Cao, B. Influence of thermal and lighting factors on human perception and work performance in simulated underground environment. Sci. Total Environ. 2022, 828, 154455. [Google Scholar] [CrossRef] [PubMed]
Figure 1. Research Framework.
Buildings 12 01432 g001
Figure 2. Fashion Avenue in Xuzhou.
Buildings 12 01432 g002
Figure 3. Mean value of color classification.
Buildings 12 01432 g003
Figure 4. Mean value of finish classification.
Buildings 12 01432 g004
Figure 5. Mean value of concave/convex degree classification.
Buildings 12 01432 g005
Figure 6. Mean value of texture classification.
Buildings 12 01432 g006
Table 1. Comparison of vocabulary and psychological perception.
Questionnaire DescriptorsPsychological Perception
Overall spatial perceptionToo crowded–too openOpenness
Too depressing–too relaxingRelaxation
Too boring–too excitingFun
Too distant–too closeCloseness
Interface perceptionToo cold colors–too warm colorsWarmth
Too messy–too regularOrderliness
Too rough–too smoothRoughness
Too dark–too brightLightness
Too closed–too transparentTransparency
Scale perceptionToo short–too longLength perception
Too narrow–too wideWidth perception
Too short–too highHeight perception
Table 2. Cronbach reliability analysis.
NameCorresponding Itemsα Factor
Overall spatial perception40.921
Interface perception50.958
Scale perception30.938
Table 3. Independent variables of experimental scenes.
InterfaceIndependent VariableHorizontal Category
Bottom interfaceOriginal bottom interface of Fashion Avenue in central Xuzhou
Side interfaceColorCold (No. 0613)Warm (No. 1085)Black (No. 1716)White (No. 1321)
FinishLow (Ra = 3.2 μm or more)Medium (Ra = 3.2 μm~Ra0.8 μm)High (Ra = 0.8 μm~Ra0.2 μm)Mirror (Ra = 0.2 μm or less)
ConcavityLow (change in undulation less than 1 cm)High (undulation change greater than 1 cm)
TextureNo textureNon-directionalDirectional
Secondary textureNo textureNon-directionalDirectional
Top surfaceUniform top
Table 4. Orthogonal design results of independent variables in experimental scenes.
ColorFinishConvexityTextureSecondary TextureTop Interface
S1WarmHighLowNo textureNo textureLow reflectivity
S2BlackMediumLowDirectionalDirectionalLow reflectivity
S3WhiteMediumLowNon-directionalNo textureMirror
S4BlackLowLowNo textureNon-directionalMirror
S5WarmLowHighNon-directionalDirectionalMirror
S6BlackHighHighNon-directionalNo textureLow reflectivity
S7ColdMediumHighNo textureNo textureMirror
S8WarmMediumHighNo textureNon-directionalLow reflectivity
S9ColdMirrorLowNon-directionalNon-directionalLow reflectivity
S10ColdHighLowNo textureDirectionalMirror
S11WhiteMirrorHighNo textureDirectionalLow reflectivity
S12BlackMirrorHighNo textureNo textureMirror
S13ColdLowHighDirectionalNo textureLow reflectivity
S14WarmMirrorLowDirectionalNo textureMirror
S15WhiteHighHighDirectionalNon-directionalMirror
S16WhiteLowLowNo textureNo textureLow reflectivity
S0Restore the status quo of Fashion Avenue in central Xuzhou
Table 5. Scene roaming screenshots.
Scene 1 ScreenshotScene 2 ScreenshotScene 3 ScreenshotScene 4 Screenshot
Buildings 12 01432 i001 Buildings 12 01432 i002 Buildings 12 01432 i003 Buildings 12 01432 i004
Scene 5 ScreenshotScene 6 ScreenshotScene 7 ScreenshotScene 8 Screenshot
Buildings 12 01432 i005 Buildings 12 01432 i006 Buildings 12 01432 i007 Buildings 12 01432 i008
Scene 9 ScreenshotScene 10 ScreenshotScene 11 ScreenshotScene 12 Screenshot
Buildings 12 01432 i009 Buildings 12 01432 i010 Buildings 12 01432 i011 Buildings 12 01432 i012
Scene 13 ScreenshotScene 14 ScreenshotScene 15 ScreenshotScene 16 Screenshot
Buildings 12 01432 i013 Buildings 12 01432 i014 Buildings 12 01432 i015 Buildings 12 01432 i016
Scene 0 Screenshot
Buildings 12 01432 i017
Table 6. Factor analysis results.
NameFactor Loading FactorCommonality (Common Factor Variance)
Fac 1Fac 2Fac 3
Height0.3920.8370.0570.858
Width0.190.9140.270.944
Length0.2920.8840.2210.916
Transparency0.8290.4010.0620.852
Lightness0.8940.2930.1450.906
Roughness0.8140.2650.2960.82
Orderliness0.7980.3080.2780.81
Warmth0.8720.2880.1980.882
Closeness0.8430.1480.4040.896
Fun0.8580.2140.3520.907
Ease0.5790.1810.7450.924
Openness0.2320.2740.9130.962
Table 7. Factor Analysis Variance Interpretation.
Factor NumberOriginal EigenrootSum Of Squares of Rotating Loads
ValueVariance Explanation %Cumulative Variance Explained %ValueVariance Explanation %Cumulative Variance Explained %
18.27268.935%68.935%5.65947.158%47.158%
21.45312.111%81.046%2.98724.894%72.052%
30.9517.921%88.967%2.0316.914%88.967%
Table 8. Cronbach reliability analysis.
NameCorresponding Itemsα Factor
Overall spatial perception20.91
Interface perception70.938
Scale Perception30.97
Table 9. Ranking of scene comprehensive scores.
NameFAC1FAC2FAC3Score
S163.3084433.8280411.8851333.183202
S113.2326233.8279691.9862723.162221
S153.0645583.7160252.2362373.089335
S03.3270363.7345911.2238053.041181
S33.0456843.7032382.0209333.03482
S132.8289753.7140452.4708563.008512
S82.8239213.7111862.3304712.978344
S102.9109193.6005262.2485872.977927
S12.7447753.6877142.1953642.904138
S52.6636773.7830362.2531032.8988
S22.6678573.6762132.2443172.869455
S92.5940683.6806632.3008772.842341
S72.5628923.7555092.1943072.826498
S62.4337143.8751762.2470962.801545
S142.55843.5881852.1305092.765168
S42.4559693.7984642.0621642.756719
S122.2677323.5647382.2220552.62194
Table 10. Physical independent variables of each scene.
ScoreColorBrightnessUnevennessTextureSecondary Texture
S163.183202WhiteLowLowNoneNone
S113.162221WhiteMirrorHighNoneDirectional
S153.089335WhiteHighHighDirectionalNon-directional
S03.041181
S33.03482WhiteMediumLowNon-directionalNone
S133.008512ColdLowHighDirectionalNone
S82.978344WarmMediumHighNoneNon-directional
S102.977927ColdHighLowNoneDirectional
S12.904138WarmHighLowNoneNone
S52.8988WarmLowHighNo directionalDirectional
S22.869455BlackMediumLowDirectionalDirectional
S92.842341ColdMirrorLowNon-directionalNon-directional
S72.826498ColdMediumHighNoneNone
S62.801545BlackHighHighNon- directionalNone
S142.765168WarmMirrorLowDirectionalNone
S42.756719BlackLowLowNoneNon-directional
S122.62194BlackMirrorHighNoneNone
Table 11. Variance analysis of color classification.
Color Classification (Mean ± Standard Deviation)Fp
Cold (n = 74)Warm (n = 74)Black (n = 74)White (n = 74)
Height4.76 ± 0.754.75 ± 0.654.60 ± 0.664.97 ± 0.553.9440.009 **
Width4.89 ± 0.774.99 ± 0.784.90 ± 0.784.98 ± 0.630.3640.779
Length4.99 ± 0.815.15 ± 0.825.16 ± 0.975.08 ± 0.640.730.535
Transparency4.39 ± 1.134.36 ± 0.954.12 ± 1.025.00 ± 0.7011.3140.000 **
Lightness4.11 ± 1.154.76 ± 1.113.77 ± 1.125.25 ± 0.7429.6690.000 **
Roughness4.68 ± 1.015.05 ± 0.814.59 ± 0.894.84 ± 0.793.8280.010 *
Orderliness4.45 ± 1.124.75 ± 0.974.76 ± 1.035.01 ± 0.794.0680.007 **
Warmth4.16 ± 1.245.71 ± 1.103.60 ± 1.324.74 ± 1.0043.4750.000 **
Closeness4.56 ± 0.984.65 ± 1.093.90 ± 1.365.30 ± 1.2617.610.000 **
Fun4.40 ± 1.275.06 ± 1.383.98 ± 1.384.81 ± 1.0910.0760.000 **
Ease4.38 ± 1.434.61 ± 1.353.68 ± 1.415.47 ± 1.2721.6910.000 **
Openness5.08 ± 1.365.16 ± 1.154.88 ± 1.275.59 ± 1.184.3150.005 **
* p < 0.05 ** p < 0.01.
Table 12. Variance Analysis of finish classification.
Finish (Mean ± Standard Deviation)Fp
Low (n = 74)Medium (n = 74)High (n = 74)Mirror (n = 74)
Height4.76 ± 0.614.84 ± 0.594.74 ± 0.564.75 ± 0.740.380.768
Width4.76 ± 0.614.88 ± 0.704.99 ± 0.674.94 ± 0.811.5060.213
Length4.94 ± 0.715.11 ± 0.825.11 ± 0.755.09 ± 0.830.8140.487
Transparency5.06 ± 0.784.42 ± 0.924.55 ± 0.764.42 ± 1.078.6780.000 **
Lightness4.46 ± 0.764.37 ± 0.904.58 ± 0.784.30 ± 1.041.4320.233
Roughness4.35 ± 0.794.63 ± 0.964.83 ± 0.785.01 ± 1.017.4450.000 **
Orderliness4.69 ± 0.714.74 ± 1.024.82 ± 0.884.57 ± 0.960.9650.41
Warmth4.84 ± 0.844.53 ± 0.754.73 ± 0.734.50 ± 0.992.7920.041 *
Closeness4.72 ± 0.804.51 ± 1.114.62 ± 1.004.45 ± 1.081.0740.36
Fun4.58 ± 1.014.54 ± 1.094.68 ± 1.024.44 ± 1.120.6670.573
Ease4.58 ± 1.104.55 ± 1.304.63 ± 1.134.40 ± 1.230.490.689
Openness4.55 ± 1.135.13 ± 1.245.36 ± 1.174.98 ± 1.265.9430.001 **
* p < 0.05 ** p < 0.01.
Table 13. Variance analysis of concave/convex degree classification.
Concavity (Mean ± Standard Deviation)Fp
Low (n = 74)High (n = 74)
Height4.80 ± 0.554.74 ± 0.560.4990.481
Width4.97 ± 0.664.90 ± 0.670.4430.507
Length5.11 ± 0.735.07 ± 0.800.120.729
Transparency4.56 ± 0.754.37 ± 0.861.9710.162
Lightness4.50 ± 0.744.30 ± 0.852.3220.13
Roughness5.06 ± 0.704.49 ± 0.8619.1670.000 **
Orderliness4.89 ± 0.804.59 ± 0.954.4620.036 *
Warmth4.62 ± 0.714.62 ± 0.780.0010.978
Closeness4.58 ± 0.944.49 ± 1.000.3540.553
Fun4.61 ± 1.054.51 ± 0.980.3940.531
Ease4.51 ± 1.124.55 ± 1.150.040.843
Openness5.19 ± 1.185.16 ± 1.140.0280.867
* p < 0.05 ** p < 0.01.
Table 14. Variance analysis of texture classification.
Texture (Mean ± Standard Deviation)Fp
NoneNon-DirectionalDirectional
Height4.78 ± 0.504.77 ± 0.664.76 ± 0.710.0160.984
Width4.94 ± 0.694.91 ± 0.694.97 ± 0.720.1410.868
Length5.11 ± 0.675.05 ± 0.895.10 ± 0.750.110.896
Transparency4.50 ± 0.724.36 ± 1.034.49 ± 0.810.6260.536
Lightness4.44 ± 0.704.63 ± 0.904.35 ± 0.862.2420.109
Roughness4.82 ± 0.644.66 ± 0.984.85 ± 0.731.2840.279
Orderliness4.82 ± 0.804.53 ± 1.104.79 ± 0.902.0840.127
Warmth4.65 ± 0.645.01 ± 0.934.60 ± 0.795.7390.004 **
Closeness4.60 ± 0.884.45 ± 1.234.49 ± 0.990.4320.65
Fun4.53 ± 0.964.50 ± 1.234.69 ± 1.020.6910.502
Ease4.58 ± 1.034.48 ± 1.514.49 ± 1.160.1430.867
Openness5.21 ± 1.115.19 ± 1.315.09 ± 1.150.2160.806
** p < 0.01.
Table 15. Variance analysis of secondary texture classification.
Secondary Texture (Mean ± Standard Deviation)Fp
NoneNon-DirectionalDirectional
Height4.74 ± 0.544.78 ± 0.654.82 ± 0.610.3640.695
Width4.92 ± 0.664.93 ± 0.754.99 ± 0.690.2010.818
Length5.06 ± 0.725.14 ± 0.775.11 ± 0.720.190.827
Transparency4.43 ± 0.814.44 ± 0.924.56 ± 0.700.5790.561
Lightness4.41 ± 0.784.34 ± 0.924.44 ± 0.770.260.771
Roughness4.79 ± 0.724.74 ± 0.824.84 ± 0.820.350.705
Orderliness4.62 ± 0.864.78 ± 0.974.95 ± 0.852.4320.09
Warmth4.64 ± 0.804.49 ± 0.794.70 ± 0.741.3960.25
Closeness4.49 ± 0.944.53 ± 1.074.64 ± 0.900.4950.61
Fun4.55 ± 1.024.46 ± 1.074.68 ± 1.010.8640.423
Ease4.46 ± 1.174.52 ± 1.194.68 ± 1.130.7050.495
Openness5.14 ± 1.135.16 ± 1.235.27 ± 1.110.2580.773
Publisher’s Note: MDPI stays neutral with regard to jurisdictional claims in published maps and institutional affiliations.

