Article

Impact Analysis of a Building Collapse Caused by a Rainfall-Induced Landslide in Kerala, India

by
Vaddepalli Santhosh Kumar
1 and
Sembulichampalayam Sennimalai Chandrasekaran
2,*
1
Department of Structural and Geotechnical Engineering, School of Civil Engineering, Vellore Institute of Technology, Vellore 632014, Tamil Nadu, India
2
Centre for Disaster Mitigation and Management (CDMM), Vellore Institute of Technology, Vellore 632014, Tamil Nadu, India
*
Author to whom correspondence should be addressed.
Buildings 2022, 12(9), 1395; https://doi.org/10.3390/buildings12091395
Submission received: 22 July 2022 / Revised: 18 August 2022 / Accepted: 28 August 2022 / Published: 6 September 2022
(This article belongs to the Section Building Structures)

Abstract

:
This study presents the experimental, numerical analysis, and dynamic impact analysis of a building collapse caused by a rainfall-induced landslide (vertical cut slope failure) on 15 August 2018, in Peringavu, Kerala, India, which resulted in the death of nine people. The volume of 1500 m3 soil-applied lateral thrust force on the building’s rear side led to its demolition. The study includes extensive geotechnical characterization. General limit equilibrium and finite element methods were used in the numerical analysis. The infiltration analysis involved a rainfall pattern of low, moderate, and higher intensities on the slope. The study involved a two-stage analysis. Firstly, the analysis of the vertical cut slope with the application rainfall intensities, and second, the analysis of the building under the dynamic impact of the landslide. As a result of the study, the failure mechanism of the vertical cut during intense rainfall and triggering factors were evaluated. The dynamic impact analysis was carried out to examine the effects of the impact of the landslide debris on the building and the performance of the building under the impact load. The load-bearing walls experienced high-intensity impact force developed by the landslide, resulting in the lateral displacement of 170 mm and differential settlement of 92 mm, which led to the building’s demolition. The flexural failures, excessive deflections, bending moments, foundation settlements, and displacement of structural elements were studied.

1. Introduction

The occurrence of natural hazards due to extreme climatic conditions and anthropogenic actions is often increased with higher magnitudes. Rainfall-induced landslides, vertical cut failures, debris flows, mudflows, and rockfall types increase rapidly in mountainous regions in India, especially in the Western Ghats in the southern part of India [1,2,3,4,5]. Rainfall-induced landslides more often cause significant economic losses, infrastructural damages, and human casualties [6]. In India, every year during the monsoons (Southwest and Northeast monsoons), rainfall-induced landslides are often noticeable. Various researchers have discussed the performance of infrastructures under the landslide impacts on the infrastructure [3,7,8,9,10,11]. In recent years, the Western Ghats of India have been devastated by catastrophic landslides due to cloud bursts and high-intensity rainfall. Kerala state witnessed the highest rainfall in a century in 2018, resulting in catastrophic landslides. Kozhikode, Idukki, Palakkad, Malappuram, Wayanad, and Kottayam are the most affected districts by the major landslides. Again, there were a lot of landslides caused by rainfall in the state of Kerala in 2019, 2020, and 2021. Various researchers have conducted numerous investigations and studies on slope stability with rainfall effects, rainfall-induced landslides, and their progressive failure mechanisms [12,13,14,15,16,17,18,19,20].
To minimize the infrastructural damages due to natural calamities, it is necessary to investigate the performance of built environments, such as structural failures, beam and column deformations, and loadbearing wall failures under the landslide impacts. Numerous researchers around the world have focused on the failure criteria of buildings under the effects of landslides, floods, and earthquakes [21,22,23,24]. The physical vulnerability of buildings and the structural members affected by landslide impact forces were studied by Qin Chen in 2018 [25]. The progressive failure of walls, beams, columns, and other structural members was reported in the study conducted by Luo et al. [9].
The damage or collapse of structural members in a landslide-prone area need to be addressed because the buildings constructed near or at the landslide-vulnerable location are more likely to collapse due to rainfall-induced landslide [26,27]. The destruction of walls is primarily affected due to their low out-of-plane flexural strength followed by the progressive failure of structural members, resulting in building collapse [10,26,28,29,30].
The interest in analyzing the performance of buildings, structures, and structural elements under impact loads has increased in recent years. Natural calamities severely affect the built environment, such as building failures caused by rainfall-induced landslides, rockfall type landslides, and floods. It is important to analyze the performance of structures or buildings under the impacts of landslide loads to minimize the losses by understanding the failure mechanism of the slope as well as of the structures.

Rainfall-Induced Landslides in Kerala State

Kerala state is one of the most densely populated states in India and is situated in peninsular India (Figure 1). The topographical map of Kerala state is depicted in Figure 1. All districts in Kerala except Alappuzha are vulnerable to landslides [19,29,31,32]. Many residential houses were demolished or partially damaged due to the vertical cut failures and landslides induced by rainfall during the monsoons of 2018, 2019, 2020, and 2021.
During a 20-year period (1975–1995), around 100 people were reported to have lost their lives. More than 500 families were evacuated and rehabilitated in various hilly regions of Kerala. In the Southwest monsoon of 2018, there were approximately 70 significant rainfall-induced landslides, more than 100 smaller ones, vertical cut failures, and a lot of damage to road networks, as recorded in government documents [5,33]. The major rainfall-induced landslides are reported in Table 1 [5,31,34,35,36].
It was observed that many buildings were destroyed or partially damaged due to the failure of unprotected vertical cuts. Due to improper vertical cuts, major failures were observed in Peringavu and Kaithakunda in the Malappuram district. A detailed investigation of the failure mechanism of the landslide in the study area was reported in an earlier study [23].
In this paper, a building collapse resulting from a vertical cut slope failure due to intense rains was analyzed. Building performance under the impact of landslide loads was studied in detail by dynamic impact analysis with the finite element method using Plaxis 3D.

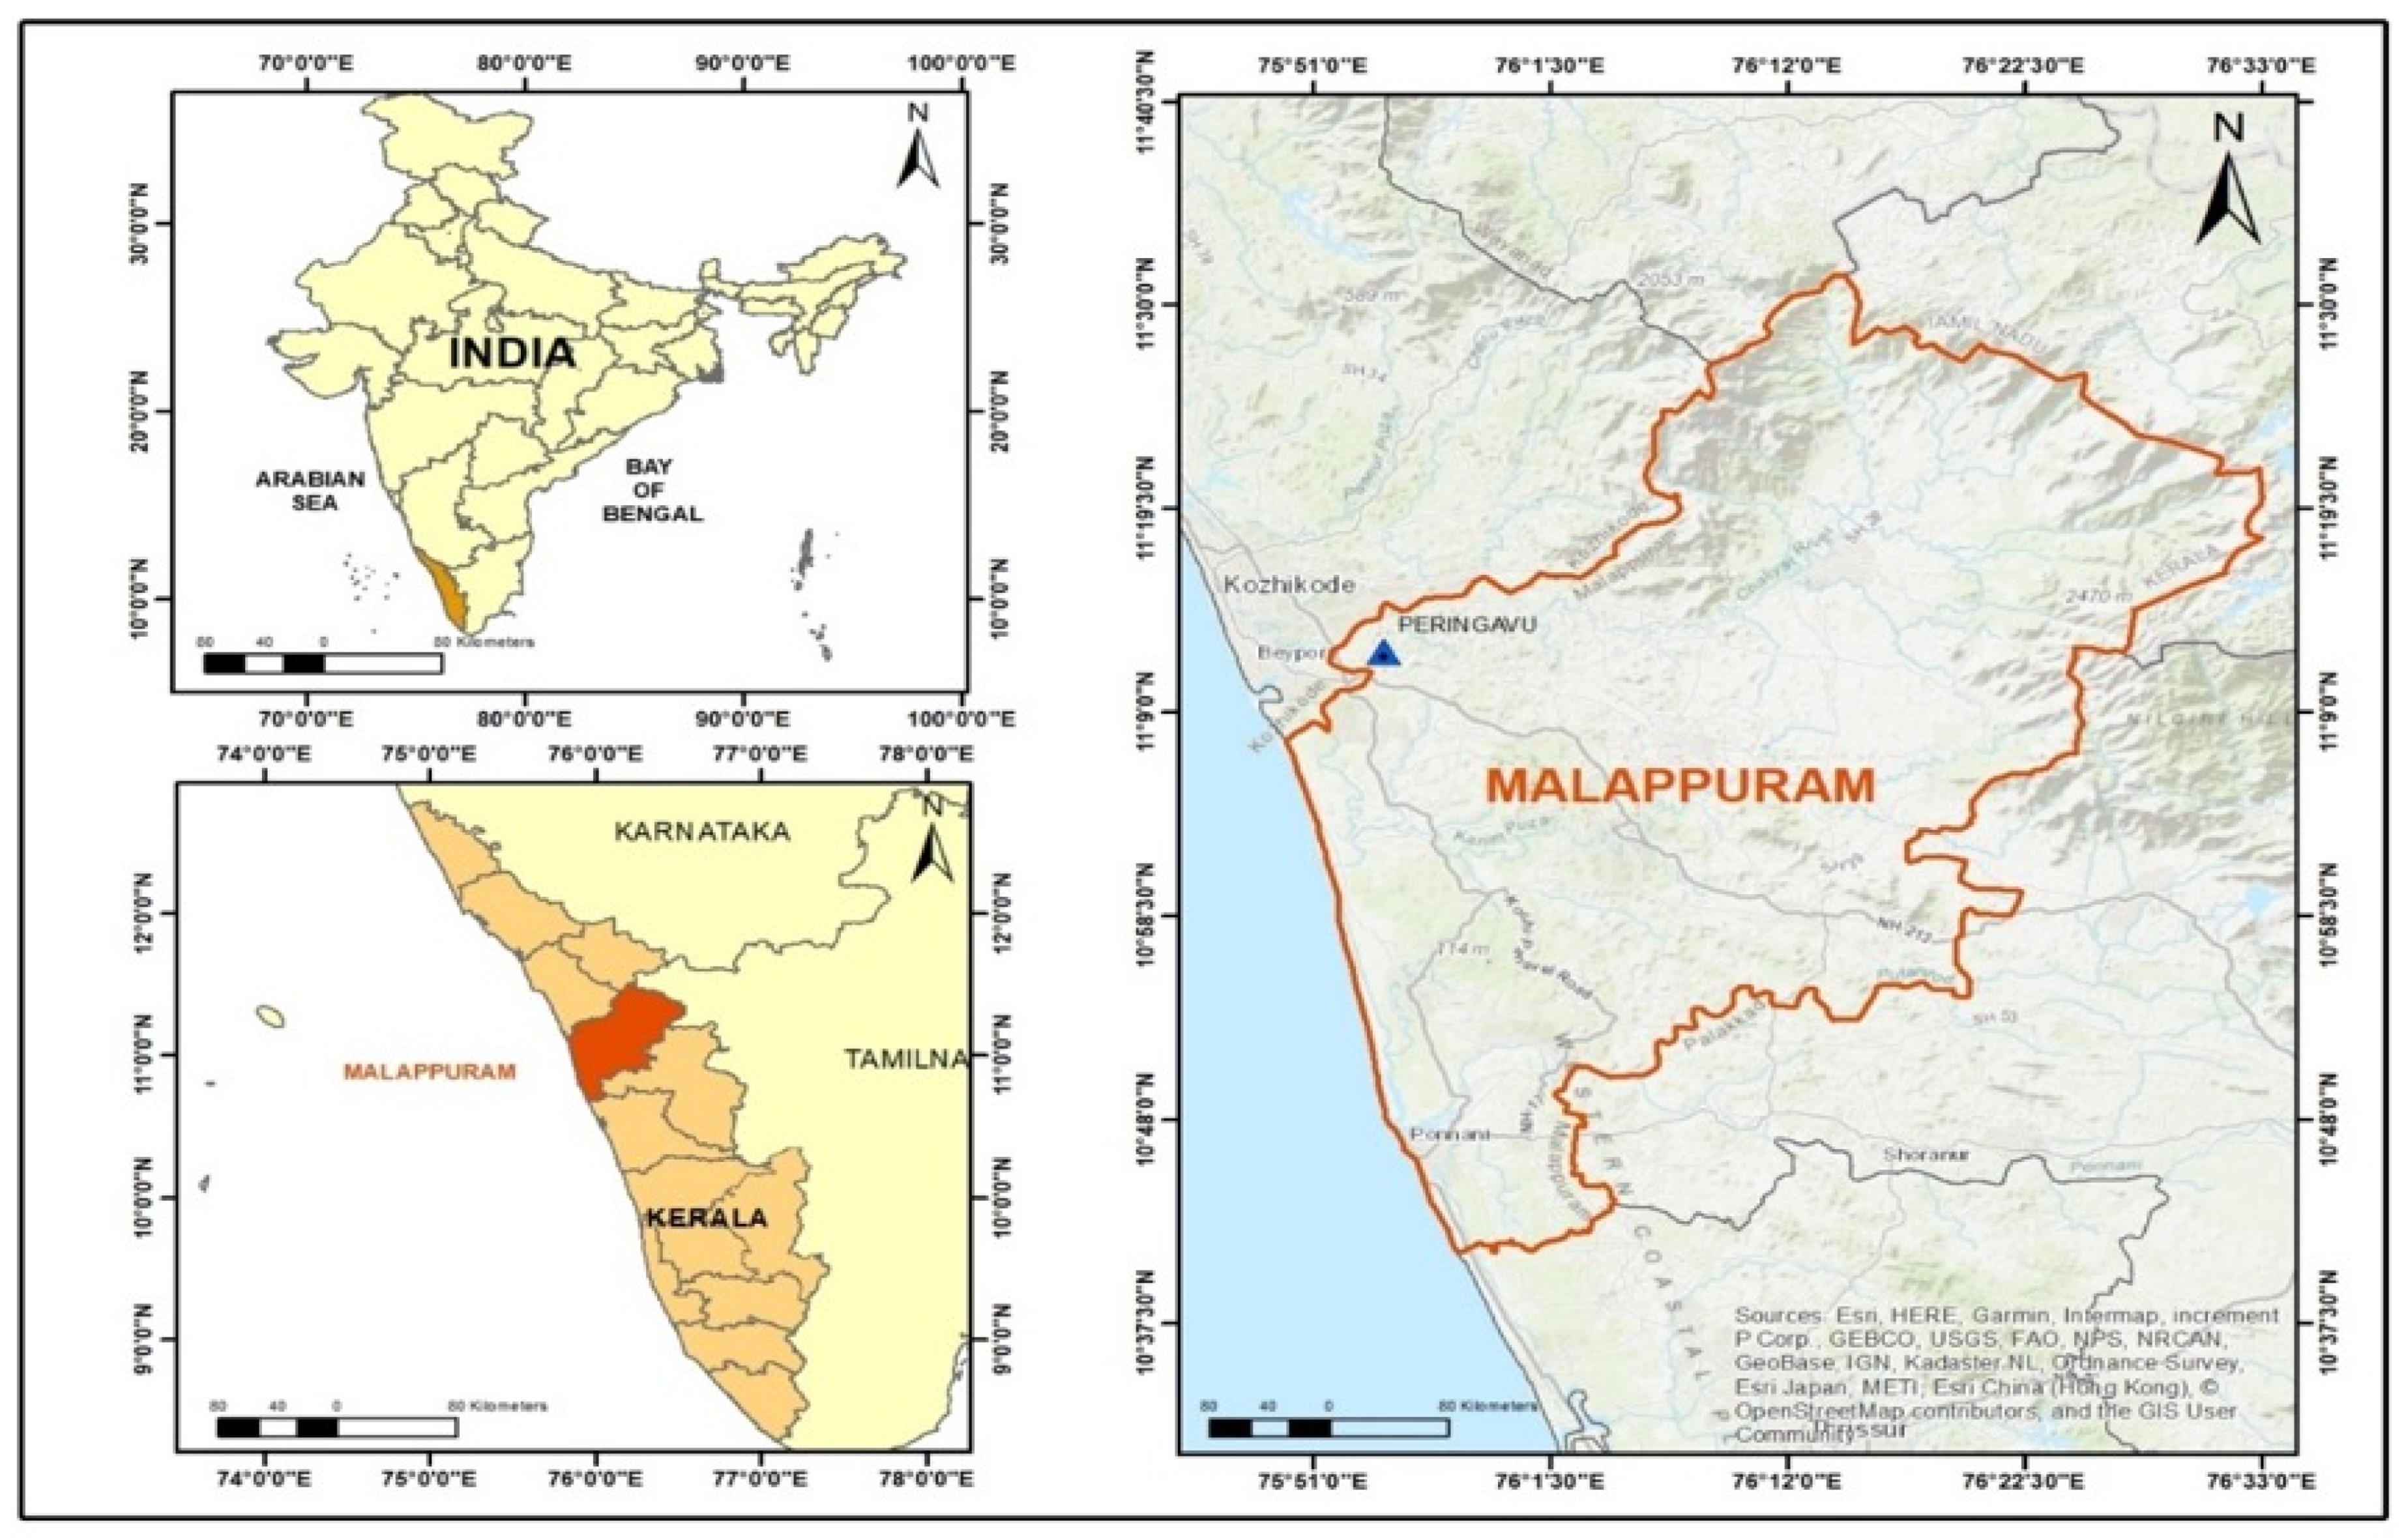
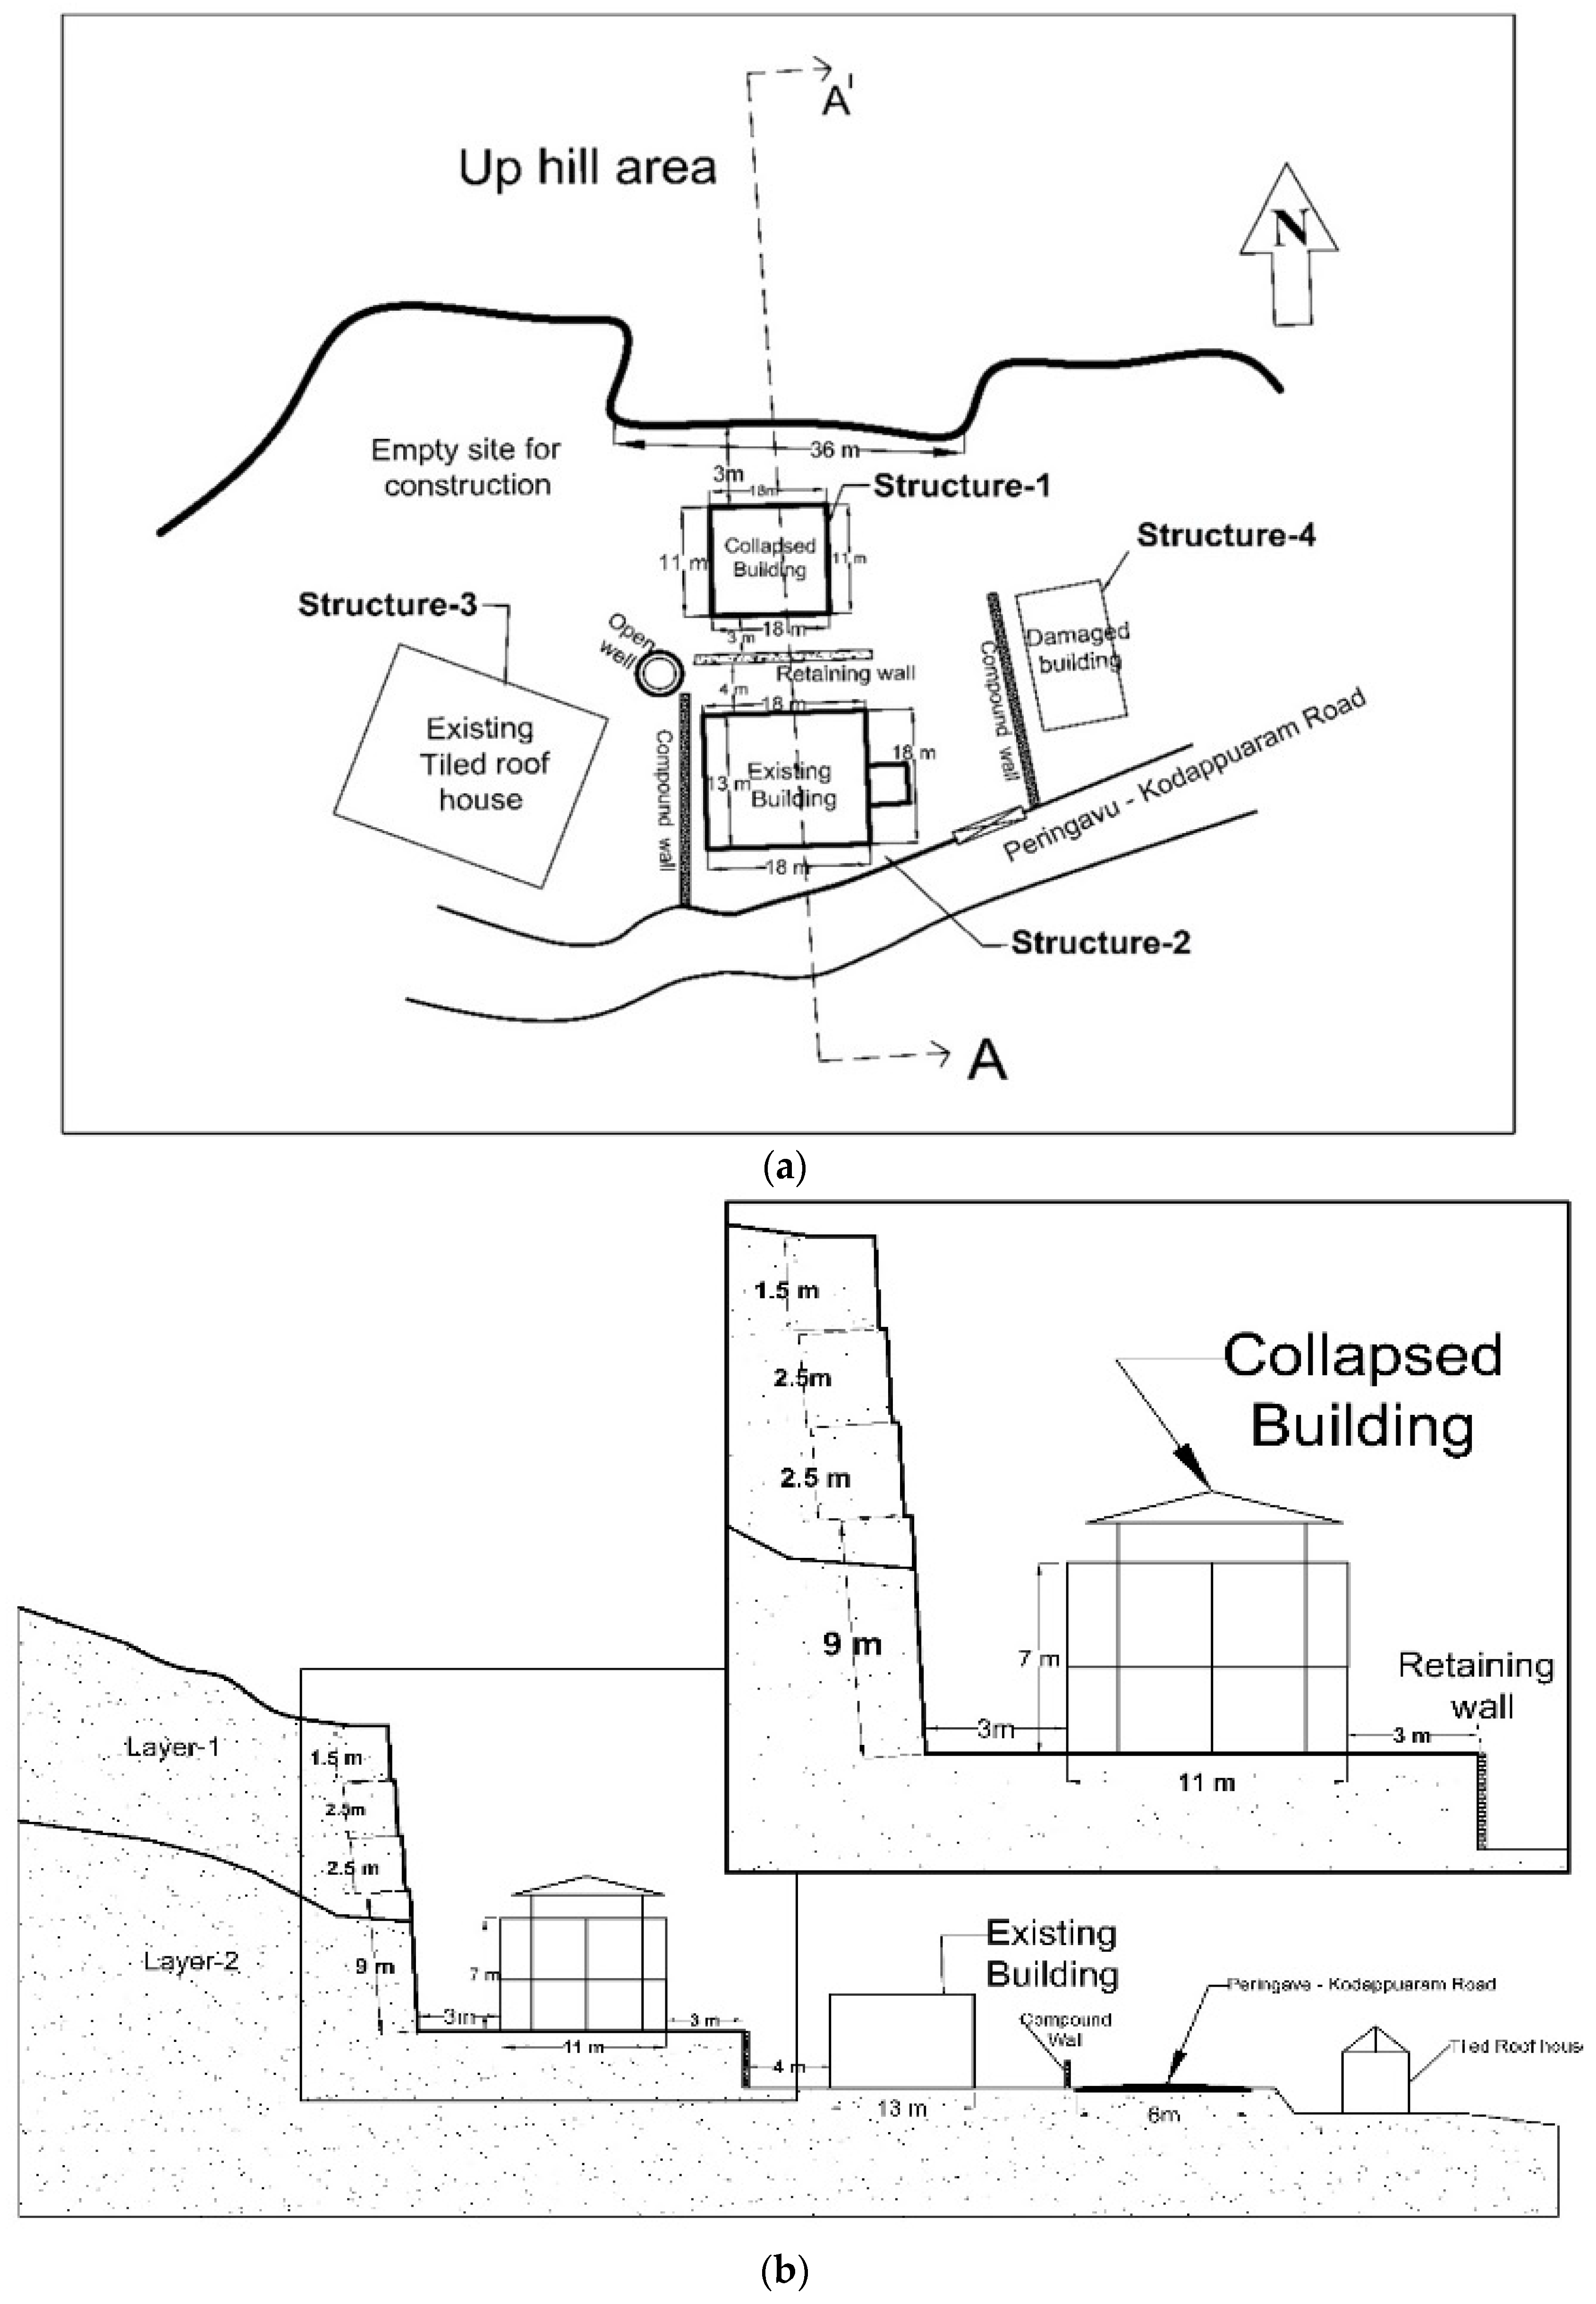
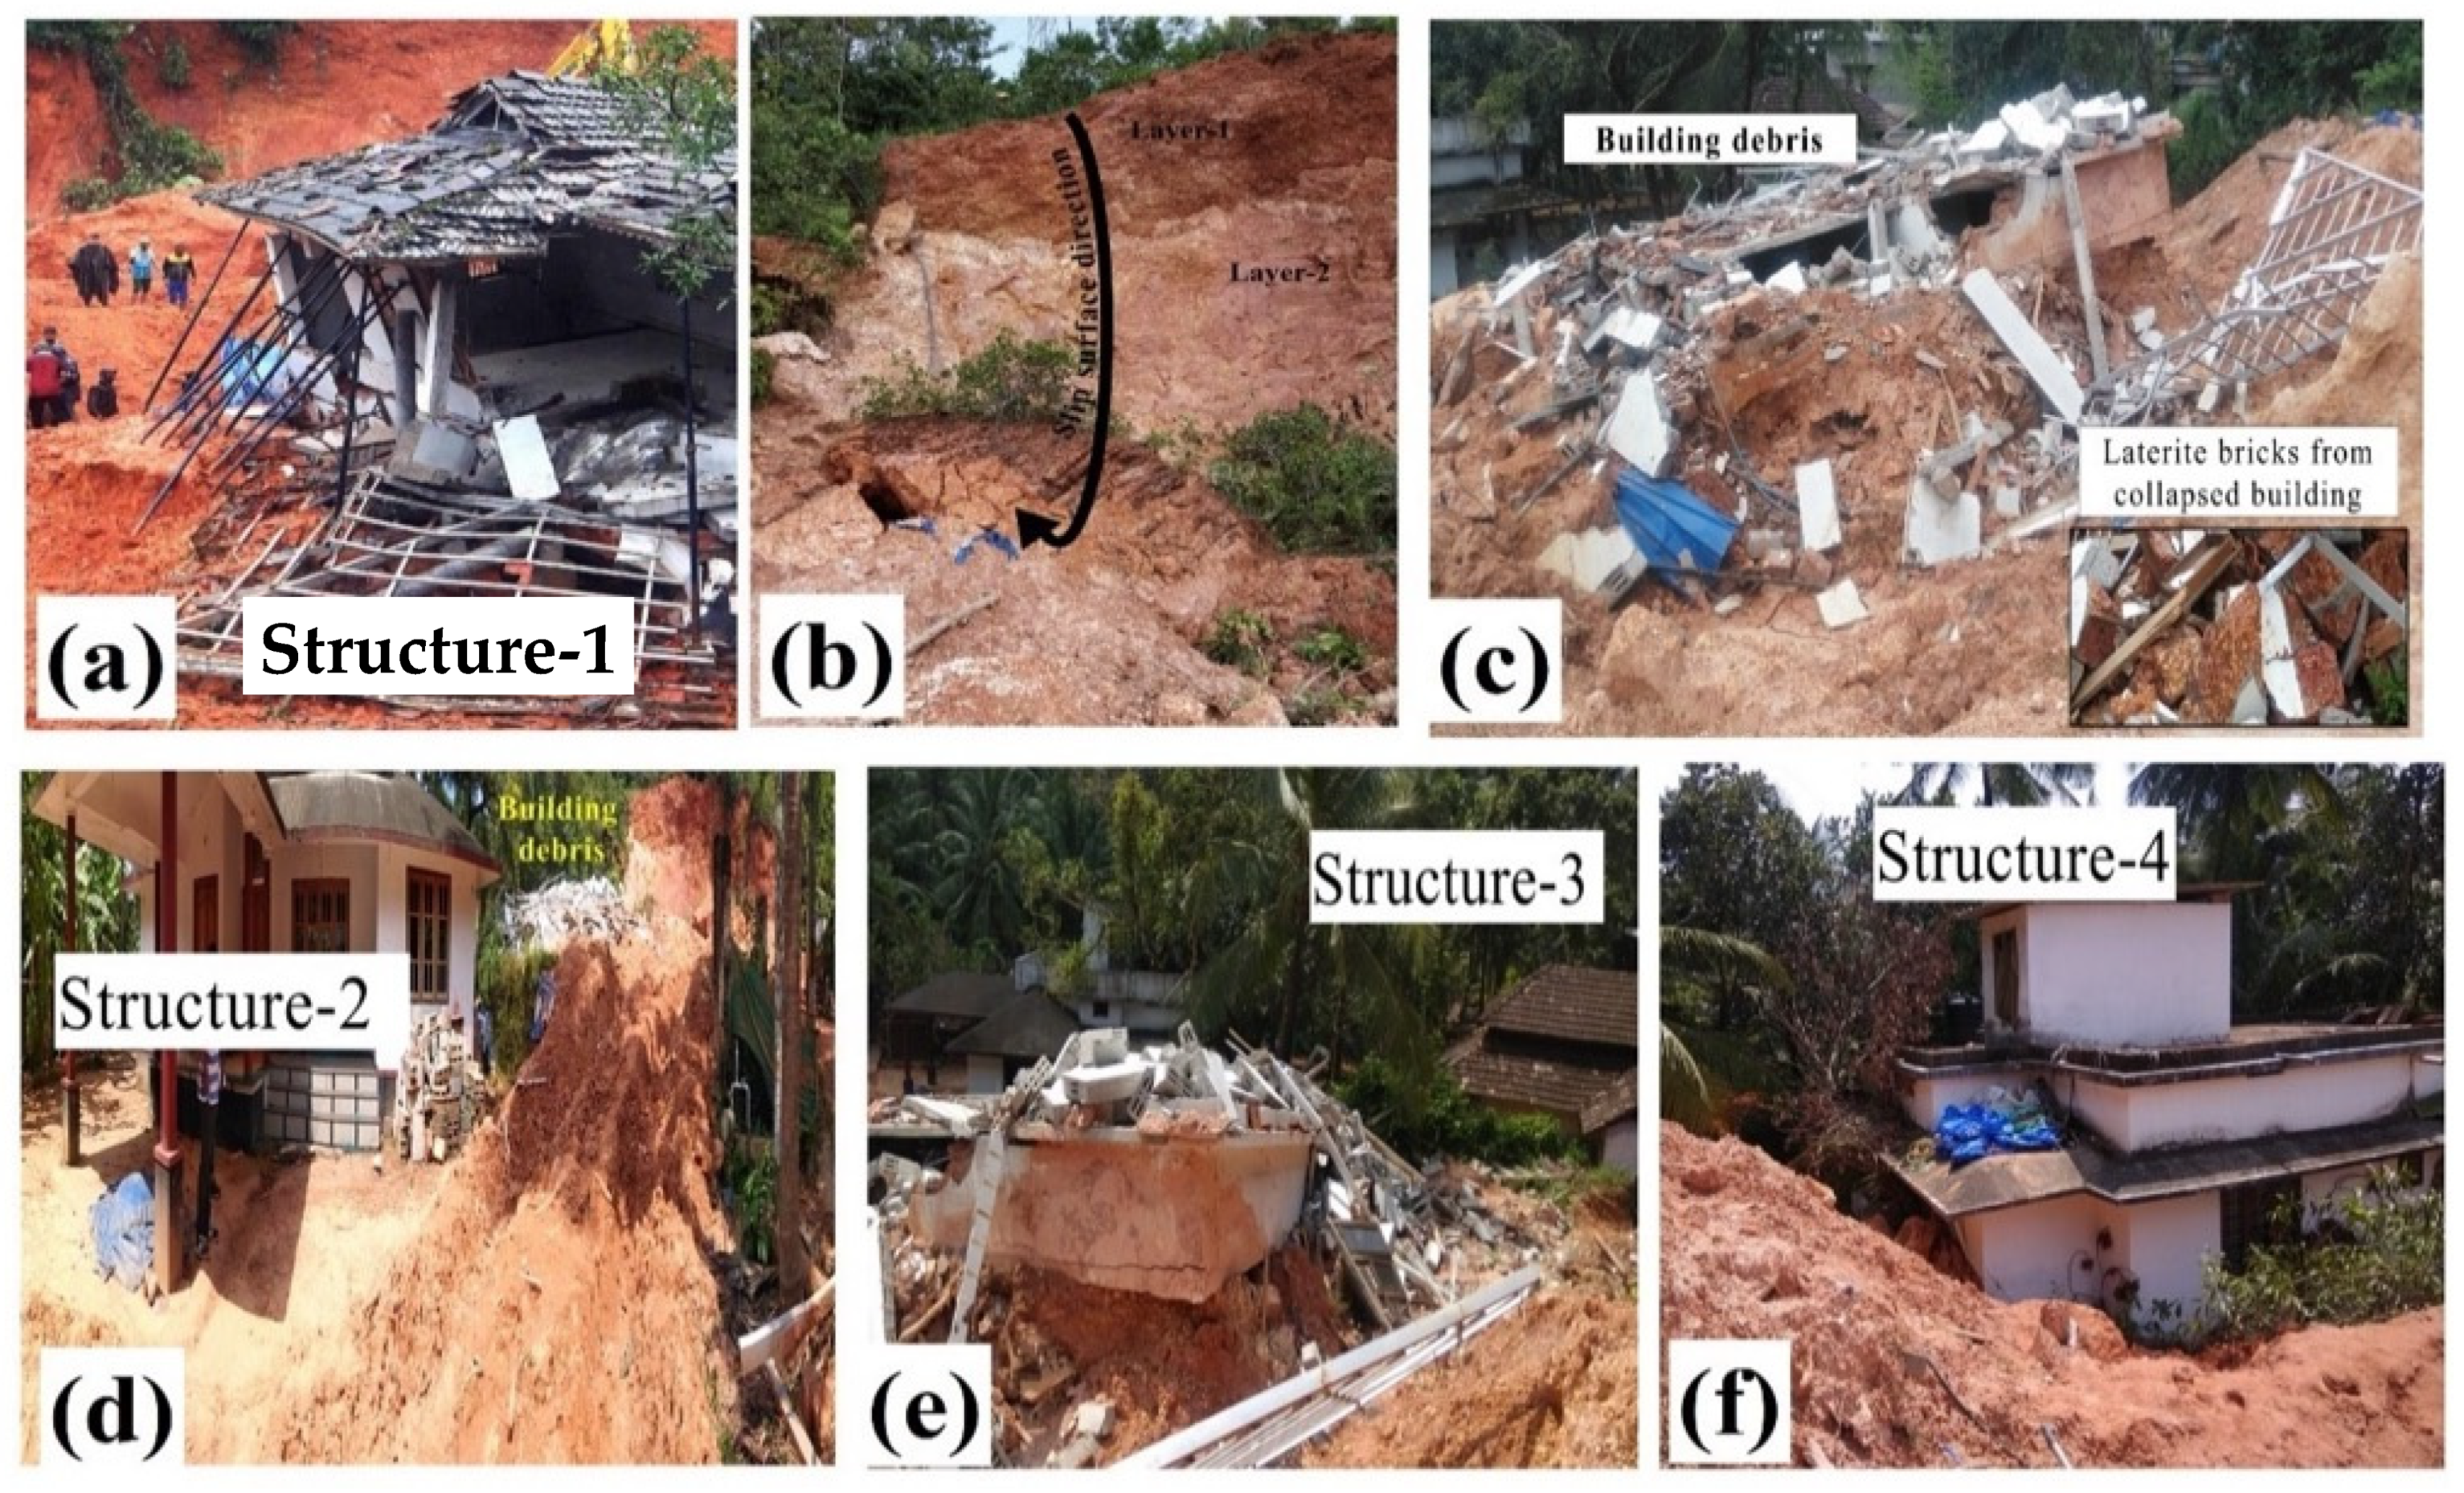
2. Building Failure in Peringavu
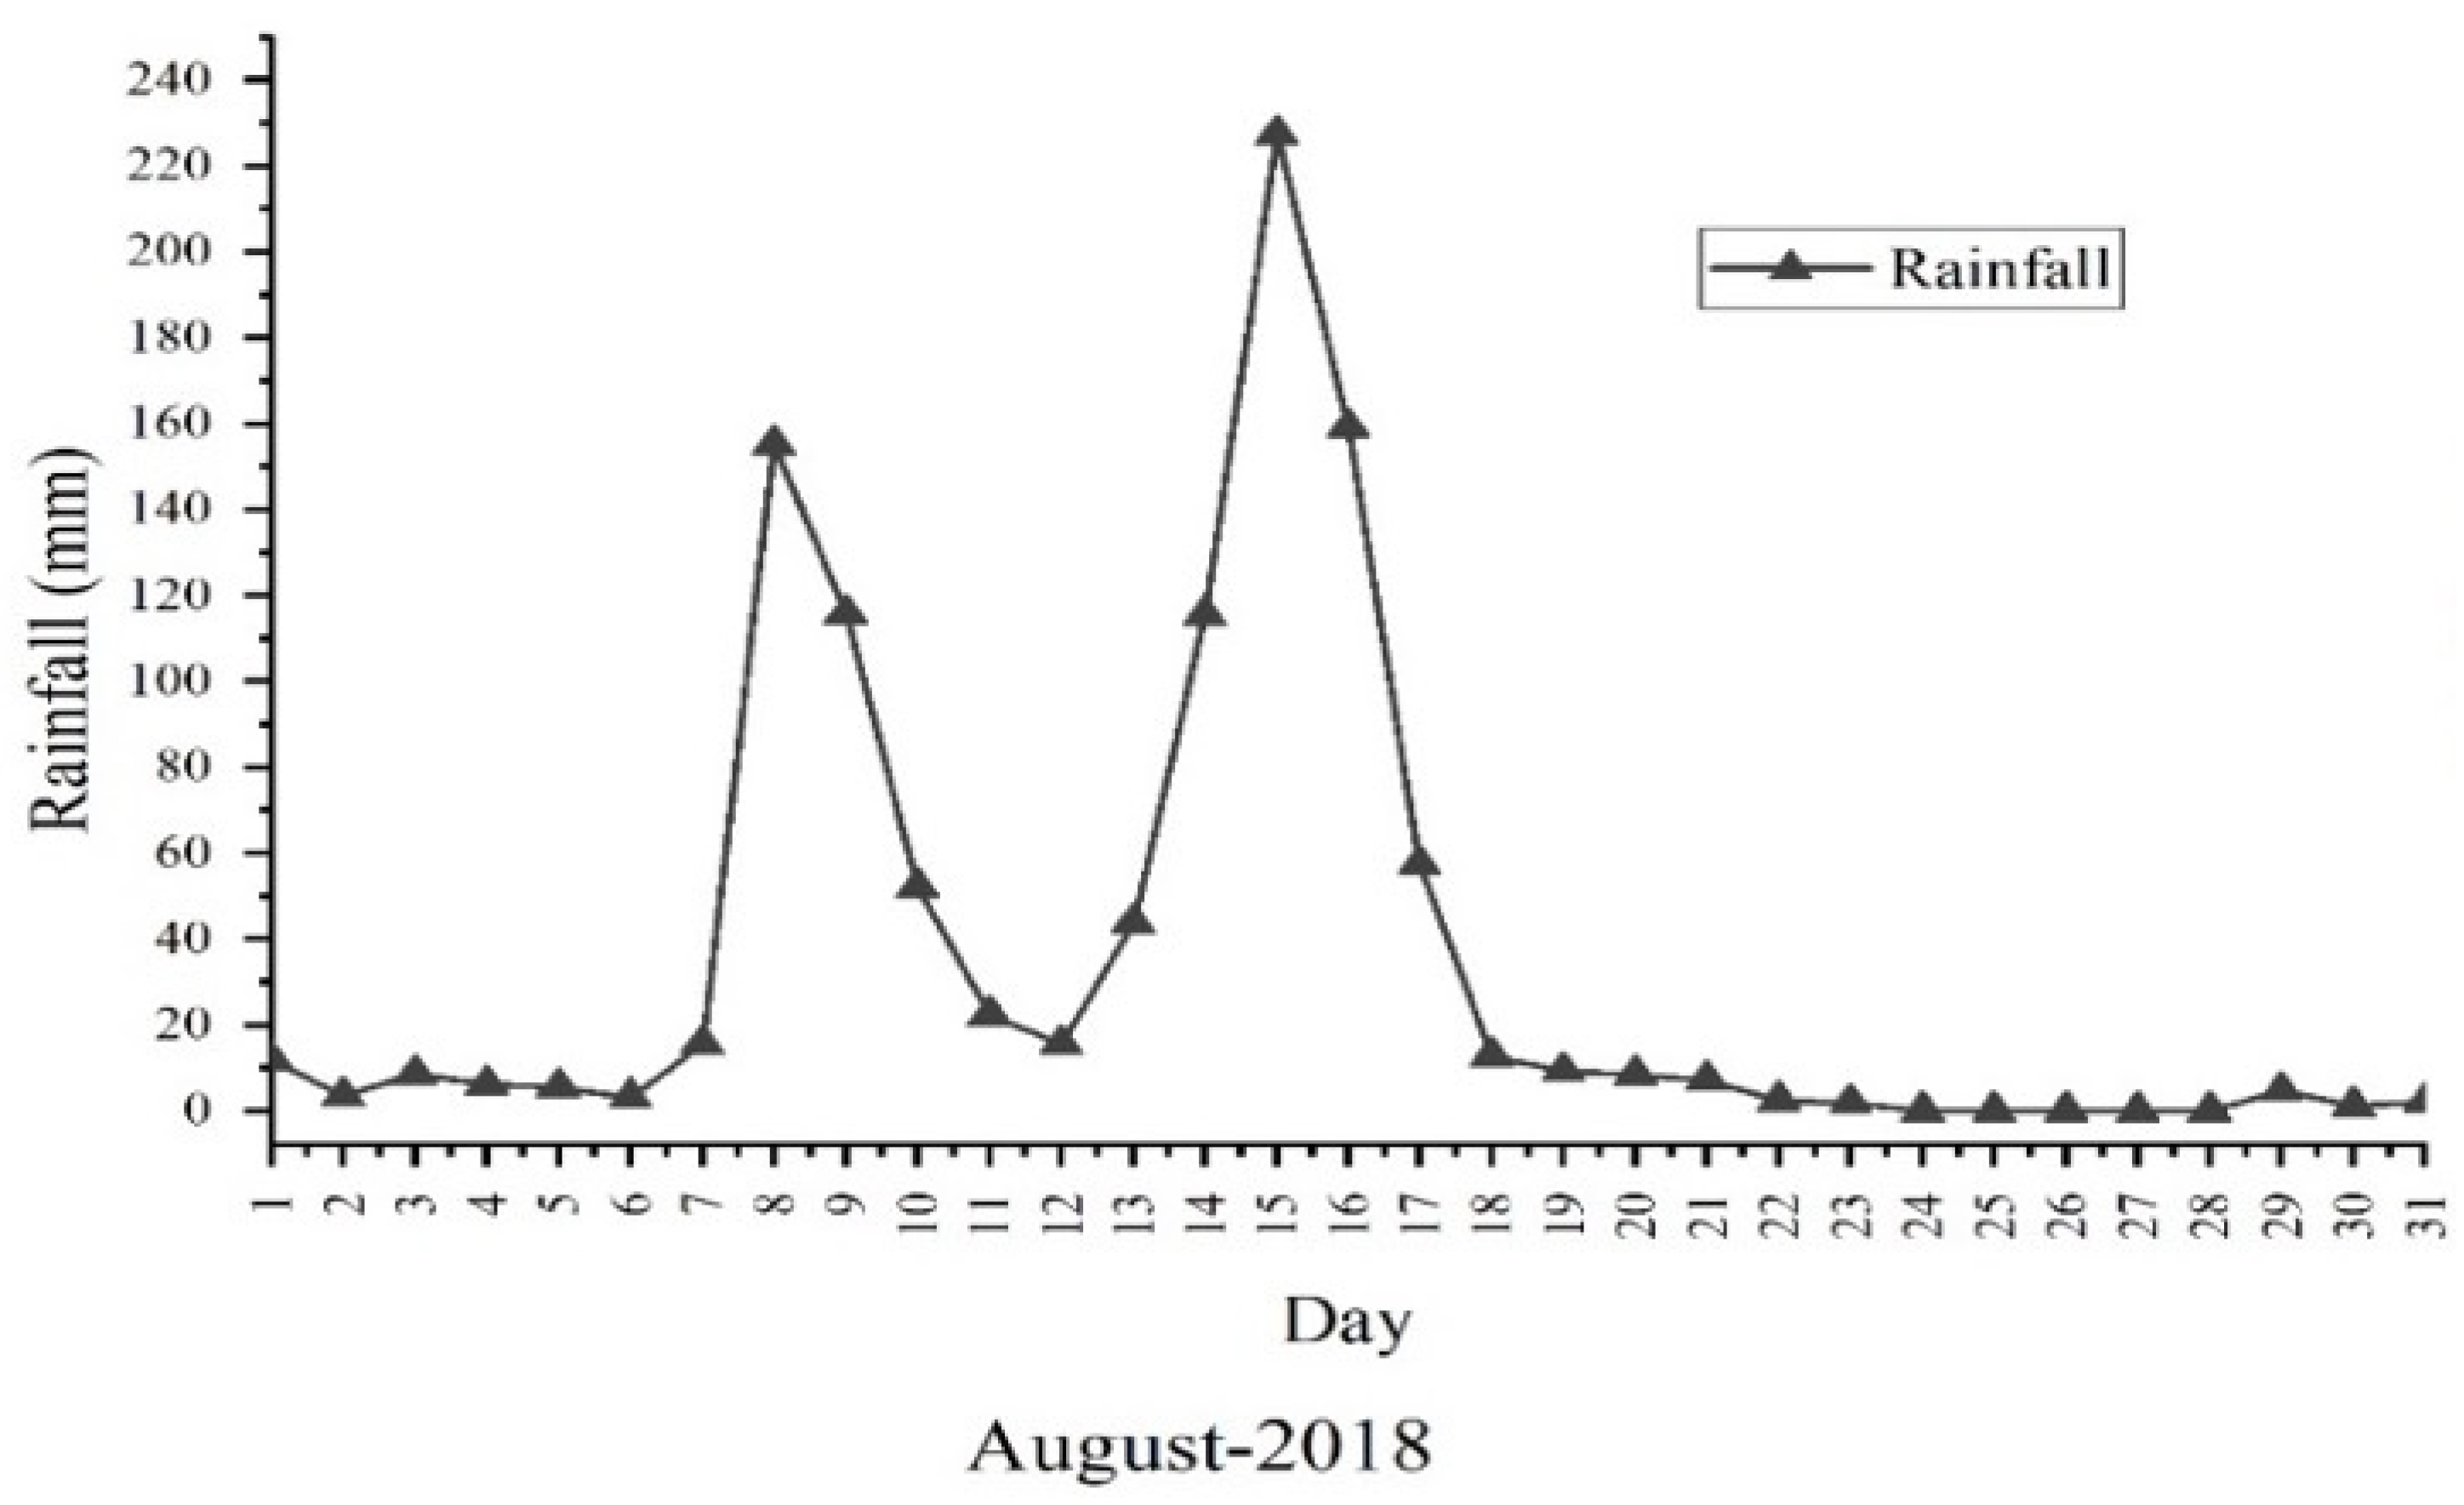
The current study investigates the landslide (vertical cut slope) failure mechanism and the performance of a building under the impact load of a landslide that occurred on 15 August 2018, in Peringavu (11°12′6.2″ N, 75°54′5.84″ E), Malappuram district, Kerala state (Figure 1). A landslide induced by heavy rain caused the demolition of a two-story building, burying nine people alive [29,34]
In the year 2010, the slope was excavated as a vertical cut. About 12 months later, the house (collapsed building) was constructed. The building plan and pictorial representation of the area prior to landslide event are shown in Figure 2. To create a space on the back side of the building, the natural slope was excavated to a larger height, and a vertical cut was made, which was not supported by any stabilization method (Figure 2). As depicted in Figure 2a, structure 1 (a two-story building) in the traditional Kerala type, was built very close to a vulnerable vertical cut (3 m). The dimensions of the vertical cut were 36 m wide and 15.5 m high, with four tiers with short foot berms (Figure 2b). Partially damaged houses (structures 2, 3, and 4) surrounding the collapsed building are depicted in Figure 2.
The building (structure 1) was built with laterite building blocks as a load-bearing designed structure. The laterite building blocks had an ultimate compressive strength of 3 MPa [29,37]. The building had 250-mm-thick interior and exterior load-bearing walls. The roof of the ground floor was an M25-grade RCC (Reinforced Cement Concrete) slab that was 127 mm thick, reinforced with Fe415-grade steel. The roof of the first floor was built as per Kerala state’s traditional design (Figure 3).
On 15 August 2018, heavy rainfall caused a landslide that resulted in the failure of the vertical cut; this caused the slide of a huge volume of saturated soil (approximately 1500 m3 volume) and applied a significant intensity of lateral thrust on the back side of the building. As a result, the building completely collapsed. The location post event and soil from the vertical cut, failure surface, and soil deposition near the collapsed building are shown in Figure 3. A landslide induced by heavy rain caused the demolition of a two-story building and killed nine people [29].
Before failure initiation, there were signs of failure; a small quantity of saturated soil spalling from the slope onto the pet cage placed at the back side of the building (structure 1) (Figure 3a), while all family members, along with two neighbors, were trying to move the pet cage to a safer place [34]. As rainfall intensity increased over time, a huge quantity of soil from the vertical cut drifted into the building, resulting in the demolition of the building. All family members, along with the two neighbors, were buried alive under the building debris and saturated soil.
Figure 3 depicts the condition of the location after the landslide. During the rescue process, the building was protected by adjustable floor support jacks for additional support to the trussed roof top observed in Figure 3a. As observed in Figure 3b, the slide was of a rotational type. Figure 3c illustrates the building (structure 1) debris after the landslide. Figure 3d depicts the condition of structure 2 and the soil spread near the road. Figure 3e depicts the picture of a partially damaged house (structure 3). The rear side of a partially damaged building with soil (structure 4) is shown in Figure 3f.

3. Rainfall

Kerala state receives rainfall mainly from monsoons. The state has 120 to 140 rainy days per year on average. Kerala received 3518 mm of rain in 2018, 20% higher than the normal rainfall, and 2516 mm in the south-west monsoon, which was 24% higher than the monsoon normal rainfall. Rainfall received in the south-west monsoon period was recorded as the highest since 1961 [38]. Figure 4 depicts the daily rainfall in August 2018 recorded at the Indian Meteorological Department (IMD) rain gauge located at Karipur Airport. The monthly rainfall data of Kerala state in 2018 are presented in Table 2. In 2018, August recorded 821 mm of rainfall, which is 96% higher than August’s normal rainfall [39]. The IMD rain gauge stations and geomorphological atlas of the Malappuram district are shown in Figure 5. Since the Karipur airport rain gauge is near Peringavu (Figure 5), rainfall data recorded from this rain gauge were used for the numerical analysis. In 24 h (from 14 August 8:30 AM to 15 August 8:30 AM), the landslide area received very heavy rainfall of 227 mm. The importance and influence of antecedent rainfall can be observed in Figure 4. The Peringavu area received very high daily rainfall and high antecedent rainfall (Figure 4) [31,39]. Hence, rainfall statistics and data analysis play an important role in evaluating the failure mechanism of the landslide in Peringavu that resulted in the demolition of the building and buried nine people alive [29].

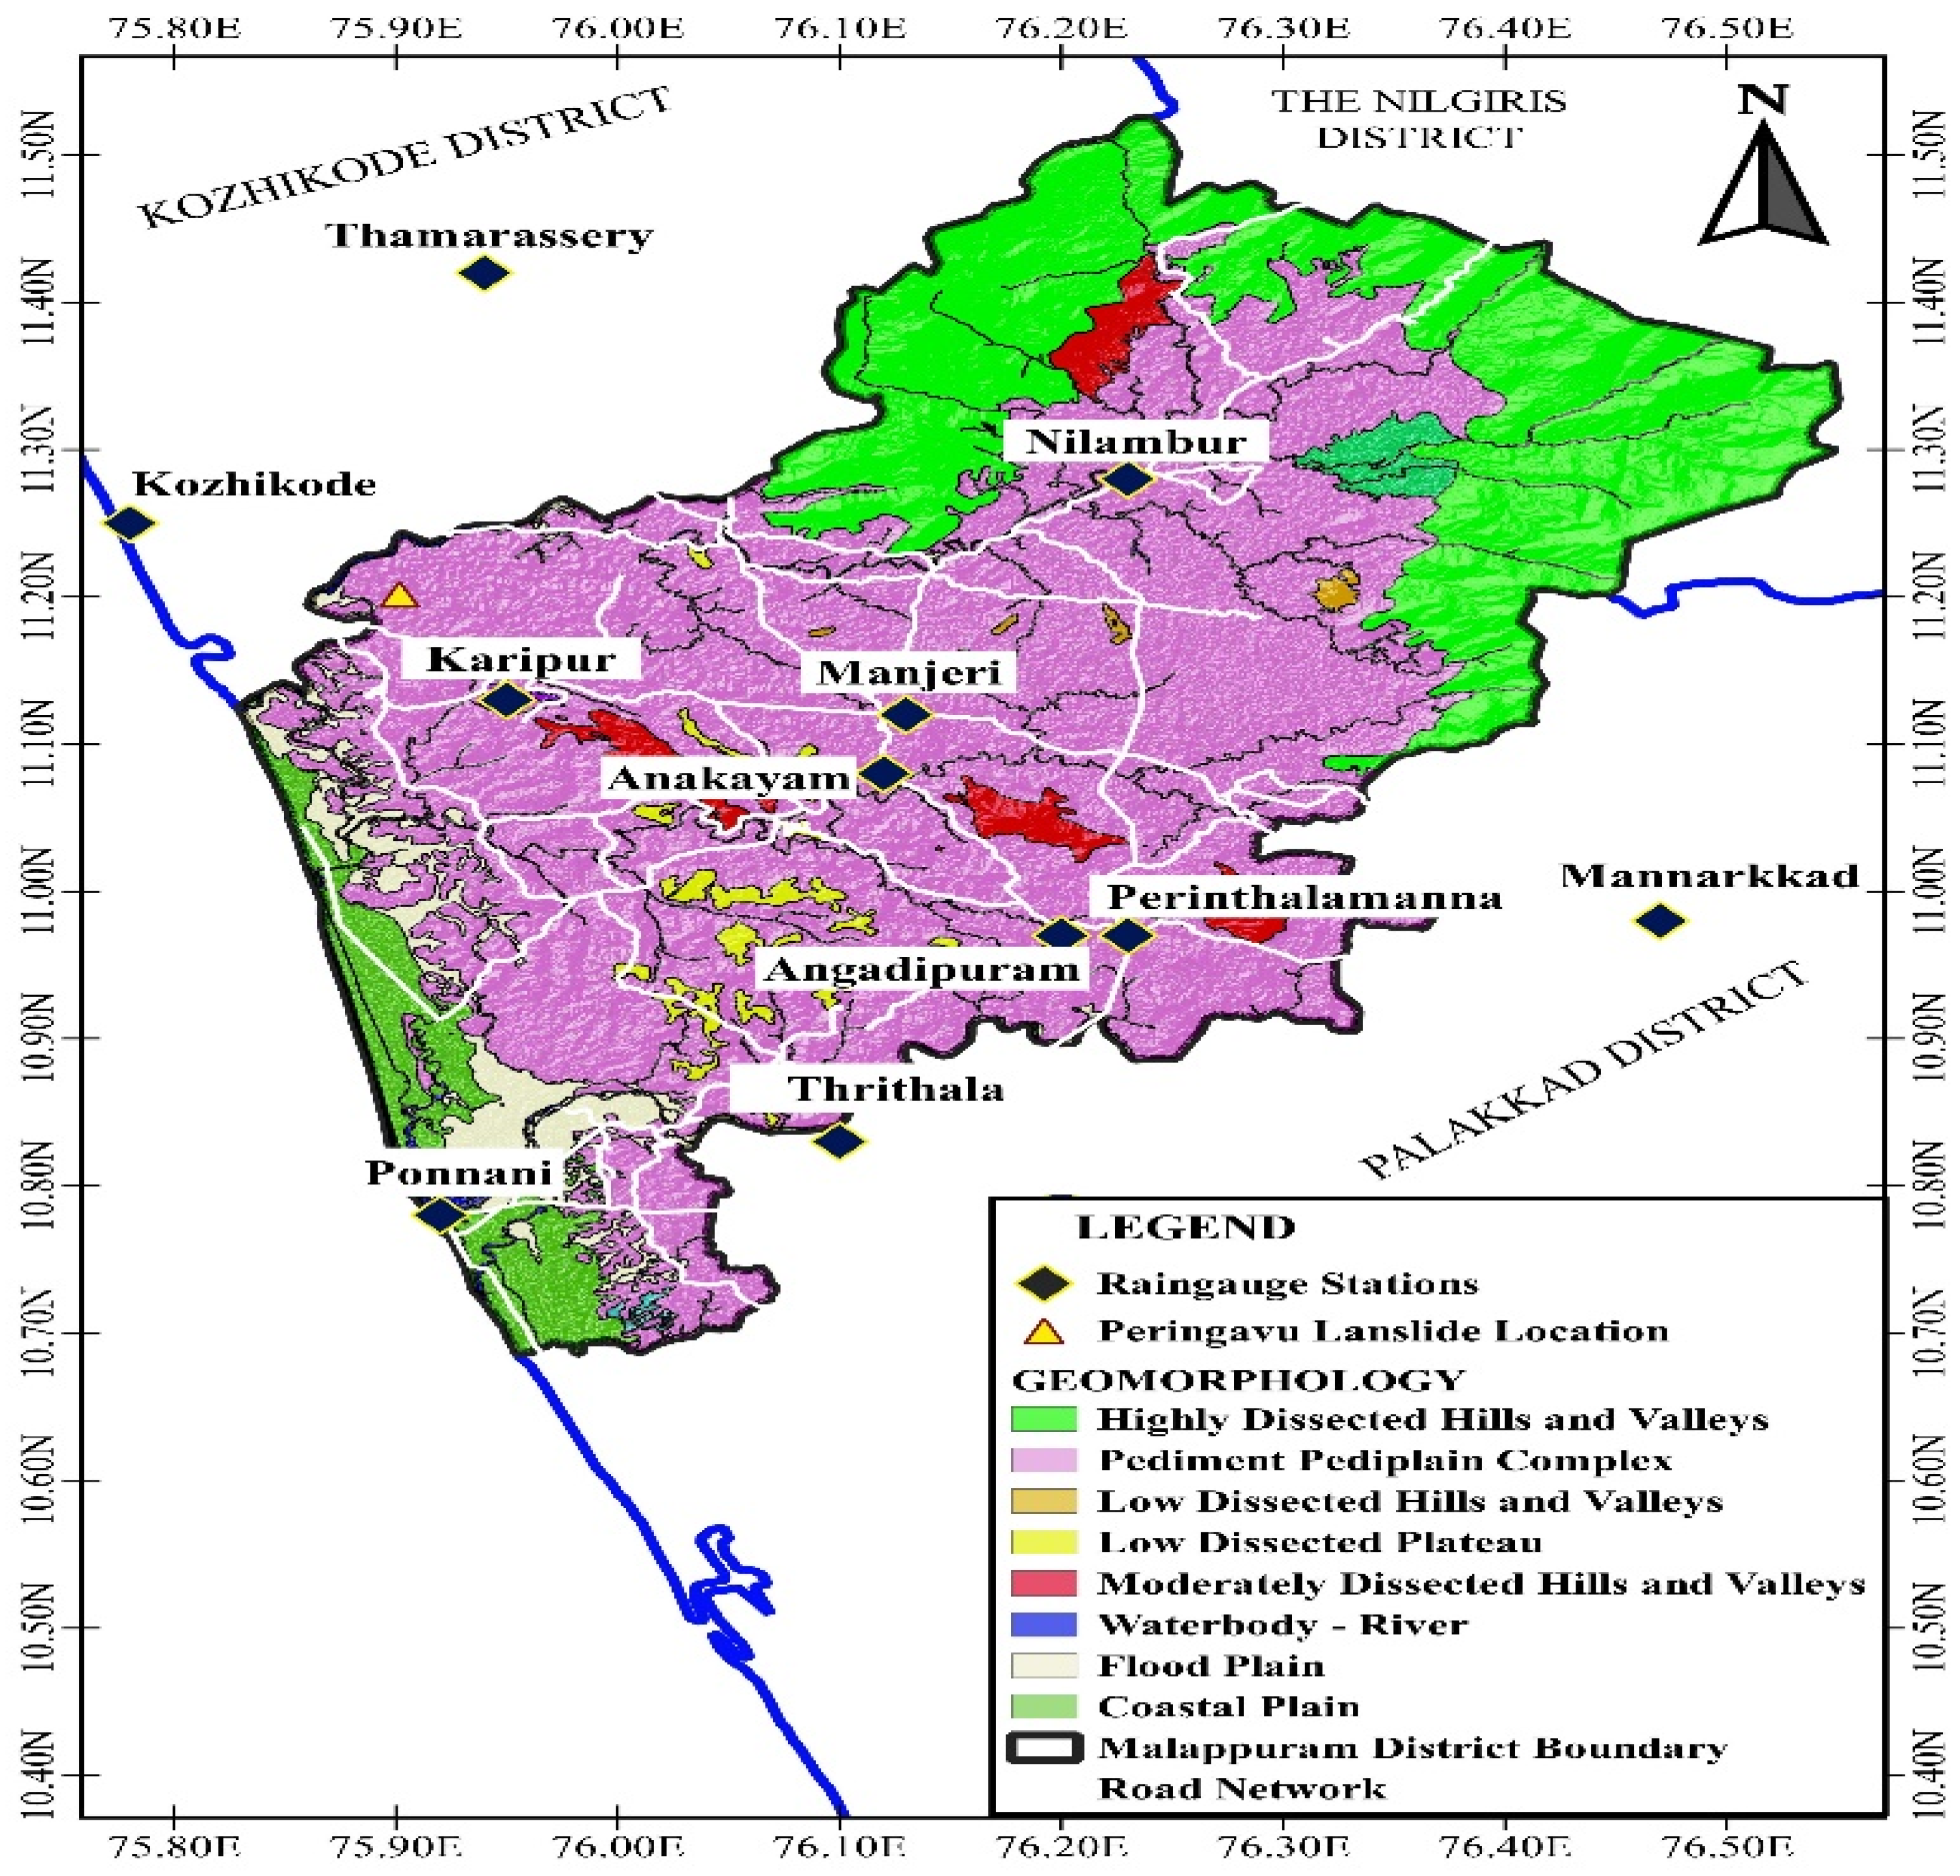
4. Geomorphology of the Study Area

A geomorphology map was developed using the geospatial information of Malappuram district, Kerala, obtained from the Bhukosh data portal of the National Remote Sensing Centre India [40]. Geomorphology details are depicted in Figure 5. Most of the area in the Malappuram district is covered with charnockite rocks, which are the source and parent rock for the thick laterite deposits in the study area. The acid intrusive granites and migmatite gneiss, conglomerate group rocks, flood plains, coastal deposits, and coastal sediments (Figure 5) are also covered in the district. Geomorphology (Figure 5) divides the district into three physiographic regions: the Highlands, the Midlands, and the western lowlands [41]. Peringavu is situated in the central midland region, which is associated with flat-top laterite fields, escarpments, hills, narrow lateral ridge rocks, and vast alluvial and river deltas [41]. The landslide location was covered with charnockite rocks and thick layers of laterite soil (Figure 3a). Intensive weathering of charnockite rock has produced laterite soil at varying depths [42].

5. Geotechnical Characterization

Detailed geotechnical experiments were performed on soil samples from the landslide location. The soil specimens were collected from the failure surface (Figure 3b). Six soil specimens from the landslide site were taken to the laboratory. Three test pits were made on the top layer, and another three test pits were made at the rear side of the collapsed building near to the toe of the vertical cut. Among six soil samples, based on test results, all samples were categorized into two groups, i.e., layer-1 soil and layer-2 soil. The soil at the site had a red and brown combined color, which denotes the lateritic nature of the soil (Figure 3a and Figure 5). The soil in the top layer was extensively weathered and covered up to a depth of 3 to 4 m (Figure 3b), whereas the second layer was moderately weathered and extended up to greater depths.
All laboratory experiments were conducted as per ASTM standards. The experimental laboratory results are reported in Table 3. The first and second layers had a specific gravity of 2.57 and 2.54, respectively, similar to previous research [29,43]. The maximum dry unit weight of the soil was determined by the standard proctor compaction test [44]. The stiffness of the soil was calculated from the consolidation of the soil for the analysis. The soil at the location was mostly fine-grained soil, as can be seen in Table 3.
A lower percentage of gravel in the top layer shows evidence of a high grade of weathering, and the higher percentage of clay (12.5%) in the first (top) layer suggests that it has undergone more weathering than the bottom layer. Rahardjo (2004) [45] reported a similar set of observations for the residual soils in Singapore. The laboratory results indicated that the soils were less plastic in behavior.
The unsaturated properties were derived from a dewpoint potentiometer (WP4C) device according to ASTM standards [46]. The soil water characteristic curve (SWCC) parameters a, n, and m are associated with the air entry value (kPa), the slope of the curve, and the residual moisture content, respectively [47]. The unsaturated soil strength parameters are presented in Table 4 and were used in the infiltration analysis.
According to ASTM-D2487, the soil at the location is characterized as sandy silt (ML) (ASTM 2017). The permeability coefficients of soil samples are 1.05 × 10⁻⁷ m/s and 4.47 × 10⁻⁸ m/s, respectively, which shows that the soil had low to moderately permeable [48].

6. Ring Shear—Consolidated Drained Test

As the slope stability analysis (Slope/W) characterized the failure mechanism based on effective stress analysis, the authors performed a ring shear test under drained conditions [49] to establish the effective stress-based residual shear strength parameters.
The torsional ring shear test is the preferred method for the determination of the residual shear strength of soil because it enables the soil specimen to be sheared at large displacements that more realistically imitate the field state [49,50]. The experiment was performed as per ASTM-D6467. The torsional ring shear was conducted as the Consolidated Drained (CD) condition. With the use of a primary test technique and a consolidated drained condition, the effective stress strength parameters were measured [29,51]. The test was carried out by considering the different normal stresses, which indicate the overburden pressure on the soil at the failure plane.

7. Slope Stability and Failure Mechanism: Numerical Approach

Seep/W, a finite element program, was used for the seepage analysis, and the stability analysis was based on the limit equilibrium method (Morgenstern–Price, Slope/W). The limit equilibrium analysis was performed after the stress calculation from Seep/W at each stage of rainfall, and the two procedures were a coupled analysis [29,52,53,54,55,56,57,58,59]. The analysis of the vertical cut proceeded with three distinct rainfall patterns to evaluate the failure mechanism and the impact load on the building triggered during the landslide occurrence. Two soil layers considered in the analysis the properties are presented in Table 3. The dimensions of the finite element model are shown in Figure 2a.
The structure and foundation soil were modelled in three dimensions for analysis. The model was a framed structure composed of load-bearing walls, beams, and the RCC slab. The important parameters and characteristics of finite element models are presented in Table 3, Table 4 and Table 5. For the building model, 10 kN/m2 live loads [60,61] were applied for the ground and first floors. The building model was considered with respect to the foundation stiffness. The dimensions of the structural members were calculated as per Indian standard codes [60,61,62]. The dimensions are presented in Table 5. The slope dimensions were considered from the field survey and are presented in Figure 2 and Table 5. The soil behavior was represented by the Mohr–Coulomb elasto–plastic constitutive model. The building structural members were considered elastic models. The structure was rigidly attached/connected to the foundation soil (Figure 2). The detailed modeling information is described in the following sections.

7.1. Analysis of the Cut Slope

Limit equilibrium analysis was performed on the cut slope before failure (Figure 2b) to study the mechanism of failure due to very heavy rainfall. Figure 2a shows that the residential structure (structure 1) was in close proximity to the toe of the cut slope. The geometry and structural mesh of the cut slope along with the building are portrayed in Figure 6a. The cut slope consisted of four tiers, and each tier had small berms, producing a height of 15.5 m (Figure 2b). The height of each tier is shown in Figure 2b and Figure 6a. The building details are explained in the previous section (Insights into Kerala landslides and building failure in Peringavu).
The soils and soil slopes in tropical regions (study area—Peringavu, India) generally consist of tropical residual soils with matric suction in the region above the groundwater table [45,53,54]. The residual slope stability is significantly influenced by climatic and hydrological factors, such as rainfall and infiltration. Numerous researchers [4,5,14,29,53,54,55] studied the causes of landslides in tropical regions and residual soils and concluded that heavy rainfall and infiltration are the significant triggering factors in the instability of slopes.

7.2. Boundary Conditions

The Mohr–Coulomb constitutive model was used to simulate the soil numerically, and both soil layers were homogeneously modeled (Figure 6). Regarding the failure mechanism, the analysis was carried out with residual shear strength parameters. The soil properties used in the analysis are given in Table 3. To study the effect of water flow due to infiltration in unsaturated soil, coupled flow analysis was carried out. The boundary was fixed for the model at both sides and the bottom for the numerical analysis. The no-flow zone was maintained by providing a nodal-flux (Q) value as zero for the sides and bottom of the model. The flux boundary (q) is equivalent to the rainfall intensity on the slope surface and is considered for the seepage analysis. In the analysis, a mesh with triangle and quadrilateral elements was generated (Figure 6a).

7.3. Infiltration Analysis—Unsaturated Soil Strength Parameters

For the infiltration analysis, the slope was considered an unsaturated slope, and an unsaturated soil parameter obtained from SWCC was considered to define the hydraulic limitations of the groundwater flow in the unsaturated soil. For the unsaturated slope, the permeability and the infiltration rate are the parameters essential for the analysis. According to Darcy’s law, the permeability coefficient varies with the degree of saturation for unsaturated soils [14,29]. Van Genuchten (1980) [56] proposed a closed-form relation between the effective saturation, matric suction potential, and relative permeability. The governing effective saturation (Se) as per Van Genuchten (1980) is as follows:
Θ w = Θ r + Θ s Θ r 1 + Ψ / a n m
where Θs = saturated volumetric moisture content; Θw = volumetric moisture content; Θr = residual moisture content; Ψ = negative pore water pressure; n, a, and m are the van Genuchten model curve fitting parameters. A dew-point potentiometer test was used to obtain the unsaturated soil parameters. Table 4 presents the a, n, and m values of soil. The pore pressure distribution and rainfall infiltration effects were the results of the analysis. The unsaturated soil strength parameters used in the finite element model are presented in Table 4.
The stability analysis was carried out according to Morgenstern–Price (1965). The normal and shear interslice forces are considered in the Morgenstern–Price method and satisfy the force and moment equilibrium limitations.
The rainfall was incorporated into the model as a unit flux in the time step (hourly). Three stages of seepage analysis were carried out under different rainy conditions. The rainfall statistics were collected from the Indian Meteorological Department (IMD) for the rain gauge station at Karipur Airport (Figure 4) [29,38]. The combined rainfall for the months of June and July was 1475.7 mm (Table 2). In the first stage of analysis, 24.1 mm/day rainfall intensity was considered. The second stage of the analysis was carried out by considering 31.7 mm/day rainfall intensity for a period of 10 days from 1–10 August 2018 (Figure 4). The landslide occurred on 15 August 2018. Thus, the final stage was carried out by taking the antecedent rainfall of 4 days and the event day rainfall (i.e., 11–15 August 2018). The deviations in the factor of safety values and critical failure surface locations during the three different rainfall events are depicted in Figure 6, and the variation of pore pressures, degree of saturation, and factor of safety versus the rainfall duration are shown in Figure 7.

7.4. Analysis of Rainfall Events on the Vertical Cut Slope

Rainfall infiltration reduces the effective stress, and this is due to the increase in the pore water pressure caused by the water seepage force. In the initial stage before the rainfall, the soil is in an unsaturated state with high matric suction and low pore water pressure. At the end of the first stage, the matric suction of the soil decreased, and the pore water pressure started to increase. The factor of safety obtained during the first stage of the rainfall event was 1.852 (Figure 6b), indicating the slope was stable during low-intensity rainfall. The low intensity of rainfall for a prolonged duration did not create an adverse effect on the vertical cut. At the initial stage, the degree of saturation was obtained as 0.74–0.55 (Figure 7a). At the surface, the pore water pressure was −35 kPa, and it was observed as a positive value at a depth of 16 m from the surface (Figure 7b). The factor of safety of the vertical cut slope after the end of the first stage was observed as 1.852, whereas at the initial stage, it was 2.5.
During the second stage, the degree of saturation changed from 0.86 to 0.56 (Figure 7a) and at shallow depths, the pore water pressure changed to a positive value. The effective stress decreased as there was an increase in the pore water pressure. The pore water pressure at the top was recorded as −29 kPa and it changed to a positive value at a depth of 3 m from the top surface (Figure 7b). The factor of safety at the initiation of the second stage was 2.0 and it subsequently decreased to 1.45 at the end, and this was due to the increase in saturation reducing the factor of safety of the slope (Figure 6c and Figure 7c).
The end of the third stage indicated that the soil was saturated at shallow depths due to high intense rainfall, and this paved the way for the increase in pore water pressure at shallow depths. The degree of saturation was recorded as 0.95 at the top level, and at 15 m depth, it was recorded as 0.82 (Figure 7a). The pore water pressure was positive at a depth of 1 m from the ground surface, and it extended to greater depths (Figure 7b). This increase in pore water pressure led to a decrease in the shear strength of the soil. The results from the third stage indicate the soil was saturated at shallow depths, which decreased the effective stress and thereby reduced the factor of safety to less than one (Figure 6d and Figure 7c), which depicts the failure incidence that occurred on 15 August 2018. The factor of safety value decreased to 1 at the 32nd hour of the third rainfall event, but the slope failure occurred during the last hour of the third-stage rainfall event. In this case, the slope was stable.

8. Impact Analysis

The objective of impact analysis is to evaluate the performance of a building under the dynamic application of a landslide thrust laterally. It explains the landslide-building interaction and the building failure mechanism due to landslide impact [9,11,57]. The structural behavior of the load-bearing structure and the application of lateral trust by landslide mass was analyzed by the finite element method using Plaxis 3D [58].
Figure 8 depicts the schematic line diagram of the building model and landslide thrust. The building width, length, and height were 18 m, 11 m, and 7 m, respectively. The building foundation soil was modeled as ten-node tetrahedral elements. The Mohr–Coulomb constitutive model was used to model the foundation soil [59].
The materials, soil for foundation, and concrete for building, were considered homogeneous and isotropic. Elastic and plastic material parameters such as Young’s modulus, the friction angle, and structural properties were considered in the analysis as shown in Table 5. Elastic material properties were adopted for the modeling of beam and plate elements. Beams and plates were modeled using 3D beam and plate elements, respectively. The plate elements were used to model the slab and walls (load-bearing walls) of the building. The beam was used to model the elements with bending and axial stiffness. Plates are shell elements used to model a two-dimensional structural component with flexural stiffness. Beam elements were modeled with three-node line elements, which had a total of six degrees of freedom (three translational and three rotational) per node. The elastic behavior of beam elements was defined by the cross-sectional area, the modulus of elasticity in the axial direction, and the moment of inertia against bending in the second and third axes [59].
Young’s modulus of concrete was determined using Ec = 5000√(fck) as per IS 456:2000 (Reaffirm 2021) [60]; M25-grade concrete was used to model the beams and slabs of the building. Fe415-grade steel was used as the reinforcement (the yield strength of steel is 415 MPa).
A fixed boundary condition was considered for the building foundation, which was not directly impacted by landslide thrust. The fixed boundary was applied to the bottom portion of the walls. According to the specifications for the design of load-bearing structures, live and dead loads were considered for the analysis [9,61].

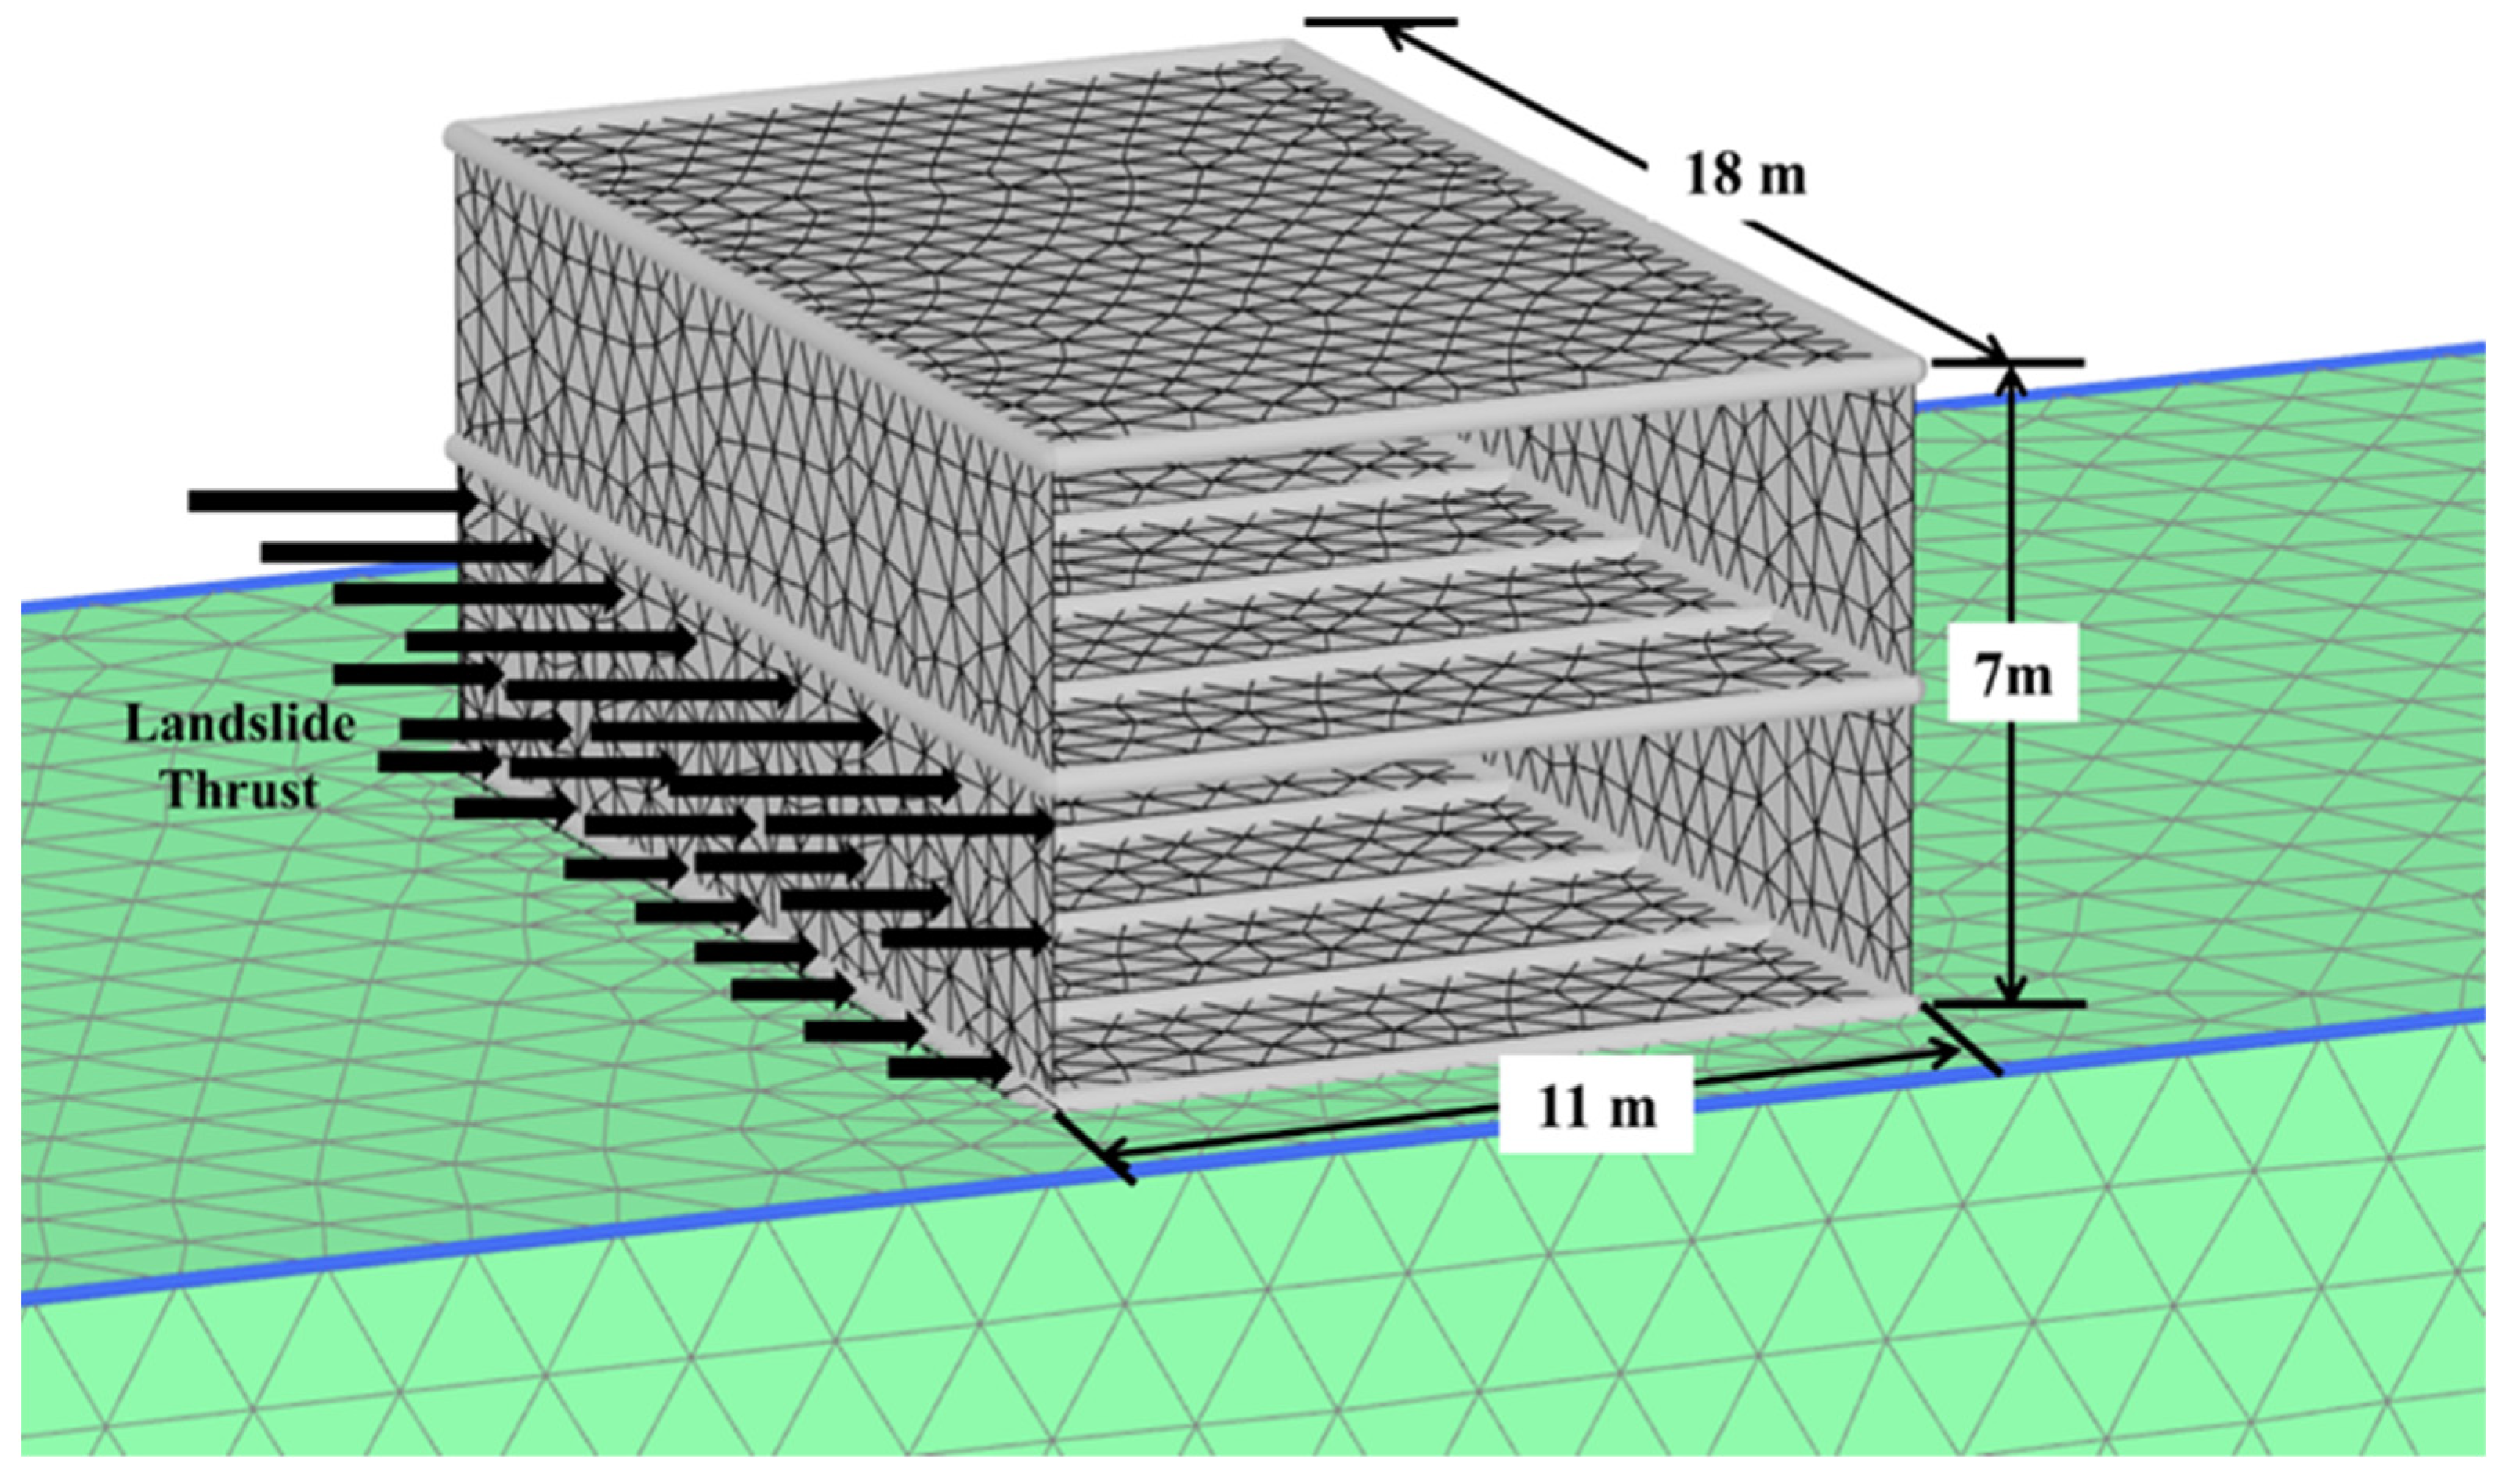
8.1. Determination of the Impact Load

The landslide thrust force was evaluated by employing the residual-thrust method, which is extensively applied for landslides and slope stability analysis [60,63]. Figure 9 describes the typical slip surface with the slices, the free body diagram of one slice with force representation, and the critical slip with a factor of safety value of 0.632. The landslide mass was split into multiple slices in this process (Figure 9), and force analysis was carried out on each slice. In this way, it is possible to determine the thrust of a landslide mass by utilizing the actual shape and profile of the sliding/failure surface, including under complex loads [11]. Figure 9 describes sliding forces and the free body diagram of a typical slice with various forces at a critical slip surface. The landslide thrust (q) was determined by applying the empirical Equations (2)–(4). In this method, infiltration seepage was considered under different rain conditions analyzed using the Slope/W and Seep/W applications [52].
The determination of the residual thrust force for the ith slice is given below:
P i = P i 1 × φ i 1 + T i R i F s
F i = cos θ i × P i
where Fs denotes the landslide safety factor, Ri denotes the resisting force (kN/m), Ti denotes the driving force (kN/m), Pi denotes the residual thrust (kN/m), φi denotes the transmitting coefficient, Fi denotes the horizontal component of residual thrust.
Referring to Dai 2002 [63], landslide thrust (q) was determined by the following equation:
q z = 1.8 F h 2 z + F 10 h
where z represents the thickness of soil, h represents the vertical distance from the toe, F represents the horizontal component of the residual thrust.
The landslide thrust (q) was applied on the rear side of the building for the different vertical distances from the toe of the landslide. The calculated landslide thrust (q) at 5 m height was 428 kN/m, at 4 m height was 347 kN/m, at 3 m height was 266 kN/m, at 2 m height was 185 kN/m, at 1 m height was 103 kN/m, and at 0.5 m height was 64 kN/m. Figure 10 shows the landslide thrust on the rear side of the building, the generated mesh, and the geometry of the building modeled using finite element analysis.

8.2. Mesh Convergence Analysis

Mesh convergence analysis is required to determine the size of elements in finite element modeling. It determined that the number of element nodes required for a model to endorse the results is not affected by the size of the elements. The analysis was carried out with five different mesh types. Table 6 shows the details of the mesh convergence study and the results of analysis. Displacement and settlement values increased with decreasing mesh size. The fine and very fine mesh types had minor changes in the results. The very fine mesh type was considered for the analysis. The smaller mesh size can be defined to ensure the analysis results have minimum tolerable error. The generated very fine mesh for the analysis is depicted in Figure 10.

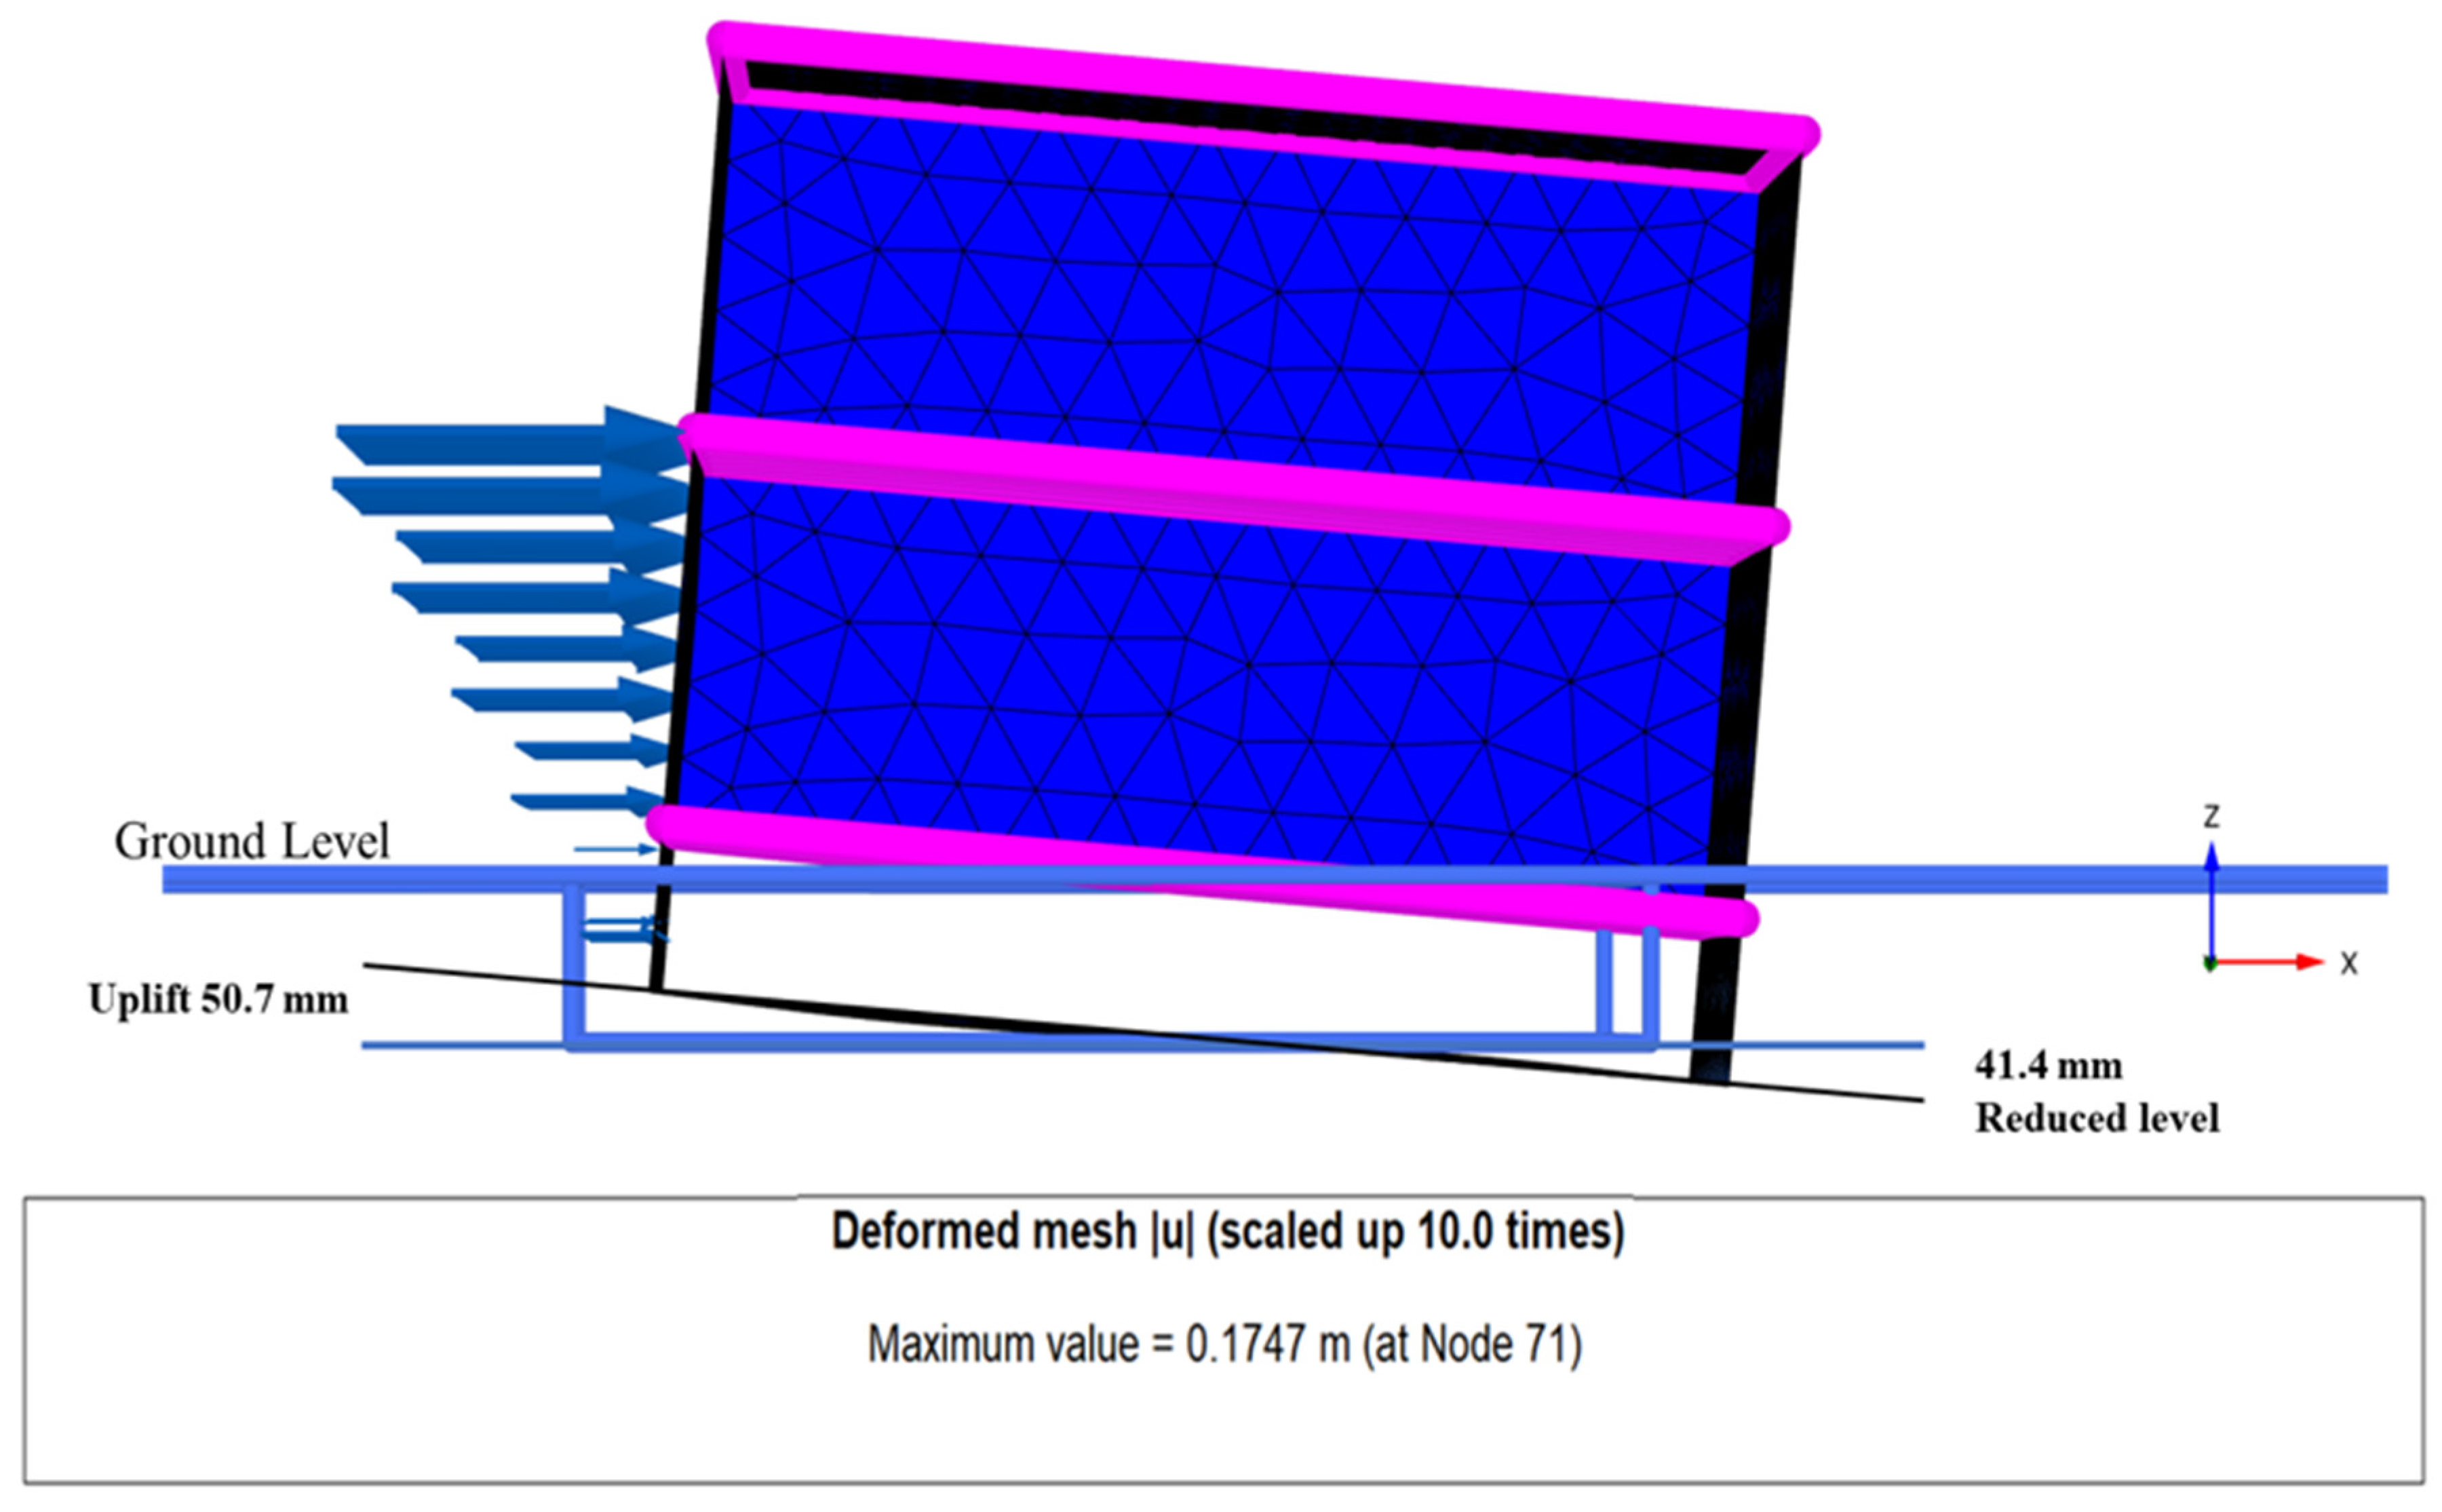
8.3. Building Settlement Analysis

The settlement of the structure is the vertical displacement of the structure due to a static load or dynamic load. The vertical and lateral displacements of the building were observed from the dynamic impact analysis. According to IS:1904–1986 (Reaffirmed 2015) [62], the differential settlement or tilt of the load-bearing structure’s permissible limit was 60 mm. In the dynamic impact analysis, after applying the impact thrust, the building tilted and experienced a differential settlement of 92 mm, which is higher than the permissible limit. Figure 11 shows the settlement and lateral displacement of the building. Numerical analysis results show that the 170 mm lateral displacement of the building specifies failure. Settlement and displacement values indicated the collapse of load-bearing walls under the landslide thrust.

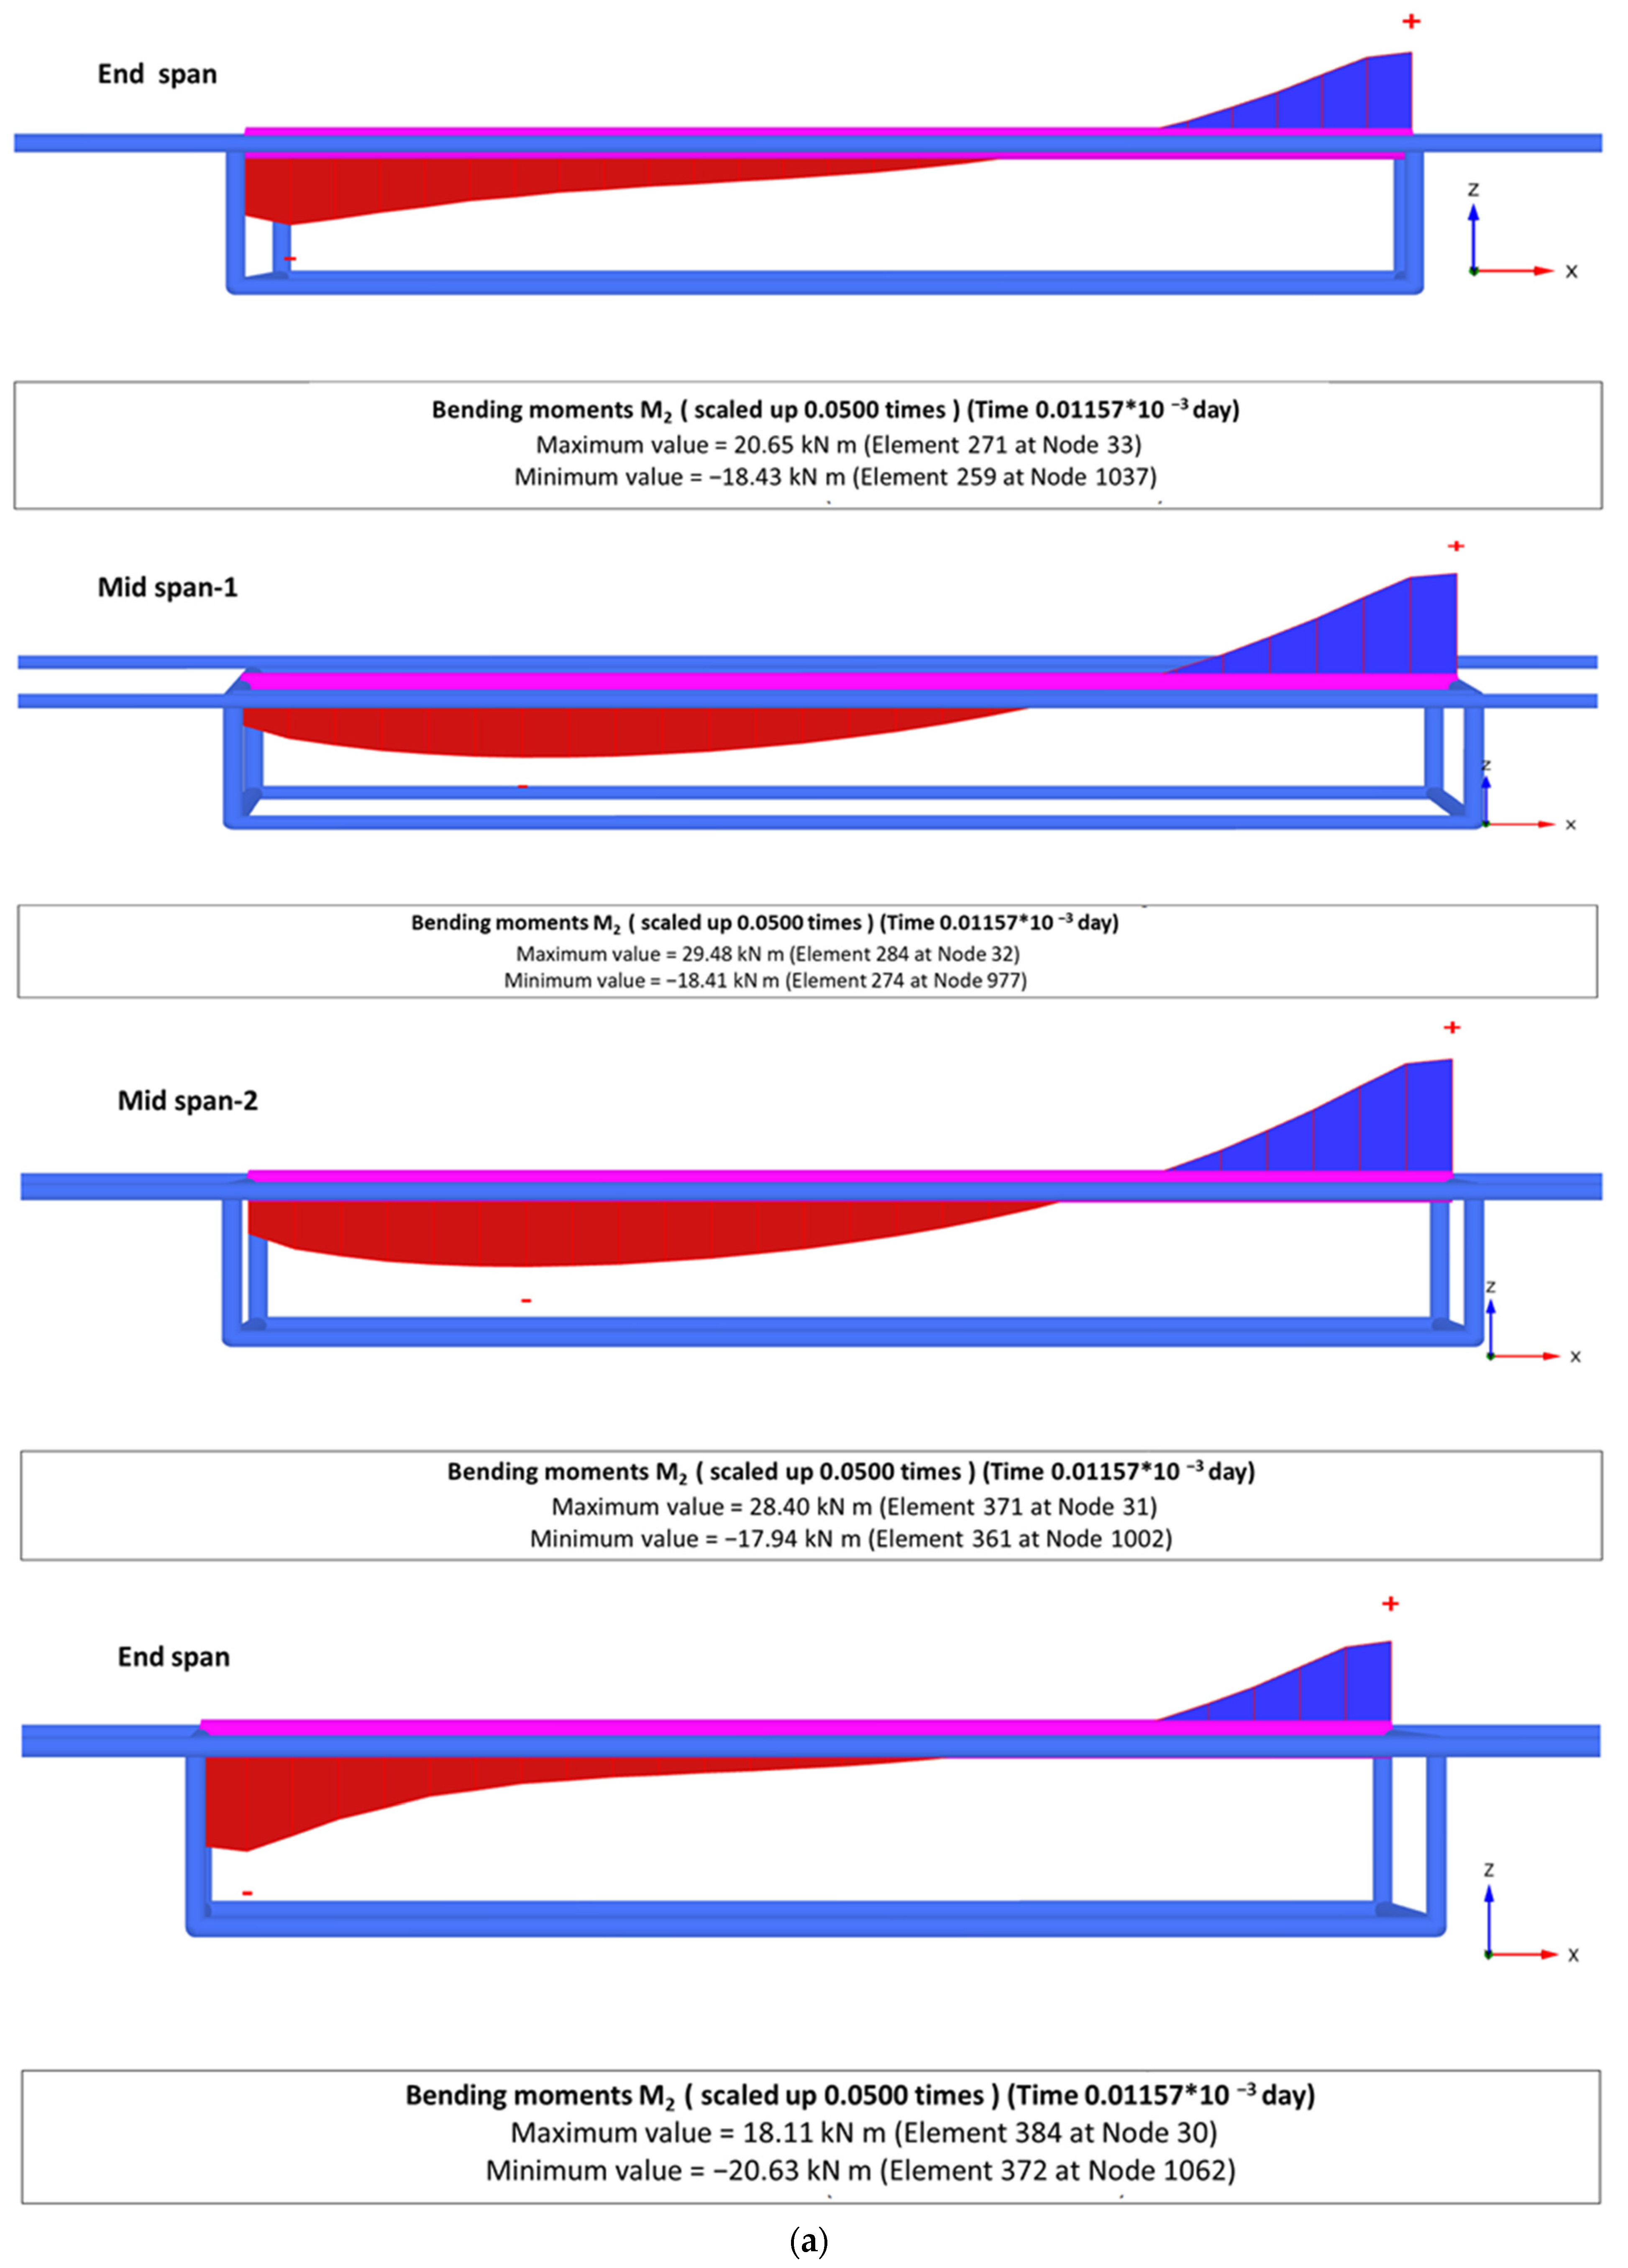
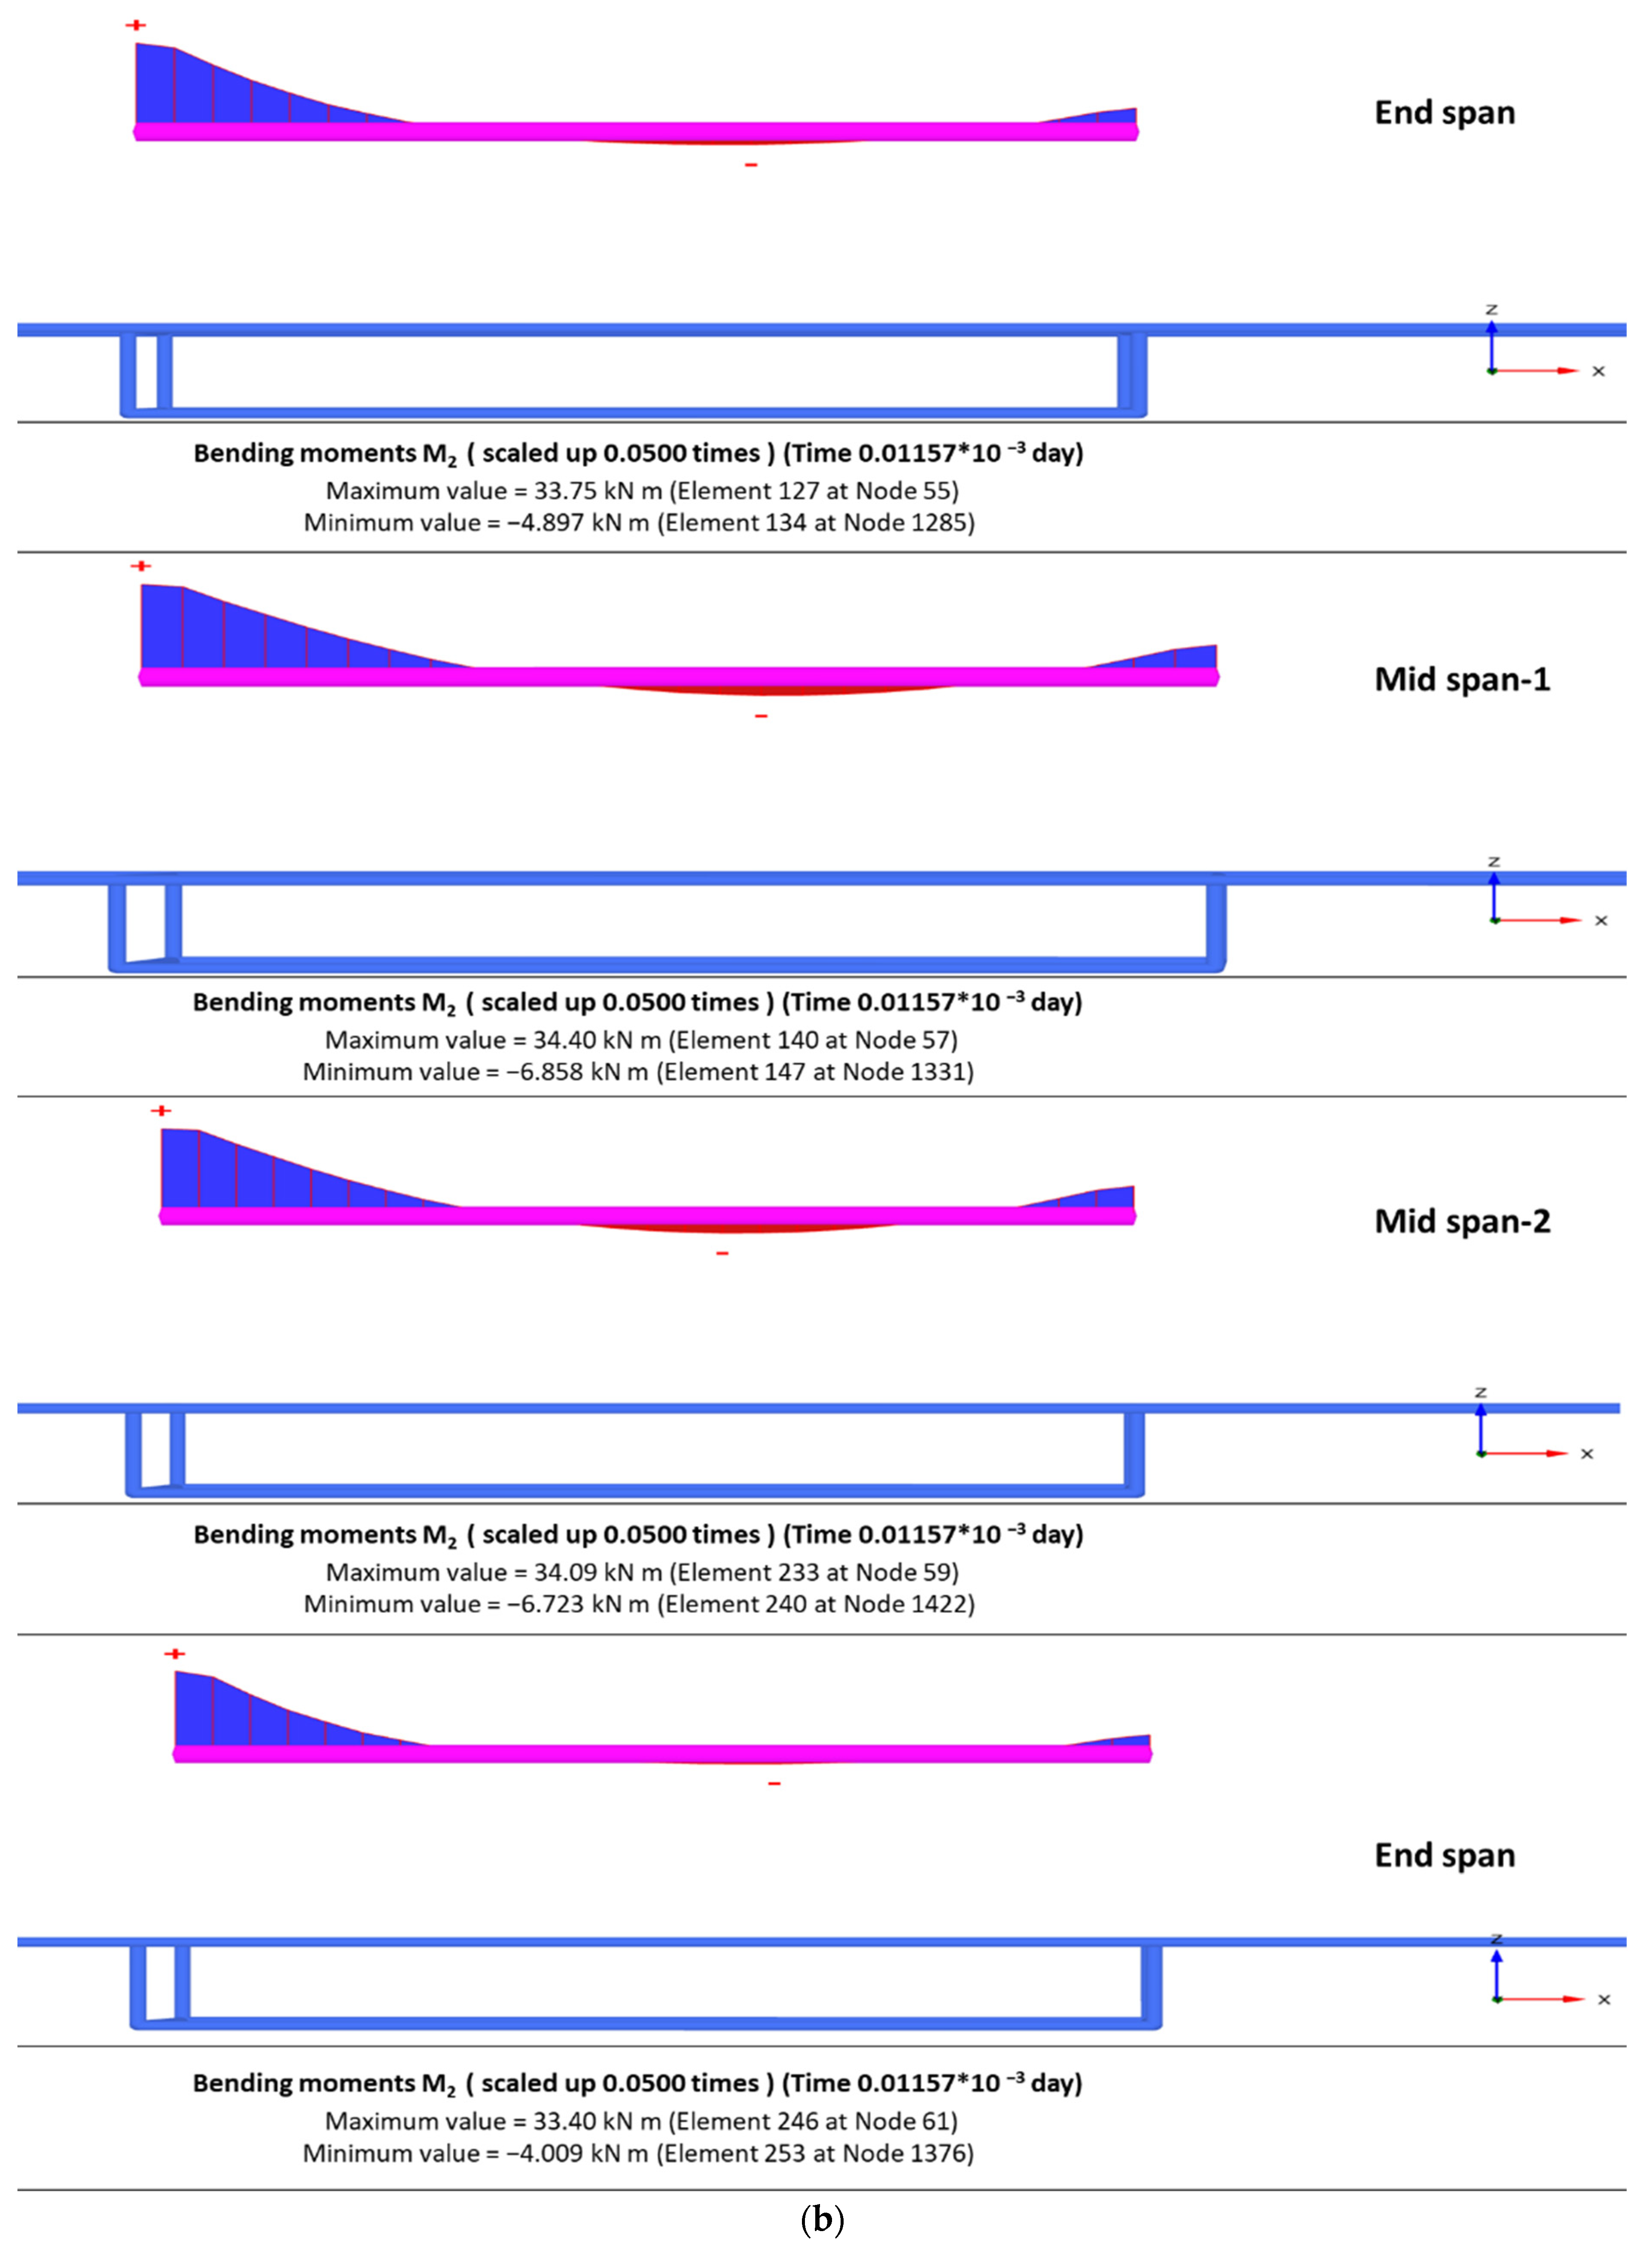
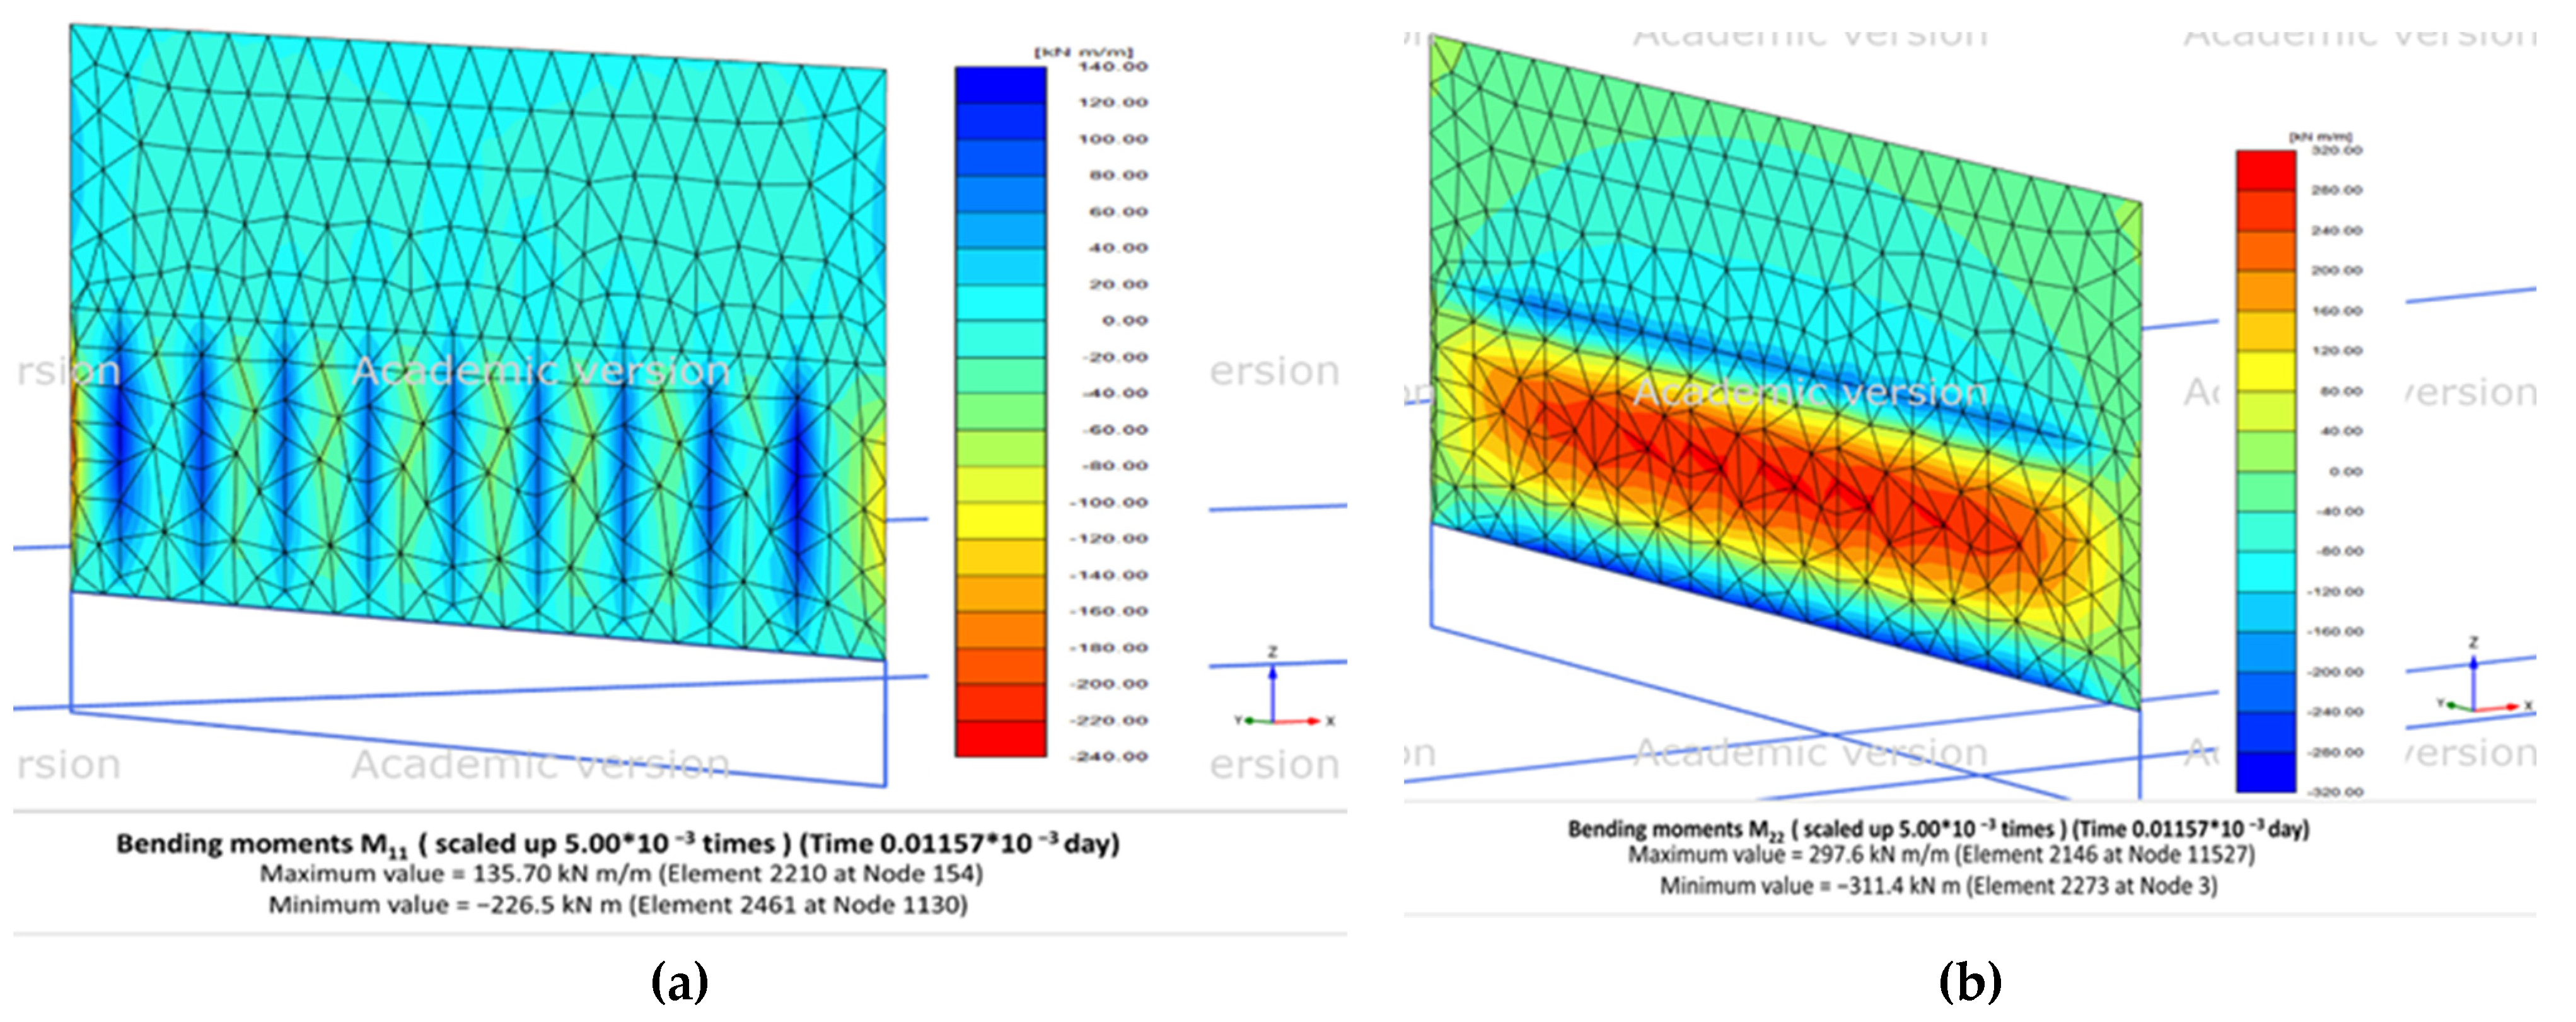
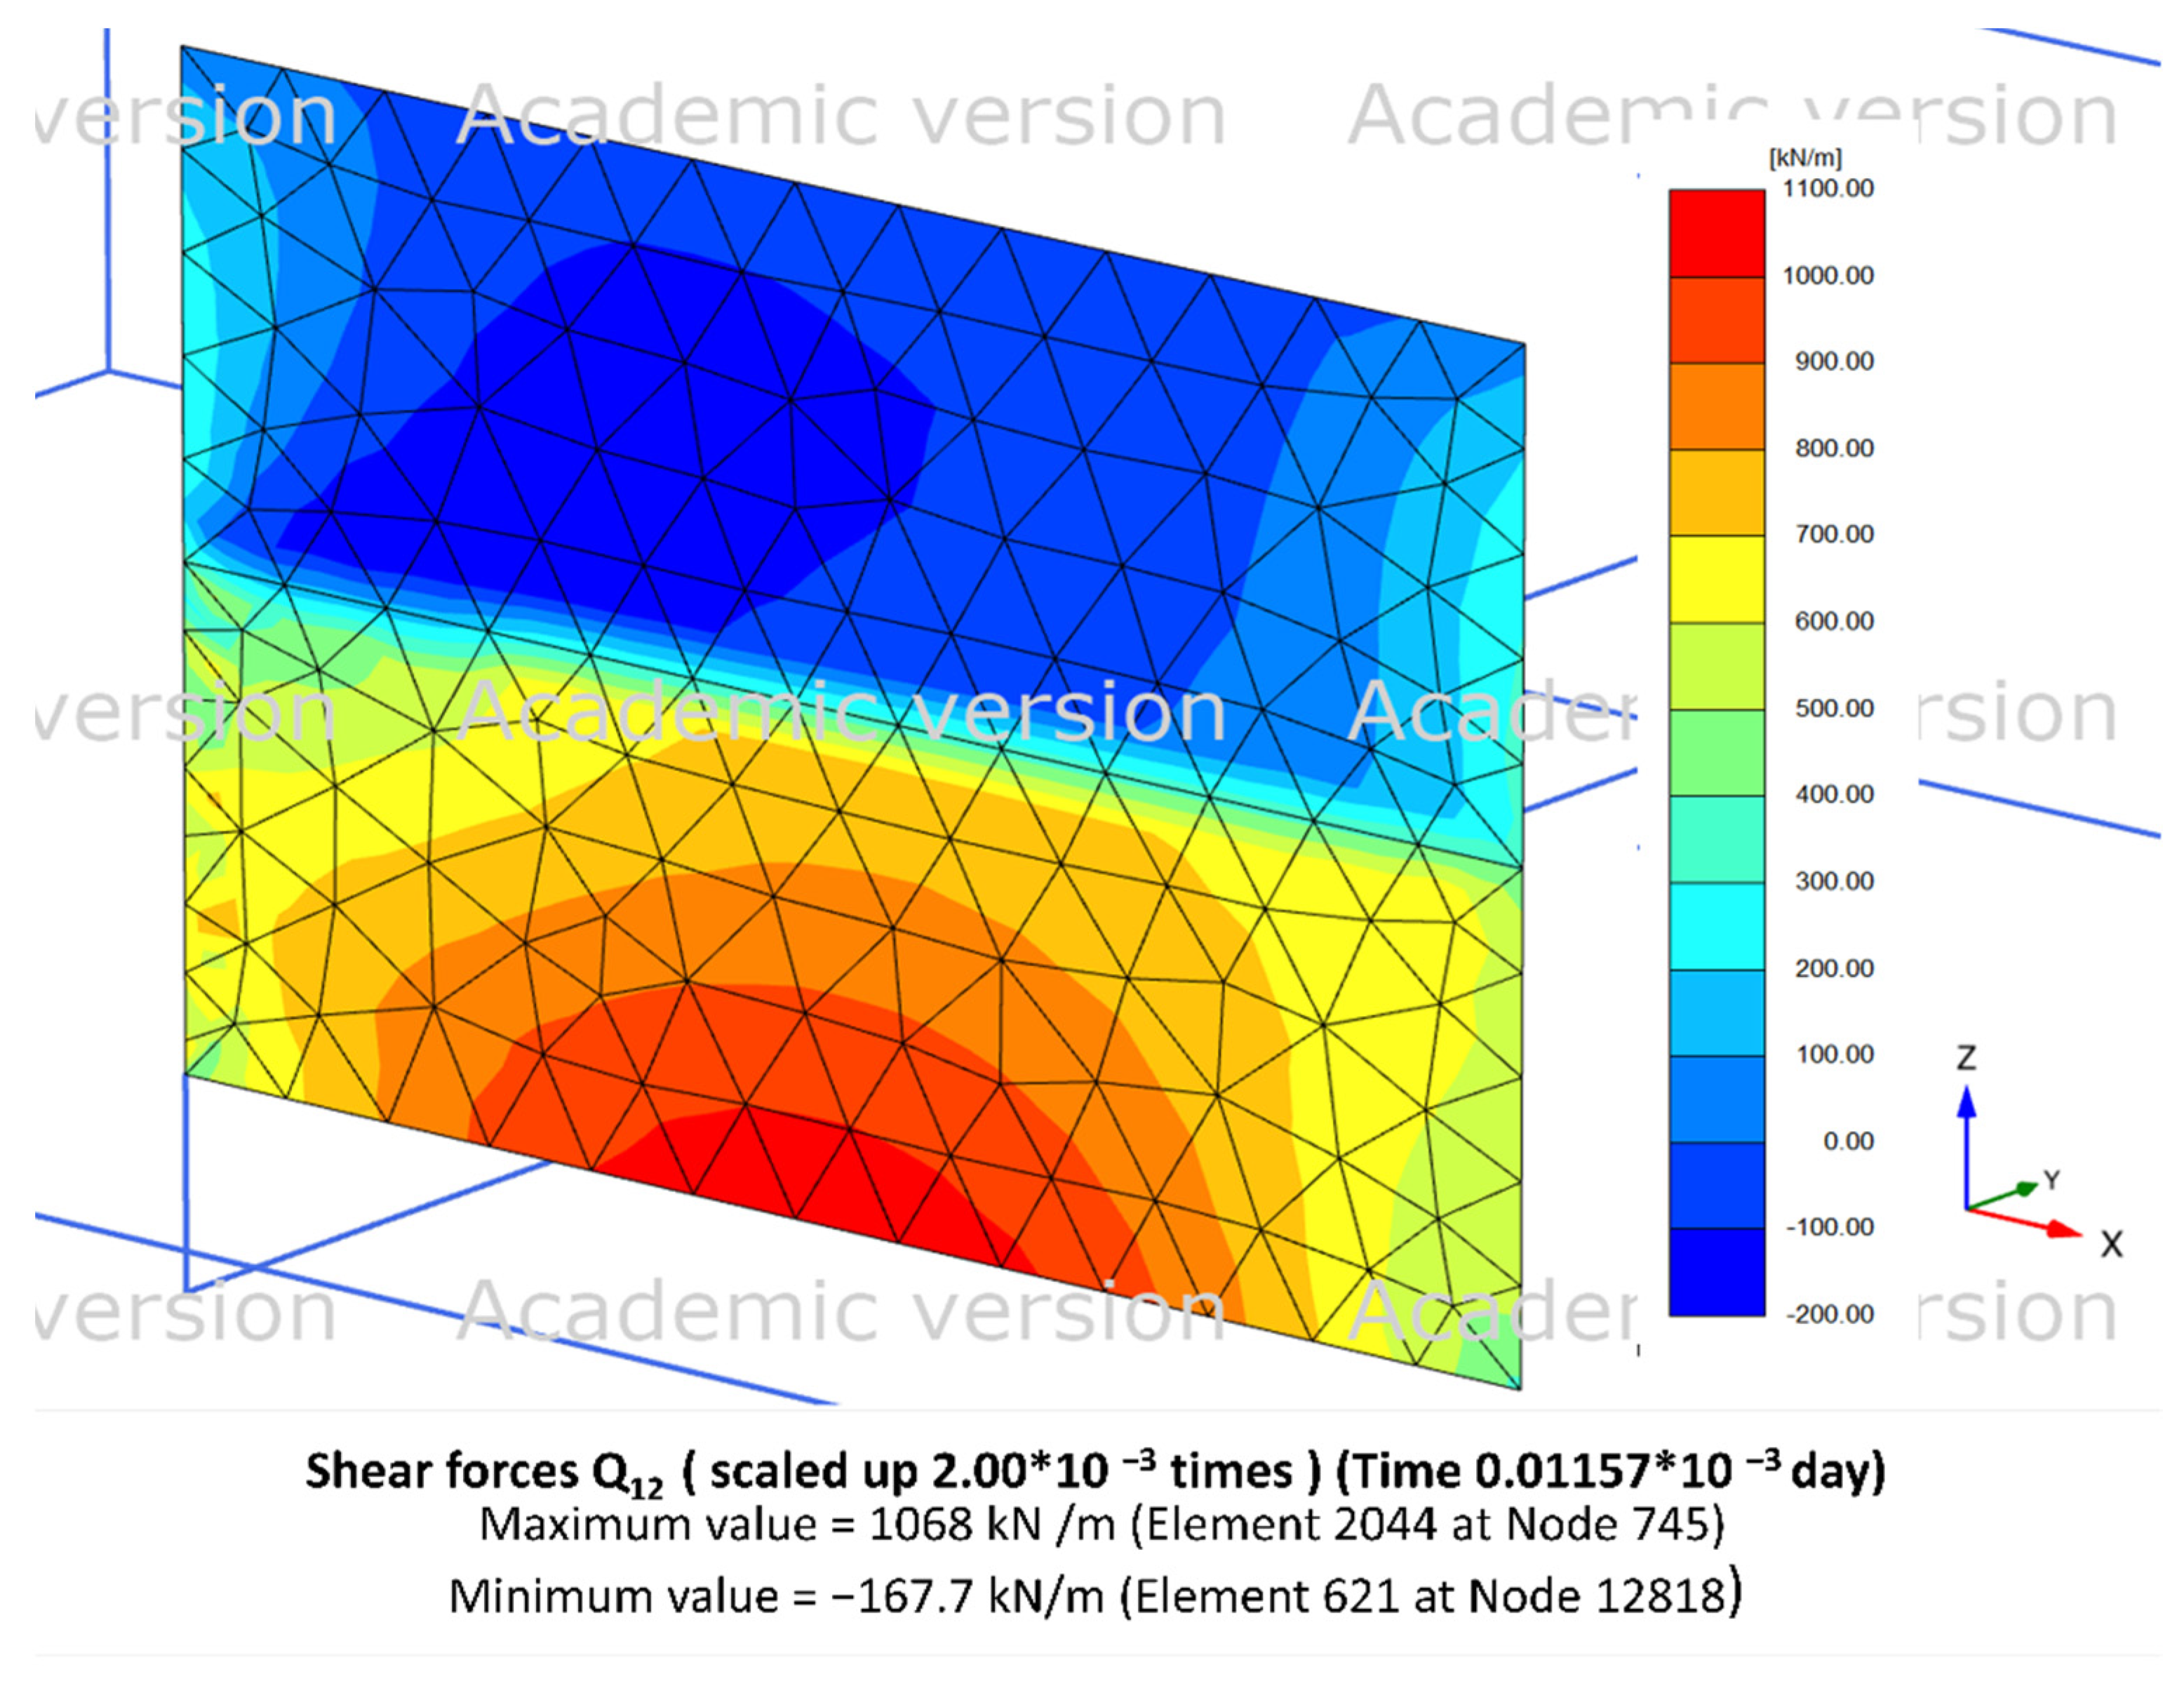
8.4. Flexural Strength of Beam Elements

The allowed or limiting moment of resistance (Mu(lim)) is the maximum moment that can be allowed for the structural elements of a building. The allowed bending moment at the end span (+ve Mu(lim)) (negative moment) at the midpoint of the span (+ve Mu(lim)) (positive moment) was estimated according to IS 456:2000 (Reaffirmed 2021) standard [60] and compared with the moments that developed due to dynamic impact analysis. During rainfall and due to landslide lateral thrust, the walls and beams of the building were demolished due to the low out-of-plane flexural strength and excessive deformation of beams. As the building was a load-bearing structure with low stiffness, a low-intensity force was more than enough for the collapse of the building [9]. The structural components and the building failed due to flexure; the factor of safety with respect to flexure is to be considered for the safe construction of a building in the case of any hazard. For residential construction, a slope with a static safety factor of 1.5 is sufficiently safe against landslides in terms of shear [25].
The bending moments of beams before and after the application of the impact force were obtained from the finite element analysis and are presented in Table 7. The permissible bending moments (allowed or limiting moment of resistance (Mu(lim)) of the end and midpoints were 14 kN-m and 21 kN-m, respectively (Table 7). Before the application of the impact load, the plinth beams and first floor beams had safe bending moments against failure. Figure 12a,b shows the negative and positive bending moments of the plinth portion and first-floor beams. After application of the dynamic impact load on the building, the bending moments of the plinth beams and first-floor beams increased to twice the permissible limit (Table 7). The higher bending moments than permissible limits indicate the failure of beams resulted in the demolition of the building.
It is significant to study the performance of a building under the effects of landslide debris and the collapse of vertical cuts during high-intensity rainfall. Due to the sudden impact load developed by a huge amount of saturated landslide mass (more than 1500 cubic meters), the lateral thrust was applied on the rear side of the building. The beams and walls were severely affected by the impact thrust, resulting in the demolition of the building. The flexural strength of each beam increased its design strength twice after the impact load. The building differential settlement observed from dynamic impact analysis was higher than the permissible limit. The building’s lateral displacement was noted as 170 mm, which means the building was moved away from its position. This confirms the failure of the load-bearing structure due to the rainfall-induced landslide that occurred on 15 August 2018.

8.5. Performance of Load-Bearing Walls under Impact Load

The failure criteria of the load-bearing walls of building were studied in two aspects: tensile stress failure (out-of-plane behavior) and shear stress failure (in-plane behavior). The loadbearing walls considered for the determination of permissible stress are shown in Figure 8: the flexural failure criteria out-of-plane behavior studied for wall 1 (rear side wall) and the shear failure criteria in-plane behavior studied for wall 2 (adjacent wall).
As per Indian standard code (IS 1905–2017) [24], the design of the load-bearing masonry wall must be based on the capacity of permissible tensile forces. The permissible tensile limit is 0.07 N/mm2 for bending in the vertical direction and 0.14 N/mm2 for bending in the longitudinal direction.
The bending moments of the wall (wall 1) (Figure 1) after the landslide are shown in Figure 13a,b; the maximum bending moment in the vertical direction was 226 kN m/m and in the longitudinal direction, 311 kN m/m. The bending stresses of the wall were calculated by using the maximum bending moment from the finite element model analysis. The actual and permissible limits of bending stresses are presented in Table 1.
The permissible shear stress of the load-bearing walls was determined by the resisting horizontal forces in the wall and the cross-sectional area of the wall; the permissible limit of shear stress is 0.5 N/mm2. The shear stress of the wall (wall 2) (Figure 14) after the landslide is shown in Figure 14; the maximum shear stress of the wall was 1068 kN/m. The shear force after the landslide impact was calculated by using the maximum shear force from the finite element model analysis. The actual and permissible limits of the shear stress are presented in the Table 8.
Higher bending moments and shear stress developed in the walls of the building during the landslide. As can be observed from the table, the actual bending moments and shear stress were much higher than the permissible limits, clearly denoting the failure of the building.

9. Elucidation of Risk to the Built Environment

This paper highlights the performance of a building under the impact of landslides and the failure mechanism of rainfall-induced landslides (vertical cut slope failure). The building collapsed due to vertical cut failure and was constructed without proper remedial measures. Various engineering measures can be applied to protect soil vertical cuts. The construction of retaining walls, subsurface drains, gabion walls, horizontal drains, and mechanically stabilized earth walls can reduce the loss during disasters. The well-planned construction of buildings with high-strength structural elements and providing ample space between building and vertical cuts may reduce the damage due to natural disasters. Along the Western Ghats, thousands of buildings and other structures are constructed very close to vulnerable to vertical cuts, which tend to fail during high-intensity rainfall. Figure 15a–i shows that the many residential buildings, commercial complexes, and shops were constructed by making vertical cuts in the hill portion without any safety measures.

10. Results and Conclusions

The Peringavu building collapse, resulting from a landslide (vertical cut failure) due to intense rainfall, was the most significant landslide during the southwestern monsoon period of 2018 in Kerala state. The study presents the investigation outcomes of the incident through geotechnical characterization, the post landslide field condition, the mechanism of failure based on numerical analysis, and the building performance under the dynamic impact of the landslide. The salient conclusions are described as follows:
  • The laboratory experiments and geotechnical characterization revealed that sandy silt (ML) was present at the failure surface. This soil type has low to moderate permeability.
  • The Peringavu landslide is in the midland region and it is associated with flat-top laterite fields and hillocks. The thick laterite soil deposits and charnockite rocks indicate the intense weathering process at the location. The higher-grade weathering of Charnockite rock has produced laterite soil to great depth.
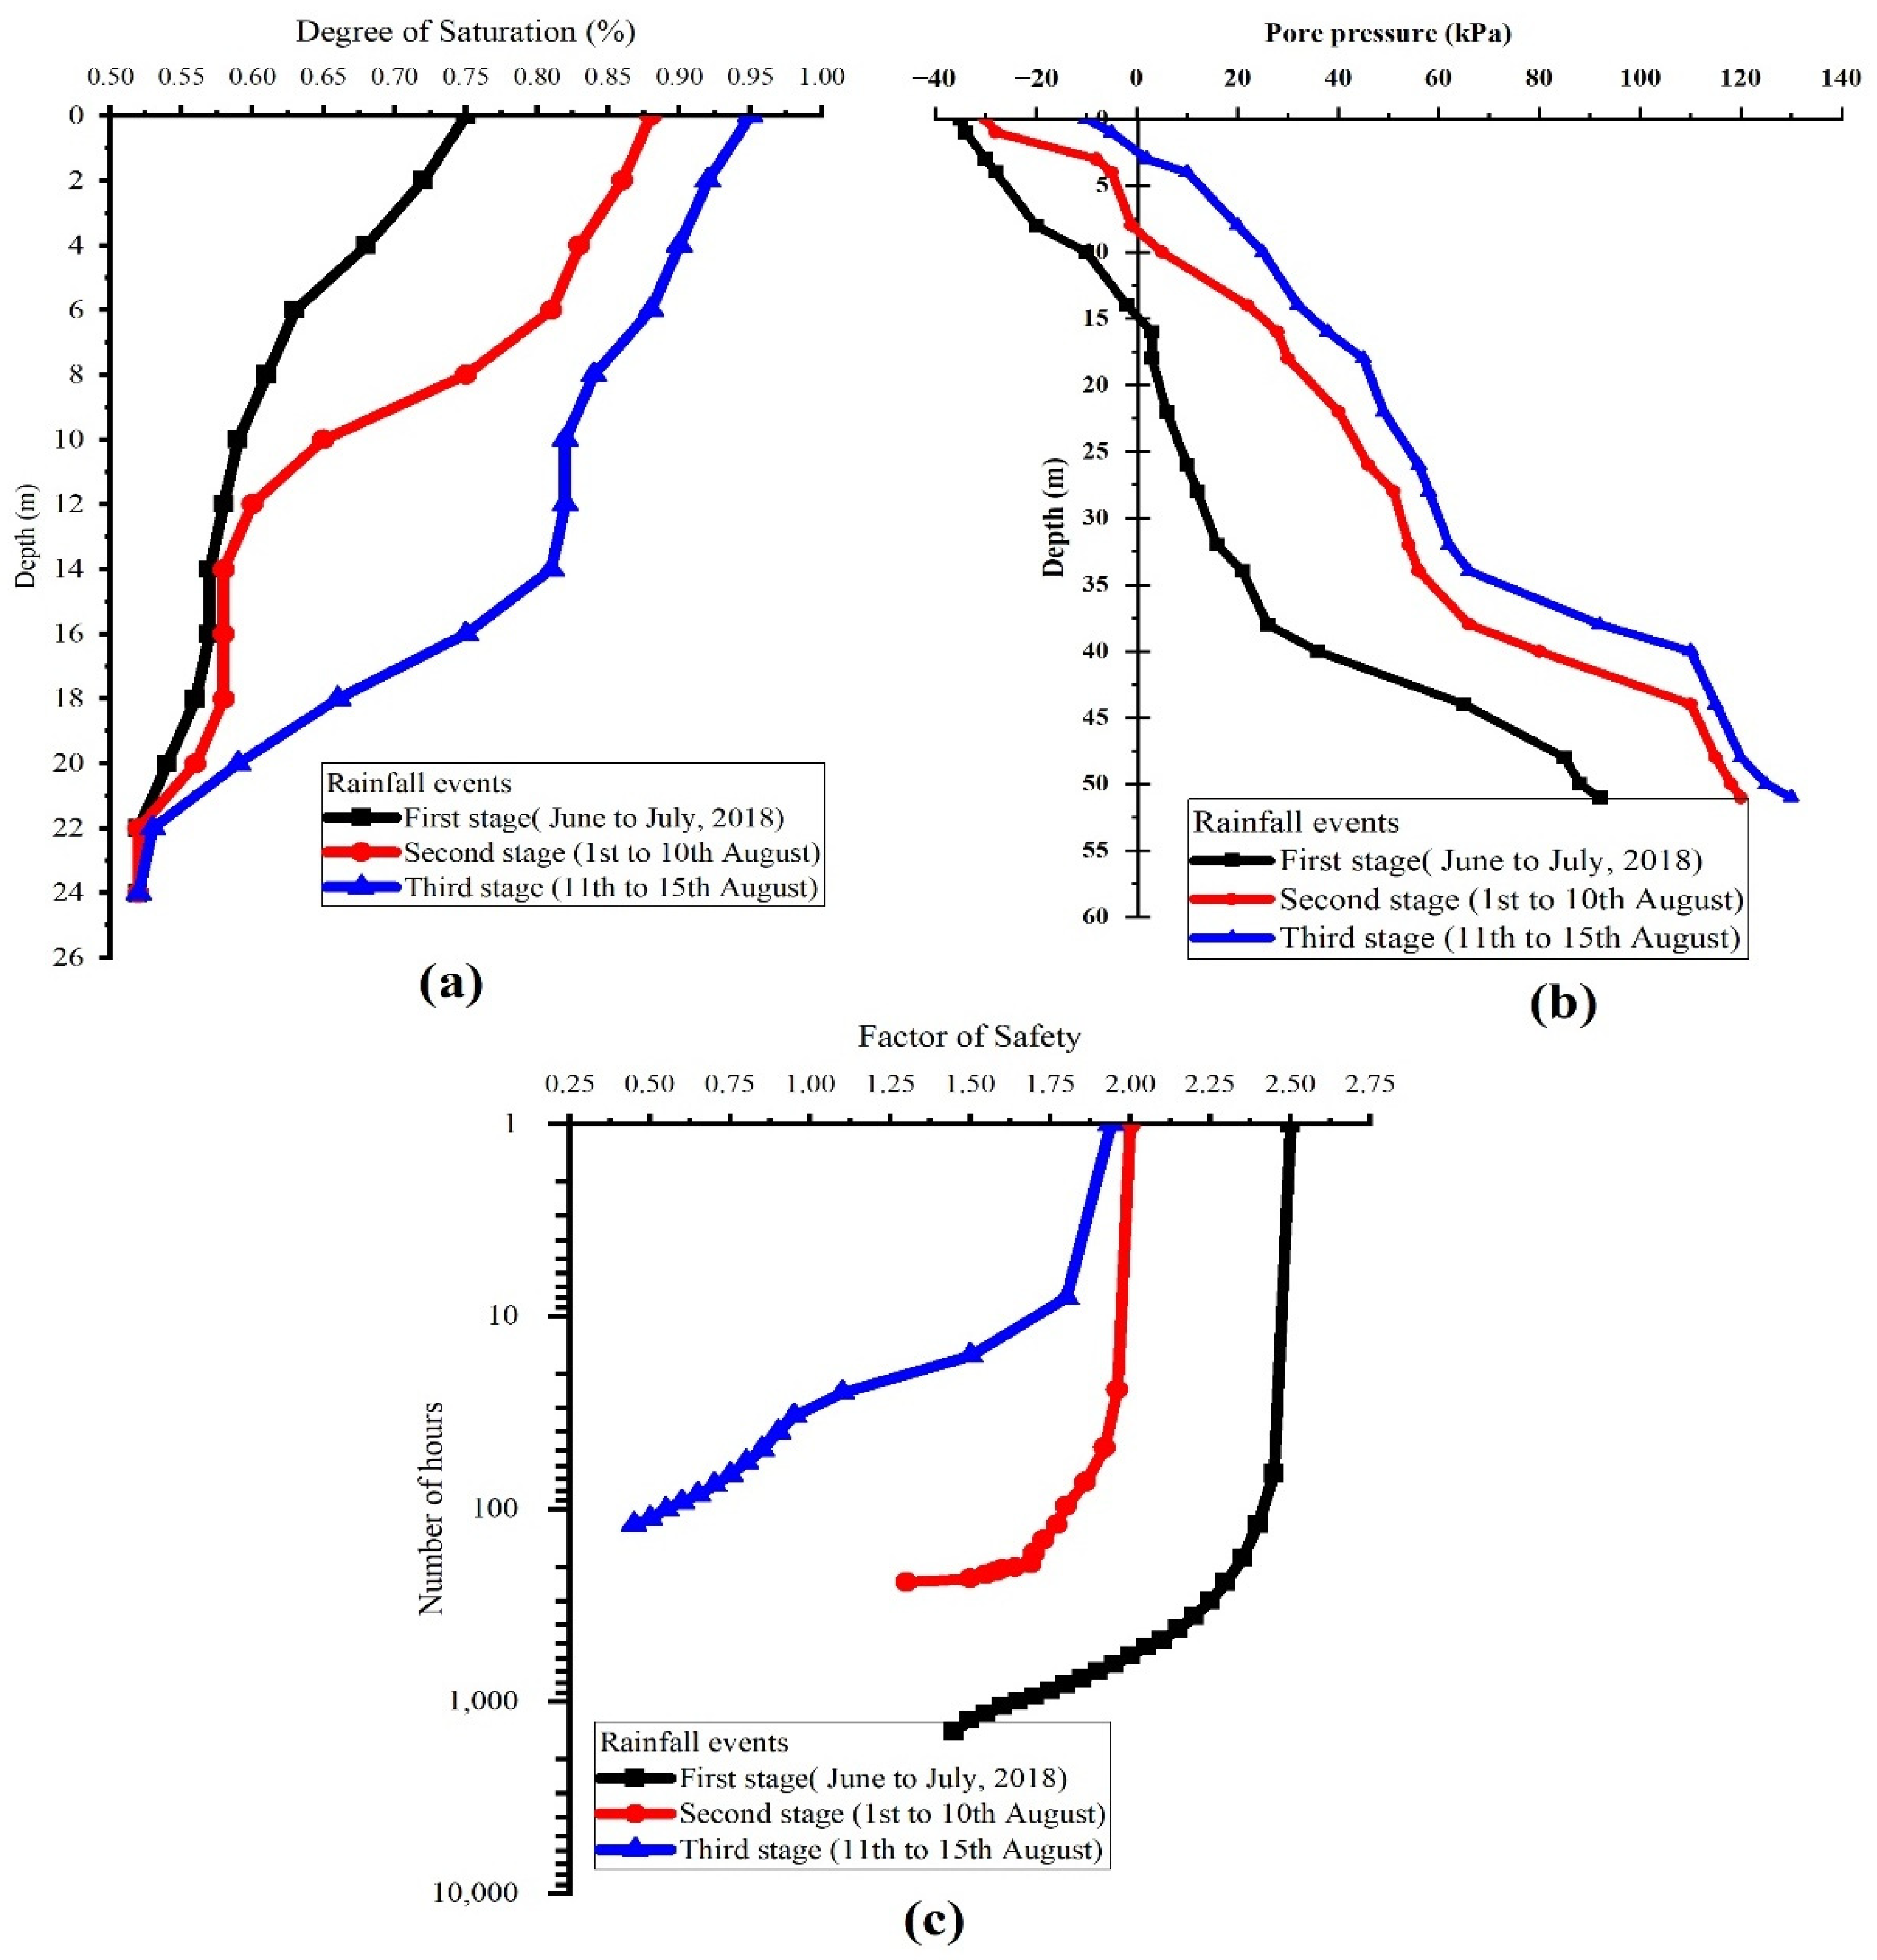
  • The first-stage rainfall analysis, low rainfall intensity, was applied for 61 days. The matric suction of the soil in the top layer was observed to be greater, and hence the results of the analysis indicated a high factor of safety values at the end of the first stage of rainfall analysis.
  • The second-stage rainfall analysis results were based on moderate intensity rainfall for ten days, which highlights the importance of antecedent rainfall statistics in the analysis and its influence on the factor of safety of the slope.
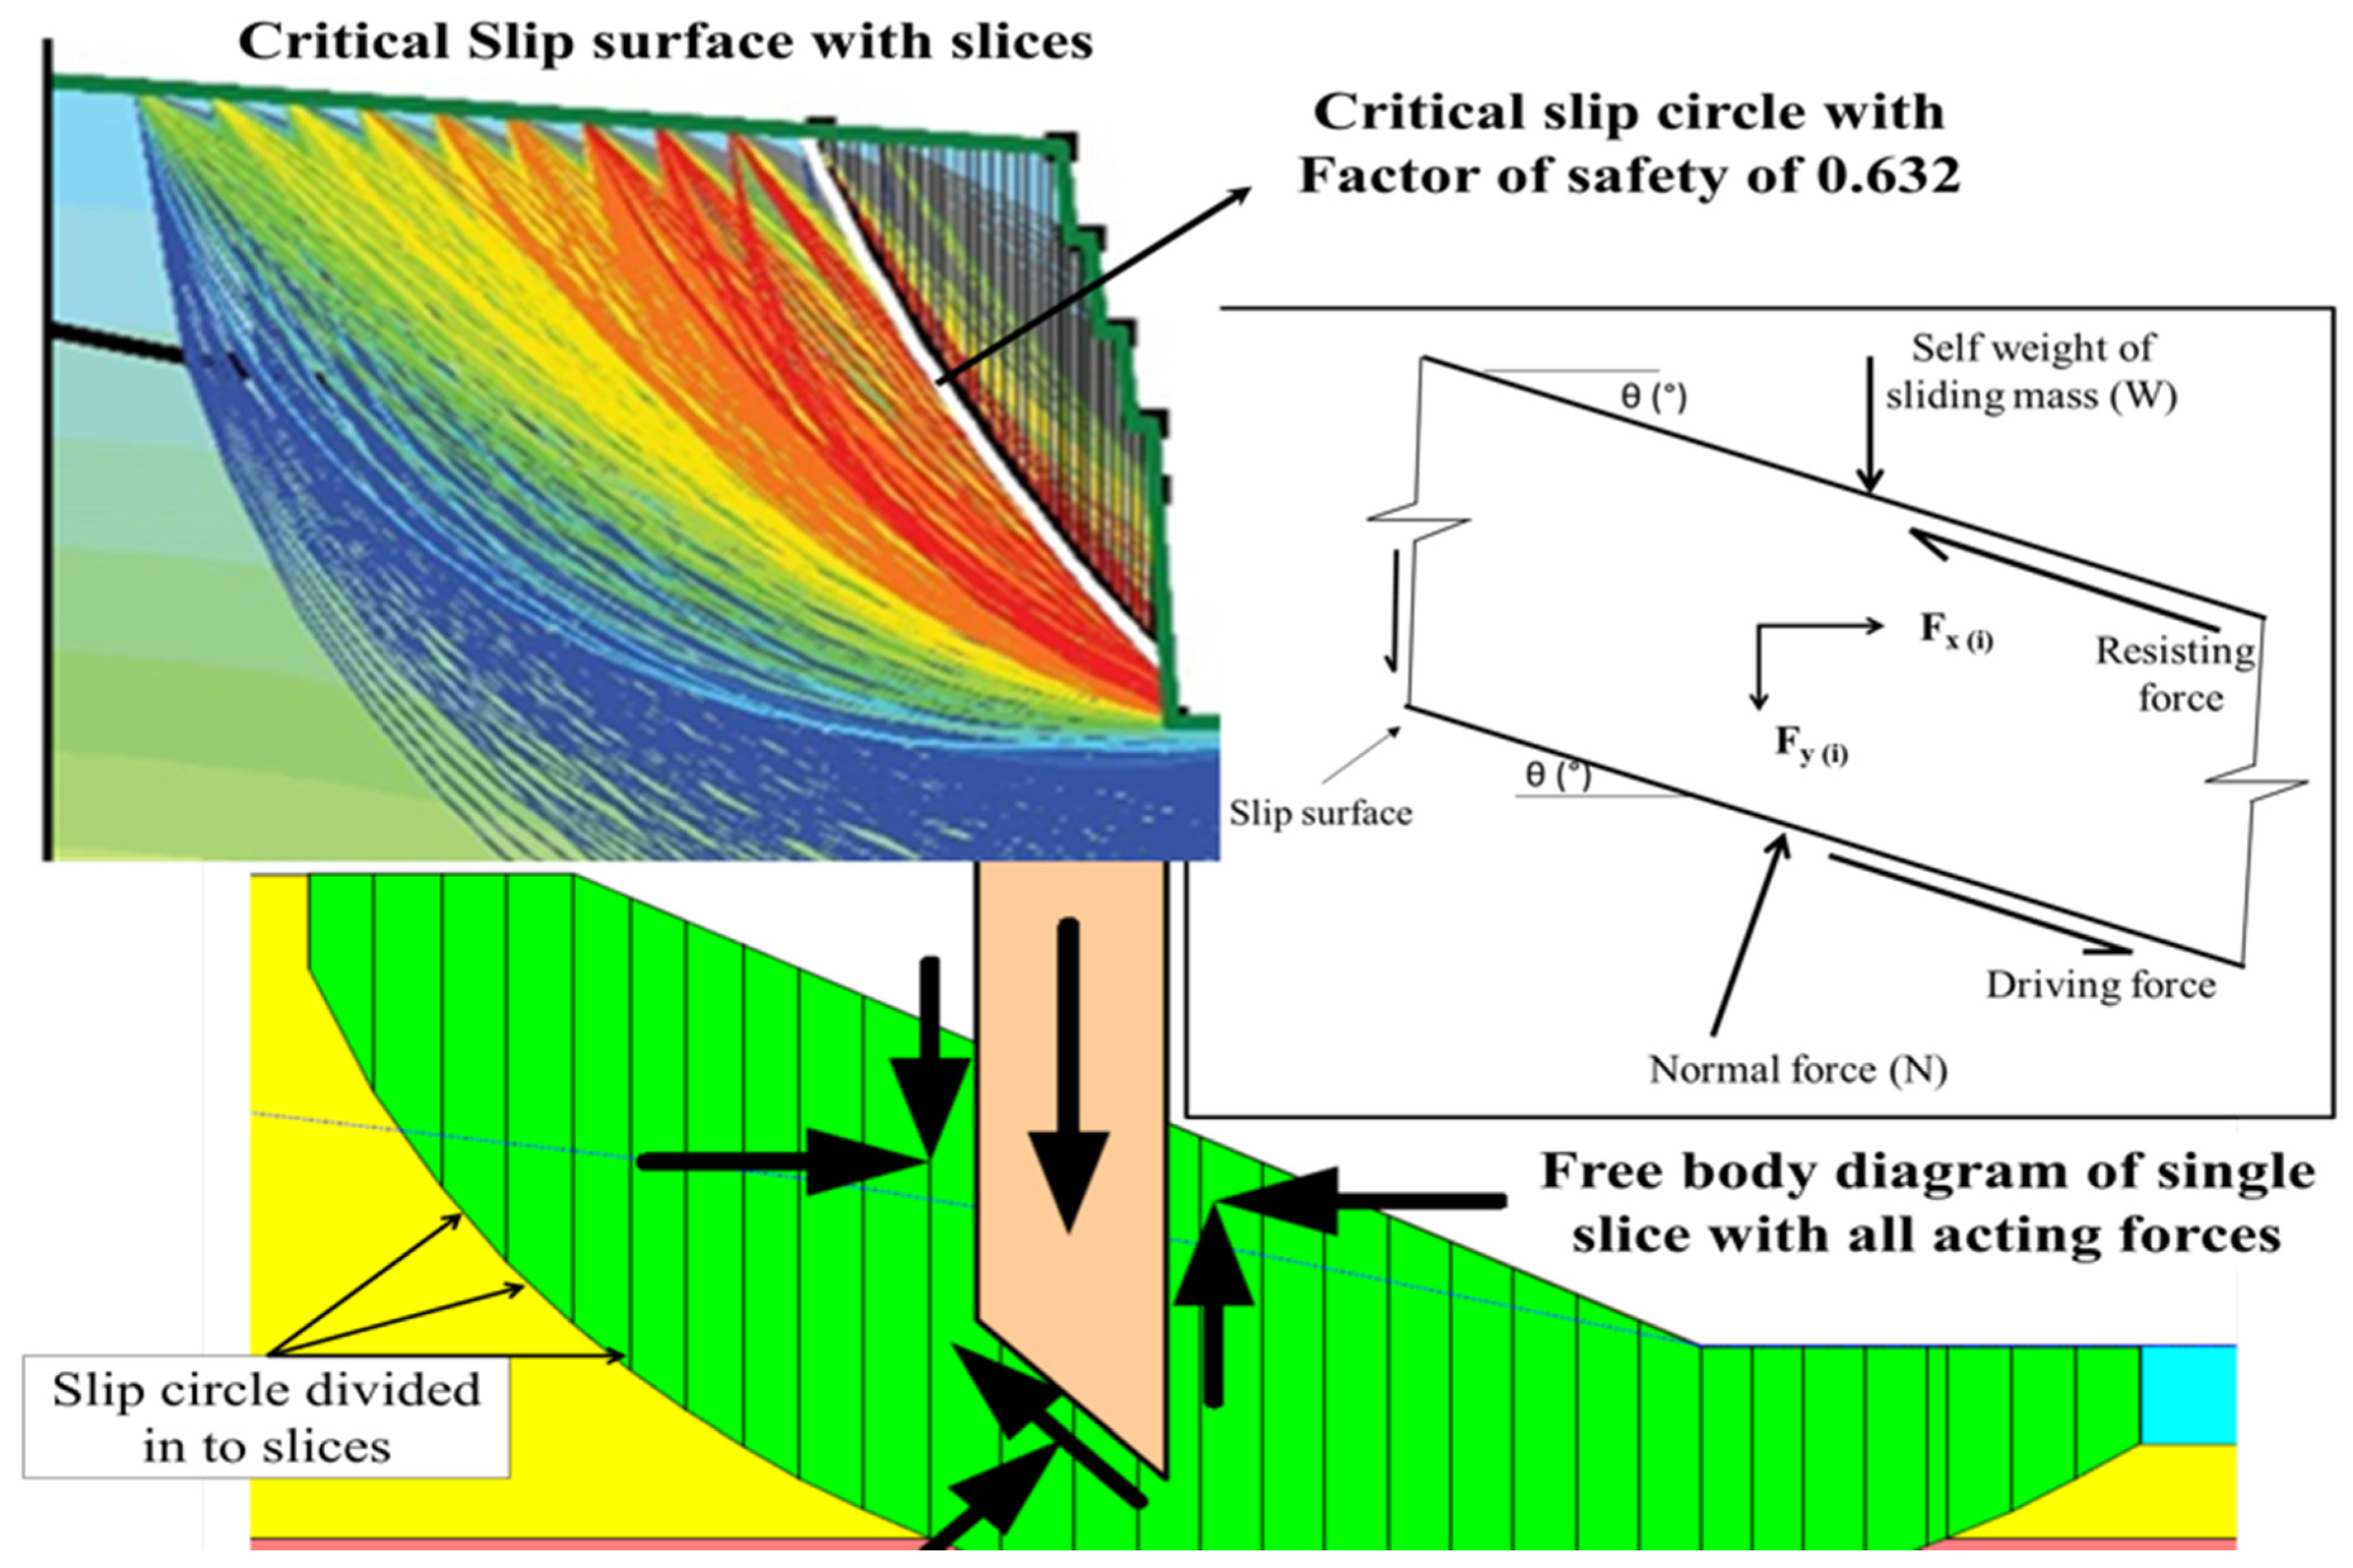
  • The final stage analysis of the rainfall event included the highly intense rainfall. The high-intensity rainfall on the last day increased the soil degree of saturation to higher percentages. The higher degree of saturation on the slope and the consequent reduction in the soil matric suction and progressive development of pore pressure led to the reduction in the factor of safety values. Thus, the landslide occurred and led to the building collapse. The results obtained from numerical analysis are similar to the slope failure noticed in the field.
  • The study explained the performance of the building as well as the behavior of structural members under the landslide impact. The destruction of the building due to landslide impact was explained by dynamic impact analysis with finite element analysis.
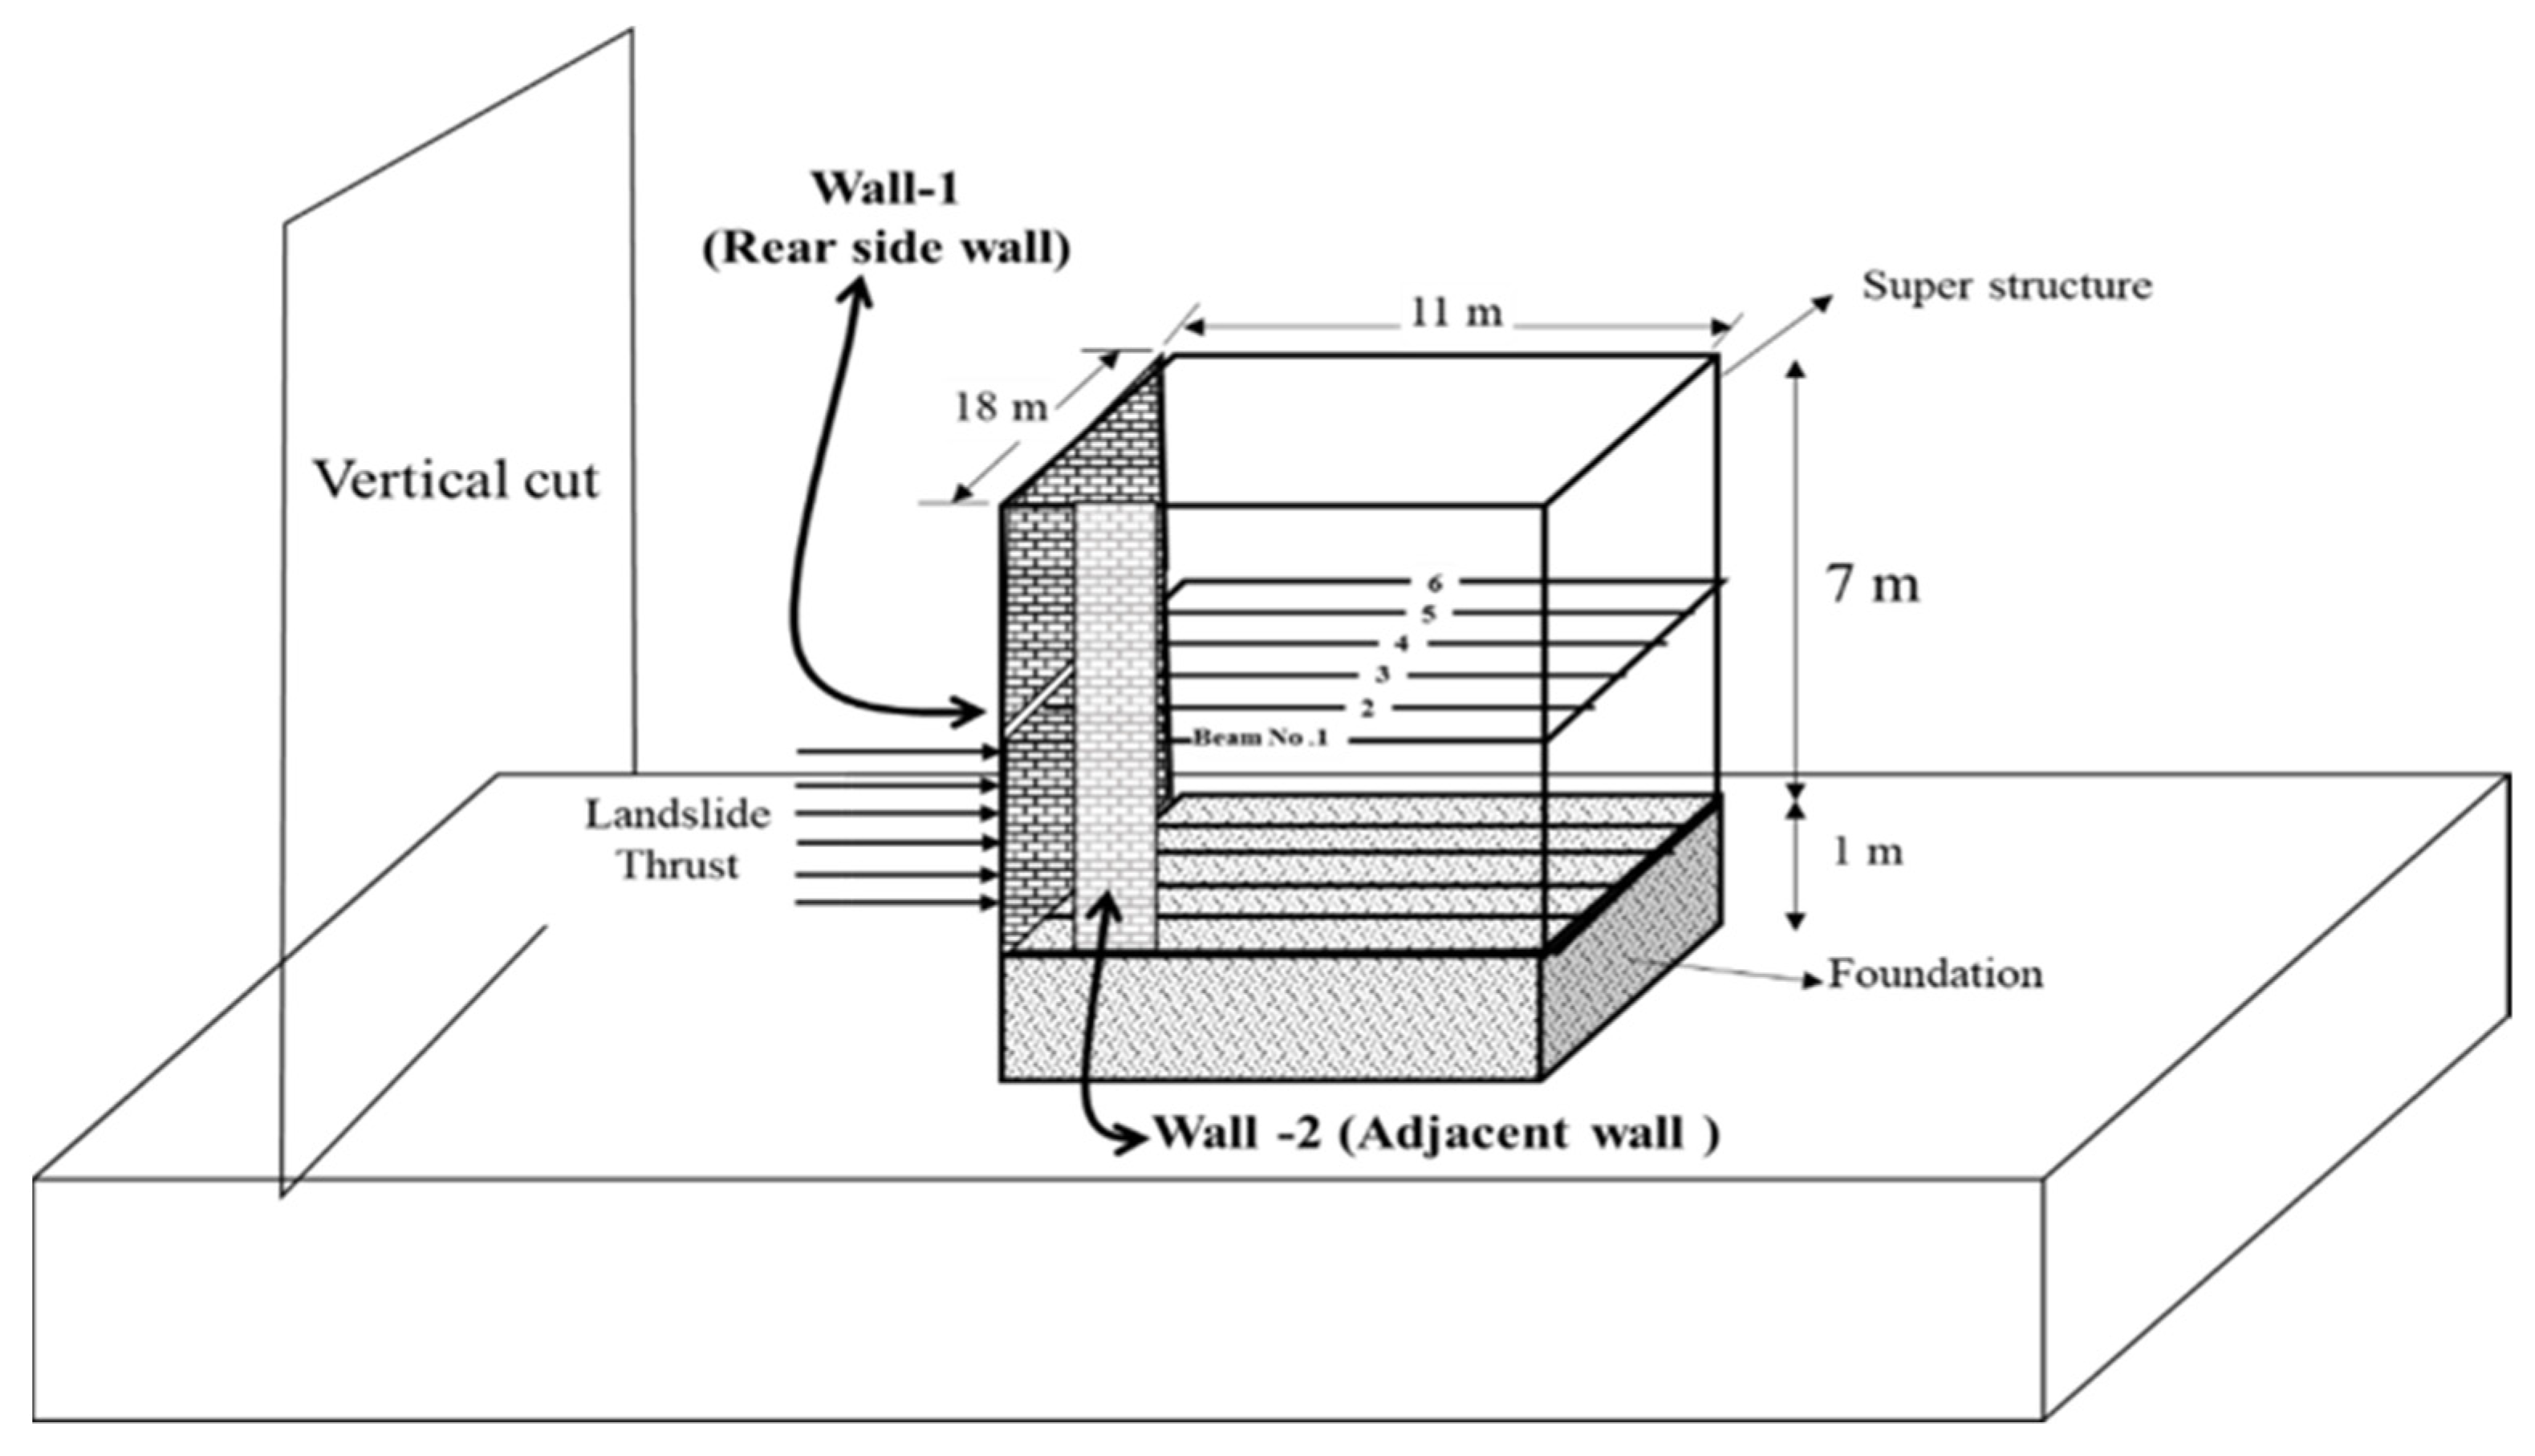
  • The sudden impact loads of 428 kN/m (maximum) to 64 kN/m (minimum) were applied on the rear side load-bearing wall of the building at different heights. The beams and walls were severely affected by the impact thrust, resulting in the demolition of the building. The flexural strength of each beam doubled its design strength after the impact load. The building differential settlement observed from dynamic impact analysis was higher than the permissible limit.
  • The differential settlement of the building was 92 mm, and the lateral displacement was 170 mm, indicating the demolition of the load-bearing structure. The bending moments of beams in the plinth portion and on the first floor were two times higher than the permissible limit after the impact load. The failure of structural elements (beams and walls) showed the destruction of the building.

Author Contributions

Conceptualization, V.S.K. and S.S.C.; methodology, V.S.K.; software and validation, V.S.K. and S.S.C.; formal analysis, V.S.K.; investigation, V.S.K.; resources, S.S.C.; data curation, V.S.K.; writing—original draft preparation, V.S.K.; writing—review and editing, V.S.K. and S.S.C.; visualization, V.S.K.; supervision, S.S.C.; project administration, S.S.C.; funding acquisition S.S.C. All authors have read and agreed to the published version of the manuscript.

Funding

This research received no external funding.

Institutional Review Board Statement

Not applicable.

Informed Consent Statement

Not applicable.

Data Availability Statement

Not applicable.

Conflicts of Interest

The authors declare no conflict of interest.

References

  1. Sajinkumar, K.S.; Anbazhagan, S. Geomorphic Appraisal of Landslides on the Windward Slope of Western Ghats, Southern India. Nat. Hazards 2015, 75, 953–973. [Google Scholar] [CrossRef]
  2. Sajinkumar, K.S.; Castedo, R.; Sundarajan, P.; Rani, V.R. Study of a Partially Failed Landslide and Delineation of Piping Phenomena by Vertical Electrical Sounding (VES) in the Wayanad Plateau, Kerala, India. Nat. Hazards 2015, 75, 755–778. [Google Scholar] [CrossRef]
  3. Senthilkumar, V.; Chandrasekaran, S.S.; Maji, V.B. Rainfall-Induced Landslides: Case Study of the Marappalam Landslide, Nilgiris District, Tamil Nadu, India. Int. J. Geomech. 2018, 18, 05018006. [Google Scholar] [CrossRef]
  4. Vadivel, S.; Sennimalai, C.S. Failure Mechanism of Long-Runout Landslide Triggered by Heavy Rainfall in Achanakkal, Nilgiris, India. J. Geotech. Geoenviron. Eng. 2019, 145, 04019047. [Google Scholar] [CrossRef]
  5. Andrewwinner, R.; Chandrasekaran, S.S. Investigation on the Failure Mechanism of Rainfall-Induced Long-Runout Landslide at Upputhode, Kerala State of India. Land 2021, 10, 1212. [Google Scholar] [CrossRef]
  6. Froude, M.J.; Petley, D.N. Global Fatal Landslide Occurrence from 2004 to 2016. Nat. Hazards Earth Syst. Sci. 2018, 18, 2161–2181. [Google Scholar] [CrossRef]
  7. Tsai, T.L.; Wang, J.K. Examination of Influences of Rainfall Patterns on Shallow Landslides Due to Dissipation of Matric Suction. Environ. Earth Sci. 2011, 63, 65–75. [Google Scholar] [CrossRef]
  8. Salgado, R.A.; Guner, S. A Structural Performance-Based Environmental Impact Assessment Framework for Natural Hazard Loads. J. Build. Eng. 2021, 43, 102908. [Google Scholar] [CrossRef]
  9. Luo, H.Y.; Zhang, L.L.; Zhang, L.M. Progressive Failure of Buildings under Landslide Impact. Landslides 2019, 16, 1327–1340. [Google Scholar] [CrossRef]
  10. Liu, W.; Yan, S.; He, S. Landslide Damage Incurred to Buildings: A Case Study of Shenzhen Landslide. Eng. Geol. 2018, 247, 69–83. [Google Scholar] [CrossRef]
  11. Lonetti, P.; Maletta, R. Dynamic Impact Analysis of Masonry Buildings Subjected to Flood Actions. Eng. Struct. 2018, 167, 445–458. [Google Scholar] [CrossRef]
  12. Chandrasekaran, S.S.; Sayed Owaise, R.; Ashwin, S.; Jain, R.M.; Prasanth, S.; Venugopalan, R.B. Investigation on Infrastructural Damages by Rainfall-Induced Landslides during November 2009 in Nilgiris, India. Nat. Hazards 2013, 65, 1535–1557. [Google Scholar] [CrossRef]
  13. Cai, F.; Ugai, K. Numerical Analysis of Rainfall Effects on Slope Stability. Int. J. Geomech. 2004, 4, 69–78. [Google Scholar] [CrossRef]
  14. Ering, P.; Babu, G.L.S. Probabilistic Back Analysis of Rainfall Induced Landslide- A Case Study of Malin Landslide, India. Eng. Geol. 2016, 208, 154–164. [Google Scholar] [CrossRef]
  15. Senthilkumar, V.; Chandrasekaran, S.S.; Maji, V.B. Geotechnical Characterization and Analysis of Rainfall—Induced 2009 Landslide at Marappalam Area of Nilgiris District, Tamil Nadu State, India. Landslides 2017, 14, 1803–1814. [Google Scholar] [CrossRef]
  16. Chou, N.N.S.; Liu, T.-Y.; Chen, P.-H.; Fan, C.-C.; Zhang, J. Failure Investigation and Sustainable Renovation for Slope at National Chi Nan University in Taiwan. J. Perform. Constr. Facil. 2020, 34, 04020085. [Google Scholar] [CrossRef]
  17. Campus, A. Identification of Failure Mechanisms in Existing Unreinforced Masonry Buildings in Rural Areas after April 4, 2019 Earthquake in Turkey. J. Build. Eng. 2021, 43, 102586. [Google Scholar] [CrossRef]
  18. Kumar, V.S.; Chandrasekaran, S.S. Review of Remedial Measures Adopted for Rainfall Induced Landslides in Nilgiris, India. In Proceedings of the 2018 IPL Symposium on Landslides, Kyoto, Japan, 3 December 2018; pp. 9–14. [Google Scholar]
  19. Andrewwinner, R.; Chandrasekaran, S.S. Finite Element and Vulnerability Analyses of a Building Failure Due to Landslide in Kaithakunda, Kerala, India. Adv. Civ. Eng. 2022, 2022, 5297864. [Google Scholar] [CrossRef]
  20. Dai, X.; Schneider-Muntau, B.; Fellin, W.; Franco, A.; Gems, B. Engineering-Geological Analysis of a Subaerial Landslide in Taan Fiord, Alaska. Remote Sens. 2021, 13, 4258. [Google Scholar] [CrossRef]
  21. Shi, C.; Zhang, Y.L.; Xu, W.Y.; Zhu, Q.Z.; Wang, S.N. Risk Analysis of Building Damage Induced by Landslide Impact Disaster. Eur. J. Environ. Civ. Eng. 2013, 17, 126–143. [Google Scholar] [CrossRef]
  22. Halder, L.; Chandra, S.; Prasad, R. Damage Study and Seismic Vulnerability Assessment of Existing Masonry Buildings in Northeast India. J. Build. Eng. 2020, 29, 101190. [Google Scholar] [CrossRef]
  23. Armanini, A.; Larcher, M.; Odorizzi, M. Dynamic Impact of a Debris Flow Front against A vertical Wall. Ital. J. Eng. Geol. Environ. 2011, 1, 1041–1049. [Google Scholar] [CrossRef]
  24. Bureau of Indian Standards IS 1905: 2017; Code of Practice for Structural Use of Unreinforced Masonry. Bureau of Indian Standards: New Delhi, India, 2018; Volume 39.
  25. Chen, Q.; Chen, L.; Gui, L.; Yin, K.; Pikha Shrestha, D.; Du, J.; Cao, X. Assessment of the Physical Vulnerability of Buildings Affected by Slow-Moving Landslides. Nat. Hazards Earth Syst. Sci. 2020, 20, 2547–2565. [Google Scholar] [CrossRef]
  26. Garofano, A.; Ceroni, F.; Pecce, M. Modelling of the In-Plane Behaviour of Masonry Walls Strengthened with Polymeric Grids Embedded in Cementitious Mortar Layers. Compos. Part B Eng. 2016, 85, 243–258. [Google Scholar] [CrossRef]
  27. Celano, T.; Argiento, L.U.; Ceroni, F.; Casapulla, C. In-Plane Behaviour of Masonry Walls: Numerical Analysis and Design Formulations. Materials 2021, 14, 5780. [Google Scholar] [CrossRef]
  28. Hansapinyo, C.; Limkatanyu, S.; Zhang, H.; Imjai, T. Residual Strength of Reinforced Concrete Beams under Sequential Small Impact Loads. Buildings 2021, 11, 518. [Google Scholar] [CrossRef]
  29. Santhosh, V.; Sennimalai, S. Analysis of Failure of High Slope Subjected to Rainfall Infiltration at Peringavu in Kerala, India. Eng. Fail. Anal. 2022, 138, 106423. [Google Scholar] [CrossRef]
  30. Singhal, V.; Durgesh, C. Rai In-Plane and out-of-Plane Behavior of Confined Masonry Walls for Various Toothing and Openings Details and Prediction of Their Strength and Stiffness. Earthq. Eng. Struct. Dyn. 2016, 45, 2551–2569. [Google Scholar] [CrossRef]
  31. Kuriakose, S.L.; Sankar, G.; Muraleedharan, C. History of Landslide Susceptibility and a Chorology of Landslide-Prone Areas in the Western Ghats of Kerala, India. Environ. Geol. 2009, 57, 1553–1568. [Google Scholar] [CrossRef]
  32. Thomas, A.; Leader, O.; Coffman, R.; Sajinkumar, K.S.; Vishnu, C.L. Geotechnical Impacts of August 2018 Floods of Kerala, India. Event: August 2018; GEER: San Francisco, CA, USA, 2018; pp. 10–17. [Google Scholar] [CrossRef]
  33. European Commission’s Directorate-General for European Civil Protection and Humanitarian Aid Operations; Government of India; UN Development Programme; World Bank. Kerala Post Disaster Needs Assessment: Floods and Landslides—August 2018; OCHA: New York, NY, USA, 2018. [Google Scholar]
  34. Nijeesh, T.P. Kerala Floods: Nine of a Family Killed While Trying to Save Pets. Times of India, 17 August 2018. [Google Scholar]
  35. Hindu, T. Centre Says Kerala Floods ‘Calamity of Severe Nature’. The Hindu, 20 August 2020. [Google Scholar]
  36. India TV News Desk Kerala Floods Updates: Death Toll Rises to 21; PM Speaks to CM Vijayan Kerala Floods LIVE: Chief Minister Pinarayi Vijayan. Available online: https://www.indiatvnews.com/news/india/kerala-floods-live-updates-kerala-rains-death-toll-advisory-rescue-operations-red-alert-imd-weather-forecast-740747 (accessed on 21 July 2022).
  37. Kasthurba, A.K.; Santhanam, M.; Mathews, M.S. Investigation of Laterite Stones for Building Purpose from Malabar Region, Kerala State, SW India—Part 1: Field Studies and Profile Characterisation. Constr. Build. Mater. 2007, 21, 73–82. [Google Scholar] [CrossRef]
  38. Indian Meteorological Department (IMD). Data Supply Portal. Available online: http://dsp.imdpune.gov.in/ (accessed on 21 July 2022).
  39. Das, A.K.; Manik, S.K. Rainfall Statistics of India—2018; Ministry of Earth Sciences: New Delhi, India, 2020. [Google Scholar]
  40. GSI Bhukosh the Spatial Data Portal of Geological Survey of India: Malappuram District, Kerala. Available online: https://bhukosh.gsi.gov.in/Bhukosh/MapViewer.aspx (accessed on 21 July 2022).
  41. Department of Mining and Geology. Government of Kerala, District Survey Report: Malappuram; Department of Mining and Geology: New Delhi, India, 2016. [Google Scholar]
  42. Rejith, R.G.; Anirudhan, S.; Sundararajan, M. Delineation of Groundwater Potential Zones in Hard Rock Terrain Using Integrated Remote Sensing, GIS and MCDM Techniques: A Case Study from Vamanapuram River Basin, Kerala, India; Elsevier Inc.: Amsterdam, The Netherlands, 2019; ISBN 9780128154137. [Google Scholar]
  43. Goswami, R.K.; Singh, B. Influence of Fly Ash and Lime on Plasticity Characteristics of Residual Lateritic Soil. Gr. Improv. 2005, 9, 175–182. [Google Scholar] [CrossRef]
  44. ASTM D698-12; Standard Test Methods for Laboratory Compaction Characteristics of Soil Using Standard Effort (12,400 ft-lbf/ft3 (600 kN-m/m3)). ASTM International: West Conshohocken, PA, USA, 2021. [CrossRef]
  45. Rahardjo, H.; Aung, K.K.; Leong, E.C.; Rezaur, R.B. Characteristics of Residual Soils in Singapore as Formed by Weathering. Eng. Geol. 2004, 73, 157–169. [Google Scholar] [CrossRef]
  46. ASTM D6836; Standard Test Methods for Determination of the Soil Water Characteristic Curve for Desorption Using Hanging Column, Pressure Extractor, Chilled Mirror Hygrometer, or Centrifuge. ASTM International: West Conshohocken, PA, USA, 2003. Available online: https://www.astm.org/d6836-16.html (accessed on 21 July 2022).
  47. Rahardjo, H.; Nio, A.S.; Leong, E.C.; Song, N.Y. Effects of Groundwater Table Position and Soil Properties on Stability of Slope during Rainfall. J. Geotech. Geoenviron. Eng. 2010, 136, 1555–1564. [Google Scholar] [CrossRef]
  48. Lambe, W.; Whitman, R.V. Soil Mechanics; John Wiley & Sons, Inc.: Hoboken, NJ, USA, 1969; ISBN 978-0-471-51192-2. [Google Scholar]
  49. ASTM D6467; Standard Test Method for Torsional Ring Shear Test to Determine Drained Residual Shear Strength of Cohesive Soils. ASTM International: West Conshohocken, PA, USA, 2013. [CrossRef]
  50. Lian, B.; Peng, J.; Wang, X.; Huang, Q. Influence of Shearing Rate on the Residual Strength Characteristic of Three Landslides Soils in Loess Area. Nat. Hazards Earth Syst. Sci. Discuss. 2018, 2018, 1–24. [Google Scholar] [CrossRef]
  51. Stark, T.D.; Vettel, J.J. Bromhead Ring Shear Test Procedure. Geotech. Test. J. 1992, 15, 24–32. [Google Scholar] [CrossRef]
  52. Geoslope Slope/W User’s Guidefor Slope Stability Analyses and Seep/W User’s Guide for Finite Element Analyses. Version: 2018, 220. Available online: https://downloads.geoslope.com/geostudioresources/books/11/2/SLOPE%20Modeling.pdf (accessed on 21 July 2022).
  53. Rahardjo, H.; Ong, T.H.; Rezaur, R.B.; Leong, E.C. Factors Controlling Instability of Homogeneous Soil Slopes under Rainfall. J. Geotech. Geoenviron. Eng. 2007, 133, 1532–1543. [Google Scholar] [CrossRef]
  54. Kristo, C.; Rahardjo, H.; Satyanaga, A. Effect of Variations in Rainfall Intensity on Slope Stability in Singapore. Int. Soil Water Conserv. Res. 2017, 5, 258–264. [Google Scholar] [CrossRef]
  55. Qi, S.; Vanapalli, S.K. Hydro-Mechanical Coupling Effect on Surficial Layer Stability of Unsaturated Expansive Soil Slopes. Comput. Geotech. 2015, 70, 68–82. [Google Scholar] [CrossRef]
  56. van Genuchten, M.T. A Closed-Form Equation for Predicting the Hydraulic Conductivity of Unsaturated Soils. Soil Sci. Soc. Am. J. 1980, 44, 892–898. [Google Scholar] [CrossRef]
  57. Shen, G.; Cai, C.S.; Sun, B.; Lou, W. Study of Dynamic Impacts on Transmission-Line Systems Attributable to Conductor Breakage Using the Finite-Element Method. J. Perform. Constr. Facil. 2011, 25, 130–137. [Google Scholar] [CrossRef]
  58. PLAXIS-3D CONNECT edition V21.01, PLAXIS 3D-Reference Manual, BENTLEY SYSTEMS PLAXIS 3D. pp. 1–532. Available online: https://communities.bentley.com/products/geotech-analysis/w/plaxis-soilvision-wiki/46137/manuals---plaxis (accessed on 21 July 2022).
  59. Visuvasam, J.; Chandrasekaran, S.S. Effect of Soil–Pile–Structure Interaction on Seismic Behaviour of RC Building Frames. Innov. Infrastruct. Solut. 2019, 4, 45. [Google Scholar] [CrossRef]
  60. Bureau of Indian Standards IS 456:2000; Indian Standard Code of Practice for Plain and Reinforced Concrete. Indian Standards: New Delhi, India, 2000.
  61. Bureau of Indian Standards IS 875-2018; Code of Practice for Design Loads (Other Than Earthquake) for Buildings and Structures. Indian Standards: New Delhi, India, 2018.
  62. Bureau of Indian Standards IS 1904-1986; Indian Standard Code of Practice for Design and Construction of Foundations—General Requirement. Indian Standards: New Delhi, India, 2015.
  63. Dai, Z. Study on the Distribution of Landslide Thrust of Anti-Slip Pile and Resistance of Pre-Pile Slide. Chin. J. Rock Mech. Eng. 2002, 21, 517–521. [Google Scholar] [CrossRef]
Figure 1. Map of landslide locations.
Buildings 12 01395 g001
Figure 2. Landslide location plan & section view: (a) Plan of the landslide location and adjacent structures; (b) Sectional plan (A-A|) of the vertical cut and houses.
Buildings 12 01395 g002
Figure 3. Condition of the site: (a) The collapsed building; (b) Failure slip surface; (c) Collapsed building debris; (d) Picture of soil and debris flow near the road (structure 2); (e) Partially damaged house (structure 3); (f) Picture of soil that drifted into an adjacent building (structure 4).
Buildings 12 01395 g003
Figure 4. Daily rainfall graph for August 2018.
Buildings 12 01395 g004
Figure 5. Rain gauge stations located in the study area and the geomorphology of Malappuram district.
Buildings 12 01395 g005
Figure 6. Numerical analysis: (a) Geometry of the model; Critical slip surface with factor of safety values: (b) First-stage rainfall event; (c) Second-stage rainfall event; (d) Third-stage rainfall event.
Buildings 12 01395 g006
Figure 7. Numerical results: (a) Change in the degree of saturation; (b) Change in pore pressure according to depth; (c) Factor of safety corresponding to depth.
Buildings 12 01395 g007
Figure 8. Schematic representation of the building model for the dynamic impact analysis.
Buildings 12 01395 g008
Figure 9. Pictorial representation of sliding forces and the free body diagram of a slice.
Buildings 12 01395 g009
Figure 10. The geometry of the building and generated mesh.
Buildings 12 01395 g010
Figure 11. Differential settlement of the building after the landslide impact.
Buildings 12 01395 g011
Figure 12. Bending moment diagrams of beams: (a) Plinth portion; (b) First floor.
Buildings 12 01395 g012aBuildings 12 01395 g012b
Figure 13. Bending moment of the wall after the landslide: (a) vertical direction (out-of-plane behavior), (b) longitudinal direction (out-of-plane behavior).
Buildings 12 01395 g013
Figure 14. Shear forces on the side wall (wall adjacent to the rear wall) after the landslide.
Buildings 12 01395 g014
Figure 15. Vulnerable locations for vertical cuts: (a) Market place near the vertical cut; (b) Failed vertical cut; (c) Building constructed near a vertical cut; (d) Partial damage of a building due to vertical cut failure; (e) Improper stabilization for a vertical cut near the roadside; (f) Building very close to the slope and vertical cut; (g) New building construction near a vertical cut; (h) Retaining wall construction near a vertical cut; (i) Multistorey building near a vertical cut.
Buildings 12 01395 g015
Table 1. Major rainfall-induced landslides in Kerala.
Landslide LocationDistrictEvent DateDeaths
Padinjarethara(Kappikalam)Wayanad19 June 199211
PazhampallichalIdukki21 July 19979
PambaPathanamthitta15 January 199925
AmbooriThiruvanthapuram9 November 200139
NittukottamalaKozhikode10 August 200410
KarincholaKozhikode14 June 201814
Nemmara Palakkad16 August 20188
UpputhodeIdukki16 August 20184
KavalapparaMalappuram8 August 201959
Puthumala, Wayanad8 August 201917
RajanmalaiIdukki7 August 202060
KoottickalKottayam17 October 202122
KokkayarIdukki17 October 202113
Table 2. Kerala state monthly rainfall during the year 2018.
MonthJanuaryFebruaryMarchAprilMayJuneJulyAugustSeptemberOctoberNovemberDecember
Rainfall (mm)8.715.647.5109.5356.6749.6726.1821.9244.2304.315037.5
Table 3. Geotechnical parameters of the soil.
PropertySoil Sample-1 (Layer-1)Soil Sample-2 (Layer-2)
Specific gravity2.572.54
Maximum Dry Unit Weight (kN/m3)18.8619.1
Liquid limit (wl) (%)4948
Plasticity Index (Ip)(%)1815
Coefficient of Permeability (m/s)1.05 × 10−74.47 × 10−8
Residual friction angle (ϕm)2022
Effective cohesion kN/m2 (c’)1517
Soil type (USCS)Sandy Silt (ML)Sandy Silt (ML)
Percentage of clay12.50%8.50%
Percentage of silt39.00%43.00%
Percentage of sand42.00%45.00%
Percentage of gravel6.50%3.50%
Table 4. Unsaturated strength properties.
PropertySoil Sample-1 (Layer-1)Soil Sample-2 (Layer-2)
Air Entry Value (AEV)/Air entry Suction (kPa)3639
Saturated water content (ϴs) (%)5153
Residual water content (ϴr) (%)14.513.8
SWCC fitting parametersa3639
n1.16951.1609
m0.14500.1380
Table 5. Soil and building properties considered in dynamic impact analysis.
ParametersSoilBeam
(Beam Element)
Wall
(Plate Element)
MaterialSandy Silt (ML)ConcreteLaterite brick wall
Young’s modulus (MPa)1425,00025.1
Unit weight (kN/m3)19.12519
Poisson’s ratio (μ)0.3210.200.18
Residual Angle of friction (φ′)22°--
Effective Cohesion kN/m2 (c′)17--
Thickness (mm)--250
Dimensions-230 mm × 250 mm-
Table 6. Mesh convergence study parameters.
S. NoMesh TypeNumber of ElementsNumber of NodesTotal Displacement (mm)Total Settlement (mm)Run Time (s)
1Very Coarse84926268022.168
2Coarse139937669538.492
3Medium2829747910256.3115
4Fine62261396515986.3226
5Very Fine148483047517492.1280
Table 7. The bending moments of beams.
Floor NumberBeam NumberAllowed or Limiting Moment of Resistance
Negative Moment
Mu(lim) = 14 kN-m
(At the End of Span)
Allowed or Limiting Moment of Resistance
Positive Moment
Mu(lim) = 21 kN-m
(At Mid of Span)
Probable Failure State
Before LandslideAfter LandslideBefore LandslideAfter Landslide
Plinth Beams1 (At end)6.6118.439.1020.65Flexural failure
26.0117.5810.3525.34
3 (Middle span)11.0118.4114.2229.48
4 (Middle span)10.5317.9413.6528.40
57.2518.3212.5422.63
6 (At end)5.1818.117.2720.63
1st-Floor
Beams
1 (At end)5.744.8910.1533.75Flexural Compression Failure Excessive deflection
25.986.1211.5233.98
3 (Middle span)9.816.7215.5334.09
4 (Middle span)9.366.5815.0034.40
58.576.3414.1032.90
6 (At end)4.394.008.1033.40
Table 8. Details of wall behavior before and after the landslide impact.
Structural MemberStructural BehaviorPermissible LimitActual Value
Back wall (directly impacted by the landslide): Wall 1Flexural failure (out-of-plane behavior)Longitudinal direction0.14 N/mm229.89 N/mm2
Vertical direction0.07 N/mm221.70 N/mm2
Side wall (adjacent to the rear side wall): Wall 2Shear failure (in-plane behavior)0.5 N/mm24.27 N/mm2
Publisher’s Note: MDPI stays neutral with regard to jurisdictional claims in published maps and institutional affiliations.

