Article

Physical, Mechanical, and Durability Properties of Concrete Containing Wood Chips and Sawdust: An Experimental Approach

1
CERIS, Department of Civil Engineering, University of Coimbra, 3030-788 Coimbra, Portugal
2
Itecons, University of Coimbra, 3030-289 Coimbra, Portugal
3
CERIS, University of Coimbra, 3030-289 Coimbra, Portugal
4
CERIS, Instituto Superior Técnico, University of Lisbon, 1049-001 Lisbon, Portugal
5
Toscca Wood & Solutions, 3680-171 Oliveira de Frades, Portugal
*
Author to whom correspondence should be addressed.
Buildings 2022, 12(8), 1277; https://doi.org/10.3390/buildings12081277
Submission received: 25 July 2022 / Revised: 17 August 2022 / Accepted: 18 August 2022 / Published: 20 August 2022
(This article belongs to the Collection Advances in Sustainable Building Materials and Construction)

Abstract

:
With a circular economy in the spotlight, wood waste has emerged as an important secondary raw material. Bearing this in mind, a comprehensive experimental study was carried out to evaluate the feasibility of using concrete compositions containing wood chips and sawdust for structural and non-structural building applications. First, the mineral and wood aggregates used in the composite design were fully characterized. Twelve compositions containing varying types of wood particles in different amounts were then produced and characterized in terms of physical and mechanical performance (e.g., mass density, compressive strength, modulus of elasticity, and flexural strength). Subsequently, two compositions with optimized features (mass density below 2125 kg/m3, compressive strength above 25 MPa, and maximum volume content of wood) were selected to undergo additional experimental tests. These included microstructural characterization, as well as the evaluation of relevant durability (e.g., wetting–drying, freeze–thaw, and thermal shock cycles) and hygrothermal (e.g., thermal conductivity, water absorption, and shrinkage and expansion) properties. All compositions showed compressive strength above 30 MPa. The durability assessment of selected compositions further showed that compressive strength after relevant artificial aging was still higher than the predefined criteria. Promising hygrothermal properties (minimal water absorption and low thermal conductivity) were also recorded.

1. Introduction

In Europe, several thousands of cubic meters of wood products become waste every year, of which less than 50% is recycled [1,2]. With an increasing focus on recycling [3], wood waste has emerged as a central source of secondary raw materials. However, from a recycling perspective, wood waste is a complex material [4]. For instance, a huge amount of wood waste is disposed because it contains dangerous chemical preservatives. Sources of contaminated wood include railways, bridges, buildings, and fencing posts. This scenario has boosted research into incorporating wood waste in cement composites, intending to develop novel sustainable construction materials with good performance, durability, and cost-effectiveness. Several alternative wood–cement composites have been developed using wood as a filler [5], wood waste ash to partially replace cement [6], and wood waste to partly or wholly replace conventional aggregate [7]. Moreover, wood cement-bonded boards [8,9,10] are already in use, mostly for parking decks, basement ceilings, floor units, loft conversion, or timber frame construction as sound barriers for acoustic absorption. Lightweight applications with thermal and acoustic advantages but with low mechanical performance have already been reported.
Several published studies on wood waste cement composites highlight certain benefits of wood incorporation [11,12,13]. Zwicky [14] developed an economically competitive wood–cement composite with regular lightweight concrete with a 70–80% eco-balance reduction. Caldas et al. [15] argued that wood waste could be considered a CO2 sink when producing wood-based concrete. This type of composite could also provide additional functional features, e.g., contributing to thermal and acoustic insulation, and thereby compensating for their reduced mechanical properties [16,17]. Fu et al. [18] highlighted the advantages of using coarse aggregates with beech wood chips to reduce self-weight and improve the thermal insulation of concrete in timber-concrete composite structures. A summary of published studies on the replacement of aggregate by wood particles is given in Table 1.
Analyzing Table 1, it can be observed that cement type II 42.5 is frequently used, the replacement of aggregate by wood particles ranges from 5% to 60%, and the water cement ratio varies from 0.26 to 0.60. It can also be noted that wood wastes are incorporated into concretes by replacement of sand and less by gravel. The use of wood wastes combined with other types of waste is less common.
Despite all the work reported on the wood cement mixtures, several aspects still need to be investigated and optimized, taking into account the nature of the wood particles under study (e.g., aggregate replacement ratio, the water-cement ratio, and the use of additives). Additionally, there is a lack of knowledge on how those wood waste cement composites behave over time and under different aging conditions. These are essential aspects to ensure that such composites can be, in fact, exploited in terms of the production of new construction elements.
The authors of the present work already discussed the potential use of wood waste in cement composites in a previous work [11], where the chemical and physical properties of wood waste from different sources were characterized. At that time, cement pastes containing either wood extractives or wood particles were used to assess the wood–cement compatibility based on hydration heat and mechanical properties. Some concrete mixes were also produced for a preliminary assessment of the feasibility of their production. Now, in the present study, the authors aimed to investigate the mechanical, physical, and durability performance of wood–concrete composites incorporating wood chips and sawdust. Several compositions were defined and produced, evaluating their mechanical performance and bearing in mind the different structural and non-structural intended applications (e.g., fence poles, façade panels, slabs, and construction elements for small residential buildings). Two compositions were then selected to proceed with durability and hygrothermal tests based on the following criteria: maximize wood incorporation (v%), minimize density (below 2125 kg/m3), and ensure compressive strength above 25 MPa.
The rest of the paper is divided into three main sections. The next section (Section 2) presents the characterization of the concrete constituents, explains how the compositions were designed, and describes the experimental campaign. Section 3 comprises the experimental results and discussion, focusing on the mechanical performance, which is crucial for building applications, the durability assessment, assessing possible premature aging caused by the presence of wood, and the hygrothermal behavior, to evaluate complementary benefits of the formulated compounds. Note, however, that while all the composites were mechanically assessed, only two optimized mixes were selected based on the established criteria to proceed to hygrothermal and durability characterization. Conclusions are drawn in Section 4.

2. Materials and Methods

The wood chips (WC) and sawdust (SD) residues for developing wood–cement composites were provided by Toscca Wood & Solutions from its regular industrial activity.
A Portland cement (OPC) concrete was used as reference (REF) for comparison purposes and as a starting point to incorporate wood waste. OPC CEM II/A-L 42.5 R, manufactured by Secil Group, was used to produce the reference concrete and the concretes incorporating wood. Preliminary tests (not included in the current paper) showed that the use of this cement would lead to a significantly higher compressive strength than a less resistant cement (OPC CEM II/A-L 32.5 R) without a significant price increase.
One sand type and two pebble-shaped gravels provided by Sabril-Sociedade de Areias e Britas, Lda were used as mineral aggregates.
All mineral and wood aggregates were physically characterized according to European mineral aggregate standards before the concrete composition was defined. The particle size distribution [27], particle density, water absorption [28], and water content [29] of all aggregates were determined.

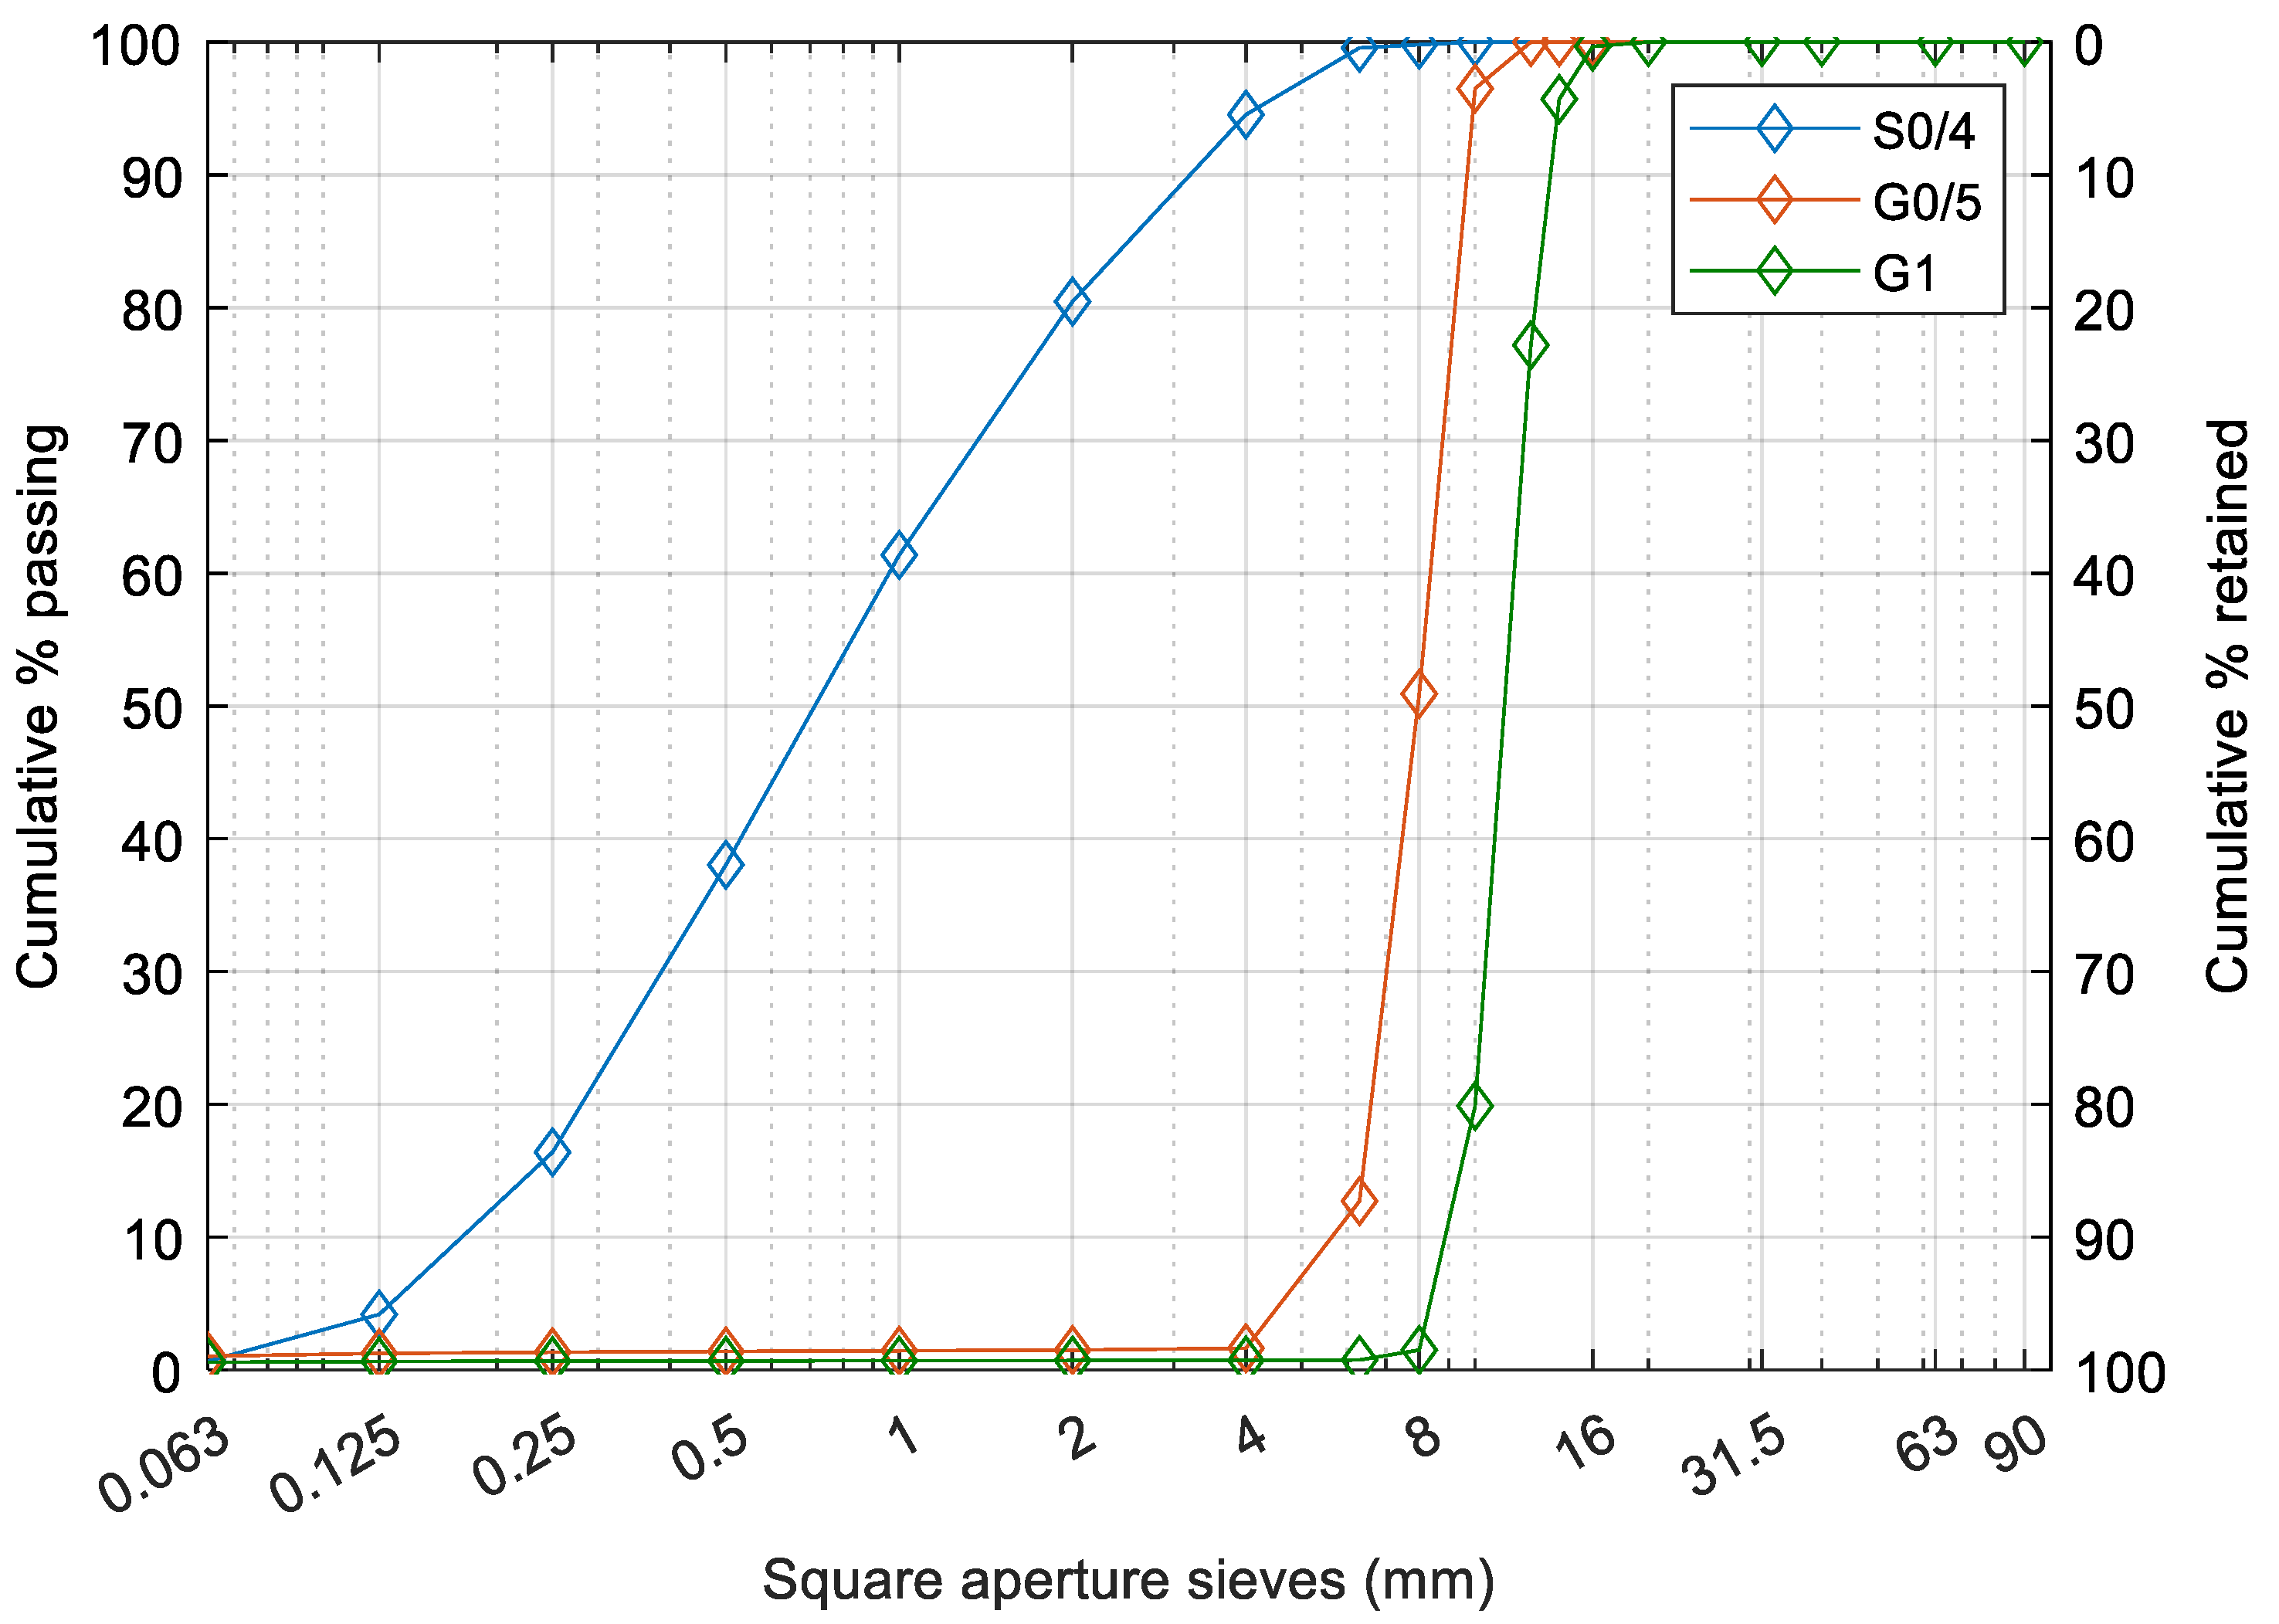
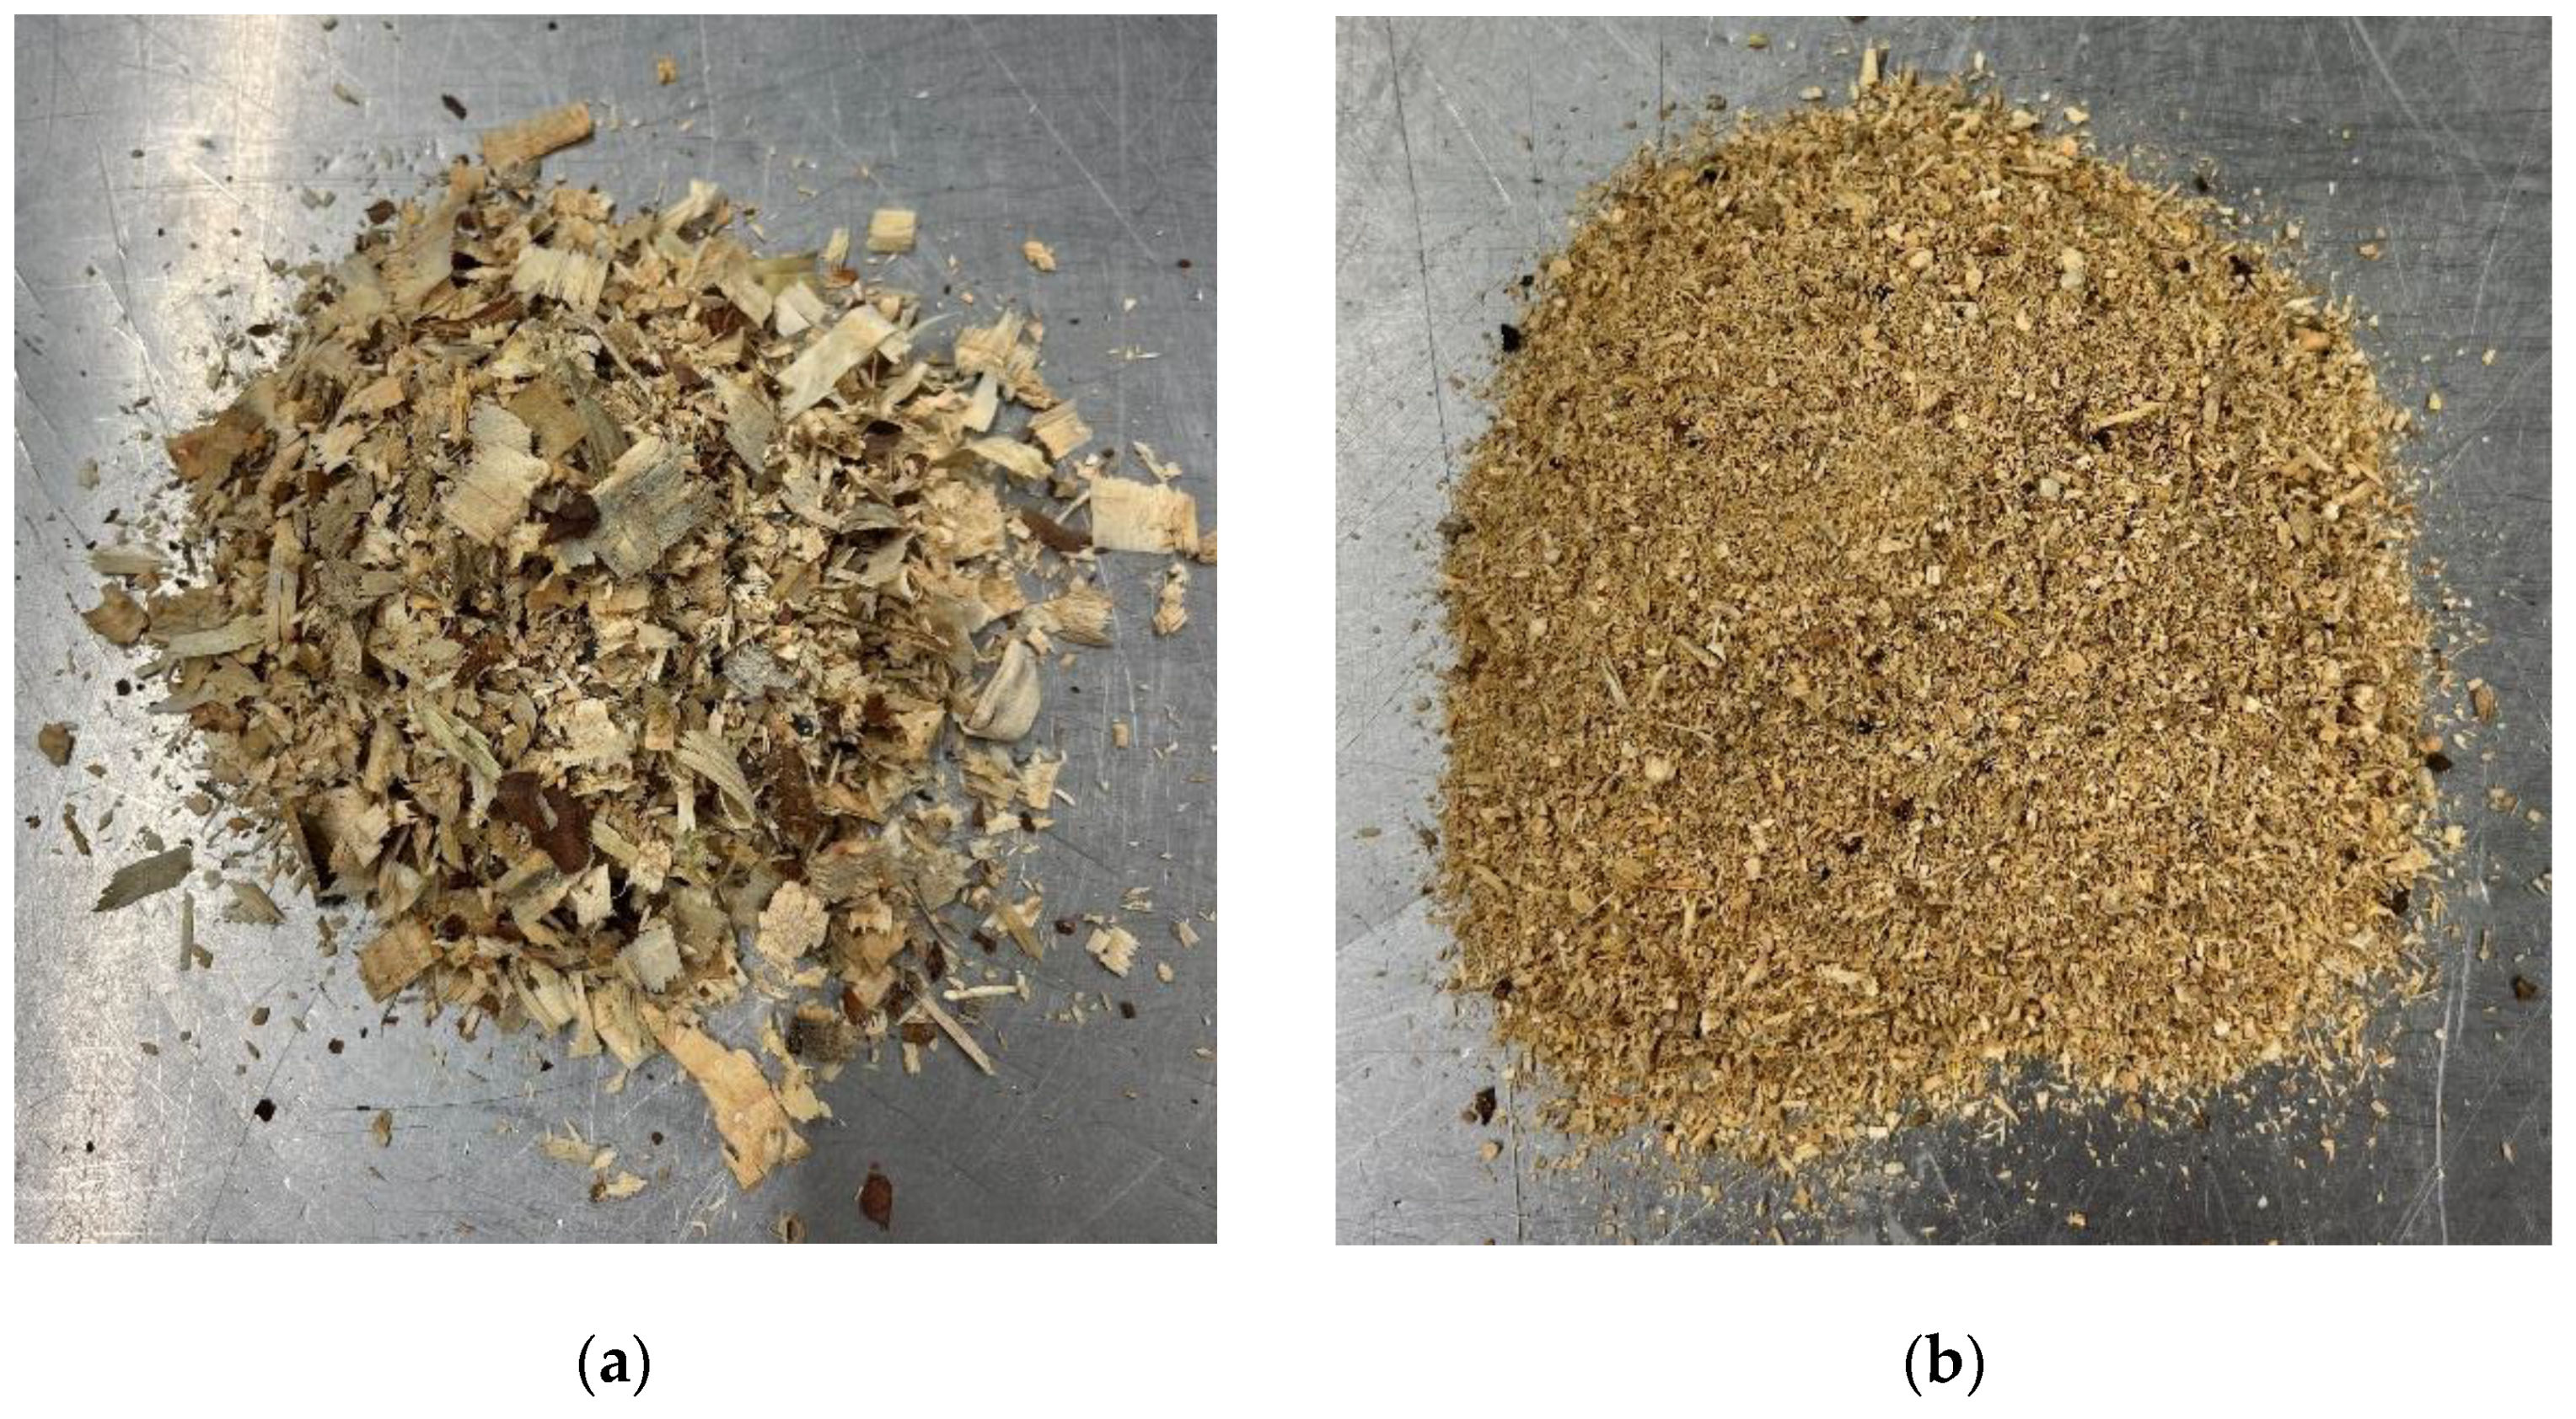
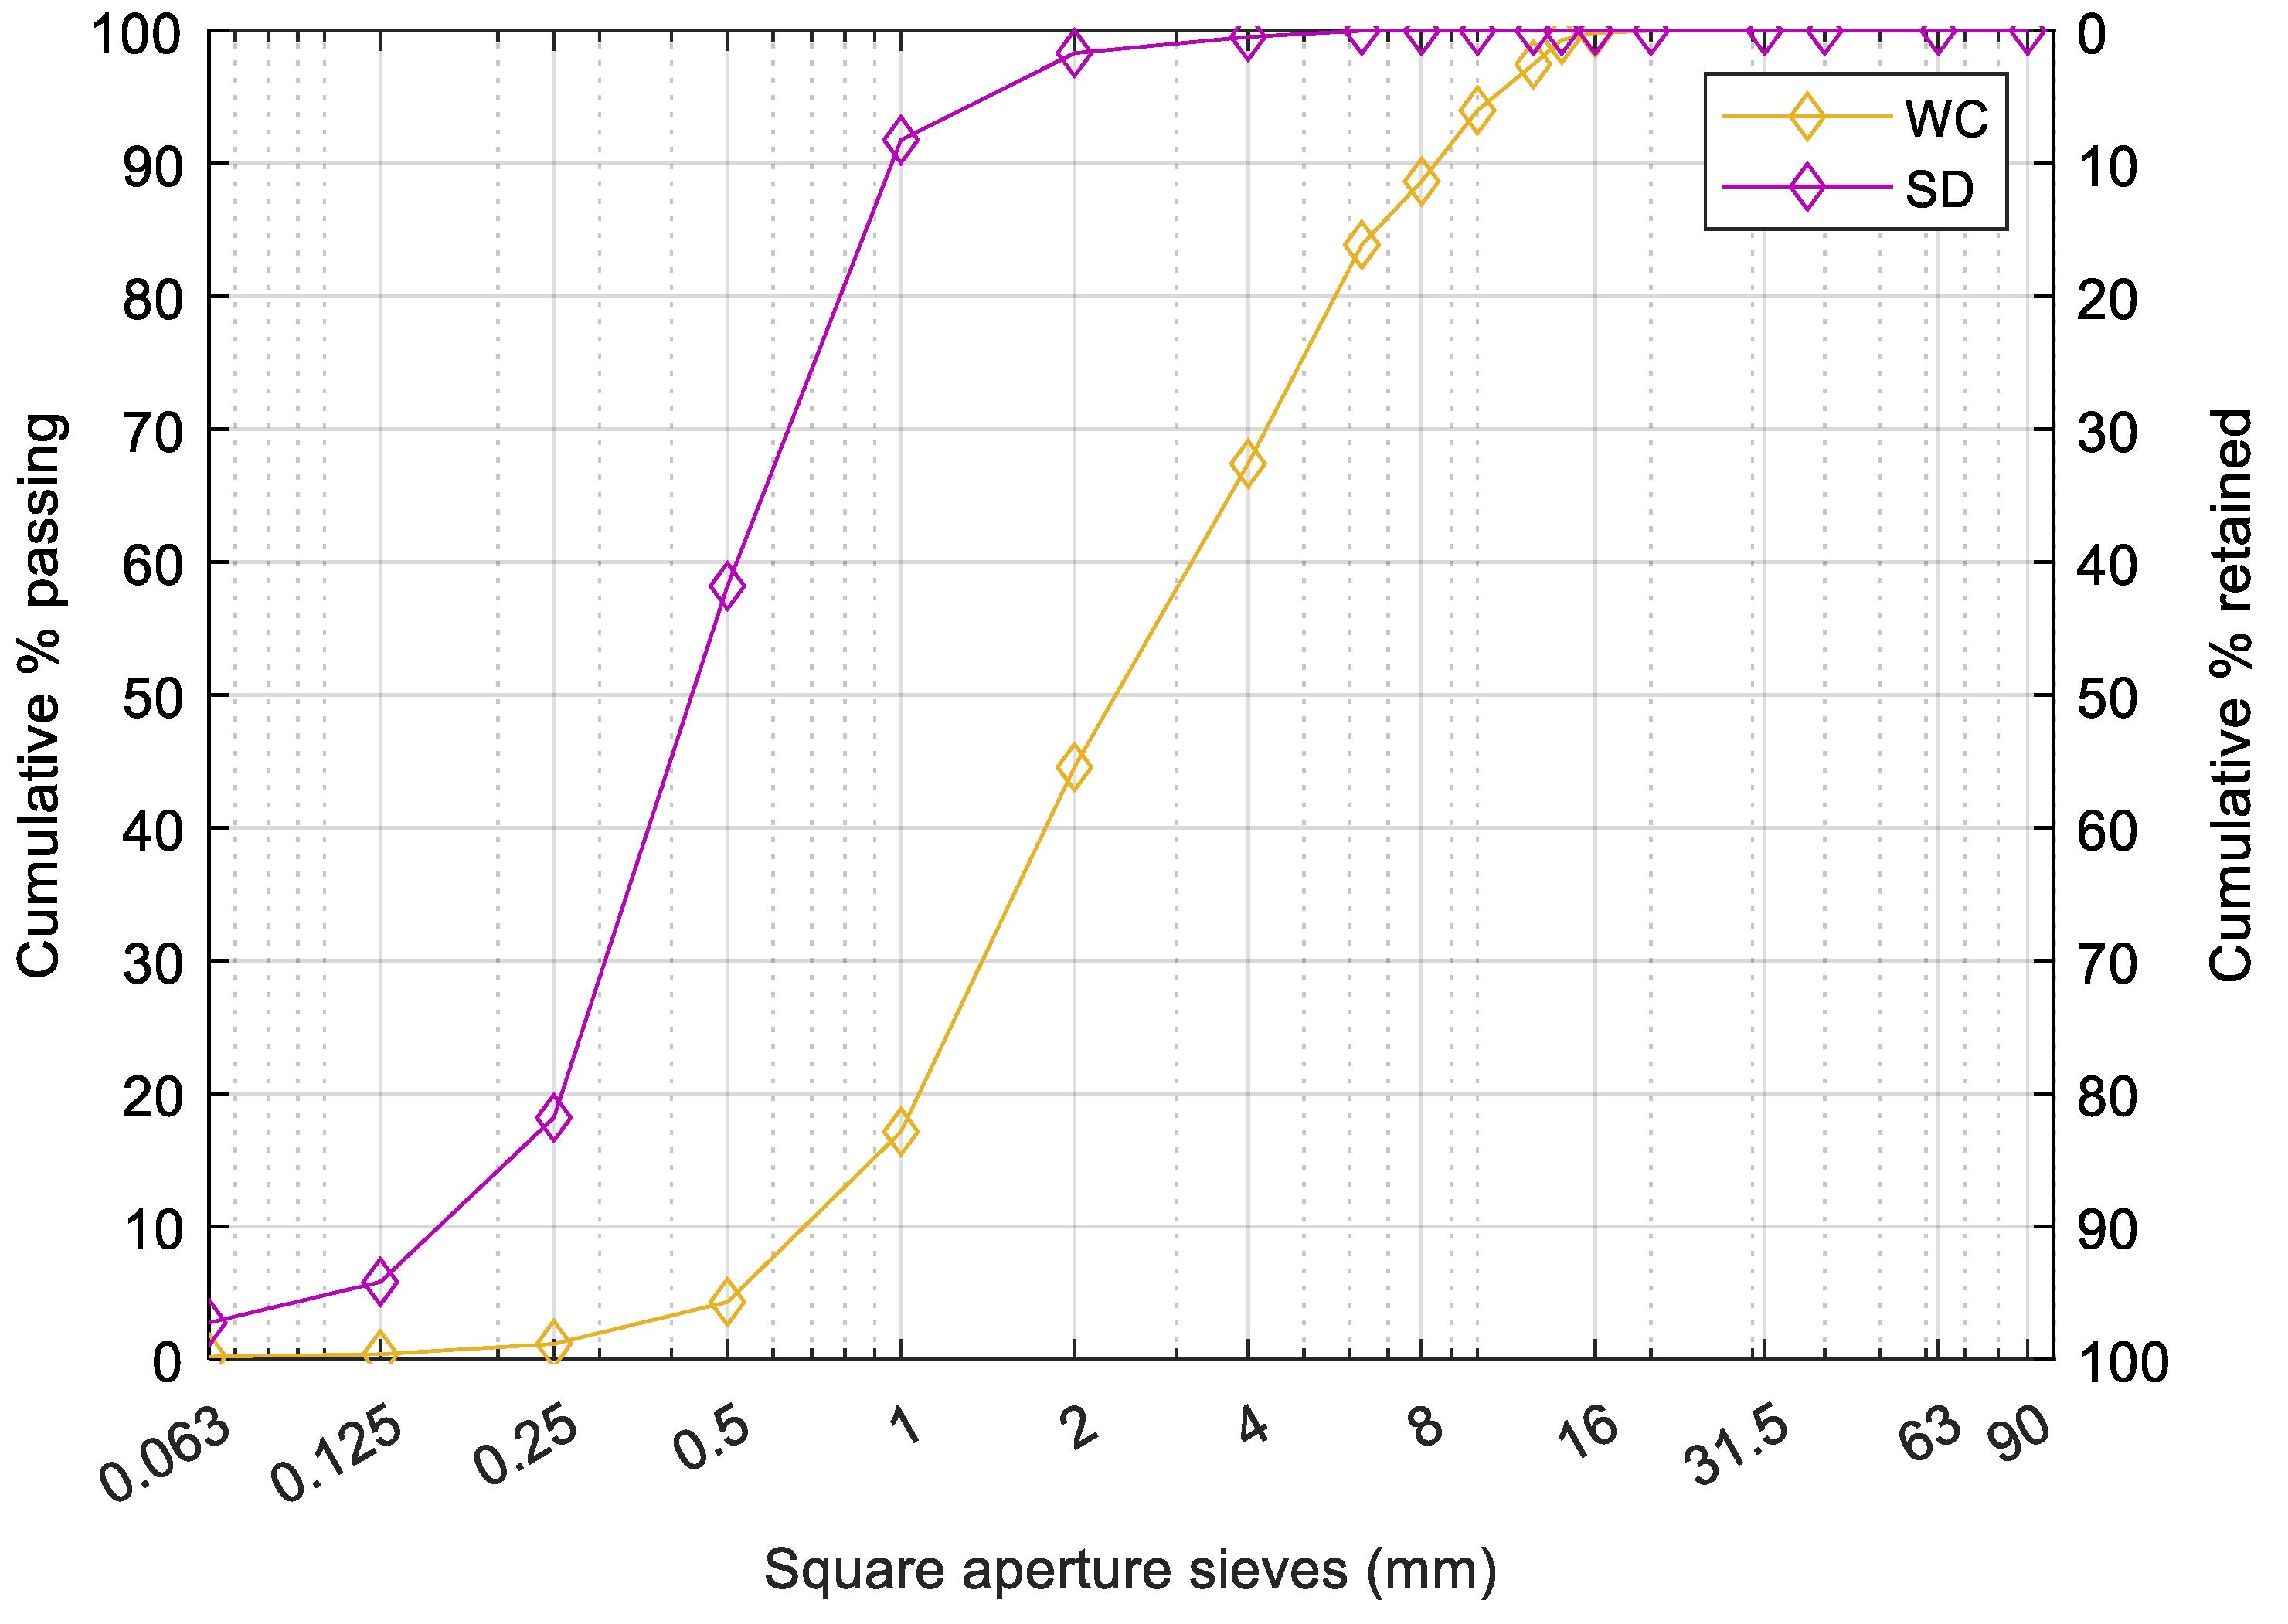
2.1. Characterization of Materials

The mineral aggregates, Sand 0/4 (S0/4), Gravel 0/5 (G0/5), and Gravel 1 (G1), were characterized in terms of the maximum size, density, water absorption, moisture content, and particle size distribution. The maximum dimension and particle size analyzes were carried out in accordance with the standard EN 933-1 [27], where the aggregates were first dried inside a climatic chamber at 110 ± 5 °C until reaching constant mass, washed to remove the fine fraction that passed through a 63 µm sieve, and then dried again up to constant mass. Constant mass was considered as achieved when the results of weighing the specimens twice with an interval of 24 h did not differ by more than 0.1% of the mass of each test specimen. Afterwards, the aggregate was poured into a sieve column and shaken until the aggregate fraction was fully separated between the sieves. Finally, each aggregate fraction was weighed, and the particle size distribution curve was plotted. The particle density and water absorption were evaluated according to standard EN 1097-6 [28]. The aggregates were then washed and sieved, and only the 4–32 mm and 63 µm–4 mm fractions were selected for the coarse and fine aggregates, respectively. Afterwards, the selected fractions were poured into a pycnometer filled with water at 22 ± 3 °C and the entrapped air removed. The pycnometer was subjected to a water bath at 22 ± 3 °C for 24 ± 0.5 h. To evaluate the saturation with dry surface weight, the coarse aggregate fraction was dried with absorbent cloth and the fine aggregate fraction was placed in an oven to evaporate surface moisture. The saturated surface dry state of the fine aggregate fraction was confirmed by filling a cone with the aggregate and checking its consistency. The aggregate is assumed to be dry when it splits and does not take a cone shape. Finally, the aggregates were weighed and the particle density and water absorption were determined. The moisture content of the aggregates was determined following standard EN 1097-5 [29]. The aggregates were first weighed and placed inside a climatic chamber at 110 ± 5 °C to achieve constant mass. Finally, the weight of dried aggregates was measured and the moisture content calculated.
Mineral aggregate particle size distribution showed that S0/4, G0/5, and G1 had a nominal maximum size of 8 mm, 10 mm, and 16 mm, respectively. As expected, all particle density and water absorption at 24 h ranged from 2620 to 2650 kg/m3 and 0.1% to 0.4%, respectively. Both gravels, G0/5 and G1, had 0.1% water content, and S0/4 had 1.6%. The particle size distribution of the mineral aggregates is presented in Figure 1, while their physical properties are summarized in Table 2.
Wood aggregates, WC and SD (Figure 2), were also characterized by their maximum size, density, water absorption, and particle size distribution. The maximum dimension and particle size analyses were carried out following the standard EN 933-1 [27]; the particle density and water absorption were determined by adapting standard EN 1097-6 [28]. The wood particles’ free surface water was evaluated based on collecting the weight of the wood in two stages, namely after draining the water from the wood through a sieve for 5 min and after wiping the particles. The oven dry particle density of the sawdust and the wood chips were 340 and 410 kg/m3, respectively, while the saturated surface dry particle density ranged from 1090 to 1110 kg/m3.
Sawdust had the highest water absorption at 24 h (411%), more than twice that of the wood chips due to their particle size distribution and corresponding specific surface area. Similarly, it had the highest free surface water (190%) in comparison to wood chips (33%). The wood aggregates’ particle size distribution curves are given in Figure 3, and their physical characterization is shown in Table 3.

2.2. Mix Design

The compositions were developed with three objectives in mind: to design a concrete with a density below 2125 kg/m3 (density reduction without compromising strength); to obtain a compressive strength above 25 MPa at 28 days (meeting the requirement of 17 MPa given by ACI 318-08 [30]), and to maximize the volume content of wood (v%). With these aims in mind, 12 mixes were developed by varying the amount of wood chips and sawdust in replacement of the mineral aggregates. In an initial phase, the composites developed were characterized in terms of compressive strength at 7 and 28 days, and in terms of modulus of elasticity and flexural strength at 28 days. Then, in a second phase, 2 of those compositions that complied with the predefined criteria were selected for a more extensive characterization.
All mixes were prepared with CEM II/A-L 42.5 R cement. The w/c (water/cement) ratio was 0.4. As mentioned before, one of the 12 mixes was the OPC reference mix (REF) designed with mineral aggregates only, and the other 11 compositions incorporate wood chips (WC), sawdust (SD), or both wood aggregates (WC + SD). Five compositions included only WC in 5 v%, 10 v%, 15 v%, 20 v%, and 25 v% replacement ratios; three incorporated only SD in 5 v%, 10 v%, and 15 v% replacement ratios; and the other three included a combination of WC + SD with 7.5 + 7.5 v%, 12.5 + 7.5 v%, and 20 + 5 v% replacement ratios of WC and SD, respectively. The amount of cement was kept constant in all mixes.
Mix design started by selecting a commonly used reference concrete. The aggregate replacement was defined to generate minimal disturbance of the particle size distribution of the aggregates. Therefore, the particle size distribution curves of WC and SD were compared with the mineral aggregates’ curves to assess the correspondence of the retained material at each sieve size between the mineral and wood aggregates. The aggregate replacement was calculated by volume (%) to prevent volumetric variations between different compositions, considering the materials’ saturated surface dry density.
In order to prevent variations in the specified water/cement ratio, the total water of the concrete compositions came from three sources: (i) added water, i.e., water that was added to the mix during the composite’s fabrication; (ii) free surface water, i.e., the water content on the wood particles’ surface (calculated in the wood aggregates’ water absorption test); and (iii) absorbed water after 24 h (calculated from the wood aggregates’ water absorption). Thus, the total water content was the sum of the added water (water added during mixing), the free surface water on the wood particles, and the water absorbed during the soaking time.
The wood aggregates were added into the mix in a saturated state. Therefore, the possible amount of wood incorporation was limited by the point when the free surface water added to the absorbed water exceeded the total water content desired. The wood aggregates were first saturated for 24 h followed by 5 min draining through a sieve before being weighed and added to the electric vertical shaft concrete mixer 130 l (Controls). The concrete mixing process started by adding coarser to finer aggregates, then half of the added water was poured into the concrete mixer. Cement was added afterwards followed by the other half of the water.
To improve workability with less available water, a superplasticizer Dynamon SP1 Mapei (SP) was used in all mixes except the reference one (without wood). The amount of SP was defined based on the amount of cement and the available water (less water is available as wood content increases in the mix, which requires the introduction of a higher amount of SP). SP was diluted in the water to be added into the concrete mixer.
Table 4 summarizes the studied compositions. They were labeled Tp according to the wood aggregate type (T = WC, T = SD, or T = WC SD) and the wood aggregate’s replacement ratio in volume (p).

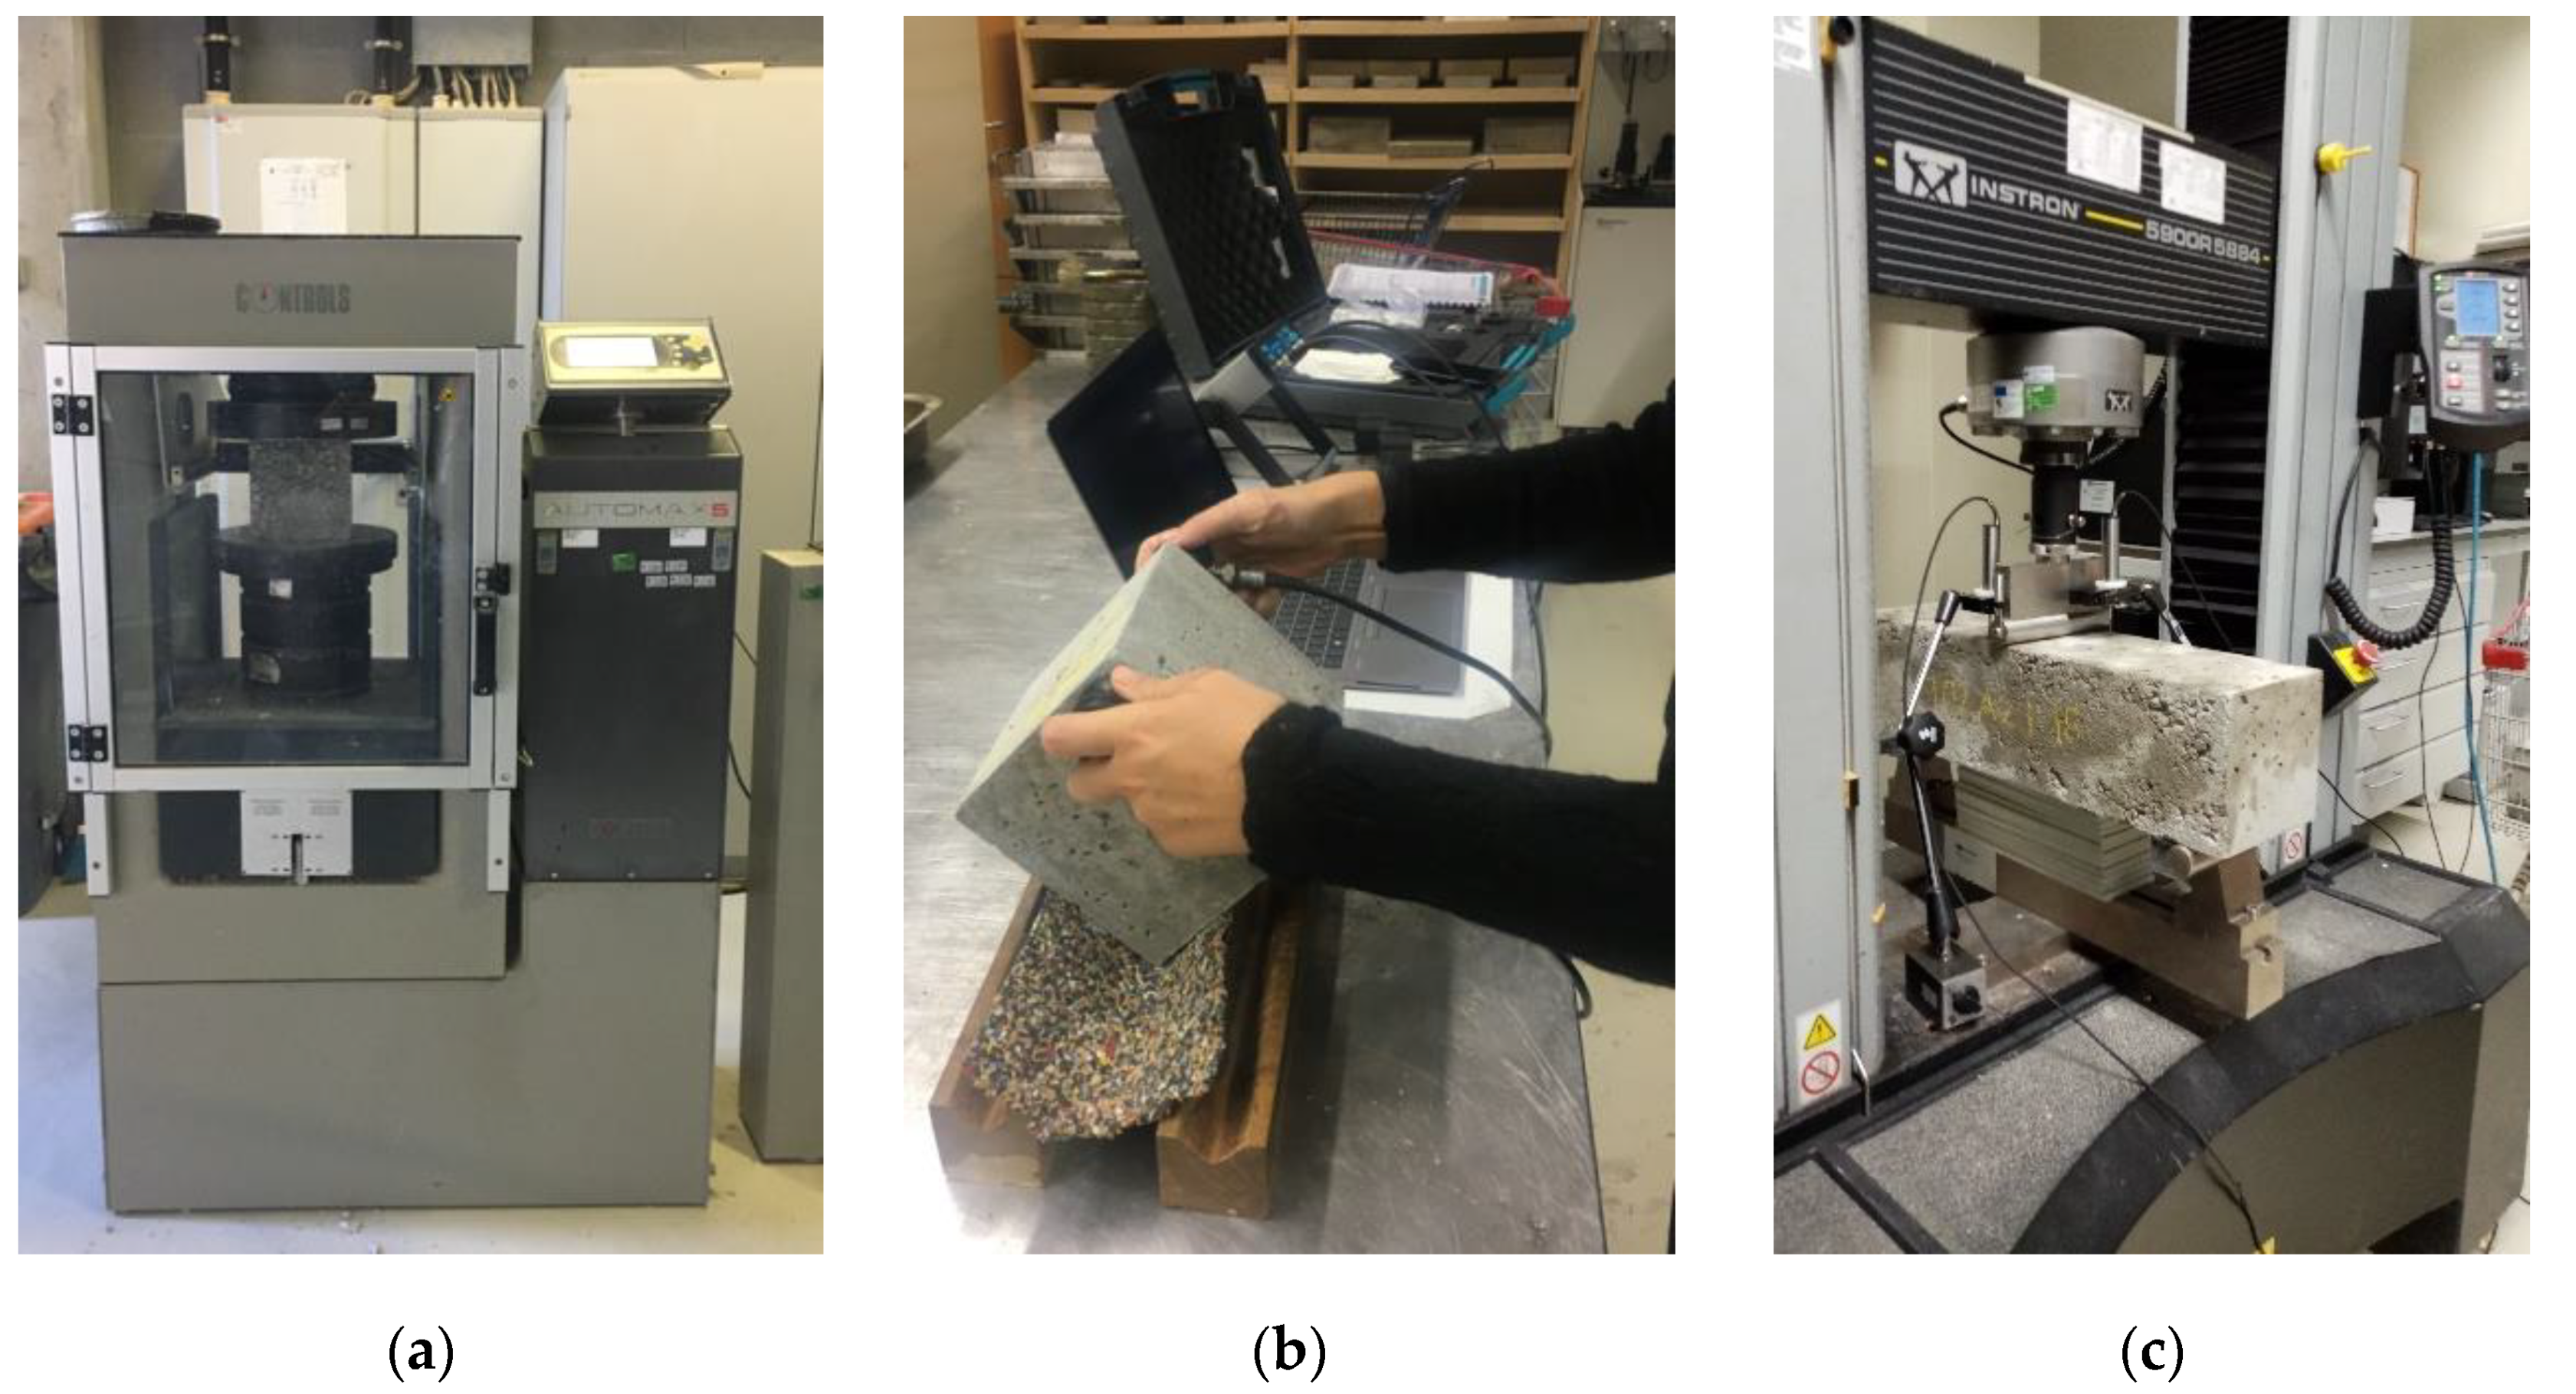
2.3. Mechanical, Durability, and Hygrothermal Tests

As mentioned above, the experimental program was divided into three evaluation programs: mechanical performance, aging resistance, and hygrothermal behavior.
To assess the mechanical performance, six cubic specimens (side 150 mm) of all 12 mixes were produced to be tested for compressive strength, Poisson’s ratio, and modulus of elasticity at 7 and 28 days, amounting to a total of 72 specimens. The Poisson’s ratio and the modulus of elasticity were calculated first since those procedures do not involve destroying the test specimens. Three beams measuring 150 mm × 150 mm × 600 mm were produced to be tested for flexural strength at 28 days. The compositions with either 15 v% or 25 v% of wood incorporation (WC15, WC25, SD15, WC7.5SD7.5, and WC20SD5) plus the reference mix (REF) were selected for these tests, amounting to a total of 18 specimens. All these specimens were kept in the molds for two days before immersion in a water tank at 20 °C until testing age.
According to the predefined criteria, WC25 and WC20SD5 were selected for the durability and hygrothermal tests because they had the highest wood incorporation (v%), the highest density reduction (%), and the compressive strength results exceeded 25 MPa. These compositions correspond to the ones with highest replacement of both coarse aggregate and sand. A total of 78 cubic (side 150 mm) specimens were produced to assess the durability against different aging scenarios (12 for each different aging scenario). An extra 42 specimens were produced to assess the compressive strength development (3 specimens for each age set) at seven curing times (7, 28, 60, 90, 120, 150, and 180 days), while 36 specimens were produced to carry out three durability cycles (wet–dry, freeze–thaw, and thermal shock). A total of 6 specimens were prepared for each durability cycle set, 3 to test after the durability cycles and 3 of the same age to test without undergoing any durability cycle. The compressive strength loss was used to assess the durability performance of the test specimens.
Three cubic specimens (side 150 mm) of each mix were also prepared for hygrothermal characterization, totaling 21 specimens. After 28 days of curing, some of the specimens were cut into slices 50 mm thick to proceed with thermal conductivity and water absorption analysis (12 specimens), and the other 9 specimens were used for water absorption tests. Four beams of each mix, measuring 100 mm × 100 mm × 500 mm, were produced to determine the shrinkage and expansion behavior (2 for shrinkage and 2 for expansion), totaling 12 specimens. They were subjected to a particular conditioning method. All test specimens were kept in the molds for two days before being immersed in a water tank at 20 °C until testing age.
The experimental program is summarized in Table 5, including the studied properties, curing/conditioning, and test methods.
All tests were carried out in the Institute for Research and Technological Development in Construction, Energy, Environment and Sustainability (Itecons, Coimbra, Portugal) using calibrated equipment. Itecons has a Quality Management System in place that is certified under EN ISO 9001 and over 300 tests accredited under EN ISO/IEC 17025. It is also a Notified Body (System 3) and a Technical Assessment Body for the CE marking of construction products. The methodologies used to carry out the tests are described next.

2.3.1. Physical and Mechanical Characterization

The mechanical characterization comprises the assessment of compressive strength according to EN 12390-3 [31] (σ), Poisson’s ratio ( μ ), modulus of elasticity ( E ), and flexural strength (f), according to EN 12390-5 [32]. The apparent mass density (ρ) of the tested specimens was also determined according to EN 1602 [33]. The details are given next.

Compressive Strength

An electromechanical compressive testing machine, Controls model 50-C56V2, was used with a load cell of 3000 kN (Figure 4a). The load was applied at a rate of 0.6 ± 0.2 MPa/s. The compressive strength was obtained by dividing the failure load by the average cross-sectional area.

Poisson’s Ratio and Modulus of Elasticity

Poisson’s ratio and the modulus of elasticity can be determined by measuring the deformations generated by the application of axial loads or by estimating the allowed body dilatational and shear wave velocities within the material. In the present study, Poisson’s ratio and the modulus of elasticity were determined through a non-destructive dynamic method that allows the evaluation of those wave velocities [34,35]. The longitudinal and shear pulse waves were generated using an electro-acoustic transducer. The travel time of these pulses along a known path length (cube edge) is used to define those velocities. This is done using a direct arrangement that consists of placing the emitting source and the receiver on two opposite faces of the test specimen. This ensures an easier detection of the dilatational and shear wave pulses. The equipment used was a commercial portable Pundit Lab unit used to generate and receive ultrasonic pulses. Two pairs of P and S wave transducers with nominal frequencies of 54 kHz and 250 kHz, respectively, were used. A couplant was used to facilitate the ultrasonic energy transmission from the firmly attached transducers into the test specimens (Figure 4b). Poisson’s ratio ( μ ) and the modulus of elasticity ( E ) were then defined using the following known elastic relationships
μ = V p 2 2 V s 2 2 ( V p 2 V s 2 )
E = 2 ρ V s 2 ( 1 + μ )
where V p and V s are the measured P-wave and S-wave velocities, respectively, and ρ is the mass density.

Flexural Strength

The flexural strength test was performed using an electromechanical universal testing machine Instron, model 59R5884 with a load cell of 150 kN (Figure 4c). The load was applied in one-point (3-point bending test) at mid-span distance, with a span (distance between supports) of 500 mm.

2.3.2. Durability

Besides evaluating the compressive strength with age, the aging effect under extreme conditions was assessed by conducting artificial aging cycles (wetting–drying, freeze–thaw, and thermal shock) in three samples before subjecting them to compressive strength tests. Control samples were tested at the same testing age without undergoing artificial aging cycles to evaluate the decay of the compressive strength.
At this stage, WC25 and WC20SD5 were selected according to the initial criteria previously defined. The details are given next.

Compressive Strength Development

The evaluation of compressive strength with age is of practical importance to control construction schedules. Seven different points of curing time were considered: aging 7, 28, 60, 90, 120, 150, and 180 days.

Wet–Dry Cycles

The wet–dry cycles were performed to assess potential damage to the concrete or to the wood–cement bond, e.g., cracking and shrinkage. Ten artificial cycles were performed. Each cycle consisted of immersion for 24 h in a water tank at a constant temperature of (20 ± 2) °C for 24 h followed by dry conditions for 24 h in a laboratory room at a constant temperature of (20 ± 2) °C and 50% relative humidity.

Freeze–Thaw Cycles

The specimens were subjected to 7 freeze–thaw cycles over a period of 7 days, according to EN 12371 [32]. Each cycle included 11.5 h in dry conditions created in a cold chamber with a constant temperature of (−20 ± 2) °C followed by 11.5 h of immersion in a water tank with a constant water temperature of (20 ± 2) °C, equipped with a device to keep the test specimen in place. The transition between conditions (−20 to 20 °C) lasted 1 h.

Thermal Shock Cycles

Thermal shock cycles were conducted to measure the ability of a material to withstand abrupt changes in temperature conditions, according to EN 10545-9 [36]. Ten thermal shock cycles were defined. Each cycle consisted of placing the test specimens in a climatic chamber at (105 ± 5) °C for 18 h, followed by immersion in a water tank at a constant water temperature of (20 ± 2) °C for 6 h. The test specimens were immediately transferred between conditions (105 to 20 °C).

2.3.3. Hygrothermal Characterization

The hygrothermal characterization evaluates four relevant properties: thermal conductivity (λ), water absorption (Ww24), shrinkage, and expansion. Following the initial criteria and similarly to the durability assessment, the physical characterization was performed on REF, WC25, and WC20 SD5 compositions. The details are given next.

Thermal Conductivity

The guarded hot plate method was used to determine thermal conductivity using a λ-Meter EP500 model, according to ISO 8302 [37]. The test procedure followed EN 12,664 [38]. The specimens were conditioned in a ventilated climatic chamber at (23 ± 2) °C and (50 ± 5)% relative humidity until a constant mass was reached (using the criteria mentioned above). The specimens were subjected to a 15 °C temperature difference between the upper and the lower plates of the equipment, with a mean temperature of 23 °C.
The equipment quantifies the steady-state heat flow through a test specimen placed between two plates with thermal sensors. The goal is to reproduce a constant unidirectional heat flow between the two plates. The plates measure 500 mm × 500 mm, with an area measuring 150 mm × 150 mm in the center where the heat is generated. The specimens were placed in an expanded polystyrene (EPS) frame to ensure the direction of the heat flow and mitigate lateral heat transfer.

Water Absorption

Water absorption is a very important parameter, closely related to the durability of its application in the case of concrete materials. This property was evaluated by partial immersion following the standard ISO 15148 [39]. The test consists of measuring the change in mass of the specimens for at least 24 h. The mass gain per face area (g/m2) was determined as a function of the square root of time in seconds.
The four lateral faces of the test specimens, 150 mm × 50 mm, were sealed with paraffin wax so that the area in contact with water was limited to the bottom face. Then, the samples were immersed in water at (23 ± 2) °C to a depth of (5 ± 2) mm, and the mass was measured 8 times (at 5 min, 20 min, 1 h, 2 h, 4 h, 8 h, 24 h, and 48 h). The surface water was removed by wiping the specimen with absorbent lab paper before weighing and then immediately placing the sample in the water again. The water absorption coefficient after 24 h, Ww24 [kg/(m2/h0.5)], can be calculated as
W w 24 = m 24 m 0 24
where m 24 [kg/m2] is the value of ∆m (kg/m2) after 24 h and m 0   (kg/m2) is where the linear regression of ∆m function of t intersects the vertical axis.

Shrinkage and Expansion

The shrinkage and expansion behavior, a relevant property given the hygroscopicity characteristic of wood particles, was determined by measuring the distance between two reference points in the beam before and after conditioning under specific conditions (under water in the expansion assessment and in a climatic chamber in the shrinkage assessment). For both cases, the beams were demolded at 24 ± 1 h of age, and the conditioning period was for 90 ± 1 day. To assess the shrinkage, after demolding, 2 specimens of each mix were placed in a climatic chamber (20 ± 2 °C and 50 ± 5% HR) in such a way that all sides were in contact with the air. The distance between the reference points was measured at the end of the conditioning period. To determine the expansion, two other specimens were placed in a water tank at 20 ± 2 °C and the distance between the reference points was measured again at the end of the conditioning period. Measurements were taken using digital calipers, and the final results correspond to the mean of three measurements. The shrinkage and expansion were obtained by the difference between the measurements, divided by the initial one, following the procedure indicated in [40].

3. Results

As previously mentioned, the experimental program was conducted by initially performing mechanical tests on several compositions. After selecting two incorporating the maximum amount of wood with good mechanical properties, additional durability and hygrothermal tests were performed. All the experimental results are presented and discussed below. To facilitate the interpretation of the results, considering the natural variability of the samples, mean ± standard deviation values are included for all the tests.

3.1. Mechanical Performance

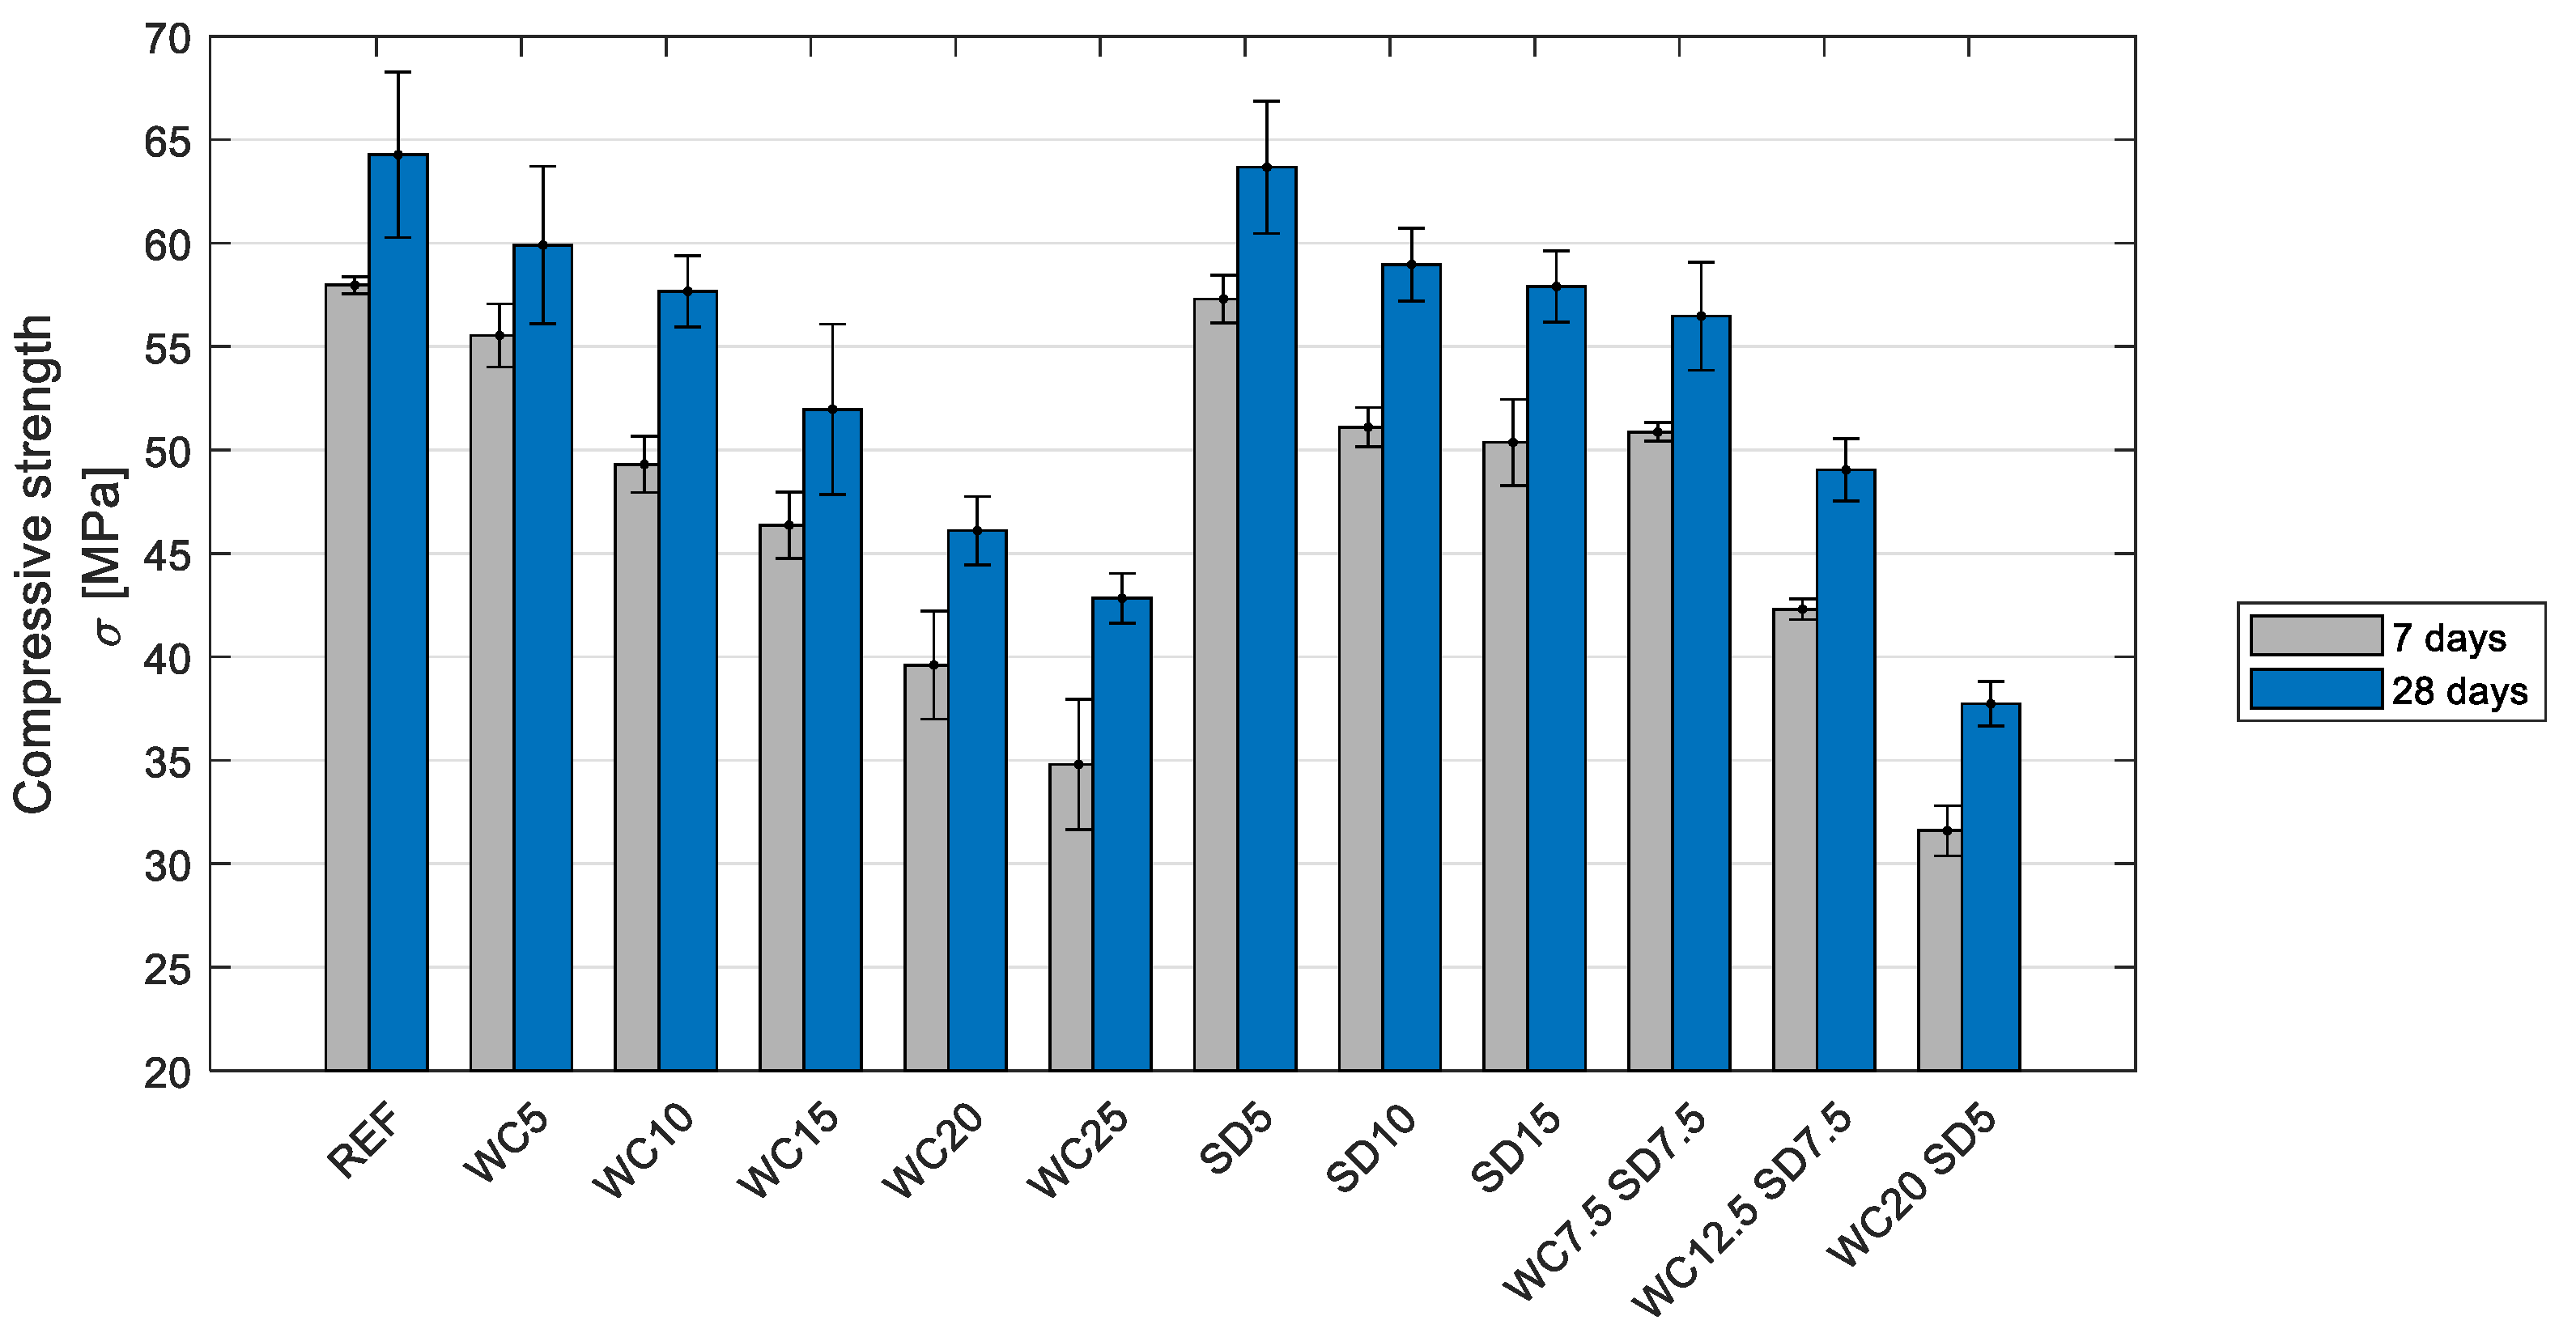
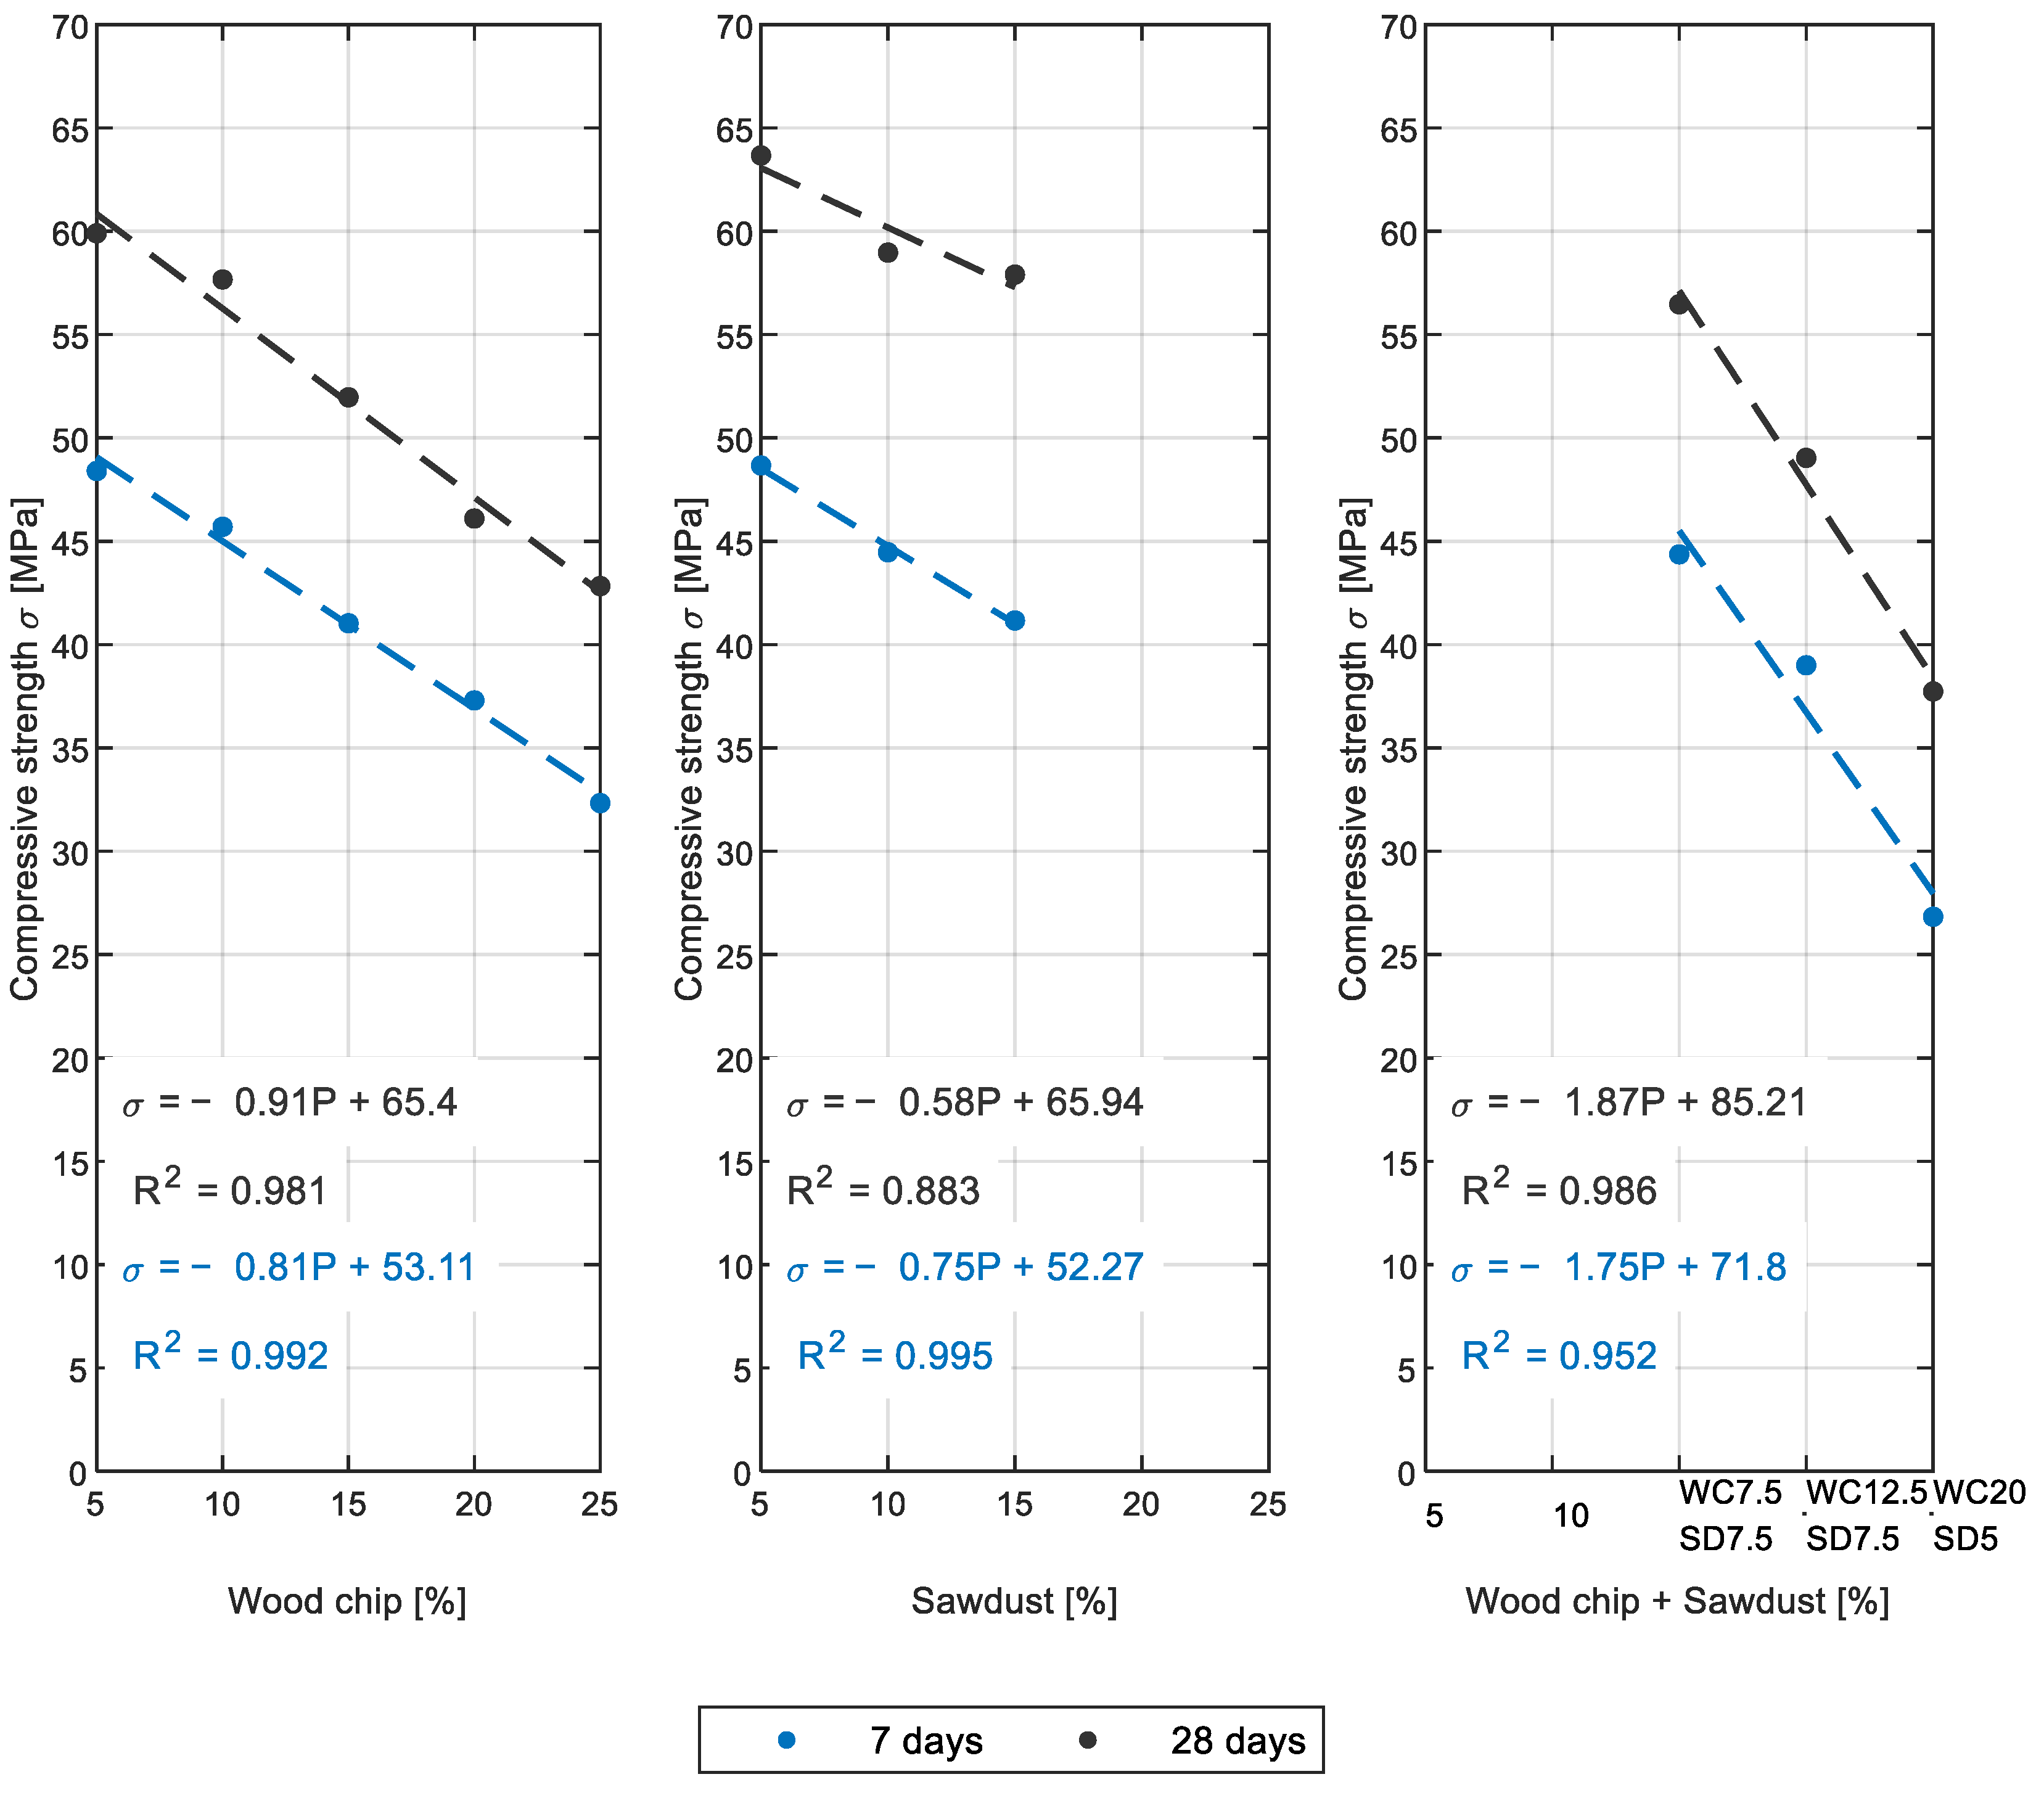
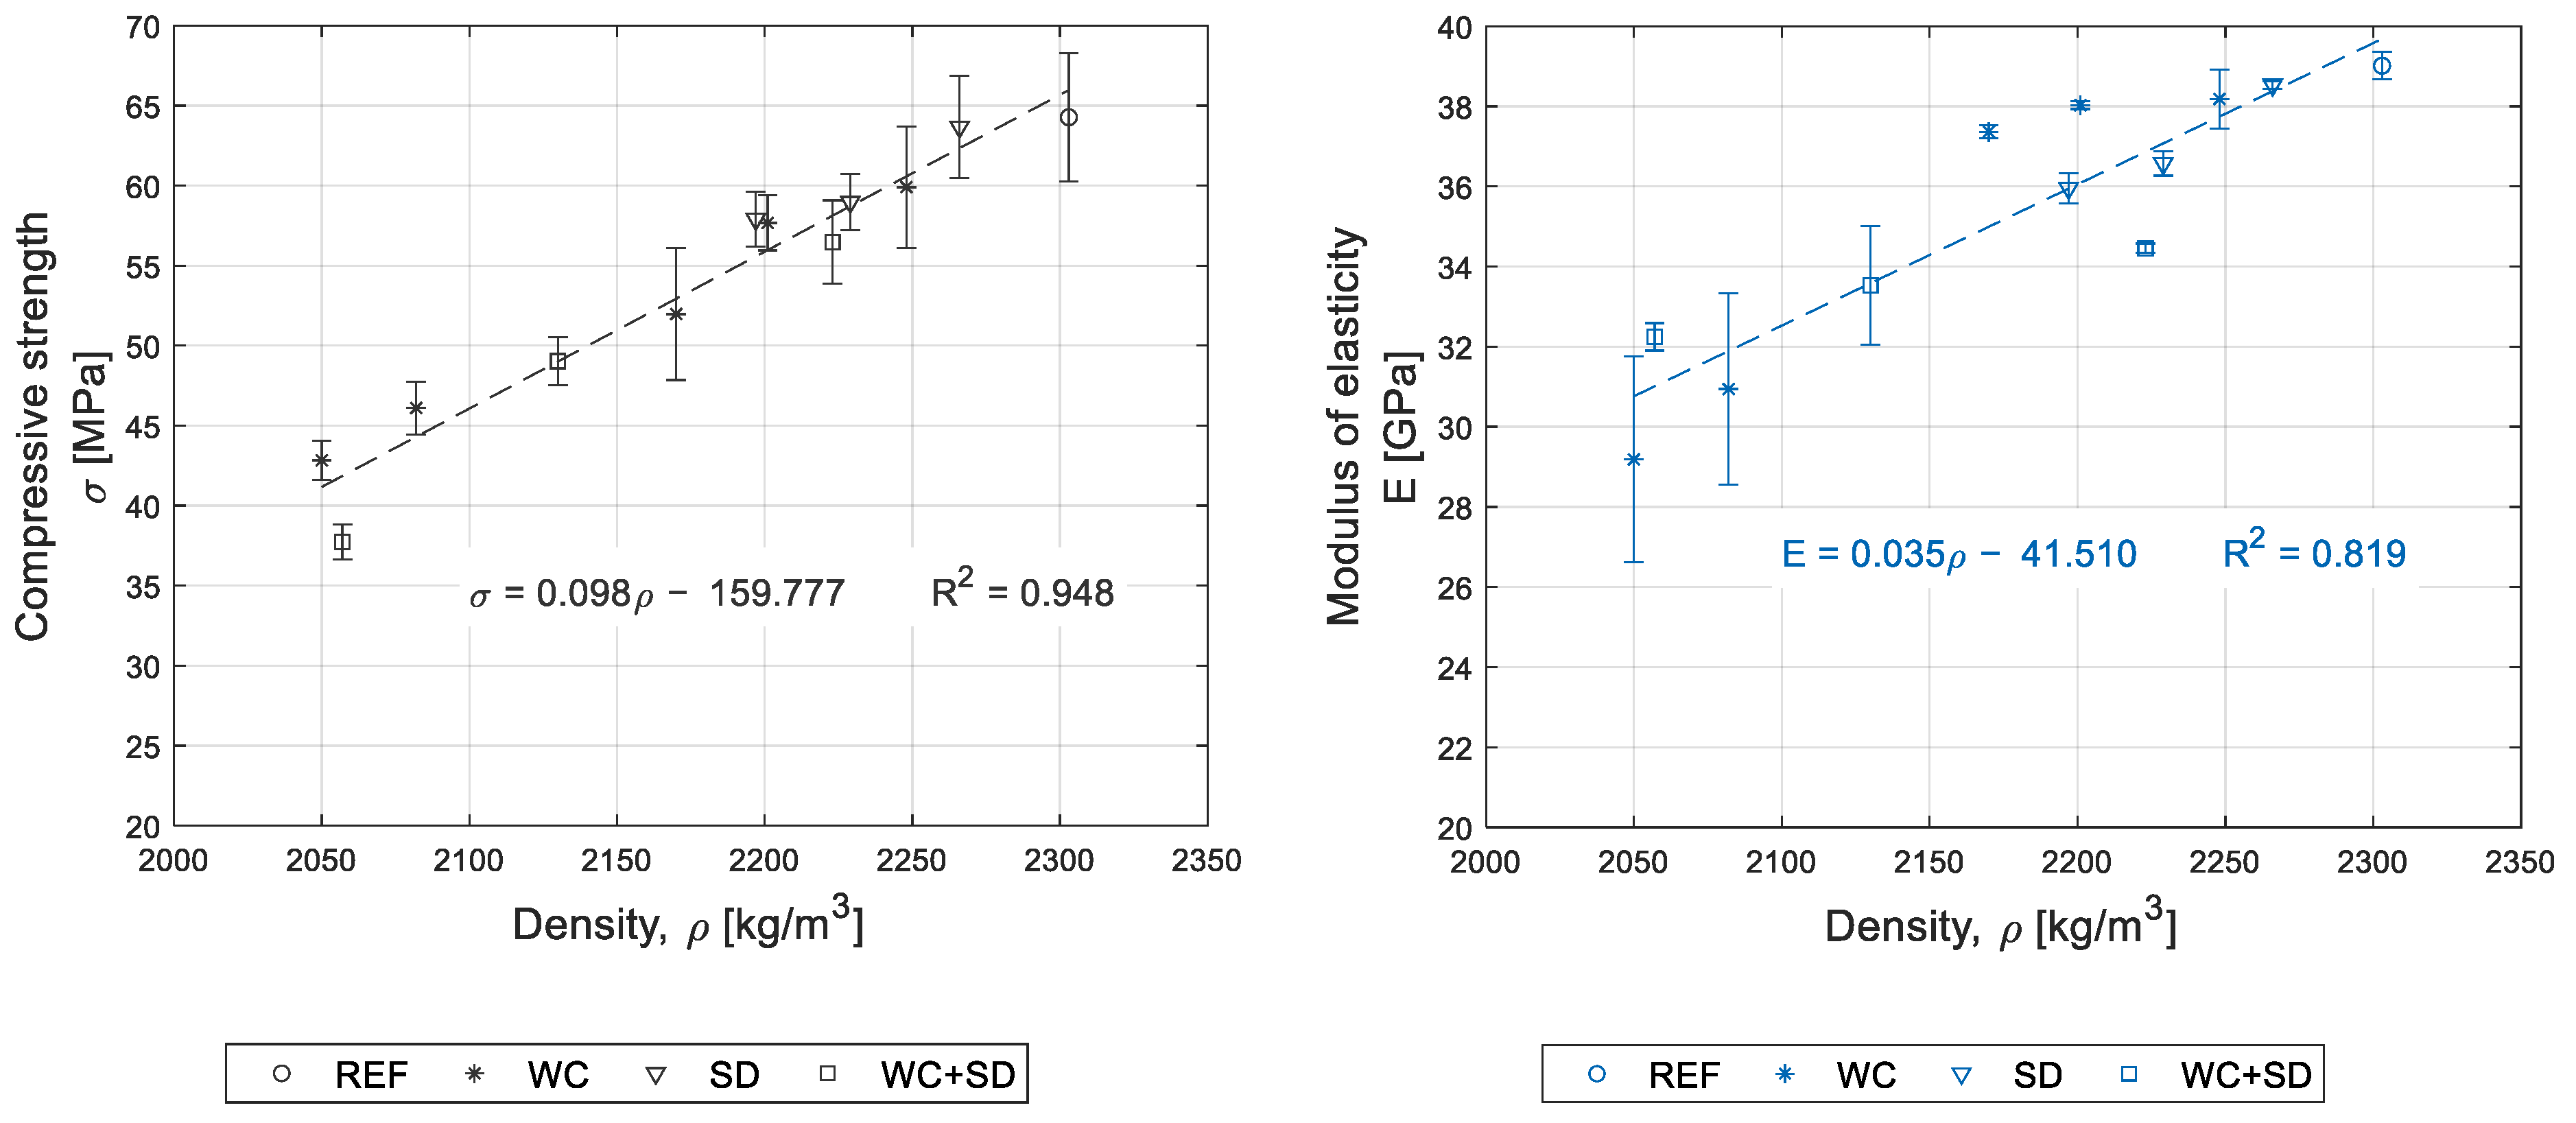
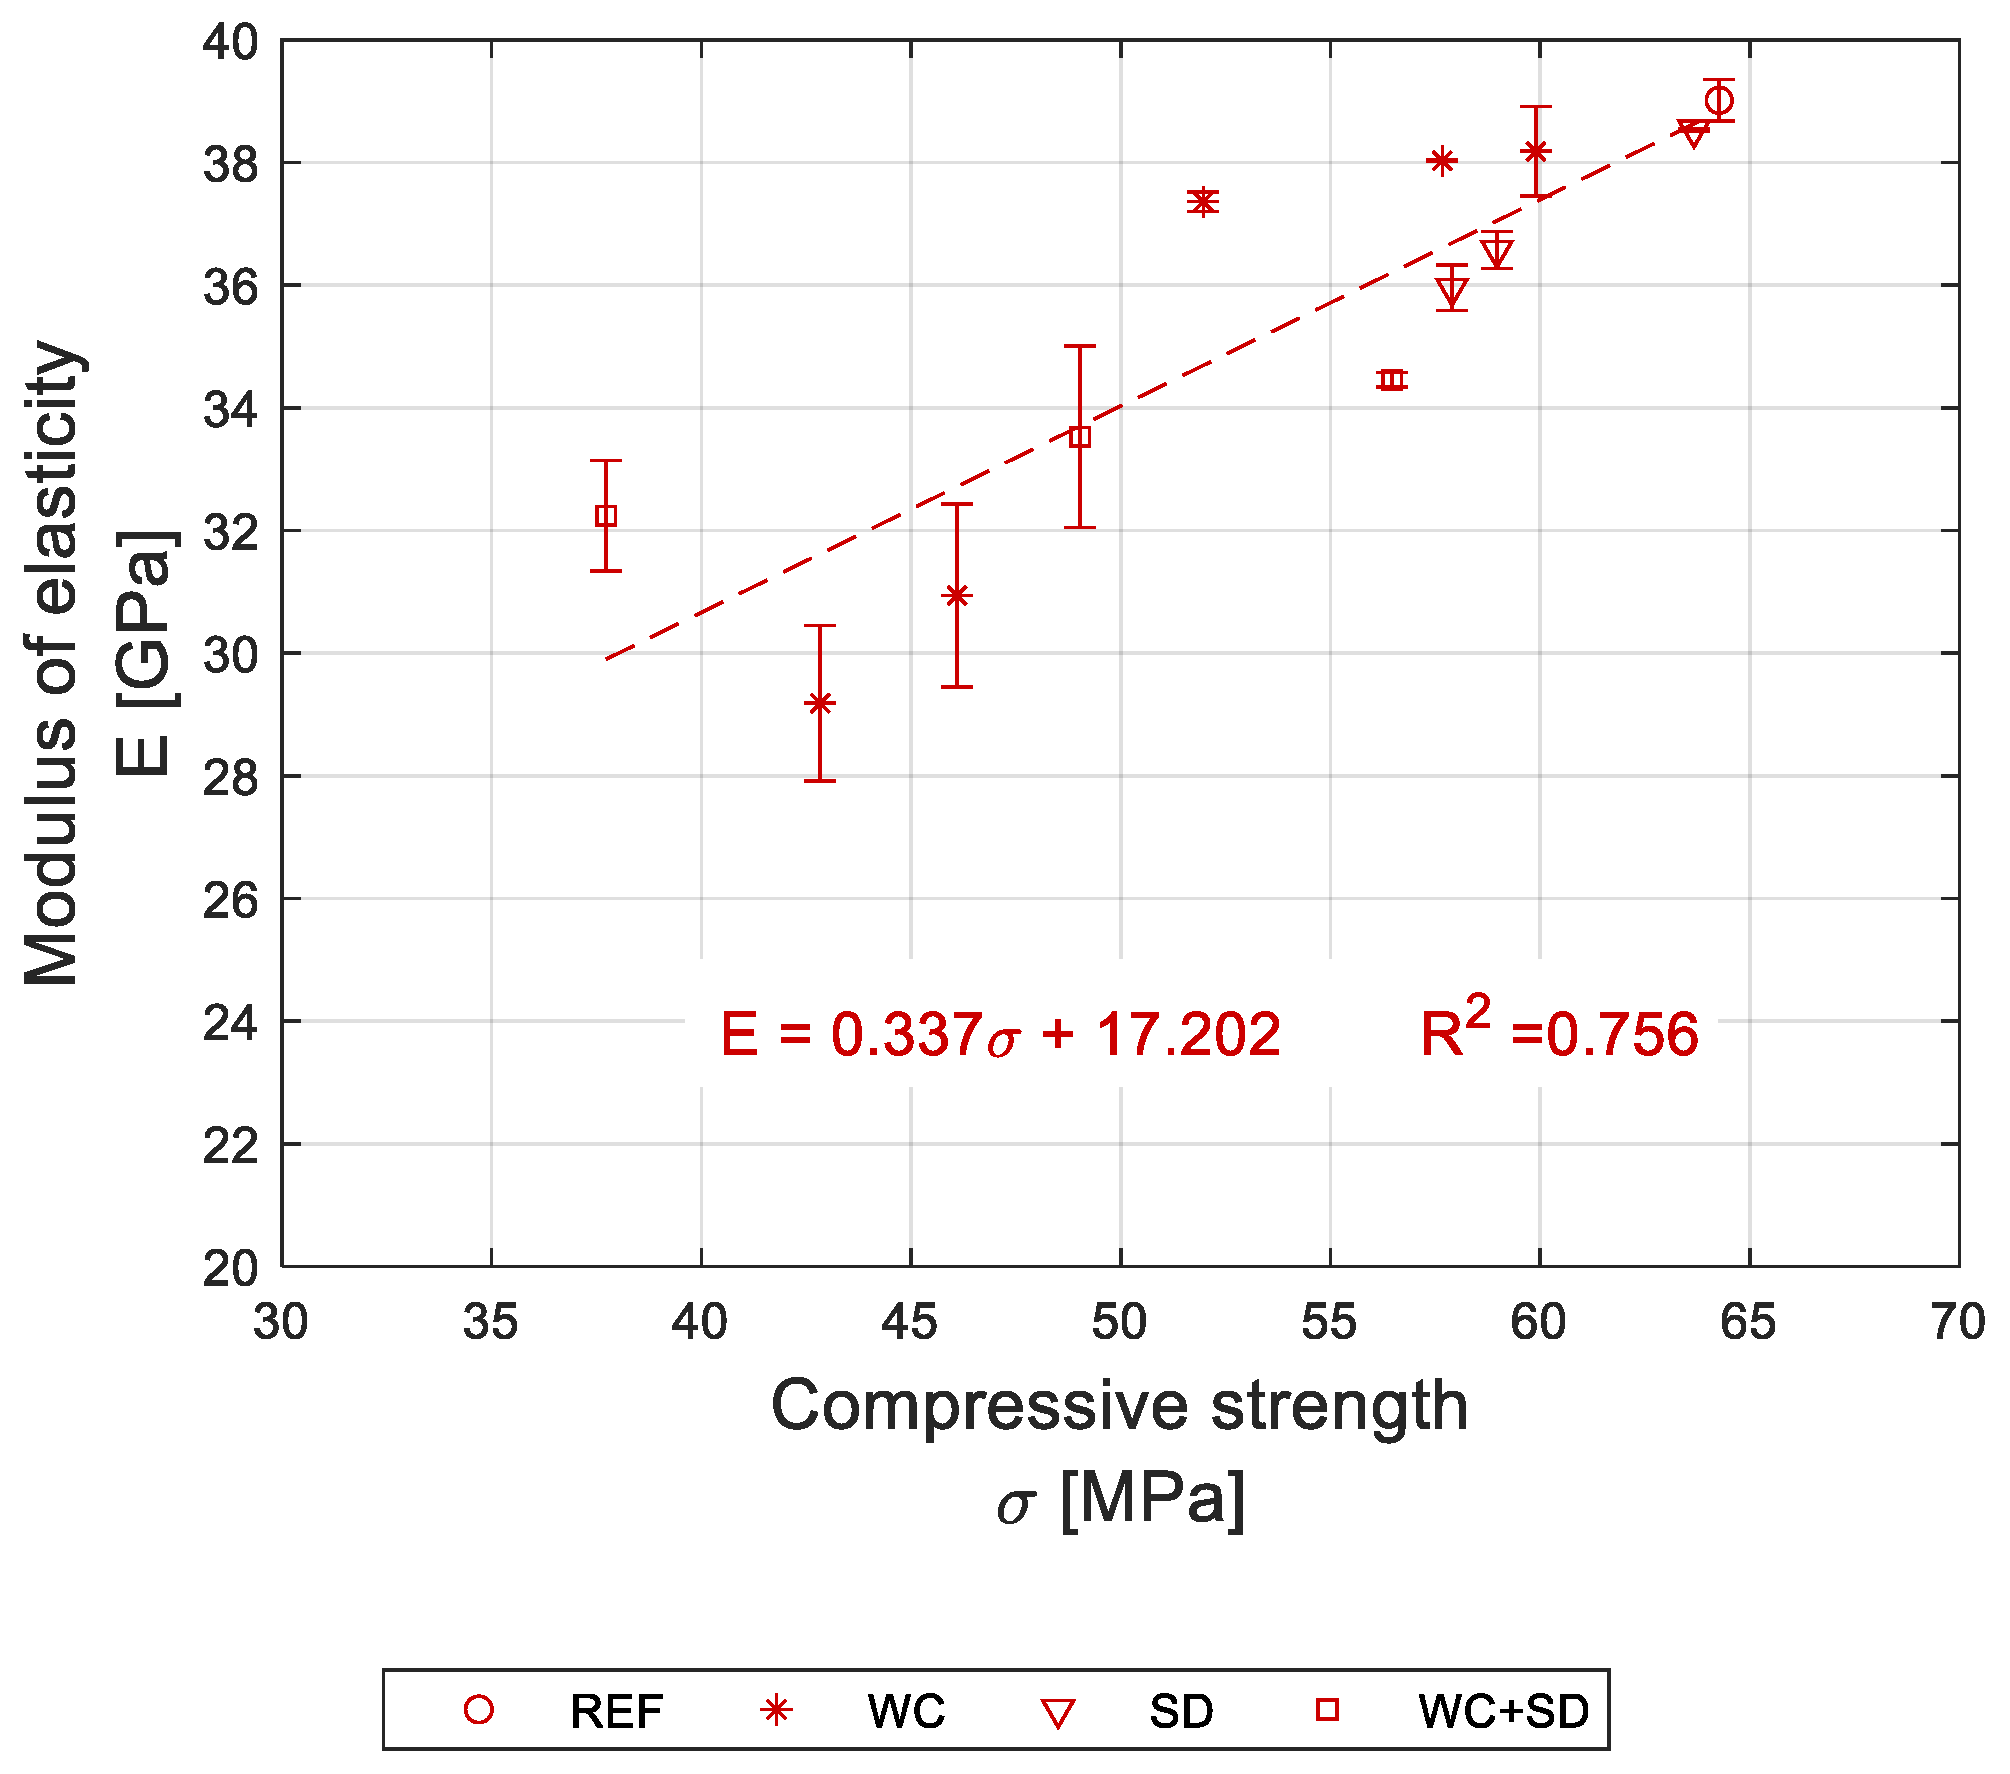
3.1.1. Compressive Strength

As mentioned above, 12 mixes were prepared based on the incorporation of wood chips or sawdust or a mixture of both. For reference purposes, an additional sample was produced with mineral aggregates only. Table 6 lists the compressive strength and respective density obtained for each composition. Compressive strength results for all compositions at 7 and 28 days are also summarized in Figure 5.
As expected, concrete density at 28 days decreased with the increase in the wood content, with WC25 and WC20SD5 displaying the most significant density reduction (up to 11%). Furthermore, unsurprisingly, the compressive strength of all composites increased steadily according to the curing age (15%, or 6.6 MPa on average).
Compared with REF, the compressive strength reduction at 28 days for WC compositions containing 5 v%, 10 v%, 15 v%, 20 v%, and 25 v% wood chips was 6.79%, 10.27%, 19.14%, 28.27%, and 33.35%, respectively. The incorporation of sawdust seemed to have less impact on compressive strength, with a reduction of 0.93%, 8.25%, and 9.9% in compressive strength at 5%, 10%, and 15% of SD incorporation, respectively. The compressive strength reduction in compositions containing a mixture of both woods with the respective amount of WC+SD of 7.5 + 7.5 v%, 12.5 + 7.5 v%, and 20 + 5 v% was 12.14%, 23.70%, and 41.29%, respectively. A smaller loss in strength could be obtained by increasing the amount of cement. However, this approach would impact on the final price and environmental performance.
Figure 6 illustrates the relationship between the compressive strength reduction and the wood incorporation content.
The regression analysis applied to the data showed that the compressive strength of concrete decreased linearly as the wood content increased for the three types of concrete (WC, SD, and WC + SD). The coefficient of determination (R2) was found to be close to 1.0, in a range of [0.952 to 0.995], except in the case of the sawdust mix at 28 days, which had an (R2) below 0.90. Additionally, the relationship between wood amount and compressive strength was linear for both ages (7 and 28 days), regardless of the composition type. Compressive strength development at an early age showed promising results, with only the WC20SD5 composite having a result below 30 MPa.
As already discussed, the SD compressive strength results were less affected by the incorporation of wood than those of the WC composites for both ages. However, WC + SD composites had the highest compressive strength reduction, affected by the incorporated wood content. Morales-Conde et al. [41] studied the incorporation of wood waste in wood–gypsum composites. Although the binder used was different, they also noted that the strength values were slightly higher for composites containing sawdust than for those containing wood in the form of wood shavings. This could be related to density, where denser samples are more likely to develop higher compressive strength.
The decrease in compressive strength could be caused by several factors: the weaker nature of the wood particles compared to mineral aggregates; the compressible nature of wood particles; and the poor bond between the wood particles and cement paste. To inspect the wood particles embedded in concrete, the two samples containing the highest volume percentage of wood (WC25 and WC20S5) were examined by means of stereoscopic microscopy and scanning electron microscopy (SEM). The reference sample was also examined for comparison purposes. A good wood–cement bond and a uniform wood distribution were observed. Representative stereoscopic micrographs are presented in Figure 7 to illustrate it.
To obtain insight into the composites’ microstructure and a close look at the interfaces between the different aggregates and the cementitious matrix, representative SEM micrographs were also recorded for the same samples (Figure 8). The images in the left column correspond to observations where a good interface between the aggregates and cement matrix were visible, while figures presented in the right column correspond to observations suggesting weak bonds or bond failure between aggregates and the cement matrix. As expected, more cases of micro-cracking were observed in wood–cement interfaces (WC25 and WC20S5), which is likely to be due to the stress generated by water loss or gain or/and bonding failure. Beltran and Schlangen [42] also reported a loss of interface bond due to the volume changes of wood fibers in the presence of water. However, similar effects were also observed for the reference sample (REF), suggesting that this phenomenon was not exclusive to the wood–cement composites.

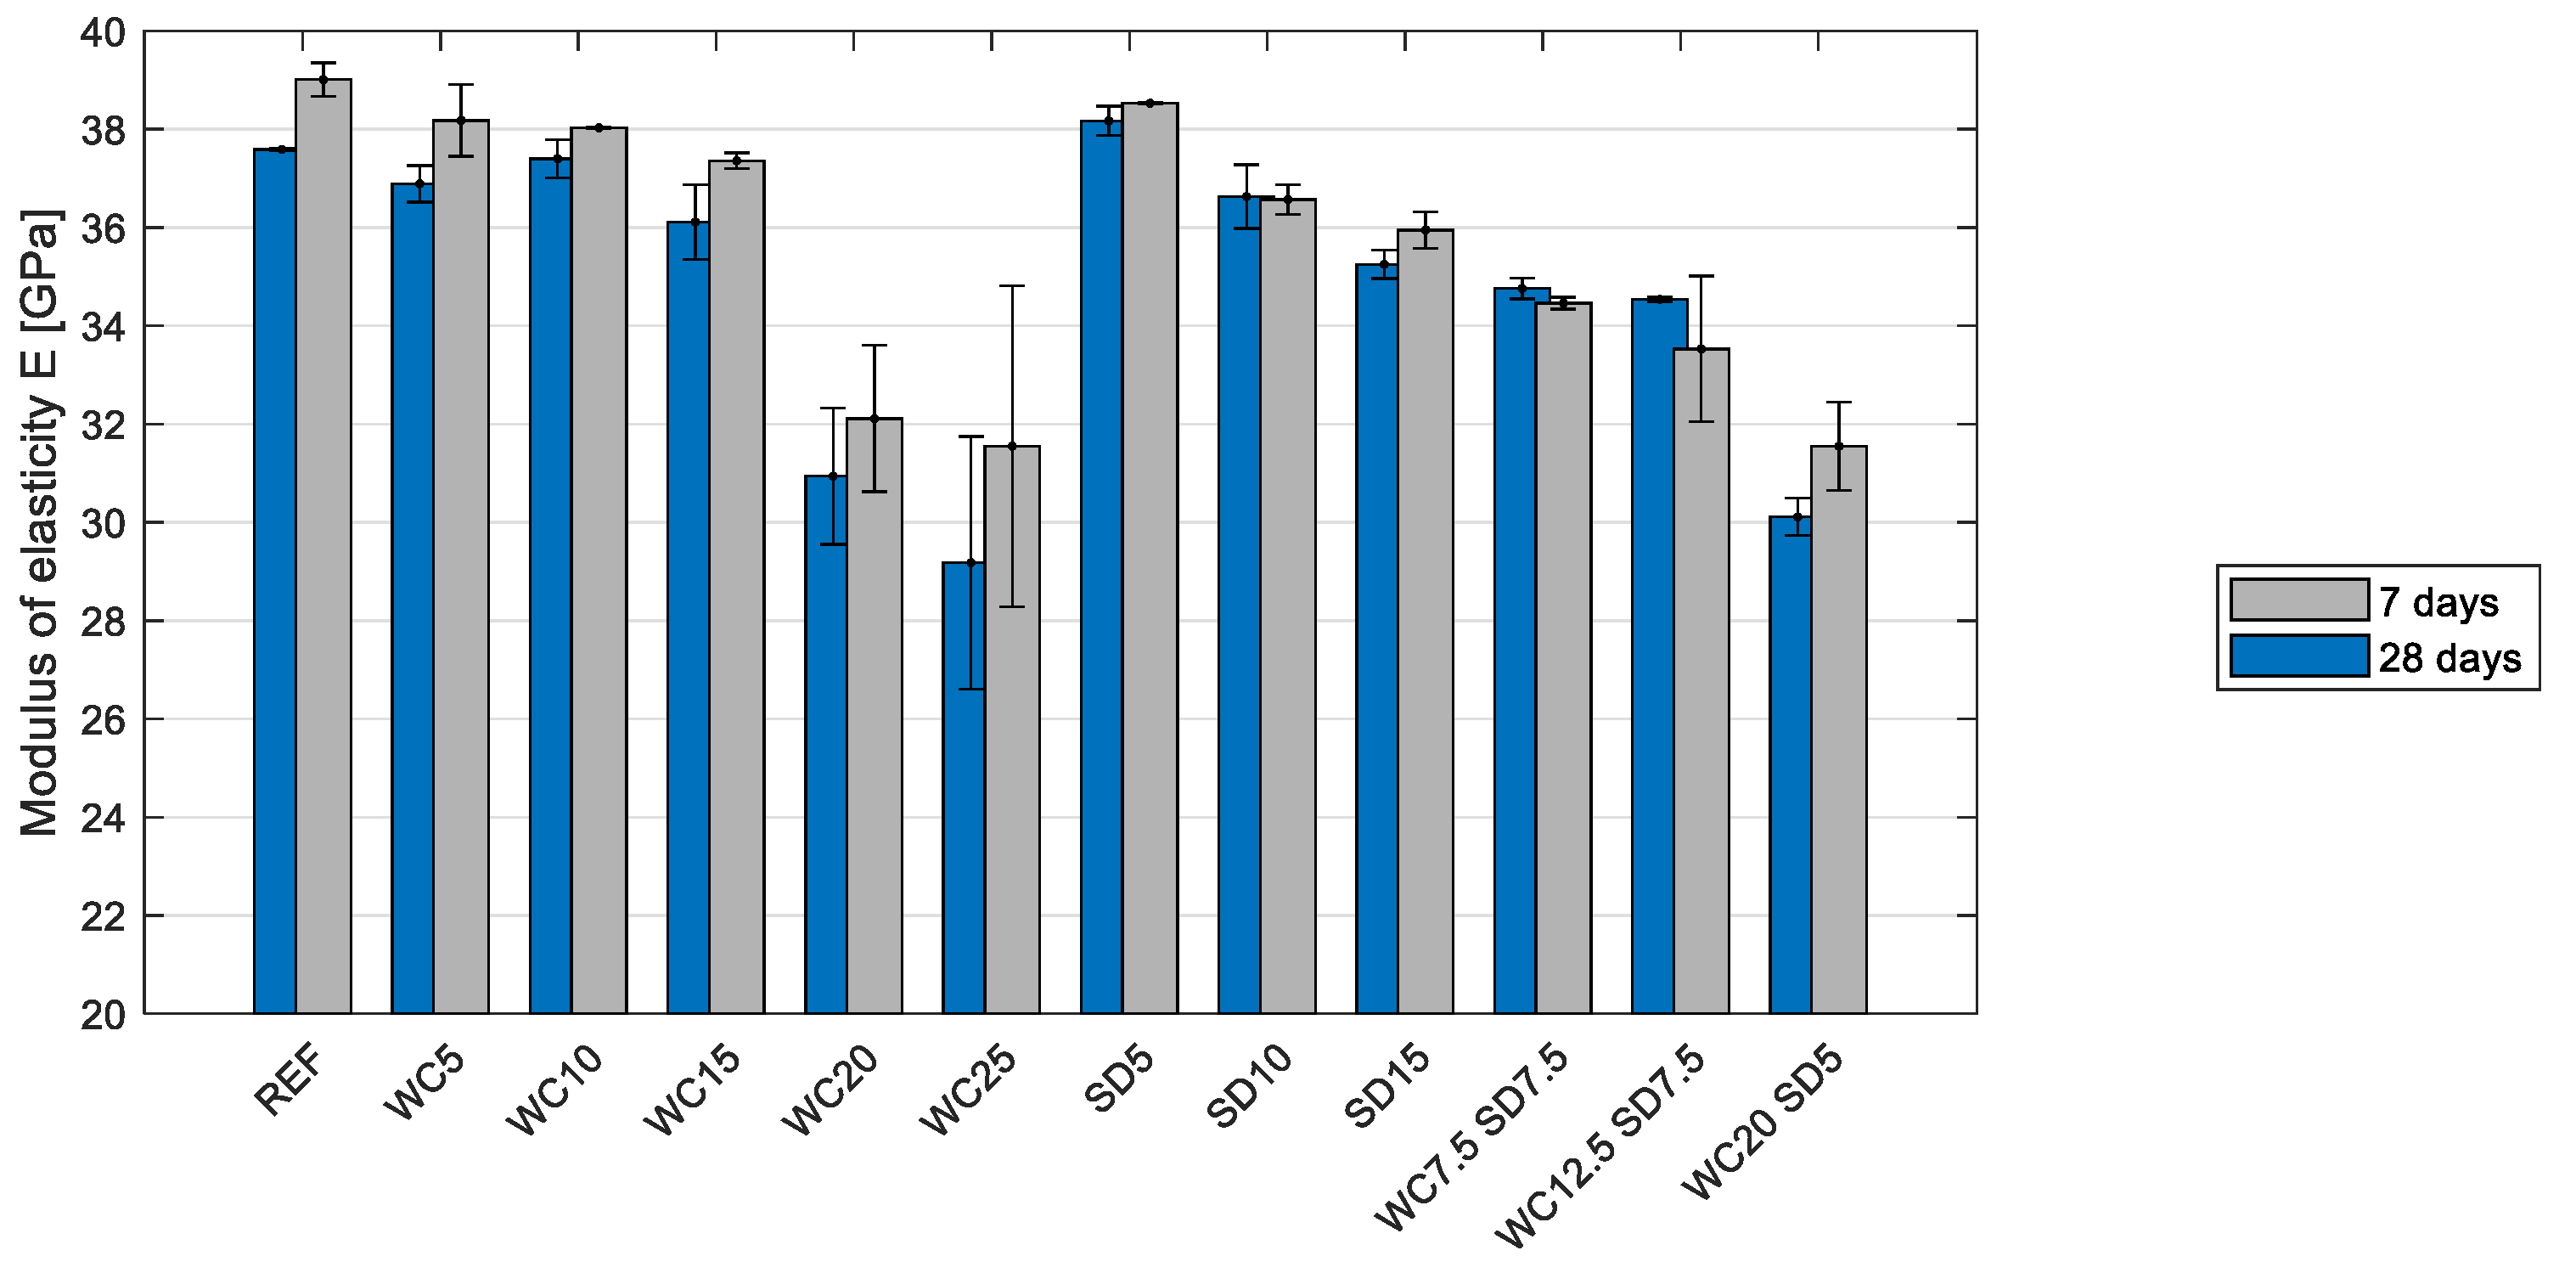
3.1.2. Dynamic Elastic Properties

The dynamic modulus of elasticity and Poisson’s ratio were determined for all compositions at 7 and 28 days in order to compare the stiffness and deformation behavior of the various concretes containing different amounts of wood chips and sawdust (Table 7).
As expected, and similarly to what had been observed for compressive strength, the modulus of elasticity increased from 7 to 28 days and decreased as the wood content increased (Figure 9).
However, a significant drop in the results of the modulus of elasticity was observed for WC20 and WC25, which may be related to their lower density. In fact, as shown in Figure 10, a close linear relationship could be obtained between the density and the mechanical properties, with coefficients of determination (R2) of 0.963 and 0.819 for the compressive strength and modulus of elasticity, respectively.
Despite the high dispersion of results, some linear correlation (R2 = 0.756) could be seen between the modulus of elasticity and compressive strength results (Figure 11).
Regarding Poisson’s ratio ( μ ), values ranging from 0.29 to 0.34 were obtained, with the reference concrete sample recording a value of 0.32.
Note that most of the building codes for concrete assume that Poisson’s ratio is equal to 0.2; Eurocode 2 [43]. However, published studies show that Poisson’s ratio obtained using a dynamic approach often leads to higher values [44,45,46], which agrees with the results obtained.

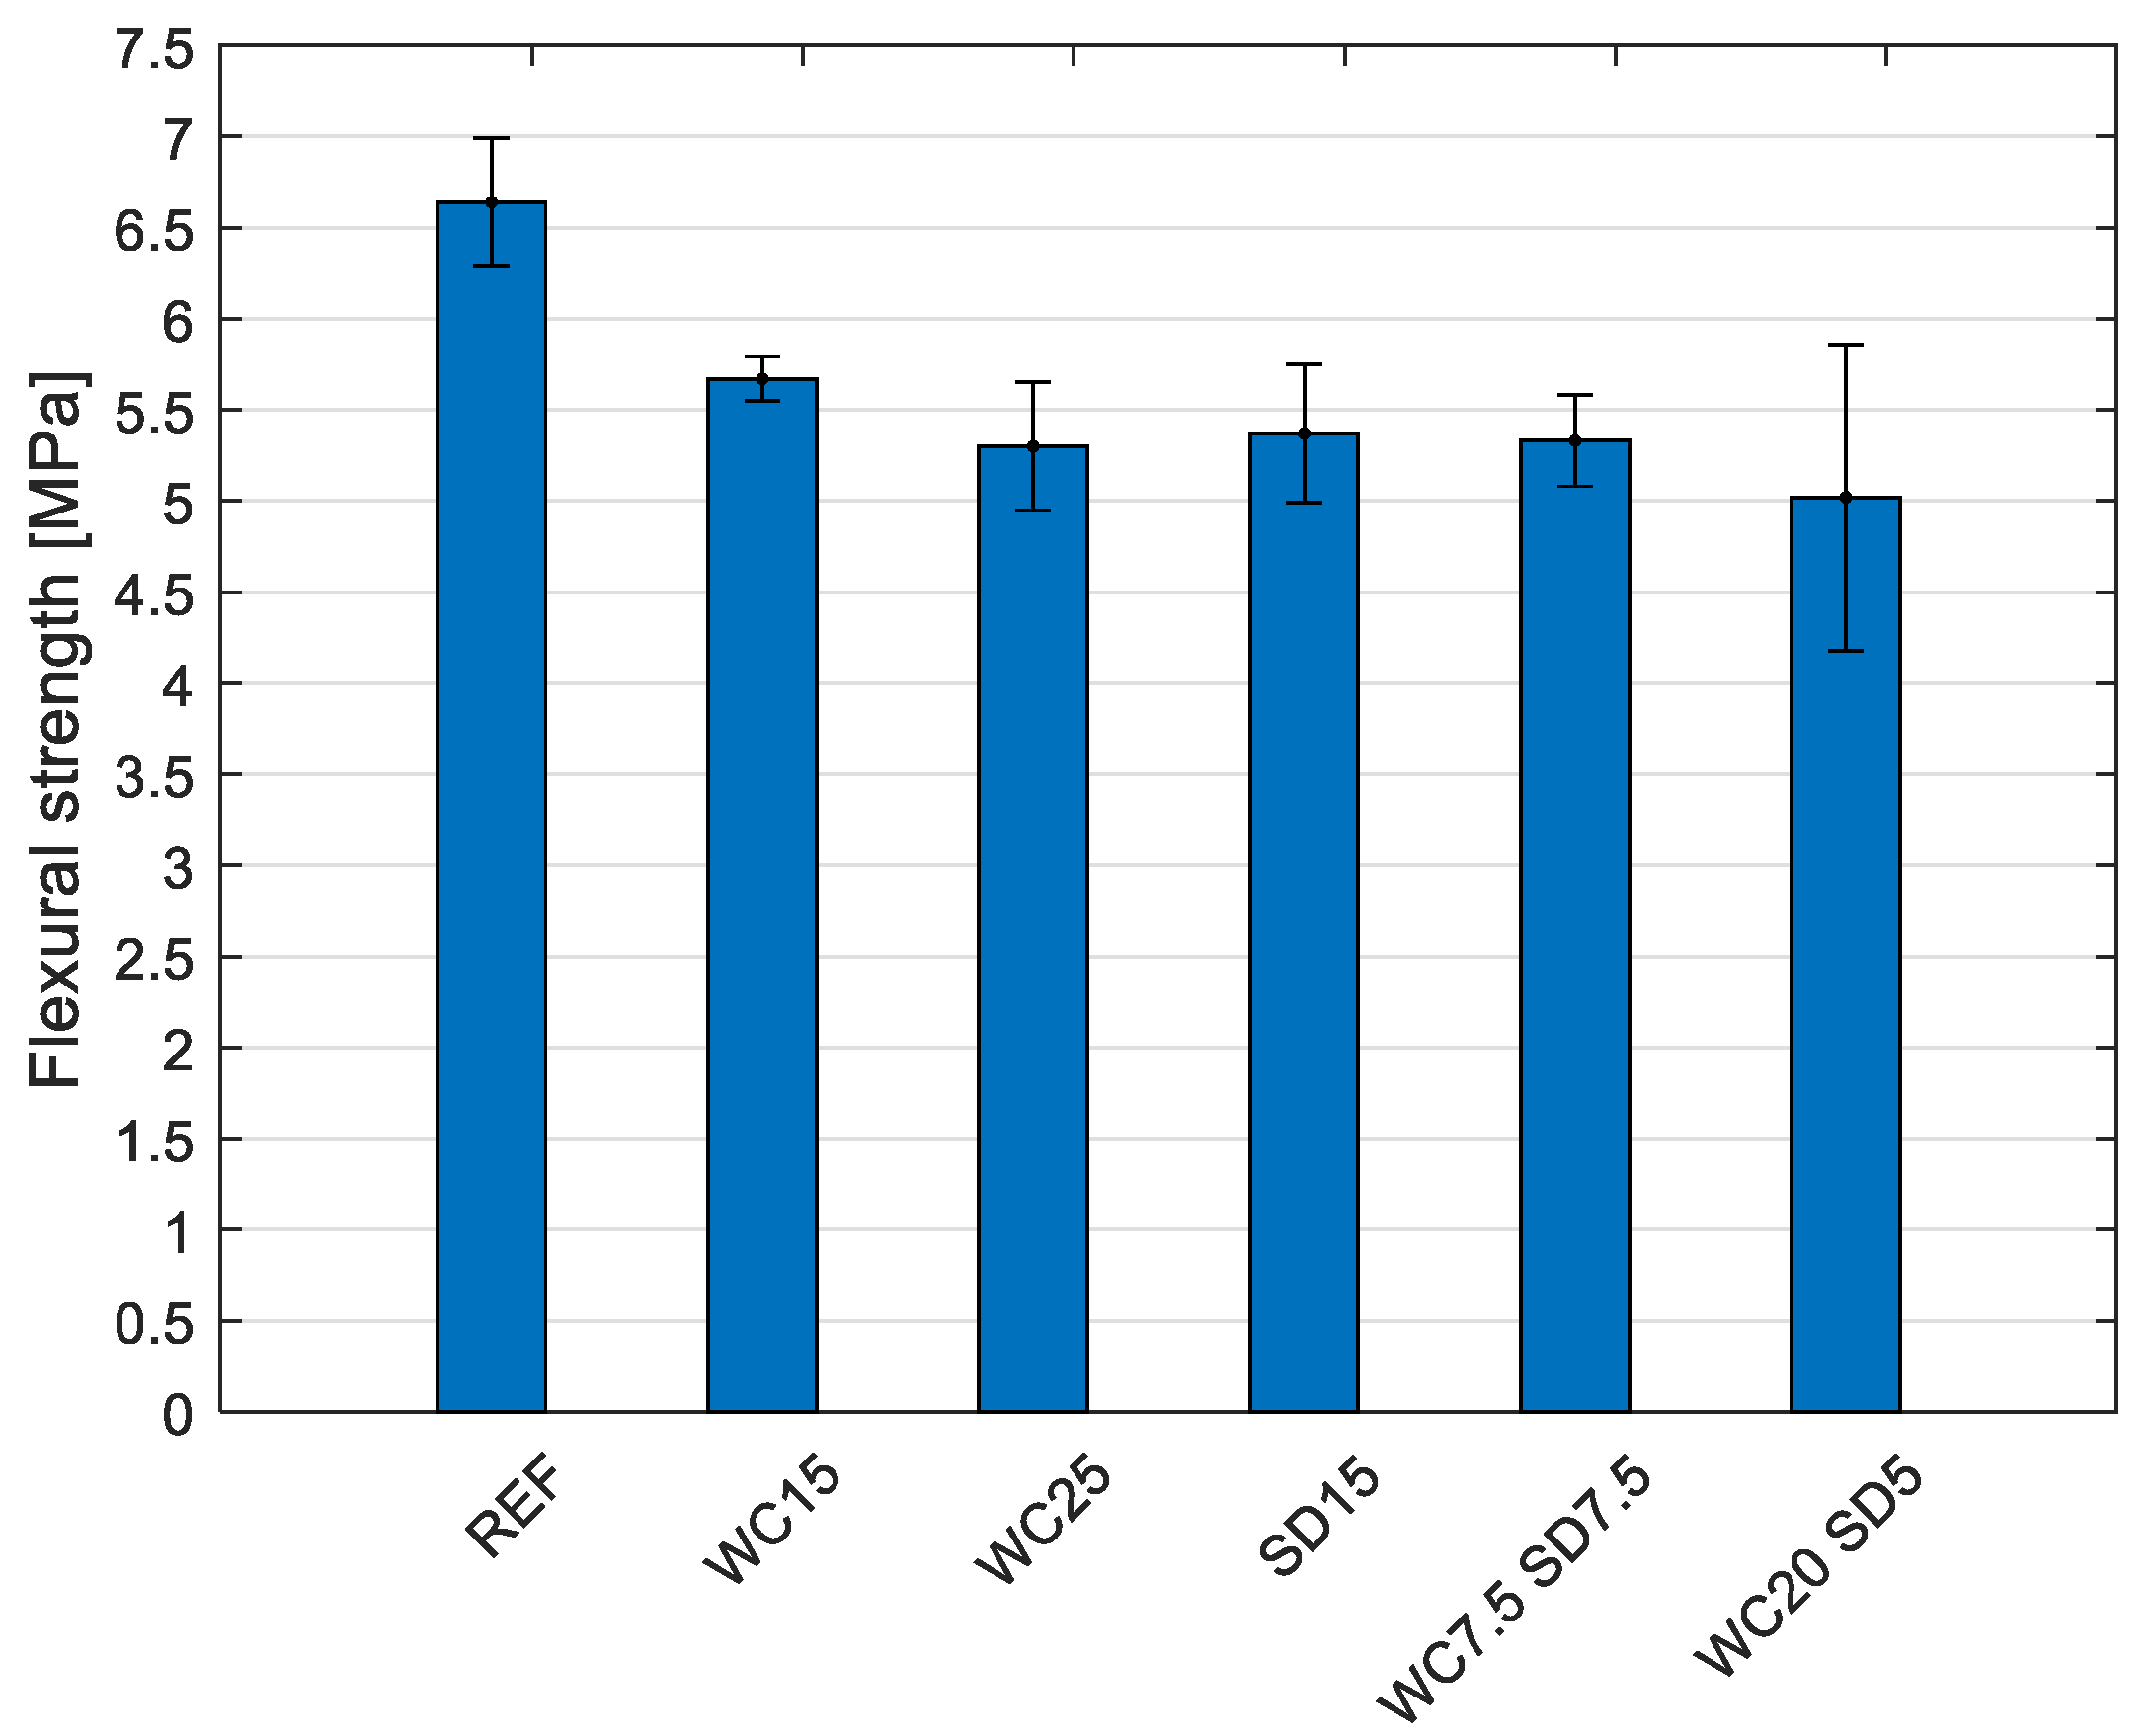
3.1.3. Flexural Strength

The flexural strength results for the six tested compositions are summarized in Figure 12. As expected, a significant strength reduction resulted from incorporating wood particles, with the WC20SD5 having the highest decrease in flexural strength (32% lower than the reference mix).
Following the previously defined criteria (density below 2125 kg/m3, compressive strength above 25 MPa, and maximum volume content of wood), and based on all the results of this section, the two mixes selected to proceed with further characterization were WC25 and WC20SD5, as mentioned before.

3.2. Durability

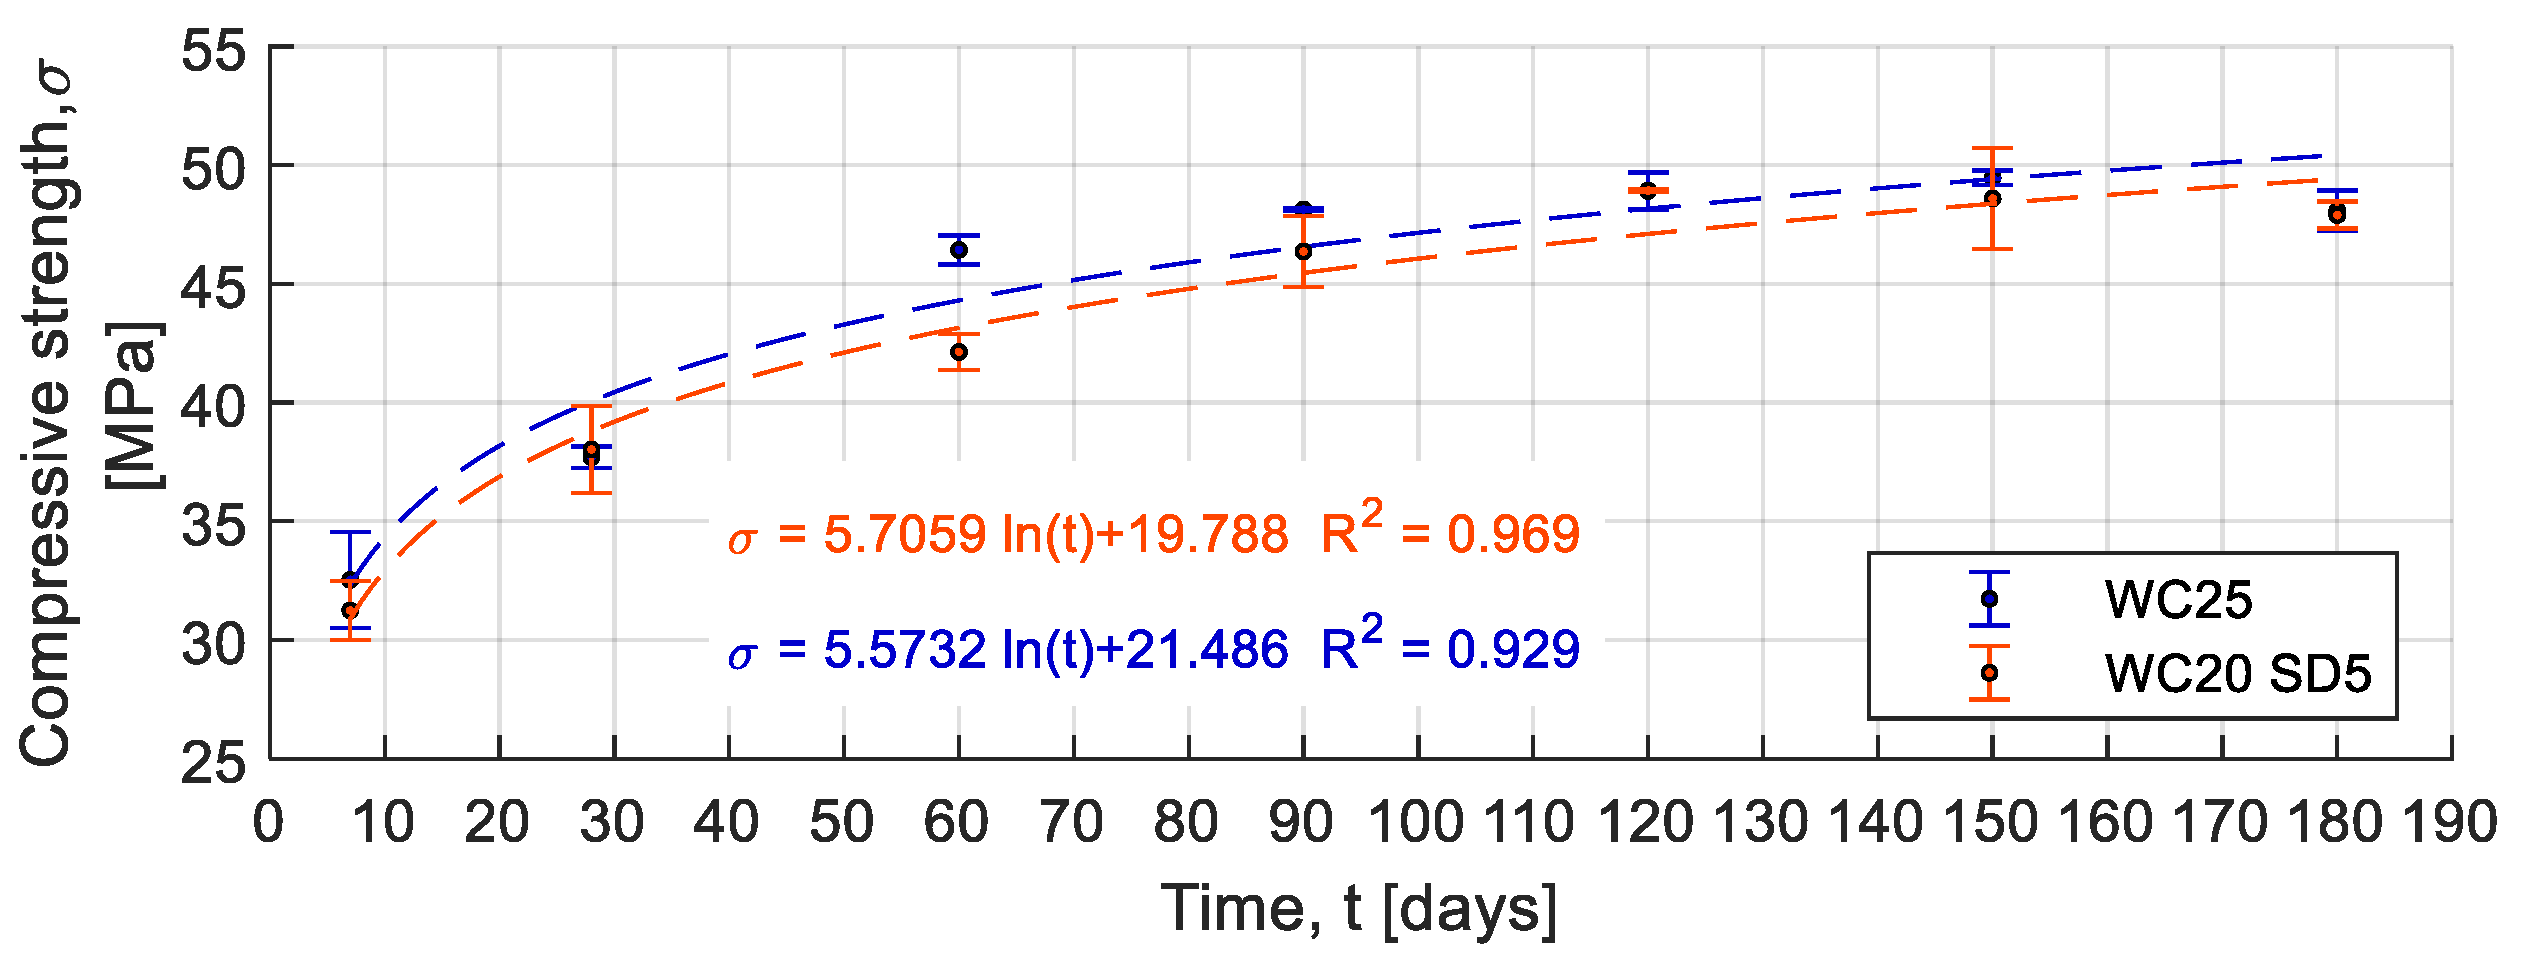
3.2.1. Compressive Strength Development

To help interpret the results of the artificial aging tests and act as an aging control, compressive strength development was evaluated over 180 days for the two selected series. Figure 13 shows compressive strength evolution with age. The results showed that both concretes developed compressive strength up to 120 days. Compressive strength results remained constant after this age and for up to 180 days.

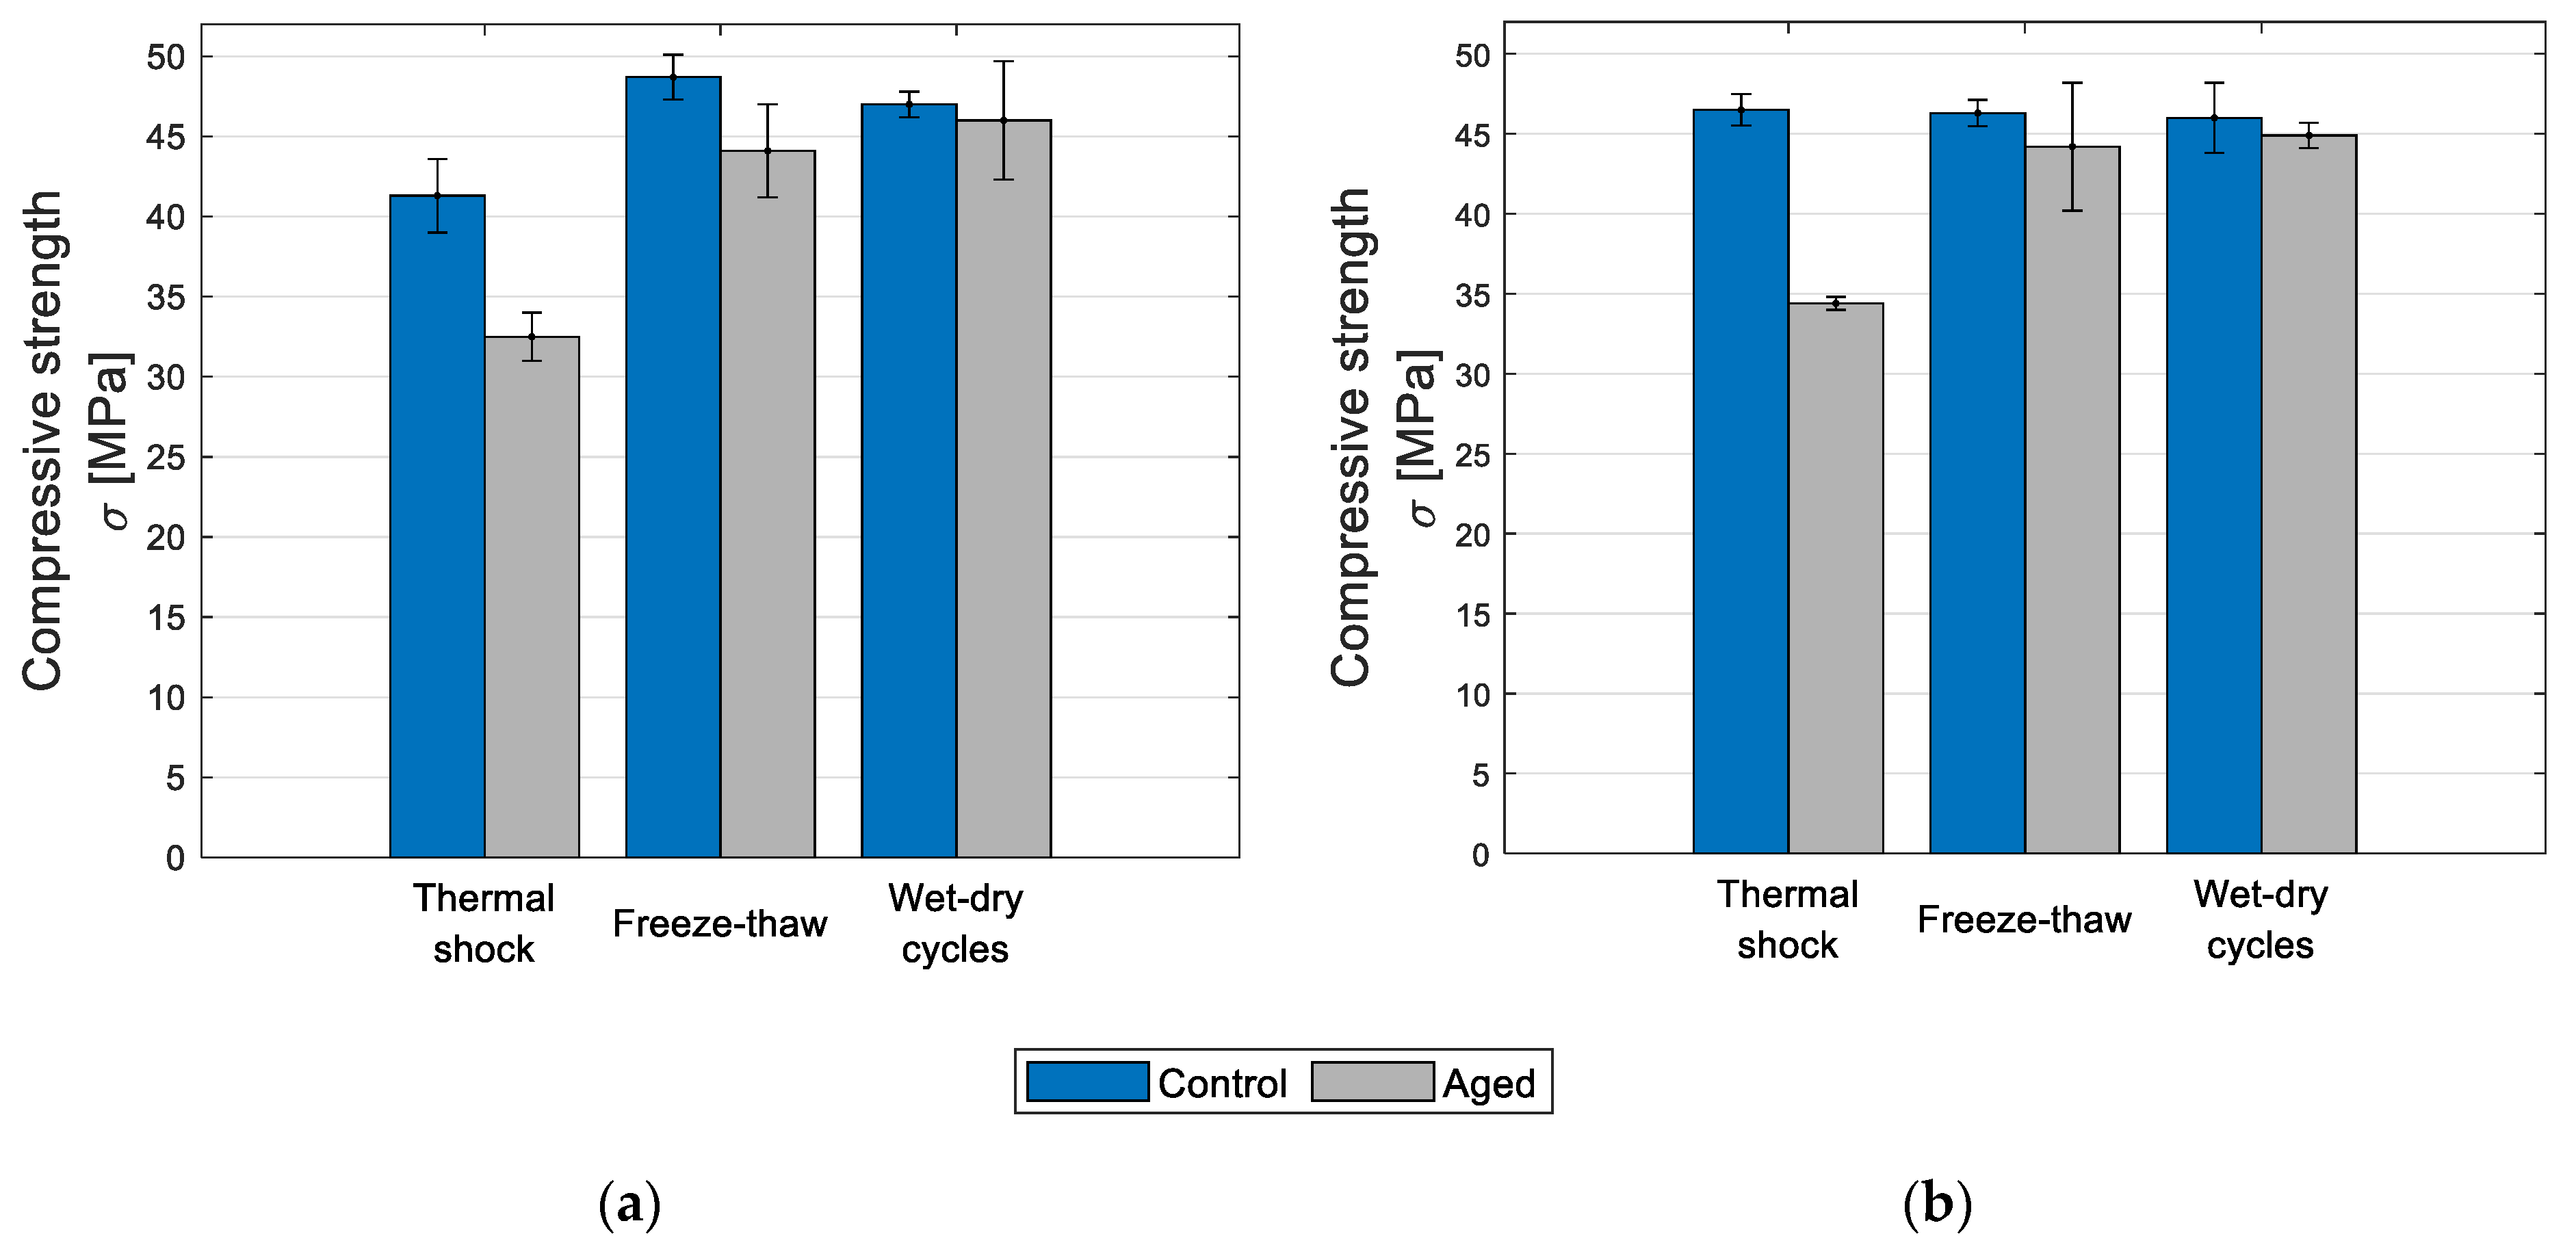
3.2.2. Wetting–Drying, Freeze–Thaw, and Thermal Shock Cycles

As mentioned in the methods section, the results concerning the artificial aging cycles were determined by evaluating the compressive strength after subjecting the test specimens to different accelerated aging cycles and comparing them with samples of the same age but not subjected to any accelerated aging condition. These results are presented in Figure 14.
After being subjected to wet–dry cycles, none of the samples showed any visual damage, such as cracking or material disaggregation (see Figure 15). Moreover, samples of both series performed equally well before and after the wet–dry cycles in terms of compressive strength.
Similar to the wet–dry cycles, none of the specimens from the two series exhibited any visual defect after being subjected to the freeze–thaw cycles. However, a slight reduction in compressive strength was registered for WC20SD5. At the same time, the WC25’s performance fell by 10% compared with the specimens that were tested at the same age but not subjected to the freeze–thaw cycles. Nevertheless, in both cases, the compressive strength after the freeze–thaw cycles was higher than that achieved at the age of 28 days, demonstrating that the compressive strength reduction would not compromise the material’s usability.
There was no visible cracking or damage to the specimens after the thermal shock cycles. However, as expected, a drop in compressive strength was found for both compositions, with WC25 and WC20SD5 falling around 21% and 26%, respectively. In both cases, the compressive strength after the thermal shock cycles was lower than at 28 days. The WC25’s performance was similar to that at 7 days, indicating that the thermal shock cycles significantly affected the composites’ durability performance. Note, however, that the conditions imposed on the specimens in the thermal shock test were very aggressive, with a temperature amplitude of approximately 85 °C. In a real application, the thermal shock is not expected to be as harsh.

3.3. Hygrothermal Behavior

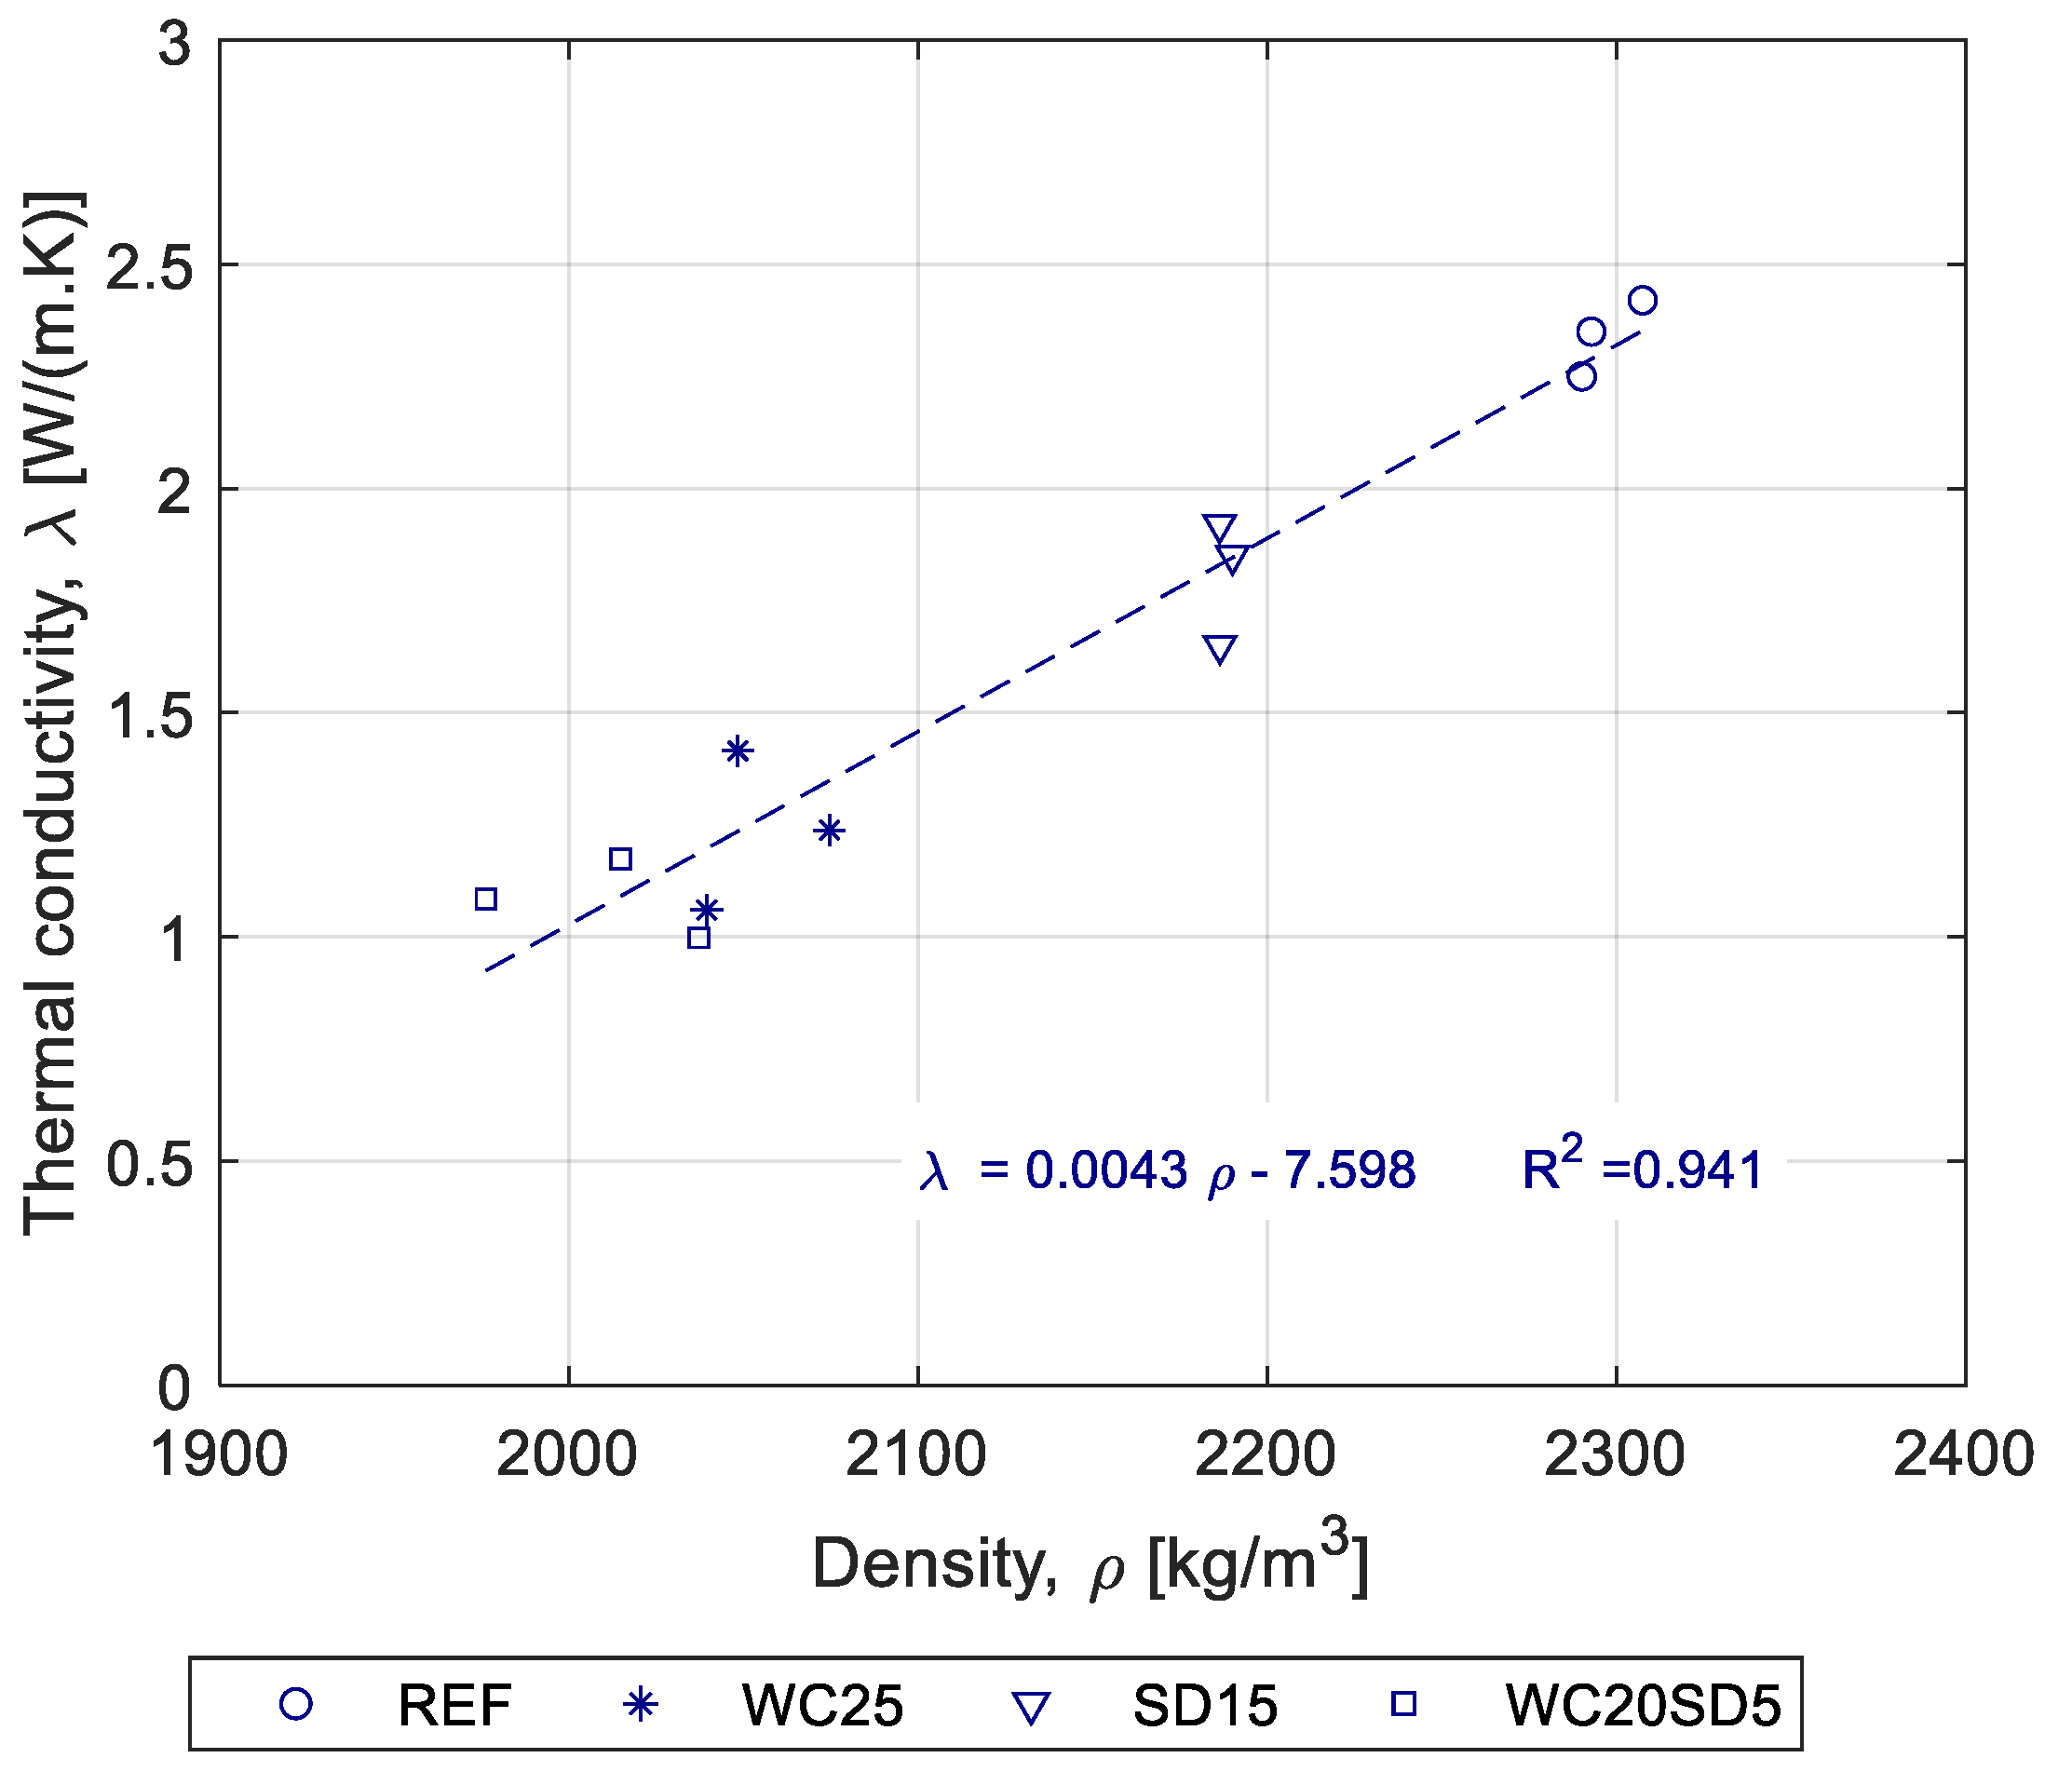
3.3.1. Thermal Conductivity

The results showed a considerable thermal conductivity (λ) decrease for WC20S5 (54%) and WC25 (52%) compared with the reference sample (Figure 16). Additionally, the reduction in thermal conductivity seemed to be linearly related to density. To better assess this relationship, the thermal conductivity was also determined for the SD15 mix and corroborated the previous assumption. A determination coefficient (R2) of 0.941 was found for the set of samples tested. This means that wood chips and sawdust can be used to produce more sustainable concrete with lower weight and lower thermal conductivity.

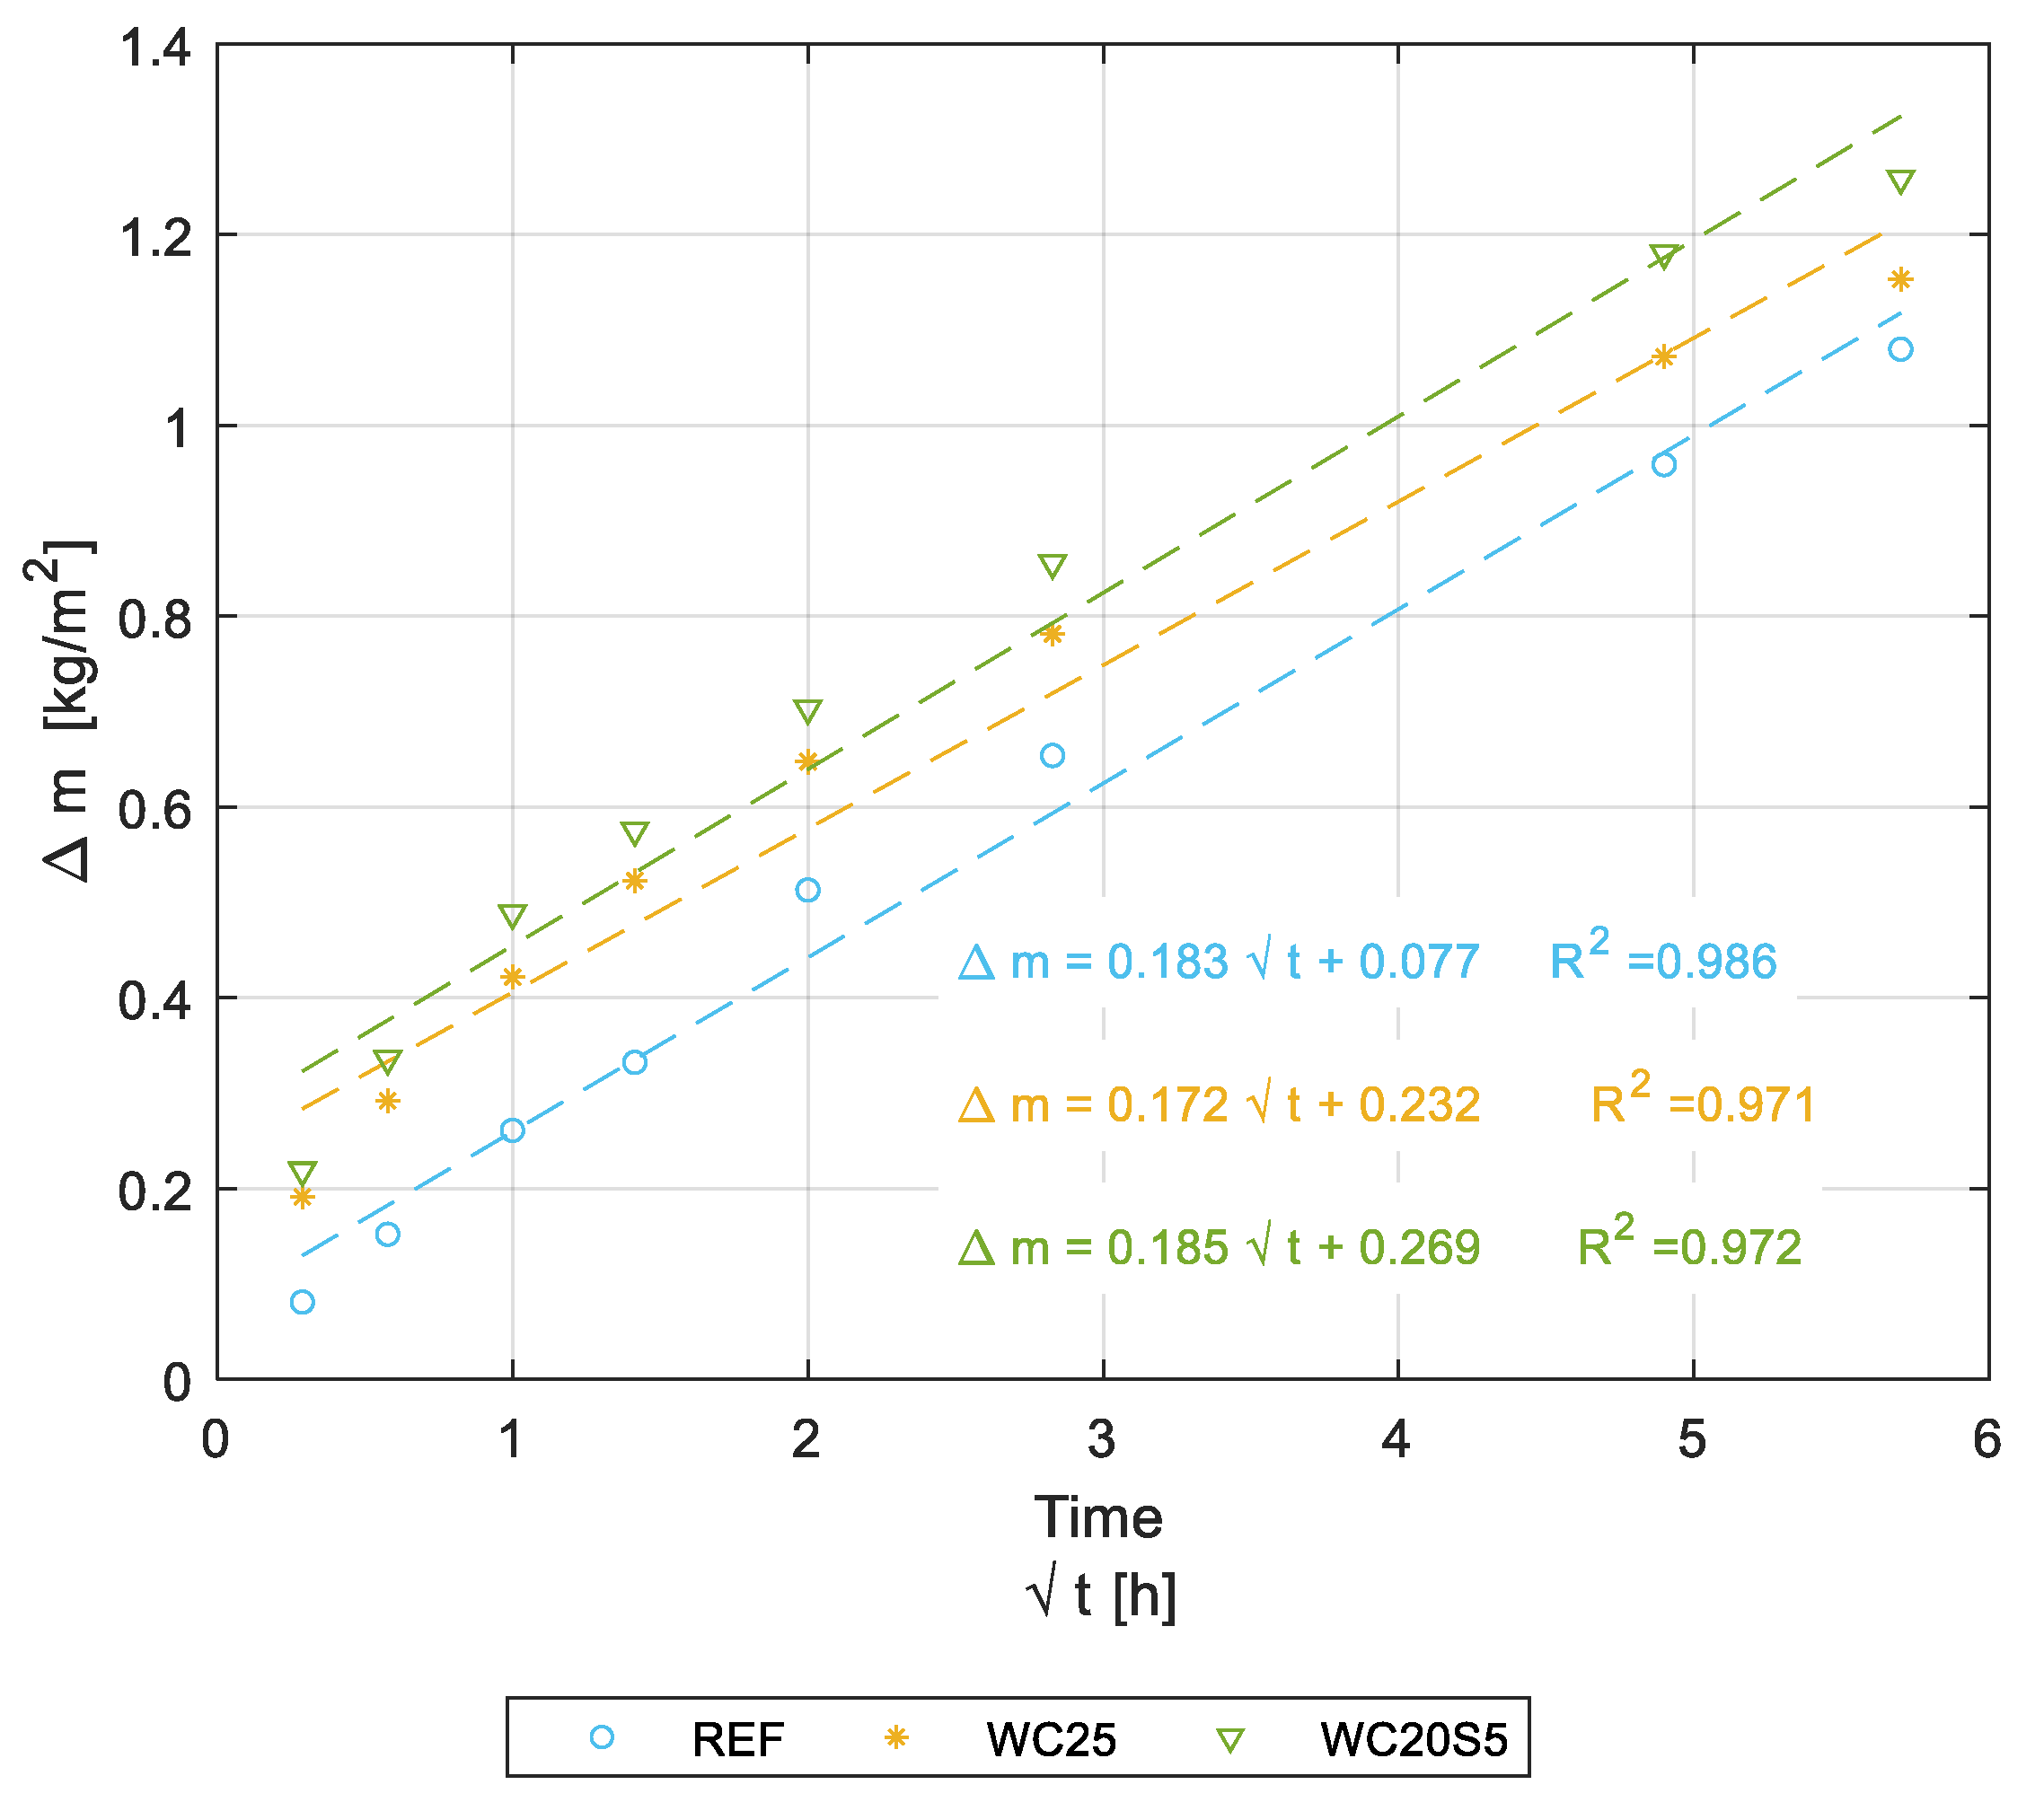
3.3.2. Water Absorption

A high water absorption coefficient means there are chloride ions near the steel reinforcement bars embedded in concrete, which initiate their corrosion, leading to long-term performance and durability concerns with respect to concrete structures [47]. The water absorption coefficient W w , 24 and the total water absorption, both determined after 24 h for each set of specimens, are presented in Table 8.
Mean results over time for each set of three specimens are also represented in Figure 17. The resulting plots follow straight trend lines with correlation coefficients (R2) greater than 0.970. As expected, the compositions with wood recorded greater absorption than the reference one, although the values were quite small.

3.3.3. Shrinkage and Expansion

Shrinkage and expansion results showed that the compositions containing wood particles performed as well as or better than the reference sample. Table 9 shows that the shrinkage did not vary significantly for the three of them and that the expansion behavior of the wood concretes under water was of the same order of magnitude as that of the reference, thus confirming the poor ability of the composites to absorb water. Concrete made with lightweight aggregates exhibited a higher moisture movement (i.e., a higher rate of drying shrinkage) [48].

4. Discussion

This section summarizes the main findings in terms of mechanical, durability, and hygrothermal properties. The results obtained for the selected compositions are further compared with those reported in the literature.

4.1. Mechanical Characterization

Although compressive strength did decline with the amount of wood chips and sawdust, all composites recorded compressive strength above 30 MPa. Compared to the reference sample, the compressive strength reduction of WC containing up to 25 v% wood chips content was found to range from 7% to 33%. The amount of sawdust up to 15 v% seemed to have less impact on compressive strength, which showed a reduction of between 0.9% and 10%. The compressive strength reduction of composites containing a mixture of chips and sawdust ranged from 12% to 41%. Note that compressive strength and modulus of elasticity seemed to be closely related to density, with the denser samples presenting higher values of both properties. The flexural strength also declined by up to 32% with the incorporation of wood particles (25 v%). Optical and electronic microscopy inspection showed similar micro-cracking effects for the reference sample and composites containing wood particles.

4.2. Durability

An aging control test showed that the two selected composites (WC25 and WC20S5) developed compressive strength within 120 days, without loss of strength after that, for up to 180 days. The results for the durability assessment (artificial aging) further showed that the thermal shock affected the compressive strength more than the other aging cycles (wet–dry and freeze–thaw). However, the compressive strength was still higher than 30 MPa for the selected mixes after all the accelerated aging tests.

4.3. Hygrothermal Characterization

Water absorption was very low (approximately 1% at 24 h), suggesting that the wood content did not contribute significantly to water absorption of the hardened material. Additionally, the thermal conductivity dropped by about 50%, comparing the two selected mixes with the reference sample. The incorporation of sawdust seemed to have less impact on the thermal conductivity, which was probably because of the higher compactness of specimens.
A summarized table comparing the results obtained for the selected compositions with those available in the literature is now presented for comparison purposes (Table 10).
Analyzing the results in Table 10, it can be seen that the compressive strength values obtained in this work are higher than those found in the literature for composites integrating wood. In some of the cases presented, the compressive strength is relatively small, even for identical density values.
The flexural tests, commonly used to assess the effect of wood fibers in bending, showed that adding wood chips did not appear to improve the flexural resistance of the composites. This is probably because of the shape of the fibers (not needle shape).
The dynamic Poisson’s ratio and elastic modulus obtained in this work agree with those found in the literature. In most cases, they are higher than those found for mineral concretes.
Regarding the durability of composites of this kind, little information is found in the literature, which suggests that further research needs to be carried out.
As far as the hygrothermal behavior is concerned, it is clear from the literature that adding wood particles to concrete results in a better thermal performance than that of conventional concrete. However, this gain is usually followed by a significant reduction in the mechanical resistance. Water absorption was found to be much less than that found in the literature for composites integrating wood, which is dependent on the density. The denser specimens present less water absorption.

5. Conclusions

Several composites containing different wood chips and sawdust content were developed and tested to evaluate the potential of wood waste to replace conventional mineral aggregates in concrete. The characterization involved an extensive campaign assessing the mechanical performance, durability, and hygrothermal properties. After performing mechanical tests on twelve different composites of varied composition, two were selected based on predefined criteria (density below 2125 kg/m3, compressive strength above 25 MPa, and maximum volume content of wood) for further characterization by assessing the durability performance and hygrothermal properties.
All compositions showed compressive strength above 30 MPa. The durability assessment of selected compositions further showed that compressive strength after relevant artificial aging was still higher than the predefined criteria. Promising hygrothermal properties were also recorded, i.e., approximately 1% of water absorption in 24 h and thermal conductivity up to 54% lower than the reference concrete.
The results obtained suggest, in the opinion of the authors of the paper, that optimized concretes containing up to 20 v% of wood chips and sawdust present physical, mechanical, and durability properties that make them suitable to be used in both structural and non-structural applications, including fence poles, slabs, façade panels, and street furniture.
Possible future research work on the topic could include the study of the bond behavior of concrete, integrating wood waste with steel bars, and the fabrication and test of full-scale constructive building elements using the selected compositions.

Author Contributions

S.D.: investigation, methodology, and writing—original draft. A.T.: conceptualization, methodology, validation, writing—review & editing, and funding acquisition. J.A. (João Almeida): conceptualization, methodology, validation, and writing—original draft. P.H.: investigation, methodology, and writing—original draft. J.A. (Julieta António): conceptualization, methodology, validation, and writing—review & editing. J.d.B.: validation and writing—review & editing. P.P.: investigation. All authors have read and agreed to the published version of the manuscript.

Funding

This research was funded by the Portuguese Foundation for Science and Technology (FCT), under PhD grant PD/BD/150575/2020, as part of the EcoCoRe Programme. It was also supported by the Project PROCK (CENTRO-01-0247-FEDER-039790) funded by the Operational Programme for the Centro Region of Portugal 2020, with the support of the European Regional Development Fund (FEDER).

Institutional Review Board Statement

Not applicable.

Informed Consent Statement

Not applicable.

Data Availability Statement

Not applicable.

Acknowledgments

The authors wish to acknowledge the enterprises Sabril-Sociedade de Areias e Britas, Lda, Secil Group, and Mapei Portugal for kindly providing the materials used in this study, namely mineral aggregates, cement, and adjuvant, respectively.

Conflicts of Interest

The authors declare no conflict of interest.

References

  1. Mantau, U.; Saal, U.; Prins, K.; Steierer, F.; Lindner, M.; Verkerk, H.; Eggers, J.; Leek, N.; Oldenburger, J.; Asikainen, A.; et al. Real Potential for Changes in Growth and Use of EU Forests; Final Report; EuWood: Hamburg, Germany, June 2010; Available online: https://franzjosefadrian.com/wp-content/uploads/2013/06/euwood_final_report.pdf (accessed on 29 November 2021).
  2. Bourguignon, D. Understanding Waste Streams Treatment of Specific Waste. 2015. Available online: https://www.europarl.europa.eu/EPRS/EPRS-Briefing-564398-Understanding-waste-streams-FINAL.pdf (accessed on 29 November 2021).
  3. Mayer, A.; Haas, W.; Wiedenhofer, D.; Krausmann, F.; Nuss, P.; Blengini, G. Measuring progress towards a Circular Economy—A monitoring framework for economy-wide material loop closing in the EU28. J. Ind. Ecol. 2019, 1, 62–76. [Google Scholar] [CrossRef] [Green Version]
  4. Bergeron, F.C. Assessment of the coherence of the Swiss waste wood management. Resour. Conserv. Recycl. 2014, 91, 62–70. [Google Scholar] [CrossRef]
  5. Ashori, A.; Tabarsa, T.; Amosi, F. Evaluation of using waste timber railway sleepers in wood-cement composite materials. Constr. Build. Mater. 2012, 27, 126–129. [Google Scholar] [CrossRef]
  6. Cheah, C.B.; Ramli, M. The implementation of wood waste ash as a partial cement replacement material in the production of structural grade concrete and mortar: An overview. Resour. Conserv. Recycl. 2011, 55, 669–685. [Google Scholar] [CrossRef]
  7. Li, M.; Khelifa, M.; El Ganaoui, M. Mechanical characterization of concrete containing wood shavings as aggregates. Int. J. Sustain. Built Environ. 2017, 6, 587–596. [Google Scholar] [CrossRef]
  8. Siddique, R.; Singh, M.; Mehta, S.; Belarbi, R. Utilization of treated saw dust in concrete as partial replacement of natural sand. J. Clean. Prod. 2020, 261, 121226. [Google Scholar] [CrossRef]
  9. Blankenhorn, P.R.; Blankenhorn, B.D.; Silsbee, M.R.; DiCola, M. Effects of fiber surface treatments on mechanical properties of wood fiber–cement composites. Cem. Concr. Res. 2001, 31, 1049–1055. [Google Scholar] [CrossRef]
  10. Prachasaree, W.; Limkatanyu, S.; Hawa, A. Parawood particle cement composite boards under accelerated wet/dry cycling and natural aging. J. Sustain. Cem. Mater. 2013, 2, 227–237. [Google Scholar] [CrossRef]
  11. Dias, S.; Almeida, J.; Santos, B.; Humbert, P.; Tadeu, A.; António, J.; de Brito, J.; Pinhão, P. Lightweight cement composites containing end-of-life treated wood—Leaching, hydration and mechanical tests. Constr. Build. Mater. 2021, 317, 125931. [Google Scholar] [CrossRef]
  12. Schmidt, W.; Alexander, M.; John, V.M. Education for sustainable use of cement based materials. Cem. Concr. Res. 2018, 114, 103–114. [Google Scholar] [CrossRef]
  13. Chen, Y.; Wu, F.; Yu, Q.; Brouwers, H.J.H. Bio-based ultra-lightweight concrete applying miscanthus fibers: Acoustic absorption and thermal insulation. Cem. Concr. Compos. 2020, 114, 103829. [Google Scholar] [CrossRef]
  14. Zwicky, D. Mechanical properties of organic-based lightweight concretes and their impact on economic and ecological performances. Constr. Build. Mater. 2020, 245, 118413. [Google Scholar] [CrossRef]
  15. Caldas, L.R.; Saraiva, A.B.; Lucena, A.F.; Da Gloria, M.Y.; Santos, A.S.; Filho, R.D.T. Building materials in a circular economy: The case of wood waste as CO2-sink in bio concrete. Resour. Conserv. Recycl. 2020, 166, 105346. [Google Scholar] [CrossRef]
  16. Bederina, M.; Marmoret, L.; Mezreb, K.; Khenfer, M.; Bali, A.; Quéneudec, M. Effect of the addition of wood shavings on thermal conductivity of sand concretes: Experimental study and modelling. Constr. Build. Mater. 2007, 21, 662–668. [Google Scholar] [CrossRef]
  17. Zwicky, D. Mechanical properties of wood-cement compounds. In Proceedings of the 10th Conference on Advanced Building Skins, Berne, Switzerland, November 2015; Available online: https://www.researchgate.net/publication/283730309 (accessed on 1 March 2022).
  18. Fu, Q.; Yan, L.; Ning, T.; Wang, B.; Kasal, B. Interfacial bond behavior between wood chip concrete and engineered timber glued by various adhesives. Constr. Build. Mater. 2019, 238, 117743. [Google Scholar] [CrossRef]
  19. Fadiel, A.A.; Abu-Lebdeh, T.; Petrescu, F.I.T. Assessment of Woodcrete Using Destructive and Non-Destructive Test Methods. Materials 2022, 15, 3066. [Google Scholar] [CrossRef]
  20. Fadiel, A.A.M.; Abu-Lebdeh, T. Mechanical Properties of Concrete Including Wood Shavings as Fine Aggregates. Am. J. Eng. Appl. Sci. 2021, 14, 478–487. [Google Scholar] [CrossRef]
  21. Dominguez-Santos, D.; Mora-Melia, D.; Pincheira-Orellana, G.; Ballesteros-Pérez, P.; Retamal-Bravo, C. Mechanical Properties and Seismic Performance of Wood-Concrete Composite Blocks for Building Construction. Materials 2019, 12, 1500. [Google Scholar] [CrossRef] [Green Version]
  22. Batool, F.; Islam, K.; Cakiroglu, C.; Shahriar, A. Effectiveness of wood waste sawdust to produce medium- to low-strength concrete materials. J. Build. Eng. 2021, 44, 103237. [Google Scholar] [CrossRef]
  23. Fu, Q.; Yan, L.; Ning, T.; Wang, B.; Kasal, B. Behavior of adhesively bonded engineered wood—Wood chip concrete composite decks: Experimental and analytical studies. Constr. Build. Mater. 2020, 247, 118578. [Google Scholar] [CrossRef]
  24. Ahmed, W.; Khushnood, R.A.; Memon, S.A.; Ahmad, S.; Baloch, W.L.; Usman, M. Effective use of sawdust for the production of eco-friendly and thermal-energy efficient normal weight and lightweight concretes with tailored fracture properties. J. Clean. Prod. 2018, 184, 1016–1027. [Google Scholar] [CrossRef]
  25. Hafidh, S.A.; Abdullah, T.A.; Hashim, F.G.; Mohmoud, B.K. Effect of Adding Sawdust to Cement on its Thermal Conductivity and Compressive Strength. IOP Conf. Ser. Mater. Sci. Eng. 2021, 1094, 012047. [Google Scholar] [CrossRef]
  26. Sosoi, G.; Abid, C.; Barbuta, M.; Burlacu, A.; Balan, M.C.; Branoaea, M.; Vizitiu, R.S.; Rigollet, F. Experimental Investigation on Mechanical and Thermal Properties of Concrete Using Waste Materials as an Aggregate Substitution. Materials 2022, 15, 1728. [Google Scholar] [CrossRef] [PubMed]
  27. EN 933-1; Tests for Geometrical Properties of Aggregates. Determination of Particle Size Distribution. Sieving Method. European Committee for Standardization: Brussels, Belgium, 2012.
  28. EN 1097-6; Tests for Mechanical and Physical Properties of Aggregates. Determination of Particle Density and Water Absorption. European Committee for Standardization: Brussels, Belgium, 2013.
  29. EN 1097-5; Tests for Mechanical and Physical Properties of Aggregates-Determination of the Water Content by Drying in a Ventilated Oven. European Committee for Standardization: Brussels, Belgium, 2008.
  30. ACI Committee 318; ACI CODE 318-08: Building Code Requirements for Structural Concrete and Commentary. American Concrete Institute: Farmington Hills, MI, USA, 2007; ISBN 9780870312649.
  31. EN 12390-3; Testing Hardened Concrete—Part 3: Compressive Strength of Test Specimens. European Committee for Standardization: Brussels, Belgium, 2019.
  32. EN 12371; Natural Stone Test Methods. Determination of Frost Resistance. European Committee for Standardization: Brussels, Belgium, 2010.
  33. EN 1602; Thermal Insulating Products for Building Applications-Determination of the Apparent Density. European Committee for Standardization: Brussels, Belgium, 2013.
  34. Nogueira, C.L.; Rens, K.L. Ultrasonic wave propagation in EPS lightweight concrete and effective elastic properties. Constr. Build. Mater. 2018, 184, 634–642. [Google Scholar] [CrossRef]
  35. Jalal, M.; Grasley, Z.; Nassir, N.; Jalal, H. Strength and dynamic elasticity modulus of rubberized concrete designed with ANFIS modeling and ultrasonic technique. Constr. Build. Mater. 2020, 240, 117920. [Google Scholar] [CrossRef]
  36. EN ISO 10545–9; Ceramic Tiles—Part 9: Determination of Resistance to Thermal Shock. European Committee for Standardization: Brussels, Belgium, 2013.
  37. ISO 8302; Thermal Insulation—Determination of Steady-State Thermal Resistance and Related Properties—Guarded Hot Plate Apparatus. International Organization for Standardization: Geneva, Switzerland, 1991.
  38. EN 12664; Thermal Performance of Building Materials and Products—Determination of Thermal Resistance by Means of Guarded Hot Plate and Heat Flow Meter Methods—Dry and Moist Products of Medium and Low Thermal Resistance. European Committee for Standardization: Brussels, Belgium, 2001.
  39. EN ISO 15148; Hygrothermal performance of building materials and products—Determination of water absorption coefficient by partial immersion. European Committee for Standardization: Brussels, Belgium, 2002.
  40. E 398-1993; Betões—Determinação da Retracção e da Expansão. Laboratório Nacional de Engenharia Civil: Lisbon, Portugal, 1993; ISSN 0870-8592.
  41. Morales-Conde, M.; Rodríguez-Liñán, C.; Rojas, M.A.P. Physical and mechanical properties of wood-gypsum composites from demolition material in rehabilitation works. Constr. Build. Mater. 2016, 114, 6–14. [Google Scholar] [CrossRef]
  42. Beltran, M.G.S.; Schlangen, E. Interface bond characteristics between wood fibres and a cement matrix. In Brittle Matrix Composites 9, BMC 2009; Brandt, A.M., Olek, J., Marshall, I.H., Eds.; Warsaw, IFTR and Woodhead Publish: Warsaw, Poland, 2009; pp. 43–51. [Google Scholar] [CrossRef]
  43. EN 1992-1-1:2004 + AC:2008 Pt; Eurocode 2—Design of Concrete Structures—Part 1-1: General Rules and Rules for Buildings. European Committee for Standardization: Brussels, Belgium, 2004.
  44. Pal, P. Dynamic Poisson’s Ratio and Modulus of Elasticity of Pozzolana Portland Cement Concrete. Int. J. Eng. Technol. Innov. 2019, 9, 13–14. Available online: https://www.researchgate.net/publication/331868482 (accessed on 5 August 2022).
  45. Chen, B.T.; Chang, T.-P. Determining Dynamic Poisson’s Ratio in Concrete Based on Lateral Impact Echo Information. 2010. Available online: https://www.researchgate.net/publication/280239680 (accessed on 5 August 2022).
  46. Zhang, J.J.; Bentley, L.; Bentley, L.R. Factors Determining Poisson’s Ratio. 2005. Available online: https://www.researchgate.net/publication/265451756 (accessed on 5 August 2022).
  47. Zhang, S.P.; Zong, L. Evaluation of Relationship between Water Absorption and Durability of Concrete Materials. Adv. Mater. Sci. Eng. 2014, 2014, 650373. [Google Scholar] [CrossRef] [Green Version]
  48. Mehta, P.K.; Monteiro, P.J.M. Concrete, Microstructure, Properties and Materials, 3rd ed.; McGraw-Hill Education: New York, NY, USA, 2006. [Google Scholar]
  49. Carrillo, J.; Ramirez, J.; Lizarazo-Marriaga, J. Modulus of elasticity and Poisson’s ratio of fiber-reinforced concrete in Colombia from ultrasonic pulse velocities. J. Build. Eng. 2019, 23, 18–26. [Google Scholar] [CrossRef]
  50. Hassan, A.M.T.; Jones, S.W. Non-destructive testing of ultra high performance fibre reinforced concrete (UHPFRC): A feasibility study for using ultrasonic and resonant frequency testing techniques. Constr. Build. Mater. 2012, 35, 361–367. [Google Scholar] [CrossRef]
Figure 1. Particle size distribution of the mineral aggregates.
Buildings 12 01277 g001
Figure 2. Wood aggregates: (a) wood chips (WC); (b) sawdust (SD).
Buildings 12 01277 g002
Figure 3. Particle size distribution of wood chips (WC) and sawdust (SD).
Buildings 12 01277 g003
Figure 4. Mechanical characterization tests: (a) compressive strength; (b) dynamic modulus of elasticity; (c) flexural strength.
Buildings 12 01277 g004
Figure 5. Compressive strength of the wood–concrete samples, mean values, and standard deviation at 7 days and 28 days.
Buildings 12 01277 g005
Figure 6. Mean values of compressive strength vs. wood percentage incorporated.
Buildings 12 01277 g006
Figure 7. Stereoscopic micrographs, indicating some of the mineral aggregates (i) and wood particles (ii) embedded in the cement matrix: (a) REF; (b) WC25; (c) WC20S5.
Buildings 12 01277 g007
Figure 8. SEM micrographs with and without evidence of micro-cracking in the interface between aggregates and cement matrix in the right and left column, respectively: (a) REF; (b) WC25; (c) WC20S5.
Buildings 12 01277 g008
Figure 9. Modulus of elasticity of the wood–concrete samples (mean values ± standard deviation) at 7 days and 28 days.
Buildings 12 01277 g009
Figure 10. Variation in the compressive strength and modulus of elasticity with density.
Buildings 12 01277 g010
Figure 11. Variation of the modulus of elasticity with compressive strength.
Buildings 12 01277 g011
Figure 12. Flexural strength (mean values ± standard deviation) for the wood–concrete samples at 28 days.
Buildings 12 01277 g012
Figure 13. Compressive strength development over time (mean ± standard deviation).
Buildings 12 01277 g013
Figure 14. Artificial aging cycles: (a) WC25; (b) WC20SD5.
Buildings 12 01277 g014
Figure 15. Test specimens after being subjected to wet–dry cycles: (a) WC25; (b) WC20S5.
Buildings 12 01277 g015
Figure 16. Relationship between thermal conductivity and density.
Buildings 12 01277 g016
Figure 17. Mass gain per face area over time.
Buildings 12 01277 g017
Table 1. Published studies on the replacement of aggregate by wood particles.
ReferenceYearComposites Type
[7]2017Sand concrete with a wood-to-cement weight ratio of 1 23 (w/c = 0.26, Portland cement type II A-L 42.5 R).
[16]2007Sand concrete incorporating wood shavings with proportions varying from 0 to 100 kg/m3.
[17]2015Wood cement compounds based on sawdust and mineralized wood fiber. Different binders were used (standard Portland cement CEM I 52.5, CEM II 42.5 N, and aluminate cement), different wood/cement ratios were considered (0.33 and 0.2) as well as different w/c ratios (0.35 to 0.56).
[18]2020Concrete with replacement of 15% in volume of coarse aggregates by wood chip (w/c = 0.598, Portland cement CEMII/B–S 42.5 R).
[19]2022Concrete with replacement varying from 0 to 50% of sand by wood chip (w/c = 0.50, Portland cement type I 42.5 N).
[20]2021Sand concrete with replacement varying from 0 to 50% of sand by wood chip (w/c = 0.49, Portland cement type I 42.5 N).
[21]2019Concrete blocks with replacement varying from 0 to 40% of gravel by wood chip (w/c = 0.41).
[22]2021Concrete with replacement varying from 0 to 60% of sand by sawdust while coarse aggregates remain unchanged (w/c = 0.45, Portland cement type II/B-M).
[23]2020Concrete with replacement of 15% of coarse aggregates by wood chip (w/c = 0.598, Portland cement type II/B-S 42.5 R).
[24]2018Concrete with replacement of varying from 0 to 15% of sand by sawdust while coarse aggregates remain unchanged (w/c = 0.50, Portland cement type I).
[25]2021Sand concrete with replacement of varying from 0 to 30% of sand by sawdust (Portland cement type II of class 45).
[26]2022Concrete with replacement of cement by fly ash (varying from 0 to 20%), of sand by sawdust (10 and 40%), PET (0 to 60%), or polystyrene (0 and 20%) (w/c = 0.5, Portland cement type II 42.5 R).
Table 2. Physical properties of the mineral aggregates.
AggregatesS0/4G0/5G1
Particle density (kg/m3)Oven dry2640 ± 302620 ± 52620 ± 20
Saturated surface dry2650 ± 202630 ± 102630 ± 15
Nominal maximum size (mm)8 ± 010 ± 016 ± 0
24 h water absorption (%)0.1 ± 0.00.4 ± 0.00.3 ± 0.0
Water content (%)1.6 ± 0.20.1 ± 0.00.1 ± 0.0
Table 3. Physical properties of the wood aggregates.
AggregatesParticle Density (kg/m3)Nominal Maximum Size (mm)24 h Water Absorption (%)Free Surface Water (%)
Oven DrySaturated Surface Dry
Wood chips410 ± 201090 ± 3516 ± 0200 ± 1233 ± 5
Sawdust340 ± 151110 ± 604 ± 0411 ± 59190 ± 24
Table 4. Concrete compositions containing Sand 0/4 (S0/4), Gravel 0/5 (G0/5), Gravel 1 (G1), wood chips (WC), sawdust (SD), and superplasticizer (SP).
SeriesCompositions (kg/m3)
CementS0/4G0/5G1WCSDAdded waterSP
REF400690467674--162-
WC540062644467043-1332
WC1040056242166586-1052
WC15400498397661128-763
WC20400434374657171-484
WC25400370351653214-195
SD5400598467674-601133
SD10400507467674-121654
SD15400415467674-181165
WC7.5SD7.5 4004574326676490464
WC12.5SD7.540039340966310790185
WC20SD54003423746571716005
Table 5. Experimental program.
SectionPropertyCuring/ConditioningTestSeries
MechanicalCompressive strengthCuring in water tankCompressive strengthall
Poisson’s ratio and modulus of elasticityCuring in water tankPoisson’s ratio and modulus of elasticity all
Flexural strengthCuring in water tankFlexural strengthREF
WC15
WC25
SD15
WC7.5SD7.5
WC20SD5
DurabilityCompressive strength development over time (for comparison purposes)Curing in water tankCompressive strengthWC25
WC20SD5
Wet–dry cyclesCuring in water tank followed by wetting–drying cyclesCompressive strengthWC25
WC20SD5
Freeze–thaw cyclesCuring in water tank followed by freeze–thaw cyclesCompressive strengthWC25
WC20SD5
Thermal shockCuring in water tank followed by thermal shockCompressive strengthWC25
WC20SD5
HygrothermalThermal conductivityCuring in water tank followed by conditioning at ambient conditionsThe guarded hot plate methodREF
SD15
WC25
WC20SD5
Shrinkage and expansionShrinkage: curing in climatic chamber
Expansion: curing in water tank
Shrinkage and expansionREF
WC25
WC20SD5
Water absorptionCuring in water tank followed by conditioning at ambient conditionsWater absorption coefficientREF
WC25
WC20SD5
Table 6. Compressive strength (mean ± standard deviation) at 7 and 28 days.
SeriesDensity (kg/m3)Compressive Strength (MPa)
28 d7 d28 d
REF2303 ± 1857.97 ± 0.4264.27 ± 4.00
WC52248 ± 655.53 ± 1.5359.90 ± 3.81
WC102201 ± 249.30 ± 1.3557.67 ± 1.72
WC152170 ± 246.37 ± 1.6051.97± 4.12
WC202082 ± 939.60 ± 2.6146.10 ± 1.65
WC252050 ± 1534.80 ± 3.1442.83 ± 1.21
SD52266 ± 3357.30 ± 1.1563.67 ± 3.20
SD102229 ± 1451.10 ± 0.9558.97 ± 1.76
SD152197 ± 2450.37 ± 2.0857.90 ± 1.71
WC7.5SD7.52223 ± 1550.87 ± 0.4556.47 ± 2.61
WC12.5SD7.52130 ± 242.30 ± 0.5049.03 ± 1.50
WC20SD52057 ± 1231.60 ± 1.2137.73 ± 1.08
Table 7. Dynamic elastic properties (mean ± standard deviation).
SeriesDynamic Modulus of Elasticity
(GPa)
Poisson’s Ratio
7 d28 d28 d
REF37.59 ± 0.0239.01 ± 0.340.32 ± 0.01
WC536.89 ± 0.3738.18 ± 0.730.34 ± 0.01
WC1037.40 ± 0.3938.03 ± 0.010.33 ± 0.00
WC1536.11 ± 0.7637.36 ± 0.160.34 ± 0.03
WC2030.94 ± 1.3932.11 ± 1.490.32 ± 0.02
WC2529.18 ± 2.5731.55 ± 1.270.30 ± 0.03
SD538.17 ± 0.3038.53 ± 0.020.33 ± 0.01
SD1036.63 ± 0.6536.57 ± 0.300.33 ± 0.01
SD1535.25 ± 0.2935.95 ± 0.370.34 ± 0.00
WC7.5SD7.534.76 ± 0.2134.46 ± 0.120.34 ± 0.00
WC12.5SD7.534.54 ± 0.0533.53 ± 1.480.32 ± 0.02
WC20SD530.11 ± 0.3831.55 ± 0.900.29 ± 0.03
Table 8. Water absorption coefficient at 24 h.
SeriesWw24
[kg/(m2⋅h0,5)]
Total Water Absorption
(%)
REF0.18 ± 0.030.9 ± 0.1
WC250.18 ± 0.021.0 ± 0.1
WC20SD50.19 ± 0.021.1 ± 0.1
Table 9. Mean results of shrinkage and expansion.
SeriesShrinkage (10−4)Expansion (10−5)
REF4.45 ± 0.337.0 ± 1.6
WC252.65 ± 1.671.9 ± 2.0
WC20SD54.44 ± 0.221.9 ± 1.8
Table 10. Results obtained for the selected compositions compared with those in the literature.
PropertyWC25WC20SD5Reported Values from the Literature
Physical and MechanicalCompressive strength at 28 d
(MPa)
42.83 ± 1.21 37.73 ± 1.08 7.9 ± 0.66 [19]
7.3 [20]
≈11 [21]
≈7 [22]
25.8 ± 3.79 [23]
≈34 [24]
Density
(kg/m3)
2050 ± 15 2057 ± 12 764.06 ± 36.35 [7]
1706 ± 1.55 [19]
2217 [22]
2200 [23]
2173 [24]
2408.4 [44] (a)
2307 [49] (b)
Poisson’s ratio0.30 ± 0.030.29 ± 0.030.296 [44] (a)
0.11 [49] (b)
0.241 [50] (c)
Modulus of elasticity
(GPa)
31.55 ± 1.2731.55 ± 0.90≈12 [19]
31.44 [35] (d)
23.98 [44] (a)
48.25 [50] (c)
Flexural strength
(MPa)
5.3 ± 0.35 5.02 ± 0.842.5 [7]
1.8 [20]
≈2 [22]
Durability
(loss of compressive strength)
Wet–dry cycles (%)22-
Freeze–thaw cycles (%)95-
Thermal shock (%)2126-
HygrothermalThermal conductivity
[W/(m·k)]
1.24 ± 0.18 1.09 ± 0.092.00 [24]
0.8 [25]
0.89 [26]
1.05 [26]
Shrinkage 2.65 ± 1.67 (10−4)4.44 ± 0.22 (10−4)-
Expansion1.9 ± 2.0 (10−5)1.9 ± 1.8 (10−5)-
Water absorption
at 24 h (%)
1.0 ± 0.1 (%)1.1 ± 0.1 (%)29.7 ± 4.54 [7]
15.1 [19]
17.6 [20]
3.62 [24]
(a) Mineral concrete (w/c = 0.55, pozzolana Portland cement). (b) Polyethylene fiber-reinforced concrete (9 kg/m3 of fiber content). (c) High-performance fiber-reinforced concrete—2% of steel fiber volume (w/c = 0.28, Portland cement type I 52.5 N). (d) Concrete with replacement of 15% of cement by rubber (w/c = 0.40).
Publisher’s Note: MDPI stays neutral with regard to jurisdictional claims in published maps and institutional affiliations.

