
Prioritizing Green Building Attributes on Conventional Office Building Rental Depreciation Using Analytic Hierarchy Process (AHP)

 ,
,  ,
,  ,
, 
Abstract
:1. Introduction
2. Literature Review
2.1. Green Building and Rental Depreciation
2.2. Benefits of Green Buildings: Rental and Occupancy Premium
2.3. Attributes of Green Buildings Affecting Rental Depreciation
2.4. Positioning This Study
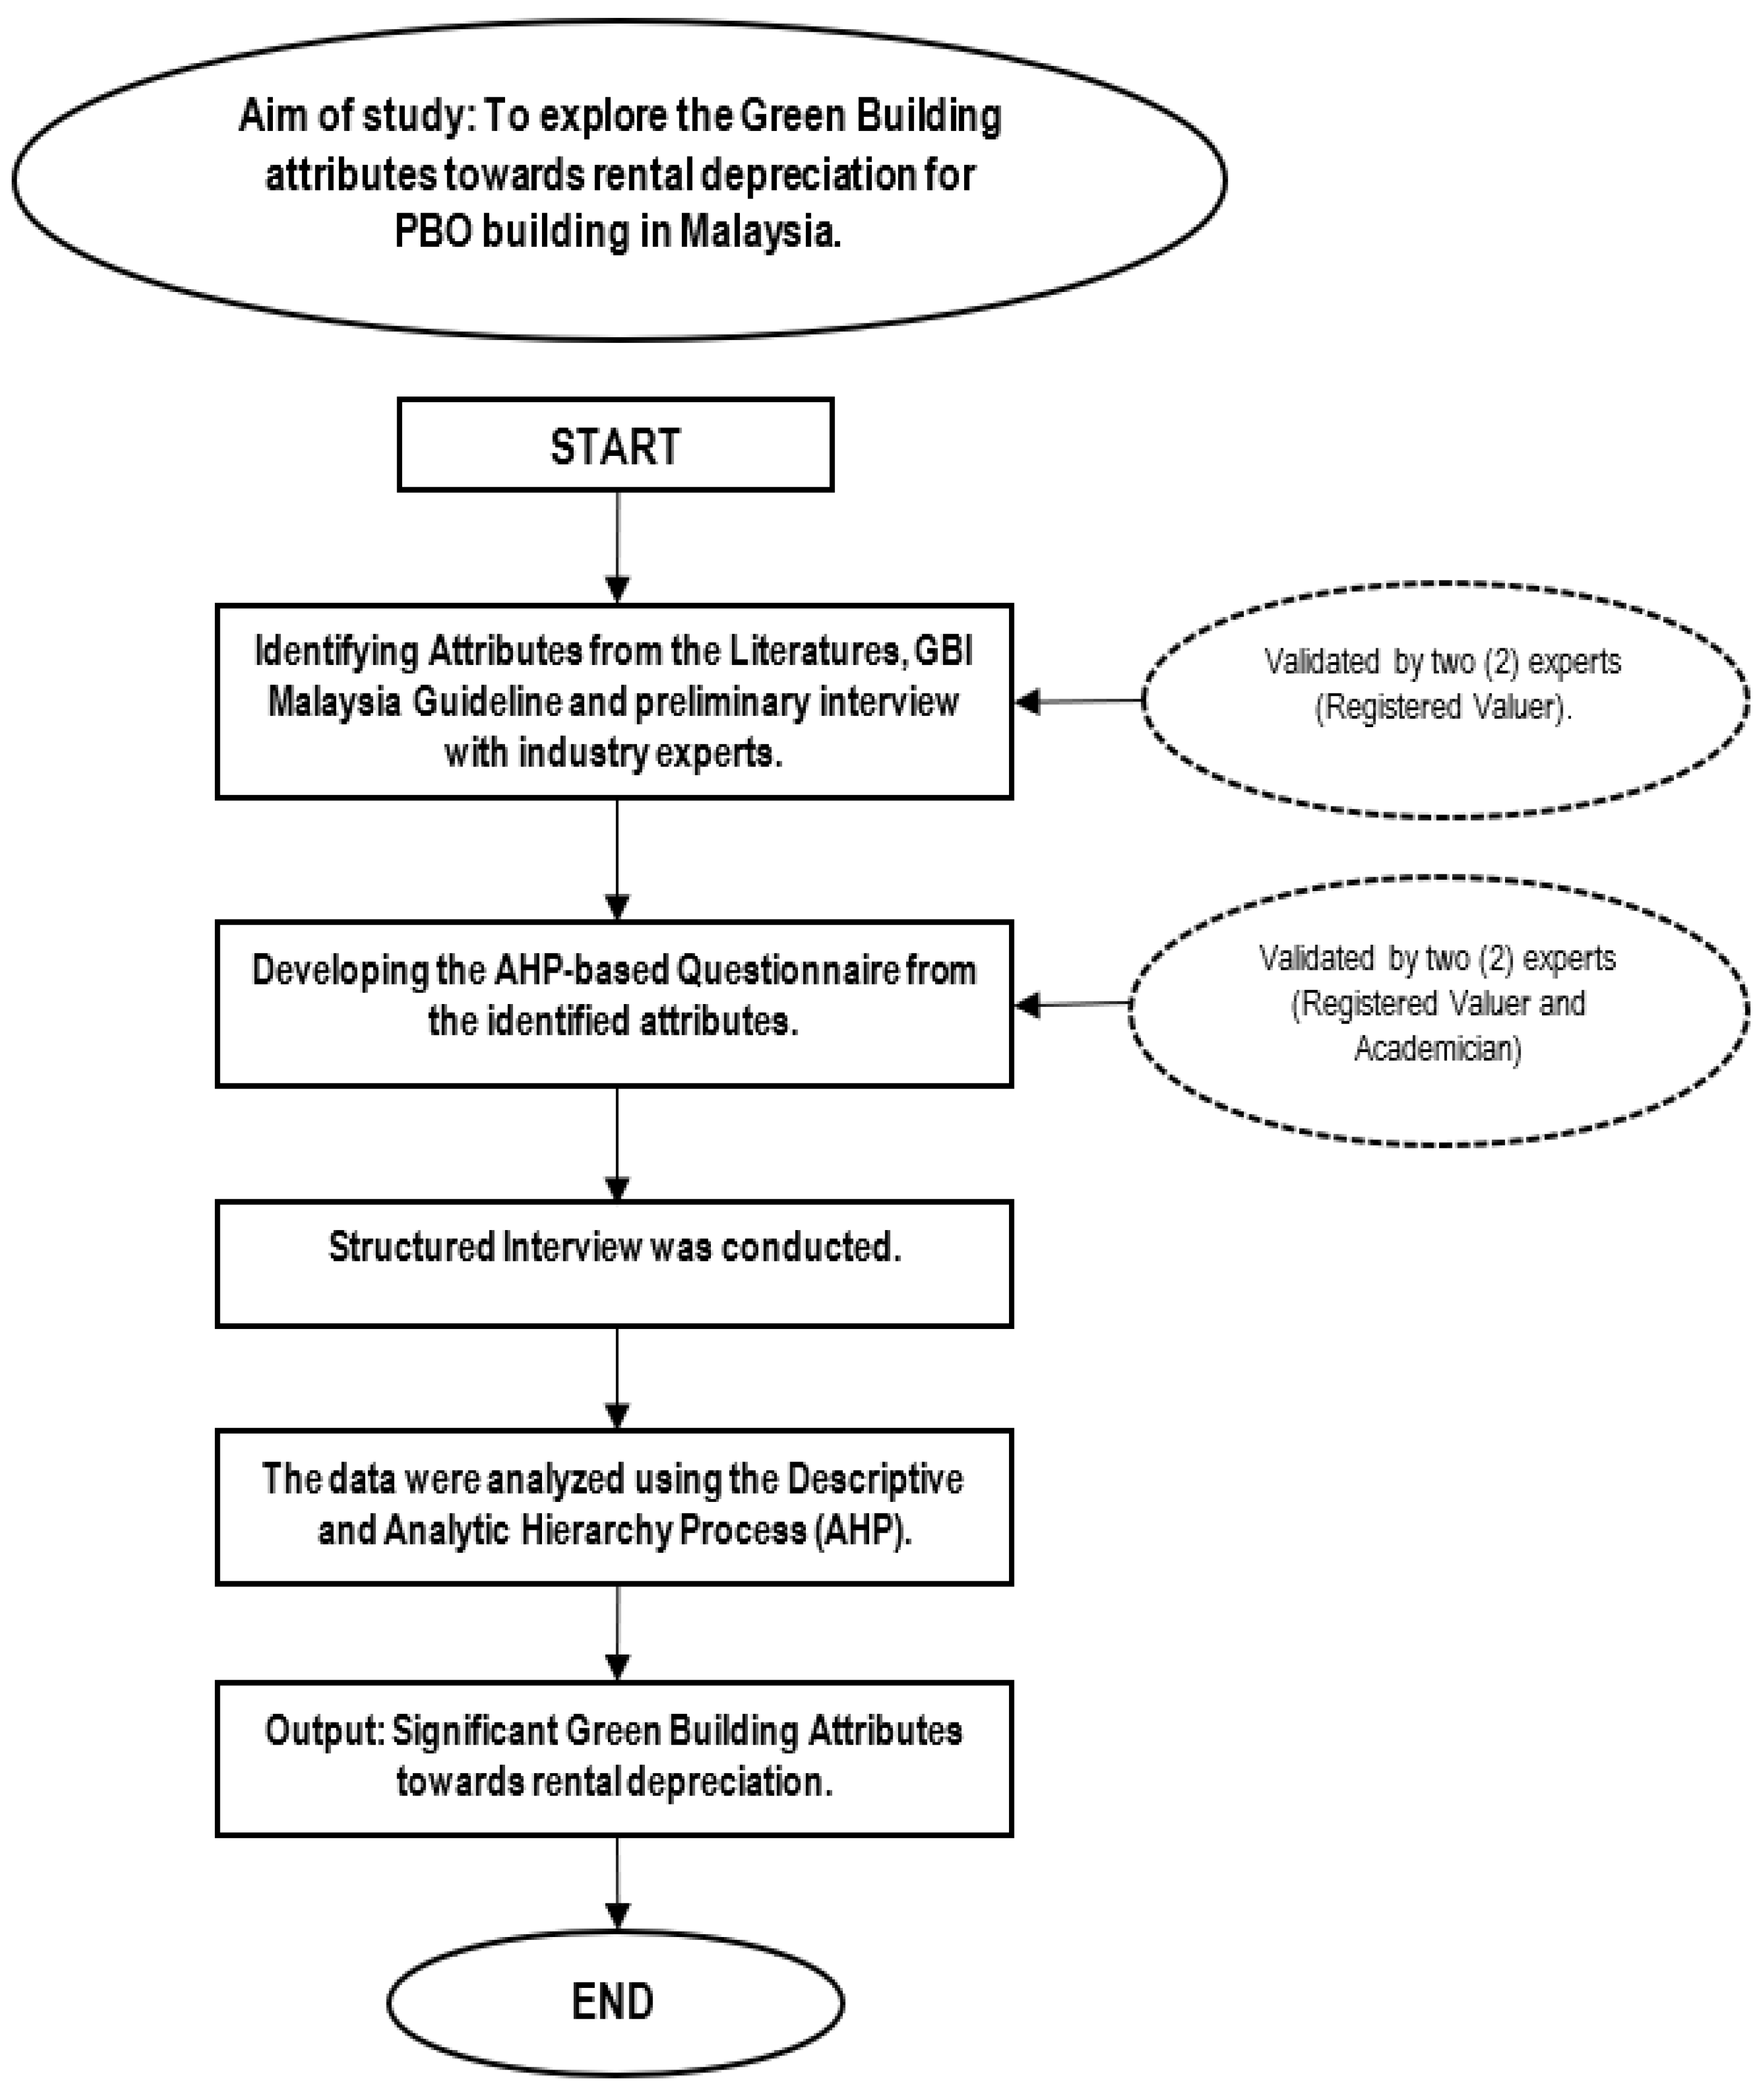
3. Methods
3.1. Developing the Survey
3.2. Collecting Survey Data
3.3. Analyzing the Survey Data
Analytic Hierarchy Process (AHP)
| W11= | (1.000 × 1.000) | + | (0.200 × 5.000) | + | (3.000 × 0.333) | = | 2.990 |
| W12= | (5.000 × 1.000) | + | (1.000 × 5.000) | + | (5.000 × 0.333) | = | 11.650 |
| W13= | (0.333 × 1.000) | + | (0.2000 × 5.000) | + | (1.000 × 0.333) | = | 1.660 |
| W14= | (1.000 × 0.200) | + | (1.000 × 0.2000) | + | (3.000 × 0.200 | = | 1.000 |
| W15= | (5.000 × 0.200) | + | (1.000 × 1.000) | + | (5.000 × 0.200) | = | 3.000 |
| W16= | (0.333 × 0.200) | + | (0.200 × 1.000) | + | (0.200 × 1.000) | = | 0.466 |
| W17= | (1.000 × 3.000) | + | (0.200 × 5.000) | + | (3.000 × 1.000) | = | 7.000 |
| W18= | (5.000 × 3.000) | + | (1.000 × 5.000) | + | (5.000 × 1.000) | = | 25.000 |
| W19= | (0.333 × 3.000) | + | (0.200 × 5.000) | + | (1.000 × 1.000) | = | 2.990 |
| Normal Value | Total Row | Priority Vector | ||
| 2.990 | 11.650 | 1.660 | 16.300 | 0.292 |
| 1.000 | 3.000 | 0.466 | 4.466 | 0.080 |
| 7.000 | 25.000 | 2.990 | 34.990 | 0.628 |
| 55.756 | 1.000 |
4. Results and Discussions
4.1. Results from the AHP Analysis
4.2. Implications
5. Conclusions and Future Directions
Author Contributions
Funding
Informed Consent Statement
Data Availability Statement
Acknowledgments
Conflicts of Interest
References
- Zamhari, S.K.; Perumal, C. Challenges and strategies towards a sustainable community. Geogr. Malays. J. Soc. Space 2016, 12, 10–24. [Google Scholar]
- Malek, J.A. Multi-dimensional development for Maran District: A symbiosis. Geogr. Malays. J. Soc. Space 2015, 11, 124–135. [Google Scholar]
- Kalsum, N.; Isa, M. Sustainable campus and academic staffs awareness and behavior in Malaysia’s institutions of higher learning: A case study of UPSI. Geogr. Malays. J. Soc. Space 2016, 12, 89–99. [Google Scholar]
- Yeong, L.S.; Putuhena, F.; Puong, L.L.; Baharun, A. Assessing the Contribution Factors for the Enhancement of Green Building Index (GBI) in the Malaysian Construction Industry. J. Kejuruter. 2015, 27, 49–56. [Google Scholar] [CrossRef]
- Azlina, A.A.; Mahirah, K.; Sin, M.S. Willingness to pay for renewable energy: Evidence from Malaysian’s Households. J. Ekon. Malaysia 2018, 52, 153–161. [Google Scholar] [CrossRef]
- Tan, C.L.; Goh, Y.N.; Yeo, S.F.; Ching, S.L.; Chan, H.S. An examination of the factors influencing the green initiative and competitiveness of private higher education institutions in Malaysia. J. Pengur. 2017, 51, 87–99. [Google Scholar] [CrossRef]
- Aigbavboa, C.; Thwala, W.D. Performance of a green building’s indoor environmental quality on building occupants in South Africa. J. Green Build. 2019, 14, 131–148. [Google Scholar] [CrossRef]
- Phillips, H.; Handy, R.; Sleeth, D.; Thiese, M.S.; Schaefer, C.; Stubbs, J. Taking The ‘Leed’ In Indoor Air Quality: Does Certification Result In Healthier Buildings? J. Green Build. 2020, 15, 55–66. [Google Scholar] [CrossRef]
- Arifin, K.; Aiyub, K.; Zakaria, H. Evaluation of indoor air quality elements and their relation to employee health symptoms in government offices around the Federal Territory of Putrajaya. Malays. J. Soc. Space 2021, 17, 166–180. [Google Scholar] [CrossRef]
- Robinson, S.; Simons, R.; Eunkyu, L. Which Green Office Building Features Do Tenants Pay for? A Study of Observed Rental Effects. J. Real Estate Res. 2017, 39, 467–492. [Google Scholar] [CrossRef]
- Jasimin, T.H.; Ali, H.M. Valuation of Green Commercial Office Building: A Preliminary Study of Malaysian Valuers ’ Insight. Int. J. Soc. Behav. Educ. Econ. Bus. Ind. Eng. 2015, 9, 1156–1161. [Google Scholar]
- Suh, M.J.; Pearce, A.R.; Song, Y.; Kwak, Y.H.; Kim, J.I.; Zhang, Y. The impact of LEED-energy star-certified office buildings on the market value of adjoining buildings in New York City. J. Green Build. 2019, 14, 31–52. [Google Scholar] [CrossRef]
- Heinzle, S.L.; Yip, A.B.Y.; Xing, M.L.Y. The Influence of Green Building Certification Schemes on Real Estate Investor Behaviour: Evidence from Singapore. Urban Stud. 2013, 50, 1970–1987. [Google Scholar] [CrossRef]
- Abraham, P.S.; Gundimeda, H. Greening offices: Willingness to pay for green-certified office spaces in Bengaluru, India. Environ. Dev. Sustain. 2020, 22, 1–9. [Google Scholar] [CrossRef]
- Pinheiro, M.D.; Luís, N.C. COVID-19 Could Leverage a Sustainable Built Environment. Sustainability 2020, 12, 5863. [Google Scholar] [CrossRef]
- Rodi, W.N.W.; Ani, A.I.C.; Tawil, N.M.; Ting, K.H.; Mahamood, N.M. A preliminary study on the relevancy of sustainable building design to commercial property depreciation. J. Fundam. Appl. Sci. 2017, 9, 162–183. [Google Scholar] [CrossRef]
- Lorenz, D.; Lützkendorf, T. Sustainability and property valuation: Systematisation of existing approaches and recommendations for future action. J. Prop. Investig. Financ. 2011, 29, 644–676. [Google Scholar] [CrossRef]
- Butt, T.; Camilleri, M.; Paul, P.; Jones, K. Obsolescence types and the built environment–definitions and implications. Int. J. Environ. Sustain. Dev. 2015, 14, 20–39. [Google Scholar] [CrossRef]
- Reed, R.; Warren-myers, G. Is Sustainability the 4 th Form of Obsolescence? In Proceedings of the 16th Pacific Rim Real Estate Society (PRRES) Conference, Wellington, NZ, USA, 24–27 January 2010.
- Eichholtz, P.; Kok, N.; Quigley, J.M. The Economics of Green Building. Rev. Econ. Statist. 2010, 95, 50–63. [Google Scholar] [CrossRef]
- Wiley, J.A.; Benefield, J.D.; Johnson, K.H. Green design and the market for commercial office space. J. Real Estate Finance. Econ. 2010, 41, 228–243. [Google Scholar] [CrossRef]
- Fuerst, F.; McAllister, P. Eco-labeling in commercial office markets: Do LEED and Energy Star offices obtain multiple premiums? Ecol. Econ. 2011, 70, 1220–1230. [Google Scholar] [CrossRef]
- Harrison, D.; Seiler, M. The political economy of green office buildings. J. Prop. Investig. Financ. 2011, 29, 551–565. [Google Scholar] [CrossRef]
- Kok, N.; Jennen, M. The impact of energy labels and accessibility on office rents. Energy Policy 2012, 46, 489–497. [Google Scholar] [CrossRef]
- Chegut, A.; Eichholtz, P.; Kok, N. Supply, Demand, and the Value of Green Buildings. Urban Stud. 2014, 51, 22–43. [Google Scholar] [CrossRef]
- Ismail, W.; Majid, R. The impact of Green Features on property valuation procedure. In Proceedings of the International Real Estate Research Symposium (IRERS), Putrajaya, Malaysia, 29–30 April 2014. [Google Scholar]
- Warren-myers, G. Real Estate Valuation and Valuing Sustainability: A Case Study of Australia. Pac. Rim Prop. Res. J. 2015, 19, 81–100. [Google Scholar] [CrossRef]
- Babawale, G.K.; Oyalowo, B. Incorporating Sustainability into Real Estate Valuation: The Perception of Nigerian Valuers. J. Sustain. Dev. 2011, 4, 236–248. [Google Scholar] [CrossRef]
- Muldavin, S. Ten Principles for Sustainable Property Underwriting & Valuation; RICS Property World: Fall, DC, USA, 2009. [Google Scholar]
- Boyd, T. Can we assess the worth of environmental and social characteristics in investment property? In Proceedings of the Pacific Rim Real Estate Society Conference, Auckland, New Zealand, 22–25 January 2006. [Google Scholar]
- Kok, N.; Jennen, M. The Value of Energy Labels in the European Office Market; Maastrict University: Maastrict, The Netherlands; RSM Erasmus: Rotterdam, The Netherlands, 2011; p. 26. [Google Scholar]
- Surmann, M.; Brunauer, W.; Bienert, S. How does energy efficiency influence the Market Value of office buildings in Germany and does this effect increase over time? J. Eur. Real Estate Res. 2015, 8, 243–266. [Google Scholar] [CrossRef]
- Baum, A. Property Investment Depreciation and Obsolescence; Routledge: London, UK, 1991. [Google Scholar]
- Whipple, R. Property Valuation and Analysis; The Law Book Company: Riverwood, NSW, Australia, 1995. [Google Scholar]
- Fuerst, F.; McAllister, P. The impact of Energy Performance Certificates on the rental and capital values of commercial property assets. Energy Policy 2011, 39, 6608–6614. [Google Scholar] [CrossRef]
- Lorenz, D.; Lützkendorf, T. Sustainability in property valuation: Theory and practice. J. Prop. Investig. Financ. 2008, 26, 482–521. [Google Scholar] [CrossRef]
- Rodi, W.N.W.; Hwa, T.K.; Medeena, M.N.; Shahrin, S.A.; Isa, A.M. Depreciation between Conventional and Green Office Buildings. Procedia Econ. Financ. 2015, 31, 661–670. [Google Scholar] [CrossRef] [Green Version]
- Seale, C. Researching Society and Culture, 3rd ed.; Sage Publications Ltd.: London, UK, 2015. [Google Scholar]
- Darko, A.; Chan, A.P.C.; Ameyaw, E.E.; Owusu, E.K.; Pärn, E.; Edwards, D.J. Review of application of analytic hierarchy process (AHP) in construction. Int. J. Constr. Manag. 2019, 19, 436–452. [Google Scholar] [CrossRef]
- Lam, K.; Zhao, X. An application of quality function deployment to improve the quality of teaching. Int. J. Qual. Reliab. Manag. 1998, 15, 389–413. [Google Scholar] [CrossRef]
- Wong, J.K.W.; Li, H. Application of the analytic hierarchy process (AHP) in multi-criteria analysis of the selection of intelligent building systems. Build. Environ. 2008, 43, 108–125. [Google Scholar] [CrossRef]
- Cheng, E.; Li, H. Construction partnering process and associated critical success factors: Quantitative investigation. J. Manag. Eng. 2002, 18, 194–202. [Google Scholar] [CrossRef]
- Saaty, T. Decision making with the analytic hierarchy process. Int. J. Serv. Sci. 2008, 1, 83. [Google Scholar] [CrossRef] [Green Version]
- Shiau, Y.-C.; Tsai, T.-P.; Wang, W.-C.; Huang, M.-L. Use questionnaire and AHP techniques to develop subcontractor selection system. NIST Spec. Publ. Space 2002, 35–40. [Google Scholar]
- Robinson, S.; Simons, R.; Lee, E.; Kern, A. Demand for Green Buildings: Office Tenants’ Stated Willingness-to-Pay for Green Features. J. Real Estate Res. 2016, 38, 423–452. [Google Scholar] [CrossRef]
- Warren-myers, G. Is the valuer the barrier to identifying the value of sustainability? J. Prop. Investig. Financ. 2013, 31, 345–359. [Google Scholar] [CrossRef]
- Simons, R.A.; Robinson, S.; Lee, E. Green Office Buildings: A Qualitative Exploration of Green Office Building Attributes. J. Sustain. Real Estate 2014, 6, 211–232. [Google Scholar] [CrossRef]


| Criteria | Energy Efficiency | Innovation | Water Efficiency |
|---|---|---|---|
| Energy Efficiency (EE) | 1 | 5 | 2 |
| Innovation (IN) | 1/5 | 1 | 3 |
| Water Efficiency (WE) | 1/2 | 1/3 | 1 |
| Criteria | Design and Performance | Commissioning | Monitoring, Improvement, and Maintenance |
|---|---|---|---|
| Design and Performance | 1 | 5 | 1/3 |
| Commissioning | 1/5 | 1 | 1/5 |
| Monitoring, Improvement, and Maintenance | 3 | 5 | 1 |
| Criteria | Innovation and Environmental Initiatives | GBI Facilitator |
|---|---|---|
| Innovation and Environmental Initiatives | 1 | 4 |
| GBI Facilitator | 1/4 | 1 |
| Criteria | Water Harvesting and Recycling | Increased Efficiency |
|---|---|---|
| Water Harvesting and Recycling | 1 | 6 |
| Increased Efficiency | 1/6 | 1 |
| Criteria | Energy Efficiency | Innovation | Water Efficiency | Priority Vector |
|---|---|---|---|---|
| Energy Efficiency (EE) | 1.000 | 5.000 | 0.333 | 0.582 |
| Innovation (IN) | 0.200 | 1.000 | 0.200 | 0.109 |
| Water Efficiency (WE) | 3.000 | 5.000 | 1.000 | 0.309 |
| Criteria | Design and Performance | Commissioning | Monitoring, Improvement, and Maintenance | Relative Priority | Relative Priority (%) |
|---|---|---|---|---|---|
| Design and Performance | 1.000 | 5.000 | 0.333 | 0.292 | 29.2% |
| Commissioning | 0.200 | 1.000 | 0.200 | 0.080 | 8.0% |
| Monitoring, Improvement, and Maintenance | 3.000 | 5.000 | 1.000 | 0.628 | 62.8% |
| Criteria | Innovation and Environmental Initiatives | GBI Facilitator | Relative Priority | Relative Priority (%) |
|---|---|---|---|---|
| Innovation and Environmental Initiatives | 1.00 | 4.00 | 0.80 | 80.0% |
| GBI Facilitator | 0.250 | 1.00 | 0.20 | 20.0% |
| Criteria | Water Harvesting and Recycling | Increased Efficiency | Relative Priority | Relative Priority (%) |
|---|---|---|---|---|
| Water Harvesting and Recycling | 1.00 | 6.00 | 0.857 | 85.7% |
| Increased Efficiency | 0.167 | 1.00 | 0.143 | 14.3% |
| Criteria | Design and Performance | Commissioning | Monitoring, Improvement, and Maintenance | Priority Vector | Rank |
|---|---|---|---|---|---|
| Design and Performance | 1.000 | 5.000 | 0.333 | 0.292 | 2 |
| Commissioning | 0.200 | 1.000 | 0.200 | 0.080 | 3 |
| Monitoring, Improvement, and Maintenance | 3.000 | 5.000 | 1.000 | 0.628 | 1 |
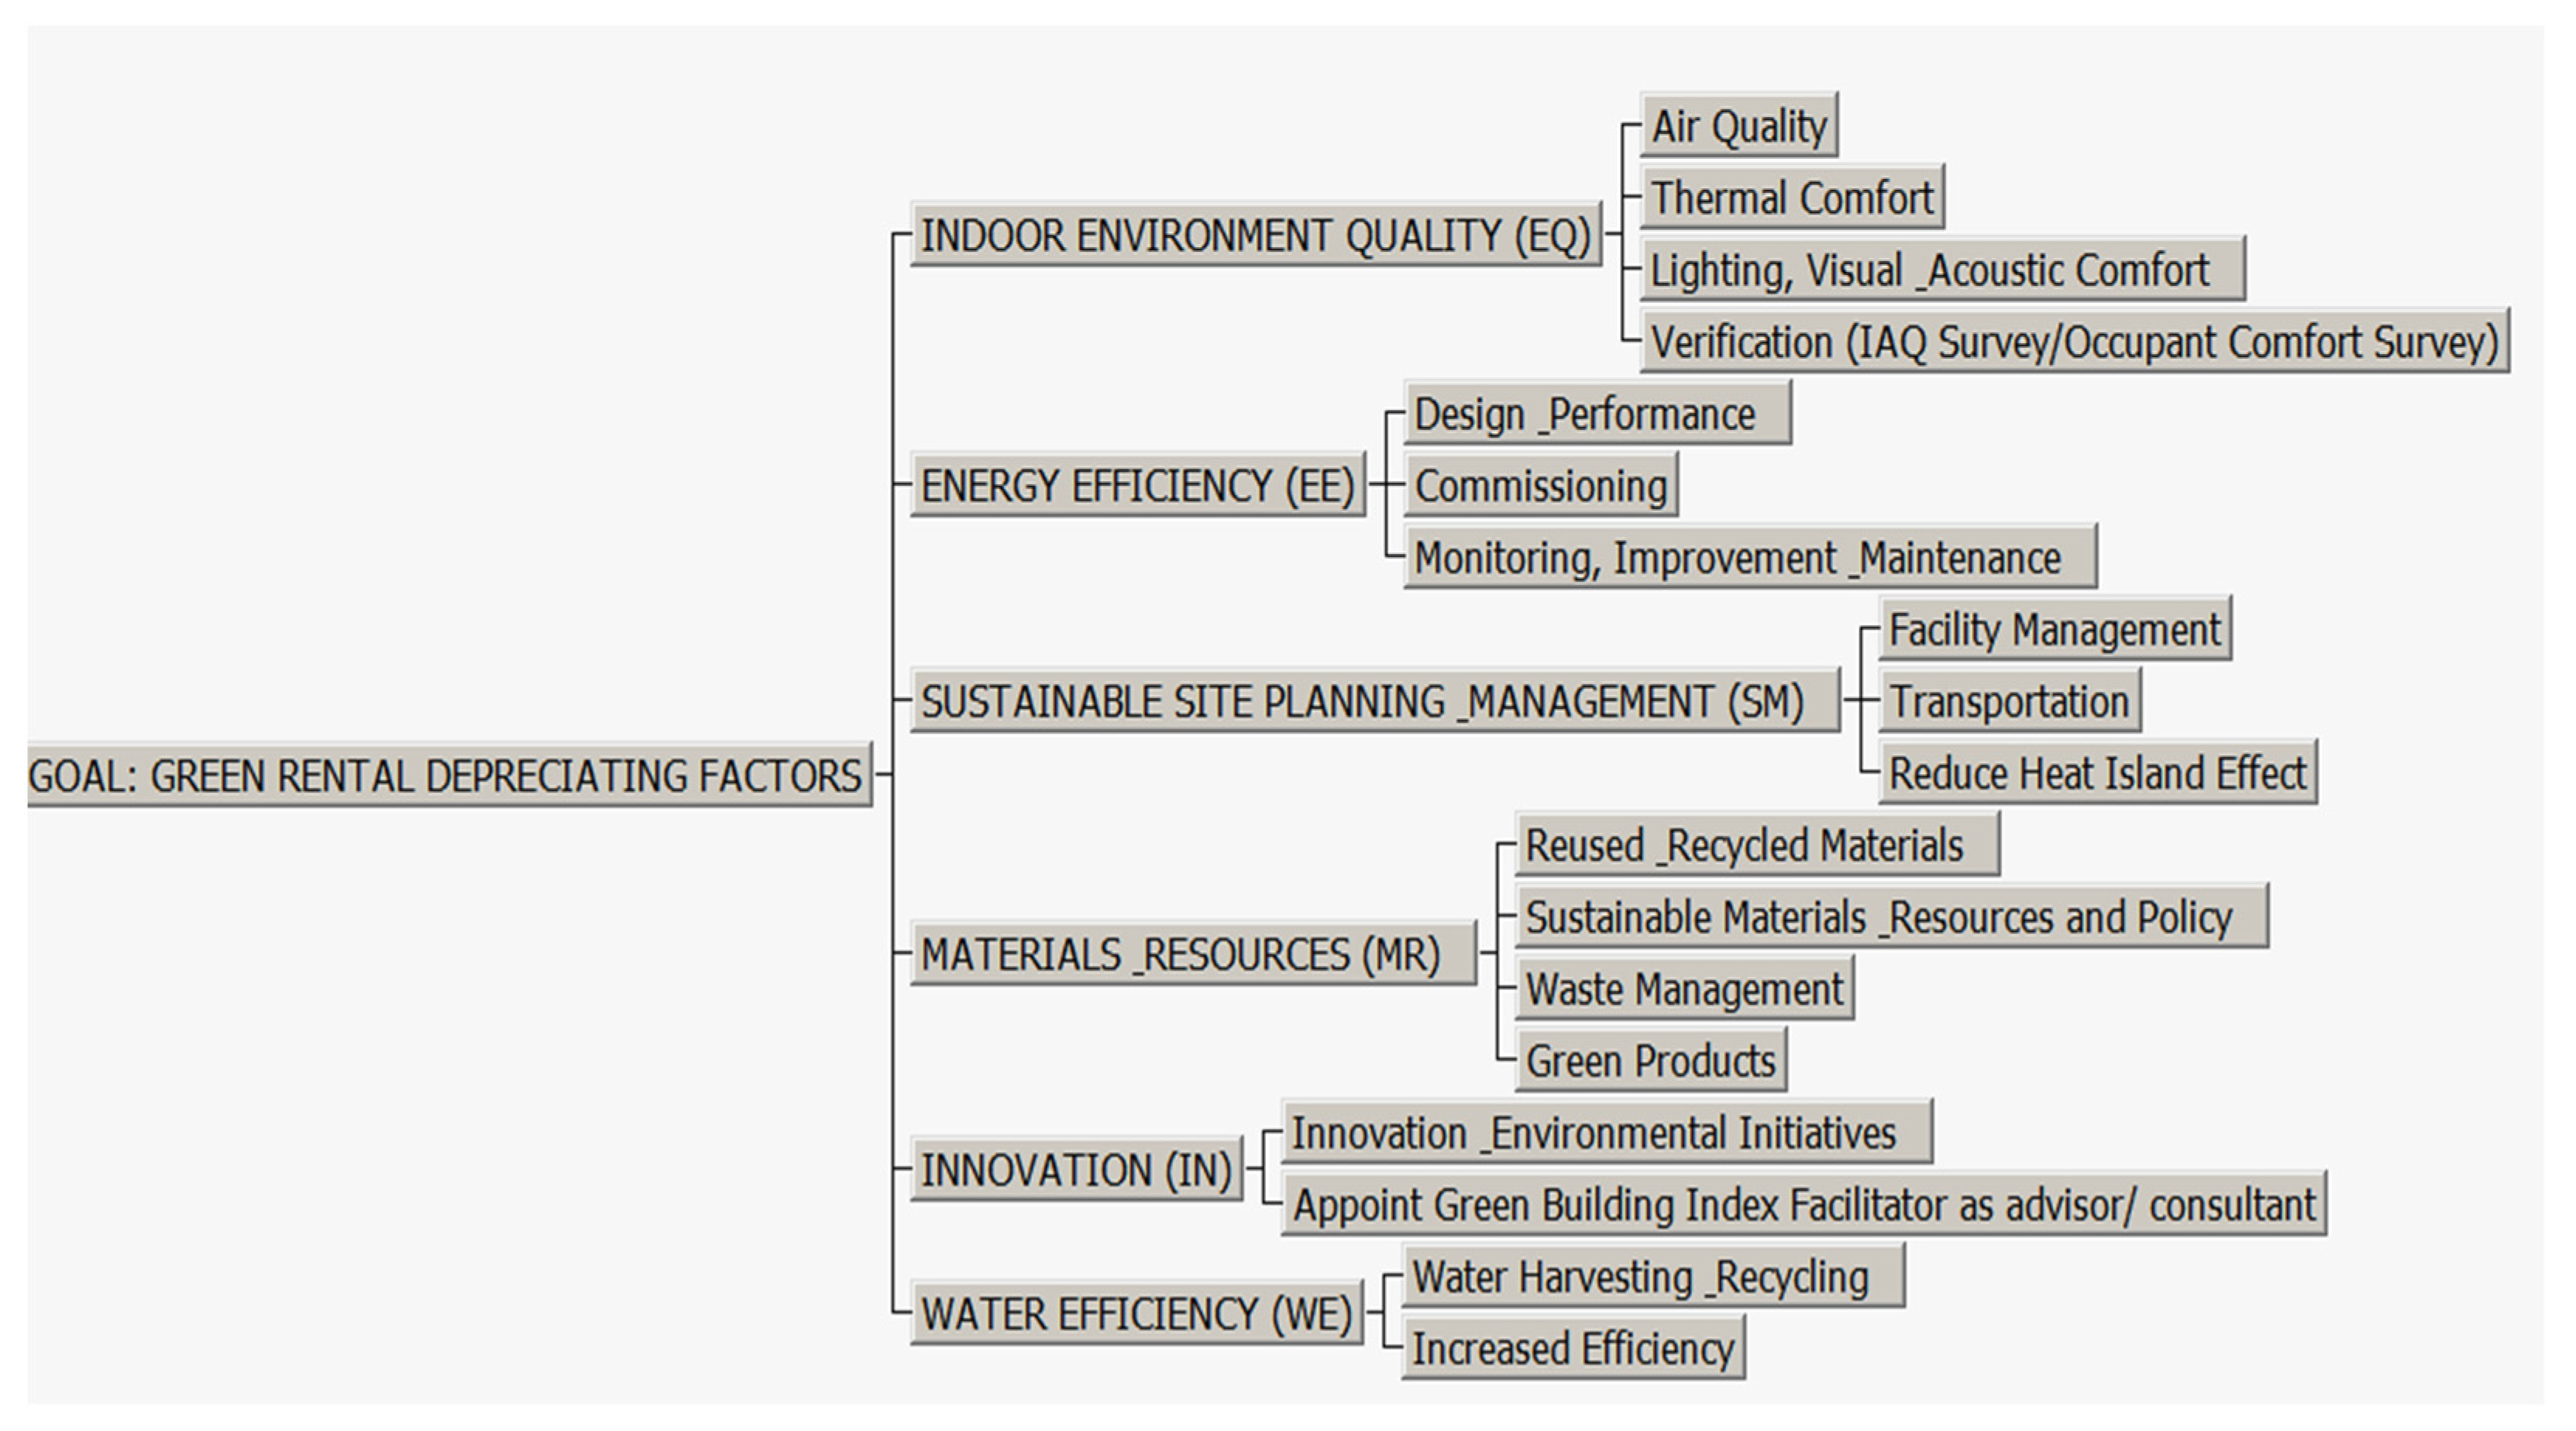
| Sustainable Building Attribute | Local Weights | Sub-Attribute | Local Weights | Global Weights | Rank |
|---|---|---|---|---|---|
| 1. Indoor Environmental Quality (IEQ) | 0.327 | Air Quality | 0.457 | 0.166 | 1 |
| Thermal Comfort | 0.200 | 0.072 | 5 | ||
| Lighting, Visual, and Acoustic Comfort | 0.200 | 0.073 | 4 | ||
| Verifications | 0.143 | 0.052 | 8 | ||
| 2. Energy Efficiency (EE) | 0.290 | Design and Performance. | 0.521 | 0.147 | 2 |
| Commissioning | 0.265 | 0.075 | 3 | ||
| Monitoring, Improvement, and Maintenance | 0.214 | 0.060 | 6 | ||
| 3. Sustainable Site Planning and Management (SM) | 0.118 | Facility Management | 0.610 | 0.060 | 7 |
| Transportation | 0.184 | 0.018 | 17 | ||
| Reduce Heat Island Effect | 0.205 | 0.020 | 16 | ||
| 4. Materials and Resources (MR) | 0.089 | Reused and Recycle Materials | 0.251 | 0.032 | 12 |
| Sustainable Materials and Resources Policy | 0.224 | 0.029 | 13 | ||
| Waste Management | 0.347 | 0.045 | 10 | ||
| Green Products | 0.178 | 0.023 | 15 | ||
| 5. Innovation (IN) | 0.090 | Innovation and Environmental Initiatives | 0.775 | 0.046 | 9 |
| GBI Facilitator | 0.225 | 0.013 | 18 | ||
| 6. Water Efficiency (WE) | 0.086 | Water Harvesting and Recycling | 0.618 | 0.043 | 11 |
| Increased Efficiency | 0.382 | 0.027 | 14 |
Publisher’s Note: MDPI stays neutral with regard to jurisdictional claims in published maps and institutional affiliations. |
© 2022 by the authors. Licensee MDPI, Basel, Switzerland. This article is an open access article distributed under the terms and conditions of the Creative Commons Attribution (CC BY) license (https://creativecommons.org/licenses/by/4.0/).
Share and Cite
Rodi, W.N.W.; Che-Ani, A.I.; Norazman, N.; Kamaruzzaman, S.N.; Chohan, A.H. Prioritizing Green Building Attributes on Conventional Office Building Rental Depreciation Using Analytic Hierarchy Process (AHP). Buildings 2022, 12, 1169. https://doi.org/10.3390/buildings12081169
Rodi WNW, Che-Ani AI, Norazman N, Kamaruzzaman SN, Chohan AH. Prioritizing Green Building Attributes on Conventional Office Building Rental Depreciation Using Analytic Hierarchy Process (AHP). Buildings. 2022; 12(8):1169. https://doi.org/10.3390/buildings12081169
Chicago/Turabian StyleRodi, Wan Norhishamuddin Wan, Adi Irfan Che-Ani, Norsafiah Norazman, Syahrul Nizam Kamaruzzaman, and Afaq Hyder Chohan. 2022. "Prioritizing Green Building Attributes on Conventional Office Building Rental Depreciation Using Analytic Hierarchy Process (AHP)" Buildings 12, no. 8: 1169. https://doi.org/10.3390/buildings12081169